


Abstract
The apparent unloading modulus of sheet metals decreases with plastic pre-strain, and its directional dependence may affect springback prediction. This study investigates its directional evolution in CN4301-4307+2B, DOCOL780DP+AM, and WBS235JR using cyclic loading–unloading–loading tensile tests at 0°, 45°, and 90° to the rolling direction. The chord modulus is used as the primary definition and described using Yoshida relations. Two alternative unloading modulus definitions are evaluated to assess the robustness of the directional comparison. At εp = 0.08, the directional spread of relative modulus reduction is 14.56 percentage points for CN4301-4307+2B, 7.95 percentage points for WBS235JR, and 3.03 percentage points for DOCOL780DP+AM. The directional ranking is retained for all investigated definitions, although the spread magnitude depends on the definition. A controlled numerical roll forming sensitivity analysis shows a maximum difference of 0.58° in the mean F1–F3 opening angle relative to the constant modulus reference. The results indicate that a direction-independent unloading modulus relation may neglect relevant directional effects and affect predicted springback geometry. When a single uniaxial relation is used in roll forming simulations, the 90° response may provide a physically motivated basis for the predominantly transverse cross-sectional bending.
1. Introduction
Accurate springback prediction requires a reliable description of both plastic deformation and unloading behavior. After plastic pre-straining, metallic sheets exhibit nonlinear unloading and a reduction in the apparent unloading stiffness, commonly characterized using chord modulus or other unloading-slope measures [1,2,3,4,5]. This behavior can be represented by a plastic-strain-dependent modulus relation, as introduced within the Yoshida framework [3,6]. Accounting for modulus degradation has been shown to affect springback predictions in bending and roll forming applications [5,6,7,8,9], while constitutive studies have further demonstrated the importance of unloading behavior relative to other hardening effects [10,11].
Rolled sheet metals additionally exhibit direction-dependent mechanical behavior. While anisotropy is routinely considered in plasticity models, directional effects in the unloading response have been investigated for different sheet materials and steel grades. Vrh et al. [12] reported loading-direction- and path-dependent stiffness degradation in cold-rolled EN 1.4301 stainless steel, while Khayatzadeh et al. [13] observed orientation-dependent modulus degradation for commercially pure titanium specimens tested at 0°, 45°, and 90° relative to the rolling direction. Lajarin et al. [14] further reported that modulus reduction in advanced high-strength steels is affected by material anisotropy. In a related study, Lajarin et al. [5] investigated several high-strength steels at 0°, 45°, and 90° to the rolling direction and incorporated the resulting chord modulus evolution into L-bending springback simulations. Xue et al. [15] investigated the nonlinear elastic behavior of dual-phase steels using different experimental approaches to characterize the unloading response and examined its implications for springback prediction. Their work highlights the relevance of the experimental method when characterizing nonlinear unloading behavior and interpreting the resulting modulus evolution.
Recent studies continue to emphasize the importance of anisotropic and path-dependent constitutive descriptions for springback. Current roll forming studies have further considered path-dependent plasticity and constitutive effects in springback prediction [16,17,18,19]. Anisotropy and tension–compression asymmetry have also been shown to influence bending and roll forming predictions [20,21]. Studies using variable elastic-modulus descriptions and cyclic loading–unloading data have also addressed springback in cold roll forming and related forming processes [7,8,9]. A recent review further highlights deformation-induced anisotropy and unloading-sensitive response as relevant aspects of sheet metal constitutive modelling [22].
Although these aspects have been investigated across different materials and modelling contexts, a systematic comparison across substantially different steel classes and an assessment of whether the directional ranking is robust to the unloading modulus definition remain limited. While previous studies have investigated strain-dependent elastic-modulus descriptions and their effects on springback prediction, the specific contribution of the directional evolution of the apparent unloading modulus to the predicted springback geometry has received less systematic attention. The present study therefore asks whether the directional evolution of the apparent unloading modulus is consistent across different steel classes within a common loading–unloading–loading (ULUL) framework and whether the directional ranking of modulus reduction is retained for different unloading modulus definitions.
To address this question, the present study investigates the apparent unloading modulus evolution of an austenitic stainless steel, a dual-phase steel, and a structural steel at 0°, 45°, and 90° relative to the rolling direction. The three materials are compared within a common ULUL evaluation framework, and their directional differences are assessed at common plastic pre-strain levels. Two alternative unloading modulus definitions are additionally evaluated to assess the robustness of the directional ranking with respect to the evaluation method. Finally, the experimentally identified directional Yoshida relations are applied in a reduced roll forming model as controlled scalar sensitivity cases to quantify their influence on the predicted springback geometry. The numerical analysis is intended as a controlled sensitivity study and does not constitute a complete anisotropic elastic or constitutive material formulation or an experimental validation of the absolute springback prediction.
2. Materials and Methods
2.1. Material
For the investigation, three sheet materials were investigated: CN4301-4307+2B (austenitic stainless steel, grades 1.4301 and 1.4307 according to EN 10028-7), DOCOL780DP+AM (dual-phase steel), and WBS235JR (hot-rolled non-alloy structural steel, grade S235JR according to EN 10025-2). The materials represent three distinct steel classes with different mechanical properties, as summarized in Table 1. All three materials were supplied as rolled sheets in coil form and tested in the as-received condition. The nominal sheet thickness was approximately 2.0 mm for all investigated materials. The chemical composition and mechanical properties were obtained from the manufacturers’ inspection certificates according to EN 10204-3.1 and are also summarized in Table 1.
Table 1.
Certified mechanical properties and chemical composition of the investigated materials.
2.2. Specimen Geometry
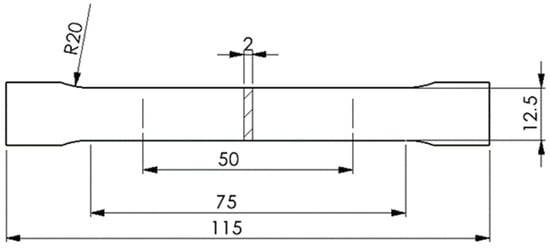
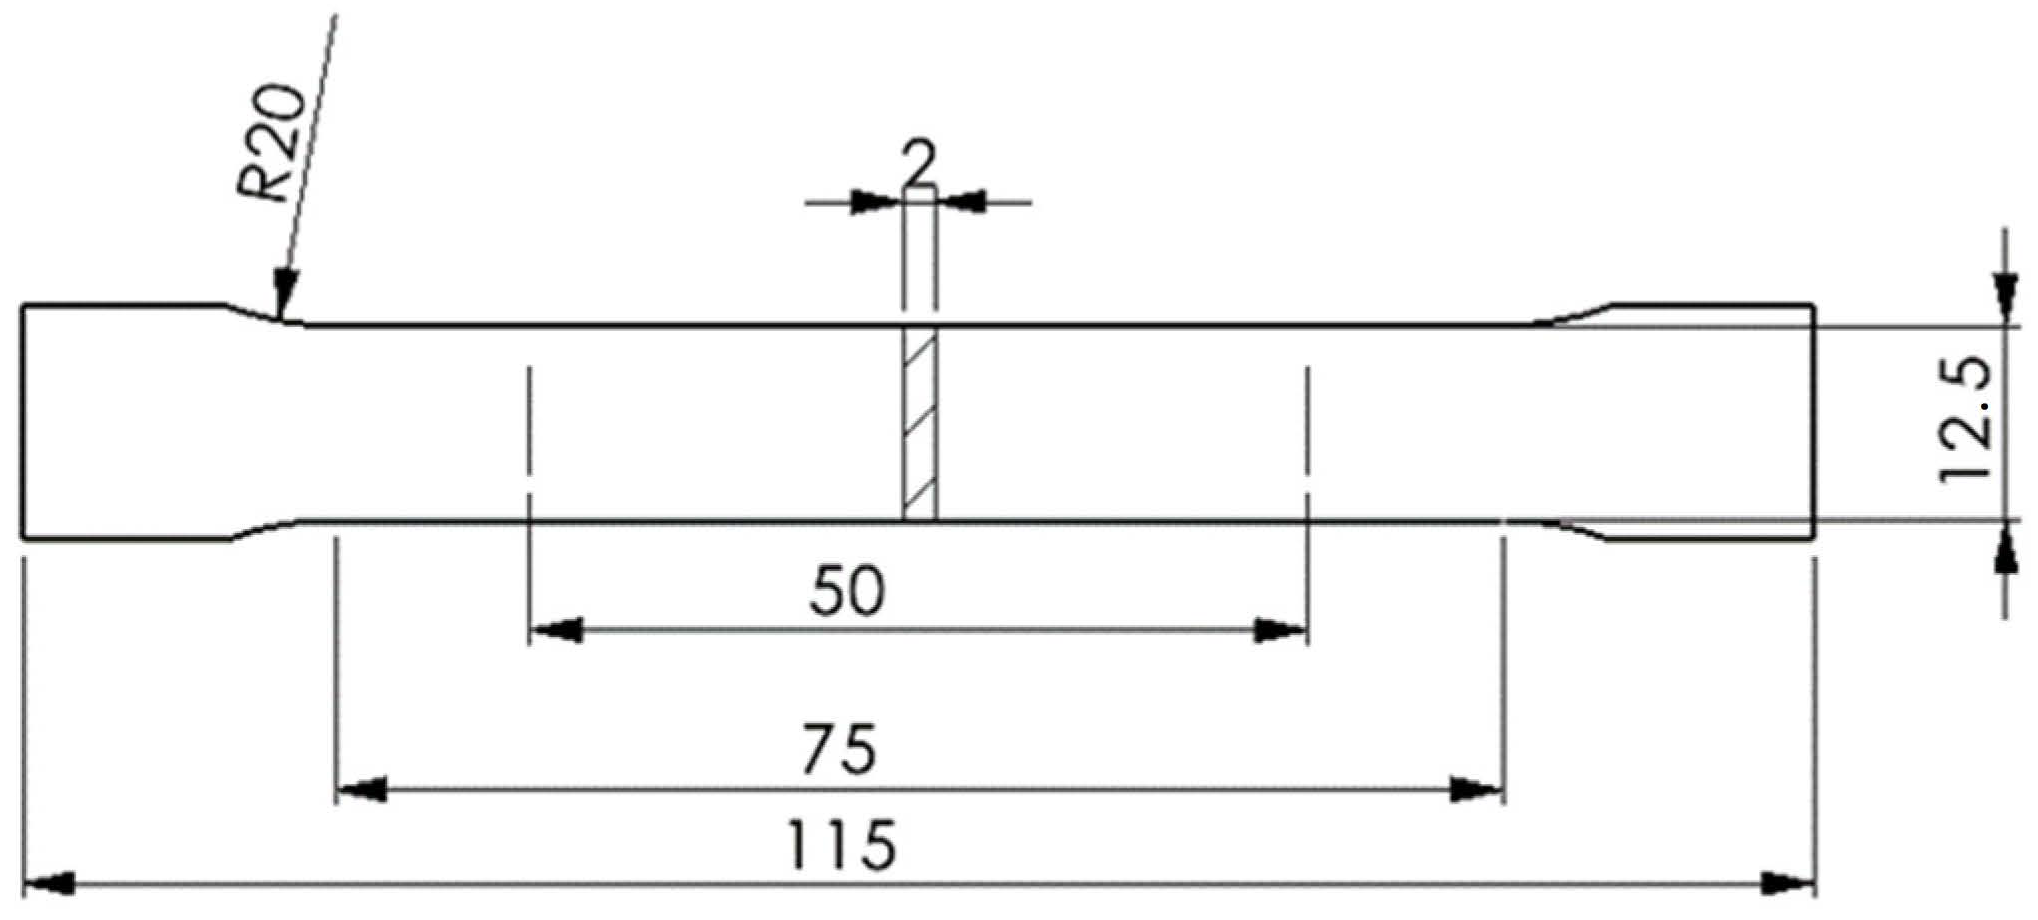
Flat dog-bone tensile specimens were used for all experiments. The specimen geometry was based on EN ISO 6892-1:2022. The specimens were extracted with their longitudinal axis oriented at 0°, 45°, and 90° relative to the rolling direction. The specimens were cut from the sheets by waterjet cutting and subsequently deburred. The geometry and dimensions are shown in Figure 1. The gauge length was 50 mm, and the parallel length was 75 mm. The total specimen length was 115 mm. The width of the gauge section was 12.5 mm, and the nominal sheet thickness was approximately 2.0 mm.
Figure 1.
Geometry of the tensile specimens based on EN ISO 6892-1:2022; dimensions in mm.
2.3. Experimental Setup
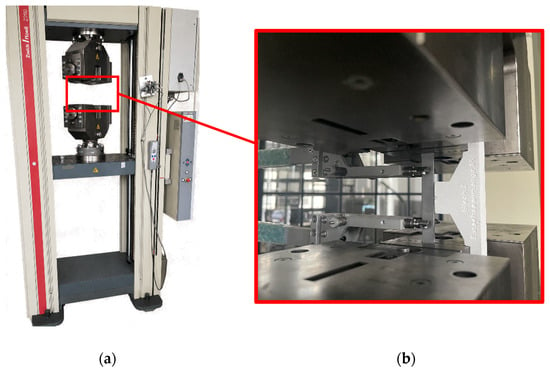
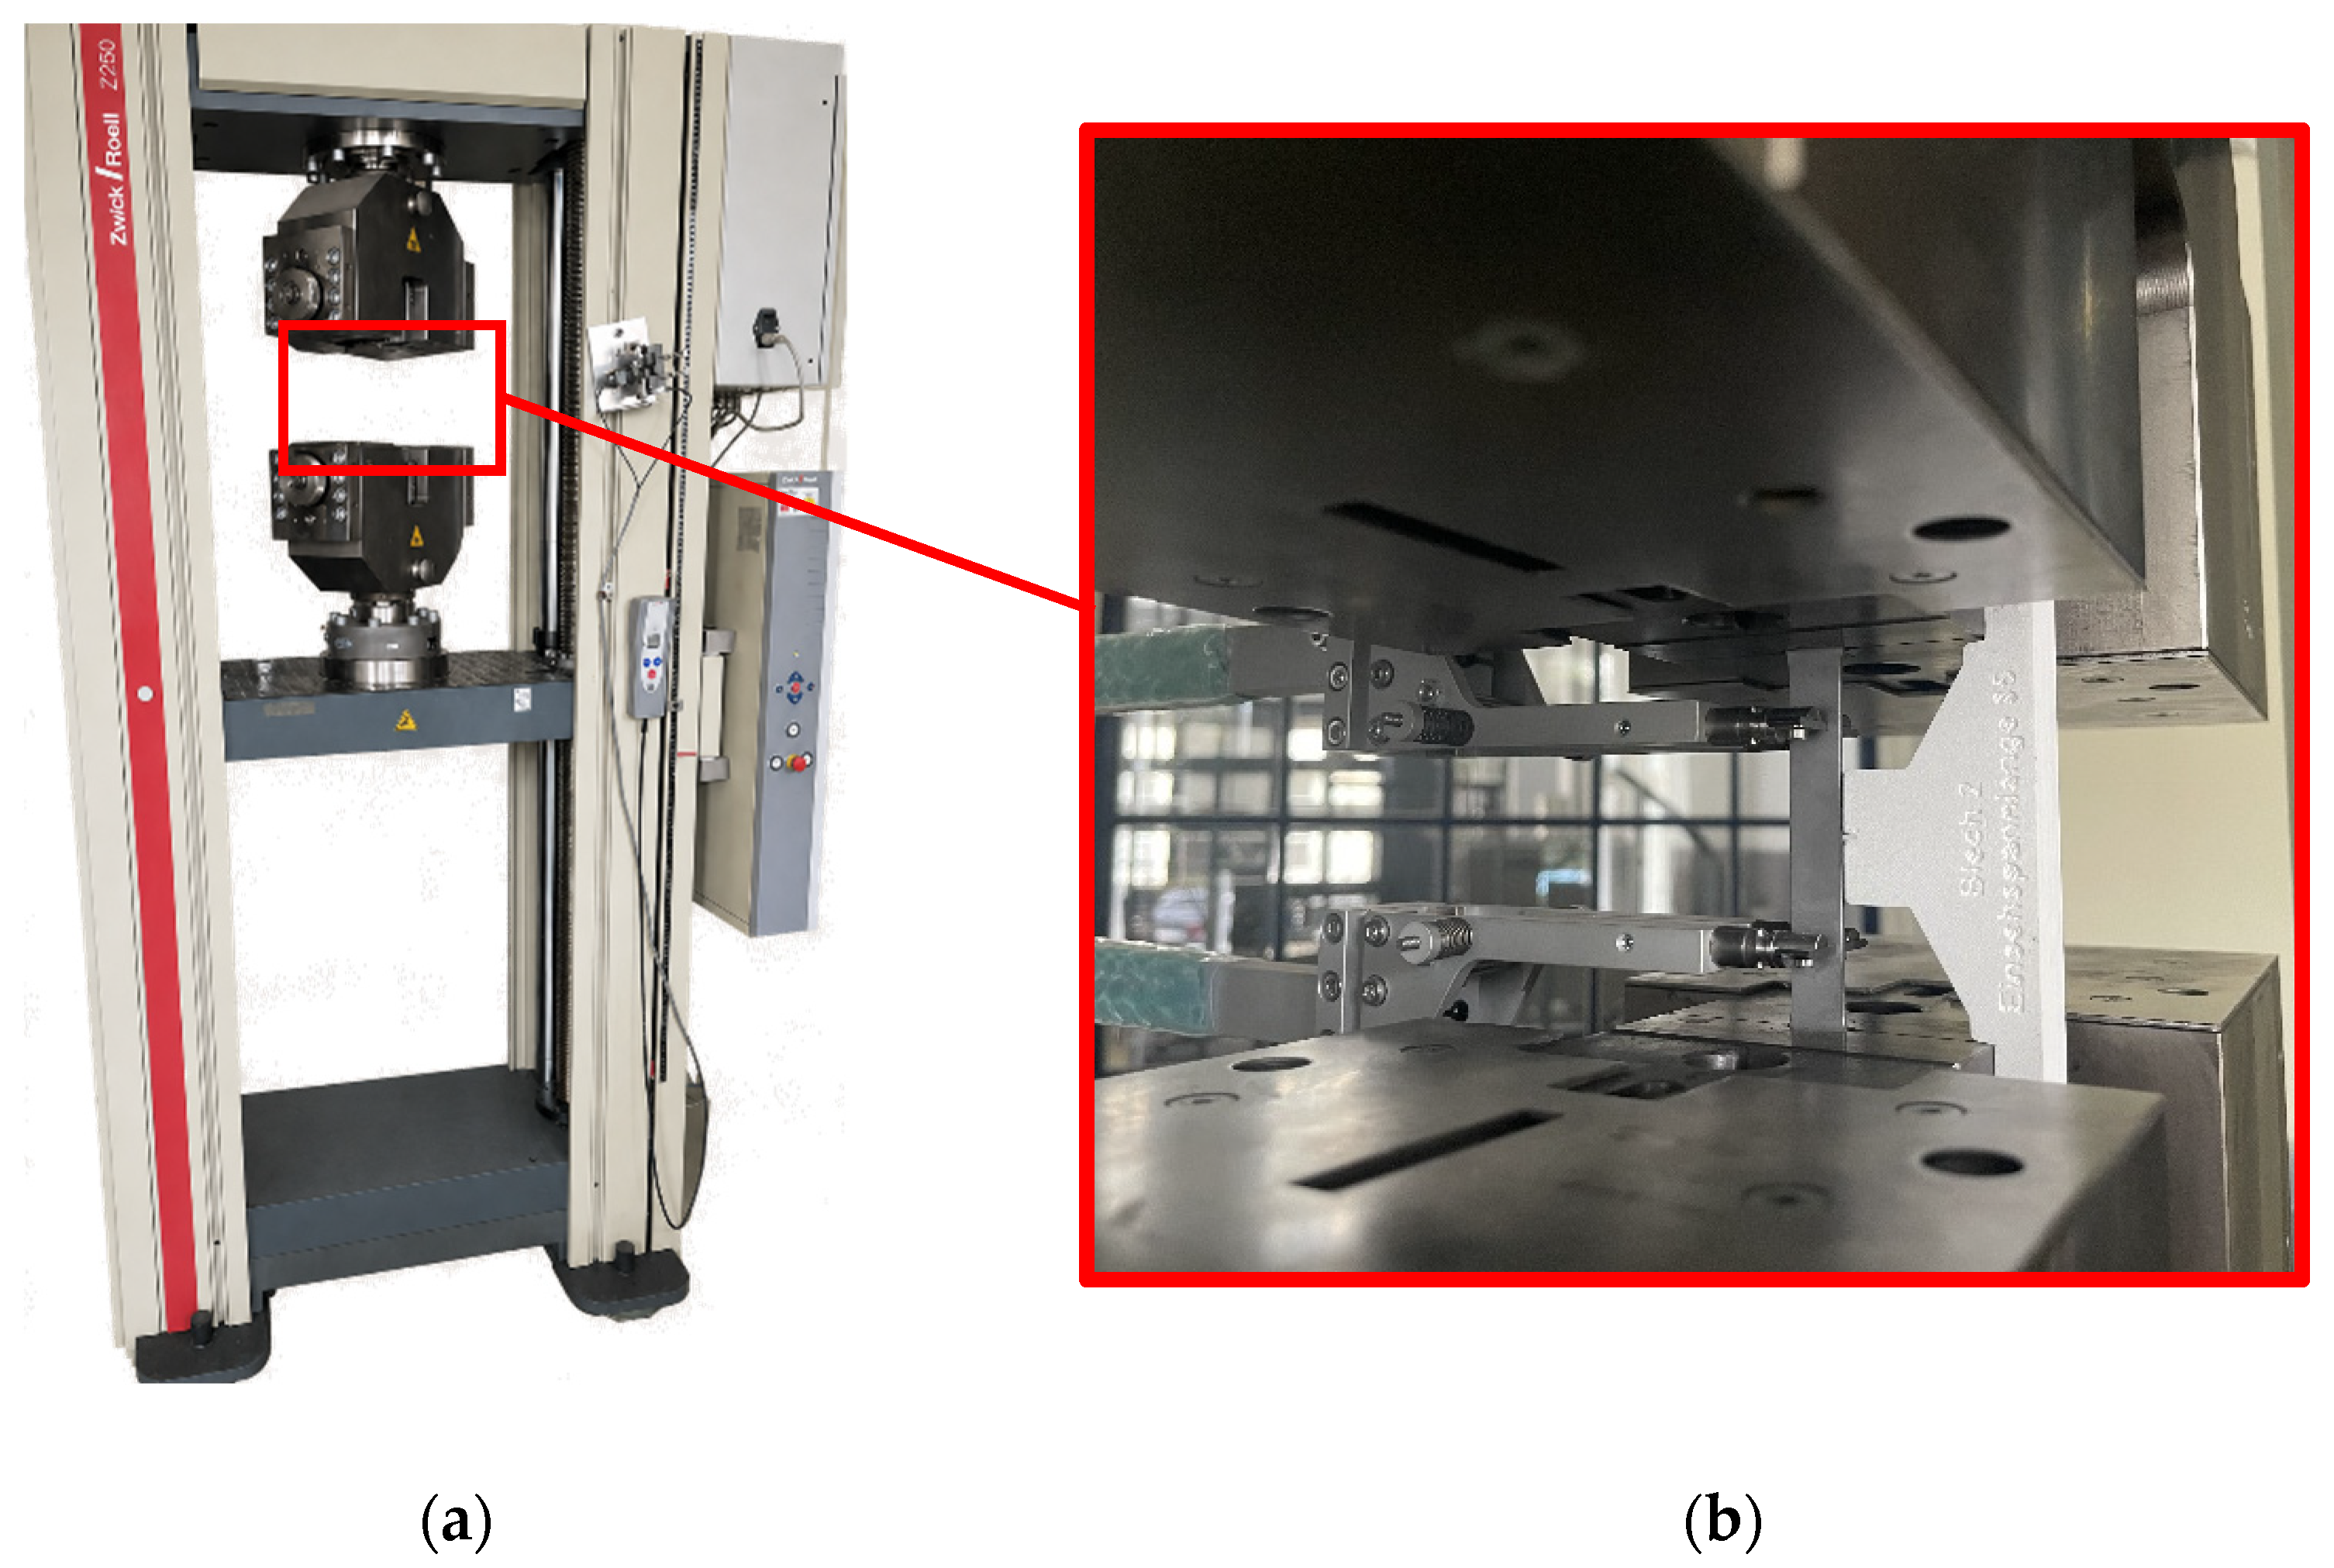
All tensile tests were conducted using a universal testing machine (Z250, Zwick/Roell, Ulm, Germany), as shown in Figure 2a. Data acquisition and evaluation were performed using testXpert II software (version 3.6), see the Supplementary Materials. To ensure the correct position of the specimens, a 3D-printed positioning aid manufactured by fused deposition modeling (FDM) was used, as shown in Figure 2b.
Figure 2.
Experimental tensile-testing setup: (a) universal testing machine and (b) close-up of the clamped specimen with the attached extensometer and positioning aid.
Axial deformation was measured directly on the specimen using a contact-type Zwick/Roell makroXtens extensometer (type BT2-EXMACRO.011), as shown in Figure 2b. According to the manufacturer’s specifications for the makroXtens system [23], the extensometer can achieve accuracy class 0.5 according to EN ISO 9513 and a maximum differential displacement measurement error of ±1 µm in the range from 20 to 200 µm. The extensometer remained attached to the specimen throughout the loading–unloading–loading sequence, such that the strain was measured directly within the specimen gauge section rather than being derived from crosshead displacement. The experiments were carried out under displacement-controlled conditions with a constant strain rate of 2.5 × 10⁻⁴ s−1 for all test series. During unloading, the specimens were unloaded to a minimum stress level of 10 MPa.
Cyclic loading–unloading–loading (ULUL) tensile tests were performed according to a predefined test procedure applied to all materials and orientations. In each cycle, the specimen was loaded to a prescribed strain level, unloaded to a minimum stress level of 10 MPa, and subsequently reloaded. One specimen was tested for each material–orientation combination at 0°, 45°, and 90° relative to the rolling direction, resulting in nine cyclic ULUL specimens in total.
Each test consisted of 20 loading–unloading–loading cycles with incrementally increasing strain levels. The strain increment per cycle was material-specific. A strain increment of 0.5% per cycle was applied to DOCOL780DP+AM, whereas increments of 1% and 2% were used for WBS235JR and CN4301-4307+2B, respectively. The initial strain level was defined separately for each material and corresponded to the respective strain increment.
The material-specific strain increments were selected to accommodate the different deformation ranges of the investigated materials while providing 20 loading–unloading–loading cycles per test. Because the uniform elongation ranges differ between the materials, a common strain increment would not have provided the same balance between the number of cycles and the covered strain range for all materials. The selected increments determine the spacing of the data points used for Yoshida calibration and may therefore influence the fitted parameters. This influence was not independently investigated in the present study and cannot be quantified from the available data.
Separate monotonic tensile tests were performed for each material and orientation, with three specimens tested per material–orientation combination. These tests were used to determine the mean total elongation at maximum force, Agt, which was subsequently used in the evaluation procedure described in Section 2.4. The applied test parameters for the cyclic experiments are summarized in Table 2.
Table 2.
Parameters of the cyclic ULUL tensile tests for the investigated materials.
2.4. Evaluation of the Apparent Unloading Modulus
The ULUL data were evaluated using true stress σtrue (1) and logarithmic true strain εtrue (2). Within the range of macroscopically uniform deformation, engineering stress σeng and strain εeng were converted according to [23,24]:
and
Because these conversions assume a homogeneous uniaxial stress state, the evaluation was restricted to ULUL cycles whose unloading onset occurred below the direction-specific mean total elongation at maximum force, Agt. For each material–orientation combination, the mean Agt value was determined from three separate monotonic tensile tests. Cycles with unloading onset at or above the corresponding mean Agt were excluded from the apparent-unloading modulus evaluation and the subsequent Yoshida calibration. This restriction was used as a conventional macroscopic criterion for the evaluated deformation range; it does not establish local strain homogeneity or demonstrate the complete absence of necking.
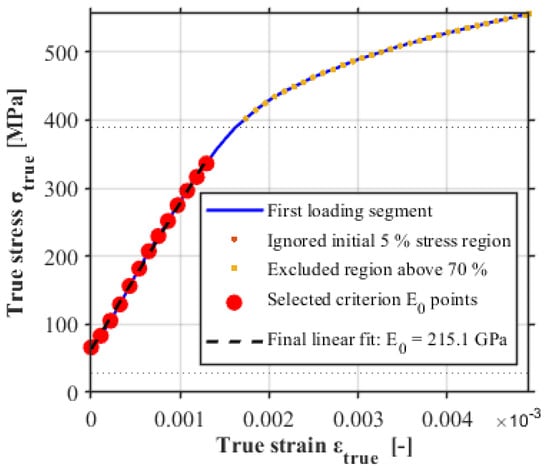
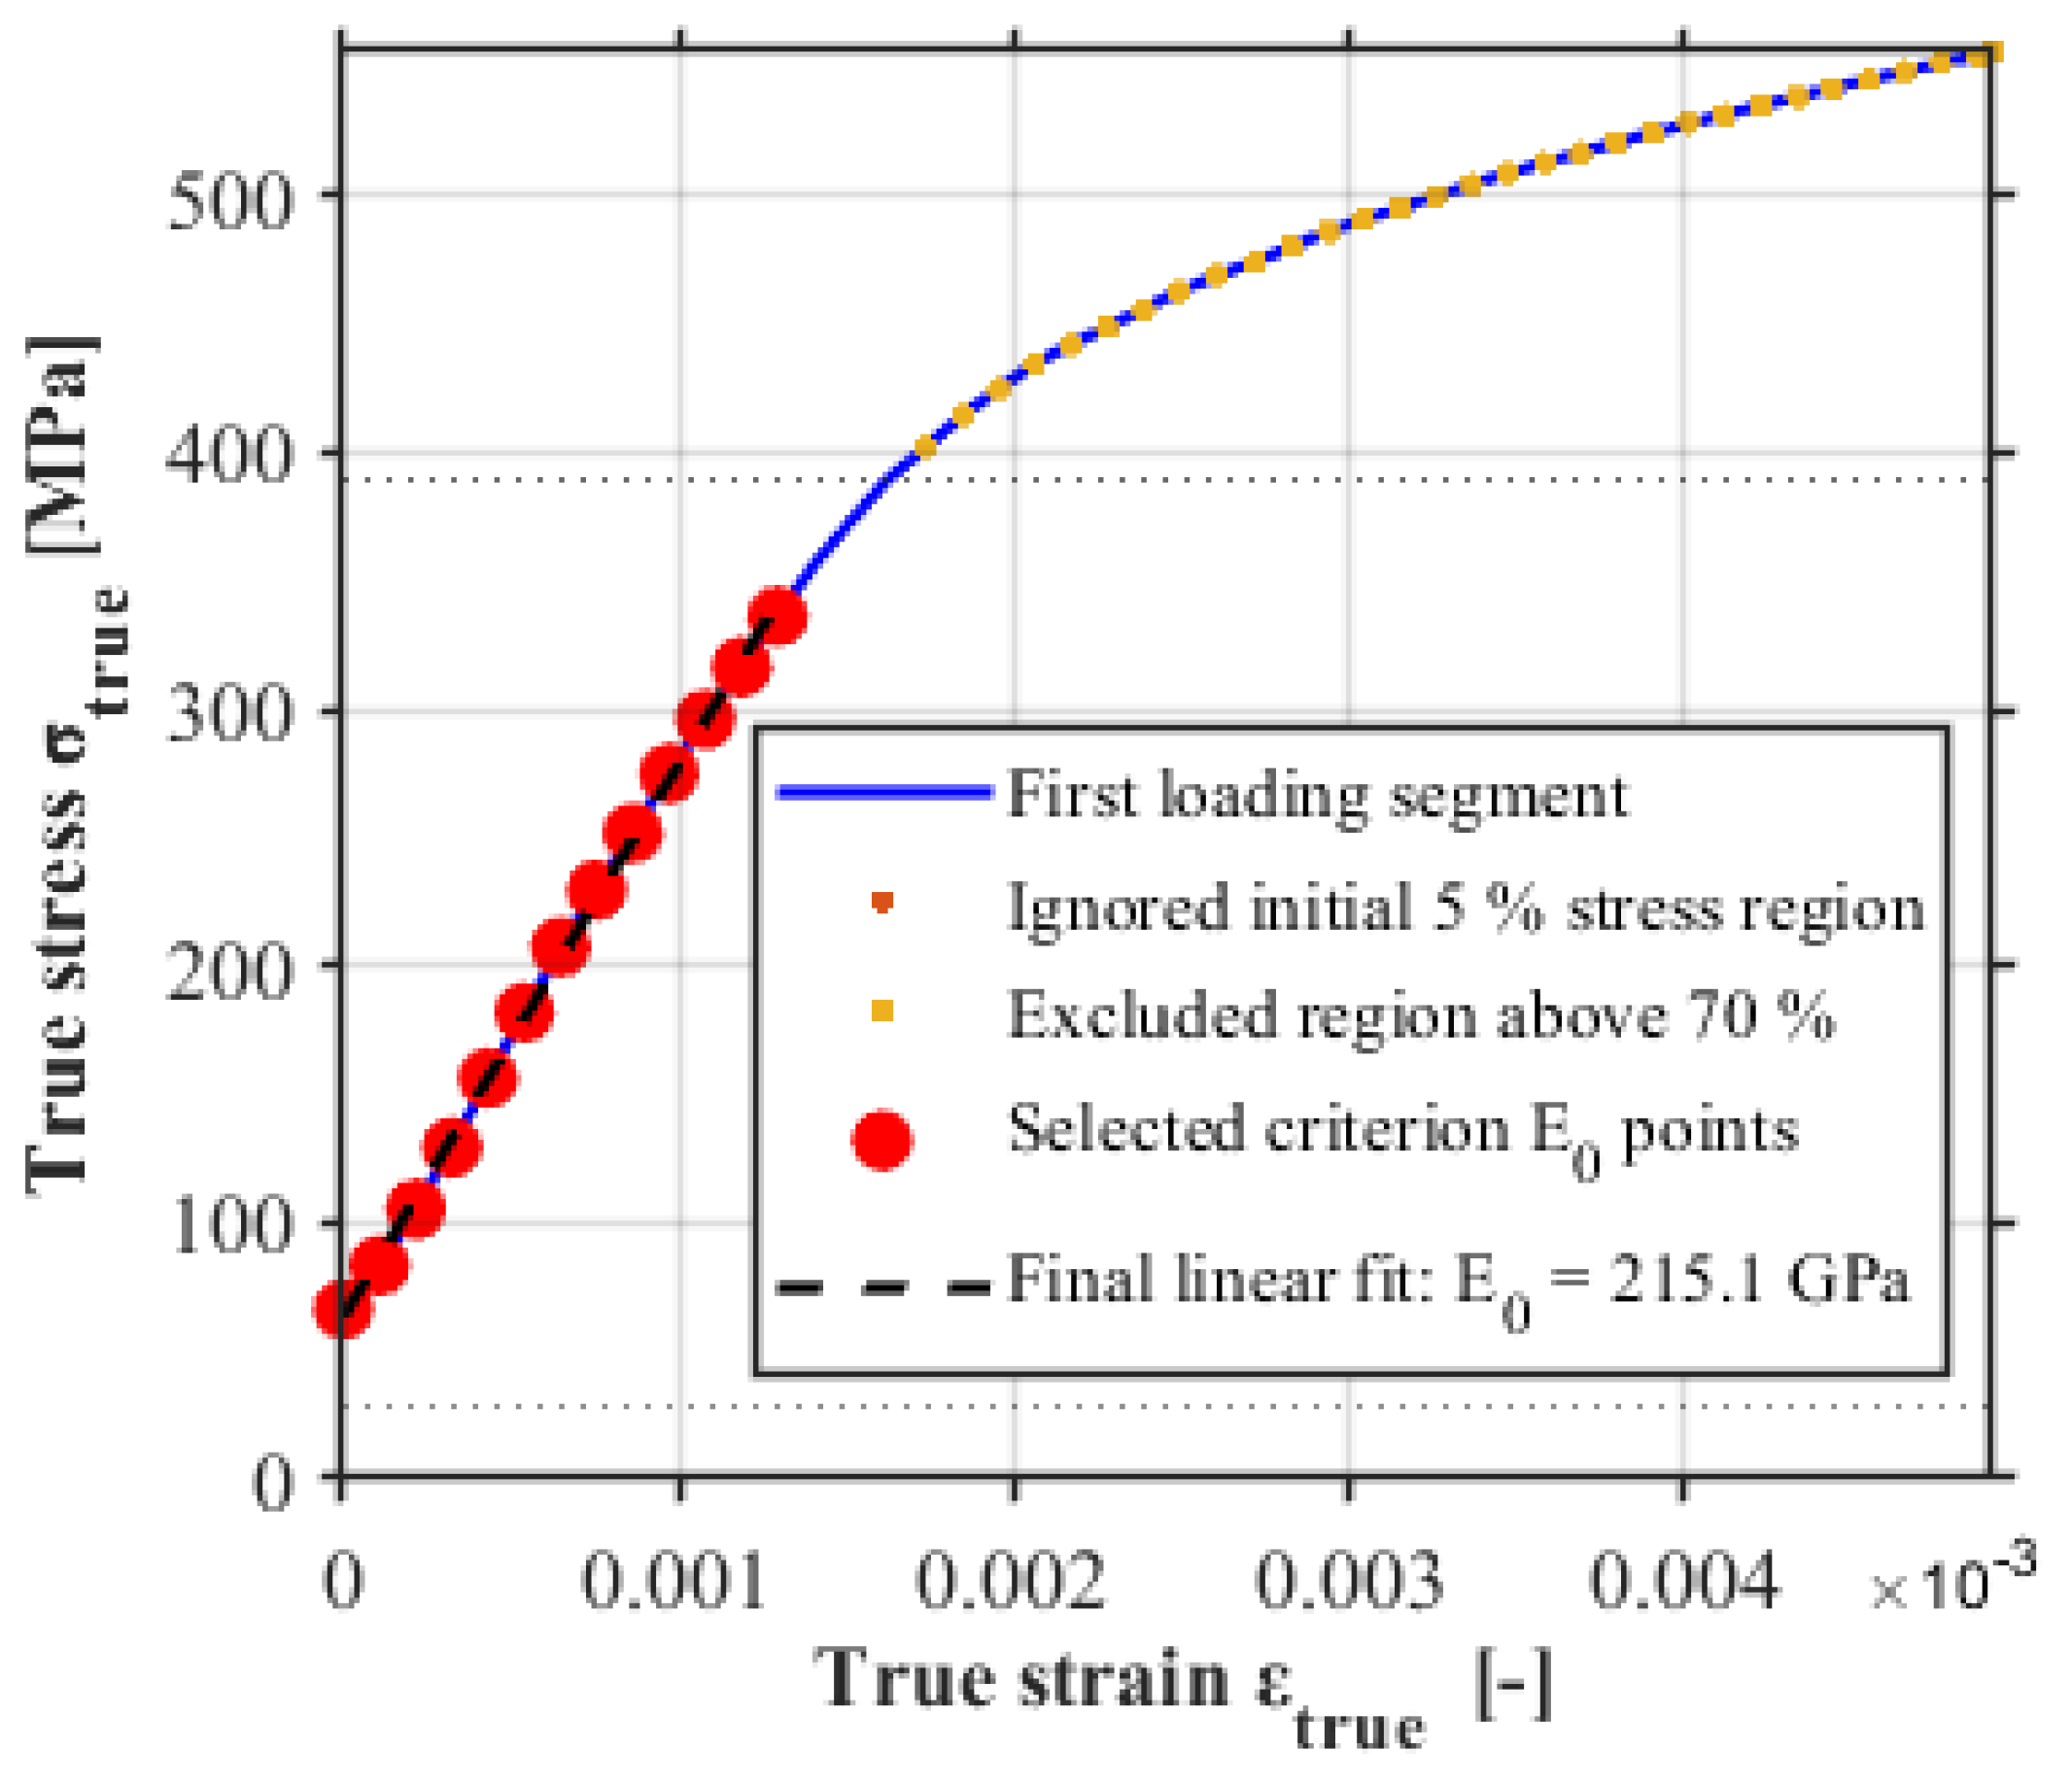
The initial elastic reference modulus E0 was determined independently from the first loading branch. Tensile-based modulus evaluation can depend on the selected regression interval and on the gradual elastic–plastic transition [25,26]. Therefore, an automated criterion-based search was applied between 5% and 70% of the maximum stress of the first loading branch. Candidate intervals were required to contain at least six data points, span at least 100 MPa, yield between 150 and 250 GPa and satisfy R2 ≥ 0.998, a maximum local slope deviation of 12%, a boundary slope difference of 10%, and a normalized curvature index of 1.5% or less. If no valid interval was identified, a relaxed set of criteria was applied using limits of R2 ≥ 0.995, 60 MPa stress span, 18% local-slope deviation, 15% boundary-slope difference, and 2.5% normalized curvature. Among the accepted intervals, the interval with the largest stress span was selected. As an additional consistency check, a criterion-based E0 below the first valid chord modulus was rejected because it would be incompatible with the monotonically decreasing Yoshida relation. In such cases, E0 was determined by linear regression over the first-loading data satisfying σtrue ≥ 0.05 σmax and εtrue ≤ 0.001. The same procedure was applied to all material–orientation combinations. Figure 3 shows the procedure for DOCOL780DP in the rolling direction. Small negative strain offsets caused by preload and gripping were shifted only for visualization in Figure 3 and were not used to modify the evaluated data.
Figure 3.
Determination of the initial elastic reference modulus E0 for DOCOL780DP in the rolling direction.
The primary measure of the unloading response is the chord modulus, which is commonly used to represent the average unloading stiffness after plastic pre-straining [1,3]. For each valid cycle, the chord modulus Echord (3) connects the unloading-start point (σmax, εmax) and the minimum-stress point (σmin, εmin), with a nominal unloading target of 10 MPa:
Each unloading branch was accepted only when all of the following criteria were fulfilled: at least three unloading data points were available; the stress drop was at least 20 MPa; the true strain interval during unloading was no greater than 0.03; the calculated Echord was between 50 and 260 GPa; no more than 10% of unloading data points exhibited increasing stress; and the unloading end corresponded to the defined 10 MPa minimum stress level. No additional outlier filtering or monotonic-envelope smoothing was applied.
The corresponding true plastic strain is determined from the unloading start point using the independently determined initial elastic reference modulus E0 (4):
where σmax and εmax are the true strain and true stress at the beginning of the respective valid unloading branch.
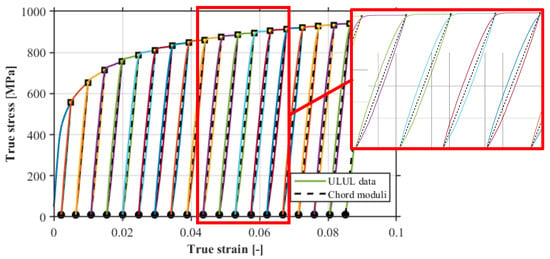
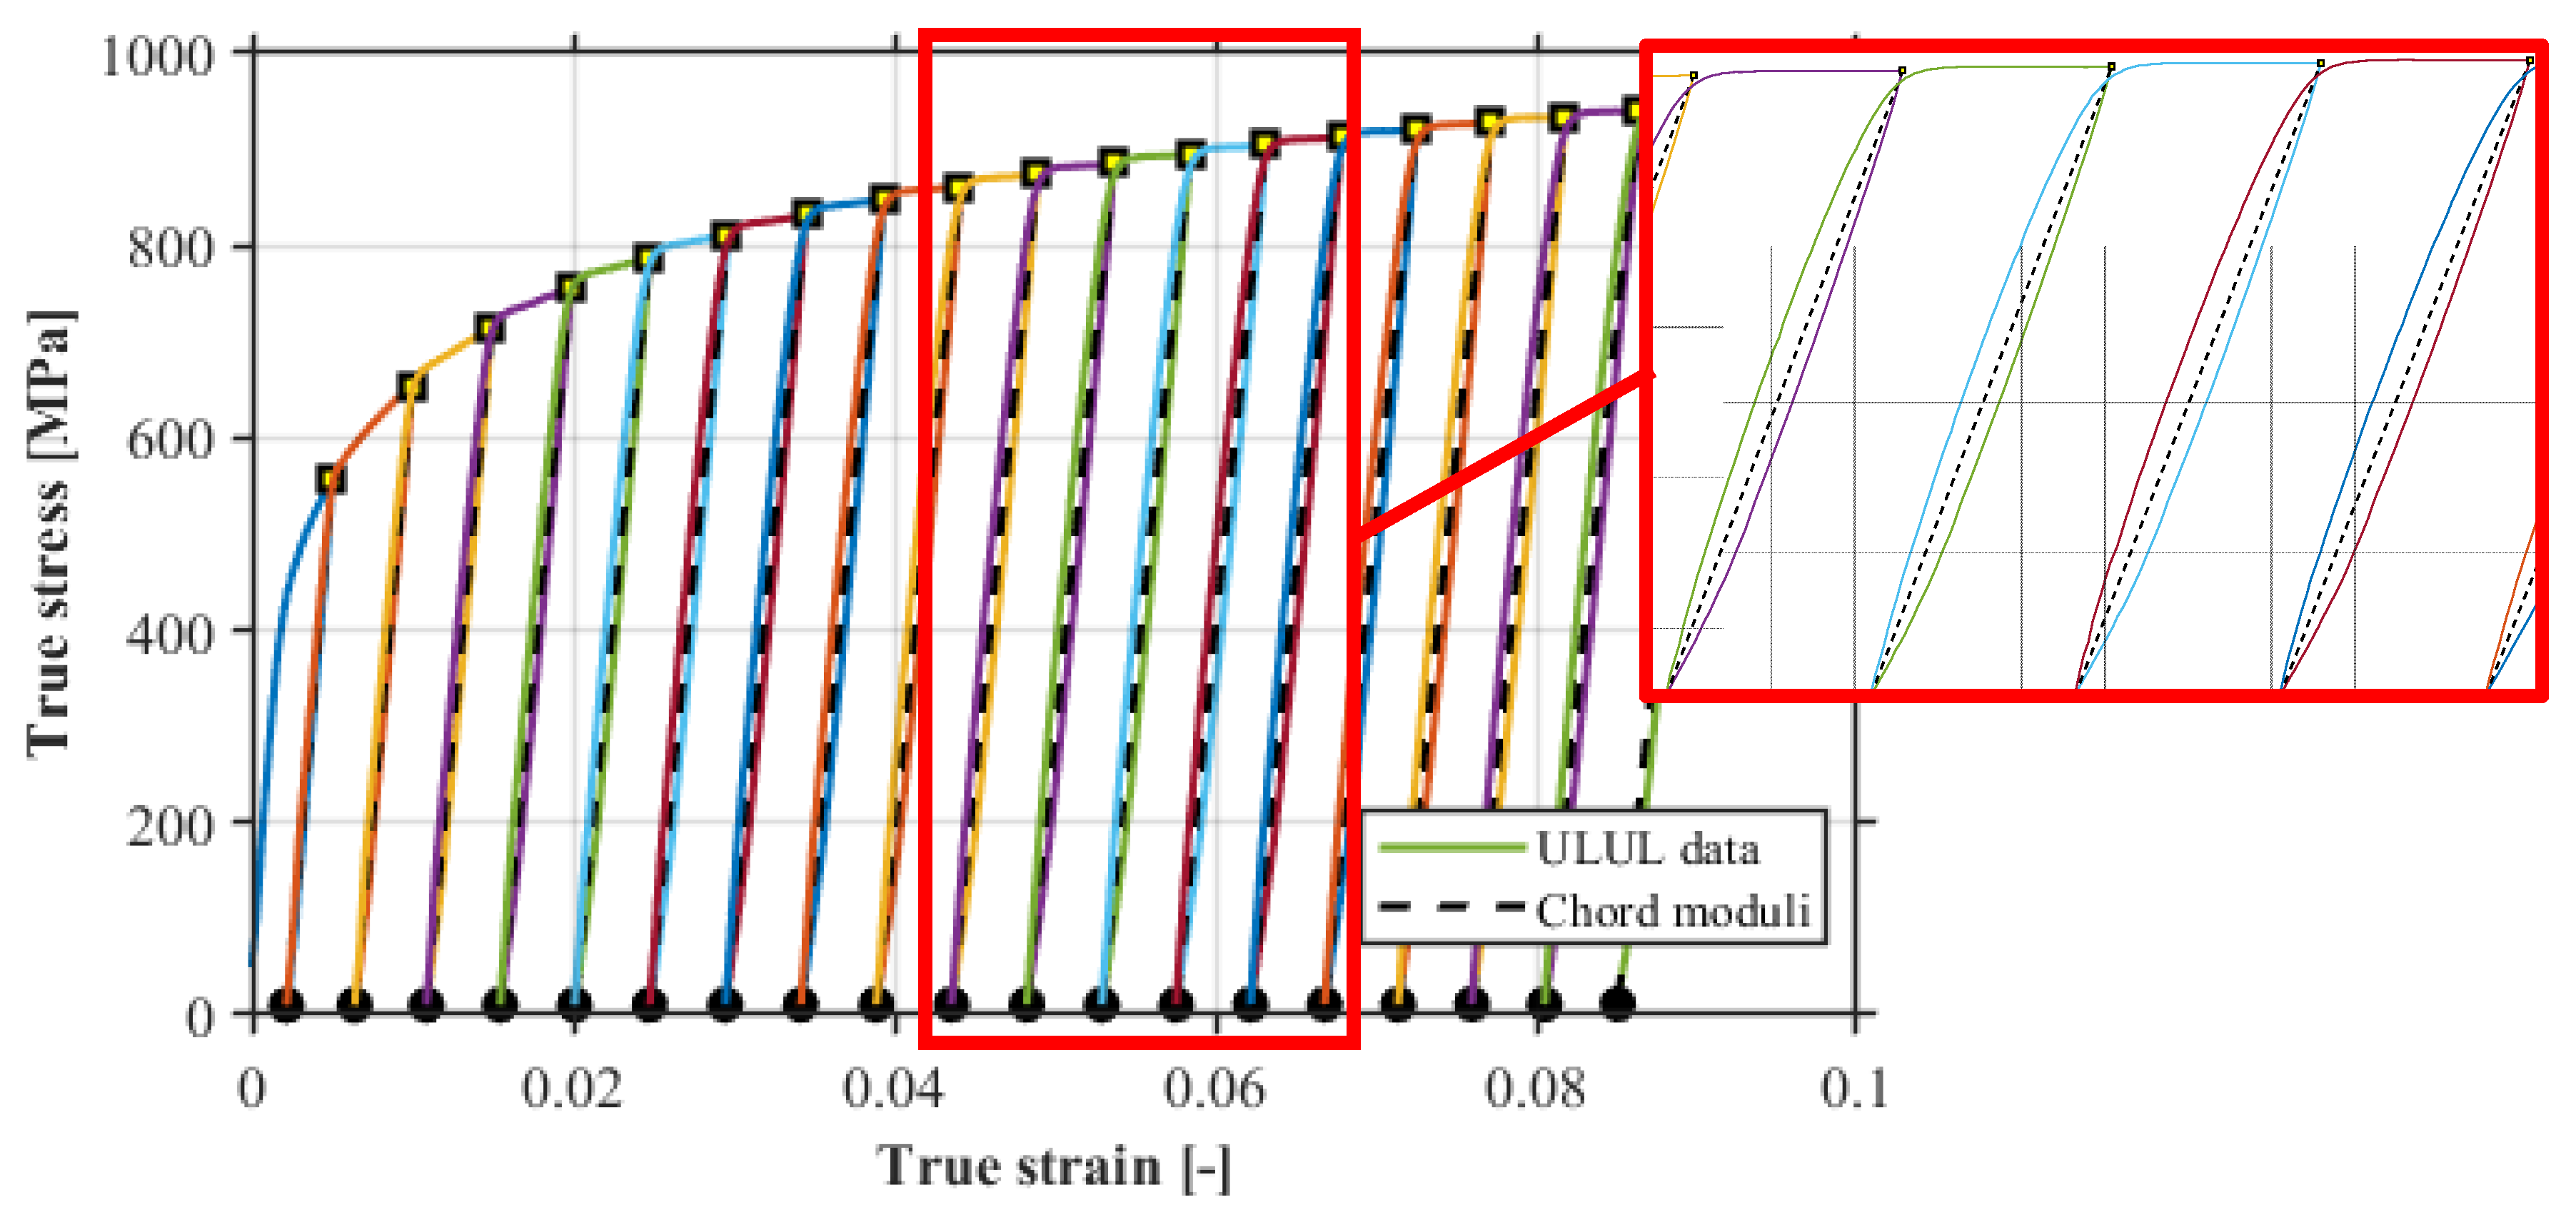
Figure 4 presents the cyclic stress–strain curves together with the evaluated chord moduli. In order to improve the visualization of the modulus evolution, an enlarged view of cycles 11–14 is additionally shown as a detail view.
Figure 4.
Cyclic true stress–true strain curve with chord modulus evaluation for DOCOL780DP in the rolling direction; inset: cycles 11–14.
The experimentally determined chord modulus is interpreted as an apparent unloading modulus rather than the intrinsic Young’s modulus, as it is additionally affected by reversible inelastic and potentially microplastic deformation processes [27]. The degradation of the apparent unloading modulus with increasing plastic strain is described using the Yoshida relation given in Equation (5) [3,6]:
where E(εpl) represents the strain-dependent apparent unloading modulus, E0 is the independently determined initial elastic reference modulus, and the fitted asymptotic chord modulus Ea is approached at large plastic strains. The parameter ξ controls the rate of modulus reduction, while εpl denotes the plastic pre-strain.
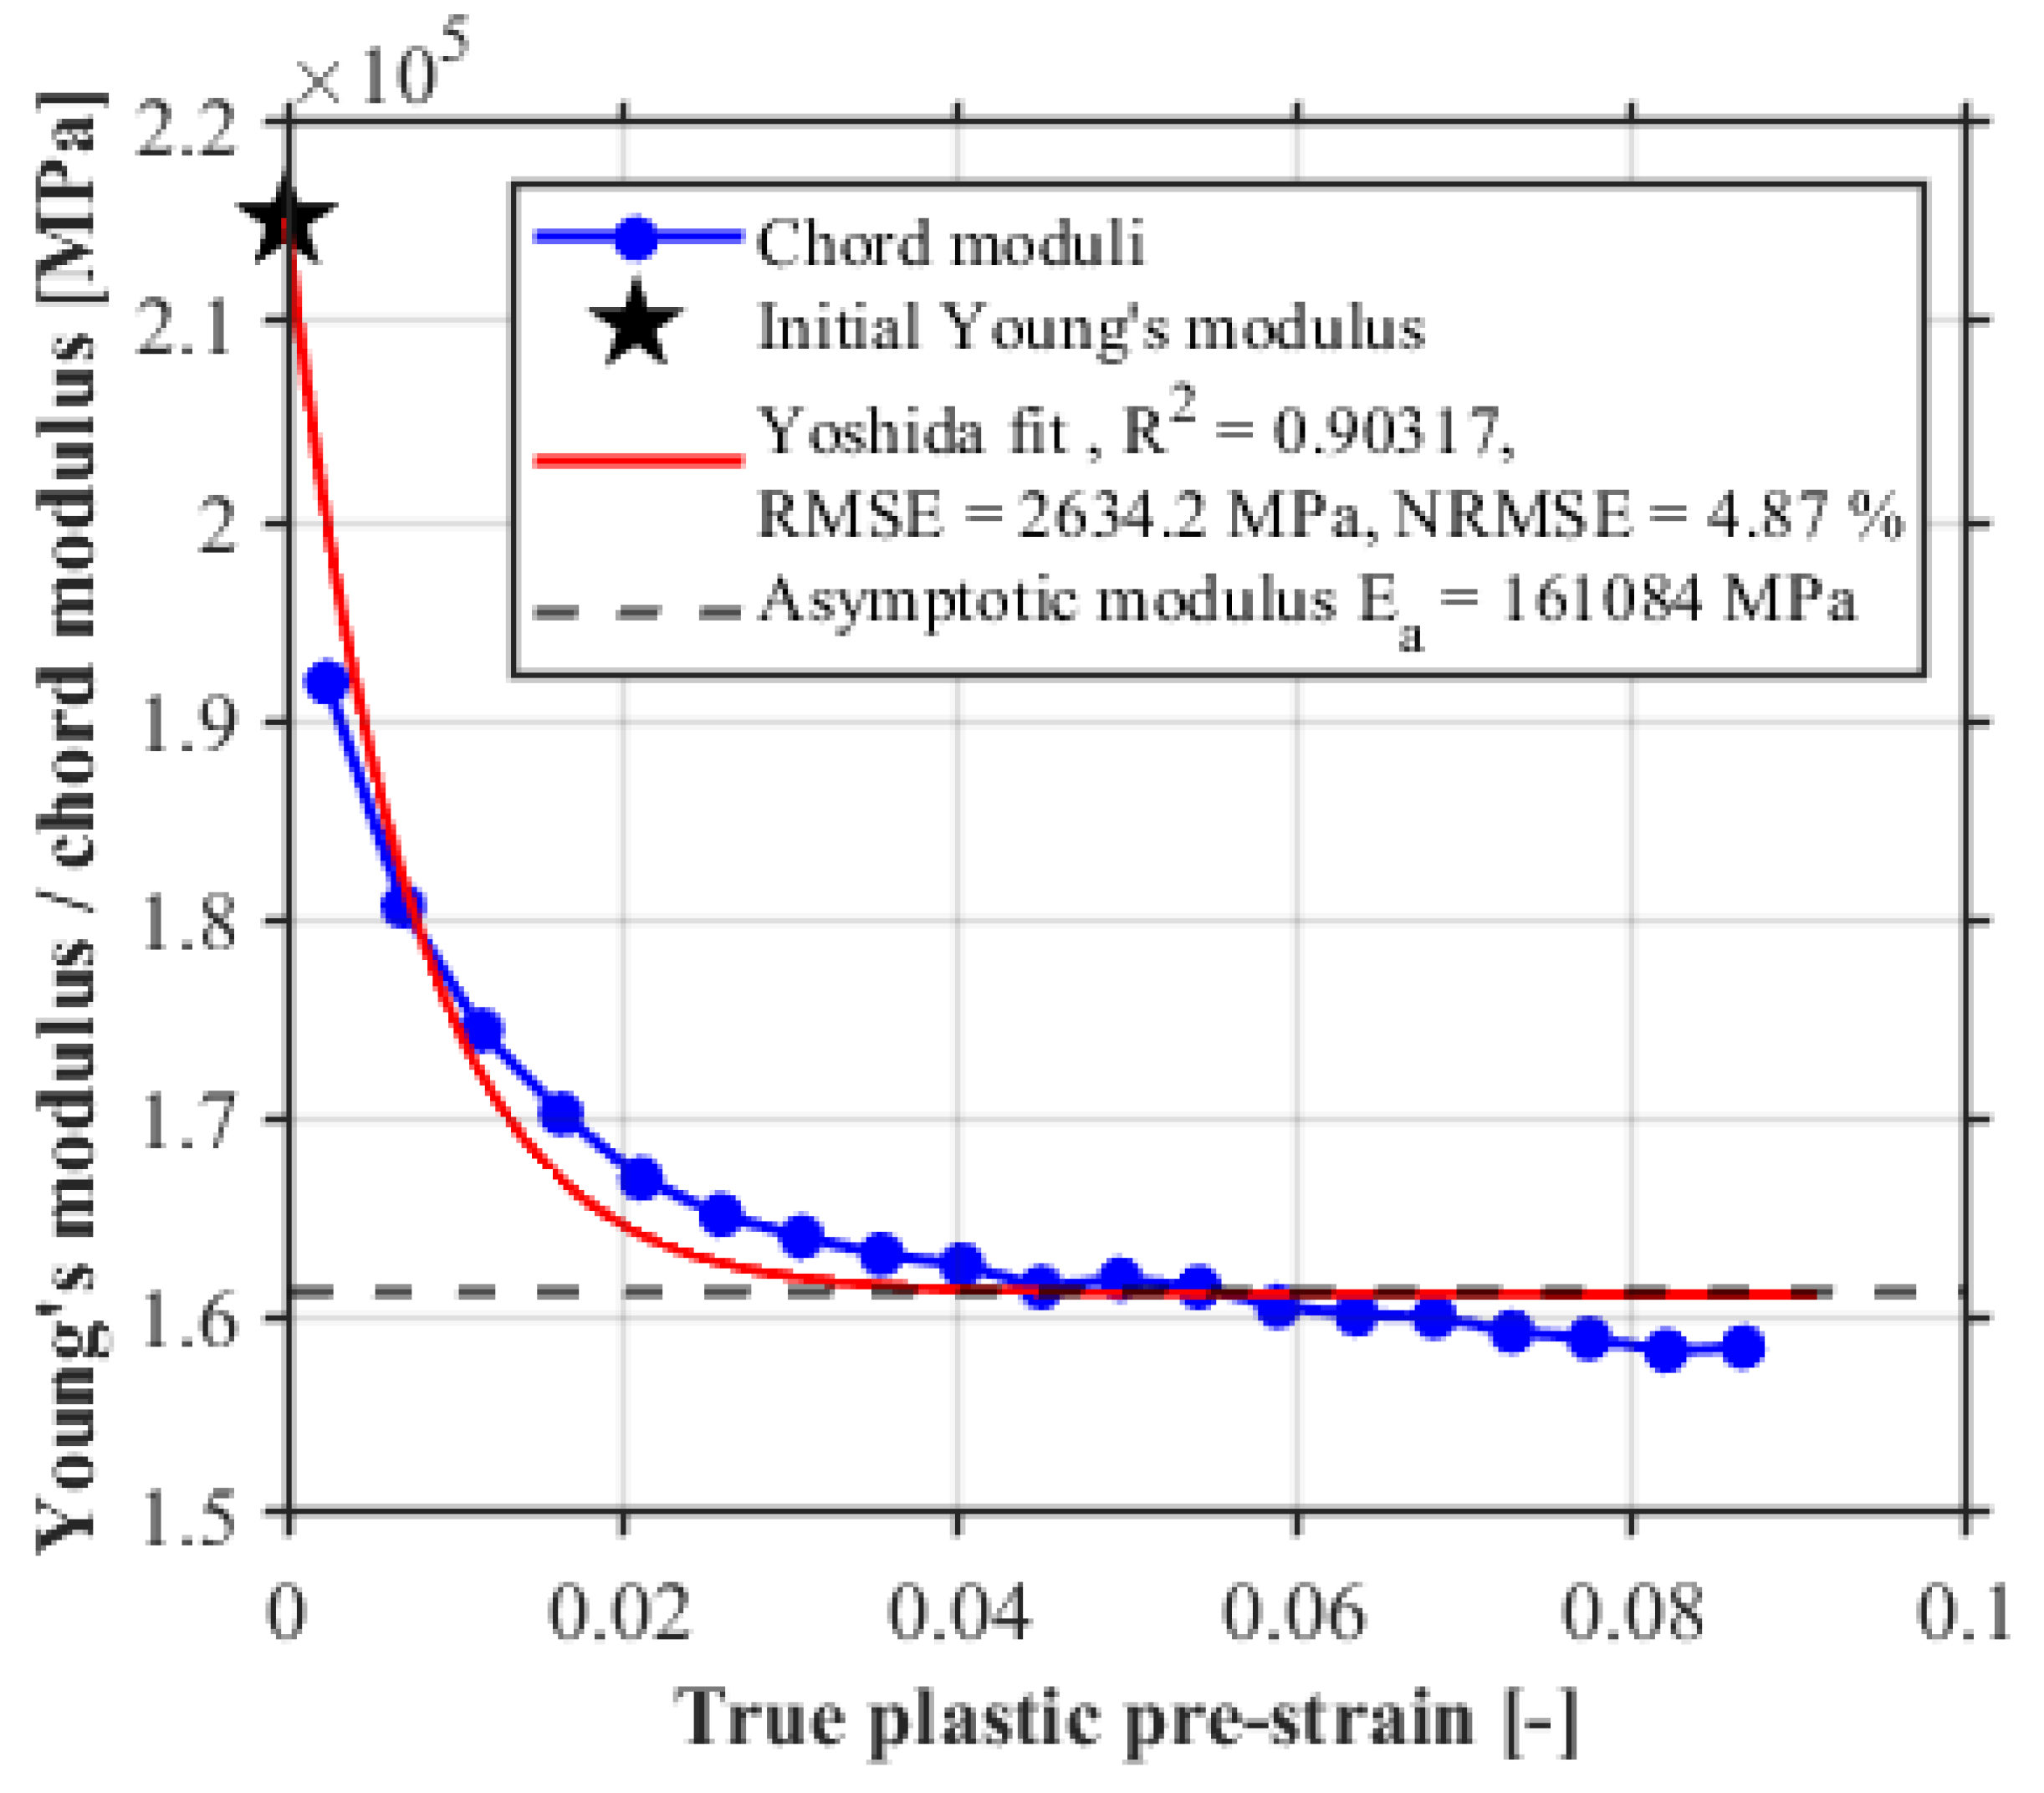
The Yoshida parameters were identified by nonlinear least-squares optimization using the experimentally determined chord moduli and plastic strain values. The independently determined initial modulus E0 was kept fixed during the optimization, while Ea and ξ were fitted. Ea is constrained to 0.7Elast ≤ Ea ≤ 1.1Elast, where Elast denotes the last valid measured chord modulus, and ξ is restricted to positive values. These bounds were fitting constraints of the implemented procedure. No outlier filtering or data smoothing was applied in the final evaluation in order to retain the experimentally observed cycle-to-cycle variation in the unloading modulus. The optimization was initialized by a broad multistart parameter screening over a wide range of start values for Ea and ξ, followed by local refinement using the Nelder–Mead algorithm [28]. Fit quality was described using the coefficient of determination R2, the root mean square error (RMSE), and the normalized root mean square error (NRMSE), defined as
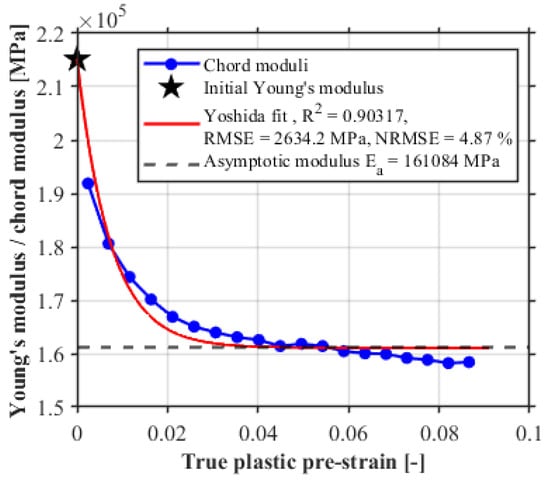
These metrics quantify the agreement between the evaluated chord modulus data and the fitted Yoshida relation; they were not used to select the primary unloading modulus definition. Figure 5 shows the final Yoshida model fit for DOCOL780DP in the rolling direction.
Figure 5.
Yoshida relation fitted to the evaluated chord moduli of DOCOL780DP in the rolling direction, including fit-quality metrics.
As an additional robustness check, two regression-based unloading modulus definitions were evaluated after the primary chord modulus analysis. Eun,full is obtained by linear regression over the complete evaluated unloading branch, whereas Eun,0–95% is determined by linear regression from the point at 95% of the unloading-start stress to the minimum stress [2,3]. Both measures were evaluated using the same E0, plastic pre-strain, validity limits, and Yoshida-fitting procedure as Echord. The regression-based definitions were used exclusively to assess whether the directional trends were robust with respect to the unloading modulus definition; Echord remained the primary definition throughout the study.
2.5. Numerical Springback Sensitivity Analysis
Recent roll forming studies have shown that springback predictions are sensitive to the constitutive description, including plastic anisotropy and strain-dependent unloading stiffness [9,16,17]. A reduced three-station roll forming model is therefore used in MSC Marc/Mentat 2024.1 [29] to quantify the model sensitivity to the experimentally observed directional unloading modulus evolution. The analysis is intended as a controlled numerical sensitivity study and not as a complete validation of the absolute springback prediction.
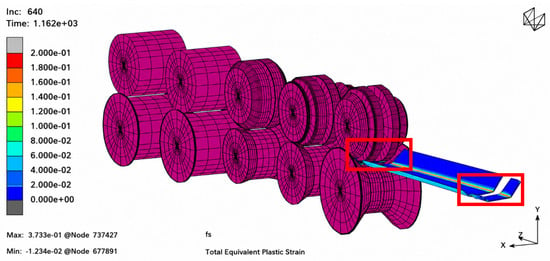
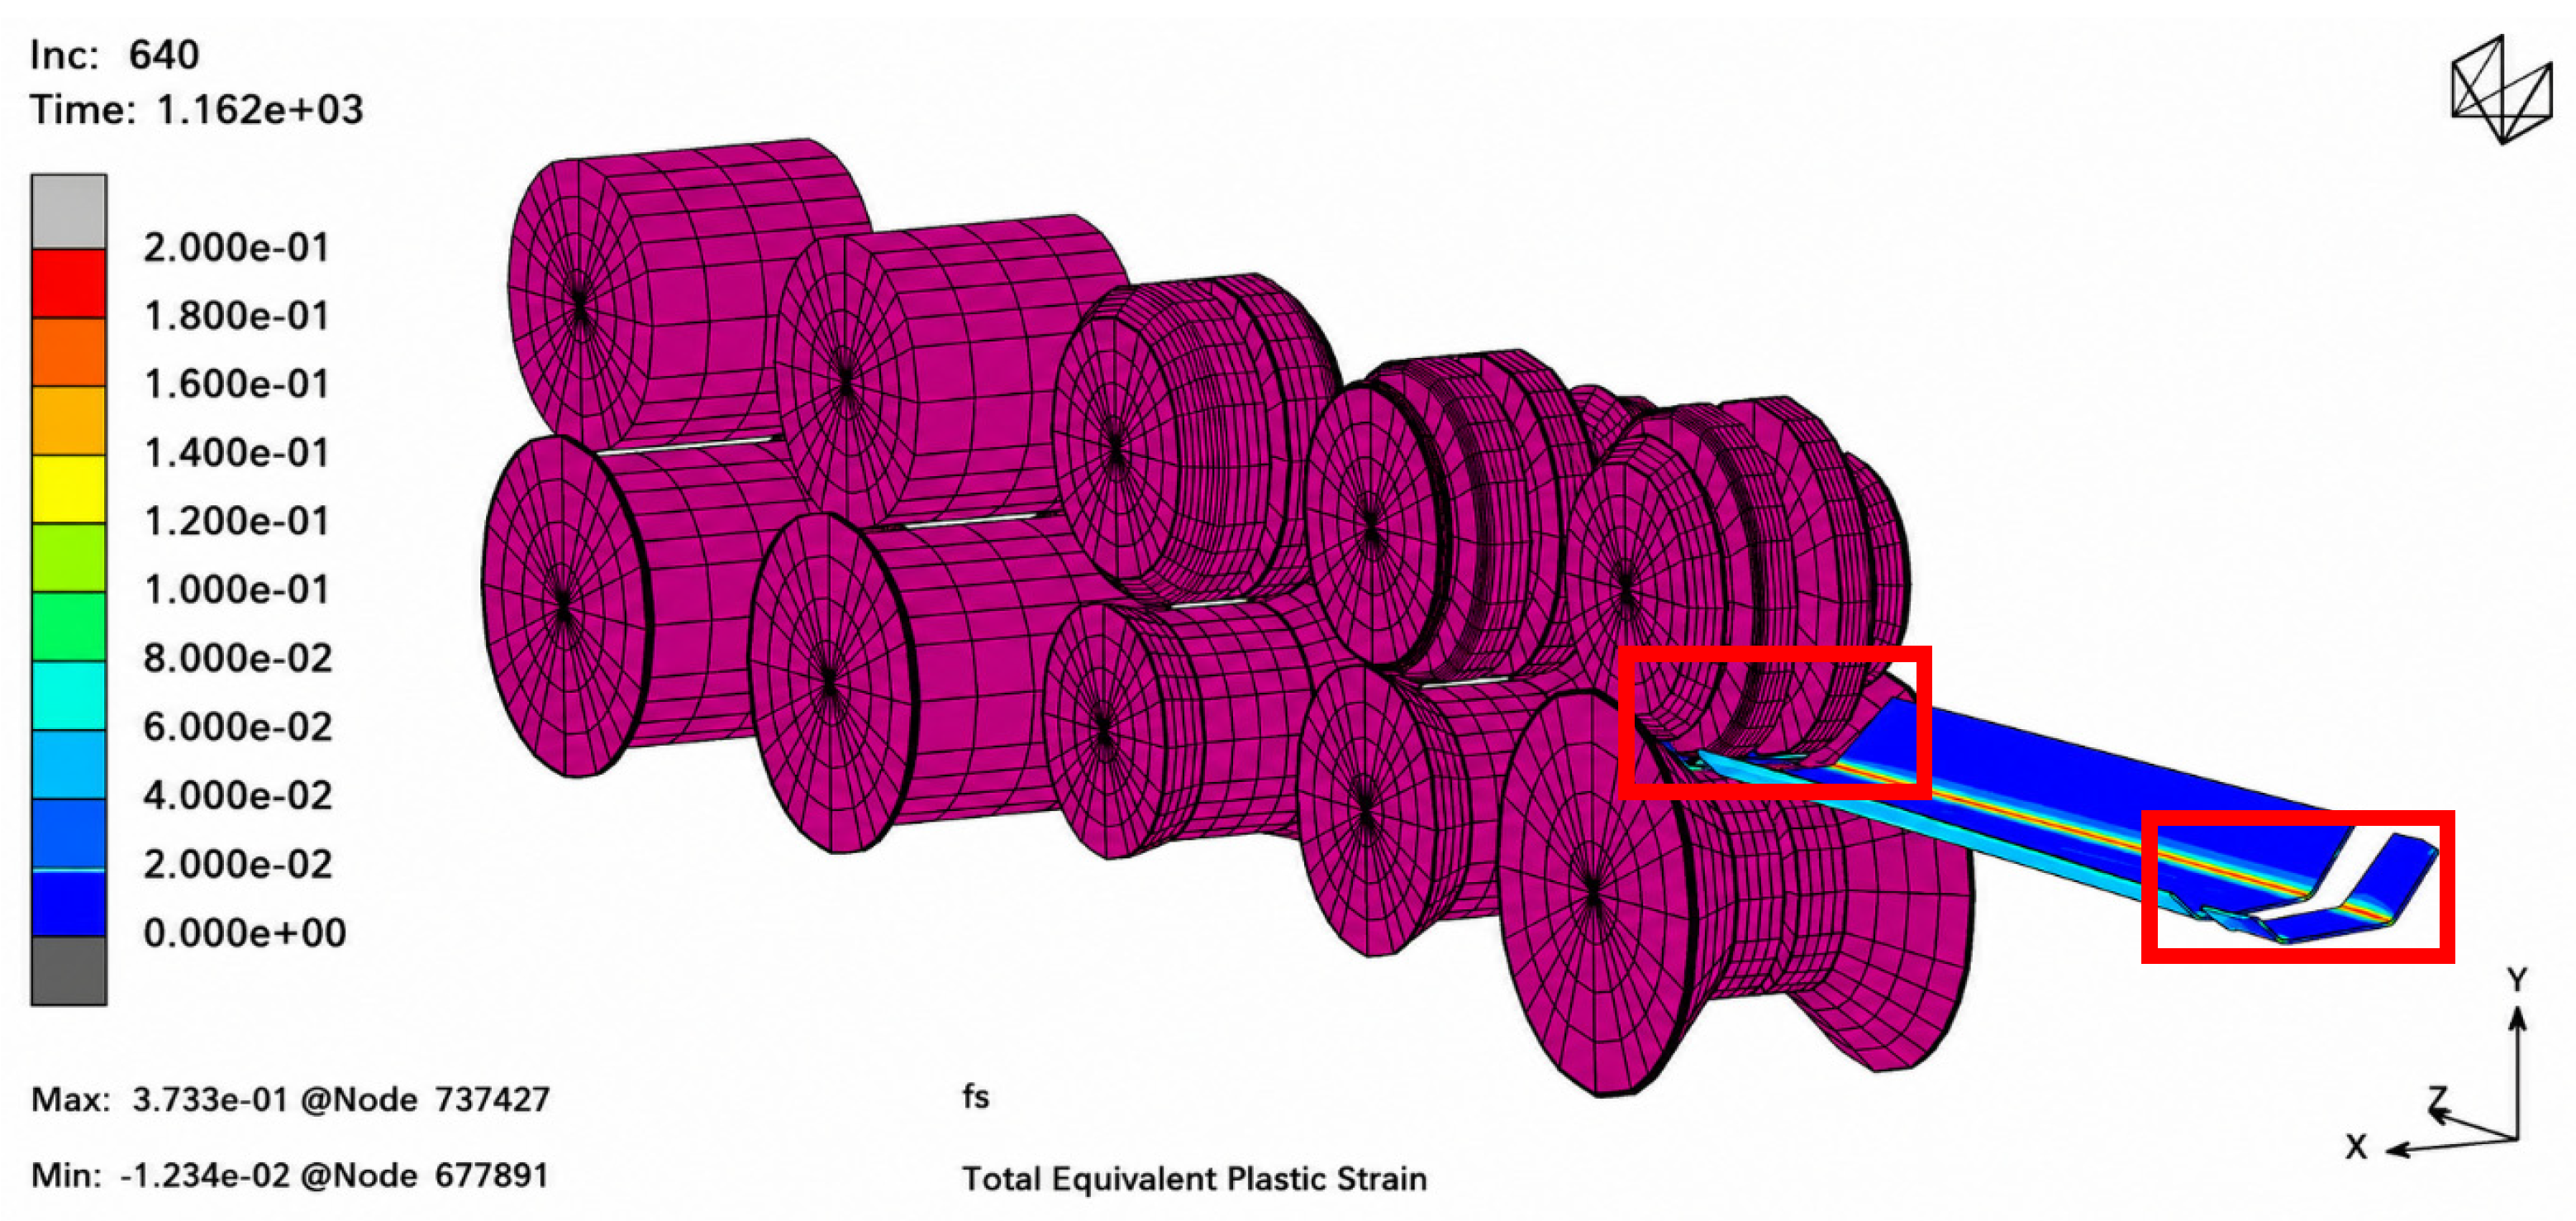
The 2 mm sheet is discretized with 40,800 eight-node solid elements (Marc type 7) using a large-strain formulation, two elements through the thickness, and a nominal longitudinal element length of 2 mm. The rolls are modeled as rigid bodies with frictionless sheet–roll contact, and sheet self-contact is enabled. The frictionless-contact assumption is supported by previous roll forming investigations [30,31,32]. After forming, the evaluation section is released by element deactivation, using the Deactivation/NC Machining option in Marc/Mentat, to allow residual-stress-driven springback. The subsequent unloading step was simulated over 2 s using 60 increments to allow the formed profile to relax. The deactivated evaluation section is shown in Figure 6 and indicated by the red squares.
Figure 6.
Reduced three-station roll forming model, including the modeled rolls, sheet, and evaluation section released after forming; the released section is marked by red squares.
CN4301-4307+2B is used because the relevant plastic-strain range in the investigated bending regions was within the experimentally characterized range of this material. For all three orientations, the maximum plastic pre-strain included in the Yoshida calibration was approximately 0.318, whereas the maximum equivalent plastic strain reached in the roll forming simulation was approximately 0.268. Thus, the simulated equivalent plastic strain remained within the experimentally characterized range, avoiding extrapolation of the fitted unloading modulus relations. A constant Poisson’s ratio of 0.30 [33] was assumed in all simulations, and the same isotropic Swift hardening law [34] (7) was applied in all simulations:
where denotes the equivalent plastic strain. This equivalent plastic strain is the scalar history variable used in the numerical material description and is distinct from the uniaxial plastic pre-strain εp used in the experimental modulus evaluation in Section 2.4.
Four otherwise identical simulations were performed using the model shown in Figure 6. The reference case uses the rolling-direction initial modulus as a constant value, E = 181.01 GPa. The other three cases use the Yoshida relations identified at 0°, 45°, and 90° according to Equation (5), with the equivalent plastic strain as the scalar history variable. The parameters are summarized in Table 3. The three directional Yoshida cases differ in the scalar strain-dependent unloading modulus relation assigned to the numerical material description, implemented as a plastic-strain-dependent Young’s modulus, E = E(), using the equivalent plastic strain as the scalar history variable. They therefore represent controlled scalar sensitivity cases rather than a fully anisotropic elastic constitutive model.
Table 3.
Modulus parameters used in the numerical sensitivity analysis.
Springback is evaluated from STL exports using an in-house contour-evaluation routine. The opening angle between the outer profile surfaces is evaluated in the final forming station and along the cut and uncut profiles. The released profile angle distributions are compared between the constant modulus reference and the three directional Yoshida cases. The nominal sheet thickness is 2 mm, and the final thickness is 1.99998 mm in the base region and 2.0000 mm in the flange regions for all investigated simulations. The resulting thickness change is therefore negligible under the simulated process conditions and does not require separate consideration in the evaluation of the profile geometry.
3. Results
The following sections present the experimental evolution of the apparent unloading modulus and the results of the numerical springback sensitivity analysis described in Section 2.4 and Section 2.5, with emphasis on directional dependence relative to the rolling direction.
3.1. Evolution of the Apparent Unloading Modulus
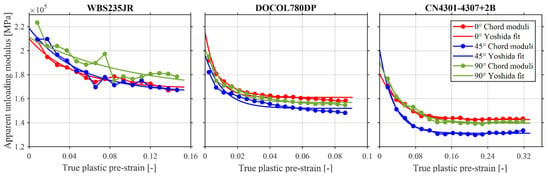
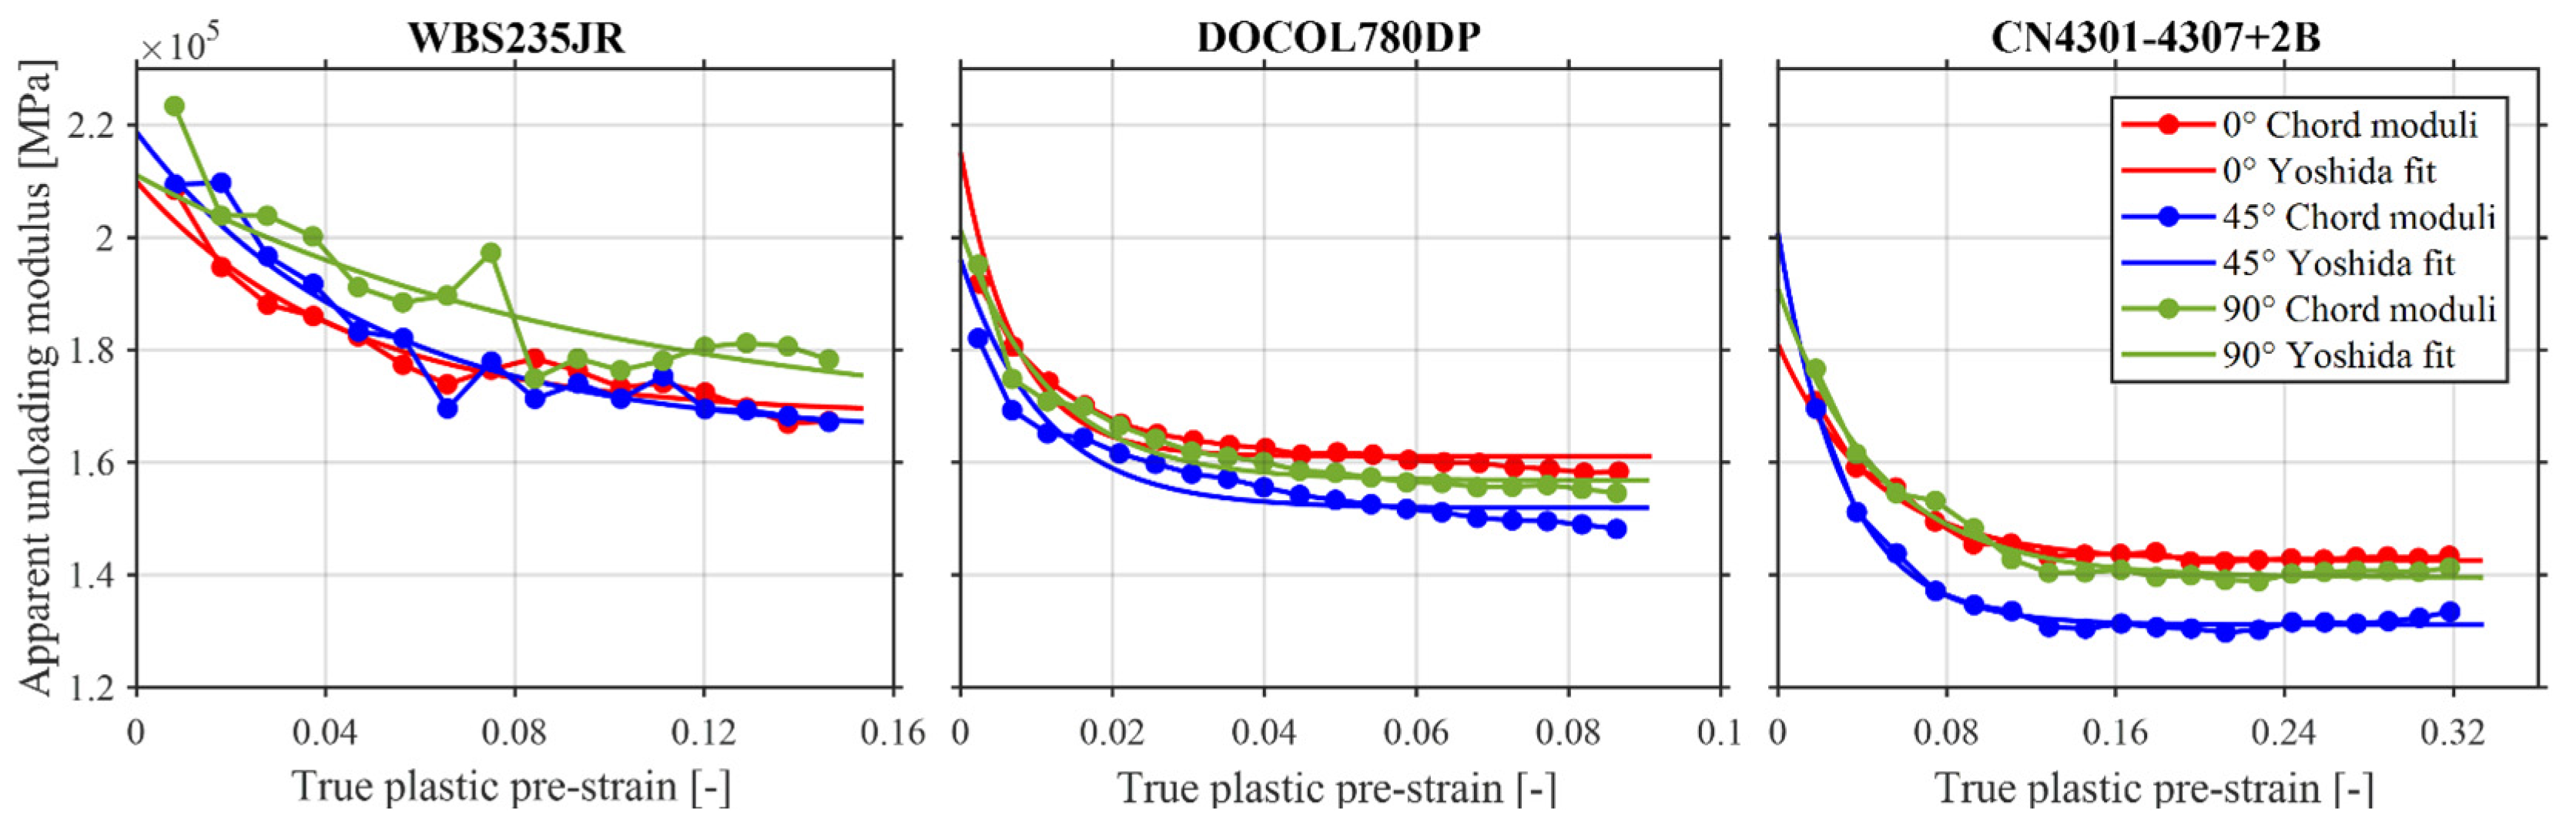
For all investigated material–orientation combinations, the apparent unloading modulus decreases with increasing plastic pre-strain. The steepest decrease occurs at low plastic pre-strains and gradually levels off with increasing deformation. Figure 7 shows the experimentally determined chord moduli and the corresponding Yoshida fits for WBS235JR, DOCOL780DP+AM, and CN4301-4307+2B at 0°, 45°, and 90° relative to the rolling direction.
Figure 7.
Evolution of the apparent unloading modulus and corresponding Yoshida fits at 0°, 45°, and 90° relative to the rolling direction for WBS235JR, DOCOL780DP, and CN4301-4307+2B. The x-axis ranges reflect the different experimentally accessible plastic pre-strain ranges of the materials.
The evolution differs between the three specimen orientations for all investigated materials. For WBS235JR, the 0° and 45° curves approach similar modulus levels with increasing plastic pre-strain, whereas the 90° orientation remains at higher modulus values over most of the evaluated range. DOCOL780DP+AM shows a comparatively close spacing of the three apparent unloading modulus curves, although differences in both the initial modulus and the subsequent modulus evolution are visible. For CN4301-4307+2B, the 45° orientation exhibits lower apparent unloading moduli than the 0° and 90° orientations over a large part of the investigated plastic pre-strain range.
The accessible plastic pre-strain range differs between the materials and is largest for CN4301-4307+2B and smallest for DOCOL780DP+AM. These differences reflect the material-dependent ranges retained by the Agt-based evaluation criterion and do not indicate different ULUL procedures. The Yoshida relation captures the overall decreasing trend of the experimentally determined chord moduli for all material–orientation combinations. The fitted relations therefore provide a common description of the observed apparent unloading modulus evolution, while the quantitative fit parameters and relative modulus reductions are compared in Section 3.2.
3.2. Quantification of Directional Modulus Degradation
The fitted Yoshida parameters and corresponding fit-quality measures are summarized in Table 4 for all investigated material–orientation combinations. The maximum evaluated plastic pre-strain εpmax corresponds to the last valid unloading cycle below the direction-specific mean Agt. Fit quality varied between the datasets, with R2 values ranging from 0.7823 to 0.9893, RMSE values from 990 to 6092.5 MPa and NRMSE values from 1.42% to 13.53%. The lowest fit quality was obtained for WBS235JR at 90°, whereas the highest R2 was obtained for CN4301-4307+2B at 45°.
Table 4.
Yoshida relation parameters, fit-quality measures, and max. evaluated plastic pre-strain.
To enable a direct comparison between the materials and specimen orientations, the relative chord modulus reduction with respect to E0 was evaluated at common plastic pre-strain levels of εp = 0.04, 0.06 and 0.08. These strain levels are within the experimentally evaluated range of all material–orientation combinations. Table 5 compares the values calculated from the Yoshida fits with the nearest experimentally determined chord moduli at the corresponding measured plastic pre-strain values.
Table 5.
Relative chord modulus reduction with respect to the initial reference modulus E0, calculated from the Yoshida fits and obtained from the nearest experimental chord modulus values at the indicated plastic pre-strain levels.
At εp = 0.08, the fitted relative modulus reduction ranges from approximately 18% to 32% for CN4301-4307+2B, from 22% to 25% for DOCOL780DP+AM, and from 12% to 20% for WBS235JR. The largest directional spread at this common strain level is therefore observed for CN4301-4307+2B, followed by WBS235JR, whereas DOCOL780DP+AM shows the smallest directional spread. The measured chord modulus reductions generally follow the fitted trends, although larger deviations occur for individual datasets, particularly for WBS235JR at 90° at the nearest measured point to εp = 0.08.
3.3. Robustness of the Unloading Modulus Definition
To assess the influence of the unloading modulus definition, the primary chord modulus Echord is compared with Eun,full and Eun,0–95%. All three methods use the same E0, plastic pre-strain definition, validity limits, and Yoshida-fitting procedure. The alternative regression-based definitions produce moderate quantitative differences but preserve the directional trends. The largest improvement in fit quality occurs for WBS235JR at 90°, where R2 increases from 0.7823 for Echord to 0.8617 for Eun,full and 0.8754 for Eun,0–95%, while NRMSE decreases from 13.53% to 10.21% and 9.51%, respectively. These fit-quality differences describe the agreement between the respective evaluated unloading modulus data and the Yoshida relation; they were not used to select the primary unloading modulus definition.
Table 6 compares the relative modulus reduction at εp = 0.08. For all three methods, CN4301-4307+2B shows the largest directional spread, WBS235JR an intermediate spread, and DOCOL780DP+AM the smallest. Across the three definitions, the directional spread ranges from 14.56 to 15.68 percentage points for CN4301-4307+2B, from 6.53 to 7.95 percentage points for WBS235JR, and from 3.03 to 4.18 percentage points for DOCOL780DP+AM. The orientation ranking also remains unchanged: 45° > 90° > 0° for CN4301-4307+2B, 0° > 45° > 90° for DOCOL780DP+AM, and 45° > 0° > 90° for WBS235JR. The observed directional ranking is therefore robust for the three evaluated unloading modulus definitions at εp = 0.08, while the magnitude of the directional spread varies between the definitions. Echord is retained as the primary evaluation measure.
Table 6.
Robustness check of the modulus definition based on the relative modulus reduction.
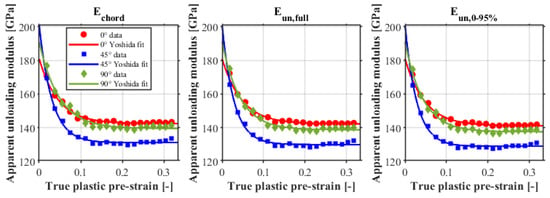
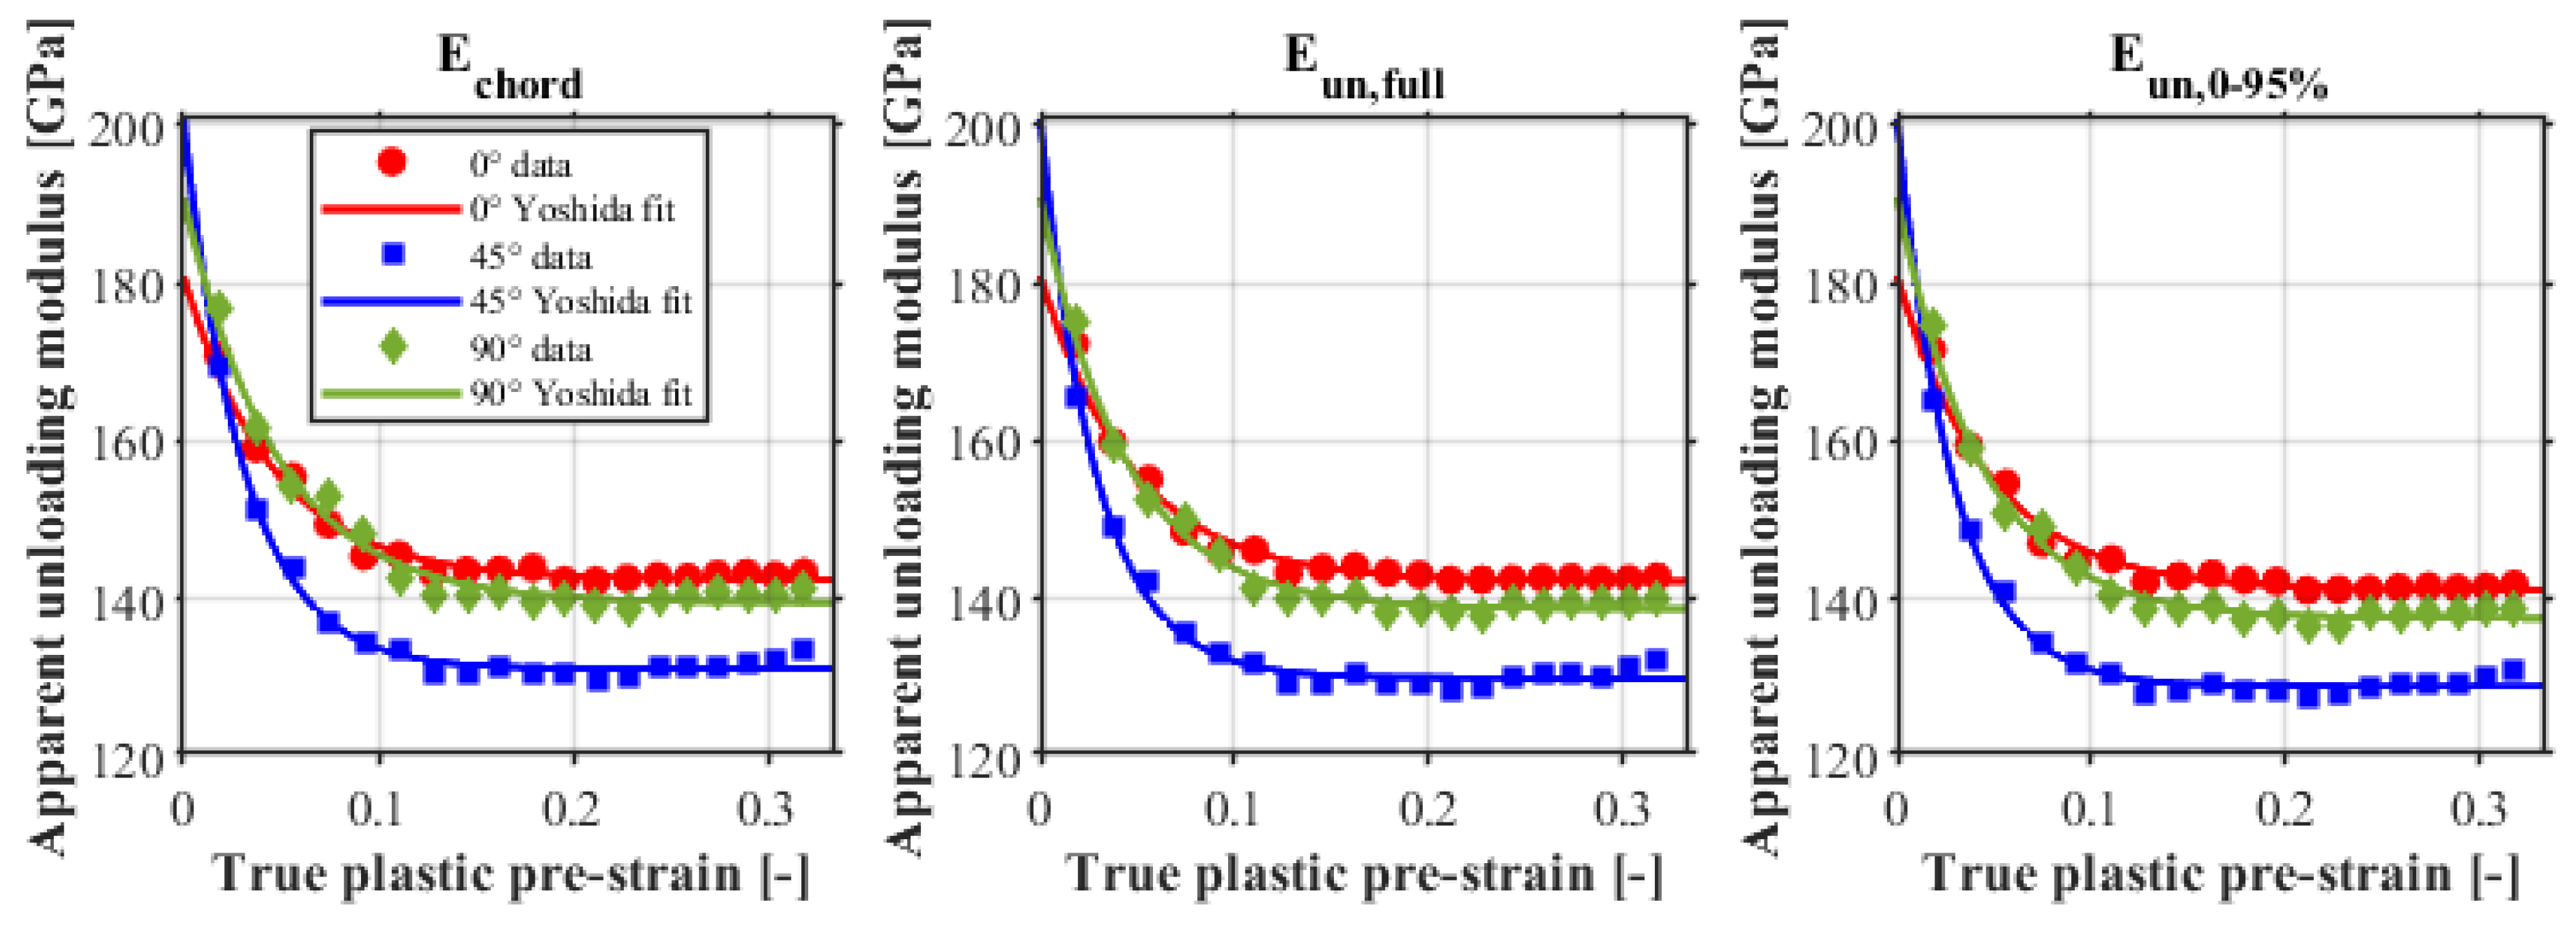
Figure 8 compares the evaluated unloading modulus data and the corresponding Yoshida fits obtained using the three unloading modulus definitions for CN4301-4307+2B. The comparison illustrates the influence of the unloading modulus definition on the quantitative fit while retaining the directional trends.
Figure 8.
Comparison of the experimental apparent unloading modulus data and Yoshida fits obtained using Echord, Eun,full and Eun,0–95% for CN4301-4307+2B at 0°, 45°, and 90° to the rolling direction.
3.4. Numerical Springback Sensitivity
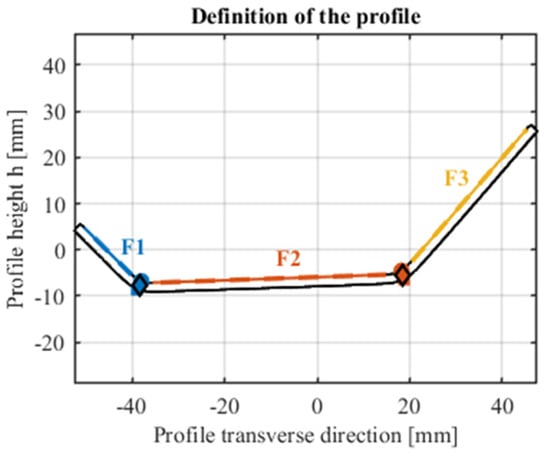
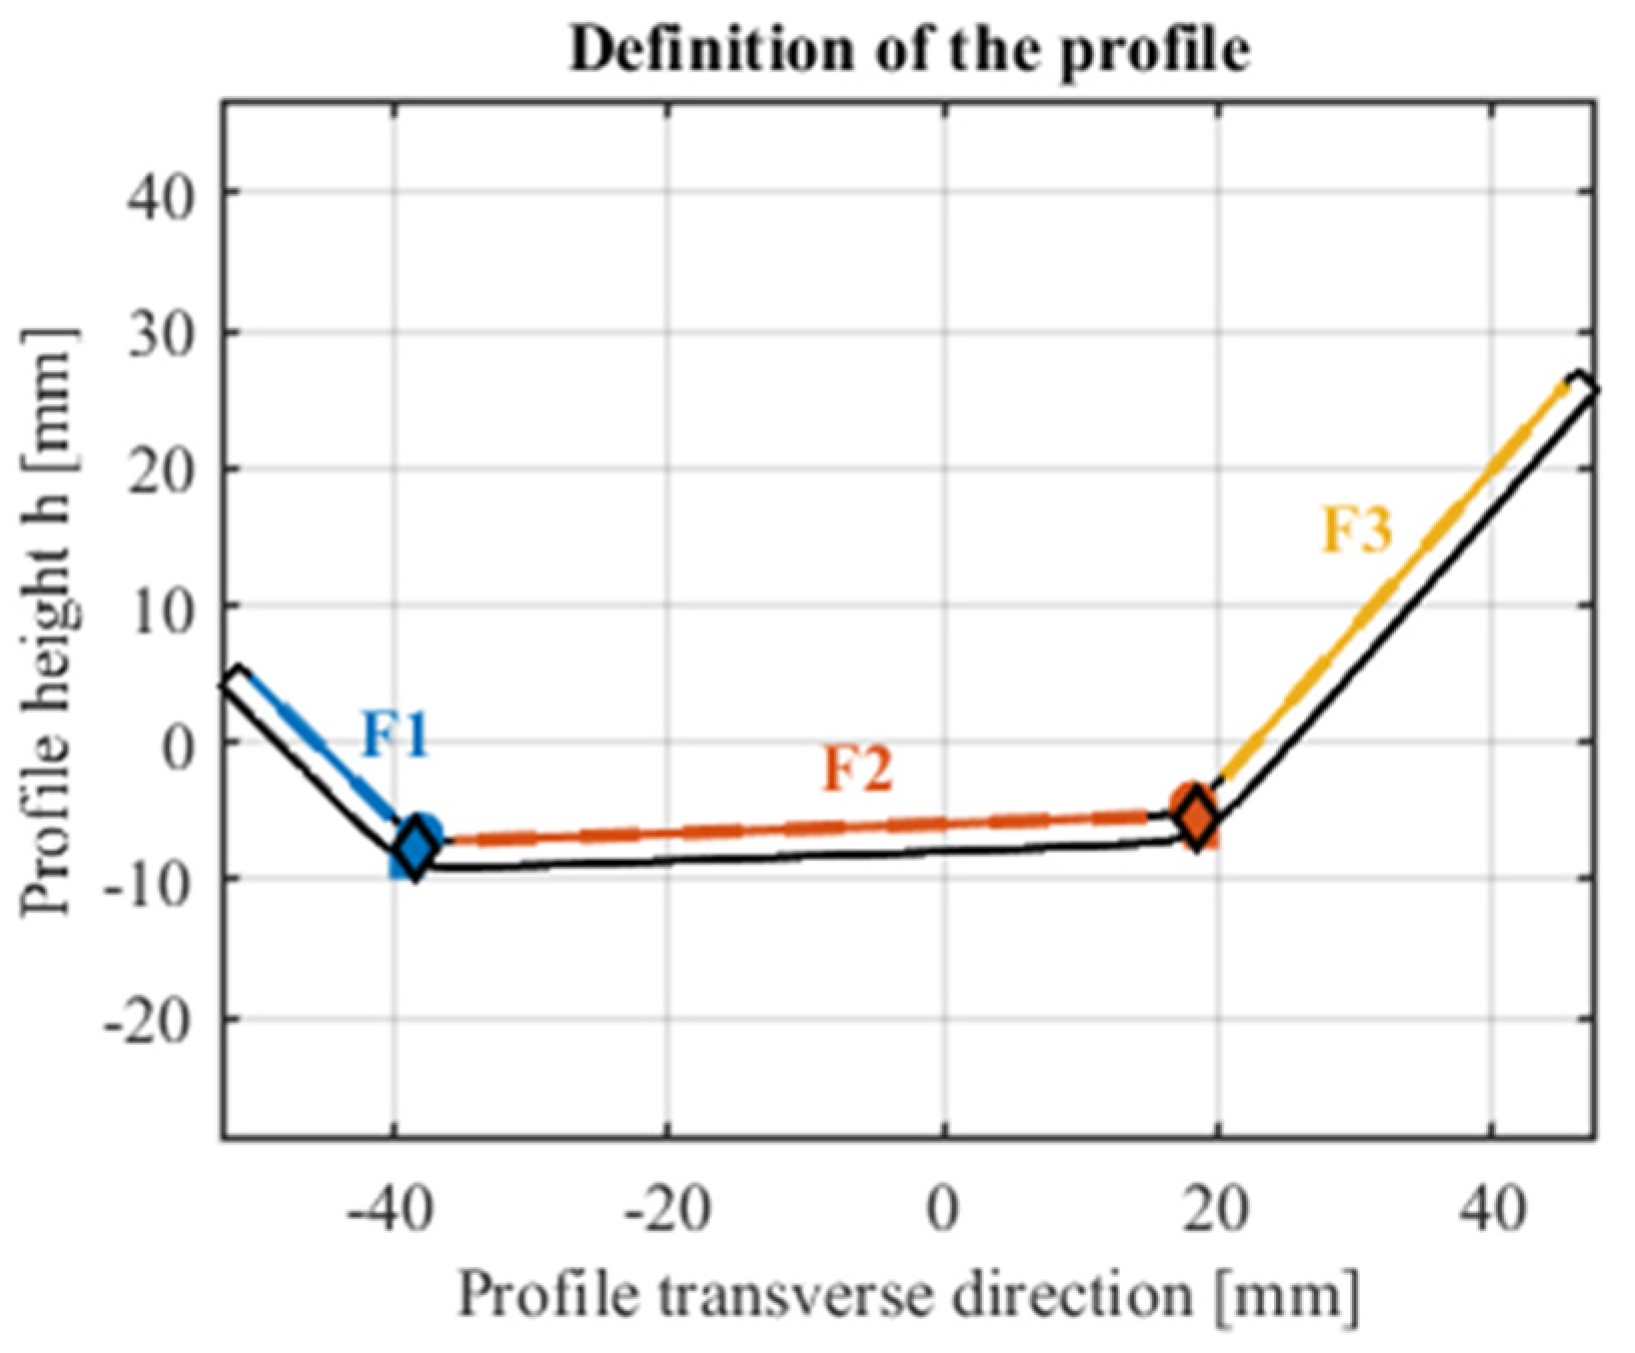
The influence of the direction-specific Yoshida relations on the predicted springback geometry of CN4301-4307+2B was evaluated using the F1–F3 opening angle between the outer profile surfaces defined in Figure 9. At the loaded final forming station, the F1–F3 opening angles were 89.30° for the constant modulus reference and 89.20°, 89.22°, and 89.17° for the Yoshida 0°, 45°, and 90° cases, respectively. The maximum difference at the loaded station was therefore approximately 0.13°.
Figure 9.
Definition of the profile surfaces F1–F3 used for the contour-based angle evaluation.
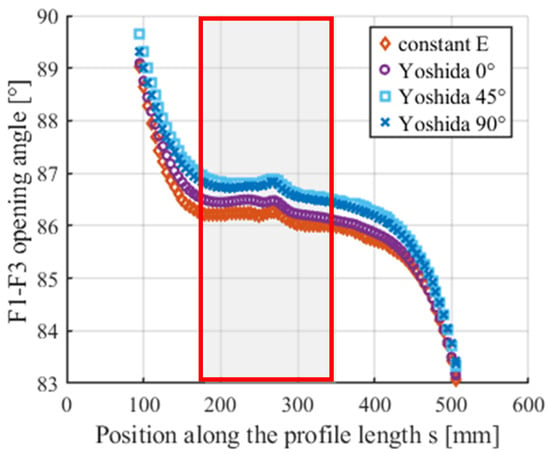
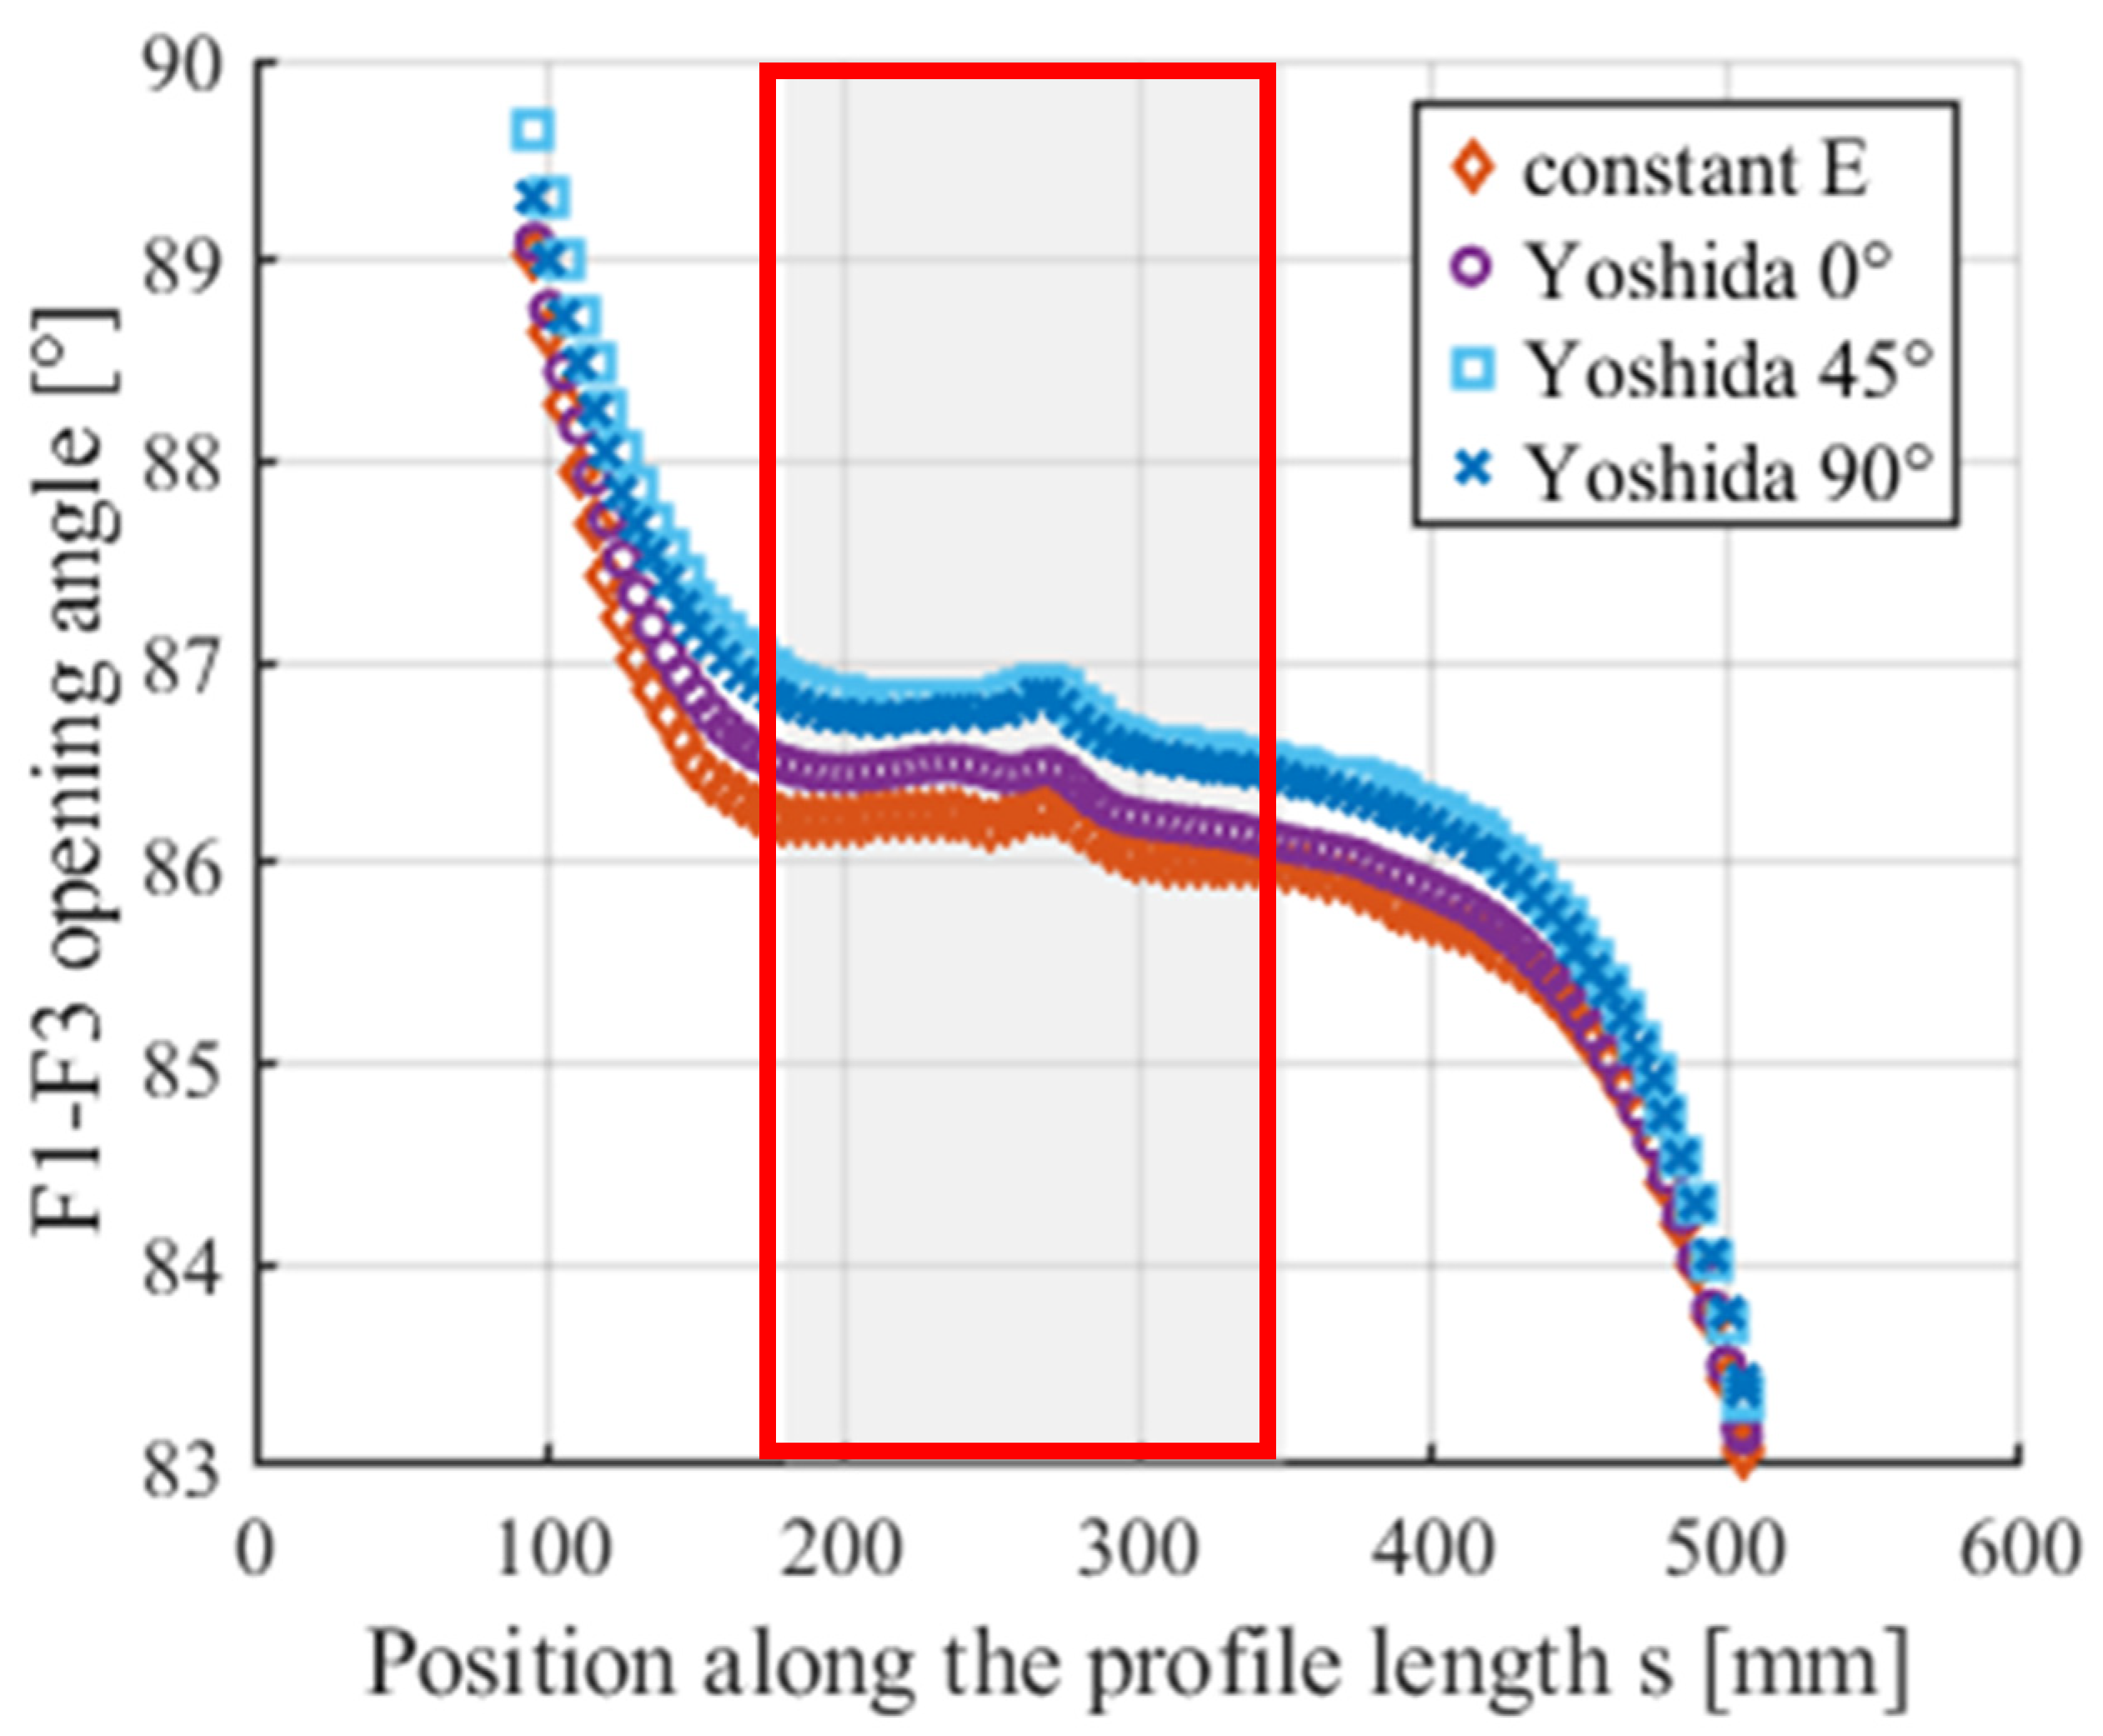
Figure 10 shows the F1–F3 opening angle along the released profiles. To obtain a representative mean F1–F3 opening angle, mean values were calculated over the central evaluation interval s = 180–350 mm. The mean F1–F3 opening angle was 86.15° for the constant modulus reference and 86.35°, 86.73°, and 86.65° for the Yoshida 0°, 45°, and 90° cases, respectively. The corresponding differences relative to the constant modulus reference are +0.20°, +0.58°, and +0.51° (calculated from unrounded mean values). The resulting geometrical differences ranked Yoshida 45° > Yoshida 90° > Yoshida 0°. This ordering is consistent with the directional ranking of the fitted relative modulus reduction for CN4301-4307+2B at εp = 0.08 reported in Section 3.2.
Figure 10.
F1–F3 opening angle along the released profile for the constant modulus reference and the three directional Yoshida cases; the highlighted region indicates the central evaluation interval.
Along the constant modulus released profile, the F1–F3 opening angle reached a local minimum of approximately 85.83° at s ≈ 145 mm and increased to approximately 86.22° around s ≈ 255 mm. This spatial evolution illustrates that the released profile cannot be characterized by a single local opening angle.
As a numerical control, the corresponding uncut profiles were evaluated over the same region. Their mean F1–F3 angles differed from the released profiles by less than 0.003°, indicating a negligible effect of the modeled cutting operation on the representative central F1–F3 opening angle within this interval. Within the reduced roll forming model, these results quantify the sensitivity of the predicted springback geometry to the prescribed direction-specific apparent unloading modulus relations. The directional Yoshida cases remain controlled scalar sensitivity cases rather than a fully anisotropic constitutive model and do not provide an experimental validation of the absolute springback prediction.
4. Discussion
The results show that the apparent unloading modulus decreased with increasing plastic pre-strain for all investigated material–orientation combinations, whereas the magnitude of the relative modulus reduction and its directional spread differed among the three investigated materials. The following discussion considers the robustness of the observed directional trends, possible interpretations based on the literature, and their implications for the numerical sensitivity of the predicted springback geometry.
4.1. Directional Dependence of the Apparent Unloading Modulus
The reduction in apparent unloading modulus with increasing plastic pre-strain observed for all three materials is consistent with previous reports of nonlinear unloading and plastic-strain-dependent chord modulus evolution in sheet metals [3,35]. Similar strain- and path-dependent unloading behavior has also been reported for steel sheets [4,36].
In the primary Echord-based Yoshida analysis, the common plastic pre-strain level of εp = 0.08 yielded directional spreads in fitted relative chord modulus reduction of 14.56 percentage points for CN4301-4307+2B, 7.95 percentage points for WBS235JR, and 3.03 percentage points for DOCOL780DP+AM (Table 5). Both the material ranking of the directional spread and the orientation ranking within each material were retained when Eun,full and Eun,0–95% were evaluated as alternative regression-based unloading modulus definitions (Table 6). Thus, within the three evaluated definitions, the observed directional trends cannot be attributed solely to the choice of the primary chord modulus definition. Echord nevertheless remains the primary evaluation measure. This robustness concerns the unloading modulus definition rather than experimental scatter: because one ULUL specimen was tested for each material–orientation combination, the present data do not quantify the repeatability of the observed directional differences.
A possible contributor to the orientation-specific response is the crystallographic texture associated with rolling, because texture can produce orientation-dependent macroscopic elastic properties in steels [37]. The experimentally determined apparent unloading modulus may additionally include reversible inelastic contributions. Previous work has associated nonlinear unloading with microplastic and dislocation-related processes [27,38]. Such contributions could, in principle, vary with loading direction in a textured material. However, no texture or microstructural characterization was performed in the present study. The experiments therefore do not distinguish among possible mechanisms or establish a causal origin of the observed directional trends.
For the investigated materials, a single direction-independent degradation curve may not adequately represent the observed orientation-specific unloading response. This is relevant to forming simulations in which unloading stiffness is represented by a scalar strain-dependent function of a plastic-strain history variable [9,17]. A direction-independent scalar calibration may therefore omit the orientation-specific behavior observed in the present uniaxial data. However, these results alone do not establish a complete direction-dependent or anisotropic constitutive description of unloading.
4.2. Influence on Numerical Springback
The controlled numerical sensitivity analysis demonstrates that the prescribed direction-specific Yoshida relations influence the released profile geometry within the reduced roll forming model. While the differences at the loaded final forming station were small, the mean F1–F3 opening angle over the central interval s = 180–350 mm differed by up to 0.58° from the constant modulus reference after release. The resulting numerical ranking was consistent with the experimental ranking of the fitted relative modulus reduction for CN4301-4307+2B at εp = 0.08. This correspondence supports the internal consistency of the sensitivity analysis, but does not establish a causal relation between the measured directional modulus degradation and the simulated geometry or validate the absolute springback prediction. Because the three directional Yoshida relations also differ in their initial moduli E0, the numerical comparison reflects the complete direction-specific modulus relations and does not isolate the contribution of strain-dependent modulus degradation alone.
The larger differences after release, despite the small differences at the loaded station, indicate that the prescribed unloading modulus relation primarily affects the released configuration. This is consistent with previous studies reporting sensitivity of springback predictions to the description of unloading stiffness [7,17]. The increase in the released F1–F3 opening angle is physically consistent with the reduced unloading stiffness: during release, a lower modulus permits greater elastic strain recovery and therefore greater springback; in the present profile geometry, this manifests as a larger F1–F3 opening angle. However, the F1–F3 opening angle continues to evolve downstream of the final forming station. Therefore, the central evaluation interval provides a defined basis for comparing the different cases, but the resulting mean angle should not be interpreted as an absolute springback angle.
The downstream evolution of the released profile is consistent with the finite deformation length reported for roll forming [39]. Consequently, a cross-section within or immediately downstream of the final forming station cannot necessarily be treated as a fully developed reference geometry for defining an absolute springback angle. The cut/uncut comparison further indicates a negligible influence of the modeled cutting operation on the representative opening angle within the selected interval.
The results also suggest that the material direction used to define a simplified strain-dependent unloading modulus relation may be relevant when such a scalar approximation is applied in roll forming simulations. Because the strip is processed longitudinally along the rolling direction while its cross-sectional shape is predominantly generated by transverse bending, the 90° response may provide a physically motivated basis for representing this dominant cross-sectional deformation when a single uniaxial relation is used. This interpretation is distinct from the numerical ranking, in which the 45° case produced the largest geometrical difference. Thus, the 90° direction is not selected because it produces the largest predicted springback effect, but because its loading direction is more closely aligned with the dominant transverse bending direction. However, this does not establish the 90° relation as generally superior, because roll forming also involves longitudinal deformation and multiaxial stress states. The directional Yoshida cases therefore remain controlled scalar sensitivity cases rather than a fully anisotropic constitutive model. Furthermore, the numerical analysis was performed only for CN4301-4307+2B in a reduced roll forming model. The observed numerical sensitivity should therefore not be generalized to other materials, profile geometries, or roll forming processes.
5. Conclusions
The directional evolution of the apparent unloading modulus was investigated for WBS235JR, DOCOL780DP+AM, and CN4301-4307+2B using ULUL tensile tests at 0°, 45°, and 90° relative to the rolling direction. For all material–orientation combinations, the apparent unloading modulus decreased with increasing plastic pre-strain.
At the common plastic pre-strain of εp = 0.08, CN4301-4307+2B showed the largest directional spread in fitted relative chord modulus reduction (14.56 percentage points), followed by WBS235JR (7.95 percentage points) and DOCOL780DP+AM (3.03 percentage points). The material ranking and the orientation-specific trends remained unchanged when the two alternative regression-based unloading modulus definitions were applied, indicating that the observed directional ranking was robust for the three evaluated unloading modulus definitions.
The numerical sensitivity analysis further showed that the directional Yoshida relations produced different predicted released profile geometries within the reduced roll forming model. For CN4301-4307+2B, the maximum difference in the mean F1–F3 opening angle relative to the constant modulus reference was 0.58°, with the mean evaluated over the central released profile interval. Although the simulations represent controlled scalar sensitivity cases rather than a fully anisotropic constitutive model, the results indicate that a direction-independent scalar unloading modulus relation may omit orientation-specific effects relevant to the predicted springback geometry. The 0.58° difference does not represent an absolute springback angle or an experimental validation of the absolute springback prediction.
For simplified roll forming simulations that use a single uniaxial unloading modulus relation, the material direction used for calibration should therefore be considered. Because cross-sectional shaping is predominantly associated with bending transverse to the rolling direction, the 90° response may provide a physically motivated basis for such a simplified representation. This process-kinematic consideration does not establish the 90° relation as generally correct or superior, because roll forming also involves longitudinal deformation and multiaxial stress states.
Future work should quantify experimental scatter by replicate ULUL testing and extend the directional characterization to multiaxial and tension–compression loading conditions. Direction-dependent unloading descriptions should also be assessed in more comprehensive constitutive formulations and for additional materials, profile geometries, and roll forming conditions.
Supplementary Materials
The following supporting information can be downloaded at https://www.mdpi.com/article/10.3390/jmmp10110454/s1: The raw data of the tensile tests and the ULUL tests is available.
Author Contributions
Conceptualization, F.R.; Methodology, F.R.; Software, F.R. and F.Z.; Validation, F.R.; Formal Analysis, F.R.; Investigation, F.R. and F.Z.; Data Curation, F.R.; Writing—Original Draft Preparation, F.R.; Writing—Review and Editing, F.Z. and K.P.; Visualization, F.R.; Supervision, K.P.; Project Administration, K.P. All authors have read and agreed to the published version of the manuscript.
Funding
This work was carried out within the framework of a doctoral project supported by the Austrian Research Promotion Agency (FFG).
Data Availability Statement
The raw data supporting the conclusions of this article will be made available by the authors on request.
Acknowledgments
During the preparation of this manuscript, the authors used ChatGPT 5.5 for English language editing, improving readability, and shortening selected text passages. The authors reviewed and edited the output as needed and take full responsibility for the content of this publication.
Conflicts of Interest
The authors declare no conflicts of interest.
Abbreviations
The following abbreviations are used in this manuscript:
| Agt | Total elongation at maximum force |
| FDM | Fused deposition modeling |
| NRMSE | Normalized root mean square error |
| RMSE | Root mean square error |
| ULUL | Uniaxial Loading–Unloading–Loading |
References
- Wallner, M.; Schneider, R.; Hebesberger, T.; Larour, P.; Krizan, D.; Steineder, K. Abhängigkeit des E-Moduls verschiedener Stähle vom Umformgrad. BHM 2019, 164, 385–391. [Google Scholar] [CrossRef] [Scilit]
- Wagner, L.; Wallner, M.; Larour, P.; Steineder, K.; Schneider, R. Reduction of Young’s modulus for a wide range of steel sheet materials and its effect during springback simulation. IOP Conf. Ser. Mater. Sci. Eng. 2021, 1157, 12031. [Google Scholar] [CrossRef] [Scilit]
- Yoshida, F.; Amaishi, T. Model for description of nonlinear unloading-reloading stress-strain response with special reference to plastic-strain dependent chord modulus. Int. J. Plast. 2020, 130, 102708. [Google Scholar] [CrossRef] [Scilit]
- Kim, H.; Kim, C.; Barlat, F.; Pavlina, E.; Lee, M.-G. Nonlinear elastic behaviors of low and high strength steels in unloading and reloading. Mater. Sci. Eng. A 2013, 562, 161–171. [Google Scholar] [CrossRef] [Scilit]
- Lajarin, S.F.; Filho, R.A.C.; Rebeyka, C.J.; Nikhare, C.P.; Marcondes, P.V.P. Numerical study on variation of chord modulus on the springback of high-strength steels. Int. J. Adv. Manuf. Technol. 2020, 106, 4707–4713. [Google Scholar] [CrossRef] [Scilit]
- Yoshida, F.; Uemori, T.; Fujiwara, K. Elastic–plastic behavior of steel sheets under in-plane cyclic tension–compression at large strain. Int. J. Plast. 2002, 5–6, 633–659. [Google Scholar] [CrossRef] [Scilit]
- Liu, X.; Cao, J.; Chai, X.; Liu, J.; Zhao, R.; Kong, N. Investigation of forming parameters on springback for ultra high strength steel considering Young’s modulus variation in cold roll forming. J. Manuf. Process. 2017, 29, 289–297. [Google Scholar] [CrossRef] [Scilit]
- Xing, M.; Wang, H.; Liu, J.; Fu, Y.; Du, F. Application of Mean Modulus in Three-Point Bending and Roll Forming. Materials 2023, 16, 2571. [Google Scholar] [CrossRef] [Scilit] [PubMed]
- Naofal, J.; Naeini, H.M.; Mazdak, S. Effects of Hardening Model and Variation of Elastic Modulus on Springback Prediction in Roll Forming. Metals 2019, 9, 1005. [Google Scholar] [CrossRef] [Scilit]
- Eggertsen, P.-A.; Mattiasson, K. On constitutive modeling for springback analysis. Int. J. Mech. Sci. 2010, 52, 804–818. [Google Scholar] [CrossRef] [Scilit]
- Zang, S.; Lee, M.-G.; Kim, J.H. Evaluating the significance of hardening behavior and unloading modulus under strain reversal in sheet springback prediction. Int. J. Mech. Sci. 2013, 77, 194–204. [Google Scholar] [CrossRef] [Scilit]
- Vrh, M.; Halilovič, M.; Štok, B. The Evolution of Effective Elastic Properties of a Cold Formed Stainless Steel Sheet. Exp. Mech. 2011, 51, 677–695. [Google Scholar] [CrossRef] [Scilit]
- Khayatzadeh, S.; Thomas, M.J.; Millet, Y.; Rahimi, S. Characterisation and modelling of in-plane springback in a commercially pure titanium (CP-Ti). J. Mater. Sci. 2018, 53, 6872–6892. [Google Scholar] [CrossRef] [Scilit]
- Lajarin, S.F.; Nikhare, C.P.; Marcondes, P.V.P. Dependence of plastic strain and microstructure on elastic modulus reduction in advanced high-strength steels. J. Braz. Soc. Mech. Sci. Eng. 2018, 40, 87. [Google Scholar] [CrossRef] [Scilit]
- Xue, X.; Liao, J.; Vincze, G.; Pereira, A.B.; Barlat, F. Experimental assessment of nonlinear elastic behaviour of dual-phase steels and application to springback prediction. Int. J. Mech. Sci. 2016, 117, 1–15. [Google Scholar] [CrossRef] [Scilit]
- Jeong, K.; Kim, K.; Lee, S.-Y.; Bong, H.J.; Yoon, S.; Yoon, J. Effect of path-dependent plasticity on springback in reverse bending and its application to roll forming. Int. J. Solids Struct. 2024, 305, 113079. [Google Scholar] [CrossRef] [Scilit]
- Hajiahmadi, S.; Moslemi Naeini, H.; Talebi-Ghadikolaee, H.; Safdarian, R.; Zeinolabedin-Beygi, A. Insights into spring-back prediction: A comparative analysis of constitutive models for perforated U-shaped roll-formed steel profiles. Int. J. Adv. Manuf. Technol. 2024, 134, 1915–1933. [Google Scholar] [CrossRef] [Scilit]
- Yao, R.; Han, F.; Ning, Z. A Study on Forming Characteristics of Roll Forming Process with 1.7GPa Ultra-high Strength Steel. Int. J. Precis. Eng. Manuf. 2026, 27, 1075–1092. [Google Scholar] [CrossRef] [Scilit]
- Zhang, C.; He, J.; Han, X.; Sun, Y.; Zhou, Y.; Chen, J.; Hu, Q. Applying a new generalized anisotropic distortional hardening model to analyse the springback behaviour of 1.8 GPa sheet metal in cold roll forming. J. Mater. Process. Technol. 2026, 356, 119478. [Google Scholar] [CrossRef] [Scilit]
- Zhang, C.; Lou, Y. Influences of the evolving plastic behavior of sheet metal on V-bending and springback analysis considering different stress states. Int. J. Plast. 2024, 173, 103889. [Google Scholar] [CrossRef] [Scilit]
- Yan, Y.; Xu, H.; Wang, H.; Bao, J. AZ31 Magnesium Alloy Roll-Forming Springback Prediction Considering Anisotropic and Asymmetric Properties. Materials 2025, 18, 3111. [Google Scholar] [CrossRef] [Scilit] [PubMed]
- Firat, M. Plasticity modelling for deformation-induced anisotropy in sheet metals: From experiments to finite element implementation. Int. J. Mater. Form. 2026, 19, 64. [Google Scholar] [CrossRef] [Scilit]
- Zwick, R. Product Information makroXtens, Ulm, Germany. 2012. Available online: https://senselektro.hu/wp-content/uploads/zwick/makroXtens%C2%AE.pdf (accessed on 19 August 2026).
- Rossi, M.; Lattanzi, A.; Morichelli, L.; Martins, J.M.P.; Thuillier, S.; Andrade-Campos, A.; Coppieters, S. Testing methodologies for the calibration of advanced plasticity models for sheet metals: A review. Strain 2022, 58, e12426. [Google Scholar] [CrossRef] [Scilit]
- Nietsch, J.A.; Ott, A.C.; Watzl, G.; Cerny, A.; Grabner, F.J.; Grünsteidl, C.; Österreicher, J.A. Comparative study of elastic properties measurement techniques during plastic deformation of aluminum, magnesium, and titanium alloys: Application to springback simulation. Meccanica 2024, 60, 55–72. [Google Scholar] [CrossRef] [Scilit] [PubMed]
- Norz, R.; Vitzthum, S.; Gruber, M.; Maier, L.; Kornmeier, J.R.; Maawad, E.; Valencia, F.R.; Gerke, S.; Brünig, M.; Volk, W. Determination of the onset of yielding and the Young’s modulus after a change in the loading direction. Int. J. Mater. Form. 2024, 17, 22. [Google Scholar] [CrossRef] [Scilit]
- Cleveland, R.; Ghosh, A. Inelastic effects on springback in metals. Int. J. Plast. 2002, 18, 769–785. [Google Scholar] [CrossRef] [Scilit]
- Nelder, J.A.; Mead, R. A Simplex Method for Function Minimization. Comput. J. 1965, 7, 308–313. [Google Scholar] [CrossRef] [Scilit]
- Cadence. Marc Advanced Nonlinear FEA Solver. Available online: https://www.cadence.com/en_US/home/tools/msc-software/marc.html (accessed on 3 September 2026).
- Müller, C. Numerische Abbildung und Validierung von Beanspruchungsgrößen in Rollprofilierprozessen; Zugl.: @Darmstadt, Techn. Univ., Diss., 2014; Berichte aus Produktion und Umformtechnik 93; Shaker: Aachen, Germany, 2014. [Google Scholar]
- Bui, Q.V.; Ponthot, J.P. Numerical simulation of cold roll-forming processes. J. Mater. Process. Technol. 2008, 202, 275–282. [Google Scholar] [CrossRef] [Scilit]
- Paralikas, J.; Salonitis, K.; Chryssolouris, G. Investigation of the effects of main roll-forming process parameters on quality for a V-section profile from AHSS. Int. J. Adv. Manuf. Technol. 2009, 44, 223–237. [Google Scholar] [CrossRef] [Scilit]
- Li, X.; Liu, Z.; Liang, X. Tool Wear, Surface Topography, and Multi-Objective Optimization of Cutting Parameters during Machining AISI 304 Austenitic Stainless Steel Flange. Metals 2019, 9, 972. [Google Scholar] [CrossRef] [Scilit]
- Swift, H.W. Plastic instability under plane stress. J. Mech. Phys. Solids 1952, 1, 1–18. [Google Scholar] [CrossRef] [Scilit]
- Wallner, M.; Schneider, R.; Steineder, K.; Krizan, D.; Hebesberger, T.; Larour, P. Effect of the Pre-Strain on the Elastic Behavior of a Dual-Phase Steel with Different Martensite Contents. Mater. Sci. Forum 2021, 1016, 1555–1560. [Google Scholar] [CrossRef] [Scilit]
- Yamaguchi, K.; Adachi, H.; Takakura, N. Effects of plastic strain and strain path on youngs modulus of sheet metals. Met. Mater. 1998, 4, 420–425. [Google Scholar] [CrossRef] [Scilit]
- Davis, C.L.; Mukhopadhyay, P.; Strangwood, M.; Potter, M.; Dixon, S.; Morris, P.F. Comparison between elastic modulus and ultrasonic velocity anisotropy with respect to rolling direction in steels. Ironmak. Steelmak. Process. Prod. Appl. 2008, 35, 359–366. [Google Scholar] [CrossRef] [Scilit]
- Sun, L.; Wagoner, R.H. Complex unloading behavior: Nature of the deformation and its consistent constitutive representation. Int. J. Plast. 2011, 27, 1126–1144. [Google Scholar] [CrossRef] [Scilit]
- Bhattacharyya, D.; Smith, P.D.; Yee, C.H.; Collins, I.F. The prediction of deformation length in cold roll-forming. J. Mech. Work. Technol. 1984, 9, 181–191. [Google Scholar] [CrossRef] [Scilit]

Disclaimer/Publisher’s Note: The statements, opinions and data contained in all publications are solely those of the individual author(s) and contributor(s) and not of MDPI and/or the editor(s). MDPI and/or the editor(s) disclaim responsibility for any injury to people or property resulting from any ideas, methods, instructions or products referred to in the content. |
© 2026 by the authors. Licensee MDPI, Basel, Switzerland. This article is an open access article distributed under the terms and conditions of the Creative Commons Attribution (CC BY) license.