


Highlights
What are the main findings?
- A fixed-wing UAV completed 20 low-altitude (60 m AGL) BVLOS missions covering 210 km of remote coastline, detecting 291 derelict fishing nets.
- DEM-based communication viewshed modelling with >60% first Fresnel zone clearance reliably predicted C2 connectivity, with 90.5% of waypoints within this range maintaining moderate-to-strong C2 link quality under real-world conditions.
What are the implications of the main findings?
- DEM-based communication viewshed modelling offers a practical, widely accessible operational planning tool for BVLOS mission planning, though it should be treated as indicative rather than deterministic.
- The principal barriers to routine adoption of BVLOS UAV survey methods are regulatory and institutional rather than technical, and broader uptake will depend as much on shared operational models as on continued advances in UAV platform and C2 system capability.
Abstract
Abandoned, lost, or otherwise discarded fishing gear (ALDFG) is a persistent form of marine pollution requiring survey approaches capable of resolving individual items across large spatial extents. While uncrewed aerial vehicles (UAVs) can capture imagery at resolutions sufficient to resolve individual debris items, their use remains largely constrained to visual line-of-sight (VLOS) operations, limiting large-scale coastal monitoring. This case study develops and field-tests an operational framework for low-altitude beyond visual line-of-sight (BVLOS) UAV surveys, in which DEM-based communication viewshed modelling incorporating first Fresnel zone clearance is used to plan BVLOS missions. A lightweight fixed-wing UAV flown at 60 m AGL completed 20 missions across 210 km of remote northern Australian coastline. Communication viewshed modelling reliably guided mission planning with 90.5% of waypoints placed within predicted high-clearance zones maintaining moderate-to-strong command-and-control (C2) link quality in flight. Manual screening confirmed that the resulting imagery was of sufficient quality, with 291 derelict fishing nets detected. In a simulated VLOS operational scenario, 76.3% of these detections fell beyond VLOS range, and equivalent coverage would require an estimated 8.8-fold increase in mission count. These findings demonstrate that fixed-wing UAVs operating under low-altitude BVLOS conditions can support large-scale image acquisition in remote coastal areas, particularly when enabled by communication-aware mission planning.
1. Introduction
Abandoned, lost or otherwise discarded fishing gear (ALDFG) is a persistent and globally distributed form of marine pollution with significant ecological consequences [1,2]. The term includes fishing gear that has left the control of the deploying vessel through abandonment, unintentional loss, or deliberate discarding at sea. Global estimates suggest that roughly 2% of fishing gear is lost annually, with fixed gillnets, trammel and drift gillnets, tuna purse-seine and pole-and-line fisheries using drifting and anchored Fish Aggregating Devices, and bottom trawls representing the highest-risk categories [3,4].
The widespread dispersal of ALDFG poses a challenge for detection and recovery [5,6,7]. While some gear accumulates in convergence zones or oceanic fronts, where detection via satellite, aircraft or vessel-based surveys is feasible [8,9], gear outside of these areas often occurs at densities below practical detection thresholds. Crewed aircraft equipped with high-resolution sensors and onboard observers have conventionally been used to quantify derelict fishing nets and other debris items stranded along the coastline or floating at sea [10,11,12]. While effective, their application is constrained by cost, logistical complexity, and operational risks to on-board observers, limiting their suitability for routine monitoring programs. This creates a need for survey approaches that support routine monitoring across large areas while retaining the resolution required to detect discrete items.
In recent years, uncrewed aerial vehicles (UAVs) have been increasingly used for coastal monitoring [13,14]. Studies show that high-resolution UAV imagery can be used to detect and map individual debris items across a range of coastal and nearshore environments, with object-level detection typically achieved through very low altitude surveys between 5 and 60 m above ground level (AGL) [15,16,17,18]. In practice, however, these applications are mostly implemented as site-specific assessments using small multi-rotor platforms operated under visual line-of-sight (VLOS) conditions [14]. VLOS is a standard operating condition requiring the remote pilot to maintain continuous, unaided visual contact with the UAV throughout the flight. While this survey method supports the detection of micro- and macro-litter items, it constrains the spatial extent of individual surveys, limiting coverage to discrete grid-based segments rather than continuous longshore transects [19]. Consequently, in remote environments where ALDFG may be distributed over tens to hundreds of kilometres, current UAV-based survey methods do not yet provide a practical basis for extending coastline monitoring.
Extending coastal surveys requires UAV operations beyond visual line of sight (BVLOS) and platforms capable of sustained flight. Fixed-wing UAVs meet this requirement through greater aerodynamic efficiency, enabling longer flight durations and range than multi-rotor platforms [20]. Electrically powered systems offer moderate endurance with relatively simple field deployment [21], whereas internal-combustion platforms extend range at the cost of increased logistical complexity [22]. In combination with BVLOS operations, these platforms support surveys beyond the pilot’s direct observation and reduce the need for frequent ground control station (GCS) repositioning, allowing more continuous survey coverage. Applications in remote environments, including Antarctica, northwestern Canada, and Papua New Guinea, demonstrate the operational feasibility of BVLOS fixed-wing UAV surveys for ecological and environmental monitoring [21,22,23,24,25]. However, these studies have been conducted across a range of operating altitudes and mission configurations that do not explicitly address the conditions at low flight altitudes (<400 ft) required for ALDFG detection.
Maintaining reliable command-and-control (C2) connectivity is a fundamental requirement for BVLOS operations, enabling operators to transmit commands and receive real-time telemetry from the aircraft [26,27]. At low flight altitudes, however, communication performance becomes particularly sensitive to terrain, vegetation, and structural obstacles, which can block line-of-sight and increase multipath interference [28]. These conditions require predictive tools that can anticipate where signal degradation is most likely to occur to inform flight pathways and contingency strategies. Communication viewshed modelling offers such a capability by mapping potential coverage based on topography and surface features [29,30,31]. Recent approaches that incorporate both line-of-sight (LOS) and first Fresnel zone clearance provide more realistic estimates of signal propagation. Baek and Choi [29] showed that simple LOS-based models tend to produce less conservative coverage estimates, whereas incorporating 2D profile-based or 3D surface-based Fresnel constraints yield more constrained representations of communication potential, particularly when modelled using high-resolution digital surface models (DSM). This makes them potentially valuable for BVLOS mission planning and assessing risk along fixed flight trajectories. Nonetheless, the effectiveness of communication viewshed models in supporting low-altitude BVLOS mission planning has not been empirically evaluated.
Understanding the operational performance of fixed-wing UAVs for low-altitude BVLOS surveys is essential for designing large-scale coastal monitoring programs for ALDFG detection. However, evidence of their performance under the variable conditions typical of extended coastal surveys remains limited, leaving a critical gap in mission planning and operational outcomes. To address this gap, we conducted BVLOS surveys with a lightweight, electrically powered fixed-wing UAV along remote northern Australian coastlines, integrating communication-aware mission planning, in-flight C2 link quality measurements, and detection analysis to evaluate survey reliability and utility. Derelict fishing nets were selected as the target feature due to their status as a regional management priority and well-documented ecological impacts [11,32,33].
The study aimed to (1) characterise C2 link performance under real-world coastal survey conditions, (2) assess the predictive accuracy of DEM-based communication viewshed models against empirical data to support mission planning and operational outcomes, and (3) evaluate derelict fishing net detection outcomes from the resulting imagery, to test whether the BVLOS mission plan yielded imagery of sufficient quality for reliable identification. We also compared BVLOS survey performance with conventional VLOS approaches in terms of spatial coverage and logistical requirements, to assess whether BVLOS operations offer a viable approach for extended coastline monitoring. Together, these analyses demonstrate how BVLOS UAV surveys can be conducted effectively under conditions representative of real-world coastal monitoring, providing practical guidance on survey design and laying the foundation for integrating this approach into routine monitoring programs.
2. Materials and Methods
2.1. Study Area
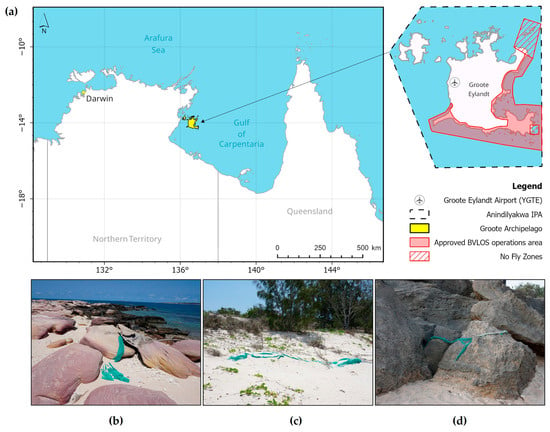
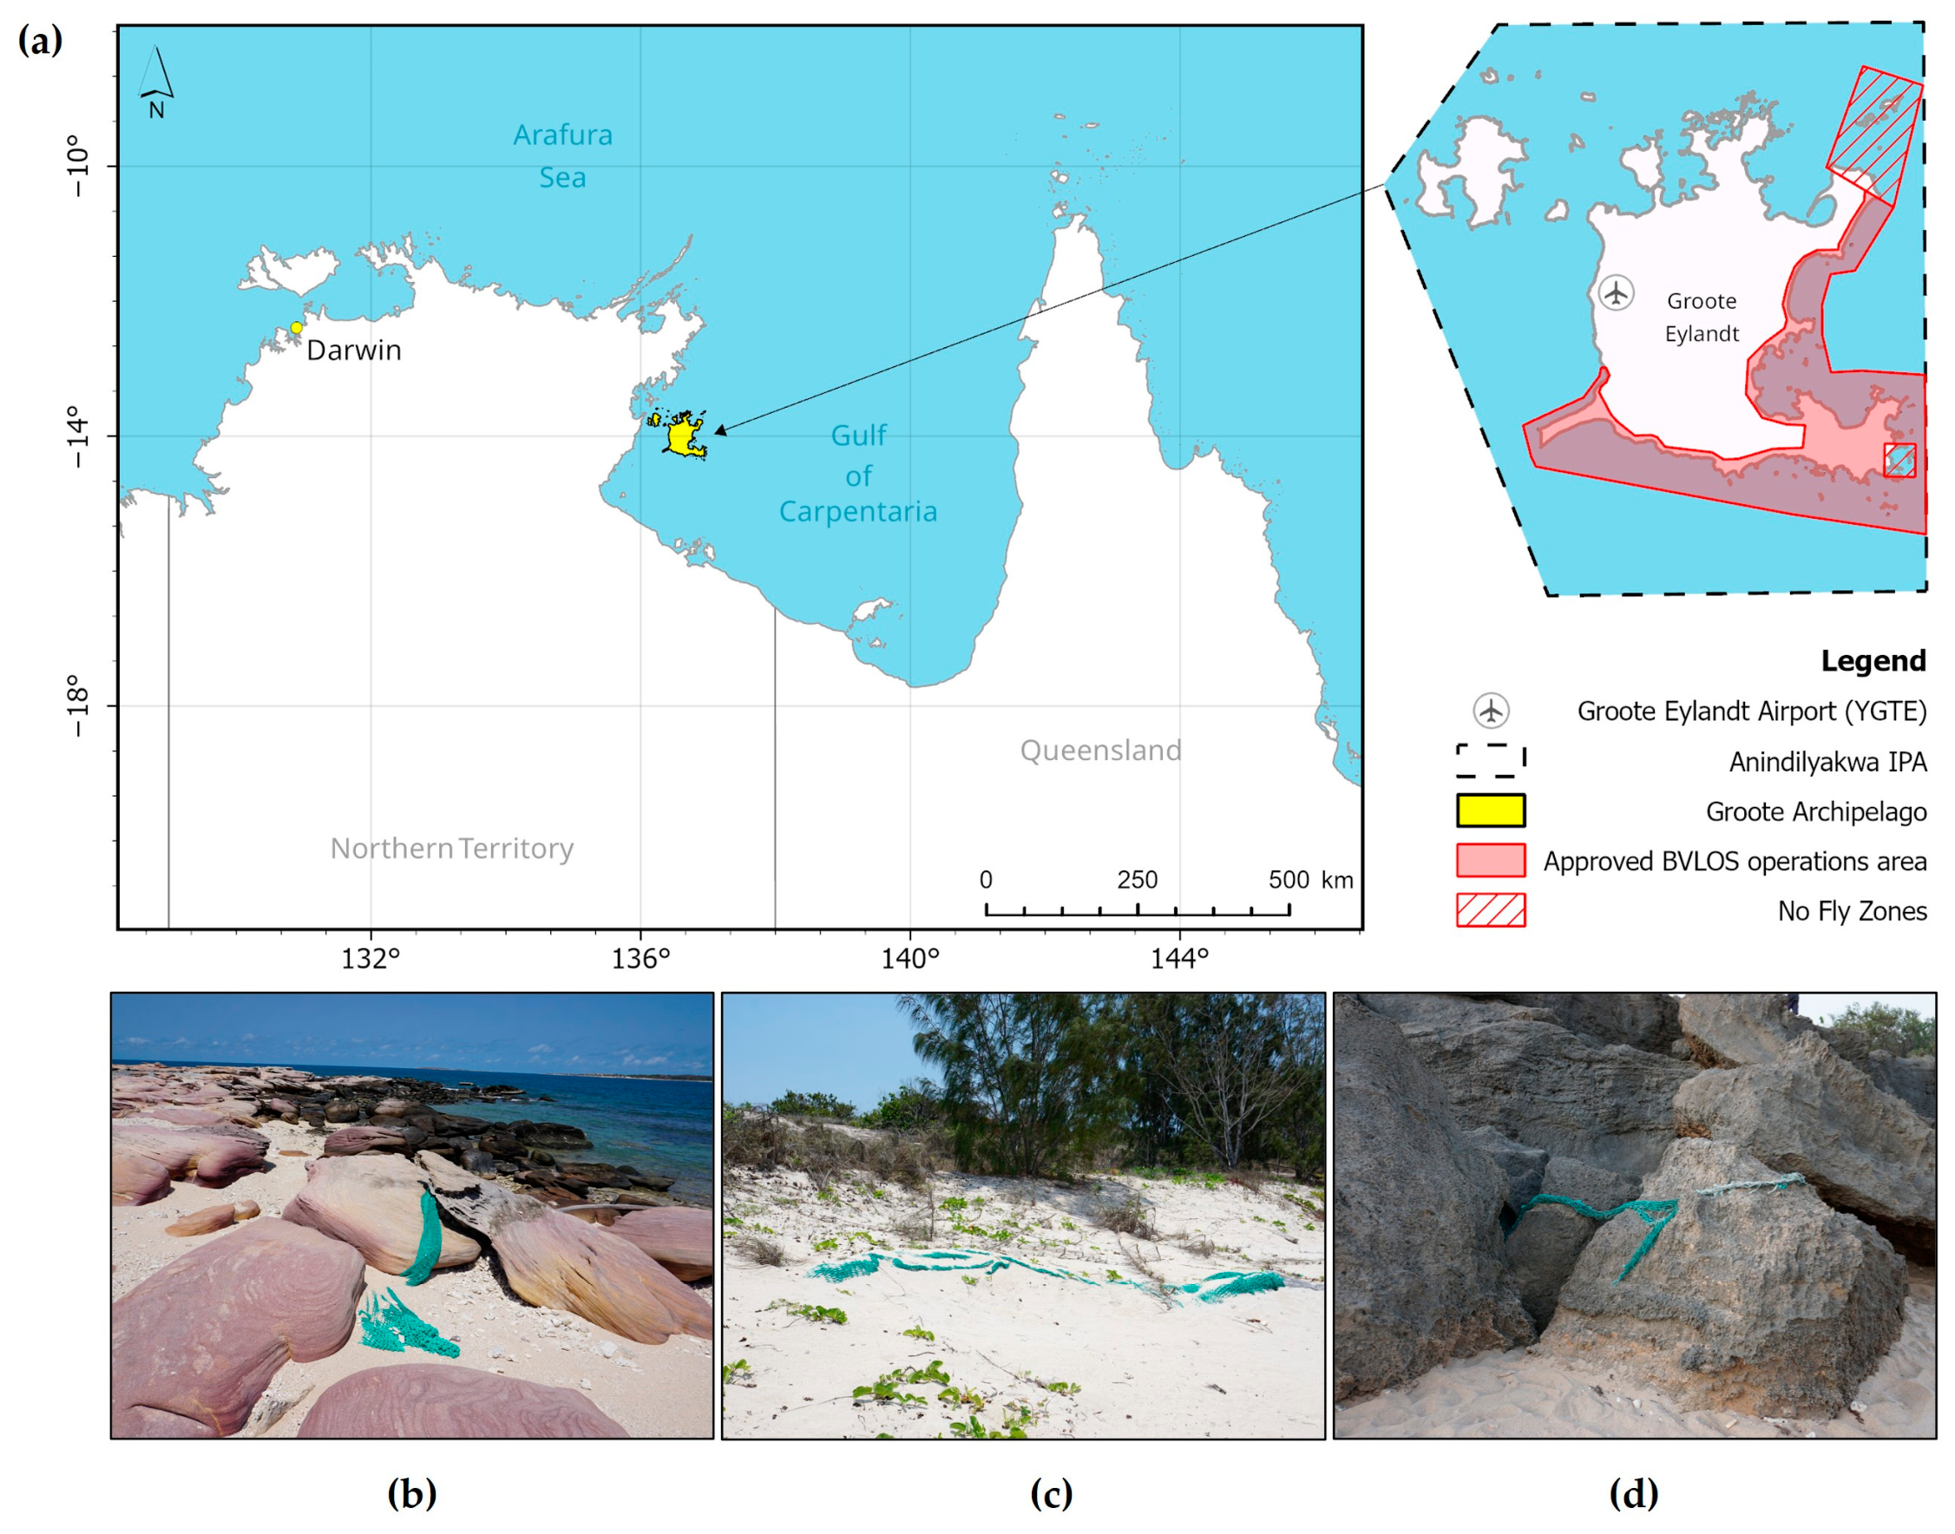
This study was conducted in the Groote Archipelago (13°58′ S, 136°35′ E), located 630 km east of Darwin in the Gulf of Carpentaria, Northern Territory, Australia (Figure 1). The Archipelago lies within the Anindilyakwa Indigenous Protected Area (IPA), which spans approximately 10,000 km2 of terrestrial and marine environments. The region experiences a tropical monsoonal climate, with a wet season (December–March) bringing high rainfall, humidity, and cyclones, and a dry season (April–November) dominated by persistent south-easterly trade winds that can produce strong winds and rough coastal seas.
Figure 1.
Overview of the study area and real-world examples of derelict fishing nets in the coastal zone. (a) Study area map showing the location of Groote Eylandt within the Anindilyakwa Indigenous Protected Area (IPA), Northern Territory, Australia, including the designated BVLOS UAV operational area approved for coastal survey operations. (b,c) fishing nets stranded on the shoreline, and (d) a fishing net fragment lodged among rocks.
The UAV survey area was located on Groote Eylandt, covering approximately 263 km of coastline along the eastern and southern margins of the island (Figure 1). This area was selected in consultation with the Anindilyakwa Land and Sea Rangers, who actively manage marine pollution within the IPA, and reflects priority zones identified as high-risk sites for derelict fishing nets and marine debris accumulation. The coastline is characterised by diverse habitat types, including mixed rocky and sandy shorelines, shallow reefs, mangrove systems, coastal dunes, headlands (<60 m), and low-elevation rocky outcrops. A single non-controlled (Class G) aerodrome (ICAO: YGTE) lies within the broader study area, informing airspace and traffic risk considerations for BVLOS operations.
2.2. Cultural Governance
Land and sea access within the Anindilyakwa IPA is governed by the authority of Traditional Owners. Approval to undertake this research was obtained prior to fieldwork through consultation with senior Traditional Owners, facilitated by the Anindilyakwa Land Council Research Committee and the Anindilyakwa Land and Sea Rangers. Consultation involved outlining the research aims and proposed survey activities to ensure the work aligned with community priorities. During this process, proposed UAV survey areas were reviewed, and culturally sensitive locations were identified and designated as no-fly zones. These spatial restrictions were incorporated into BVLOS mission planning.
Access to specific sites can vary over time due to cultural obligations, seasonal accessibility, or community priorities. For this reason, access permissions were reconfirmed before each UAV survey event. A Traditional Owner accompanied field activities to ensure agreed protocols were upheld and that operational decisions remained consistent with current access conditions.
2.3. BVLOS Approval
Formal approval from the Civil Aviation Safety Authority (CASA) was required to conduct BVLOS operations in non-controlled airspace. For this study, the AU-STS 6 standard scenario was used as the regulatory template [34], providing predefined operational conditions and safety objectives for BVLOS operations below 400 ft AGL in remote Australian airspace with a sparsely populated ground environment.
To support the approval process, the project team prepared a Specific Operations Risk Assessment (SORA), which is a structured methodology for evaluating ground and air risks and associated mitigations for non-standard UAS operations. An accompanying Concept of Operations (CONOPS) was also developed to document how the operation would be conducted in practice, including the aircraft, crew configuration, operating environment, procedures, and contingency measures.
Charles Darwin University obtained regulatory approval from CASA for the Operation of Remotely Piloted Aircraft Beyond Visual Line of Sight on Groote Eylandt. This approval authorises the university to conduct UAV operations within the specified parameters outlined in the CASA instrument, which is valid from 21 August 2024 to 30 September 2027. Operational activities were authorised at altitudes below 400 ft (122 m) AGL within a designated airspace covering approximately 1857 km2. This area includes a 450 m contingency buffer and a 120 m ground risk buffer surrounding the operational volume and excludes the designated no-fly zones.
2.4. UAV Platform and Sensors
The SenseFly eBee X fixed-wing UAV was selected for this study (SenseFly, Lausanne, Switzerland). The UAV has a maximum take-off weight of 1.7 kg, placing it within the <2 kg excluded category under the Civil Aviation Safety Regulations (CASR) Part 101 [35]. This classification reduces the licensing upgrade requirements for operational deployment. The airframe has a 116 cm wingspan and is constructed from reinforced polypropylene mesh with a carbon structure and composite parts, providing durability while maintaining lightweight portability for remote-field transit.
The system features a wireless ground modem operating in the 2.4 GHz frequency band, which provides the C2 link for bidirectional aircraft telemetry and command communication. Manufacturer specifications cite a maximum working communication range of up to 8 km under favourable conditions. However, the maximum operational range was limited to 6.4 km, corresponding to 80% of the manufacturer’s published range, in accordance with CASA requirements.
The system was fitted with a SenseFly S.O.D.A. 3D camera and 4900 mAh endurance batteries (SenseFly, Lausanne, Switzerland) to maximise allowable flight duration. The camera has a 20-megapixel sensor and a 28 mm focal length (35 mm equivalent), capable of capturing nadir and oblique imagery. Although the camera supports triple-image capture per acquisition cycle, a nadir-only mode was used to reduce motion blur and maintain consistent spatial coverage along linear flight corridors. A practical consideration in selecting this camera was the automatic stowing of the gimbal during landing, which provides additional lens protection in debris-rich areas. The camera was set as per Table 1.
Table 1.
SenseFly S.O.D.A 3D camera setting.
2.5. Ground Control Station (GCS) Configuration
Each GCS was equipped with the necessary hardware and communication systems to support reliable telemetry links and real-time flight monitoring for compliant BVLOS operations. The primary unit was a laptop running mission planning software, which enabled real-time tracking and control of the UAV’s position, altitude, and flight path. This was connected via USB to the UAV ground modem mounted on a 2-m-high pole.
To support airspace awareness and coordination, the GCS included an Airband radio connected to a custom-built VHF antenna for aviation communications, and UHF radios for ground team coordination. High-speed internet access via Starlink enabled co-pilots to access live ADS-B data from OzRunways version 12 and FlightRadar24, and weather radar from the Bureau of Meteorology (BOM) during operations.
Power was supplied via a petrol generator or a Ryobi 18V ONE+ 150W inverter with 5Ah Ryobi batteries (Ryobi, Sydney, Australia), and a Starbeam 18V Starlink Mini Ryobi battery adapter (Powertec Telecommunications Pty Ltd., Gold Coast, Australia) for very remote survey sites. The portable batteries were limited to 5Ah to ensure that they remained below the 100-watt-hour threshold, allowing them to be transported on commercial passenger flights to Groote Eylandt without additional dangerous goods handling requirements. Redundancy was built into the GCS through backup equipment, including additional fuel or 5Ah batteries, spare Airband and UHF radios, a secondary laptop preloaded with UAV missions, and an emergency response kit containing a satellite phone, first aid kit, LIPO-safe battery bag, and fire blanket.
2.6. Communication Viewshed Analysis
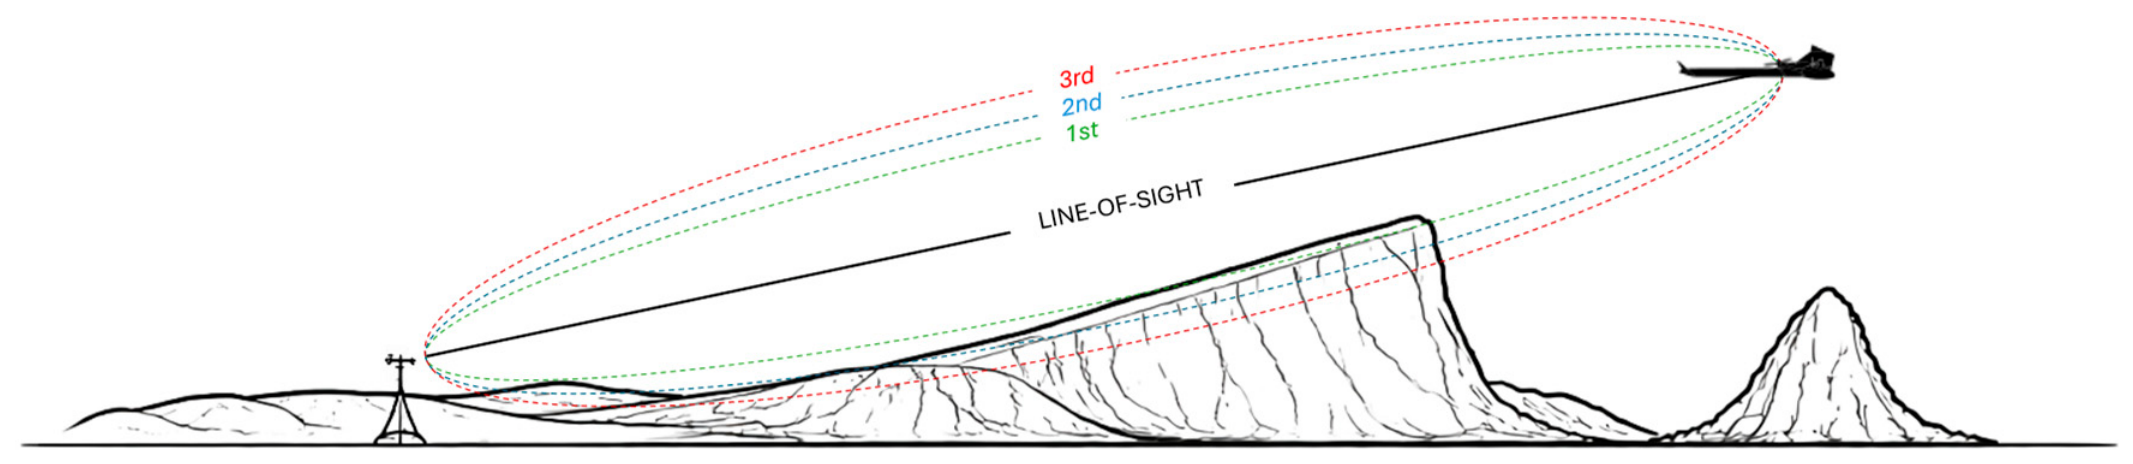
Command-and-control (C2) connectivity was assessed using a combined LOS–Fresnel zone approach to support BVLOS mission planning. The first Fresnel zone defines an ellipsoidal region surrounding the direct signal path, within which partial obstruction can reduce signal strength through diffraction (Figure 2) [31]. While 3D Fresnel zone analysis provides a more comprehensive representation of signal propagation by accounting for the full volume of potential obstructions [29], its reliance on high-resolution DSM data limits its applicability in large and remote areas. Accordingly, a 2D Fresnel zone approach using an open-source DEM was selected to test a practical, widely available approximation of terrain-related propagation constraints for BVLOS mission planning. LOS was derived from the DEM and extended using a 2D Fresnel zone approach, in which terrain elevations along the signal path were compared with the first Fresnel zone boundary to identify potential obstructions. Rather than treating visibility as binary, clearance was quantified as the proportion of the first Fresnel zone remaining unobstructed along the path. This combined LOS–Fresnel approach was used as an operational planning tool rather than a complete signal propagation model, identifying areas more or less likely to support reliable C2 connectivity, thereby informing ground control station (GCS) and waypoint placement.
Figure 2.
Conceptual schematic illustrating first Fresnel zone clearance around the direct line of sight from the ground modem (transmitter) and the UAV (receiver) under an air-to-ground propagation scenario. The green dashed line depicts the ellipsoidal region of the first Fresnel zone.
A communication viewshed analysis was conducted in Global Mapper Pro (Blue Marble Geographics, Hallowell, ME, USA) using the viewshed tool within the terrain analysis module, with first Fresnel zone clearance enabled. Elevation data were derived from a 1-arc-s Shuttle Radar Topography Mission Version 3.0 (SRTM Plus) DEM. For each site, Fresnel clearance conditions were classified into two categories: 0–<60%, representing scenarios where terrain intrusion into the first Fresnel zone is more likely to result in signal degradation, and 60–100%, representing conditions generally considered suitable for reliable signal propagation, consistent with applied radio-frequency engineering guidelines [31]. Transmitter and receiver heights were set to 2 m and 60 m above ground level, respectively, with a maximum view radius of 6.4 km and an operating frequency of 2.4 GHz. Based on predicted coverage, 17 GCS locations were selected, and the resulting viewshed polygons were integrated into mission-planning software to guide waypoint placement and to be displayed on the ground control interface during flight.
2.7. BVLOS Mission Planning
BVLOS missions were programmed using eMotion v3.23.1 software (SenseFly, Lausanne, Switzerland; Table 2). A flight altitude of 60 m AGL was chosen to ensure safe terrain clearance while maximising image resolution, resulting in a ground sampling distance (GSD) of 1.37 cm pixel−1. Previous work by Moy et al. [12] used ~2 cm GSD imagery to map coastal marine debris, including derelict fishing nets. In this study, a slightly higher GSD was chosen to enhance the detectability of fragmented, obscured, or partially buried nets.
Table 2.
Summary of programmed UAV survey flight parameters.
A single-line corridor survey method was adopted, with flight paths aligned with the mid-tide line to maximise coverage of likely deposition zones. The survey corridor width was set to 75 m, corresponding to the image footprint at the designated altitude. Forward image overlap was fixed at 50% to ensure continuous spatial coverage while minimising redundant imagery. Waypoint placement was prioritised in areas with >60% first Fresnel zone clearance to maximise C2 link reliability, with all points positioned no more than 6 km from the GCS. Waypoint placement within lower-clearance zones (<60%) was required to complete some segments of coastline. Operational adjustments to mission plans were made in the field as needed, including modifications to account for wind conditions, terrain warnings, C2 degradation, and tidal changes affecting UAV landing sites.
2.8. GNSS Correction
The Emlid Reach RS2+ GNSS receiver (Emlid, Budapest, Hungary) was deployed as a static base station to improve the positional accuracy of UAV imagery using Post-Processed Kinematic (PPK) correction. Unlike real-time kinematic approaches, PPK does not require a continuous radio link between the UAV and the base station, making it well suited to longer range flights and operations in remote environments with limited or no communication coverage, such as Groote Eylandt. The base station was established at fixed locations within a 20 km radius of scheduled flight areas and continuously recorded GNSS observations, which were exported in RINEX 2.11 format. No ground control points (GCPs) were used because the study objectives did not require the level of absolute positional accuracy provided by GCP networks.
The eBee X UAV is equipped with an onboard GNSS receiver that logs raw positional data throughout each flight. Following data acquisition, raw GNSS observations from both the UAV and the base station were post-processed using eMotion software. During post-processing, PPK corrections were applied to refine image geotags prior to image review.
2.9. Flight Telemetry and C2 Performance Data
During each flight, telemetry data were recorded at pre-programmed waypoints to support analysis of C2 performance and system events. Recorded parameters included geographic coordinates (latitude and longitude), battery status, distance from the GCS, C2 link quality, and flight altitude. The frequency and type of C2 link interruptions, classified as no data uplink or no data downlink, were derived from flight transcripts. Including flight transcripts captures all link-loss events along the UAV’s trajectory, including those occurring between planned waypoints, thereby accounting for transient signal interruptions that waypoint-level analysis alone would miss. Data uplink refers to the transmission of commands from the operator to the UAV, whereas data downlink refers to the transmission of telemetry and system information from the UAV to the operator.
ArcGIS Pro version 3.6.1 [36] was used to extract terrain information. The 1-arc second SRTM digital elevation model (DEM) was imported and reclassified into discrete elevation bands (>40 m, 30–39 m, 20–29 m, 10–19 m, 5–9 m, 1–4 m, and 0 m) to delineate potential terrain obstructions. The reclassified raster was converted to polygon format to enable feature-based proximity analysis. Flight telemetry data, representing aircraft positions along the flight corridor, were imported as point features and overlaid on the DEM. The ArcGIS Near tool was used to identify the nearest elevated terrain feature for each point within each elevation band, as well as the distance of each waypoint from the predicted propagation range. Because the nearest features are not necessarily located within the signal path, terrain features outside the LOS path between the UAV and GCS were excluded. Following this filtering step, a single nearest terrain feature was assigned to each telemetry point, and the distance to that feature was used as a metric of terrain proximity. The feature’s elevation was then subtracted from the UAV flight altitude to derive a clearance metric representing the vertical separation between the aircraft and the nearest terrain obstacle. Additionally, each waypoint was assigned to a percentage-based class of first Fresnel zone clearance (high (≥60%), low (<60%), outside).
2.10. Model Fitting and Selection
A model selection framework was used to evaluate the influence of environmental and terrain-related predictors on C2 link quality. All statistical analyses were conducted in R Studio version 4.5.3 [37]. C2 link quality was recorded as a continuous percentage but was strongly right-skewed, with most observations near high values. To improve interpretability and align with operational thresholds, it was classified into ordered categories (loss = 0%, very weak ≥ 0–25%, weak ≥ 25–50%, moderate ≥ 50–75%, strong ≥ 75–100%). Ordinal outcomes were analysed using cumulative link mixed models (CLMMs) fitted with a logit link using the “clmm” function in the ordinal package [38], with site included as a random intercept to account for repeated observations.
Predictor variables were defined a priori to represent mechanisms influencing air-to-ground signal propagation, including geometric constraints (distance from the GCS), terrain interactions (proximity to and clearance above elevated features, distance to the predicted propagation boundary), and environmental conditions (humidity, temperature, wind). First Fresnel zone clearance was included as a categorical representation of signal obstruction. Continuous predictors were log-transformed as needed to reduce skewness and standardised as z-scores to enable comparison of effect sizes across variables.
Collinearity was screened prior to model fitting using generalised variance inflation factors (GVIFs) adjusted for their degrees of freedom [39]. All GVIF^(1/2 × Df) values were below the threshold of 2, indicating no problematic collinearity (range: 1.07–1.85). A global CLMM containing all predictors was then fitted, and model assumptions were assessed using the “check model” function in the performance package [40]. Candidate sub-models were generated from the global model using the “dredge” function in the MuMIn package [41] and ranked by corrected Akaike’s Information Criterion (AICc). Four models fell within 2 ΔAICc units of the top-ranked model and were considered to have substantial support [42]. The top-ranked model was selected for inference, given the consistency of core predictors (Fresnel class, distance from the GCS, proximity to the predicted propagation boundary) across all supported models.
To further examine if C2 link quality varied among geomorphic classes, we conducted a one-way analysis of variance (ANOVA). As residuals were non-normally distributed and variances were unequal across geomorphic classes, we performed a Welch ANOVA. Pairwise comparisons were then conducted using the Games-Howell post hoc test, which adjusts for unequal variances and sample sizes and provides conservative estimates of mean differences between geomorphic classes. All analyses were conducted using the rstatix package [43].
2.11. UAV Image Review
UAV imagery was manually screened by two analysts with ground-based experience in fishing net identification and image review, to establish a baseline record of derelict fishing nets and net fragments. This served to validate the survey methodology, rather than to test or develop a new detection method. Images were reviewed at full spatial resolution using a systematic lawnmower-pattern scanning approach to ensure complete coverage, requiring approximately one minute per image. Nets were identified based on a combination of visual characteristics, including mesh texture, tangled structure, and colour. Both analysts screened the full image set concurrently, and discrepancies in detections were resolved through verbal consensus; no formal measure of inter-observer agreement was calculated. Images containing duplicate detections of the same net were manually removed to avoid double-counting. For each remaining detection, geographic coordinates were derived from image centre points. Coordinates (latitude and longitude) and associated image file names were extracted in RStudio version 4.5.3 and exported as a KML file for integration into ArcGIS Pro software version 3.6.1 for further analysis and use in field-based navigation tools.
Field validation was undertaken to assess detection reliability under operational conditions. An 8 km segment of coastline accessible by a four-wheel drive (4WD) vehicle was selected as the survey area. Detection points were uploaded as waypoints onto an iPad using the GPS Tracks Pro application version 4.5.2 (DM Software Solutions, Destin, FL, USA), which provides offline satellite basemaps, waypoint navigation, and route tracking. Field surveys were conducted using a 4WD vehicle travelling parallel to the shoreline at approximately 20 km h−1. A second vehicle, with two additional personnel experienced in derelict fishing net retrieval, followed and scanned the surrounding coastline for additional nets not identified in the UAV imagery. All nets encountered during the survey were recorded and validated against the corresponding UAV images.
2.12. VLOS Operational Scenario
To evaluate the potential influence of VLOS constraints on UAV survey outcomes, an operational scenario was developed using the spatial distribution of detected fishing nets relative to GCS locations. VLOS conditions were approximated using a conservative maximum UAV–GCS separation of 600 m, corresponding to an operational range of 1200 m when the GCS is positioned at the midpoint of each survey segment. BVLOS flight corridors were segmented in ArcGIS Pro using the “Generate Points Along Line” tool, dividing each corridor into sequential, non-overlapping 1200 m segments. The total number of segments was used as a proxy for the number of missions required in this VLOS operational scenario.
A cumulative detection analysis was used to quantify detection availability as a function of distance from each GCS under the VLOS operational scenario. For each BVLOS mission, the distances of all detected nets from the corresponding GCS were calculated in ArcGIS Pro using the Near tool and exported to RStudio for analysis. Distances between each detected net and its corresponding GCS location were extracted and ordered from nearest to farthest. A cumulative count of detections was then calculated and expressed as a proportion of the total number of detections. Detections were classified as either within (<1200 m) or beyond (>1200 m) the VLOS operational range. The cumulative proportion of net detections was plotted against distance to visualise how the availability of beached nets increased with range under this scenario.
This operational scenario assumes a fixed 600 m maximum UAV–GCS separation, uninterrupted LOS with no allowance for terrain or vegetation obstructions, and unrestricted access to each GCS location.
3. Results
3.1. BVLOS UAV Surveys
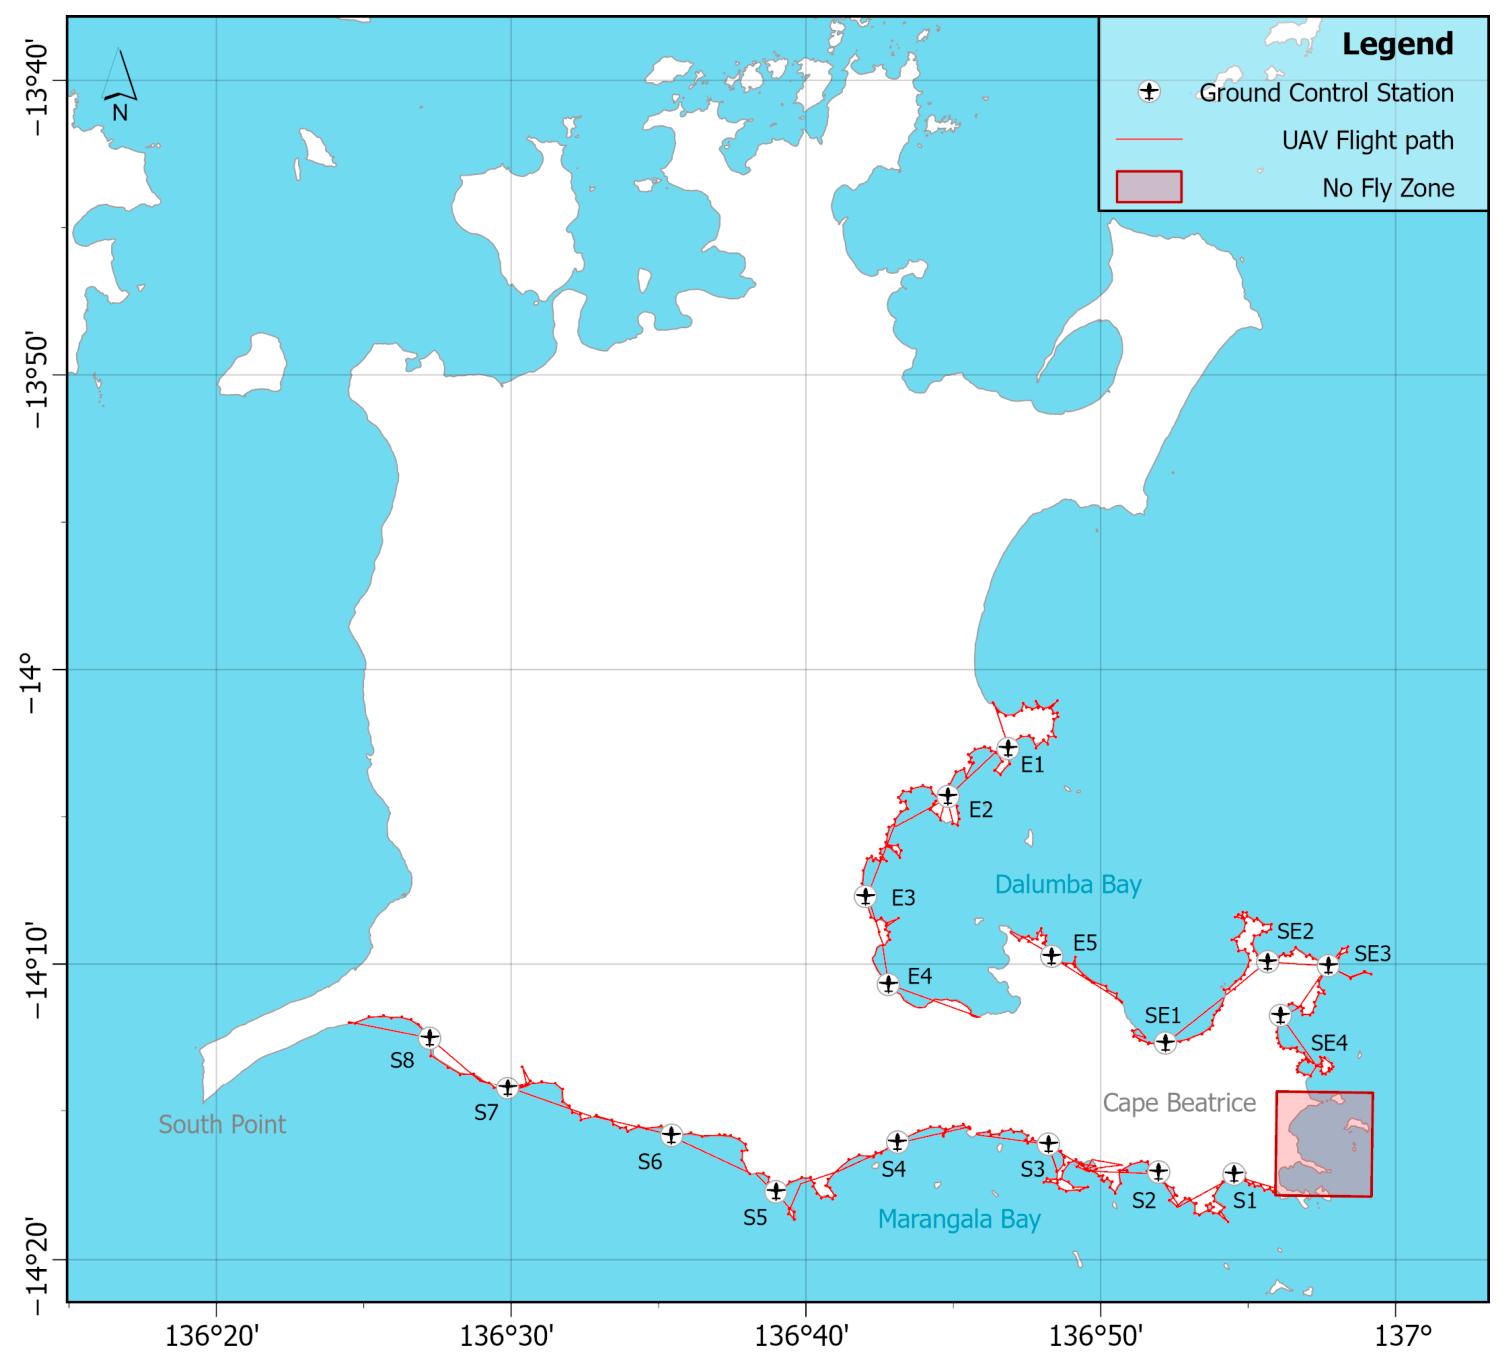
Across eight survey days, we conducted 20 BVLOS missions totalling 51.5 field hours, with active UAV flight accounting for 12.5 h, just under a quarter (24%) of the total effort (Figure 3). The UAV captured 9648 images, covering 210 km of coastline, travelling at an average speed of 12.5 ± 2.8 m s−1. Flights were planned at 60 m above ground, but the actual mean altitude was 65.3 ± 6.7 m, resulting in a ground sample distance of 1.48 ± 0.15 cm pixel−1 and an approximate mean elevation angle between the ground modem and UAV of 3.6 ± 6.4°. The UAV reached a maximum distance of 5.84 km from the GCS, with survey corridors averaging 10.5 ± 3.0 km in length.
Figure 3.
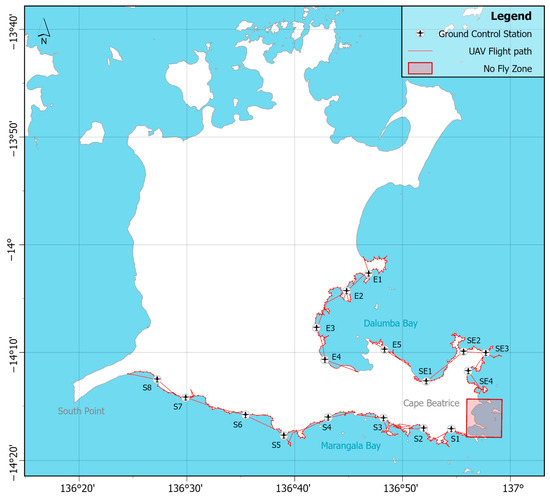
BVLOS UAV flight paths (red line) of all 20 aerial surveys conducted on Groote Eylandt. The UAV icons mark the ground control station locations along the shoreline from which the UAV was piloted.
Of the 21 programmed BVLOS missions, 16 (76%) were completed as planned. Four missions (19%) were redirected in flight due to temporary C2 link degradation, resulting in incomplete missions, and one was cancelled prior to launch due to an active bushfire (Table S1). Of the four redirected missions, two were resumed after in-flight path adjustments were made to avoid areas of poor signal, restoring C2 connectivity. One mission was aborted near the end of the corridor after sustained link loss triggered an automated return-to-home (RTH) fail-safe response. The remaining mission was terminated mid-flight due to recurring signal degradation; however, repositioning the GCS allowed the remaining corridor segment to be completed under improved conditions. At site E4, a hard landing caused the camera to disconnect, interrupting data recording; as a result, the associated flight logs and transcripts were unavailable for review and excluded from analysis.
3.2. C2 Link Performance
C2 link performance was evaluated at 433 waypoints along the surveyed coastline, as summarised in Table 3. The UAV maintained moderate-to-strong links at 377 waypoints (87%), with an average link quality of 96.1 ± 9.3% at a mean distance of 2229 ± 1244 m from the GCS (maximum 5840 m). Weaker links (<50%) were observed at 49 waypoints (11%), with a mean quality of 23.2 ± 14.6% at 3336 ± 1124 m (maximum 4895 m), while complete link loss occurred at 7 waypoints (mean 3937 ± 1315 m, maximum 5370 m).
Table 3.
Summary of C2 link quality and distance metrics by predicted first Fresnel class.
Analysis of flight transcripts showed that most link-loss events were associated with data downlink. A total of 65 downlink interruptions were recorded on and between waypoints, totalling 7 min 48 s. Most events were very brief (<1 s) and had negligible impact on telemetry or UAV operation. By contrast, only a single uplink interruption occurred (<1 s). At the site level, the longest cumulative link loss occurred at site S8, lasting 2 min 21 s across four events, even though the affected waypoints were within the predicted first Fresnel clearance zone (>60%). Whereas sites E2 (2 min 1 s, 8 events), E5 (1 min 6 s, 6 events), and S2 (1 min 7 s, 12 events) experienced link loss primarily at waypoints near or beyond the lower Fresnel clearance threshold (<60%).
3.3. Communication Viewshed Model Validation
Observed C2 link performance differed across predicted Fresnel clearance zones, providing insight into the predictive reliability of the communication viewshed model. Predictions were most accurate for waypoints within the upper first Fresnel clearance zone (≥60%), where 90.5% (n = 363) of observations in this class maintained moderate-to-strong links, with a mean link quality of 96.3 ± 8.9% at a distance of 2198 ± 1241 m. However, 38 waypoints within this zone exhibited signal degradation (8.7%, n = 35) or loss (0.7%, n = 3). Waypoints placed within the predicted lower first Fresnel clearance (>0–60%) showed greater variability. Nearly half of the waypoints (44.5%, n = 12) maintained moderate-to-strong links, averaging 91.3 ± 16.2% link quality at 3309 ± 905 m, while the same proportion experienced weak C2 links (23.2 ± 14.6%). The remaining 11% (n = 3) suffered complete link loss.
These patterns were further evaluated using a cumulative link mixed model to quantify the influence of Fresnel clearance and positional factors on C2 link quality (Table 4). Fresnel clearance, proximity to predicted viewshed edges, and distance from the GCS emerged as the strongest predictors. Waypoints within the first Fresnel zone (>60% clearance) had substantially higher odds of stronger C2 links compared with those below this threshold (OR = 10.4, 95% CI 3.3–32.8, p < 0.001), whereas waypoints outside the Fresnel zone had markedly reduced odds (OR = 0.06, 95% CI 0.006–0.61, p = 0.017). Greater distance from the edge of the predicted viewshed boundaries also increased the likelihood of stronger links (OR = 1.95, 95% CI 1.38–2.76, p < 0.001), reflecting the improved LOS and Fresnel conditions deeper within the predicted coverage area. Conversely, distance from the GCS was a strong negative predictor (OR = 0.43, 95% CI 0.31–0.60, p < 0.001), consistent with distance-dependent signal attenuation and the operational limitations of the UAV communication system. Humidity showed a marginal negative effect (OR = 0.52, 95% CI 0.24–1.13, p = 0.10). Random intercept variance (σ2 = 1.543, SD = 1.242) indicated notable baseline differences among sites, highlighting spatial heterogeneity along the flight routes.
Table 4.
Fixed-effect estimates from the cumulative link mixed-effects model (CLMM) predicting C2 link quality along the surveyed coastline. Coefficients for the Fresnel class are relative to the reference level (<60% first Fresnel clearance).
3.4. Variation in C2 Link Quality Across Coastal Habitat Types
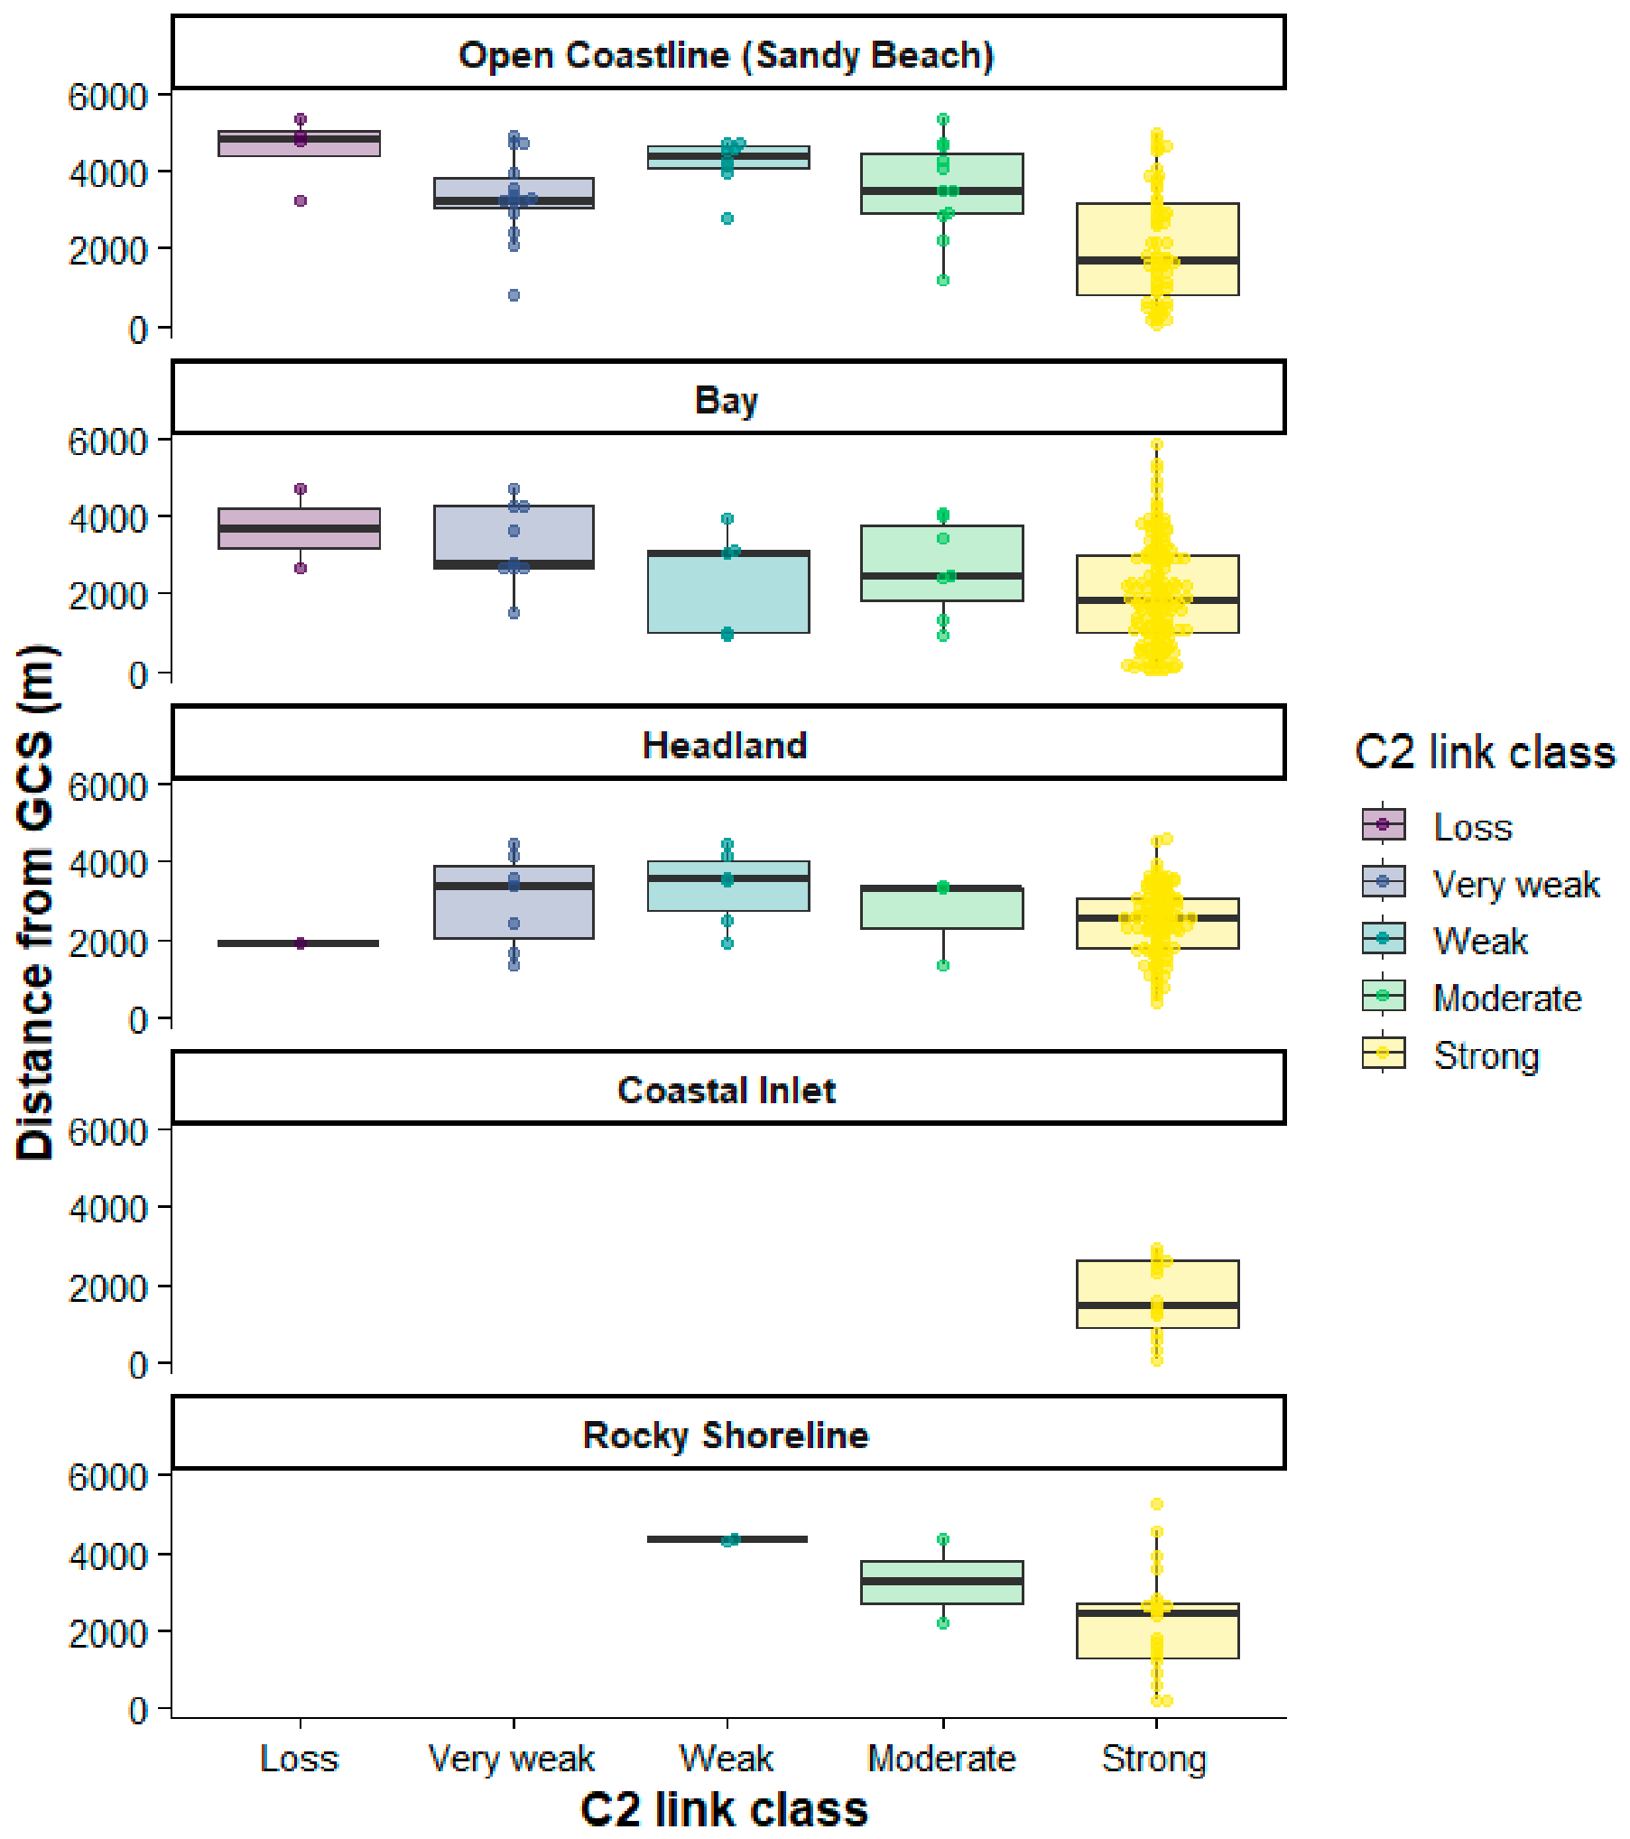
A one-way Welch ANOVA confirmed that mean C2 link quality differed significantly among coastal habitat types (p < 0.001). Games-Howell post-hoc comparisons revealed that open coastlines characterised by sandy beaches exhibited significantly lower link quality than bays (diff = 17.1, p < 0.001), headlands (diff = 17.0, p < 0.001), and coastal inlets (diff = 23.5, p < 0.001), with a smaller difference compared to rocky shorelines (diff = 16.5, p = 0.029). No other pairwise differences among the other coastal habitat types were significant. However, further investigation showed that the distance at which signal degradation occurred was greater along open coastlines (mean ± SD: 3642 ± 1031 m, max: 4895 m) than in bays (2861 ± 1191 m, max: 4704 m) or headlands (3124 ± 1116 m, max: 4475 m) (Figure 4). No weak-link observations were recorded in coastal inlets, and only a few occurred over rocky shorelines, limiting interpretation for these segments.
Figure 4.
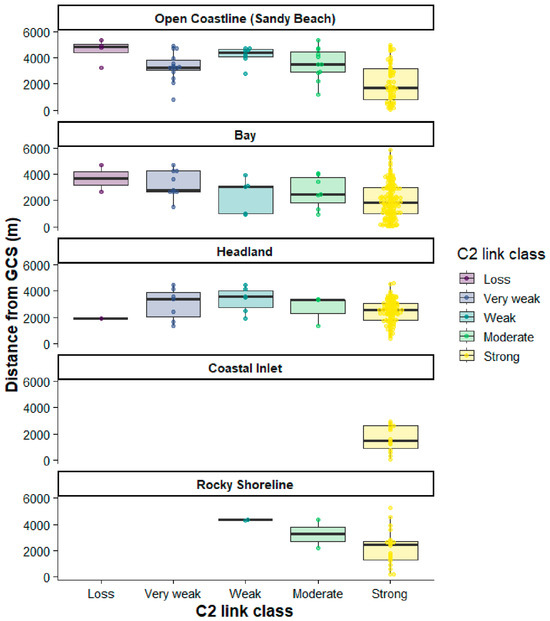
Variation in C2 link quality across geomorphic classes along the BVLOS flight routes. Distance from the GCS is shown on the X-axis, with boxplots indicating the median and interquartile range of distances for each C2 link quality class, and jittered points representing individual waypoints.
3.5. Detection Outcomes
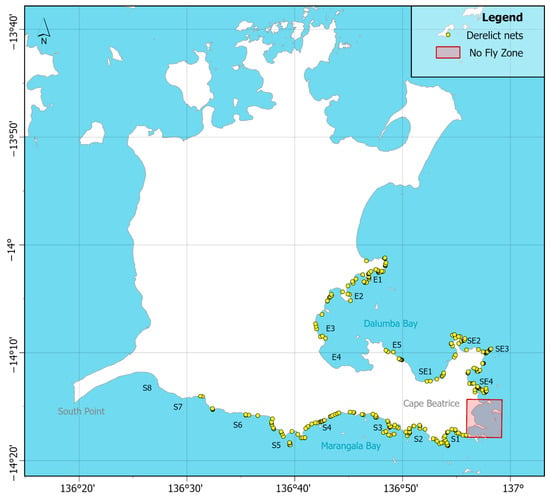
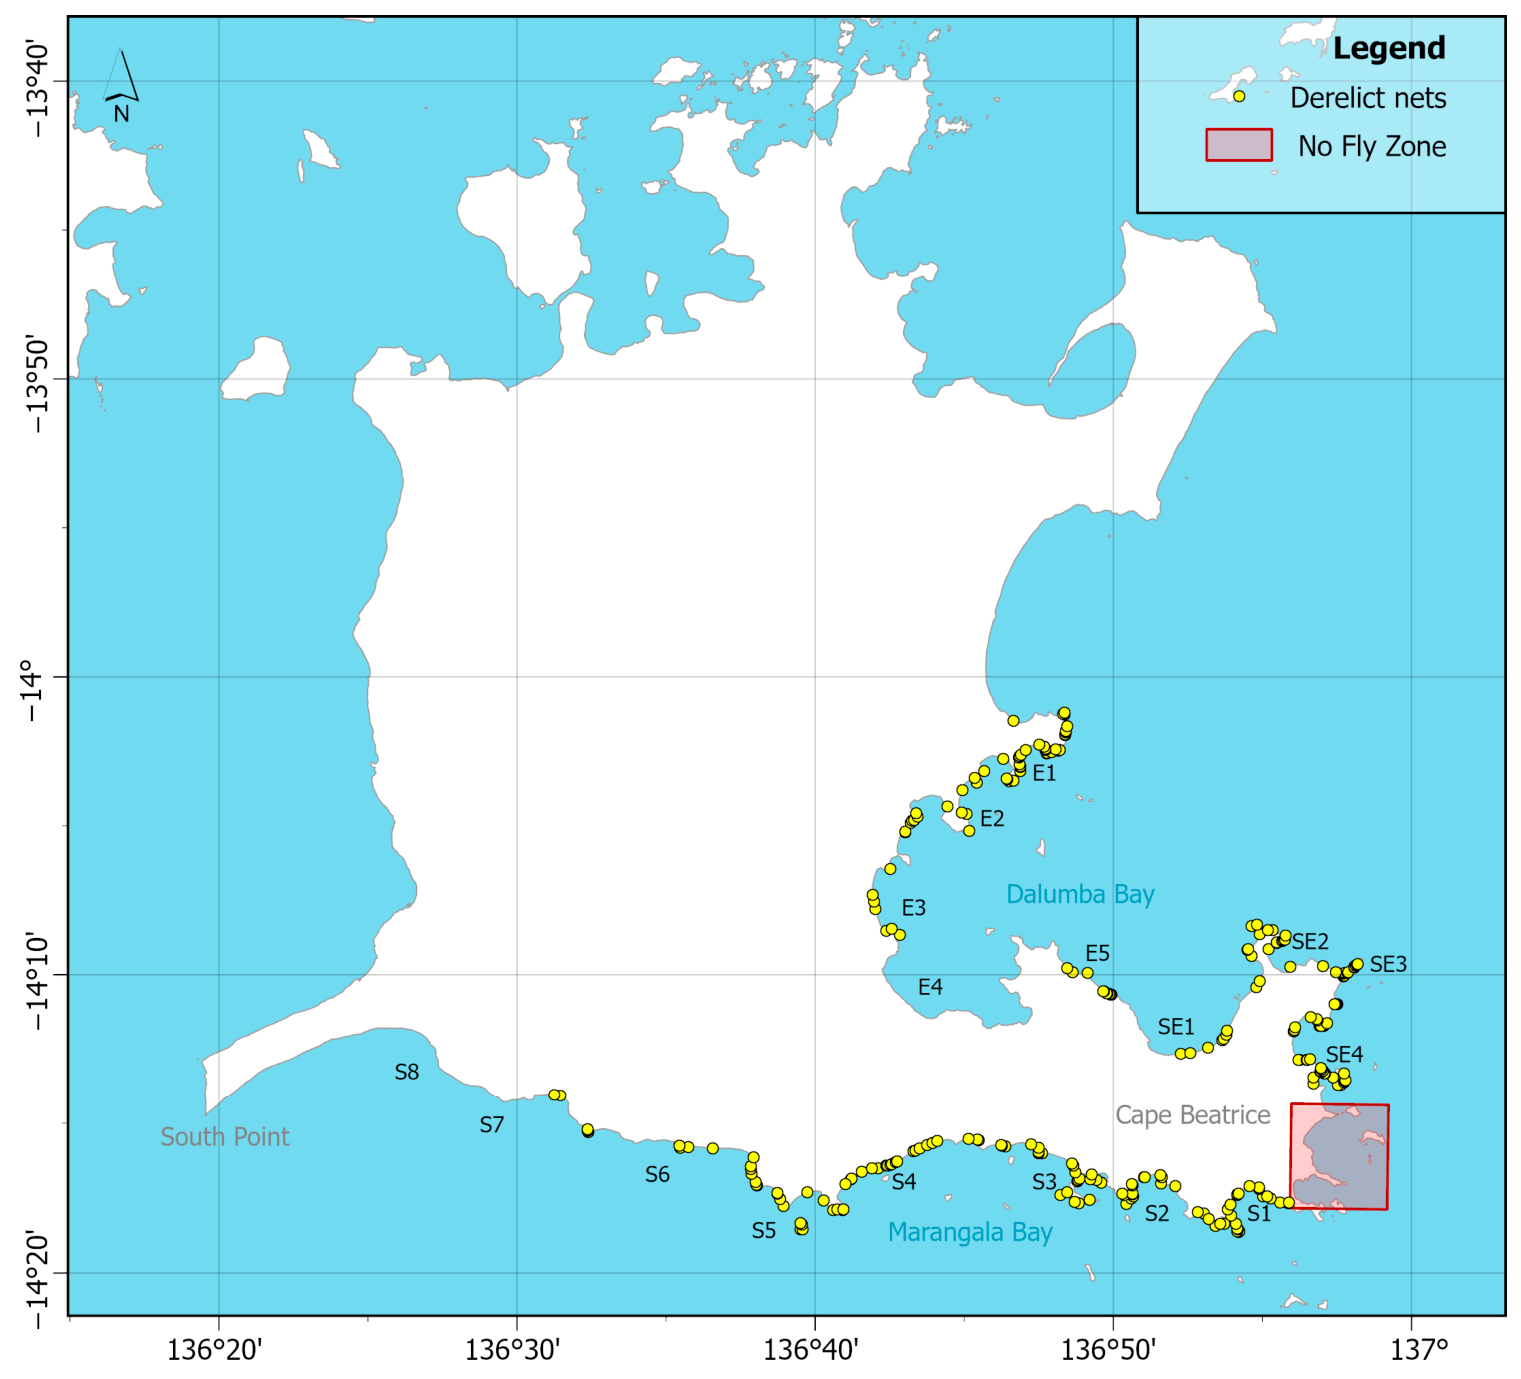
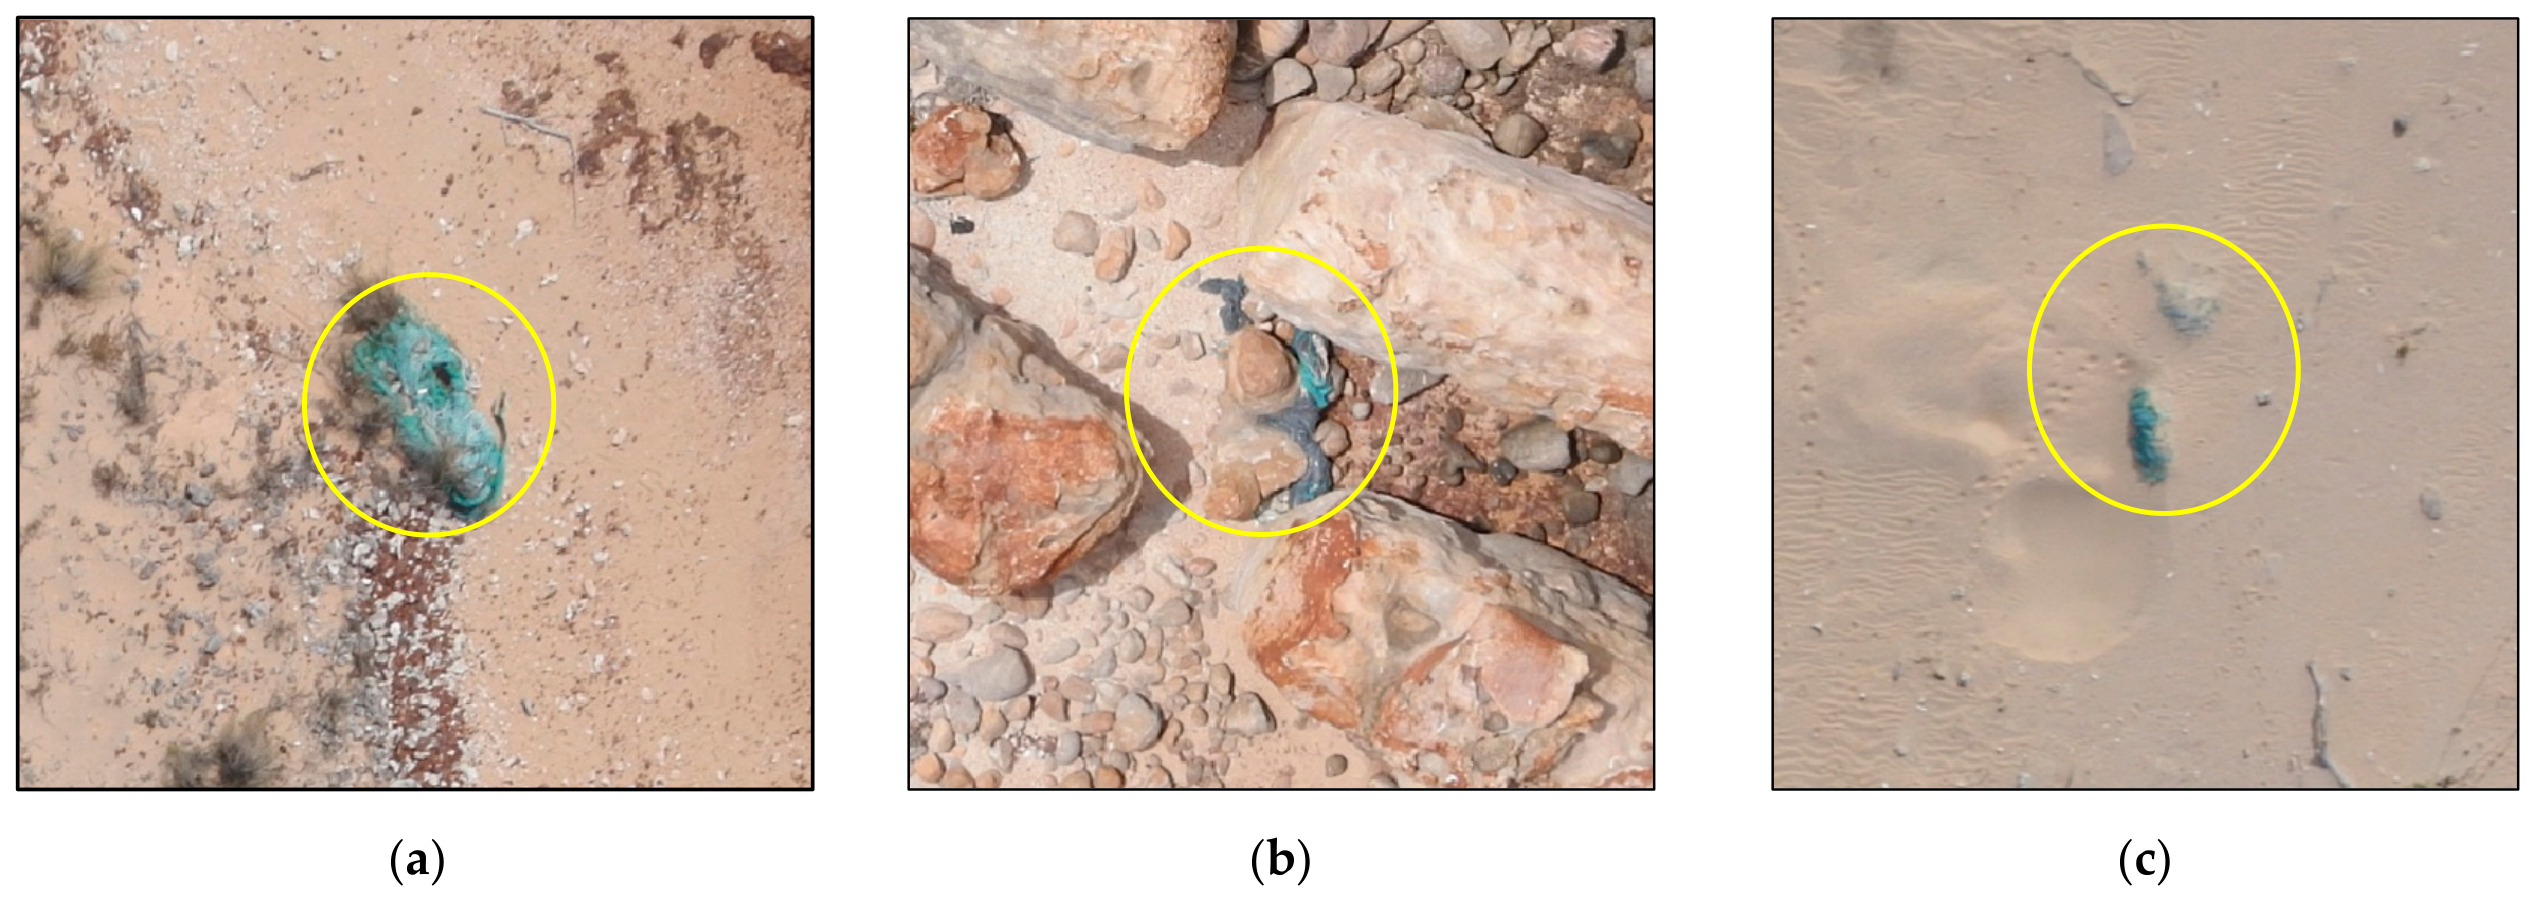
A total of 291 derelict fishing nets and net fragments were detected across the surveyed coastline, equivalent to 1.38 items per kilometre (Figure 5). Net detections varied across habitat type and visibility class, with most recorded in bays (30%), rocky shorelines (29%), and around headlands (27%). Nets stranded along open coastlines and islands exhibited comparatively lower counts. However, the island category was underrepresented, with only two small nearshore islands surveyed. Across all habitat types, detections were mostly of partially obscured nets (54%), while heavily obscured nets (10%) were infrequently observed in the UAV imagery (Figure 6).
Figure 5.
Distribution of derelict net detections (yellow points) along 210 km of surveyed coastline.
Figure 6.
Examples of derelict fishing nets (yellow circle) manually detected in UAV imagery illustrating the range of visibility conditions encountered: (a) fully visible net on a headland; (b) partially obscured net on a rocky shoreline; and (c) heavily obscured net on an open sandy beach.
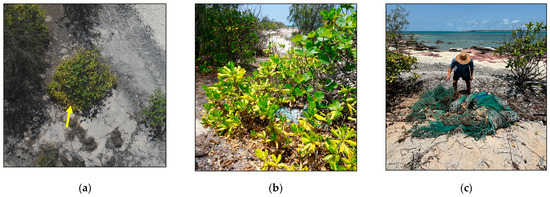
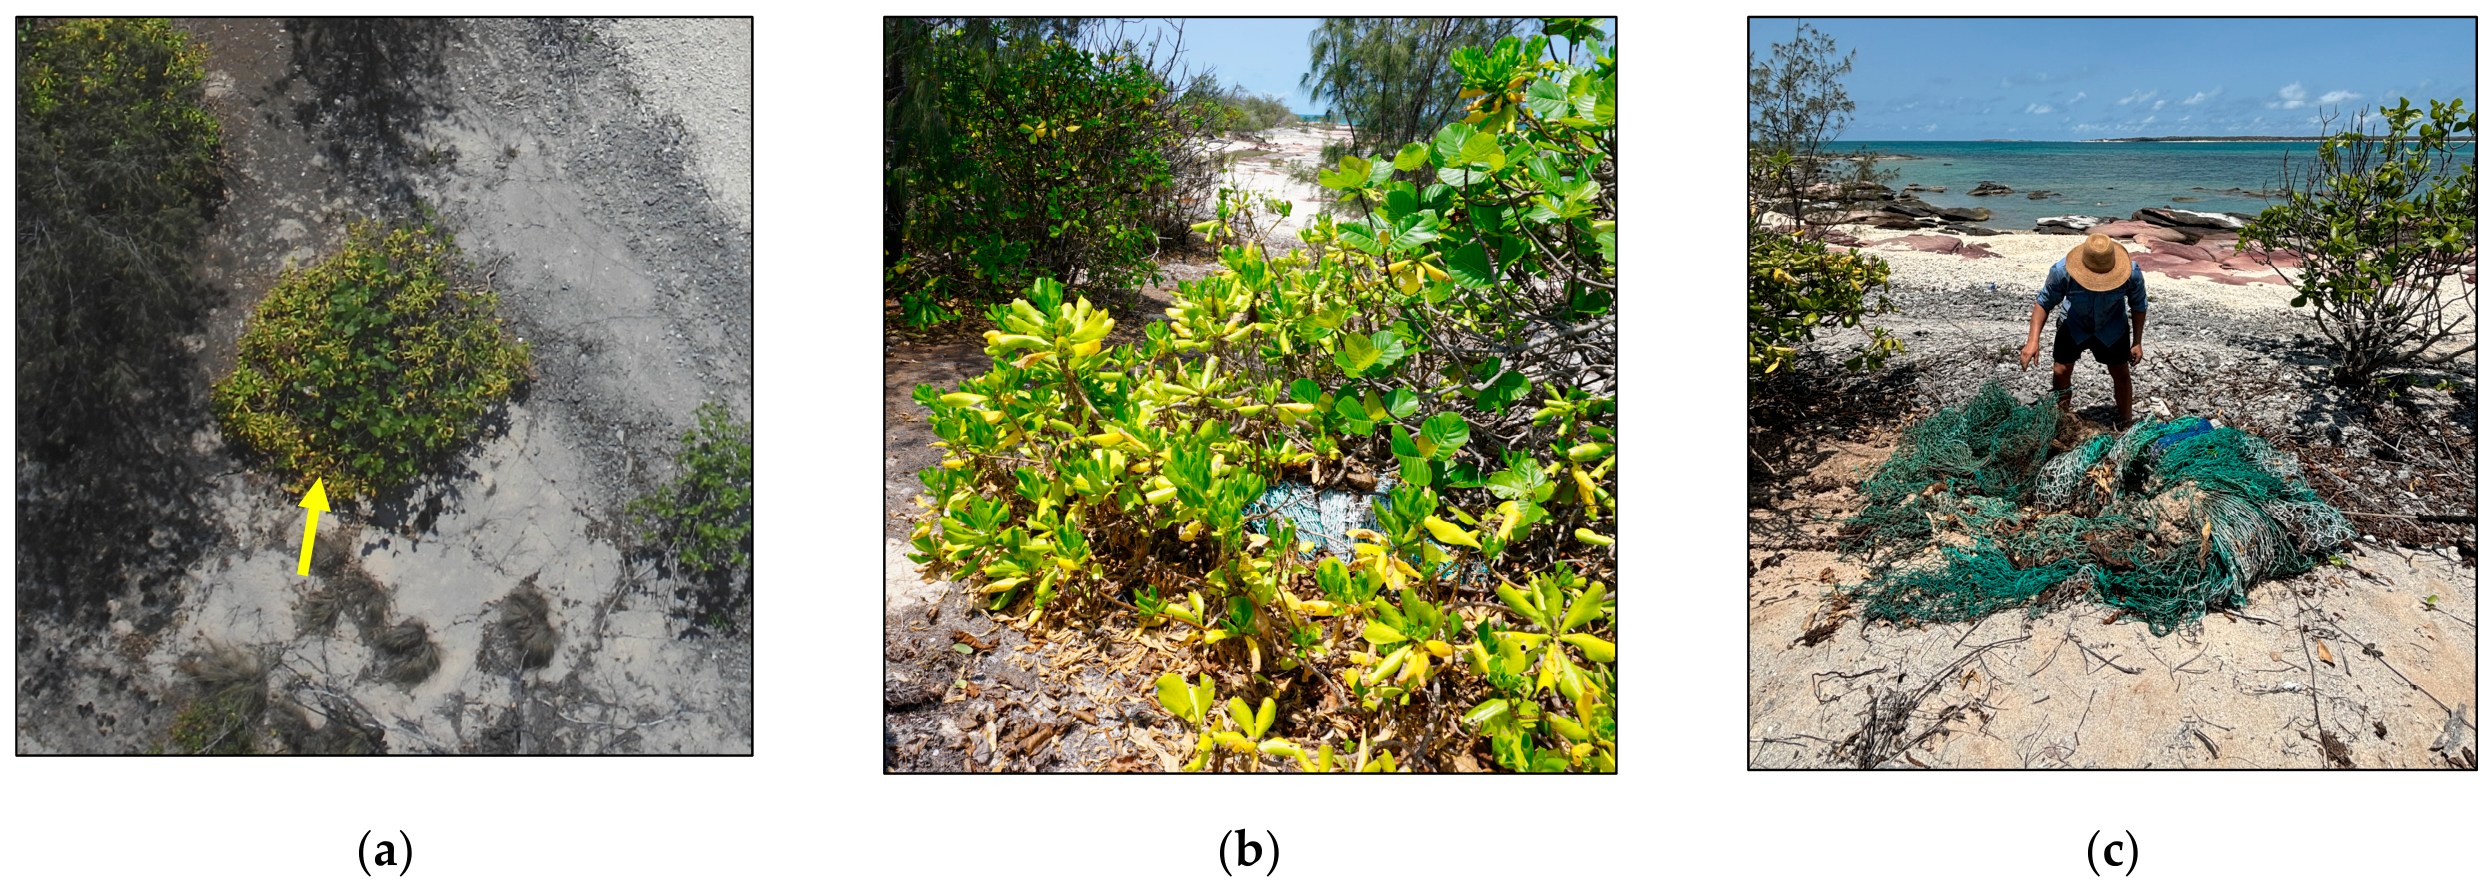
To provide a preliminary assessment of detection reliability, we surveyed an 8 km section of coastline, where 11 nets had been identified in the UAV imagery. During the ground survey, 15 nets were recovered, of which 12 were located within the image scene. Of these, 11 nets were correctly detected in the imagery (true positives), with one net missed due to vegetation occlusion (false negative; Figure 7), yielding a detection sensitivity of 91.7%. The remaining three nets were outside the surveyed imagery extent and, therefore, unavailable for detection, reflecting a limitation in spatial coverage rather than in detection performance.
Figure 7.
Illustration of a false negative derelict fishing net detection found during the ground survey resulting from vegetation occlusion: (a) UAV imagery showing the net location (yellow arrow), where dense shrub cover prevented aerial detection; (b) partial visibility of the net at ground level; and (c) the net following manual retrieval, demonstrating the size of the gear.
3.6. Survey Outcomes Under the VLOS Operational Scenario
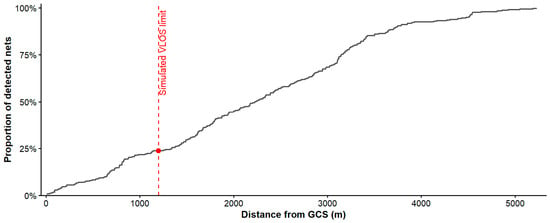
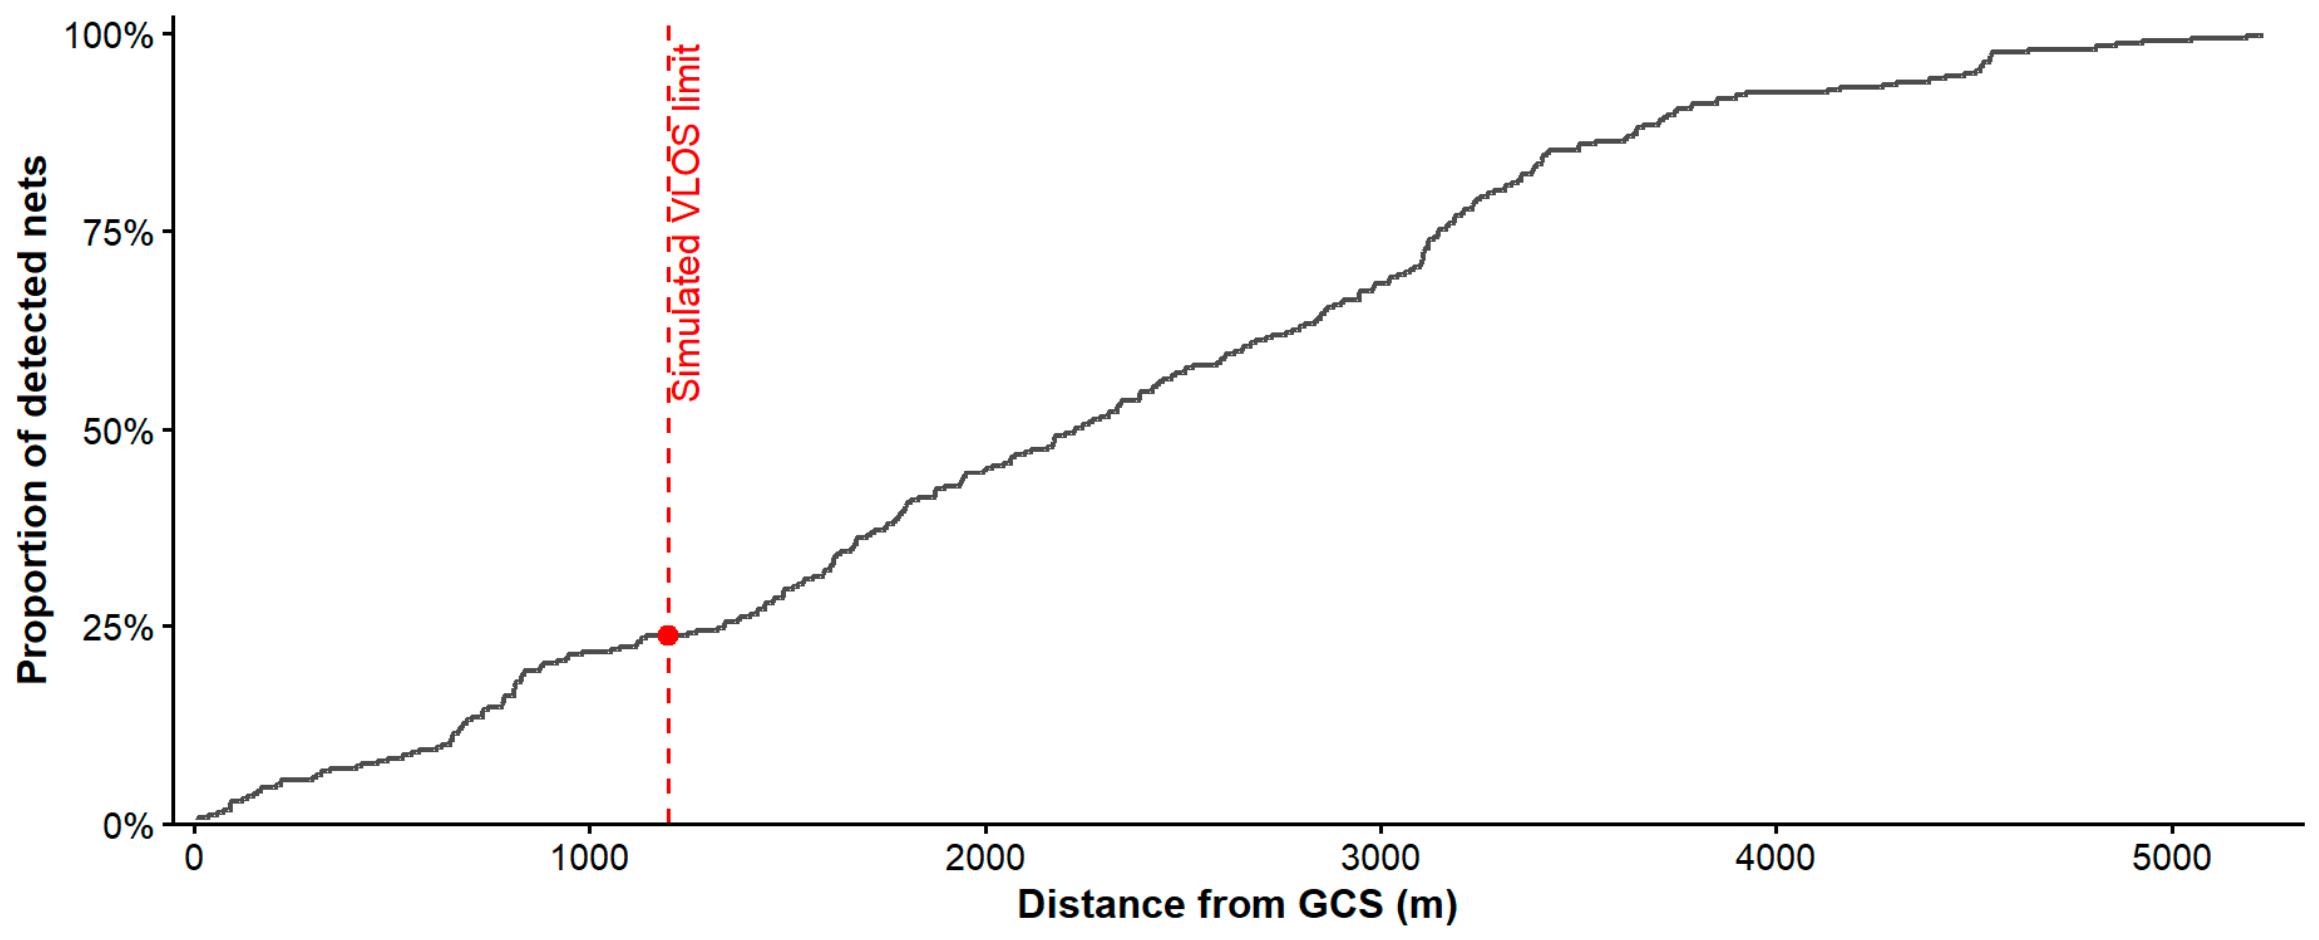
Under the VLOS operational scenario, using a conservative 600 m UAV–GCS separation and 1200 m operational range, 69 net detections (23.7%) fell within the simulated VLOS range, and 222 detections (76.3%) occurred beyond this threshold (Figure 8). Detected nets were distributed across the full survey extent, with a median distance of 2226 m from the GCSs (IQR: 1339–3147 m). Cumulative detection analysis indicated that 54.6% of detections occurred within 2400 m of the GCSs, and 86.3% occurred within 3600 m.
Figure 8.
Cumulative proportion of derelict fishing nets detected (N = 291) with increasing distance from the 17 ground control stations (GCS). The black stepped line shows the cumulative distribution of fishing net detections across the full BVLOS survey extent. The dashed red line marks the simulated standard VLOS distance limit (1200 m). The red point indicates the proportion of nets detected within this range (n = 69), representing the detection yield achievable under conventional VLOS operations relative to the full BVLOS survey.
Across all missions, BVLOS deployment enabled 210 km of coastline to be surveyed over 20 missions. Based on the assumptions outlined in Section 2.12, an estimated 175 missions would have been required to achieve equivalent spatial coverage under VLOS-constrained operations, representing an approximately 8.8-fold increase in mission requirement relative to BVLOS operations.
4. Discussion
4.1. BVLOS Operational Feasibility and Performance
Our results demonstrate that a fixed-wing UAV can be effectively deployed for ALDFG monitoring under low-altitude BVLOS conditions in remote coastal environments. The UAV collected high-resolution imagery along 210 km of longshore transects, enabling the detection of 291 individual derelict fishing nets and net fragments. Survey performance was generally reliable, with 76% of BVLOS missions completed as planned. Occasional C2 link degradations reflected the influence of communication stability and environmental conditions, but these interruptions were typically very brief and recoverable, with most resolving without automated fail-safes or manual intervention. C2 link reliability emerged as the primary operational constraint, reinforcing the need to account for connectivity in mission planning. However, observed C2 link behaviour suggests that, when LOS and high first Fresnel clearance (>60%) are maintained, the UAV’s communication system is primarily limited by distance-related attenuation rather than terrain obstruction in coastal settings.
4.2. Evaluation of DEM-Based Communication Viewshed Modelling
DEM-based communication viewshed modelling incorporating first Fresnel zone clearance provided a practical means of identifying areas likely to support stable C2 connectivity, informing pre-flight risk assessment, GCS placement and mission design. The agreement between predicted and observed connectivity, where most waypoints in high Fresnel clearance zones maintained moderate-to-strong link quality, demonstrates the capability of this approach to identify such areas. Nonetheless, occasional link degradation and loss within these zones indicate that DEM-based predictions did not fully capture in-flight performance. This discrepancy likely reflects the exclusion of vegetation and fine-scale surface features from the underlying DEM, and the comparatively limited 2D Fresnel clearance assessment. As Baek and Choi [29] note, 2D Fresnel analyses assess obstruction along a single terrain profile, whereas 3D analyses evaluate every terrain cell within the Fresnel zone, capturing the full propagation volume, particularly when derived from high-resolution DSMs. The DEM-based 2D Fresnel approach therefore represents a pragmatic trade-off: it is widely accessible and computationally efficient for landscape-scale BVLOS mission planning, but its outputs should be interpreted as indicative rather than deterministic.
This trade-off between accessibility and predictive fidelity is likely to be more consequential in complex coastal environments, where vegetation, dune structures, and other above-ground features increase the potential for DEM-based predictions to diverge from observed C2 connectivity. In such settings, DSM- or LiDAR-derived surface models would offer a more accurate alternative, capturing the above-ground surface that directly influences signal propagation rather than bare-earth elevation alone [29]. Such data may be obtained from existing airborne LiDAR datasets, where available, or through dedicated airborne or UAV-based capture in areas lacking existing coverage [44,45]. This gain in accuracy, however, is not without cost where higher data acquisition and processing demands, larger file sizes, and, in many remote regions, limited existing coverage may necessitate dedicated pre-survey data capture, offsetting the broad applicability that this operational framework is intended to provide. The choice between DEM- and DSM-based approaches should therefore be informed by the complexity of the terrain and the resources available for a given survey.
4.3. Fixed-Wing UAVs in Coastal ALDFG Monitoring
Battery-powered micro fixed-wing UAVs occupy an intermediate position between multicopters, which are effective for very high-resolution, site-scale surveys but limited in range [13], and small fixed-wing UAVs (<25 kg), which offer greater range but are less frequently reported in coastal monitoring studies. A recent review of UAV applications in coastal ecosystem monitoring shows that multirotor platforms dominate the literature, with fixed-wing systems comparatively underrepresented, likely reflecting logistical and operational barriers, rather than a lack of capability [14]. This underrepresentation limits evidence-based guidance for establishing standard procedures and developing best practices for extending coastal surveys, reinforcing the need for studies that evaluate fixed-wing UAV performance under diverse field conditions.
The eBee X provided a low-risk platform for testing low-altitude BVLOS survey capability, offering a practical balance between spatial resolution, coverage, and operational simplicity. Its lightweight yet rugged design facilitated deployment in very remote areas of the Anindilyakwa IPA, where access typically requires a commercial flight followed by travel via 4WD vehicle, helicopter, or boat, making portability a key operational consideration. The UAV’s batteries are under 100 Wh, which can be carried as hand luggage on commercial flights, while its fuselage design and the availability of spare parts support minor in-field repairs. The operating conditions in northern Australia highlight the importance of robust equipment, where high temperatures, seasonal wind and humidity, complex terrain, and limited infrastructure place significant demands on the UAV. Although the eBee X completed the task, it was susceptible to environmental hazards, including high-temperature warnings, wind gusts exceeding operational thresholds of 12 m/s, and rough landings. The need for clear runways for take-off and landing was a primary constraint for this platform, particularly when high tides coincided with direct onshore or offshore winds and coastal features such as dunes or woodland further reduced available space.
4.4. Extending Coastal Monitoring
Operating BVLOS provided a substantial spatial advantage over conventional VLOS surveys, with extended longshore transects of up to 15.6 km completed across a heterogeneous coastline with minimal GCS repositioning. This proved particularly beneficial across rugged or access-restricted coastline segments, where frequent repositioning under VLOS constraints would otherwise be required. Under the operational scenario, equivalent VLOS coverage was estimated to require an 8.8-fold increase in mission numbers, from 20 BVLOS missions to 175 VLOS missions. This scale of difference points to a practical barrier facing VLOS-based coastal monitoring programs, where covering remote coastlines under VLOS constraints would demand repeated site access, crew time, and logistical coordination that are rarely feasible for routine, large-scale surveys. This estimate should nonetheless be treated as a best-case scenario rather than a universally applicable performance ratio, given its reliance on simplifying assumptions such as a fixed maximum UAV–GCS separation, uninterrupted LOS, and unrestricted access to each GCS location, conditions rarely met in practice over diverse areas. In more complex or logistically constrained coastal environments, these constraints would likely be more pronounced under VLOS operations, further widening the practical gap between the two approaches.
When contextualised against crewed aircraft operations, Moy et al. [12] surveyed approximately 1960 km of Hawaiian coastline over 12.5 h of active flight time, roughly nine times the linear distance covered per flight hour by the UAV. Despite this difference, the UAV delivered higher-resolution imagery (1.48 cm versus approximately 2 cm), greater flexibility in flight altitude and transect design, and a considerably lower sensor cost, using a consumer-grade compact camera rather than a professional multi-sensor aerial system. This comparison illustrates the trade-off between platform type, survey efficiency, and detection capability. While crewed aircraft offer clear advantages in coverage, UAVs can provide higher-resolution imagery and greater operational adaptability, qualities that are important for detecting small or partially obscured objects and for supporting routine coastal monitoring programs in remote locations.
Nonetheless, the BVLOS setup required to extend coastal monitoring is heavier in both equipment and logistical complexity, driven largely by the need for airspace awareness, redundant communications, and regulatory compliance. Much of this overhead exists to manage risks that VLOS operations avoid simply by keeping the aircraft in sight. For remote deployments such as the Anindilyakwa IPA, where reliable power and connectivity are not readily available, the supporting infrastructure poses a significant logistical challenge.
4.5. Regulatory Considerations for Routine Monitoring
The integration of BVLOS UAV surveys into routine coastal monitoring programs depends not only on technological capability but also on compliance with evolving civil aviation regulatory frameworks. While regulatory approaches differ between countries, operators universally face requirements for aircraft safety systems, communication infrastructure, airspace approvals, and pilot certification that represent significant practical and financial commitments before conducting flights. For smaller organizations such as land and sea management groups, conservation agencies, and research institutions, who may stand to benefit most from cost-effective monitoring tools, these demands can be prohibitive, concentrating operational capacity among well-resourced commercial operators and limiting broader adoption across the environmental monitoring sector. In practice, this may push smaller organisations toward contracting certified third-party providers to conduct BVLOS surveys on their behalf, introducing dependencies on external scheduling, pricing, and data workflows that can undermine the consistency and long-term affordability that routine monitoring programs require.
Internationally, BVLOS operations are governed through risk-based approval processes, with the SORA methodology developed by the Joint Authorities for Rulemaking on Unmanned Systems (JARUS) providing a widely adopted framework across the European Union, Canada, and Australia [46]. In the Australian context, BVLOS operations are regulated by the Civil Aviation Safety Authority (CASA) under the Civil Aviation Safety Regulations 1998, with each approval subject to individual assessment against defined operational criteria. The flights conducted in this study were authorised under Australian Standard Scenario 6 (AU-STS-06) [34], a CASA-recognised pathway permitting BVLOS operations below 400 ft AGL by a certified ReOC holder within sparsely populated environments, criteria well-suited to the remote coastal settings surveyed of northern Australia, and representing a practical and repeatable regulatory route for this class of environmental monitoring.
Since completing this study, CASA has introduced Temporary Management Instruction 2025-03, which establishes four broad area BVLOS approval pathways for certified ReOC holders, reducing the procedural burden of obtaining site-specific approvals [47]. While this represents a meaningful step toward operationalising routine UAV monitoring at large scales, it does not reduce the foundational costs of maintaining certified pilots, a ReOC, and compliant aircraft requirements, which remain a barrier for smaller organisations, regardless of how streamlined the approval process becomes. With CASA’s regulatory roadmap anticipating BVLOS operations becoming routine across shared Australian airspace by 2030 [48]. The longer-term outlook is encouraging, though realising the full potential of UAV-based monitoring across the environmental sector will likely depend as much on models of shared access and collaboration as on regulatory reform alone.
4.6. Key Limitations
4.6.1. Generalisability of Terrain Conditions
The BVLOS mission plan and flight conditions in this study were optimised for the test environment, and several factors influence how representative these results are of broader coastal operations. The surveyed coastline was geomorphologically diverse, encompassing open beaches, bays, headlands, and rocky outcrops, with elevations across the operational volume ranging from 0 to 60 m. Although some localised elevated features were present, the landscape generally exhibited moderate relief without extensive or continuous escarpments. Under these conditions, the observed C2 performance reflects outcomes achievable through effective planning and is representative of BVLOS operations in heterogeneous yet moderately complex coastal settings. The flight altitude used was suitable for these terrain characteristics but may be insufficient in coastal areas with greater elevation change or more rugged topography. In such areas, maintaining reliable communication and safe terrain clearance may require higher flight altitudes, increased transmitter antenna height, or additional planning informed by higher-resolution elevation or surface data.
4.6.2. Exclusion of Surface Features
The DEM-based approach used in this study represents bare-earth elevation only and is intended as a widely accessible operational planning tool rather than a complete model of signal propagation. A key limitation of this approach is its exclusion of surface features, which can attenuate or block LOS radio signals in ways a bare-earth profile cannot capture. This limitation is compounded by the coarse resolution of the satellite-derived DEM (1-arc-s, ~30 m), where each pixel represents an average elevation across a 30 m area and cannot resolve features smaller than this. As a result, small but potentially significant terrain features may be smoothed out of the model entirely, limiting its ability to capture the fine-scale terrain variation. Predicted connectivity should therefore be understood as a best-case, terrain-based envelope, rather than a precise representation of the C2 link range.
4.6.3. Ground Truth Sample Limitations
The ground truth assessment of derelict fishing net detectability presented in this study offers a preliminary indication of detection reliability under the specific conditions tested, rather than a definitive measure of performance. Field validation was conducted along an 8 km segment of coastline accessible by 4WD vehicle at the time of survey, with the segment length reflecting seasonal accessibility constraints rather than a deliberate feature of the survey design. As such, the resulting sample does not capture the full range of terrain and net exposure conditions present across the study area and may under-represent net detectability along more complex stretches of coastline, such as rocky headlands and shorelines. Future validation incorporating a larger and more geomorphologically diverse sample would help establish whether detection performance holds under the more variable conditions characteristic of coastal environments.
4.7. Future Applications
Future applications may benefit from the use of fixed-wing VTOL platforms and automated detection workflows to enhance operational capacity and detection efficiency. Small fixed-wing VTOL platforms, which combine the extended range and endurance of fixed-wing aircraft with the vertical take-off and landing capability of multirotors, could increase transect length per mission while reducing the launch and landing site limitations encountered in this study, albeit with additional remote pilot licensing requirements and greater logistical demand. However, the resulting increase in transect length and survey area would also substantially increase the volume of imagery collected per mission, placing greater demand on manual review capacity unless paired with more efficient interpretation methods.
Although automated detection was not the objective of this study, deep learning-based object detection methods are increasingly being applied to marine debris identification, with promising results reported in prior studies [17,18,19,42,49]. Integrating such models into the proposed BVLOS workflow could substantially reduce the manual image review burden associated with large-scale coastal surveys, enabling near-real-time detection outputs. This would be particularly valuable in the remote and time-sensitive contexts this framework is designed for, where reducing the interval between data collection and actionable on-ground response could improve the likelihood of successful net recovery before further ecological damage or drift occurs. Together, these developments would increase the area surveyed per mission and reduce the time between data collection and on-ground response.
5. Conclusions
This case study showed that BVLOS UAV surveys offer a practical solution for large-scale image acquisition in remote coastal areas. It demonstrated that the operational, communication, and detection requirements for effective low-altitude BVLOS coastal surveys can be met under real-world field conditions, offering both baseline data and a replicable methodology for programs targeting derelict fishing nets and other gear at large scales. DEM-based communication viewshed modelling, incorporating first Fresnel zone clearance, helped predict where C2 link connectivity was likely to be maintained, supporting pre-flight risk assessment, GCS placement, and mission design. However, its reliance on bare-earth elevation data and a 2D approximation of signal propagation means it should only be used as an operational planning tool. Compared with a simulated VLOS operational scenario, BVLOS reduced the mission effort required for equivalent coverage, easing the logistical burden of surveying extended coastline segments that would otherwise require disproportionate ground support. Despite these operational advantages, the main barriers to wider adoption are regulatory and institutional rather than technical and addressing these through shared operational models will be as crucial as continued development of UAV platforms, longer-range or multi-path C2 systems, and automated data processing workflows for larger-scale or time-sensitive applications.
Supplementary Materials
The following supporting information can be downloaded at: https://www.mdpi.com/article/10.3390/drones10080625/s1, Table S1: BVLOS UAV mission completion summary (C = Completed, A = Aborted, IC-R = Incomplete—Redirected in flight, IC-A = Incomplete—Aborted in flight); Shape-Files S2: Complete BVLOS UAV survey coverage.
Author Contributions
Conceptualisation, A.H., H.A.C. and A.R.; methodology, A.H.; validation, A.H. and A.R.; formal analysis, A.H.; investigation, A.H.; resources, A.R.; data curation, A.H.; writing—original draft preparation, A.H.; writing—review and editing, H.A.C. and A.R.; visualisation, A.H.; supervision, H.A.C.; project administration, A.H.; funding acquisition, H.A.C. and A.R. All authors have read and agreed to the published version of the manuscript.
Funding
This research was funded by the Australian Government Ghost Net Innovation Solutions Program (grant number: GN10043).
Data Availability Statement
The aerial data collected in this study are not publicly available due to ethical and cultural restrictions. This imagery is subject to Indigenous data governance arrangements, and access is determined by the Anindilyakwa Land Council. Requests for access should be directed to the corresponding author and will be considered in accordance with these governance processes.
Acknowledgments
This research was undertaken on the traditional lands of the Anindilyakwa people. We pay our respects to Elders past and present and recognise their ongoing connection to Sea Country. We thank the Traditional Owners of the Anindilyakwa Indigenous Protected Area for their collaboration and knowledge throughout this project, as well as the key staff of the Anindilyakwa Land Council. We also thank Benjamin McArdle from the Anindilyakwa Rangers for his operational support.
Conflicts of Interest
The authors declare no conflicts of interest.
Abbreviations
The following abbreviations are used in this manuscript:
| 4WD | Four Wheel Drive vehicle |
| ALDFG | Abandoned, Lost, or otherwise Discarded Fishing Gear |
| BVLOS | Beyond Visual Line of Sight |
| C2 | Command-and-Control |
| CASA | Civil Aviation Safety Authority |
| DEM | Digital Elevation Model |
| DSM | Digital Surface Model |
| GCS | Ground Control Station |
| GPS | Global Positioning System |
| IPA | Indigenous Protected Area |
| LOS | Line of Sight |
| PPK | Post-Processed Kinematic |
| SORA | Specific Operations Risk Assessment |
| UAV | Uncrewed Aerial Vehicle |
| VLOS | Visual Line of Sight |
References
- Stelfox, M.; Hudgins, J.; Sweet, M. A review of ghost gear entanglement amongst marine mammals, reptiles and elasmobranchs. Mar. Pollut. Bull. 2016, 111, 6–17. [Google Scholar] [CrossRef] [Scilit] [PubMed]
- UNEP. From Pollution to Solution: A Global Assessment of Marine Litter and Plastic Pollution; UNEP: New York, NY, USA, 2021. [Google Scholar]
- Gilman, E.; Musyl, M.; Suuronen, P.; Chaloupka, M.; Gorgin, S.; Wilson, J.; Kuczenski, B. Highest risk abandoned, lost and discarded fishing gear. Sci. Rep. 2021, 11, 7195. [Google Scholar] [CrossRef] [Scilit]
- Richardson, K.; Hardesty, B.D.; Vince, J.; Wilcox, C. Global estimates of fishing gear lost to the ocean each year. Sci. Adv. 2022, 8, eabq0135. [Google Scholar] [CrossRef] [Scilit] [PubMed]
- Chassignet, E.P.; Xu, X.; Zavala-Romero, O. Tracking Marine Litter With a Global Ocean Model: Where Does It Go? Where Does It Go? Where Does It Come From? Front. Mar. Sci. 2021, 8, 667591. [Google Scholar] [CrossRef] [Scilit]
- McCoy, K.S.; Huntington, B.; Kindinger, T.L.; Morioka, J.; O’Brien, K. Movement and retention of derelict fishing nets in Northwestern Hawaiian Island reefs. Mar. Pollut. Bull. 2022, 174, 113261. [Google Scholar] [CrossRef] [Scilit] [PubMed]
- Patterson, R.G.; Wolanski, E.; Groom, R.; Critchell, K.; Playford, L.; Grubert, M.; Kennett, R.; Tait, H.; Udyawer, V.; Lambrechts, J.; et al. Improving certainty in marine ecosystems: A biophysical modelling approach in the remote, data-limited Gulf of Carpentaria. Estuar. Coast. Shelf Sci. 2023, 283, 108254. [Google Scholar] [CrossRef] [Scilit]
- Biermann, L.; Clewley, D.; Martinez-Vicente, V.; Topouzelis, K. Finding Plastic Patches in Coastal Waters using Optical Satellite Data. Sci. Rep. 2020, 10, 5364. [Google Scholar] [CrossRef] [Scilit]
- Pichel, W.G.; Veenstra, T.S.; Churnside, J.H.; Arabini, E.; Friedman, K.S.; Foley, D.G.; Brainard, R.E.; Kiefer, D.; Ogle, S.; Clemente-Colon, P.; et al. GhostNet marine debris survey in the Gulf of Alaska--satellite guidance and aircraft observations. Mar. Pollut. Bull. 2012, 65, 28–41. [Google Scholar] [CrossRef] [Scilit]
- Garcia-Garin, O.; Aguilar, A.; Borrell, A.; Gozalbes, P.; Lobo, A.; Penades-Suay, J.; Raga, J.A.; Revuelta, O.; Serrano, M.; Vighi, M. Who’s better at spotting? A comparison between aerial photography and observer-based methods to monitor floating marine litter and marine mega-fauna. Environ. Pollut. 2020, 258, 113680. [Google Scholar] [CrossRef] [Scilit]
- Hardesty, B.D.; Roman, L.; Duke, N.C.; Mackenzie, J.R.; Wilcox, C. Abandoned, lost and discarded fishing gear ‘ghost nets’ are increasing through time in Northern Australia. Mar. Pollut. Bull. 2021, 173, 112959. [Google Scholar] [CrossRef] [Scilit]
- Moy, K.; Neilson, B.; Chung, A.; Meadows, A.; Castrence, M.; Ambagis, S.; Davidson, K. Mapping coastal marine debris using aerial imagery and spatial analysis. Mar. Pollut. Bull. 2018, 132, 52–59. [Google Scholar] [CrossRef] [Scilit]
- Andriolo, U.; Garcia-Garin, O.; Vighi, M.; Borrell, A.; Gonçalves, G. Beached and Floating Litter Surveys by Unmanned Aerial Vehicles: Operational Analogies and Differences. Remote Sens. 2022, 14, 1336. [Google Scholar] [CrossRef] [Scilit]
- Makumbura, R.K.; Gibney, E.; Nash, R.; Dooly, G.; Duraibabu, D.B. A systematic review of unmanned aerial vehicles (UAVs) for coastal ecosystem monitoring. Sci. Remote Sens. 2026, 13, 100438. [Google Scholar] [CrossRef] [Scilit]
- Escobar-Sánchez, G.; Haseler, M.; Oppelt, N.; Schernewski, G. Efficiency of Aerial Drones for Macrolitter Monitoring on Baltic Sea Beaches. Front. Environ. Sci. 2021, 8, 560237. [Google Scholar] [CrossRef] [Scilit]
- Goncalves, G.; Andriolo, U.; Pinto, L.; Bessa, F. Mapping marine litter using UAS on a beach-dune system: A multidisciplinary approach. Sci. Total Environ. 2020, 706, 135742. [Google Scholar] [CrossRef] [Scilit]
- Song, K.; Jung, J.-Y.; Lee, S.H.; Park, S.; Yang, Y. Assessment of Marine Debris on Hard-to-Reach Places Using Unmanned Aerial Vehicles and Segmentation Models Based on a Deep Learning Approach. Sustainability 2022, 14, 8311. [Google Scholar] [CrossRef] [Scilit]
- Takaya, K.; Shibata, A.; Mizuno, Y.; Ise, T. Unmanned aerial vehicles and deep learning for assessment of anthropogenic marine debris on beaches on an island in a semi-enclosed sea in Japan. Environ. Res. Commun. 2022, 4, 015003. [Google Scholar] [CrossRef] [Scilit]
- Martin, C.; Zhang, Q.; Zhai, D.; Zhang, X.; Duarte, C.M. Enabling a large-scale assessment of litter along Saudi Arabian red sea shores by combining drones and machine learning. Environ. Pollut. 2021, 277, 116730. [Google Scholar] [CrossRef] [Scilit] [PubMed]
- Adade, R.; Aibinu, A.M.; Ekumah, B.; Asaana, J. Unmanned Aerial Vehicle (UAV) applications in coastal zone management-a review. Environ. Monit. Assess. 2021, 193, 154. [Google Scholar] [CrossRef] [Scilit] [PubMed]
- Pfeifer, C.; Barbosa, A.; Mustafa, O.; Peter, H.-U.; Rümmler, M.-C.; Brenning, A. Using Fixed-Wing UAV for Detecting and Mapping the Distribution and Abundance of Penguins on the South Shetlands Islands, Antarctica. Drones 2019, 3, 39. [Google Scholar] [CrossRef] [Scilit]
- van der Sluijs, J.; Saiet, E.; Bakelaar, C.N.; Wentworth, A.; Fraser, R.H.; Kokelj, S.V. Beyond visual-line-of-sight (BVLOS) drone operations for environmental and infrastructure monitoring: A case study in northwestern Canada. Drone Syst. Appl. 2023, 11, 1–15. [Google Scholar] [CrossRef] [Scilit]
- Wood, K.; Liu, E.J.; Richardson, T.; Clarke, R.; Freer, J.; Aiuppa, A.; Giudice, G.; Bitetto, M.; Mulina, K.; Itikarai, I. BVLOS UAS Operations in Highly-Turbulent Volcanic Plumes. Front. Robot. AI 2020, 7, 549716. [Google Scholar] [CrossRef] [Scilit] [PubMed]
- Zmarz, A.; Karlsen, S.R.; Kycko, M.; Korczak-Abshire, M.; Gołębiowska, I.; Karsznia, I.; Chwedorzewska, K. BVLOS UAV missions for vegetation mapping in maritime Antarctic. Front. Environ. Sci. 2023, 11, 1154115. [Google Scholar] [CrossRef] [Scilit]
- Zmarz, A.; Rodzewicz, M.; Dąbski, M.; Karsznia, I.; Korczak-Abshire, M.; Chwedorzewska, K.J. Application of UAV BVLOS remote sensing data for multi-faceted analysis of Antarctic ecosystem. Remote Sens. Environ. 2018, 217, 375–388. [Google Scholar] [CrossRef] [Scilit]
- Fang, S.; O’Young, S.; Rolland, L. Development of Small UAS Beyond-Visual-Line-of-Sight (BVLOS) Flight Operations: System Requirements and Procedures. Drones 2018, 2, 13. [Google Scholar] [CrossRef] [Scilit]
- Khawaja, W.; Guvenc, I.; Matolak, D.W.; Fiebig, U.-C.; Schneckenburger, N. A Survey of Air-to-Ground Propagation Channel Modeling for Unmanned Aerial Vehicles. IEEE Commun. Surv. Tutor. 2019, 21, 2361–2391. [Google Scholar] [CrossRef] [Scilit]
- Zeng, Y.; Zhang, R.; Lim, T.J. Wireless communications with unmanned aerial vehicles: Opportunities and challenges. IEEE Commun. Mag. 2016, 5, 36–42. [Google Scholar] [CrossRef] [Scilit]
- Baek, J.; Choi, Y. Comparison of Communication Viewsheds Derived from High-Resolution Digital Surface Models Using Line-of-Sight, 2D Fresnel Zone, and 3D Fresnel Zone Analysis. ISPRS Int. J. Geo-Inf. 2018, 7, 322. [Google Scholar] [CrossRef] [Scilit]
- El Debeiki, M.; Al-Rubaye, S.; Perrusquía, A.; Conrad, C.; Flores-Campos, J.A. An Advanced Path Planning and UAV Relay System: Enhancing Connectivity in Rural Environments. Future Internet 2024, 16, 89. [Google Scholar] [CrossRef] [Scilit]
- Wang, Y.; Dou, W. Accurate calculation method of terrain viewshed for wireless signal as line of sight. Trans. GIS 2024, 28, 1236–1253. [Google Scholar] [CrossRef] [Scilit]
- Edyvane, K.S.; Penny, S.S. Trends in derelict fishing nets and fishing activity in northern Australia: Implications for trans-boundary fisheries management in the shared Arafura and Timor Seas. Fish. Res. 2017, 188, 23–37. [Google Scholar] [CrossRef] [Scilit]
- Wilcox, C.; Hardesty, B.D.; Sharples, R.; Griffin, D.A.; Lawson, T.J.; Gunn, R. Ghostnet impacts on globally threatened turtles, a spatial risk analysis for northern Australia. Conserv. Lett. 2013, 6, 247–254. [Google Scholar] [CrossRef] [Scilit]
- Civil Aviation Safety Authority (CASA). Applicant Response—BVLOS Operations in Remote Australian Airspace (Below 400 ft AGL). Available online: https://www.casa.gov.au/applicant-response-bvlos-operations-remote-australian-airspace-below-400-ft-agl (accessed on 21 August 2023).
- Civil Aviation Safety Authority (CASA). Part 101 (Unmanned Aircraft and Rockets) Manual of Standards 2019 (As Amended); CASA: Canberra, Australia, 2024. [Google Scholar]
- Esri. ArcGIS Pro, 3.6.1; Environmental Systems Research Institute: Redlands, CA, USA, 2025.
- R Core Team. R: A Language and Environment for Statistical Computing, 4.5.3; R Foundation for Statistical Computing: Vienna, Austria, 2025.
- Christensen, R.H.B. Ordinal: Regression Models for Ordinal Data. 2025. Available online: https://cran.r-project.org/web/packages/ordinal/index.html (accessed on 3 March 2026).
- Fox, J.; Monette, G. Generalized Collinearity Diagnostics. J. Am. Stat. Assoc. 1992, 87, 178–183. [Google Scholar] [CrossRef]
- Lüdecke, D.; Ben-Shachar, M.S.; Patil, I.; Waggoner, P.; Makowski, D. An {R} Package for Assessment, Comparison and Testing of Statistical Models. J. Open Source Softw. 2021, 6, 3139. [Google Scholar] [CrossRef] [Scilit]
- Bartoń, K. MuMIn: Multi-Model Inference. 2026. Available online: https://cran.r-project.org/web/packages/MuMIn/index.html (accessed on 3 March 2026).
- Burnham, K.P.; Anderson, D.R. Model Selection and Multimodel Inference: A Practical Information-Theoretic Approach, 2nd ed.; Springer: New York, NY, USA, 2002. [Google Scholar]
- Kassambara, A. rstatix: Pipe-Friendly Framework for Basic Statistical Tests. 2025. Available online: https://cran.r-project.org/web/packages/rstatix/index.html (accessed on 3 March 2026).
- Mikita, T.; Janošíková, L.; Caha, J.; Avoiani, E. The Potential of UAV Data as Refinement of Outdated Inputs for Visibility Analyses. Remote Sens. 2023, 15, 1028. [Google Scholar] [CrossRef] [Scilit]
- Orlof, J.; Ozimek, P.; Labedz, P.; Widlak, A.; Ozimek, A. Generating viewsheds based on the Digital Surface Model (DSM) and point cloud. PLoS ONE 2024, 19, e0312146. [Google Scholar] [CrossRef] [Scilit] [PubMed]
- JARUS. JARUS Guidelines on Specific Operations Risk Assessment (SORA); Joint Authorities for Rulemaking on Unmanned Systems (JARUS): Vienna, Austria, 2024. [Google Scholar]
- Civil Aviation Safety Authority (CASA). Broad Area BVLOS Operations: Temporary Management Instruction 2025-03 (Version 1.0, CASA-03-7110); CASA: Canberra, Australia, 2025. [Google Scholar]
- Civil Aviation Safety Authority (CASA). RPAS and AAM Strategic Regulatory Roadmap 2024 (Version 2.1); CASA: Canberra, Australia, 2025. [Google Scholar]
- Winans, W.R.; Chen, Q.; Qiang, Y.; Franklin, E.C. Large-area automatic detection of shoreline stranded marine debris using deep learning. Int. J. Appl. Earth Obs. Geoinf. 2023, 124, 103515. [Google Scholar] [CrossRef] [Scilit]

Disclaimer/Publisher’s Note: The statements, opinions and data contained in all publications are solely those of the individual author(s) and contributor(s) and not of MDPI and/or the editor(s). MDPI and/or the editor(s) disclaim responsibility for any injury to people or property resulting from any ideas, methods, instructions or products referred to in the content. |
© 2026 by the authors. Licensee MDPI, Basel, Switzerland. This article is an open access article distributed under the terms and conditions of the Creative Commons Attribution (CC BY) license.