


Highlights
What are the main findings?
- Willingness to pay was the strongest predictor of drone delivery acceptance.
- OLR provided a strong ordinal baseline, while ML models and LLM-derived sentiment added complementary predictive value.
What are the implications of the main finding?
- Rural drone delivery should prioritize affordable and equitable same-day service.
- Open-ended sentiment can complement structured survey measures when evaluating rural acceptance.
Abstract
While drone delivery has gained significant scholarly and industrial interest, rural residents’ acceptance of these systems remains underexplored, despite the region’s acute logistics challenges and service inequities. Using survey data from rural U.S. residents, this study first estimates an ordered logistic regression (OLR) model to identify factors associated with five-level drone delivery acceptance. The study then compares OLR, multinomial logistic regression (MNL), Random Forest (RF), XGBoost, and LightGBM under matched feature sets to evaluate whether nonlinear machine-learning models improve prediction beyond the interpretable statistical baseline. Open-ended responses are coded into LLM-derived sentiment labels and added as supplementary predictors to test whether unstructured feedback improves acceptance prediction. Results show that willingness to pay is the strongest predictor of acceptance, while equitable same-day delivery demand and post-pandemic attitude adjustment are also positively associated with higher acceptance. Household disability status and urban accessibility are not significant after adjustment. In the five-level analysis, OLR provides a strong ordinal baseline, while XGBoost and other tree-based models improve selected class-level prediction metrics. In the binary high-acceptance analysis, machine-learning models show stronger predictive performance, especially when structured predictors are combined with sentiment features. This study contributes to rural drone-delivery literature by linking service equity, perceived value, and LLM-derived sentiment within a comparable statistical and machine-learning framework for rural service design.
1. Introduction
The COVID-19 pandemic has accelerated the shift in shopping behaviors toward e-commerce. Consumers are increasingly turning to online shopping for its convenience and speed [1,2,3]. The surge in e-commerce has pushed the global logistics market to new heights, reaching US$ 500.76 billion in 2024 (more than double the size in 2020) and is expected to reach US$ 609.59 billion by 2025 and US$ 3721.53 billion by 2034 [4]. Traditional delivery methods relying on trucks and drivers struggle to keep up with surging customer demands, particularly for rapid deliveries like same-day service or life-critical medical supplies during the COVID-19 pandemic. In response to these growing logistical challenges, especially in the context of time-sensitive or remote deliveries, drone-based services have emerged as a promising alternative.
Major delivery companies and technology giants are exploring drone-based solutions in their delivery services to improve efficiency. Advancements in drone technology, particularly fixed-wing drones and electric vertical takeoff and landing (eVTOL) aircraft, hold immense potential for revolutionizing urban and rural logistics [5]. Drones not only deliver critical medical supplies quickly in emergencies [6] but also enable same-day delivery of lightweight packages over long distances for everyday purchases [7,8]. Examples of such services include Amazon Prime Air drone delivery [9] and Walmart and Wing drone delivery [10].
On the policy side, to support this technological leap, the Federal Aviation Administration (FAA) has started to clear some regulations for drone operators to safely fly their aircraft over the horizon without visual spotters, allowing for longer-range deliveries. The recent release of the Unmanned Aircraft Systems (UAS) Beyond Visual Line-of-Sight Operations authorized three companies—Phoenix Air Unmanned, Uavionix, and UPS Flight Forward—to develop their drone delivery plan under new regulations [11]. In June 2025, the White House issued an executive order focused on promoting U.S. innovation in drone and eVTOL technology [12]. With advancements in technologies and regulations, drone delivery is poised to accelerate and reshape the future of logistics.
Spurred by the surge in e-commerce demand, maturing technology, and loosening regulatory barriers, drone delivery is becoming an increasingly viable solution. Although drone-based services are increasingly studied in both urban and rural contexts, systematic evidence regarding rural adoption remains limited, particularly within U.S. consumer markets. Rural areas often face unique logistical, infrastructural, and demographic challenges that differ significantly from urban contexts. Varied road conditions and long travel distances often render traditional delivery methods slow and costly. During the COVID-19 pandemic, for instance, many rural residents were forced to retrieve packages from distant central hubs or endure delays exceeding eight hours due to poor road conditions and long travel distances. Overwhelmed rural post offices struggled to manage the surge in e-commerce shipments, resulting in critical delays for essential items such as medicine, tax rebates, and important documents [13]. To overcome these logistical barriers, drone delivery has the potential to transform rural logistics, ensuring that rural residents enjoy the same fast and convenient delivery options as their urban counterparts. In recognition of this potential, companies such as Wingcopter [14] and Zipline [15] have launched pilot programs in rural regions to assess service feasibility and market readiness.
While much attention has been devoted to technical feasibility and pilot deployments, far less is known about how rural communities perceive and accept this emerging technology. Despite growing demand for rural logistics and the promise of drone delivery, understanding residents’ acceptance remains limited. This oversight is likely attributed to factors such as scattered population, long distances involved, and higher delivery costs, which together contribute to a lower return on investment (ROI) in rural areas compared to urban counterparts [16,17]. As drone delivery services begin to reshape the logistics landscape, particularly in underserved regions, it becomes increasingly important to examine the attitudes, perceptions, and willingness of rural residents to adopt this emerging mode of delivery [18,19].
Building on these motivations, this study seeks to examine rural residents’ acceptance of drone-based delivery services by addressing the following four research questions: (1) What factors influence rural residents’ acceptance of drone delivery? (2) Has the COVID-19 pandemic affected their perceptions of drone delivery? (3) Would the availability of same-day delivery options impact their acceptance? (4) Does the presence of a household member with a disability affect their acceptance?
To investigate these questions, the study designed a survey and developed an LLM-enhanced empirical framework. To mitigate potential cognitive biases associated with unfamiliar technologies like drone delivery, as discussed by Kinsey et al. [20], the questionnaire included both structured survey items and an open-ended question that allowed respondents to express their personal views on drone delivery services. The LLM is used as a feature-extraction tool to classify open-ended responses into sentiment categories, while OLR, MNL, RF, XGBoost, and LightGBM are used to evaluate acceptance prediction under comparable feature sets. This design combines the interpretability of statistical models with the predictive flexibility of machine-learning methods [21,22].
The remainder of this paper is structured as follows. Section 2 reviews the literature on customer acceptance of drone delivery services. Section 3 presents the data collection process, survey variables, urban accessibility measure, and the OLR, MNL, RF, XGBoost, and LightGBM modeling approaches. Section 4 reports the OLR results and compares structured-only and sentiment-augmented prediction models. Section 5 discusses key insights and their implications for rural service equity and drone delivery design. Finally, Section 6 concludes by summarizing the study’s contributions and identifying directions for future research.
2. Literature Review
2.1. Factors Influencing Drone Delivery Acceptance
Drone technology advancement has sparked significant research into customer demand analysis and delivery route optimization. Historically, many studies concentrated on drone delivery in urban areas [23,24], reflecting dense customer demand [25] and the intensive study of urban airspace operations [26]. Drone delivery demand analysis serves as a foundation for solving the drone delivery optimization problem. Traditional demand analysis methodologies are built upon surveying methods and statistical models to identify key factors influencing customer choices between truck and drone delivery. For example, Otto et al. [27] conducted a comprehensive survey of current and future applications of drone technologies, emphasizing the need for detailed strategic planning, such as determining drone fleet sizes and evaluating potential economic and social values in real-world scenarios.
Customers often have concerns about adopting drone delivery in urban areas, considering factors like delivery fees [28], equity [29,30], attitudes towards service quality [31], the impact of the pandemic [32], disability [33,34], and environmental friendliness [35]. To explore the feasibility and practicality of drone technology, existing literature has investigated the acceptance of drone-based delivery and its cost-effectiveness for companies. From a consumer perspective, people generally hold a positive attitude toward drone delivery services [36,37]. To meet and respond to consumer demand, retailers have conducted cost-benefit analyses and evaluated delivery efficiency for actual retail operations [38]. They found that drone-related delivery can reduce route costs compared to truck-only delivery and satisfy delivery demand with fewer routes, especially in suburban areas [39].
Although several studies have started to optimize drone delivery routing or cooperative truck-drone delivery problems, they often do not identify which customer groups or socio-economic features affect the adoption of drone delivery. This limitation leads to uncertain demand assumptions [40] and idealized, complex delivery optimization models [41,42,43] for large-scale networks that may not be useful for drone delivery. While there have been significant achievements in drone-based delivery optimization [44,45,46,47], few studies focus on potential changes in the drone delivery market and specific customer group clustering, especially in rural areas [48] post-COVID-19 [49]. This research gap is often due to the lack of accurate customer acceptance identification methods and updated rural logistics market demand information for drones.
Recent research and practice increasingly address rural drone delivery directly. Tadić et al. [50] identify regulatory, liability, privacy, cultural, and insurance barriers to rural applications, while Wu et al. [51] show that the determinants of consumer acceptance differ between urban and rural settings. Broader acceptance research also emphasizes perceived usefulness, ease of use, and privacy concerns in logistics transformation [52]. Thus, the remaining gap is not the absence of rural drone-delivery research, but the limited U.S.-specific evidence on how rural residents evaluate service value, delivery equity, product needs, and open-ended feedback.
2.2. Approaches to Technology Acceptance
For emerging technologies such as drone delivery, customers vary in their perceptions of innovation [53], perceived risk, benefit, and trust [54]. These perceptions are further shaped by attitudinal and behavioral factors [55]. Technology acceptance theories provide a useful foundation for studying emerging delivery technologies. TAM emphasizes perceived usefulness and ease of use, TPB highlights attitudes and perceived behavioral control, and UTAUT/UTAUT2 incorporate broader factors such as performance expectancy, facilitating conditions, and price value [56,57,58,59]. These frameworks suggest that drone delivery acceptance may be shaped by perceived service value, affordability, expected benefits, and household constraints. However, because this survey was designed around rural logistics and service-equity concerns rather than as a full test of a single acceptance theory, this study adopts a theory-informed exploratory framework instead of a formal TAM, TPB, or UTAUT model.
Current methods of analyzing customer acceptance of drone delivery are limited. Traditional regression models, discrete choice models [35,60,61], and structural equation models have been widely used to identify homogeneous groups of potential drone adopters and examine associations among key factors, including safety, trust, regulations, and psychological and environmental concerns [49,62,63,64]. These models are valuable for interpretation, but they may be limited when the goal is out-of-sample prediction or when the relationship between survey variables and acceptance is nonlinear. Machine-learning methods such as RF, XGBoost, and LightGBM provide complementary tools for assessing predictive performance and potential interactions across structured and textual features [65,66,67,68].
Also, survey respondents may misunderstand questions or graded response options, such as those used on Likert-type scales [69]. Factors including limited education and cognitive capabilities can prevent people from clearly expressing their attitudes [70]. Cognitive biases may also affect survey data collection and subsequent modeling [20,71]. To mitigate these issues, it is essential to include open-ended questions in questionnaires, allowing respondents to express their sentiments [72,73], concerns [74], or personal experiences [75]. This approach helps reduce potential biases, while applying natural language processing to analyze these text responses and extract valuable insights about sentiments towards drone delivery requires further study.
Traditional natural language processing models are often used for sentiment analysis but are limited by their parameters and training corpora, which can restrict their ability to understand complex technological developments and long-text emotional responses. This limitation can lead to suboptimal outcomes in areas like financial sentiment analysis [76,77]. With the rapid development of LLMs [78,79] and machine learning methods [80,81,82], advanced language models like ChatGPT-4o [83], LaMDA [84], and LLaMA [85] have achieved remarkable success in various fields, including transportation [86,87,88,89], due to their advanced language interaction and flexible interpretation capabilities. However, how LLM-derived sentiment can be combined with theory-guided structured survey variables to understand rural drone delivery acceptance remains unclear. Further research is needed to examine whether sentiment extracted from open-ended responses adds predictive value beyond conventional survey measures.
Recent research also caution that LLM-based sentiment labels may vary across models and tasks. Bojić et al. [90] compared several LLMs with human annotators and found that reliability depends on the content-analysis dimension. This supports the practice of validating LLM outputs and comparing performance across models when constructing research features.
2.3. Research Focus
Despite growing research on rural drone applications, evidence regarding U.S. consumer acceptance remains limited, creating a critical gap in our understanding of adoption drivers. The literature review in previous sections clearly indicates that few studies address rural residents’ acceptance of drone delivery. Consequently, understanding the factors influencing these residents’ attitudes toward drone adoption in rural areas remains limited. Moreover, traditional regression models face limitations in predictive accuracy and in capturing the richness of textual data—gaps that can be more effectively addressed using modern machine learning techniques and LLMs.
To address this gap, this study adopts a theory-informed exploratory framework tailored to rural drone delivery acceptance. Because drone delivery remains an emerging service and many rural residents have limited direct experience with it, the study does not test a single formal technology-acceptance model. Instead, it focuses on four mechanisms that are especially relevant to rural logistics and service equity: perceived service value, post-pandemic delivery attitude change, perceived fairness in same-day delivery access, and household accessibility needs. These mechanisms are operationalized through four focal predictors: willingness to pay a premium, post-pandemic attitude adjustment, opinion on equitable same-day delivery, and household disability or mobility limitation. Building on these insights, this study examines whether rural residents’ acceptance of drone delivery is associated with the following four key factors:
- 1.
- Willingness to pay a premium for drone delivery.
- 2.
- Attitudinal changes influenced by the COVID-19 pandemic.
- 3.
- Perceived fairness and demand for same-day delivery.
- 4.
- Physical disability or mobility limitations in the household.
On the methodological side, this study integrates structured survey responses, LLM-derived sentiment from open-ended comments, and comparable statistical and machine-learning models. The LLM is used as a feature-extraction tool to classify open-ended responses into sentiment categories, while OLR, MNL, RF, XGBoost, and LightGBM are used to evaluate acceptance prediction under matched feature sets. This design allows the study to examine whether LLM-derived sentiment adds predictive value beyond theory-guided structured survey variables, while preserving the interpretability of traditional statistical models.
To the best of our knowledge, this study is the first to integrate customers’ explicit acceptance (derived from conventional survey questions) and latent sentiment (extracted from open-ended questions) toward adopting drone delivery in rural areas post-pandemic, utilizing an LLM-powered machine learning approach.
3. Method
3.1. Survey Description
This research explores how rural residents in the U.S. feel about the potential adoption of drone delivery services after the COVID-19 pandemic. A total of 524 participants, recruited from the Qualtrics online panel, completed the study hosted on the Qualtrics XM platform in July 2023. All participants reside in rural areas of the United States. Although the survey was conducted in 2023, the data remain relevant because drone delivery is still an emerging and unevenly deployed service, especially for rural consumer markets [91,92]. Since the survey period, regulatory and commercial activity has increased, including progress toward beyond-visual-line-of-sight operations and expanded pilot deployments, but routine drone delivery remains limited to selected service areas rather than broadly available rural coverage. Therefore, the 2023 survey provides a useful baseline of rural residents’ stated acceptance before large-scale rural deployment.
After removing incomplete surveys, our final analysis included data from 512 participants. The geographic distribution of these participants is shown in Figure 1 with their locations represented as dots.
Figure 1.
Geographic distribution of survey respondents.
The survey was designed to explore the potential of drone delivery in enhancing accessibility and spatial equity within smart logistics systems in rural areas. Our study investigates respondents’ perceptions of delivery experiences in their rural settings through two major sections: drone delivery-related questions and socio-demographic inquiries. Recognizing that respondents may have additional emotional insights beyond the structured survey questions, an open-ended question was included to gather novel ideas. A summary of statistical indices related to socio-demographic data is provided in Table A1 in Appendix A.
3.2. Modeling Approach
This research investigates the factors that influence rural residents’ acceptance of drone delivery services, with the goal of improving predictive accuracy for this target market and supporting the effective adoption and development of drone-based logistics. The dependent variable, i.e., rural acceptance of drone delivery, is measured on a five-point Likert ordinal scale: “Not at all,” “A little,” “Some,” “Much,” and “Very much.” The distribution of the five acceptance levels is illustrated in Figure 2.
Figure 2.
Rural respondents’ acceptance of drone delivery services.
To account for the ordinal nature of this response variable, the study first employs the classical ordinal logistic regression (OLR) model as a benchmark. The OLR model estimates associations between the focal predictors and the likelihood of being in a higher acceptance category. The analysis then compares OLR with MNL and three tree-based machine-learning classifiers, RF, XGBoost, and LightGBM, to evaluate whether alternative modeling approaches improve out-of-sample prediction under matched feature sets.
However, rural respondents’ understanding of drone delivery may be shaped by subjective perceptions and diverse educational backgrounds, factors not easily captured by structured survey responses. To uncover deeper insights, this study incorporates an open-ended question inviting participants to describe their thoughts in their own words. These free-text responses are coded into sentiment categories using an LLM and then added as supplementary features. The following sections detail the OLR model, LLM-derived sentiment coding, and comparable statistical and machine-learning framework.
3.2.1. Ordinal Logistic Regression Model
To explore the association between delivery-related independent variables and acceptance categories, it necessitates an evaluation of the importance of each variable in influencing these acceptance categories. The interaction between independent variables and acceptance level of accessible drone delivery services is established through cross-tabulations based on actual frequency observations, which intuitively reveal the contribution of different independent variables to specific acceptance categories. The Ordinal Logistic Regression (OLR) model is then used to fit the relationship between the dependent variable and the related independent variables.
Before fitting the OLR model, certain assumptions must be met to ensure its validity. These include tests for multicollinearity, parallel lines, the significance of the regression model, and the significance of the regression coefficients [93].
The variables used in the OLR model include ordinal, categorical, and continuous predictors. The three focal Likert predictors (i.e., willingness to pay a premium, post-pandemic attitude adjustment, and opinion on equitable same-day delivery) are coded as ordinal numeric variables in the main model. Nominal variables, such as gender, household disability status, and occupation, are converted into dummy variables with one omitted reference category.
Let denote the ordinal response categories for drone delivery acceptance, and let represent the vector of explanatory variables. The OLR model estimates the cumulative log-odds of a response falling at or below a given threshold j, conditioned on .
Unlike multinomial logistic regression, OLR does not select one outcome category as a base reference. Instead, it estimates threshold parameters that separate adjacent cumulative response levels. The cumulative logit model is expressed as [93]:
where is the cumulative probability that acceptance Y does not exceed category j, given predictors ; denotes the threshold parameter for category j; and represents the regression coefficient for explanatory variable . Under the proportional-odds parameterization with a negative sign, a positive coefficient indicates that an increase in increases the likelihood of reporting higher acceptance levels. Exponentiating the coefficients, , yields odds ratios, where values greater than 1 correspond to higher odds of greater acceptance, holding the other variables constant.
3.2.2. LLM-Enhanced LightGBM
In addition to the quantitative ratings collected through the survey, qualitative assessments, i.e., rural residents’ opinions on drone-based services, were gathered through open-ended responses. These free-text answers capture natural language expressions that may convey attitudes, concerns, and emotional sentiment not fully revealed through structured survey items. Because traditional OLR cannot directly incorporate raw text, the open-ended responses were transformed into sentiment features before being used in the prediction models.
Among the survey respondents, 259 provided codable open-ended comments about their personal delivery experiences and attitudes toward potential drone delivery services. Responses included comments such as, “This is interesting, but I am new to this possibility and curious as to how it operates,” “Hope they have a good hold on the package and don’t run into any bad weather,” and “I’m unsure about drones at this stage, but I’m sure that is going to be a major direction going forward.”
To extract this information in a scalable and reproducible way, GPT-4o was accessed through the API and prompted to classify each codable response into one of three sentiment categories: positive, neutral, or negative. For the full-sample analysis, respondents without a codable or matched text response were not treated as neutral; instead, they were assigned to a separate “no sentiment available” category. A matched-sentiment subset was also evaluated as a sensitivity analysis using only respondents with positive, neutral, or negative sentiment labels.
GPT-4o was selected pragmatically because, at the time of analysis, it offered strong instruction-following for short contextual texts, structured API output, and efficient batch processing. Classifications were generated with the temperature set to 0.0 to reduce stochastic variation. The study did not benchmark GPT-4o against all available LLMs; therefore, model choice is treated as a methodological limitation, and cross-model comparison is recommended for future research [90].
Prior to processing, open-ended responses were de-identified and isolated from the survey dataset. No personal identifiers, demographics, or metadata were transmitted to the API. Although the IRB-approved protocol (Morgan State University IRB #23/03-0072) permitted sharing de-identified data, it did not explicitly name LLM processing, and no project-specific OpenAI Data Processing Agreement was established. Returned sentiment labels were linked to the dataset locally.
The modeling framework compares two main feature sets: structured survey predictors only and structured predictors plus LLM-derived sentiment. The structured predictors are based on the OLR model specification, which includes the four focal factors and key demographic, socioeconomic, occupational, and geographic controls. This design allows the analysis to evaluate whether sentiment extracted from open-ended responses adds predictive value beyond the theory-informed structured survey variables.
Several statistical and machine-learning models are compared under matched feature sets. For the five-level acceptance outcome, OLR is used as the interpretable ordinal baseline, MNL is used as a less restrictive statistical comparison that does not impose the proportional-odds assumption, and RF, XGBoost, and LightGBM are used as machine-learning classifiers. For the binary high-acceptance analysis, BLR is used as the statistical baseline and is compared with RF, XGBoost, and LightGBM [21,94,95].
The LLM-enhanced empirical framework is illustrated in Figure 3. In this framework, the LLM is used only for sentiment feature extraction, while prediction is performed by statistical and machine-learning models.
Figure 3.
LLM-enhanced empirical framework for rural drone delivery acceptance modeling.
The raw survey dataset included various data types, including numerical, categorical, ordinal, nominal, and textual data, which were processed to construct a comprehensive profile of rural respondents. In addition to survey responses, this study introduced an urban accessibility measure to capture each respondent’s spatial proximity to major urban centers. Urban accessibility was calculated as a population-weighted, distance-decay index using respondent coordinates and the top 200 U.S. cities by population. Details of the measure construction are provided in Appendix B.
The final model-comparison analysis uses the OLR with structured predictors as the common baseline. Structured-only models are compared with structured-plus-sentiment models for both the five-level acceptance outcome and the binary high-acceptance outcome. For the full-sample sentiment-augmented analysis, missing or unavailable sentiment is treated as a separate category rather than being assigned to neutral sentiment. A matched-sentiment subset is also reported to examine model performance among respondents with codable sentiment labels.
The dataset was divided into a training set and a test set using an 80/20 split. For five-level acceptance, model performance was evaluated using accuracy, Macro-F1, Macro-AUC, weighted F1, and quadratic weighted kappa. For binary high-acceptance analysis, the acceptance categories were collapsed into high acceptance (“Much” and “Very much”) and lower/moderate acceptance (“Not at all,” “A little,” and “Some”), and performance was evaluated using accuracy, balanced accuracy, Macro-F1, ROC-AUC, PR-AUC, and Cohen’s kappa.
4. Results
4.1. Ordinal Logistic Regression Results
This study selected independent variables for the OLR model based on the conceptual framework and the four focal factors examined in the study. The final model included willingness to pay a premium, post-pandemic attitude adjustment, opinion on equitable same-day delivery, and household disability status, along with key demographic, socioeconomic, occupational, and geographic controls. Specifically, the control variables included gender, age, education, household income, occupation, and the 25-mile urban accessibility index. Household size and vehicle ownership were considered but excluded from the final specification because they were less central to the theoretical framework and did not improve model parsimony or diagnostics. The correlation analysis in Appendix A is therefore used as a descriptive check rather than as the primary basis for selecting model variables.
To ensure that the OLR model was appropriate for the ordered acceptance outcome, it was evaluated using several diagnostic tests. The multicollinearity test showed that all VIF values were within an acceptable range, indicating that serious multicollinearity was not present (Table A3 in Appendix C). The proportional-odds assumption was also satisfied based on the parallel-lines diagnostic (Table A4 in Appendix C). In addition, the likelihood-ratio test was statistically significant, confirming that the model with predictors performed better than the intercept-only model (Table A5 in Appendix C). These results indicate that the OLR model is suitable for analyzing rural residents’ acceptance of drone delivery services.
As shown in Table 1, willingness to pay a premium was the strongest significant predictor of drone delivery acceptance. A one-level increase in willingness to pay was associated with substantially higher odds of being in a higher acceptance category. This suggests that respondents who perceived drone delivery as valuable enough to pay extra for were more likely to accept the service. Opinion on equitable same-day delivery was also positively and significantly associated with acceptance, indicating that respondents who placed greater importance on fair access to delivery services were more likely to support drone delivery. Post-pandemic attitude adjustment was significant as well, although its effect was smaller than the effects of willingness to pay and equitable same-day delivery.
Table 1.
Summary of OLR model Analysis Results.
Some control variables also showed meaningful associations. Several middle-aged groups, especially respondents aged 55–64, had higher odds of acceptance compared with the 18–24 reference group. Education also showed some association, with respondents holding a bachelor’s degree reporting higher acceptance than those in the lowest education reference group. However, household disability status was not statistically significant after adjustment, suggesting that respondents with and without a household disability or mobility limitation did not differ significantly in drone delivery acceptance. Urban accessibility was also not significant, indicating that proximity to major urban centers alone does not explain acceptance after accounting for attitudes, willingness to pay, and demographic factors.
Overall, the OLR model results suggest that rural residents’ acceptance of drone delivery is mainly associated with perceived service value, equity-related delivery attitudes, and post-pandemic changes in delivery expectations. The model provides a parsimonious and interpretable explanation of acceptance while controlling key demographic, socioeconomic, occupational, and geographic characteristics.
The main OLR specification directly operationalizes the four focal mechanisms stated in the research questions and Section 2.3 and supplies the common structured feature set for the subsequent model comparisons. It is therefore retained as the primary inferential model because of its theory-aligned scope, parsimony, and comparability across methods, rather than its statistical fit.
The extended OLR specification in Appendix C adds current same-day delivery accessibility, product-interest indicators, perceived equity impact, employment impact, and perceived well-being improvement. It fits the sample better than the main model (McFadden pseudo- = 0.332 versus 0.256; AIC = 1185.787 versus 1277.425), and several product-interest indicators become statistically significant. These findings are substantively important and indicate that product-specific demand and service-design perceptions add explanatory information beyond the four focal mechanisms. Because the extended model addresses a broader service-design question and does not provide the common feature baseline used in Section 4.2, it is presented as a complementary specification rather than a replacement for the theory-aligned main model.
4.2. LLM-Enhanced Model Comparison
The model-comparison analysis was designed to test whether alternative statistical and machine-learning methods improve prediction beyond the structured OLR model. The structured-only feature set used the same predictors as the OLR model: willingness to pay, post-pandemic attitude adjustment, opinion on equitable same-day delivery, household disability status, gender, age, education, income, occupation, and the 25-mile urban accessibility index. The structured-plus-sentiment feature set added LLM-derived sentiment categories to these same predictors.
Two sentiment specifications were evaluated. The full-sample specification retained all 512 respondents and treated unavailable sentiment as a separate “no sentiment available” category. This conservative approach avoids conflating missing text with neutral sentiment. As a sensitivity check, a matched-sentiment subset was also evaluated using only respondents with positive, neutral, or negative sentiment labels. Because this subset excludes respondents without codable text, it is interpreted as a supplementary sensitivity analysis rather than the primary population-level comparison.
All models were trained on 80% of the data and evaluated on the remaining 20%. The five-level acceptance analysis compared OLR, MNL, RF, XGBoost, and LightGBM using structured-only features and structured-plus-sentiment features. The binary high-acceptance analysis, reported in Appendix D, compared BLR, RF, XGBoost, and LightGBM using the same feature-set logic.
The LLM-derived sentiment labels are therefore evaluated empirically through their incremental predictive value. This design avoids assuming that sentiment extraction is automatically superior; instead, it tests whether adding sentiment improves model performance beyond the theory-guided structured predictors.
As shown in Table 2, for the structured-only five-level outcome, OLR produced the strongest ordinal discrimination and agreement performance, as shown by the highest Macro-AUC and quadratic weighted kappa. XGBoost achieved the highest Macro-F1 and nearly matched OLR in accuracy, indicating that nonlinear machine-learning models can improve class-level predictive balance. These findings support the use of OLR as an interpretable ordinal baseline while justifying ML models as complementary predictive checks.
Table 2.
Five-level acceptance to drone delivery with structured predictors only (full sample with ).
As shown in Table 3, adding sentiment to the full-sample five-level models produced modest changes in predictive performance relative to the structured-only models. OLR continued to show the strongest Macro-AUC and quadratic weighted kappa, suggesting that the ordered structure of the dependent variable remains important even when sentiment features are added. However, the improvement from sentiment was limited in the full sample because nearly half of the respondents did not have codable sentiment and were grouped into a “no sentiment available” category. Thus, sentiment should be interpreted as a supplementary feature rather than a replacement for structured survey predictors.
Table 3.
5-level acceptance to drone delivery with structured predictors plus sentiment (Full sample with ).
As shown in Table 4, the tree-based models performed more strongly in the matched-sentiment subset, in which all respondents had positive, neutral, or negative sentiment labels. RF achieved the highest accuracy and Macro-F1, while XGBoost achieved the highest Macro-AUC and quadratic weighted kappa. This suggests that sentiment features become more informative when actual sentiment labels are available for all included respondents and when nonlinear interactions between sentiment and structured predictors can be captured. Because the matched subset excludes respondents without codable text, these results are treated as sensitivity evidence rather than the main full-sample estimate.
Table 4.
5-level acceptance to drone delivery with structured predictors plus sentiment (Matched-sentiment subset with ).
The five-level results show that OLR remains a strong ordinal baseline, while tree-based ML models provide complementary benefits, particularly when sentiment labels are available. To further evaluate practical adoption, the study also estimates a binary high-acceptance outcome that distinguishes respondents who reported “Much” or “Very much” acceptance from those reporting lower or moderate acceptance. The binary results are reported in Appendix D because they are used as a predictive robustness check rather than the primary inferential model.
The SHAP values in Figure 4 provide a supplementary explanation of how features contribute to high-acceptance predictions in the tree-based models. These values should be interpreted as model-based explanations rather than causal effects. Consistent with the OLR and model-comparison results, willingness to pay, opinion on equitable same-day delivery, post-pandemic attitude adjustment, and sentiment-related features were among the important predictors of acceptance.
Figure 4.
SHAP-based feature impacts on the predicted acceptance of drone delivery: (a) global SHAP summary plot showing the relative importance and directional effects of all model features; (b) SHAP dependence plot for willingness to pay a premium; (c) SHAP dependence plot for post-pandemic attitude adjustment; (d) SHAP dependence plot for opinion on equitable same-day delivery; (e) SHAP dependence plot for LLM-derived sentiment; (f) SHAP dependence plot for occupation; (g) SHAP dependence plot for gender.
The results indicate that rural residents’ acceptance is primarily associated with three focal factors: willingness to pay a premium, post-pandemic attitude adjustment, and perceived demand for equitable same-day delivery. Household disability status was not significant in the OLR model, suggesting that the broad household disability measure may not fully capture mobility-specific delivery needs.
Together, the OLR, model-comparison, and SHAP-based results suggest that rural residents weigh perceived service value, delivery equity, and post-pandemic changes in delivery expectations when evaluating drone delivery. Sentiment extracted from open-ended responses adds useful supplementary information, especially among respondents with codable text, but the structured survey predictors remain the primary source of stable explanatory and predictive signal.
5. Discussion
5.1. Feature Relationships and Model Interpretation
This section further discusses how key features relate to one another and how they contribute to the interpretation of drone-delivery acceptance. In this discussion, the term “feature” is used for variables in the machine-learning models, while “factor” refers to the same variables in the statistical interpretation. The analysis is intended to support interpretation of the modeling results rather than provide causal evidence.
Figure 5 plots selected feature values on the X-axis and their SHAP values from the tree-based model on the Y-axis. The color scale represents the value of a second feature, allowing the figure to illustrate potential interactions among important predictors.
Figure 5.
Correlation analysis among acceptance-related features: (a) relationship between willingness to pay a premium and its SHAP value, differentiated by opinion on equitable same-day delivery; (b) relationship between opinion on equitable same-day delivery and its SHAP value, differentiated by age group; (c) relationship between household size and its SHAP value, differentiated by opinion on equitable same-day delivery; (d) relationship between household income and its SHAP value, differentiated by LLM-derived sentiment.
The strongest and most consistent pattern concerns willingness to pay a premium. As shown in Figure 5a, respondents with higher willingness to pay tend to have higher SHAP values, indicating stronger predicted acceptance. This pattern is consistent with the OLR result that willingness to pay is the strongest focal predictor. The interaction with opinion on equitable same-day delivery suggests that acceptance is highest when respondents both value fast delivery equity and are willing to pay extra for drone service.
Figure 5b illustrates the relationship between equitable same-day delivery and age. The OLR results showed that several middle-aged groups, especially respondents aged 55–64, had higher odds of acceptance than the 18–24 reference group. This pattern suggests that acceptance may be stronger among working-age and pre-retirement rural residents than among the youngest and oldest respondents.
Figure 5c presents household-level patterns that were explored in the broader machine-learning interpretation. Because household size was not retained in the OLR model, this relationship should be interpreted as descriptive and exploratory. The main model indicates that the core acceptance pattern is better explained by willingness to pay, equitable delivery attitudes, and post-pandemic attitude adjustment.
Figure 5d depicts the relationship between income and predicted acceptance. Income was retained as a key control because willingness to pay may partly reflect ability to pay. The model results indicate that the willingness-to-pay effect remains significant after income is controlled, suggesting that the association reflects perceived service value rather than income alone.
Several variables ranked lower in the model interpretation but remain useful for understanding the rural service context. Education showed some association with acceptance in the OLR model, particularly for respondents with a bachelor’s degree. Urban accessibility, however, was not statistically significant in either the descriptive correlation table or the OLR model, indicating that proximity to major urban centers alone does not explain acceptance after adjusting for service attitudes and demographic characteristics.
Figure 6a illustrates the relationship between education and post-pandemic attitude adjustment. Respondents with higher education levels may be more familiar with emerging technologies and more receptive to delivery innovations, although this pattern is secondary to the stronger focal predictors.
Figure 6.
Dependence relationship analysis among demographic and geographic features: (a) relationship between education and its SHAP value, differentiated by post-pandemic attitude adjustment; (b) relationship between urban accessibility and its SHAP value, differentiated by LLM-derived sentiment; (c) relationship between household disability status and its SHAP value, differentiated by gender.
Regarding urban accessibility in Figure 6b, the analysis treats the 25-mile accessibility index as a geographic control rather than a primary acceptance driver. Although lower urban accessibility may intuitively suggest greater need for drone delivery, the OLR results indicate that this relationship is not statistically significant after adjustment. This suggests that acceptance is driven more by perceived value and delivery-equity attitudes than by proximity to large cities alone.
Household disability status in Figure 6c was also not significant in the multivariable OLR model. This finding should be interpreted cautiously because the survey item measured broad household disability or mobility limitation rather than specific mobility-related barriers. Future surveys should separately measure mobility limitations, difficulty traveling to stores or pharmacies, and whether the disability belongs to the respondent or another household member.
5.2. Occupation Impacts
This paper further investigates the diversity in acceptance of drone delivery and willingness to pay additional costs for fast delivery among individuals from different occupational backgrounds, as depicted in Figure 7. The analysis considers occupation as a control variable because occupational background may reflect differences in work patterns, income stability, technology exposure, and household delivery needs. Occupation was recoded to identify respondents who selected “Other” and specified being disabled or unable to work, allowing the model to distinguish household disability status from the respondent’s own disability-related labor-force status.
Figure 7.
Effect of occupation on acceptance of paid drone delivery.
In the OLR model, most occupation categories were not statistically different from the working/professional reference group. The disabled/unable-to-work occupation category showed lower odds of higher acceptance at the 0.10 significance level. This result differs from the initial expectation that disability-related status would necessarily increase drone-delivery acceptance. One possible explanation is that drone delivery may still be perceived as costly, unfamiliar, or uncertain by respondents facing stronger economic or mobility constraints.
These findings suggest that rural drone delivery should not be framed only as a premium convenience service. Although willingness to pay is the strongest predictor, the importance of equitable same-day delivery indicates that rural residents also evaluate drone delivery through a service-parity lens. For policymakers and logistics providers, this means that pricing, privacy, safety, and accessibility concerns should be addressed together. Service designs that offer transparent pricing, targeted accessibility support, and clear operational safeguards may be more effective than approaches that rely only on technological novelty.
6. Conclusions
Understanding rural residents’ acceptance of drone delivery is increasingly important as e-commerce demand grows, and logistics companies seek to expand drone delivery services in rural areas. Despite growing interest in drone logistics, rural residents’ attitudes toward drone delivery have not been sufficiently investigated. This study addresses that gap by combining a theory-informed exploratory framework with OLR, MNL, RF, XGBoost, LightGBM, and LLM-derived sentiment analysis.
Using survey data from rural U.S. residents, this paper examined four focal factors: (1) willingness to pay a premium for drone delivery, (2) post-pandemic attitude adjustment, (3) perceived fairness and demand for same-day delivery, and (4) household disability or mobility limitation. The OLR model showed that willingness to pay, opinion on equitable same-day delivery, and post-pandemic attitude adjustment were significantly associated with higher acceptance. Household disability status was not significant after adjustment, likely because the available survey item measured broad household disability rather than specific mobility-related needs.
The model-comparison results show that OLR provides a strong interpretable baseline for the five-level ordinal acceptance outcome, while machine-learning models provide complementary predictive benefits. For binary high-acceptance prediction, tree-based models such as XGBoost and LightGBM achieved stronger predictive performance than the statistical baseline. LLM-derived sentiment added modest value in the full sample and became more informative in the matched-sentiment subset, suggesting that open-ended comments contain useful attitudinal signals when codable text is available.
The findings indicate that rural acceptance of drone delivery is shaped primarily by perceived service value and delivery-equity attitudes rather than urban proximity alone. Urban accessibility was not significant after adjustment, suggesting that geographic isolation by itself does not determine acceptance. Instead, residents appear to evaluate drone delivery according to whether it offers practical value, fair access to fast delivery, and a credible response to changing post-pandemic delivery expectations.
Overall, this study provides logistics policymakers and delivery companies with a practical methodology to identify rural customer groups and assess readiness for drone delivery. By combining structured survey variables with LLM-derived sentiment and comparable statistical and machine-learning models, the study demonstrates how heterogeneous survey data can support more inclusive and evidence-based rural service design. The results suggest that future drone delivery programs should address affordability, service equity, safety, privacy, and product-specific delivery needs rather than treating rural markets as homogeneous.
This study has several limitations. First, the survey measures stated acceptance rather than observed adoption behavior, and drone delivery remains unevenly deployed in rural consumer markets. Second, the household disability measure is broad and does not distinguish mobility limitations from other disability types. Third, although the study includes an urban accessibility index, it does not directly measure local infrastructure readiness, such as broadband, cellular coverage, GPS reliability, landing-site availability, or drone-recovery capability. Future research should integrate these technical and infrastructural barriers into behavioral models to improve the ecological validity of rural drone deployment strategies.
In addition to these survey- and infrastructure-related limitations, the study also faces several methodological and ethical considerations associated with the use of LLMs. Fourth, the GPT-4o sentiment labels were not independently validated against a human-coded benchmark. The sentiment results should therefore be interpreted as exploratory, particularly because the improvements for the full sample were modest and the larger gains occurred in the smaller matched-sentiment subset. Future work should use multiple human coders, report inter-rater agreement, and benchmark multiple LLMs and model versions using a common prompt and evaluation set [90]. Fifth, although the approved consent form allowed the sharing of de-identified research data, it did not specifically mention third-party LLM processing. Future studies should explicitly disclose planned external AI processing in the consent materials and confirm the applicable institutional data-processing arrangements before conducting the analysis.
The significance of product-interest indicators in the supplementary extended OLR model suggests that product type may play an important role in rural drone-delivery demand. Future research should therefore examine how rural residents evaluate different pricing structures, such as one-time same-day drone delivery fees, annual subscription fees, and traditional truck-based delivery alternatives, across different product categories. Such analysis would extend the current acceptance-focused study toward a more detailed understanding of rural willingness to pay and product-specific demand.
Author Contributions
Z.W., K.N. and X.H. jointly launched this research and provided the research outline. Z.W., H.Z. and X.H. designed the research methods. H.Z. and Z.W. performed the experiments and prepared the figures. Z.W. and X.H. provided critical revisions. All authors jointly analyzed the results and participated in the writing of the manuscript. All authors have read and agreed to the published version of the manuscript.
Funding
This work was partially supported by the U.S. National Science Foundation under Grants CMMI-2200506 and CMMI-2047793. The funder had no role in study design, data collection and analysis, decision to publish or preparation of the manuscript. The authors are solely responsible for the contents of this paper.
Institutional Review Board Statement
The study was reviewed and approved by the Institutional Review Board (IRB) at Morgan State University, approval number #23/03-0072.
Informed Consent Statement
Informed consent was obtained from all participants. The approved consent form informed participants that de-identified study data could be shared for research after personal information had been removed or coded; it did not specifically name OpenAI or LLM processing.
Data Availability Statement
The original contributions presented in this study are included in the article. Further inquiries can be directed to the corresponding author.
Acknowledgments
The authors would like to express their sincere gratitude to Xiaokun (Cara) Wang at RPI for her valuable suggestions on the survey design. We also acknowledge the Center for Equitable Artificial Intelligence & Machine Learning Systems (CEAMLS) at Morgan State University and the Center for Infrastructure, Transportation, and the Environment (CITE) at Rensselaer Polytechnic Institute for their support.
Conflicts of Interest
The authors declare that they have no known competing financial interests or personal relationships that could have appeared to influence the work reported in this paper.
Appendix A. Socio-Demographic Data and Correlation Analysis
Table A1.
Summary of Statistical Indices.
The Spearman correlation Table A2 shows correlations among the focal ordinal variables and selected contextual controls. The table is intended as a descriptive check only; the main findings are based on multivariable OLR and predictive models that adjust for covariates and account for nonlinear patterns.
Table A2.
Spearman correlations among focal variables and selected controls.
The strongest descriptive association is between Willingness to pay and Acceptance to drone delivery (). Opinion on equitable SDD and Post-pandemic attitude change also show positive correlations with acceptance. Urban accessibility is not significantly correlated with acceptance in this descriptive table, which is consistent with the OLR results.
Household disability showed a weak positive bivariate association with drone-delivery acceptance (, ), but this association was not statistically significant in the multivariable OLR models after adjusting for willingness to pay, post-pandemic attitude change, perceived need for equitable same-day delivery, demographic characteristics, socioeconomic factors, occupation, and urban accessibility.
Appendix B. Urban Accessibility
This paper proposes urban accessibility analysis for rural residents based on the GPS coordinates collected from the survey. This measure is included because proximity to large cities may reflect differences in access to retail options, same-day delivery services, and logistics infrastructure, which may shape rural residents’ perceived need for drone delivery. Following prior work on distance-based interaction and neighbor selection [96], neighboring large cities were identified for each respondent using GPS coordinates, city coordinates, and a fixed interaction radius. Large cities were determined based on population size [97], and the main interaction radius was set at 25 miles, consistent with the EDGE rural framework, which distinguishes rural-distant and rural-remote areas using a 25-mile threshold from urban areas with populations of 50,000 or more [98].
Given the interaction range, some rural respondents can travel to multiple large cities within their search circles. Evaluating comprehensive urban accessibility among these cities is challenging due to the varying attraction levels of each city. It is difficult to pinpoint which cities have the strongest accessibility attraction in real-world scenarios. Therefore, this study introduces a two-dimensional evaluation index of urban accessibility that considers the impacts of neighboring cities’ populations and accessibility distances for each rural respondent.
Figure A1.
Selection of neighboring large cities.
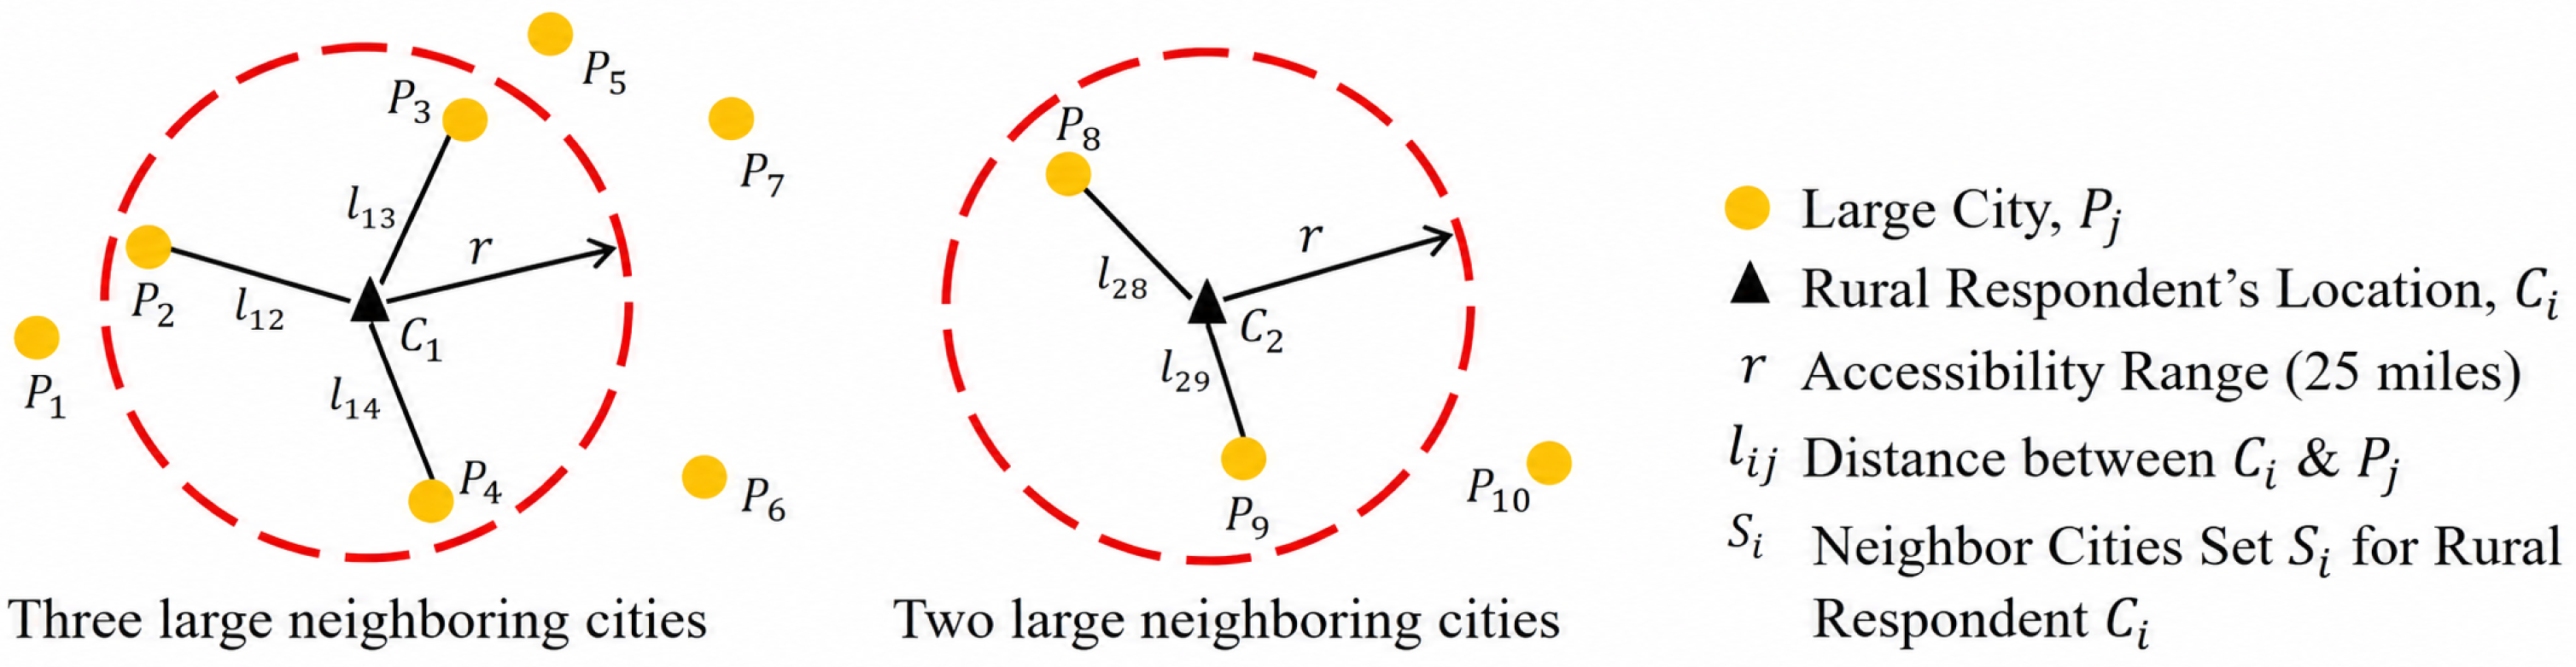
To calculate urban accessibility, the study uses the spatial accessible distances between rural residents’ locations and neighboring large cities based on graph theory. This study regularizes the actual distance into an accessible distance using a designed proximity influence function, as shown in Equation (A1). The function value is constrained within the interval [0, 1).
where is the accessible distance between a rural resident’s location and one of the neighboring large cities; x is the reciprocal of the actual distance.
After regularizing the distances, the cities’ populations [99] are normalized into corresponding population weights in Equation (A2).
where is the population weight for a neighboring large city ; is the actual population size for this city ; N represents all large cities set in US.
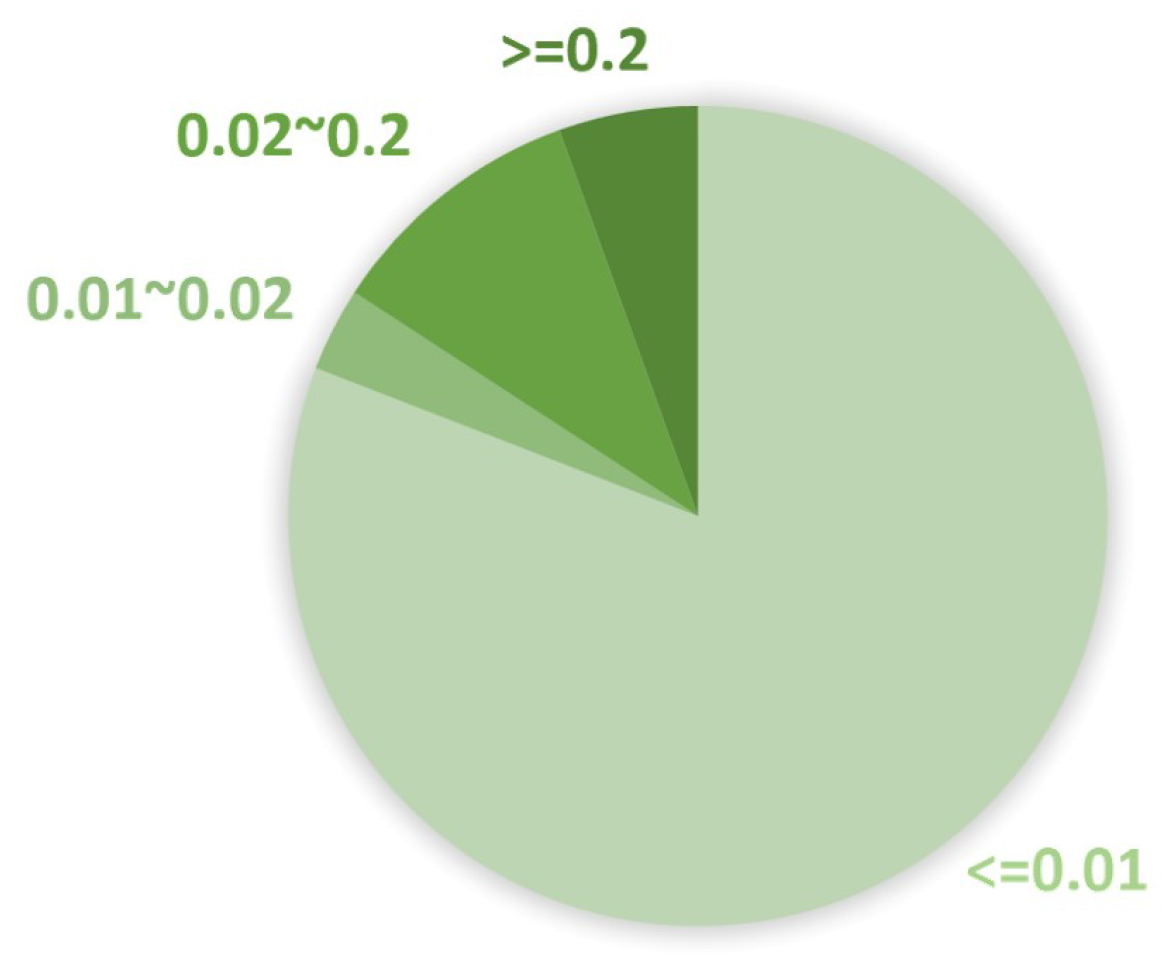
Finally, the study calculates the cumulative product of the converted accessible distance and the population weight of each neighboring large city, as shown in Equation (A3). The calculated urban accessibility index for a rural resident can be described in Figure A2. Based on the urban accessibility index calculated from the collected survey data, most respondents are located far from large cities, with index values below 0.2. This verifies the accuracy of the collected dataset and ensures that our analysis effectively focuses on rural areas.
Figure A2.
Urban accessibility index.
To assess sensitivity to the selected interaction radius, we also computed 10-mile and 50-mile versions of the index. The share of respondents with at least one top-200 city within range increased from 39.3% under the 10-mile specification, to 58.4% under the 25-mile specification, and to 78.1% under the 50-mile specification. Thus, the 25-mile radius provides a balanced middle specification between a restrictive local-access measure and a broader regional-access measure.
Appendix C. Statistical Assessment of the ORL Model
Table A3 evaluates whether the independent variables in the model are highly correlated with each other, which could distort the regression results. None of the Variance Inflation Factor (VIF) values are more than 5, which indicates that multicollinearity is not a concern in this model, meaning each predictor contributes unique information to the analysis.
Table A3.
Assessment of multicollinearity.
Table A4 tests the proportional odds (PO) assumption, a key requirement for ordinal logistic regression. A large p value suggests that we do not reject the proportional-odds assumption for the OLR model.
Table A4.
Test of parallel lines.
Table A5 reports likelihood-based goodness-of-fit statistics for the main OLR model and the extended OLR model specifications.
The row labeled “OLR” in Table A5 reports the goodness-of-fit statistics for the OLR model. The likelihood-ratio test was statistically significant, indicating that OLR model fits the data better than an intercept-only model.
Overall, these diagnostics support the reliability of the model’s findings and its suitability for interpreting ordinal outcomes. The extended OLR specification adds current same-day delivery accessibility, product-interest indicators, perceived equity impact, employment impact, and perceived well-being improvement. It shows lower AIC and BIC and a higher McFadden pseudo-R2 than the main model (Table A4), confirming that the broader variables add explanatory information. The main model remains the primary inferential and model-comparison baseline because it directly operationalizes the four focal research mechanisms and uses the common structured feature set, while the extended specification is interpreted as a complementary service-design model, not as an analytically unimportant appendix check.
Table A5.
Combined goodness of fit.
Appendix D. Binary Analysis
This appendix reports the binary high-acceptance analysis. The binary outcome was coded as 1 for respondents who selected “Much” or “Very much” acceptance and 0 for respondents who selected “Not at all,” “A little,” or “Some.” This analysis is used as a predictive robustness check because it focuses on respondents most likely to adopt drone delivery if the service becomes available.
For the binary high-acceptance task, the ML models generally performed more strongly than the statistical baseline, especially when structured predictors were used. XGBoost performed best in the full-sample structured-only and structured-plus-sentiment comparisons, while LightGBM and RF performed strongly in the matched-sentiment subset. These results suggest that machine-learning models are particularly useful when the research goal is to classify high-acceptance respondents rather than interpret an ordered five-level outcome. The matched-sentiment results should be interpreted as sensitivity evidence because they exclude respondents without codable text responses.
Table A6.
Binary acceptance to drone delivery with structured predictors only (Full sample with ).
Table A7.
Binary acceptance to drone delivery with structured predictors plus sentiment (Full sample with ).
Table A8.
Binary acceptance to drone delivery with structured predictors plus sentiment (matched-sentiment subset with ).
References
- U.S. Department of Commerce. Post Pandemic eCommerce; U.S. Department of Commerce: Washington, DC, USA, 2022.
- Wang, X.C.; Kim, W.; Holguín-Veras, J.; Schmid, J. Adoption of delivery services in light of the COVID pandemic: Who and how long? Transp. Res. Part A Policy Pract. 2021, 154, 270–286. [Google Scholar] [CrossRef] [Scilit] [PubMed]
- Brewster, M. Annual Retail Trade Survey Shows Impact of Online Shopping on Retail Sales During COVID-19 Pandemic; United States Census Bureau: Washington, DC, USA, 2023. [Google Scholar]
- Polaris Market Research. E-Commerce Logistics Market Demand, Opportunity, Growth Analysis, 2025–2034; Polaris Market Research: Dover, DE, USA, 2025. [Google Scholar]
- DHL. A DHL Perspective on Implications and Use Cases for the Logistics Industry; DHL: Bonn, Germany, 2014. [Google Scholar]
- Snouffer, E. Six places where drones are delivering medicines. Nat. Med. 2022, 28, 874–875. [Google Scholar] [CrossRef] [Scilit] [PubMed]
- Hassanalian, M.; Abdelkefi, A. Classifications, applications, and design challenges of drones: A review. Prog. Aerosp. Sci. 2017, 91, 99–131. [Google Scholar] [CrossRef] [Scilit]
- Frachtenberg, E. Practical drone delivery. Computer 2019, 52, 53–57. [Google Scholar] [CrossRef] [Scilit]
- Amazon. Amazon Is launching Ultra-Fast Drone Deliveries in Italy, the UK, and a Third Location in the U.S. Available online: https://www.aboutamazon.com/news/operations/amazon-prime-air-drone-delivery-updates (accessed on 15 July 2026).
- Rajashekhar, P. Walmart and Wing Team Up to Provide the Convenience of Drone Delivery. Available online: https://corporate.walmart.com/news/2023/08/24/walmart-and-wing-team-up-to-provide-the-convenience-of-drone-delivery (accessed on 15 July 2026).
- Muller, J. Drones clear key hurdle to sharing U.S. Airspace. Axios, 6 September 2023.
- The White House. Executive Order 14307—Unleashing American Drone Dominance. 6 June 2025. Available online: https://www.whitehouse.gov/presidential-actions/2025/06/unleashing-american-drone-dominance/ (accessed on 15 July 2026).
- The Washington Post. Missed Mail infuriates rural towns as carriers deliver Amazon packages. The Washington Post, 28 November 2023.
- Wingcopter. Wingcopter Delivery Drones for Better Local Supply in Rural Areas; Wingcopter: Weiterstadt, Germany, 2023. [Google Scholar]
- Korosec, K. Zipline Is Now the National Drone Service Provider for Rwanda. TechCrunch, 15 December 2022. Available online: https://techcrunch.com/2022/12/15/zipline-is-now-the-national-drone-service-provider-for-rwanda/ (accessed on 15 July 2026).
- Friedlob, G.T.; Plewa, F.J., Jr. Understanding Return on Investment; John Wiley & Sons: Hoboken, NJ, USA, 1996. [Google Scholar]
- Berechman, J.; Ozmen, D.; Ozbay, K. Empirical analysis of transportation investment and economic development at state, county and municipality levels. Transportation 2006, 33, 537–551. [Google Scholar] [CrossRef]
- dos Santos Rocha, C.; Magnani, M.; Ramos, G.L.d.P.A.; Bezerril, F.F.; Freitas, M.Q.; Cruz, A.G.; Pimentel, T.C. Emerging technologies in food processing: Impacts on sensory characteristics and consumer perception. Curr. Opin. Food Sci. 2022, 47, 100892. [Google Scholar] [CrossRef] [Scilit]
- Kapser, S.; Abdelrahman, M. Acceptance of autonomous delivery vehicles for last-mile delivery in Germany–Extending UTAUT2 with risk perceptions. Transp. Res. Part C Emerg. Technol. 2020, 111, 210–225. [Google Scholar] [CrossRef] [Scilit]
- Kinsey, M.; Gwynne, S.; Kuligowski, E.D.; Kinateder, M. Cognitive biases within decision making during fire evacuations. Fire Technol. 2019, 55, 465–485. [Google Scholar]
- Ke, G.; Meng, Q.; Finley, T.; Wang, T.; Chen, W.; Ma, W.; Ye, Q.; Liu, T.-Y. LightGBM: A Highly Efficient Gradient Boosting Decision Tree. In Advances in Neural Information Processing Systems 30 (NIPS 2017); Curran Associates, Inc.: Red Hook, NY, USA, 2017; pp. 3146–3154. Available online: https://proceedings.neurips.cc/paper/2017/hash/6449f44a102fde848669bdd9eb6b76fa-Abstract.html (accessed on 15 July 2026).
- Choudhury, A.; Mondal, A.; Sarkar, S. Searches for the BSM scenarios at the LHC using decision tree-based machine learning algorithms: A comparative study and review of random forest, AdaBoost, XGBoost and LightGBM frameworks. Eur. Phys. J. Spec. Top. 2024, 233, 2425–2463. [Google Scholar] [CrossRef] [Scilit]
- Brunner, G.; Szebedy, B.; Tanner, S.; Wattenhofer, R. The urban last mile problem: Autonomous drone delivery to your balcony. In Proceedings of the 2019 International Conference on Unmanned Aircraft Systems (ICUAS); IEEE: Piscataway, NJ, USA, 2019; pp. 1005–1012. [Google Scholar]
- Calderón, O.; Holguín-Veras, J.; Ison, S. The Role of Road Pricing and Incentives in Urban Logistics Management. In The Routledge Handbook of Urban Logistics; Routledge: Abingdon, UK, 2023; pp. 282–294. [Google Scholar]
- Khan, R.; Tausif, S.; Javed Malik, A. Consumer acceptance of delivery drones in urban areas. Int. J. Consum. Stud. 2019, 43, 87–101. [Google Scholar]
- Oh, S.; Yoon, Y. Urban drone operations: A data-centric and comprehensive assessment of urban airspace with a Pareto-based approach. Transp. Res. Part A Policy Pract. 2024, 182, 104034. [Google Scholar] [CrossRef] [Scilit]
- Otto, A.; Agatz, N.; Campbell, J.; Golden, B.; Pesch, E. Optimization approaches for civil applications of unmanned aerial vehicles (UAVs) or aerial drones: A survey. Networks 2018, 72, 411–458. [Google Scholar] [CrossRef] [Scilit]
- Chen, H.; Hu, Z.; Solak, S. Improved delivery policies for future drone-based delivery systems. Eur. J. Oper. Res. 2021, 294, 1181–1201. [Google Scholar] [CrossRef] [Scilit]
- Tepylo, N.; Straubinger, A.; Laliberte, J. Public perception of advanced aviation technologies: A review and roadmap to acceptance. Prog. Aerosp. Sci. 2023, 138, 100899. [Google Scholar] [CrossRef] [Scilit]
- Paddeu, D.; Parkhurst, G. The potential for automation to transform urban deliveries: Drivers, barriers and policy priorities. In Advances in Transport Policy and Planning; Elsevier: Amsterdam, The Netherlands, 2020; Volume 5, pp. 291–314. [Google Scholar]
- Waris, I.; Ali, R.; Nayyar, A.; Baz, M.; Liu, R.; Hameed, I. An empirical evaluation of customers’ adoption of drone food delivery services: An extended technology acceptance model. Sustainability 2022, 14, 2922. [Google Scholar] [CrossRef] [Scilit]
- Yuen, K.F.; Cai, L.; Wee, S.C.K.; Wang, X. Pandemic-driven acceptance of urban drone deliveries. Transp. Policy 2024, 146, 356–370. [Google Scholar] [CrossRef] [Scilit]
- Harrow, D.; Gheerawo, R.; Boyd Davis, S.; Phillips, D.; Lockton, D.; Mausbach, A.; Wu, J.; Ramster, G.; Johnson, S.; Meldaikyte, G.; et al. Driverless Futures: Design for Acceptance and Adoption in Urban Environments; Royal College of Art: London, UK, 2020. [Google Scholar]
- Gadiraju, V.; Garcia, J.; Kane, S.; M. Brock, A. “It is fascinating to make these beasts fly”: Understanding Visually Impaired People’s Motivations and Needs for Drone Piloting. In Proceedings of the 23rd International ACM SIGACCESS Conference on Computers and Accessibility; Association for Computing Machinery: New York, NY, USA, 2021; pp. 1–12. [Google Scholar]
- Yoo, W.; Yu, E.; Jung, J. Drone delivery: Factors affecting the public’s attitude and intention to adopt. Telemat. Inform. 2018, 35, 1687–1700. [Google Scholar] [CrossRef] [Scilit]
- Ramadan, Z.B.; Farah, M.F.; Mrad, M. An adapted TPB approach to consumers’ acceptance of service-delivery drones. Technol. Anal. Strateg. Manag. 2017, 29, 817–828. [Google Scholar]
- Lawson, A.M. Consumer Behaviors of Drone Delivery. Ph.D. Thesis, Appalachian State University, Boone, NC, USA, 2017. [Google Scholar]
- McGuire, M.; Rys, M.J.; Rys, A. A Study of How Unmanned Aircraft Systems Can Support the Kansas Department of Transportation’s Efforts to Improve Efficiency, Safety, and Cost Reduction; Kansas Department of Transportation: Topeka, KS, USA, 2016.
- Campbell, J.F.; Sweeney, D.C., II; Zhang, J. Strategic Design for Delivery with Trucks and Drones; Supply Chain & Analytics Report SCMA-2017-0201; College of Business Administration, University of Missouri–St. Louis: St. Louis, MO, USA, 2017; Available online: https://www.updwg.org/wp-content/uploads/2019/05/StrategicDesignforDeliverywithDronesandTrucks_4-17-17_SCMA-2017-0201.pdf (accessed on 15 July 2026).
- Jiang, J.; Dai, Y.; Yang, F.; Ma, Z. A multi-visit flexible-docking vehicle routing problem with drones for simultaneous pickup and delivery services. Eur. J. Oper. Res. 2024, 312, 125–137. [Google Scholar] [CrossRef] [Scilit]
- Wang, Y.; Bi, M.; Lai, J.; Wang, C.; Chen, Y.; Holguín-Veras, J. Recourse strategy for the routing problem of mobile parcel lockers with time windows under uncertain demands. Eur. J. Oper. Res. 2024, 316, 942–957. [Google Scholar] [CrossRef] [Scilit]
- Wang, S.; Zhu, X.; Shang, P.; Lin, X.; Yang, L.; Tavasszy, L. Two-echelon multi-commodity multimodal vehicle routing problem considering user heterogeneity in city logistics. Expert Syst. Appl. 2024, 252, 124141. [Google Scholar] [CrossRef] [Scilit]
- Yang, S.; Ning, L.; Shang, P.; Tong, L.C. Augmented Lagrangian relaxation approach for logistics vehicle routing problem with mixed backhauls and time windows. Transp. Res. Part E Logist. Transp. Rev. 2020, 135, 101891. [Google Scholar] [CrossRef] [Scilit]
- Murray, C.C.; Chu, A.G. The flying sidekick traveling salesman problem: Optimization of drone-assisted parcel delivery. Transp. Res. Part C Emerg. Technol. 2015, 54, 86–109. [Google Scholar] [CrossRef] [Scilit]
- Dorling, K.; Heinrichs, J.; Messier, G.G.; Magierowski, S. Vehicle routing problems for drone delivery. IEEE Trans. Syst. Man. Cybern. Syst. 2016, 47, 70–85. [Google Scholar] [CrossRef] [Scilit]
- Murray, C.C.; Raj, R. The multiple flying sidekicks traveling salesman problem: Parcel delivery with multiple drones. Transp. Res. Part C Emerg. Technol. 2020, 110, 368–398. [Google Scholar] [CrossRef] [Scilit]
- Gao, J.; Zhen, L.; Wang, S. Multi-trucks-and-drones cooperative pickup and delivery problem. Transp. Res. Part C Emerg. Technol. 2023, 157, 104407. [Google Scholar] [CrossRef] [Scilit]
- Xiao, J.; Li, Y.; Cao, Z.; Xiao, J. Cooperative trucks and drones for rural last-mile delivery with steep roads. Comput. Ind. Eng. 2024, 187, 1–18. [Google Scholar] [CrossRef] [Scilit]
- Tamakloe, R.; Zhang, K.; Atandzi, J.; Park, D. Examining urban delivery service user profiles and determinants of drone delivery adoption in Ghana considering usage before and after the COVID-19 pandemic. Transp. Policy 2024, 146, 279–294. [Google Scholar] [CrossRef] [Scilit]
- Tadić, S.; Radovanović, L.; Krstić, M.; Čokorilo, O.; Veljović, M. Evaluating barriers to drone application in rural areas. Transp. Res. Procedia 2025, 90, 1070–1077. [Google Scholar] [CrossRef] [Scilit]
- Wu, J.; Chen, Z.; Zhang, Z.; Cen, M. Examining the acceptance of drone delivery services among Chinese consumers: A perspective from urban and rural areas. PLoS ONE 2025, 20, e0333422. [Google Scholar] [CrossRef] [Scilit] [PubMed]
- Gomes, S.; Lopes, J.M.; Trancoso, T. Aerial pathways to resilience: The acceptance of drones in logistics transformation. Future Bus. J. 2025, 11, 102. [Google Scholar] [CrossRef] [Scilit]
- Abdul-Muhmin, A.G. CRM technology use and implementation benefits in an emerging market. J. Database Mark. Cust. Strategy Manag. 2012, 19, 82–97. [Google Scholar] [CrossRef] [Scilit]
- Ali, M.; Raza, S.A.; Khamis, B.; Puah, C.H.; Amin, H. How perceived risk, benefit and trust determine user Fintech adoption: A new dimension for Islamic finance. Foresight 2021, 23, 403–420. [Google Scholar] [CrossRef] [Scilit]
- Walker, R.H.; Johnson, L.W. Why consumers use and do not use technology-enabled services. J. Serv. Mark. 2006, 20, 125–135. [Google Scholar] [CrossRef] [Scilit]
- Davis, F.D. Perceived usefulness, perceived ease of use, and user acceptance of information technology. MIS Q. 1989, 13, 319–340. [Google Scholar] [CrossRef] [Scilit]
- Ajzen, I. The theory of planned behavior. Organ. Behav. Hum. Decis. Process. 1991, 50, 179–211. [Google Scholar] [CrossRef] [Scilit]
- Venkatesh, V.; Morris, M.G.; Davis, G.B.; Davis, F.D. User acceptance of information technology: Toward a unified view1. MIS Q. 2003, 27, 425–478. [Google Scholar] [CrossRef] [Scilit]
- Venkatesh, V.; Thong, J.Y.; Xu, X. Consumer acceptance and use of information technology: Extending the Unified Theory of Acceptance and Use of Technology1. MIS Q. 2012, 36, 157–178. [Google Scholar] [CrossRef] [Scilit]
- Kim, S.H. Choice model based analysis of consumer preference for drone delivery service. J. Air Transp. Manag. 2020, 84, 101785. [Google Scholar] [CrossRef] [Scilit]
- Wang, X.C.; Kim, W.; Zhang, D. What to do in response to toll increases: A behavioral analysis of freight carriers in New York State. Transp. Res. Part A Policy Pract. 2023, 173, 103725. [Google Scholar] [CrossRef] [Scilit]
- Hwang, J.; Kim, J.J.; Lee, K.W. Investigating consumer innovativeness in the context of drone food delivery services: Its impact on attitude and behavioral intentions. Technol. Forecast. Soc. Change 2021, 163, 120433. [Google Scholar] [CrossRef] [Scilit]
- Kim, J.J.; Kim, I.; Hwang, J. A change of perceived innovativeness for contactless food delivery services using drones after the outbreak of COVID-19. Int. J. Hosp. Manag. 2021, 93, 102758. [Google Scholar] [CrossRef] [Scilit] [PubMed]
- Leon, S.; Chen, C.; Ratcliffe, A. Consumers’ perceptions of last mile drone delivery. Int. J. Logist. Res. Appl. 2023, 26, 345–364. [Google Scholar]
- García, S.; Fernández, A.; Luengo, J.; Herrera, F. A study of statistical techniques and performance measures for genetics-based machine learning: Accuracy and interpretability. Soft Comput. 2009, 13, 959–977. [Google Scholar]
- Makridakis, S.; Spiliotis, E.; Assimakopoulos, V. Statistical and Machine Learning forecasting methods: Concerns and ways forward. PLoS ONE 2018, 13, e0194889. [Google Scholar] [CrossRef] [Scilit] [PubMed]
- Tizghadam, A.; Khazaei, H.; Moghaddam, M.H.; Hassan, Y. Machine learning in transportation. J. Adv. Transp. 2019, 2019, 4359785. [Google Scholar] [CrossRef] [Scilit]
- Marković, N.; Kim, M.E.; Schonfeld, P. Statistical and machine learning approach for planning dial-a-ride systems. Transp. Res. Part A Policy Pract. 2016, 89, 41–55. [Google Scholar] [CrossRef] [Scilit]
- Collins, D. Pretesting survey instruments: An overview of cognitive methods. Qual. Life Res. 2003, 12, 229–238. [Google Scholar] [CrossRef] [Scilit] [PubMed]
- Bruine de Bruin, W.; Bostrom, A. Assessing what to address in science communication. Proc. Natl. Acad. Sci. USA 2013, 110, 14062–14068. [Google Scholar] [CrossRef] [Scilit] [PubMed]
- Caverni, J.P.; Fabre, J.M.; Gonzalez, M. Cognitive Biases; Elsevier: Amsterdam, The Netherlands, 1990. [Google Scholar]
- Medhat, W.; Hassan, A.; Korashy, H. Sentiment analysis algorithms and applications: A survey. Ain Shams Eng. J. 2014, 5, 1093–1113. [Google Scholar] [CrossRef] [Scilit]
- Ding, Y.; Korolov, R.; Wallace, W.A.; Wang, X.C. How are sentiments on autonomous vehicles influenced? An analysis using Twitter feeds. Transp. Res. Part C Emerg. Technol. 2021, 131, 103356. [Google Scholar] [CrossRef] [Scilit]
- Ferrario, B.; Stantcheva, S. Eliciting people’s first-order concerns: Text analysis of open-ended survey questions. In Proceedings of the AEA Papers and Proceedings; American Economic Association: Nashville, TN, USA, 2022; Volume 112, pp. 163–169. [Google Scholar]
- Smith, R.M.; Powell, M.B.; Lum, J. The relationship between job status, interviewing experience, gender, and police officers’ adherence to open-ended questions. Leg. Criminol. Psychol. 2009, 14, 51–63. [Google Scholar] [CrossRef] [Scilit]
- Zhang, B.; Yang, H.; Zhou, T.; Ali Babar, M.; Liu, X.Y. Enhancing financial sentiment analysis via retrieval augmented large language models. In Proceedings of the Fourth ACM International Conference on AI in Finance; Association for Computing Machinery: New York, NY, USA, 2023; pp. 349–356. [Google Scholar]
- Sohangir, S.; Wang, D.; Pomeranets, A.; Khoshgoftaar, T.M. Big Data: Deep Learning for financial sentiment analysis. J. Big Data 2018, 5, 1–25. [Google Scholar] [CrossRef] [Scilit]
- Chang, Y.; Wang, X.; Wang, J.; Wu, Y.; Yang, L.; Zhu, K.; Chen, H.; Yi, X.; Wang, C.; Wang, Y.; et al. A survey on evaluation of large language models. ACM Trans. Intell. Syst. Technol. 2023, 15, 1–45. [Google Scholar] [CrossRef] [Scilit]
- Chen, M.; Tworek, J.; Jun, H.; Yuan, Q.; Pinto, H.P.d.O.; Kaplan, J.; Edwards, H.; Burda, Y.; Joseph, N.; Brockman, G.; et al. Evaluating large language models trained on code. arXiv 2021, arXiv:2107.03374. [Google Scholar]
- Pang, B.; Lee, L.; Vaithyanathan, S. Thumbs up? Sentiment classification using machine learning techniques. arXiv 2002, arXiv:cs/0205070. [Google Scholar]
- Hasan, A.; Moin, S.; Karim, A.; Shamshirband, S. Machine learning-based sentiment analysis for twitter accounts. Math. Comput. Appl. 2018, 23, 11. [Google Scholar] [CrossRef] [Scilit]
- Costola, M.; Hinz, O.; Nofer, M.; Pelizzon, L. Machine learning sentiment analysis, COVID-19 news and stock market reactions. Res. Int. Bus. Financ. 2023, 64, 101881. [Google Scholar] [CrossRef] [Scilit]
- Roumeliotis, K.I.; Tselikas, N.D. ChatGPT and Open-AI Models: A Preliminary Review. Future Internet 2023, 15, 192. [Google Scholar] [CrossRef] [Scilit]
- Thoppilan, R.; De Freitas, D.; Hall, J.; Shazeer, N.; Kulshreshtha, A.; Cheng, H.T.; Jin, A.; Bos, T.; Baker, L.; Du, Y.; et al. Lamda: Language models for dialog applications. arXiv 2022, arXiv:2201.08239. [Google Scholar]
- Touvron, H.; Lavril, T.; Izacard, G.; Martinet, X.; Lachaux, M.A.; Lacroix, T.; Rozière, B.; Goyal, N.; Hambro, E.; Azhar, F.; et al. Llama: Open and efficient foundation language models. arXiv 2023, arXiv:2302.13971. [Google Scholar]
- Zheng, O.; Abdel-Aty, M.; Wang, D.; Wang, Z.; Ding, S. ChatGPT is on the horizon: Could a large language model be all we need for Intelligent Transportation? arXiv 2023, arXiv:2303.05382. [Google Scholar]
- Mo, B.; Xu, H.; Zhuang, D.; Ma, R.; Guo, X.; Zhao, J. Large Language Models for Travel Behavior Prediction. arXiv 2023, arXiv:2312.00819. [Google Scholar]
- Da, L.; Liou, K.; Chen, T.; Zhou, X.; Luo, X.; Yang, Y.; Wei, H. Open-TI: Open Traffic Intelligence with Augmented Language Model. arXiv 2023, arXiv:2401.00211. [Google Scholar]
- Zheng, O.; Abdel-Aty, M.; Wang, D.; Wang, C.; Ding, S. Trafficsafetygpt: Tuning a pre-trained large language model to a domain-specific expert in transportation safety. arXiv 2023, arXiv:2307.15311. [Google Scholar]
- Bojić, L.; Zagovora, O.; Zelenkauskaite, A.; Vuković, V.; Čabarkapa, M.; Veseljević Jerković, S.; Jovančević, A. Comparing large Language models and human annotators in latent content analysis of sentiment, political leaning, emotional intensity and sarcasm. Sci. Rep. 2025, 15, 11477. [Google Scholar] [CrossRef] [Scilit] [PubMed]
- Ogozalek, S. Trump’s admin wants US drone delivery dominance. It could take years. POLITICO, 8 May 2025.
- Kyi, E.P.; Feng, T.; Lan, J.; Liu, Y. Destination Drone: A Comprehensive Analysis of Japanese Consumer Choice Behavior and Intentions for Drone Delivery Services. arXiv 2026, arXiv:2601.08660. [Google Scholar]
- Harrell, F.E., Jr.; Harrell, F.E. Ordinal logistic regression. In Regression Modeling Strategies: With Applications to Linear Models, Logistic and Ordinal Regression, and Survival Analysis; Spinger: Berlin/Heidelberg, Germany, 2015; pp. 311–325. [Google Scholar]
- Zhang, Y.; Zhu, C.; Wang, Q. LightGBM-based model for metro passenger volume forecasting. IET Intell. Transp. Syst. 2020, 14, 1815–1823. [Google Scholar] [CrossRef] [Scilit]
- Guo, X.; Gui, X.; Xiong, H.; Hu, X.; Li, Y.; Cui, H.; Qiu, Y.; Ma, C. Critical role of climate factors for groundwater potential mapping in arid regions: Insights from random forest, XGBoost, and LightGBM algorithms. J. Hydrol. 2023, 621, 129599. [Google Scholar] [CrossRef] [Scilit]
- Sandberg, O. Neighbor selection and hitting probability in small-world graphs. Ann. Appl. Probab. 2008, 18, 1771–1793. [Google Scholar] [CrossRef] [Scilit]
- SimpleMaps. United States Cities Database [Data Set]. Available online: https://simplemaps.com/data/us-cities (accessed on 15 July 2026).
- National Center for Education Statistics. Locale Classifications and Criteria; National Center for Education Statistics: Washington, DC, USA, 2025.
- World Population Review. The 200 Largest Cities in the United States by Population 2024; World Population Review: Walnut, CA, USA, 2024. [Google Scholar]
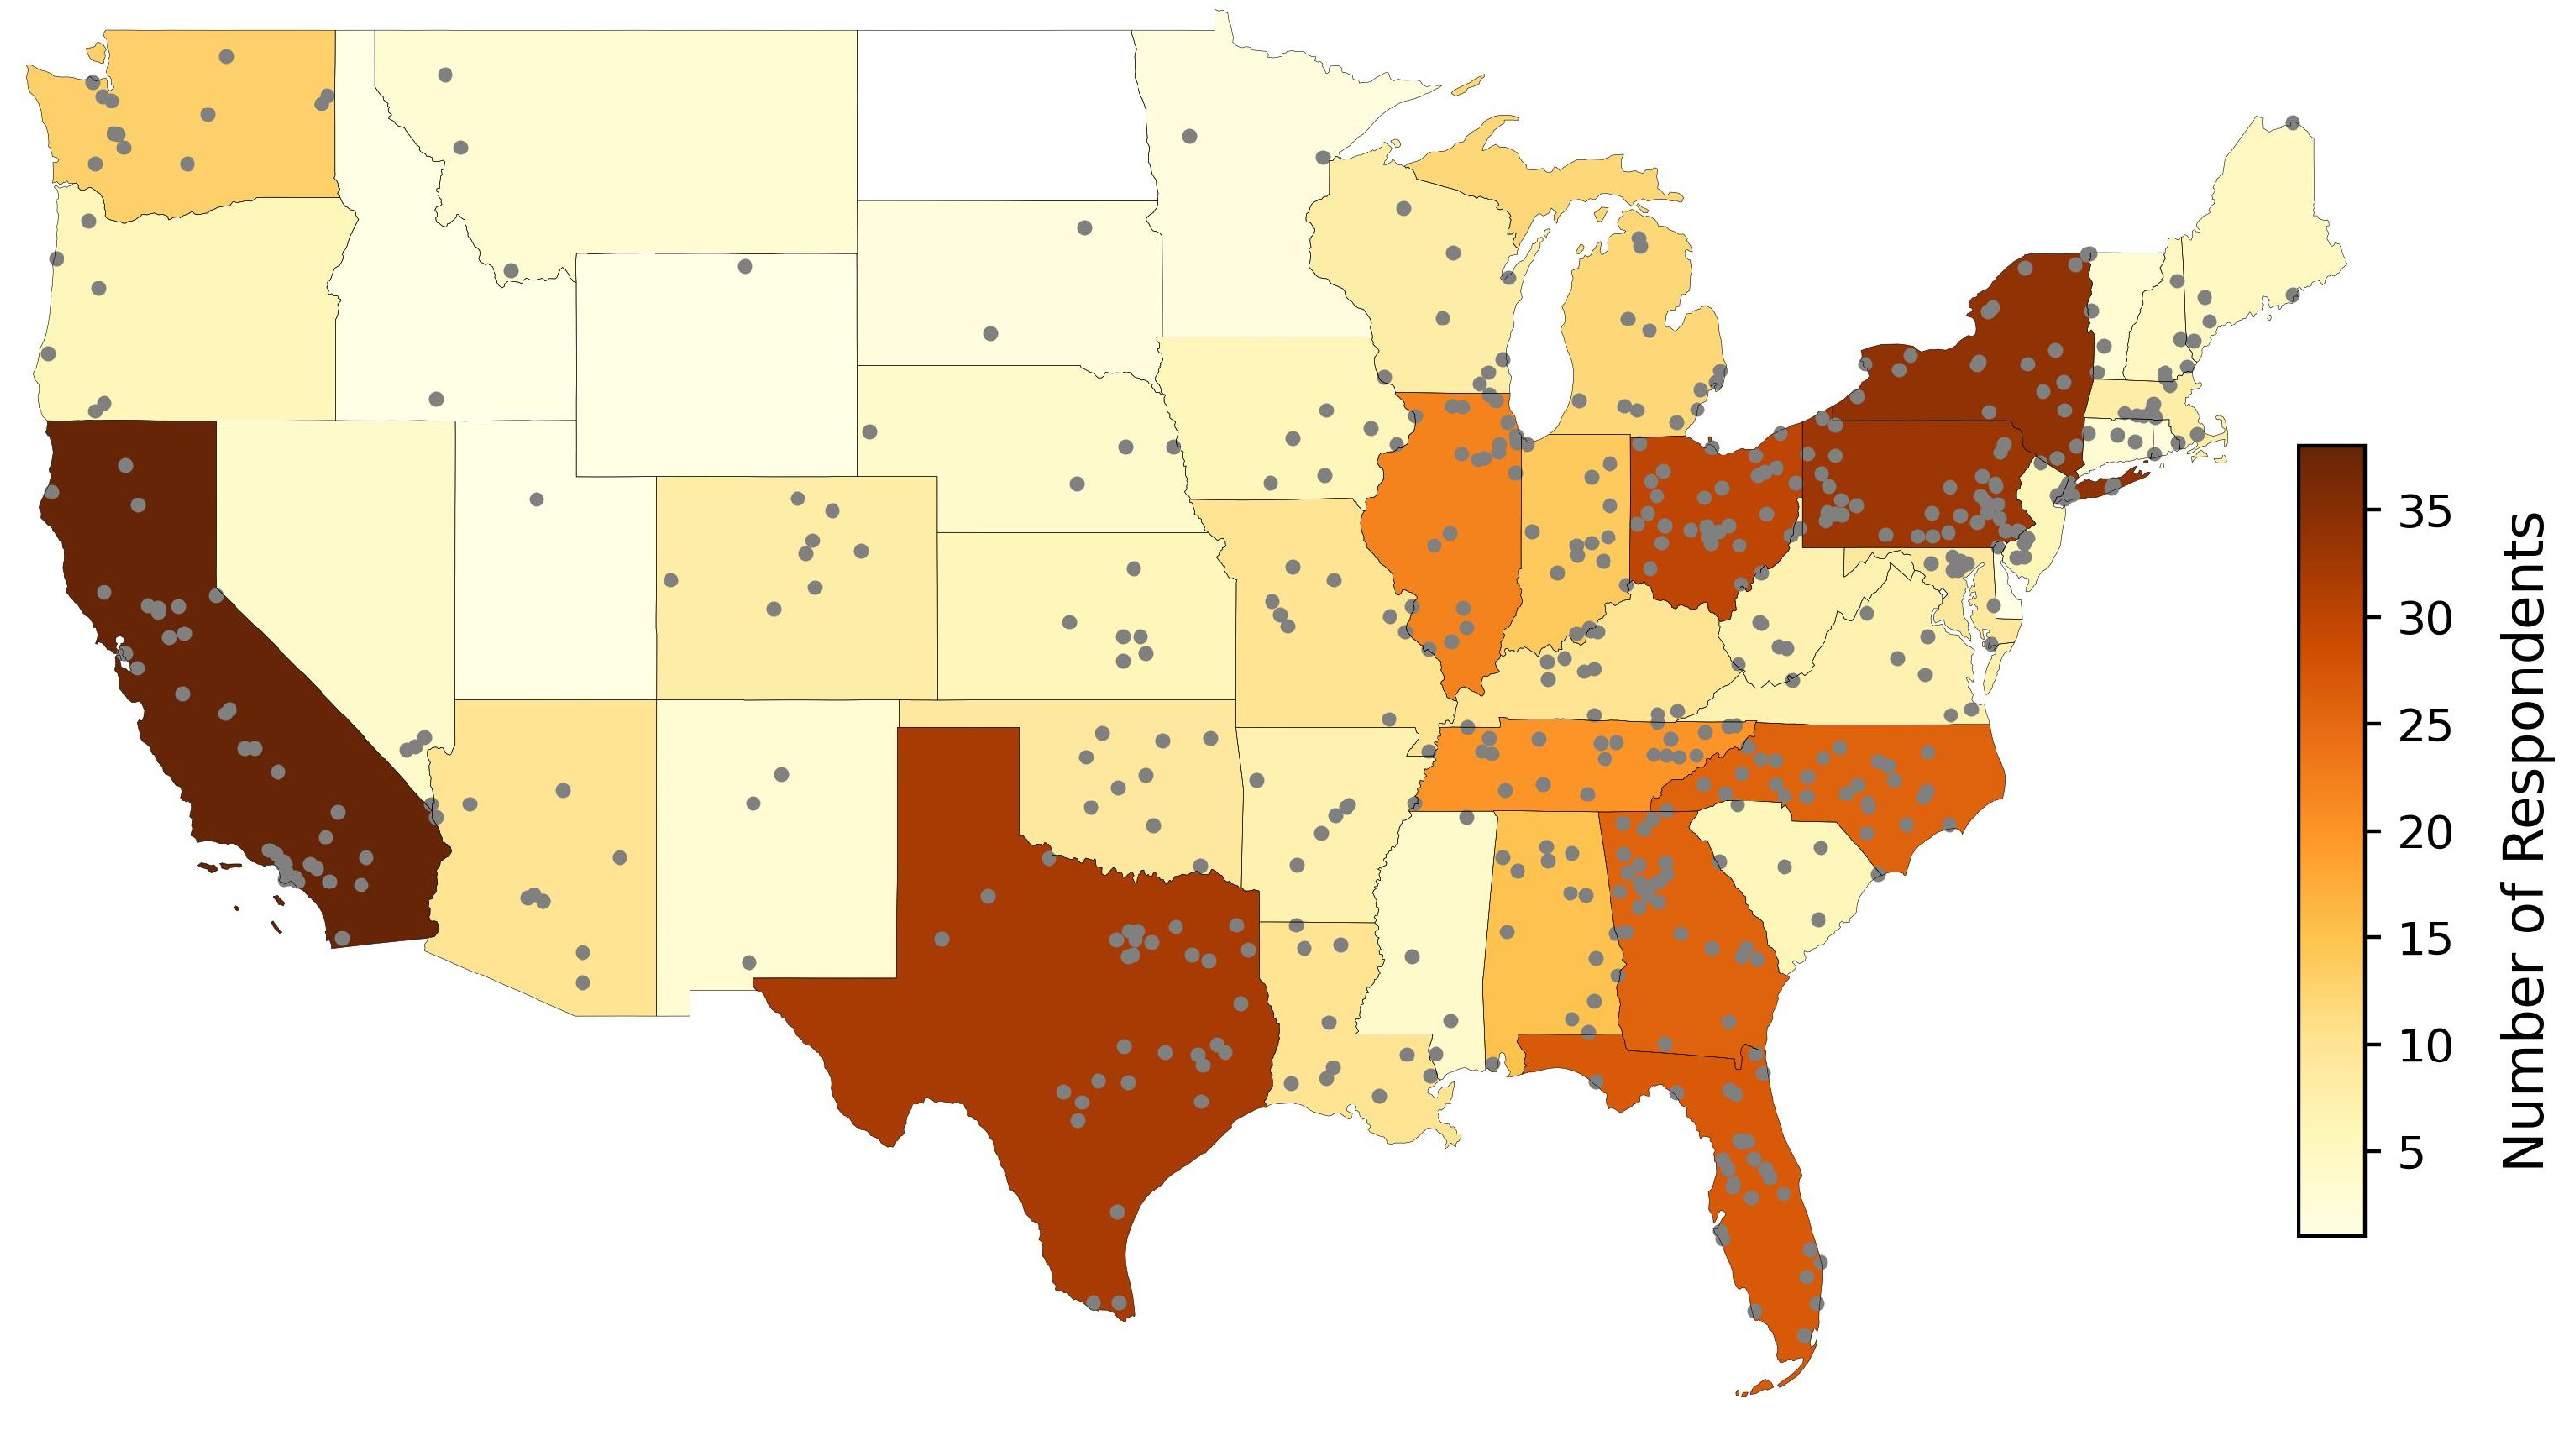
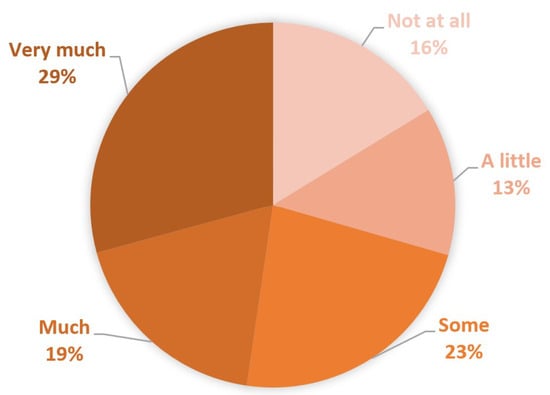
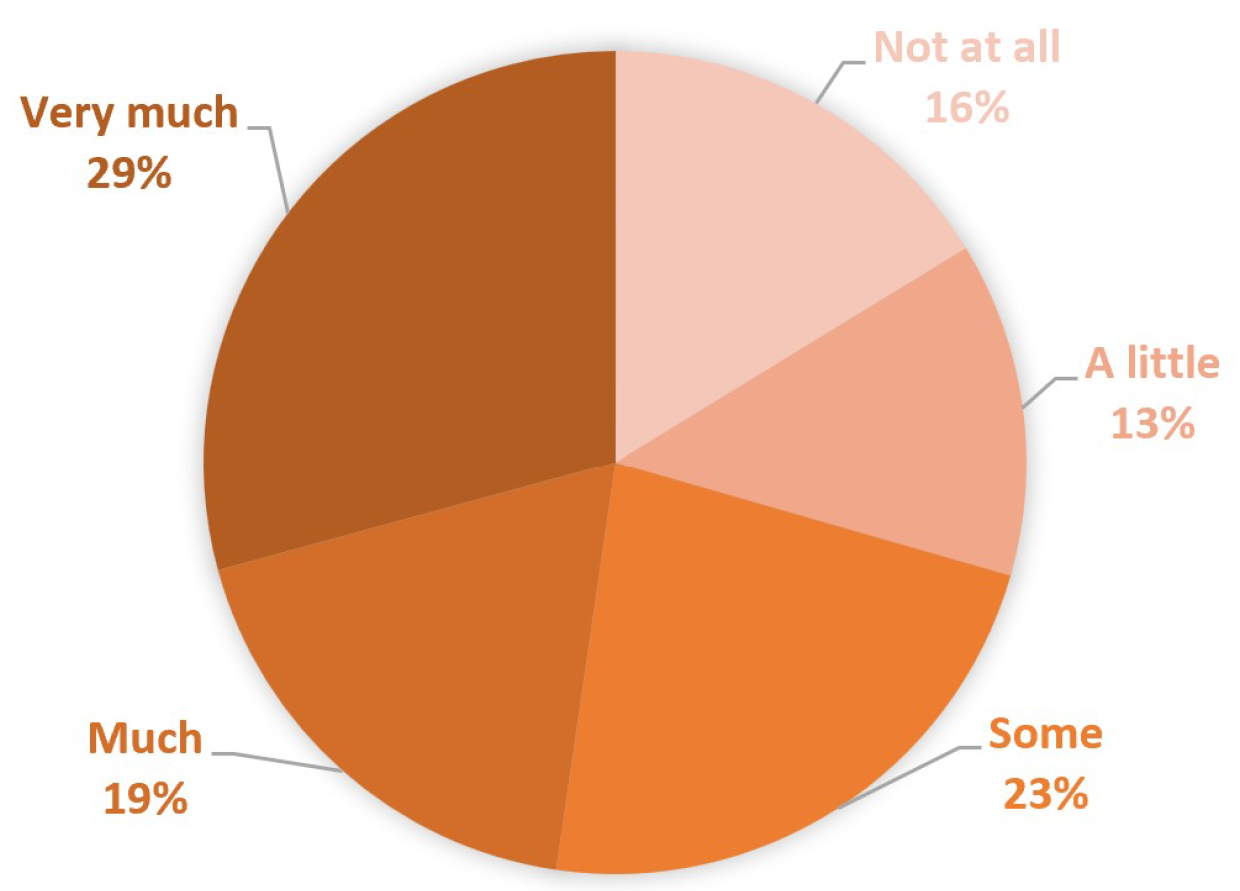
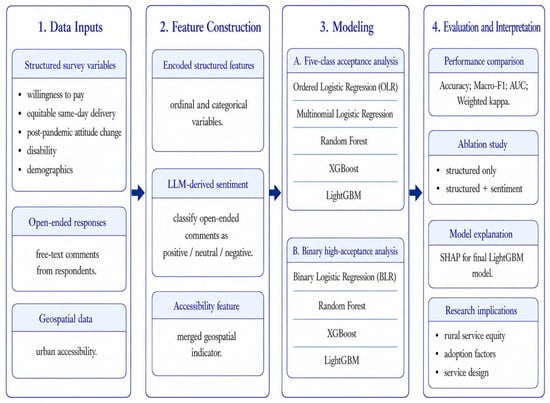
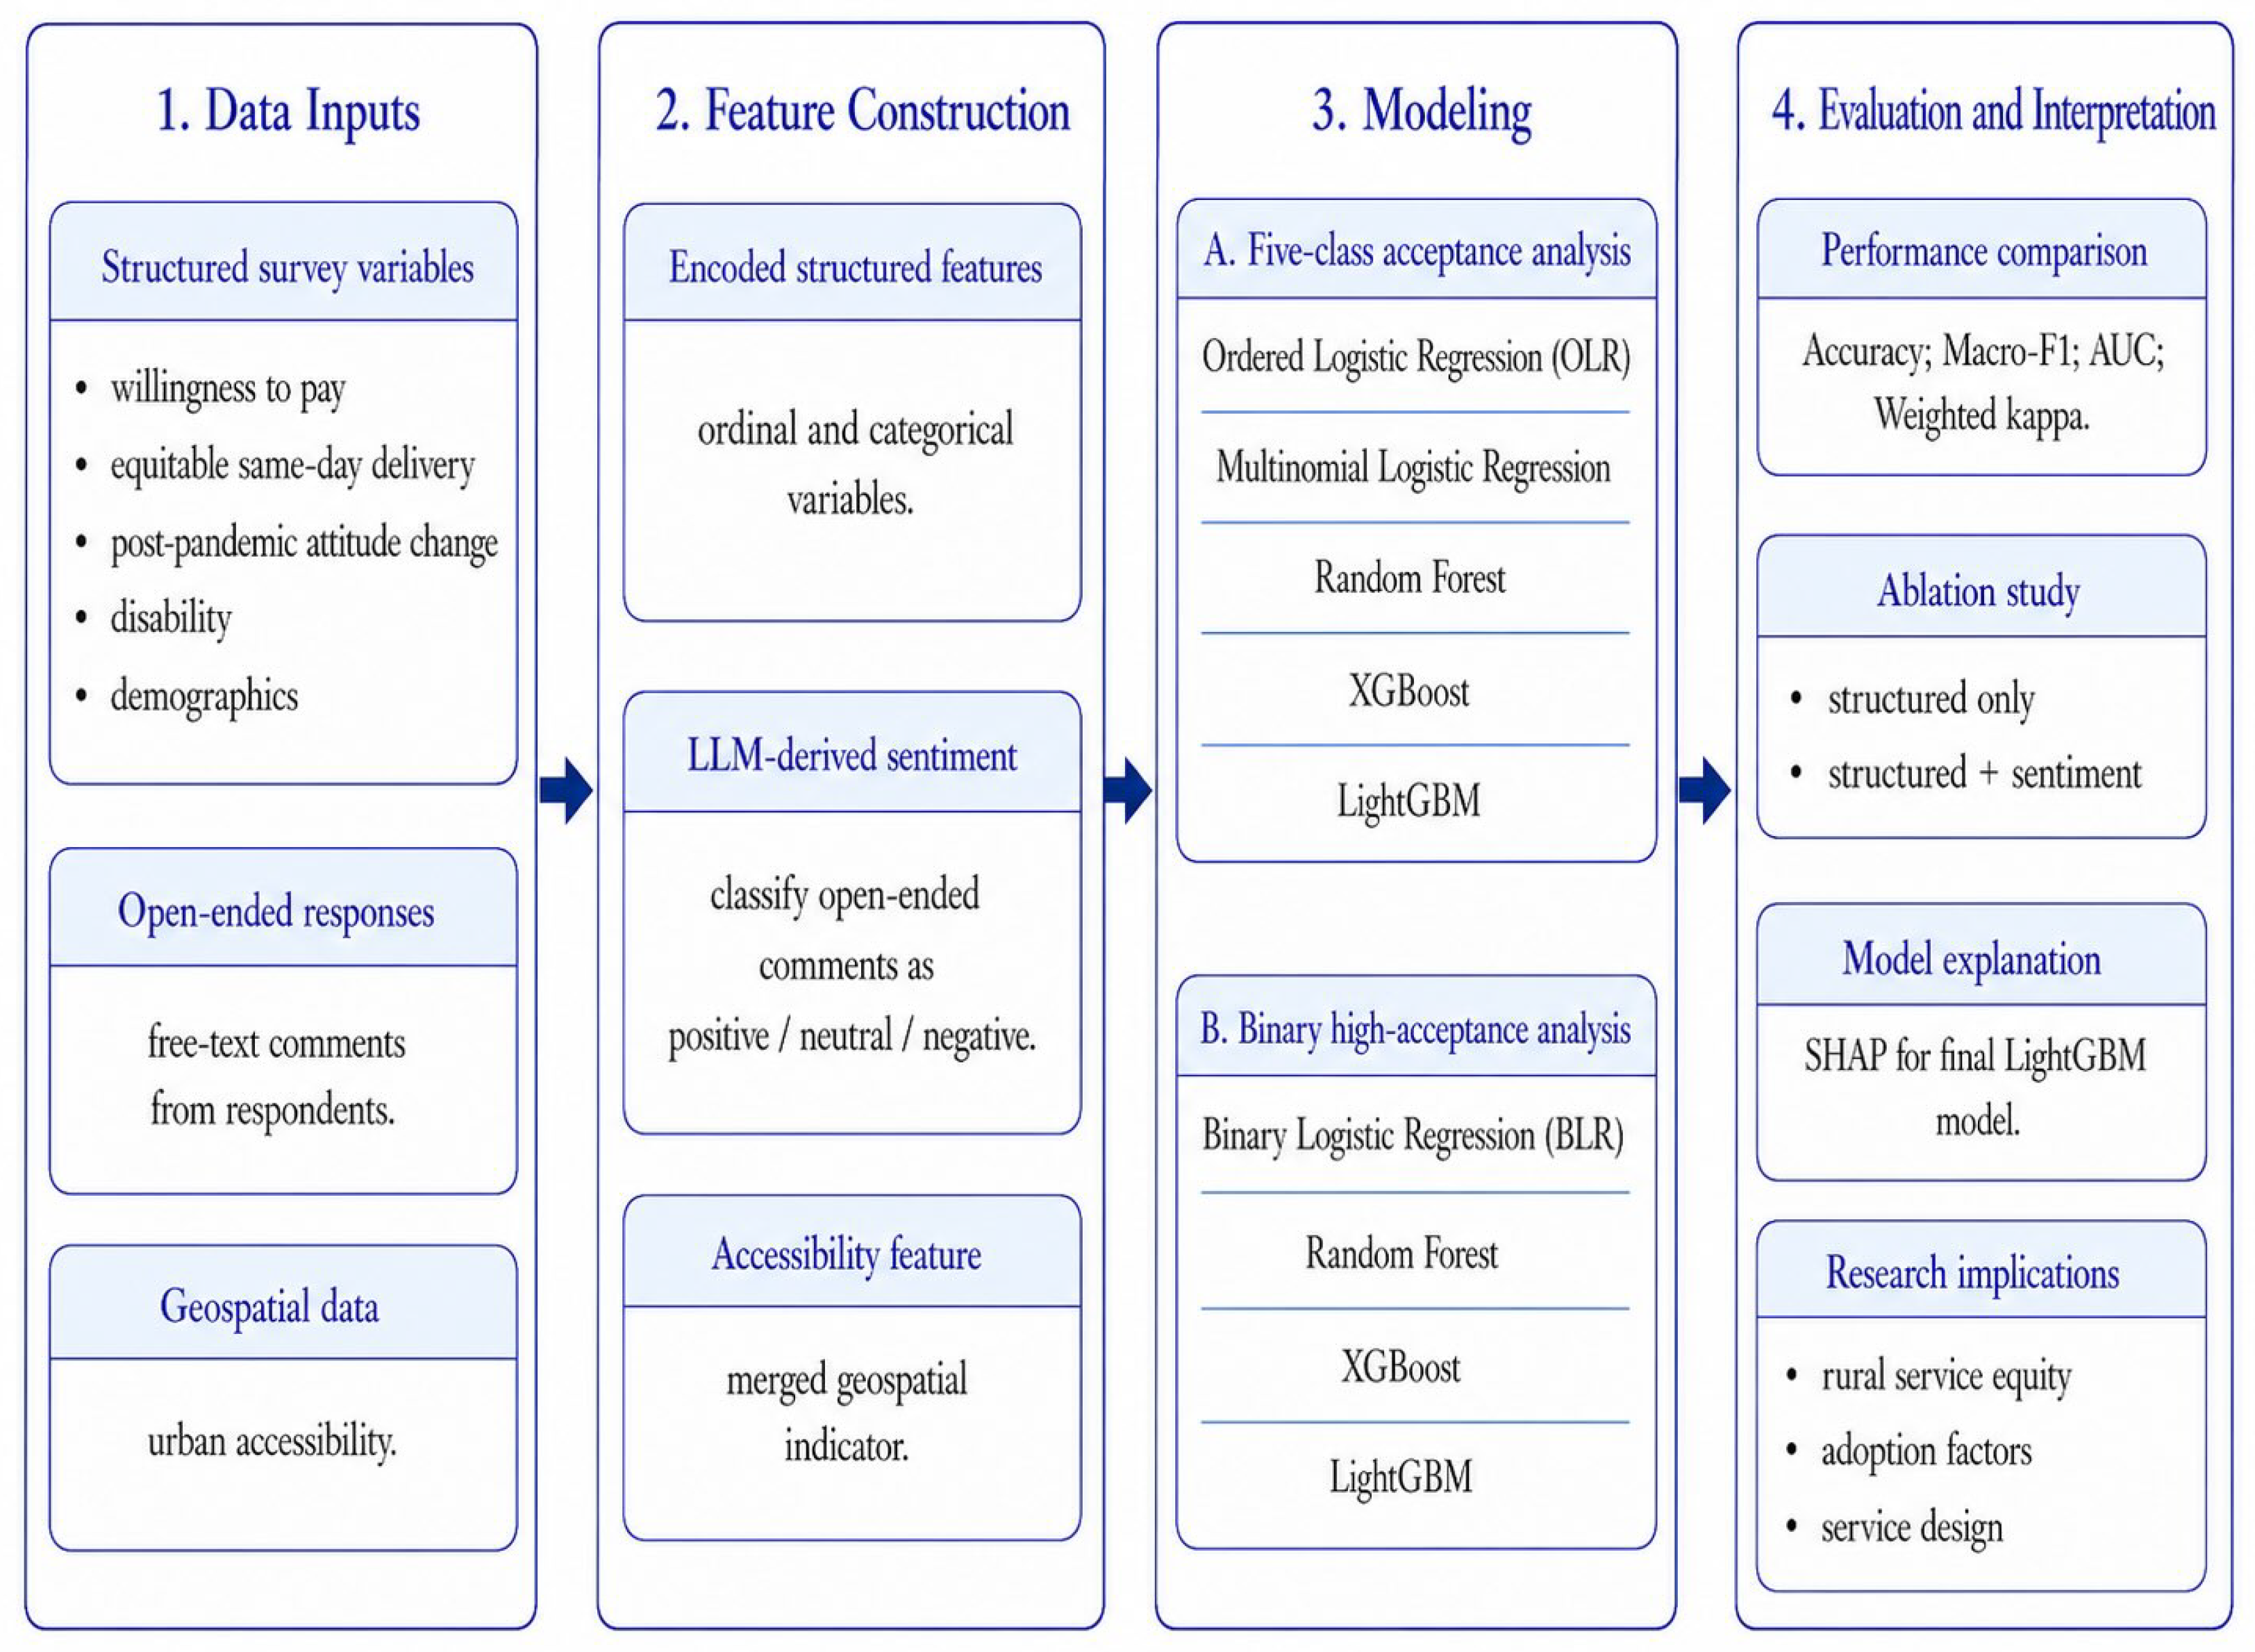
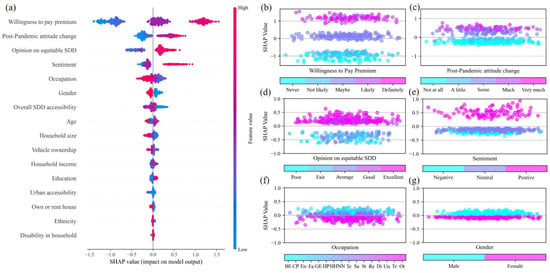
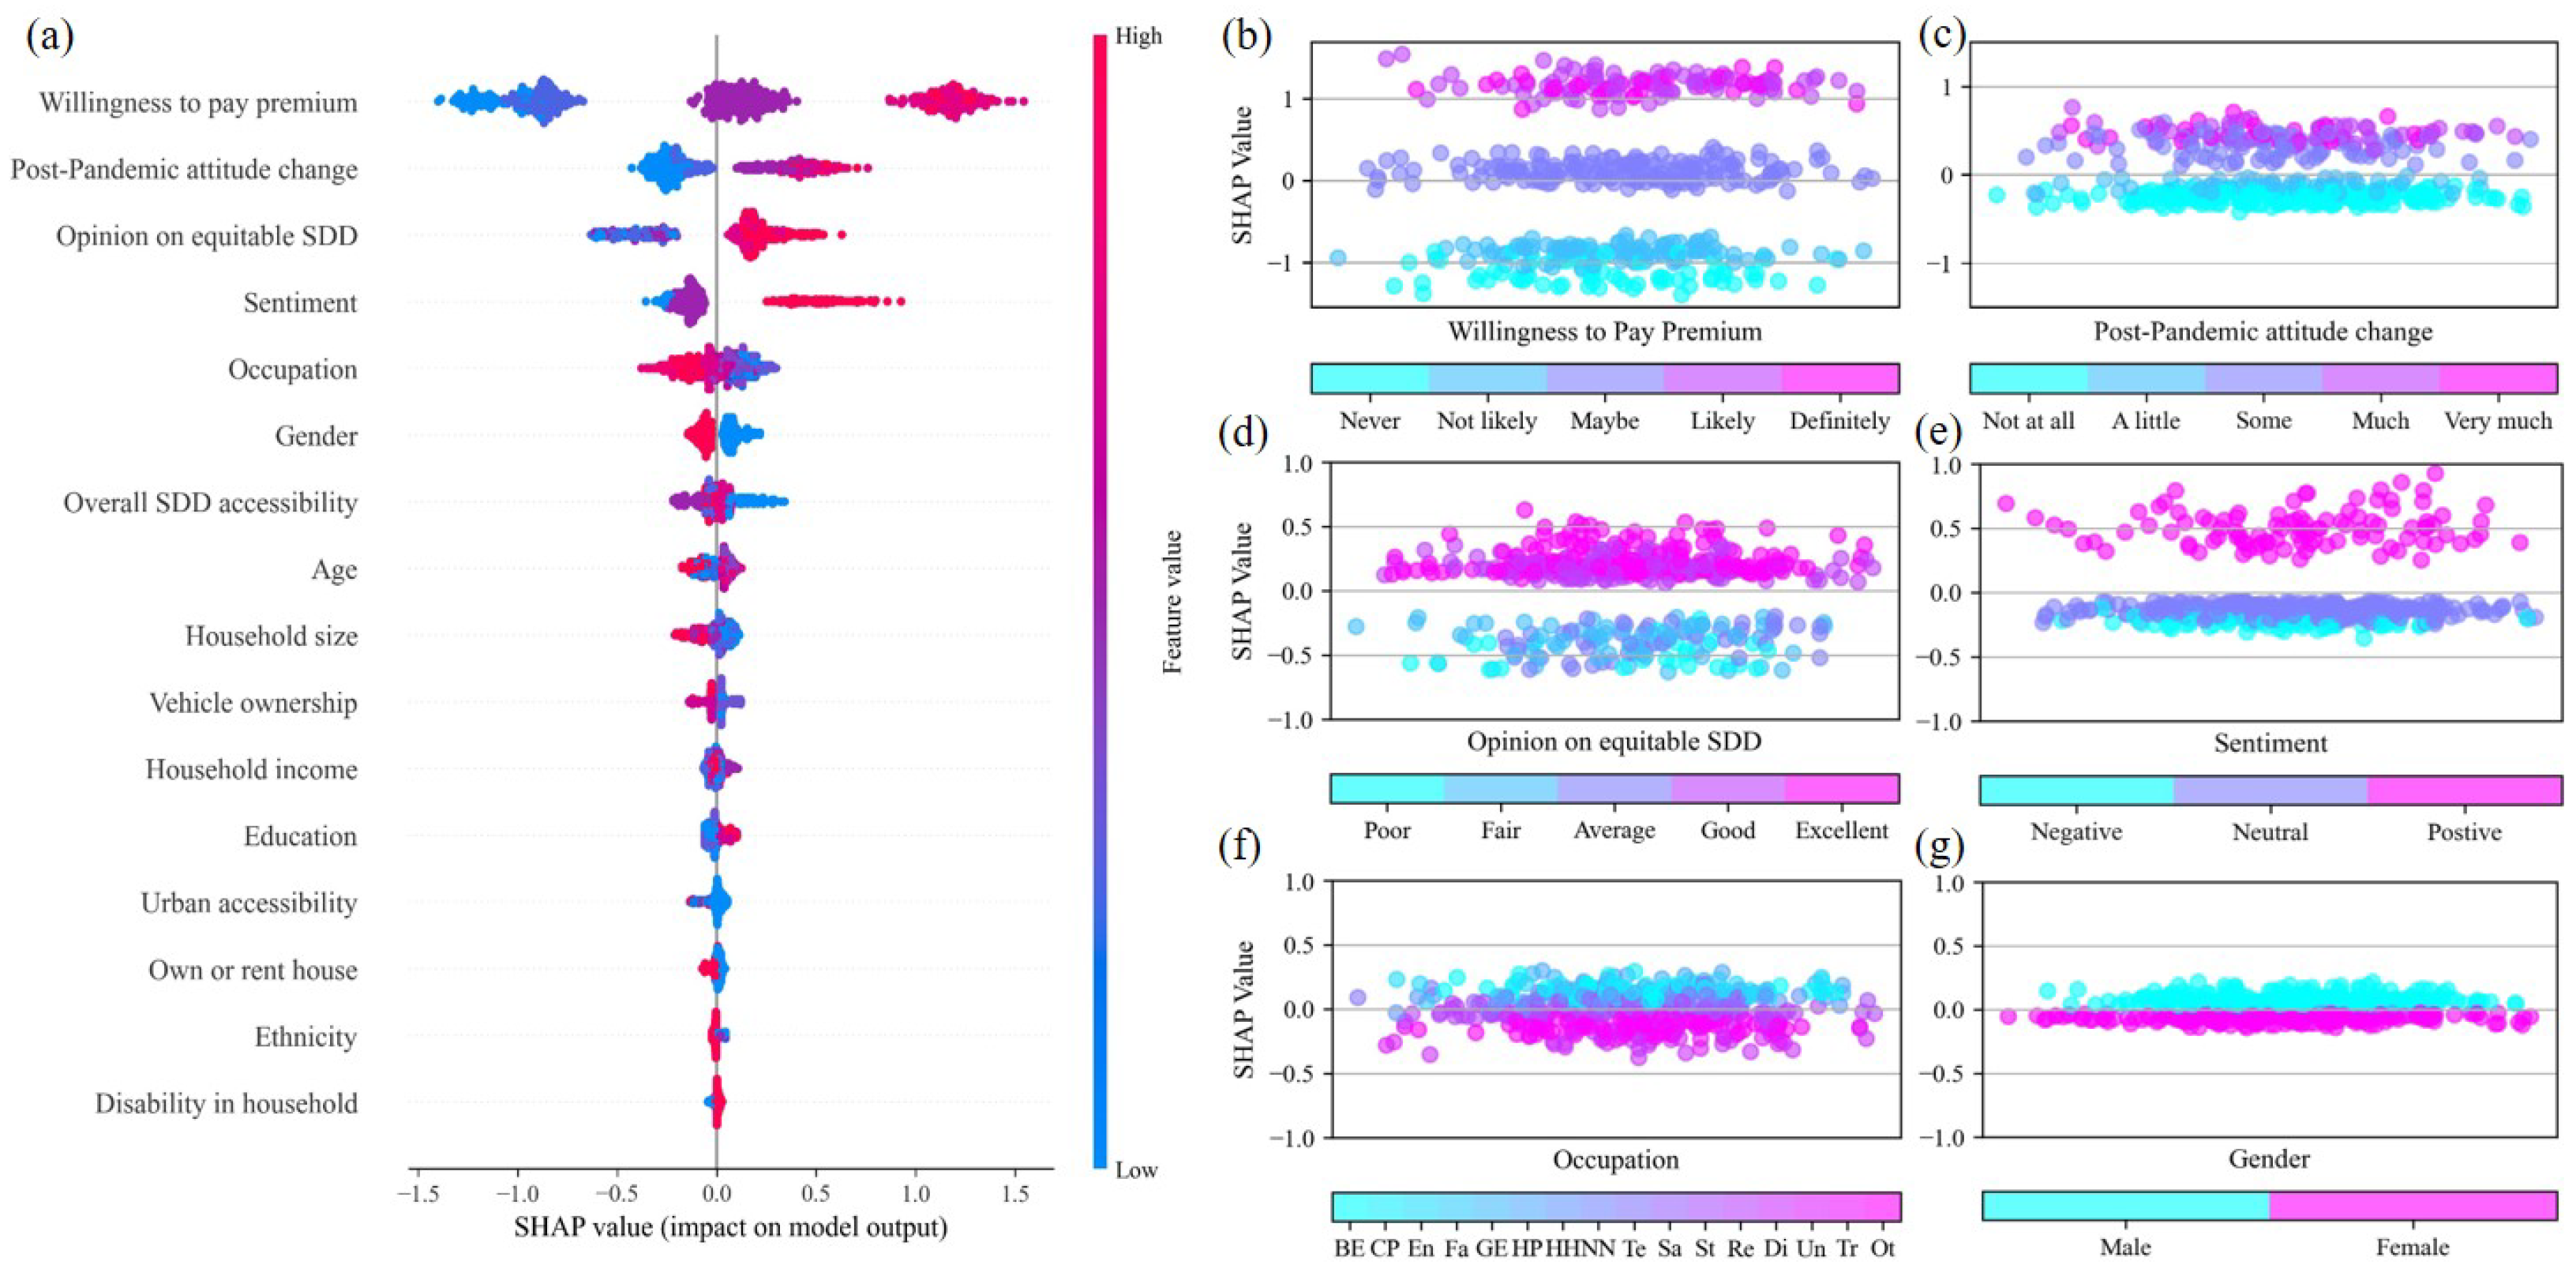
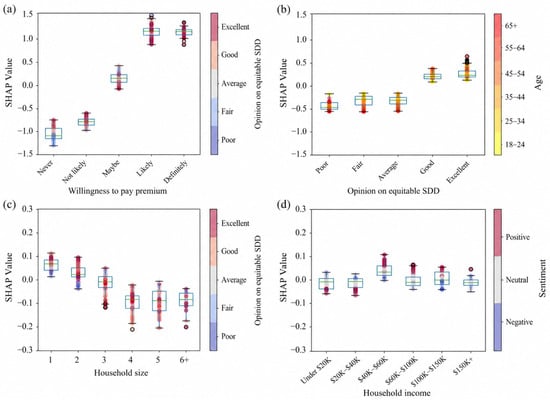
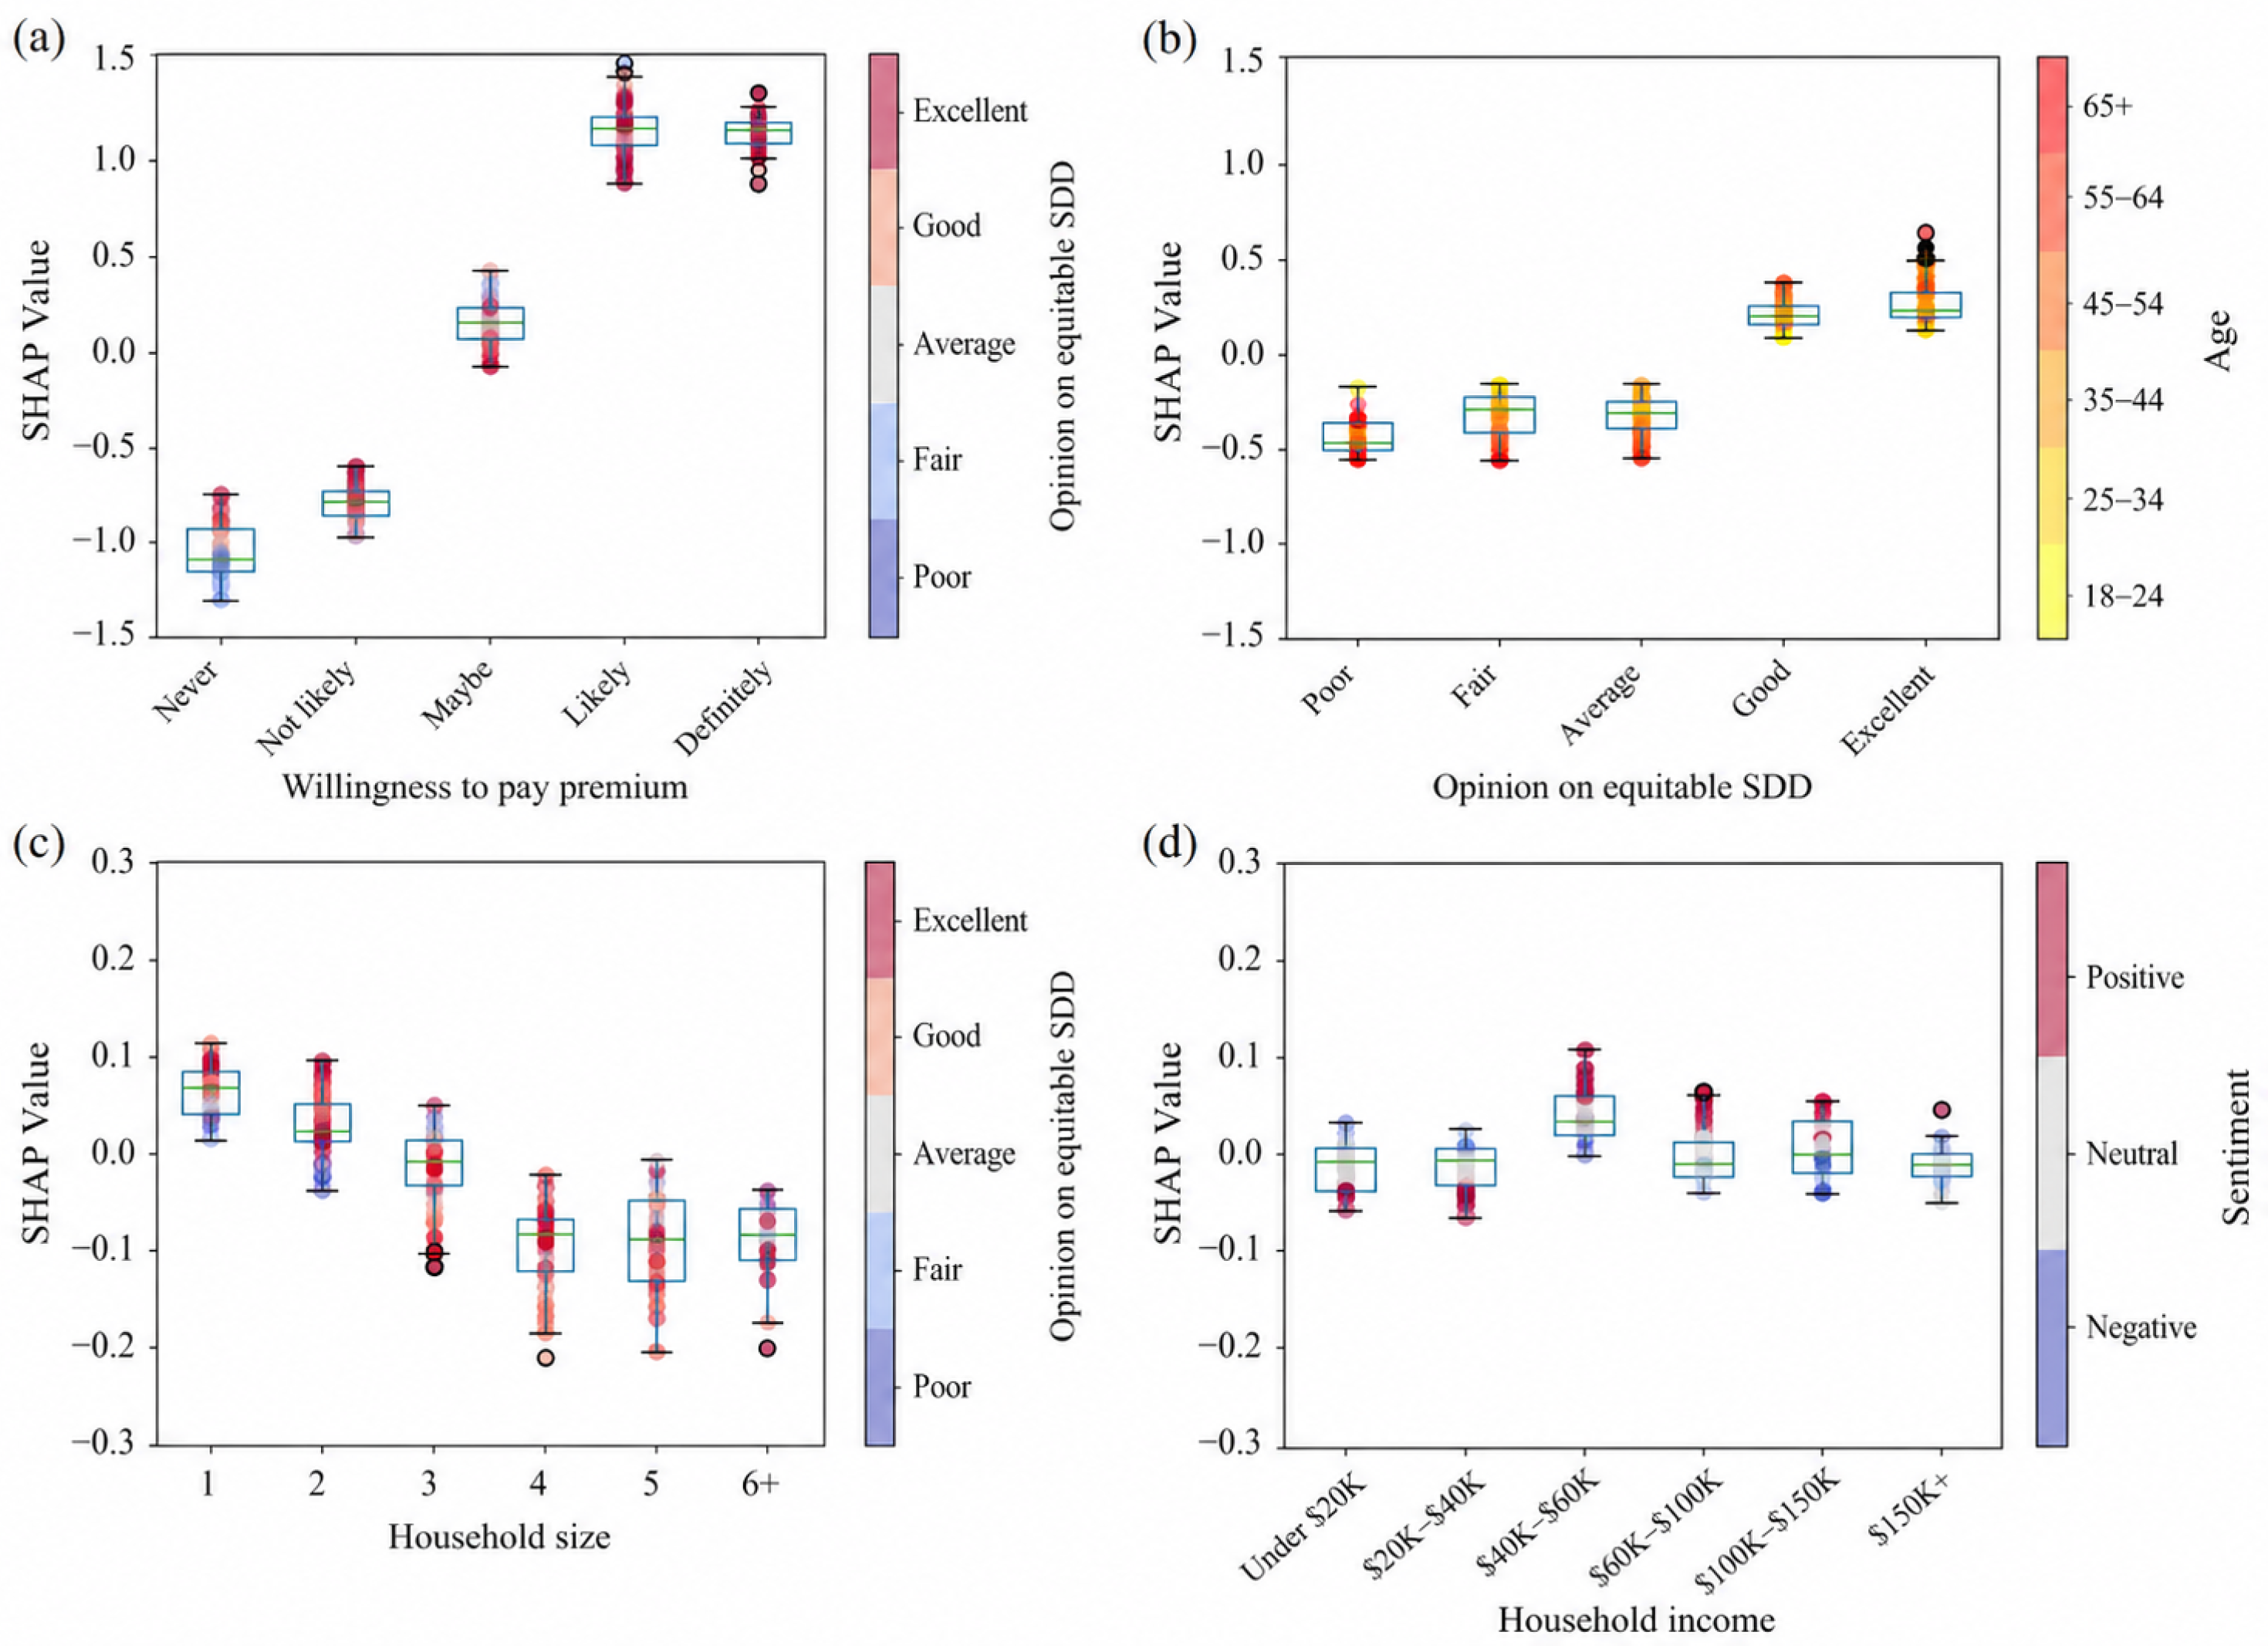
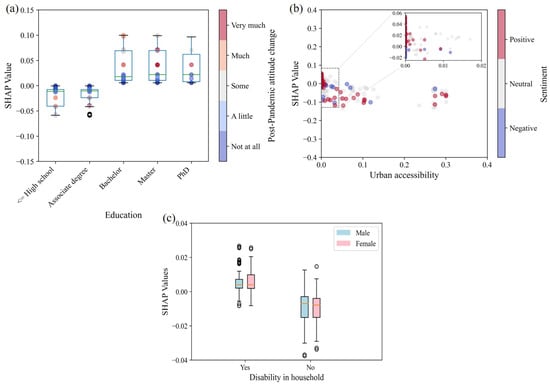
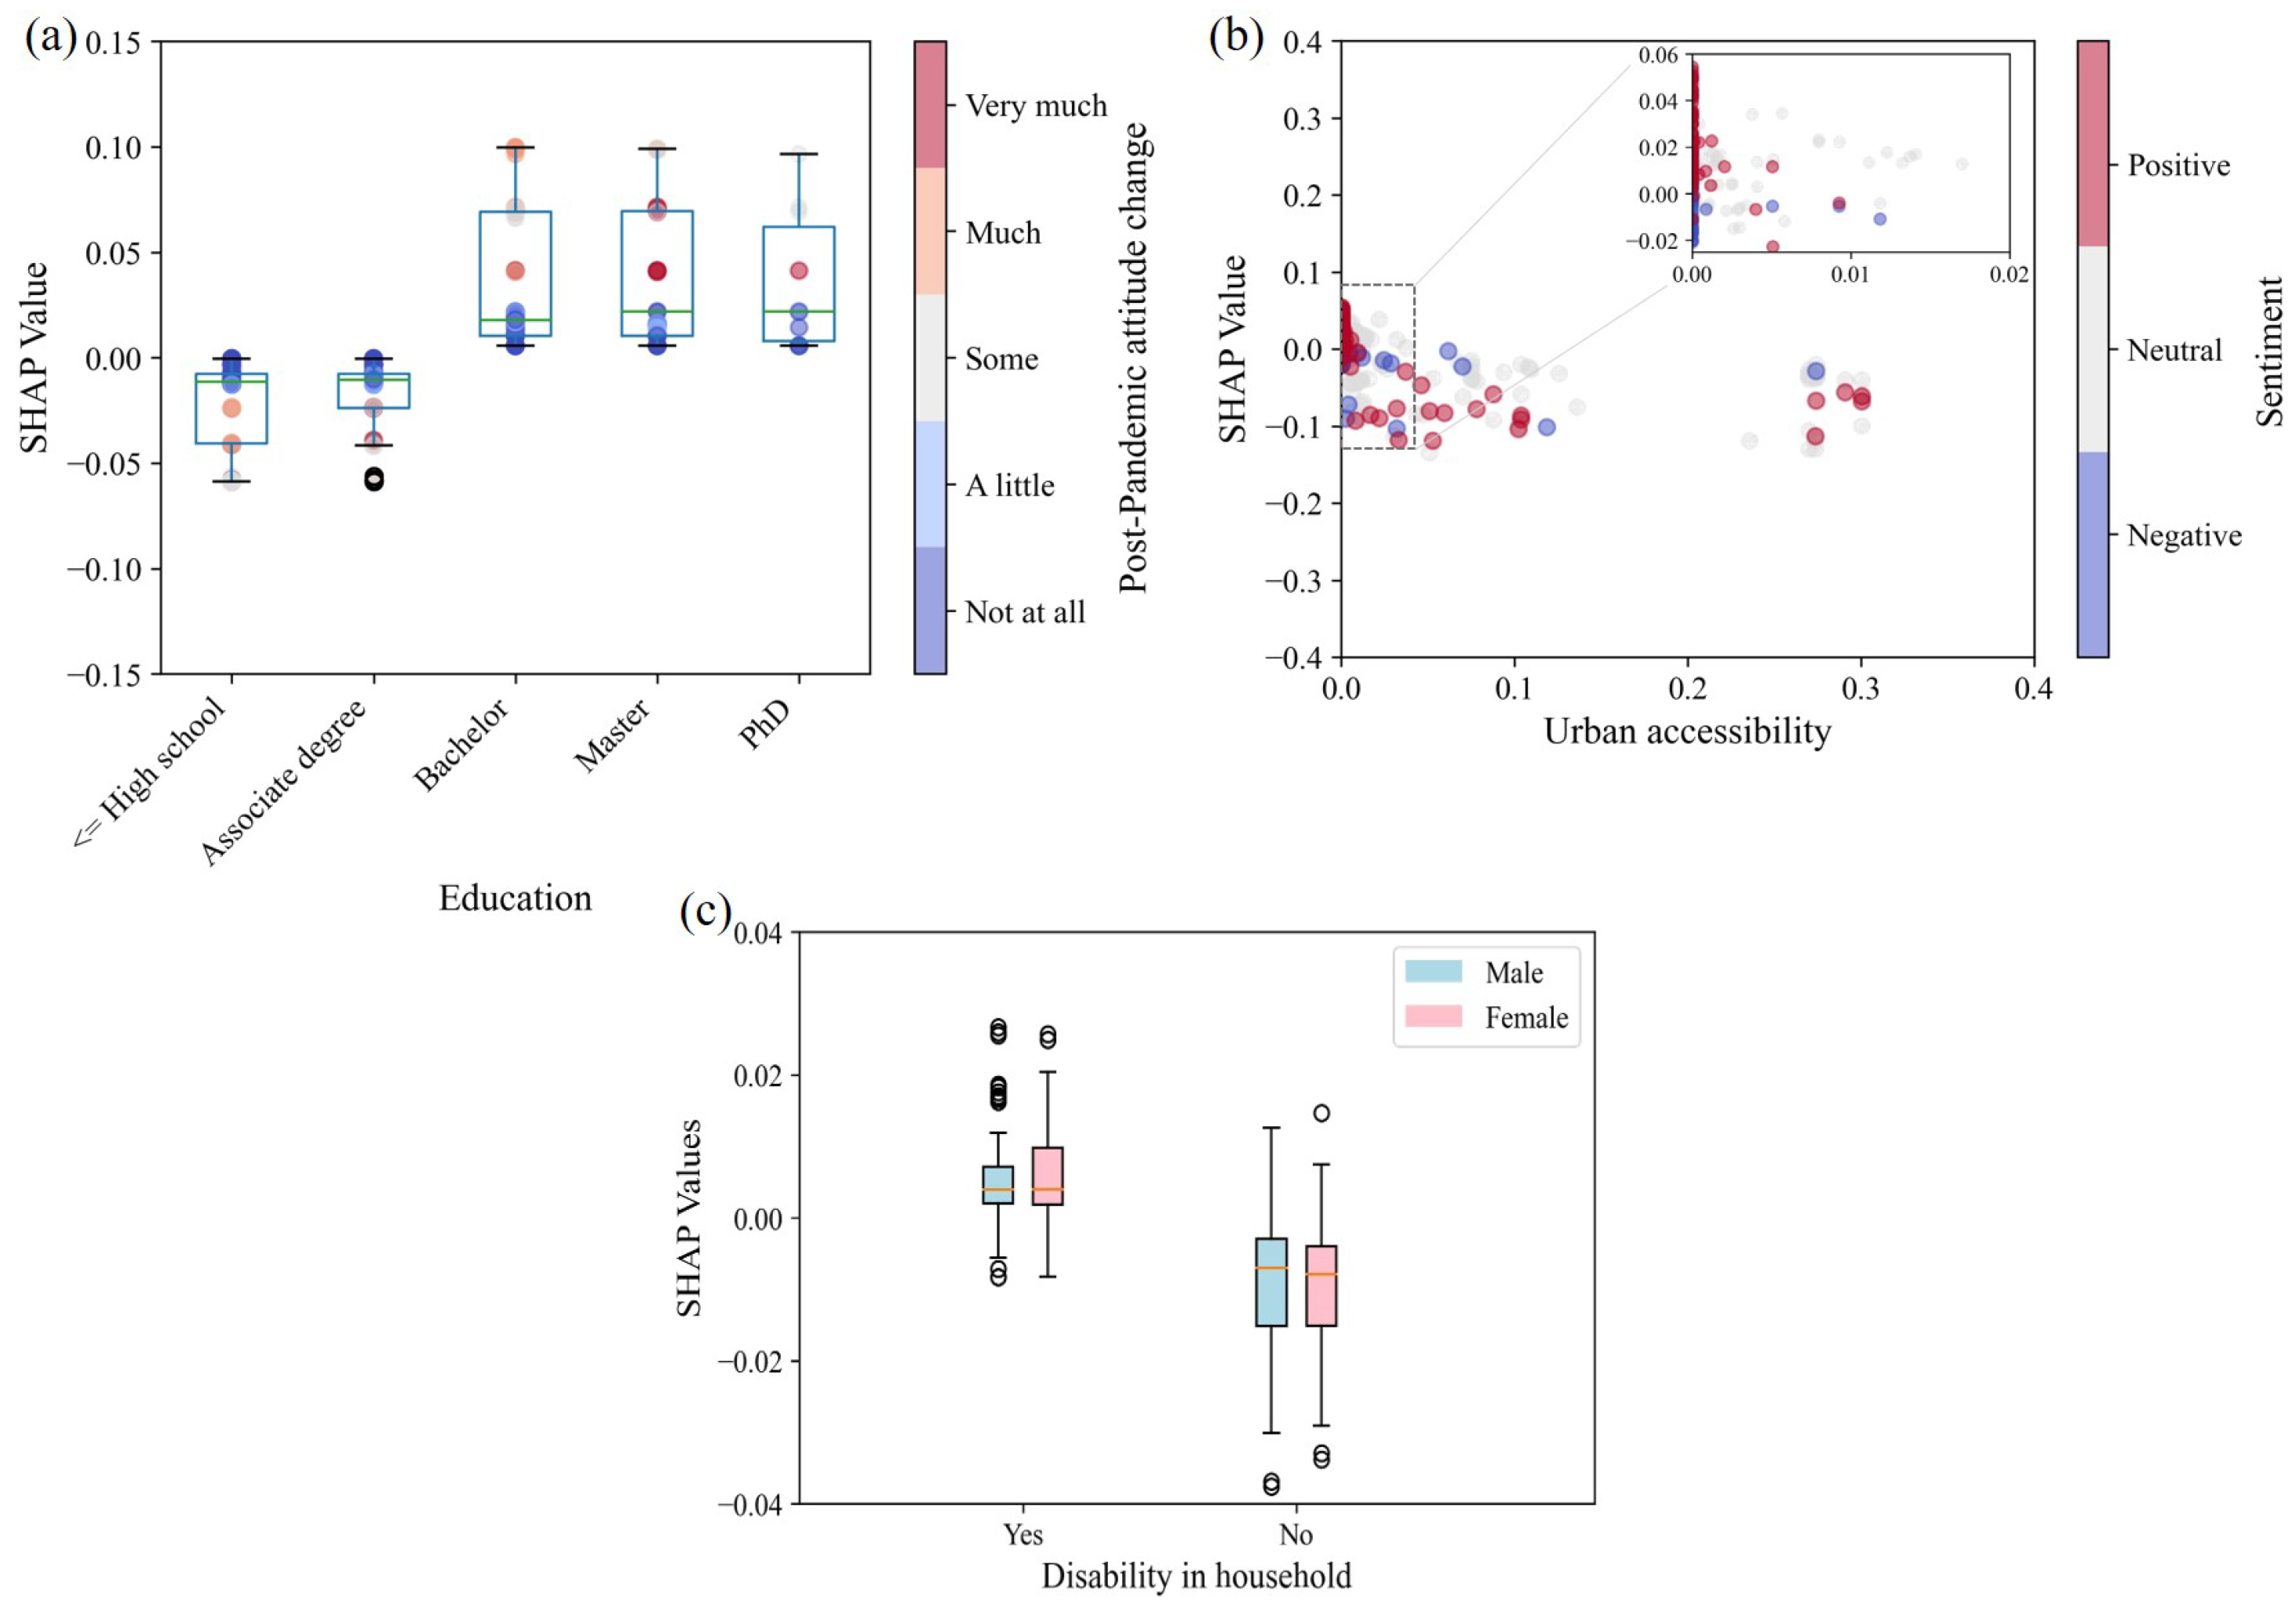
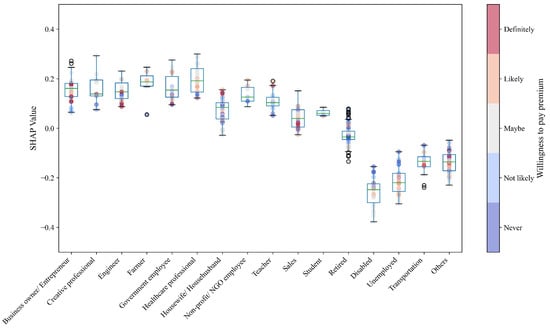
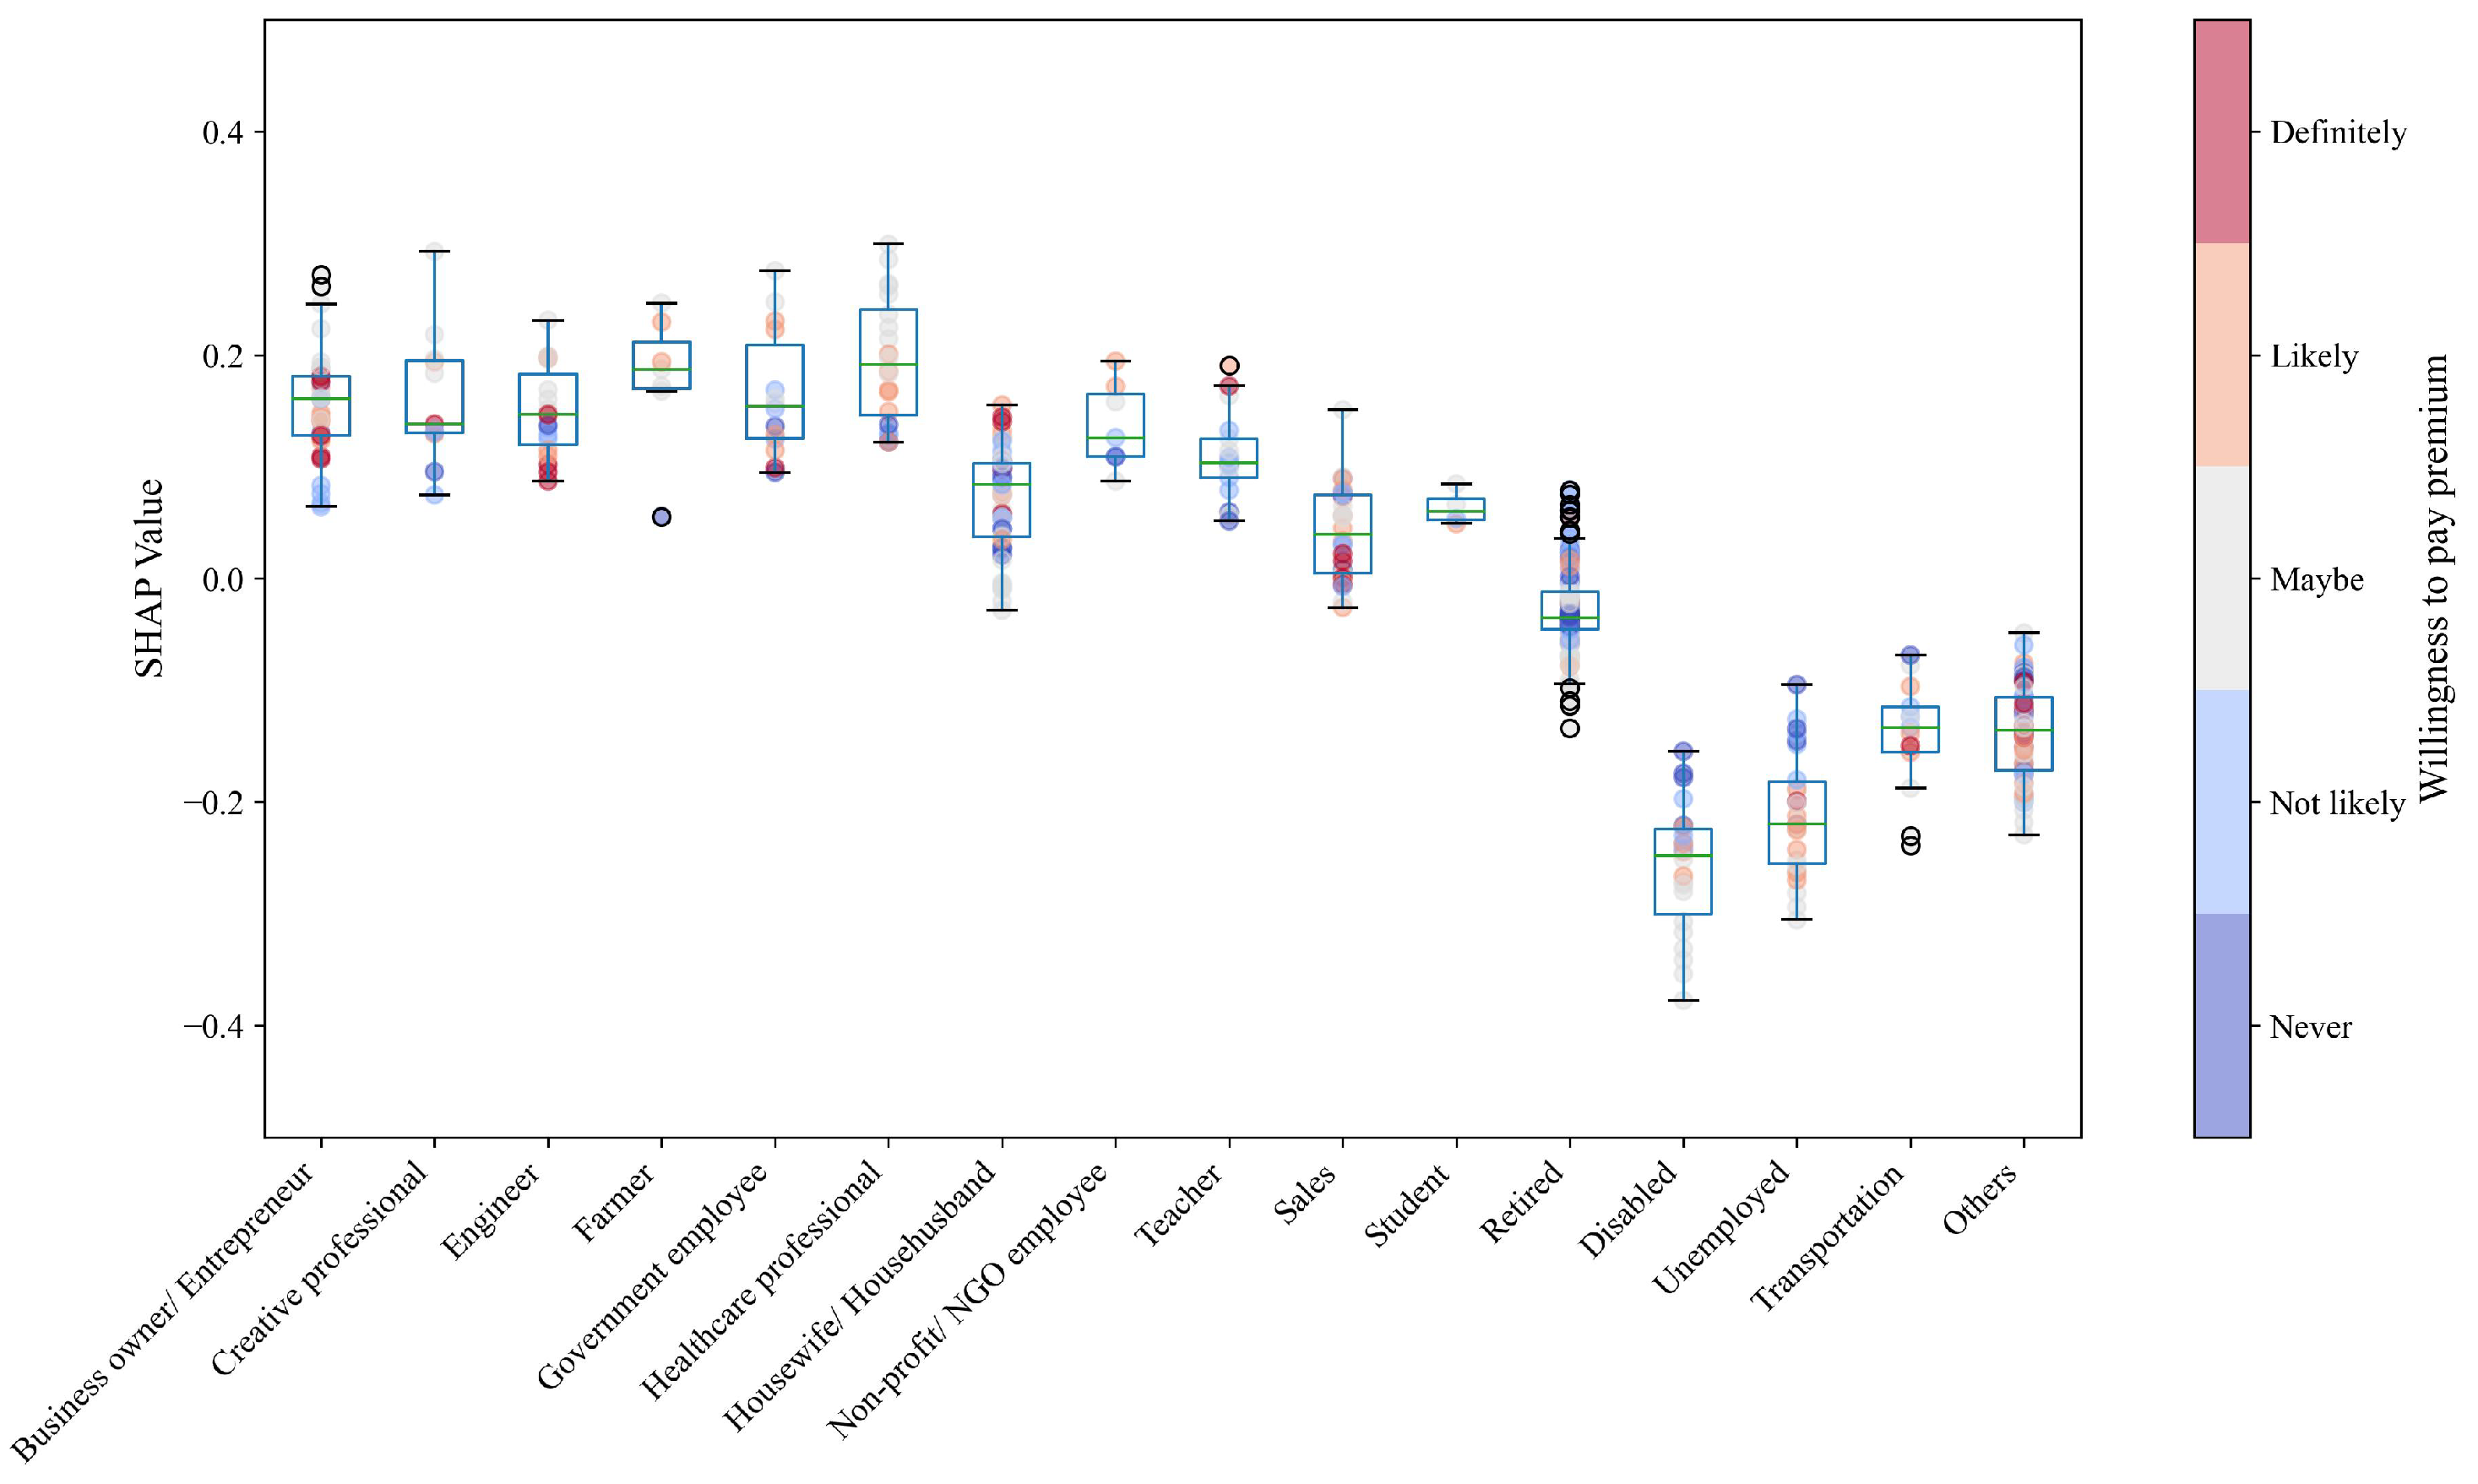

Disclaimer/Publisher’s Note: The statements, opinions and data contained in all publications are solely those of the individual author(s) and contributor(s) and not of MDPI and/or the editor(s). MDPI and/or the editor(s) disclaim responsibility for any injury to people or property resulting from any ideas, methods, instructions or products referred to in the content. |
© 2026 by the authors. Licensee MDPI, Basel, Switzerland. This article is an open access article distributed under the terms and conditions of the Creative Commons Attribution (CC BY) license.