


Highlights
What are the main findings?
- We introduce a complete framework that includes all necessary algorithms and open-source software, enabling fully automated mission planning for both the power line inspection team and each of their drones.
- We propose a new neural-network-based method for pole identification based on satellite images.
What are the implications of the main findings?
- Simulation experiments demonstrated that the introduced framework increases the number of inspected poles per working day by up to 58.7% compared to prior art, while real inspection flights confirmed that the data collected during automatically generated missions is fully suitable for further processing with intelligent diagnostic methods.
- The proposed pole identification method is fully compatible with synthetic datasets, which can be automatically generated for new types of poles, and, thanks to the expert system, it achieves 27.7% better performance than previously published solutions.
Abstract
Over the past decade, drone-based aerial inspection of overhead power lines has proven superior to traditional ground-based methods. However, in flatland areas, it remains costlier, as total expenses include not only flights but also extensive mission planning. Operators must select takeoff zones and conduct flights in compliance with weather conditions and numerous regulations. Automating mission planning can reduce operator workload, lower the risk of rule violations, and boost inspection efficiency. This paper introduces a framework for automating power line inspection route planning. It selects takeoff areas and generates drone routes for specified line segments, which meet all regulatory requirements. The framework incorporates a novel method for automatic pole-type identification using satellite imagery. The approach combines a YOLO detector, trained on synthetic data, with an expert system, resulting in a 36.9% improvement in performance (on the tested dataset) compared to prior solutions. The final solution was implemented as an open-source QGIS plugin. The experimental results demonstrate that the automated path-planning approach successfully generates inspection routes for line segments exceeding 50 km (135 poles) and increases the number of inspected poles by 58.7%, enabling the capture of power line insulators, which can then be automatically segmented and analyzed using machine learning algorithms.
1. Introduction
The problem of accurately assessing the technical condition of overhead power lines remains highly relevant for ensuring reliable and efficient power system operation, as discussed in [1]. Over the past decade, drone-based aerial inspection of overhead power lines has proven superior to traditional ground-based methods [2]. Many recent research papers focus on various aspects of autonomous inspection using drones [3,4,5,6,7,8]. At the same time, ground-based inspection remains widely used, especially in flatland areas where power lines are easily accessible. The review of the papers mentioned above shows that most of them focus on introducing safety-related functions, such as collision avoidance, or on functions related to online path planning, such as navigating a drone along the power line or even reacting to human gestures. This functionality improves the user experience for drone operators but does not solve key problems that limit the spread of aerial inspection. In many countries, any commercial use of industrial drones is highly regulated [9,10,11]. The inspection of overhead power lines should also comply with local industrial standards. E.g., in the Russian Federation, overhead power line inspection using drones should be performed according to the SRT 56947007-29.200.10.235-2016 standard [12] created by the Federal Grid Company of the Unified Energy System. This standard defines the requirements for takeoff and landing sights, distances to power lines during inspection, etc. Violation of the regulations creates direct financial risks for the company operating a drone. At the same time, choosing the right takeoff zones that allow inspection of more power line poles in fewer flights, while meeting all legal requirements, directly saves money. Conversely, a single mistake in choosing such a takeoff point may easily lead to 1 h of additional time for the inspection crew to reach another takeoff candidate. The unpredictability of such delays makes ground inspection a preferable choice for companies maintaining overhead power lines, especially in flatland areas, where it is relatively cheap. At the same time, the mentioned above risks are minimized with proper planning.
When analyzing possible mission planning approaches, it is worth noting that power line inspection with a quadrotor typically involves flying at relatively low altitudes and collecting data from close range. Low-altitude flying leads to an obstacle-avoidance problem. Also, obstacles can obstruct the line of sight between the operator and the drone, which is often prohibited by regulatory requirements. Thus, the mission planning approach should address both of these problems. The automated inspection mission planning for quadrotor operating close to power lines and meeting multiple constraints is discussed in [5,13]. In both cases, the authors use georeferenced 3D models of the area surrounding power line poles. The development of such models is quite expensive and economically justified only in limited areas with a high density of power equipment or that require precise camera targeting (e.g., substations, power plants). At the same time, the need for precise 3D modeling and georeferencing of typical power lines with lengths above 100 km will make their aerial inspection less competitive than ground-based inspection.
A possible solution is to extract the necessary data not from the 3D model, but from different geospatial layers. Indeed, today, a lot of geoinformation data is openly available: satellite imagery, the Shuttle Radar Topography Mission (SRTM) elevation model, OpenStreetMap (OSM), and OpenStreetMap data. However, the data is often incomplete and contains different errors. In many fields, decision support systems [14,15,16] serve as effective tools for reducing human effort in similar multi-objective planning tasks involving incomplete and contradictory input data. The development of a decision support system for quadrotor-based aerial inspection to plan missions using open geoinformation data is a relevant task that, to the best of our knowledge, has not yet been solved.
This paper proposes a comprehensive framework for automating inspection route planning using intelligent geoinformation data analysis to support decision-making by power line maintenance personnel. The main contributions of our research are the following: (1) the framework for autonomous movement planning of inspection teams and flight mission routes; (2) the method for automatic pole type identification via satellite images and automatic generation of a flight task for a drone; (3) the open-source QGIS plugin; (4) the experimental results demonstrating that proposed automated path-planning approach successfully generates inspection routes, enabling capture of power line insulators, which can then be automatically segmented and analyzed using machine learning algorithms.
The rest of the paper is organized as follows. Section 2 reviews related works. Section 3 describes the proposed framework and its underlying algorithms. Section 4 introduces a new method for automatic pole type identification via satellite images. The automatic route-generation procedure for aerial inspection is described in Section 5. Section 6 briefly describes the developed plugin for geoinformation data analysis and mission planning for inspection. The experimental results are provided in Section 7. Section 8 discusses the limitations of the proposed methods. The research results are summarized in Section 9.
2. Related Works
Automating the preparation of inspection teams is both relevant and in demand in the modern world. Mendu et al. [2] presented a systematic review of the use of unmanned aerial vehicles (UAVs) for power line inspection. The authors emphasize that effective coordination of multiple UAVs for large-scale inspections remains lacking and highlight the need to move toward broader inspection planning and greater automation. The review also discusses common challenges associated with inspecting power lines and poles using UAVs, including unfavorable weather conditions such as rain, poor visibility, and snow, as well as limited battery capacity, which reduces flight time and, consequently, inspection speed and coverage. Recently, Caballero et al. [17] propose a solution for rapid autonomous inspection of overhead power lines using drones. The main value of this work lies in the development of an integrated software framework for flight mission generation; it also presents a precise battery consumption model that accounts for factors such as drone mass, flight speed, and weather conditions. A further important contribution is the adaptation of the inspection approach to the requirements of power companies, including complete coverage, georeferencing of shooting points, and similar requirements. Hu et al. [18] address the problem of optimizing power line inspection. The main objectives of the proposed algorithm are to minimize the number of inspection teams required and to reduce the total inspection time. In essence, the algorithm can be regarded as a more advanced approach to clustering inspection objects in order to distribute them more evenly among teams and to construct the optimal route between inspection points.
It is important to have a precise understanding of the locations of power line poles, the general context of their placement, and the safe zones around them to generate an accurate drone route. Gauce et al. [19] discuss the benefits of creating and using digital twins for the inspection of low-voltage overhead power lines ranging from 6 to 20 kV. The proposed method involves creating an accurate representation of the space surrounding the power line, with the poles rigidly linked to their actual locations in a Geographic Information System (GIS). By creating a digital twin, a precise, deterministic space is established for subsequent drone use in power line inspection tasks, including vegetation monitoring and defect detection along the line. Park et al. [13] consider a method for operating a GIS- and Global Navigation Satellite System (GNSS)-based autopilot for drones used in the inspection of extra-high-voltage power lines. The authors identify the high level of GNSS signal distortion near steel structural elements and magnetic interference near the conductors as the main problem. The authors also define visibility criteria to maintain the drone in line of sight during inspection and identify, selected empirically, safe distances of 30 and 45 m for power lines with voltages of 335 kV and 765 kV, respectively. Shuang et al. [20] examine a method for refining the position of power poles and the course of the line itself based on the Canny edge detector, using filtering by two groups of features: brightness gradient and expected wire width. In contrast, the line direction is clustered using k-means.
Knowledge of the poles’ locations and types enables route generation. Romanov et al. [5] describe an automated, offline drone mission-planning approach for thermal inspection of a power plant. The authors highlight a U-shaped flight profile between target points, as this approach provides the highest level of safety under power plant conditions. In addition, the work considers a method for creating safe-altitude maps for drone flights and a local turbulence map to avoid drifting into hazardous zones due to wind. An algorithm for flight mission generation based on a genetic algorithm and RRT is also presented. Li et al. [21] propose a fully autonomous framework for the inspection of high-voltage power lines using drones. This work presents an example of an algorithm for the autonomous generation of an inspection program based on three modes: fine inspection, arc-chasing inspection, and channel inspection; a system for improving flight accuracy and stability; and a method for automatic drone battery replacement. A notable contribution is an improved detector YOLOX_m for identifying points of interest, such as bird nests.
Accurate identification of the pole is needed both for planning camera angles during inspection and structuring further inspection reports. Gomes et al. [22] propose a method in which the detection problem is addressed by using Adaptive Training Sample Selection (ATSS) as the detector. Marty et al. [23], in turn, propose a new Convolutional Neural Network (CNN) that detects spots of specific classes, after which the pole type is determined at the post-processing stage using the K-means method and an area range. Rodrigues et al. [24] present an inspection approach that simultaneously combines information from three sources: Red-Green-Blue (RGB), infrared, and Light Detection and Ranging (LiDAR). In this framework, RGB and infrared imaging are used to inspect the power line itself, while LiDAR is used to inspect the surrounding area. The main drawback of the proposed solution is the high cost of drones capable of carrying such a payload.
Based on the presented material, it is clear that all methods, in one way or another, rely on GIS models in their operation, and that the accuracy of these algorithms is proportional to the accuracy of the maps used. The methods proposed in this work do not contradict the approaches reviewed above; rather, they represent a higher level of automation that prepares the data required by those methods. It is also important to emphasize that pole type identification must be performed before the aerial inspection, as it directly determines the inspection procedure. When pole-type information is unavailable, the mission is generated using an averaged scenario, resulting in either incomplete coverage or unnecessary maneuvers with no diagnostic value. The completeness of diagnostic data is determined at the imaging stage. If the pole type is identified after the flight, missing viewpoints and inspection zones cannot be recovered without an additional field visit (subsequent classification cannot compensate for the absence of data on critical structural elements, thereby reducing inspection reliability and increasing the amount of repeated work).
The pole type also provides context for interpreting defects during data acquisition: different structures require different spatial resolutions, sensor orientations, and imaging emphases. Without prior consideration of these factors, some defects may either not be captured within the inspection field of view or be recorded in a form unsuitable for analysis. Preliminary pole-type identification is also critical for flight safety, as it provides information on the physical arrangement of structural elements and conductors, which must be considered during mission planning. Finally, identifying the pole type prior to inspection enables direct and correct integration of inspection results into maintenance and repair processes. As a result, inspection data are immediately structured in a format compatible with equipment passports and asset management systems, eliminating the need for subsequent manual normalization and repeated expert processing. As a result, inspection becomes part of a controlled engineering workflow rather than an isolated step of visual data capture.
Compared with the previous, the proposed approach occupies a different position in the inspection workflow. Autonomous UAV inspection systems, such as Li et al. [21], focus on executing inspection tasks with dedicated UAV hardware, ground stations, flight control algorithms, battery-replacement systems, and object-detection models. These systems rely on already available pole parameters, such as coordinates, altitude, pole orientation, and cross-arm dimensions. In contrast, the proposed framework focuses on automatic pre-flight preparation when such complete asset data are unavailable or incomplete. Studies on object recognition, such as Gomes et al. [22], address the mapping of utility poles in aerial orthoimages. In contrast, Marty et al. [23] use CNN-based satellite image classification to identify high-voltage transmission poles and surrounding objects for safety-perimeter assessment. These works do not transform the recognition results into diagnostic flight missions. The proposed method connects pole-type identification with mission generation: the detected pole type determines the diagnostic viewpoints, sensor orientation, and inspection trajectory. Therefore, the novelty of this work lies in the operational integration of GIS analysis, satellite-based pole-type recognition, expert post-processing, regulatory constraints, and QGIS-based generation of ready-to-use inspection routes.
It should also be noted that completing all route waypoints using a single battery pack is not feasible, as confirmed in [21], and this often conflicts with flight operation standards that require direct line-of-sight between the drone and the operator. Therefore, it is also important to partition the inspected line segment into groups and select dedicated launch points for each group. This statement is also supported by [5,17], where the same issue was addressed and the proposed approach outperformed [25,26].
3. The Framework for Automating Power Line Inspection Route Planning
There are various types of power line inspection carried out in different ways, and they may not coincide in time. For example, inspection of insulator integrity is performed much more frequently than inspection of power line poles or their foundations. The proposed framework enables planning the inspection team’s route along power line poles using baseline technical documentation and geospatial data.
The required data includes baseline technical documentation containing the power line rating and the number of poles for each type. However, inspection teams or companies providing such services typically lack data on which pole types are located at specific positions along a given power line. In addition, due to the layout of power lines, inspection teams are expected to traverse rough terrain, creating mobility and passability issues. The use of UAVs can partially address this problem, but their operation is subject to a fairly broad set of constraints, e.g., [12].
The framework proposed in this paper uses the following set of input data: SRTM (NASA Earthdata), a forest canopy height map derived from either OSM data or the World Resources Institute Meta Global Canopy Height (2018–20) product, and OpenStreetMap geospatial data. The additional use of a canopy height map is motivated by the limited accuracy of SRTM in forested areas, where trees can interfere with maintaining a line of sight to the drone. The altitudes provided by SRTM correspond to the elevation of the radar scattering center of targets; however, for coniferous forests, the height bias is on the order of 2–5 m [27], and for comparable magnitudes in the experimental areas, it is approximately 4–6 m [28]. It can also be assumed to reach up to about 50% of the total canopy height, although the accuracy also depends on canopy density, forest type, and the season of forest acquisition [29,30]. OpenStreetMap data are used to determine the locations of power lines and their poles, as well as roads, rivers, water bodies, and forests. Based on these data, a suitable starting point for aerial inspection is selected, and drone visibility during inspection is evaluated using SRTM and canopy height data. The proposed framework assumes the application of several data processing methods in a specific sequence, as shown in Figure 1.
Figure 1.
The proposed framework.
The proposed solution is scalable and adaptable across countries. White blocks on Figure 1 represent operations that do not depend on any technical or legal requirements. The block color pink depends on legal regulations and industry standards, which are generally unique to each country. These regulations affect UAV flight zones with respect to the operator’s position, the locations of takeoff and landing zones for inspection flights, and the requirements for line of sight and maximum flight altitude. The green blocks depend on the construction parameters of inspected power lines. They are usually specific to each region and can vary within one country. At the same time, while the pink block requires changing the formal rule related to the legal requirement (which requires additional programming in the current implementation), the green blocks do not require any software development to adapt to a new region. Instead, the operator just needs to change the parameters of the corresponding modules and create a new syntactic dataset for neural network training (since the dataset is synthetic, its preparation task can also be automated). Finally, the blue block depends on parameters related to safe distances from the drone to poles and wires. The higher voltage rating will require higher distances. At the same time, this block can be parametrically tuned and does not require any changes to its code to support different voltage ratings.
First, road data are loaded and used to build a weighted connected road graph [31] by extracting all intersections and turns, then connecting them based on road geometry and estimating distances from each identified point to its neighboring points. This graph is also used to plan a route along power line poles [32]. The core idea of generating a path along poles is to move along the power line whenever possible, and to detour obstacles via public roads when direct movement along the poles is difficult. Rivers and water bodies, along with SRTM elevation data, are used to detect obstacles. Water barriers are considered impassable; therefore, if such a barrier lies between two poles, the inspection team returns to a road, bypasses the obstacle, and then proceeds to the next uninspected pole from the nearest road turn or intersection. There are also local obstacles, such as ravines and steep ascents, which can be very difficult to overcome off-road. To detect them, a mask is applied to each vectorized SRTM polygon within a circle whose radius equals the distance from one pole to the next. Within this circle, elevation changes are sought such that the central polygon of the mask is at a minimum or maximum in any of the four directions or along the diagonals, thereby enabling detection of a ravine bottom or a cliff edge. As a result, a route for movement along power line poles is formed as a sequence of points to be visited, including poles, road intersections, and turns.
A crucial part of aerial inspection planning is selecting takeoff and landing zones. Their positions are constrained both by industrial standards (e.g., [12]) and flight safety requirements [13]. These constraints include keeping the drone within the operator’s direct line of sight at all times during the mission and, consequently, within the target point’s direct line of sight. In addition, the takeoff zone must not be located within 20 m [13] of the power line conductors. Another important selection criterion is the distance from takeoff to the target point, which, according to [12], must not exceed 1.5 km. A detailed description of the takeoff selection method is provided in [32]. The method considers convenient launch zones, those that intersect roads, thereby speeding the movement of inspection teams. Visibility is determined by checking whether trees or forest belts exist between the candidate zone and the target point. If such an obstacle exists, its height is estimated from the canopy height map, and based on this, it is determined whether the quadcopter maintains visibility. All vectorized SRTM polygons that satisfy the visibility conditions for at least one pole and intersect roads are added to a list, from which the most suitable candidates are selected based on visibility to the largest number of poles. Movement between such zones is also implemented using the same weighted road graph, with a list of points (turns and intersections) that the crew must pass through to reach the next drone takeoff/landing zone.
Since visibility is also affected by weather conditions, which cannot be predicted in advance, and the decision to conduct a flight mission is made on site by the operator, and since map data may also be inaccurate, this issue can be addressed by using a route replanning approach based on the WaterFront algorithm [33]. This method enables rapid route recomputation directly while the inspection crew is on the move.
The next important part of the framework is a new method for automatic pole type identification. This method is required to compute the image capturing points during inspection. It is discussed in more detail in the next section of the paper. Note that to identify pole types at specific locations, we use a synthetic dataset. To obtain the dataset, the pole types encountered along the line were modeled, and the dataset relies not only on the pole’s appearance in a simulated high-resolution satellite image but also on the shape of the shadow it casts. A virtual modeling environment with lighting support, such as SolidWorks 2023 SP4.0 or Unreal Engine 5.7, was used to generate such a dataset. In addition, given geospatial data on pole locations (from OpenStreetMap), the type of each pole can be determined in a targeted manner, noting that the pole type can change only under a few conditions: when the line crosses a road or a river, or at a line turn. Thus, the pole locations and their types become known; based on this, it is possible to generate drone routes, since knowing the pole type implies knowing the positions of all elements of interest on it.
The next step in the framework is to generate the flight mission. The key criteria for generating it are the distance from the launch zone and maintaining a line of sight to the drone throughout the inspection. Route planning uses geospatial data on pole locations and dimensions, and accounts for the need to maintain a safe separation from the conductors. Given the pole location, its type, and the inspection points of interest on the pole, imaging waypoints are computed algorithmically, accounting for the ability to aim either the drone gimbal or, if no gimbal is available, the drone itself at the target points on the pole.
The route generation procedure is illustrated in Figure 2. First, the image capture point closest to the launch zone is identified; then, an entry point used to join the route is defined, (located n meters before the first imaging point, parallel to the power line, where n is a configurable parameter); the image capture points are arranged clockwise along the power transmission line, and for crossing the line, additional points are placed at a safe altitude above the conductors. If the visibility conditions are violated, the drone receives a command to climb to an altitude that restores the line of sight. Such behavior allows the operator to analyze and adjust the generated mission easily if necessary.
Figure 2.
An example of a completed flight assignment.
The final step is preparing the flight plan documentation. The framework described above provides all the necessary information for this stage, but its automation is considered out of scope for this research.
4. The New Method for Automatic Pole Type Identification
Preliminary identification of the pole type is required before aerial inspection, since the completeness of diagnostic data is formed precisely at the image acquisition stage. The pole type determines the location of critical elements, the required viewing angles, spatial resolution, sensor orientation, and permissible flight trajectories, taking into account structural features, conductors, and other factors. Additionally, prior knowledge of the pole type enables immediate structuring of the inspection results in a format compatible with equipment passports and asset management systems, thereby reducing manual normalization and repeated expert processing.
Incorrect classification may lead to collecting inspection data from the wrong points, at the wrong camera angle, and/or with incorrect inspection equipment. In this case, the inspection crew will need to correct the pole type, regenerate the mission, and repeat the flight. Similar errors and consequences also occur in cases when the inspection mission is planned manually. The lower the classification error rate, the less time overhead is required to perform inspection.
The new method is based on identifying the shadow cast by a power line pole in a satellite image. It relies on a neural network trained using a synthetic dataset. The use of a synthetic dataset is motivated by the difficulty of obtaining relevant training data for the detector, as data quality depends directly on the quality of the satellite imagery. The algorithm for the proposed solution is provided below (Algorithm 1).
| Algorithm 1 Post-Processing of YOLO Detections |
|
The approach based on synthetic data is feasible because power line poles are generally manufactured in accordance with strict industrial standards that define their geometry. In this research, three-dimensional models were created in SolidWorks (Figure 3), and the dataset itself was assembled based on the Sun’s motion throughout the day. To achieve this, the resulting model was illuminated cyclically according to the solar movement characteristic of a latitude of 55.7° in the Northern Hemisphere. Different types of surfaces onto which the shadow was cast were used. The 360° movement of the shadow was recorded as a video at 30 fps, with the poles’ shadow randomly oriented at the start of recording. For this purpose, various satellite images were used, representing different environmental conditions around the poles: an agricultural field, a plowed agricultural field, a meadow, a flat field, a meadow overgrown with shrubs, and a gray background (Figure 4). In addition, blank satellite images containing no power line poles but showing other landscapes were added. The rotation angle of the poles against the background was set to 0°, 20°, 45°, 65°, 80°, and 90°, which provided data for different power line orientations. The synthetic dataset was prepared for three pole types: PP-750, U-110, and UB-110 (Figure 5). The dataset was manually annotated in the Roboflow environment by splitting the video into frames, with the shadow rotation angle approximately 8.37° per frame. Before augmentation, the total number of images for each class was 244 for PP-750, 234 for U-110, and 225 for UB-110. In addition, 100 background images without any target objects were added from the dataset [34] to improve recognition of the target objects. The following preprocessing steps were applied to the resulting dataset: auto-orientation, resizing to , and conversion to grayscale. Additional augmentation was performed using blur and random rotation from −97 degrees to +97 degrees. The dataset consists of 1949 images, split into training, validation, and test sets (available on Zenodo [35]). Using the same approach, a dataset for any latitude range, with any number of pole classes and any number of typical underlying surfaces, can be generated. The proposed method can be easily extrapolated for application to other pole types in other countries. To do this, it is necessary to recreate the required pole types, generate a dataset, and train the model on the resulting data.
Figure 3.
3D models of the poles used to create the synthetic dataset: (a) a U-shaped pole (PP-750), (b) a tower-type pole (U-100), (c) a pillar-type pole (UB-110).
Figure 4.
The backgrounds used to create the dataset.
Figure 5.
Example images from the created synthetic dataset.
Then, YOLO v11n, which achieved the best performance on the test set, was selected as the main model, after which a comparative study was conducted against similar architectures, namely RetinaNet and Faster R-CNN. The comparison was performed on the generated synthetic dataset loss function parameters [36], mAP@0.5 [37], and mAP@0.5:0.95 [38]. The comparison results are presented in Table 1.
Table 1.
Comparison of different CNNs trained on the created synthetic dataset.
Additionally, to improve the classification accuracy, a post-processing procedure was introduced. The general post-processing pipeline is the following. First, we filter out all bounding boxes (BBoxes) that do not intersect the image center within a tolerance of pixels in both the vertical and horizontal directions. Only the BBoxes with the highest confidence level for each class are retained. Since the number of classes is relatively small, for images in which no BBox is detected at the center, a problem similar to classification arises: the highest-confidence BBox for each detected class is shifted to the image center. Because the pole type does not change along a straight segment, the final step is to fill in the missing predictions. For this purpose, the distribution of pole types is computed for each segment, and missing images are assigned the most frequent class. A more detailed and formalized description of the proposed post-processing procedure is presented below.
Let the set of detections produced by the detector for a single image be denoted by
where is the predicted class of the i-th object, is the corresponding confidence score, and is its bounding box. Let be the image center and let
be the central target region. At the first post-processing stage, only the detections intersecting this region are retained, i.e.,
For each class q, only the most confident detection is preserved:
where U is either the filtered set or, if the center contains no detections, the full set D.
Thus, if , the final detections are selected from the central region only. If but , then the problem is treated in a classification-like manner: for each detected class, the most confident bounding box is selected and shifted to the image center. If denotes the center of , then the shift vector is defined as
and the corrected bounding box becomes
Since the pole type is assumed to remain unchanged along a straight power line segment, the remaining missing predictions are filled using segment-level class statistics. Let denote the number of detections of class q on segment g. Then, the assigned class for a missing or ambiguous image is chosen as
Therefore, empty images and images containing multiple competing classes are both resolved in favor of the most frequent pole type within the corresponding segment. This strategy provides full recognition coverage for all images associated with a power line. On the test segments, the resulting pole recognition accuracy reached .
In addition to the image-wise predictions, a separate file describing the inferred pole types is generated for further use by the route planner. This file contains the line identifier, segment number, pole number, and assigned pole class. An example illustrating the operation of the proposed pole detection and classification procedure is presented in Figure 6.
Figure 6.
An example of the method of detecting and determining the type of powerline poles.
The final required step is selecting the imaging point for insulators or other elements of the power line that are of interest to the inspection. Since the dataset was created using synthetic material, namely “SolidWorks” pole models, the exact positions of insulators are known for each of the pole types used. Given the positions of the poles and their insulators, it is straightforward to obtain the final imaging coordinates by computing the shooting angle relative to the camera direction. For greater accuracy, an intermediate waypoint is specified before the imaging point, ensuring the camera is oriented toward the insulators. At this step, it was also identified that the pole’s actual center may differ from its position on OpenStreetMap. Nevertheless, this problem is not critical, since the error lies in the ground plane and can be compensated for by the drone’s vertical or diagonal distance to the target. Moreover, the error follows an approximately normal distribution, which simplifies its detection. As an alternative, the method in [13] can be used to determine the pole position more accurately, while the pole type is already known.
The Figure 7 demonstrates the distributions of absolute errors between the pole positions determined by OpenStreetMap and Google Earth. The demonstrated error values are significant and exceed 15 m for PP-750. A Sobel-based edge detector is used to refine the pole location to address this issue. Since the conductors running between poles appear as simply brighter regions of the satellite image, and their approximate location is also known, the pole vicinity is cropped into a bounding box centered at the pole position provided by OpenStreetMap, with side lengths of m, where the shorter side is aligned parallel to the power line axis. It is also assumed that such poles typically have three conductor lines. Thus, to identify them, edge candidates are detected as local brightness maxima above a threshold.
where —average and short-term (on the working part of the window), .
Figure 7.
The value of the absolute error between the pole positions determined by OSM and Google Earth: (a) Type PP-750. (b) UB-110.
Knowing the local brightness maxima above the threshold, it is necessary to find three boundaries with a given distance between them (approximately 20 m for poles of this type):
The quality assessment function for the three found lines is determined by line brightness, Sobel boundary detection, and the distance between the condiments.
where —the radius of the Sobel boundary search window (in meters along ), —weights.
The final step in refining pole positions is to save the new point obtained by this method and project it along the normal to the power line (power line axis) relative to the original point describing the pole location. This approach ensured that, on the test dataset, the point representing the pole center was placed exactly at the pole center in 12 cases, improved its positional accuracy in 8 cases, and shifted slightly in the opposite direction in 7 cases. Overall, this corresponds to an improvement in the position of 74% of the poles.
5. Automatic Route Generation
The algorithms provided in [32] provide positions for takeoff and each inspected pole. At the same time, the proposed pole identification method automatically determines which cameras and drones to use for each pole, grouping them so they can be inspected in a single flight. Moreover, the proposed method provides a more accurate pole position and, therefore, a more accurate insulator position. Algorithm 2 is then used to generate the route for each inspection flight automatically.
The first step is to unambiguously determine the imaging waypoint layout: insulator points are numbered as even on one side and odd on the other, and the nearest zone suitable for mission start is selected. Each polygon describing a zone also stores the poles visible from that zone; therefore, an additional waypoint is placed at a small distance from the first target imaging point to allow the drone to enter the route. After that, all points are connected sequentially clockwise, with additional waypoints used to align to a straight flight segment when crossing the power line.
Since imaging is performed from a drone-safe distance [13], in segments where the route requires crossing the power line, a safe altitude is specified for passing over the pole and transitioning to a safe waypoint. It is then continuously checked that the drone remains within the operator’s line of sight. For this purpose, an SRTM elevation map under the power line is used; given the drone flight altitude, obstacle heights (in this work, forest acts as the main obstacle), and the elevation of the drone launch point, visibility is verified using two right triangles: the hypotenuse of the first is the distance from the launch point to the nearest obstacle, and the hypotenuse of the second is the distance to the drone. If the first triangle is contained within the second, visibility is ensured; otherwise, a safe flight altitude is set, determined by the allowed maximum flight altitude (in this case, 120 m, based on standard requirements). Imaging waypoints are assumed to be visible a priori, and the drone will descend from a safe altitude where the visibility criterion is satisfied to perform pole imaging. In the event of signal loss and a drone crash, its location can be determined unambiguously. The Figure 8 shows an example of a ready-made flight task obtained in the QGIS geodata environment.
| Algorithm 2 Unified Generation of 3D Inspection Routes |
|
Figure 8.
An example of the automatically generated route loaded in QGIS software.
6. The Developed Open-Source Solutions
This solution was developed for use in QGIS version 3.40 or later. The proposed workflow can be divided into four stages carried out to obtain the final result. The first stage focuses on data preparation. The second stage aims to identify suitable launch zones for the flight mission and to plan the ground route between them. The third stage determines the pole types and generates a file describing them. The last stage generates flight routes according to the rules described above. The first, second, and fourth stages are performed directly in QGIS; the third stage is performed using a Python 3.14 script in PyCharm-2026.1.2.
Preliminary preparation is required for the proposed solution to operate stably. It includes obtaining the boundary values of the area of interest in the EPSG:3857 coordinate system, specifically the map extent defined by the boundary coordinates North, West, South, and East. It is also necessary to add OpenStreetMap, Google Earth, and NASA SRTM layers to the QGIS project. In addition, SRTM data for the region of interest must be downloaded and converted from raster to vector format using QGIS’s built-in tools. It is also required to acquire data on roads, rivers, forests, poles, and the power lines themselves. We used the QuickOSM plugin for this purpose. Table 2 presents Key/Value notation used in current research by the developed open-source plugin [35].
Table 2.
Key/Value notation for QuickOMS.
During the preparation, a global road graph is generated from vector road data and used for subsequent computations [31]. The input layer for the first plugin is a vector road layer covering the area of interest. The user can also manually define the area extent, use a predefined QGIS spatial bookmark, or apply the map-canvas capture option. After the script finishes, the user obtains the resulting road graph as well as intermediate layers: road_vertices (the initial set of road geometry points), road_intersections (detected intersections that are not explicitly represented in OSM data), road_vertices_augmented (geometry refined with the detected intersections and junctions), road_nodes (the final node layer used for graph construction), and road_graph (the road graph layer). Figure 9 shows the general block diagram of the plugin.
Figure 9.
The general flowchart of the plugin for building a graph of roads, the element that is used in subsequent plugins is highlighted in green.
When the second stage is initiated, the distance to each power line pole and its visibility from potential takeoff and landing locations are evaluated. At this stage, the obstacles considered are forest belts and terrain features [32]. It is important to note that, at this stage, tree height is provided by the user and is treated as a single average value for all forests and plantations within the area of interest. The suitability of candidate zones is then evaluated, and a ground route for the inspection crew is generated between launch points and poles. The developed software also checks for obstacles that may prevent moving along the line between poles; these include ravines, which are detected using the SRTM elevation model. The input layers are: a vectorized polygon layer of the SRTM map (optionally more than one layer can be provided), a point layer of power line poles (OSM), a line layer of power lines (OSM), a line layer of roads (OSM), a polygon layer of forest (OSM), a point geometry layer of roads (road_vertices_augmented), and a line layer of rivers. Similar to the first stage, the user specifies the search area to identify mission start zones and build routes between inspection points. The plugin also provides configuration parameters for inspection and environmental conditions, including: the maximum distance from a target pole to a launch point, a coefficient for refining forest height, a coefficient for estimating pole height, a maximum visibility distance, and a coefficient for filling missing poles (since some poles may be absent from the map data). In addition, the user can exclude certain road types (primary and secondary), as launching from them may not be possible or preferable. The remaining options include the generation of intermediate output layers (IL), a “zero-visibility” mode (for inspection teams not equipped with drones), and the ability to recompute the route based on on-site visibility conditions.
The mandatory output layers are: Power Transmission Lines (the powerline layer within the region of interest), Corrected poles (a pole layer with missing poles filled in), Launch Polygons (zones satisfying the distance criterion to the target pole), Base Start Zones, Augmented Start Zones, and Final Start Zones (to allow on-site visibility adjustments and to select better zones when recomputation is triggered), Artifacts (ravine bottoms or sharp elevation-change zones), and the Inspection Crew Route. In the zero-visibility mode, the same layers are created except for the drone start-zone layers. All remaining layers are service or debugging layers intended to improve the interpretability of the route generation process. These include: Road Launch (primary polygons suitable for drone launch), Forests for Visibility (a layer used to evaluate visibility behind obstacles, which in this work are forests), pole Heights (a layer for refining pole visibility estimates), Launch Points (a polygon layer of areas from which at least one pole is visible), Ravine Gradient (an SRTM-based layer for detecting elevation discontinuities), as well as Anchor Points, Missing pole, Way graph of roads, Intermediate Points, Intersections and Node Points. Figure 10 shows the general block diagram of the plugin.
Figure 10.
The general flowchart of the plugin for building the route of the inspection team and the takeoff and landing zones, the element that is used in subsequent plugins is highlighted in green.
The third stage is dedicated to pole type identification. In the open-source solution provided along with the paper [35], the following pole types are detected: PP-750, UB-110, and U-110. The process of creating the training dataset is provided in Section 4.
At the final stage, a flight route is generated from the launch zone selected in the second stage to the poles for inspection, then back to the launch zone. Figure 11 presents the general flowchart of the drone flight route generation used in the developed plugin. The route generation algorithm is described in the previous section. In current research, we implemented two route file formats: KML [39], and ArduPilot “.waypoints”. The route generation function uses the following input layers: forest layer (OSM) and the layers created by the proposed plugin on previous stages, including corrected poles, power lines, launch polygons (layer of all candidate polygons for launch zone), launch zones layer (the final landing/takeoff spots selected by the greedy algorithm) [32]. Finally, a route-generation function uses a Comma-Separated Values (CSV) file containing pole identification results to distinguish between poles and assign generated routes to the most appropriate drones and inspection equipment. A different route is generated for each pole type, to be executed by its own drone type.
Figure 11.
The general flowchart of the plugin for building a graph of roads.
In case of generation flight missions in the ArduPilot file format the following subset of commands is used: WAYPOINT to reach the point; DO_SET_ROI to aim at the target shooting point; DELAY to allow the camera to align; DO_AUX_FUNCTION (9 2) to start image capture; DELAY to perform the capture; DO_AUX_FUNCTION (9 0) to stop image capture; DO_SET_ROI with all parameters set to zero to reorient along the drone’s course; and DELAY to complete this reorientation. Takeoff and landing commands are not used because the corresponding operations are generally performed manually during inspection flights.
7. Experimental Results
7.1. Comparison of the Automatic Pole Type Identification with Prior Art
The proposed automatic pole type identification methods were compared with those proposed in [22,23] on a dataset of 76 satellite images of various sizes and resolutions at a scale of 1:1828, and the average satellite image is 0.484 m/pixel. The overall spatial resolution of the satellite imagery used for the experiments, represented by the Google Earth raster layer in QGIS, was approximately 0.3–0.5 m/pixel for the most detailed areas, with possible degradation to 1–1.5 m/pixel depending on the mosaic section. The solutions introduced in [22,23] were reimplemented by our team. The recreated third-party solutions were also trained on the proposed synthetic dataset for objective comparison, as the authors did not provide the datasets on which their models were trained. The comparison results are presented in the Table 3, while the Figure 12 demonstrates examples of identified poles.
Table 3.
Comparison of automatic pole type identification methods.
Figure 12.
Examples of detecting poles and determining their type: (a) Gomes M. et al., 2020 [22]; (b) Marty B. et al. [23]; (c) for the proposed solution.
When the raw output of the YOLO detector is used directly, it demonstrates lower effectiveness in the task of pole type identification, since this task cannot be reduced solely to object detection in a single image. Due to the similarity of the silhouettes of different pole types under certain illumination conditions, as well as the occurrence of multiple competing detections in a single image, the final result may depend on the operation of the built-in Non-Maximum Suppression mechanism, which suppresses some alternative hypotheses. In the proposed solution, the YOLO output is not treated as the final result, but rather as a set of primary hypotheses about the pole type. These hypotheses are then processed by an expert system that uses information about the positions of detections relative to the image center, confidence scores, partially reproduces the logic of NMS to select the most probable variants, and also accounts for the distribution of pole types within the considered power line section. By using not only a single image but also the context of the entire image sequence, the robustness of pole-type identification is improved.
During the experiment, two different poles were identified, as shown in Figure 13. In this case, the pole type with the higher confidence score is written to the output CSV file, while the other duplicated results are omitted. Meanwhile, all images with multiple detections are stored for possible subsequent human verification, if necessary. A similar approach is also applied in our experimental studies for the classifier presented in [22], as it may also provide multiple outputs.
Figure 13.
An example of double detection case.
7.2. Verification of the Proposed Framework in a Simulation
The proposed framework was verified for inspection planning of a 50 km segment of the power line. During the simulation, geoinformation data for an area of 1080 km2 were analyzed. The power line segment was rated at 500 kV and included 135 poles. This process took 58 min on a personal computer TX Gaming FA608PP equipped with an AMD Ryzen 9 8940HX with Radeon Graphics (2.40 GHz) processor and 16 GB of RAM, including the automatic selection of flight mission start zones, the generation of the route between them, and the creation of 21 inspection route files that can be directly uploaded into UAV flight planning software. In this case, 2 min were spent entering the required information into the plugin, processing road data, and creating a weighted road graph for subsequent route generation. Another 3 min were spent entering the required information into the plugin and generating flight missions. Approximately 4 min were required for pole-type identification, including loading satellite images from QGIS and processing them by the expert system based on the YOLO detector. The remaining 49 min were spent identifying takeoff and landing zones and constructing the inspection route. In this case, the relatively long execution time of the plugin was due to the large volume of geoinformation data processed within the selected area, including 4,615,202 height-map polygons, 6650 forest polygons, 10,460 vector road elements, and 1160 vector river elements. Under this unfavorable scenario, approximately 1 min was spent refining the general zone around the power transmission line, about 46 min were spent checking the visibility of power line poles from candidate polygons located on roads, 1 min was required to select the most suitable candidates, 1 min was required to select the start zone, and less than 1 min was spent on route construction. This duration includes all the time expenses, including layer loading and initial data preparation. The overview of the inspection area and the generated routes are demonstrated in Figure 14, Figure 15 and Figure 16, respectively.
Figure 14.
The result of the framework’s work, where orange is the proposed route of the inspection team, red is the proposed flight tasks for the inspection of power line poles, and green is the power line poles, where the inspection team route is shown in orange, the 500 kV power transmission line poles are shown in green, and the flight missions are shown in red.
Figure 15.
Examples of flight tasks on sections of a power line (1 (a)–8 (h) zone).
Figure 16.
Examples of flight tasks on sections of a power line (9 (a)–14 (f) zone).
The proposed framework produced 21 flight missions and a 95 km ground path between the takeoff/landing sites. The numerical parameters of the generated missions are presented in Table 4. For safety reasons, two poles were excluded from drone-based inspection because they did not meet the safety requirements for drone inspections defined by the industrial standard [12].
Table 4.
Numerical parameters of the generated missions.
Each flight mission lasts no more than 15 min, providing sufficient autonomous operating time to return safely to the landing point in the event of strong winds. However, flight duration is not a directly configurable parameter and, in this case, depends on the overall allowable flight distance (no more than 1.5 km according to [12]). During the experiment, all generated flight missions remained within the allowable time limits and did not exceed the practical constraints on quadcopter flight duration. The proposed algorithm does not directly consider the flight time. However, the flight duration is indirectly limited by strict requirements for the distance to the operator and the defined visibility [12]. The limitation on the maximum distance from the takeoff and landing zone to the inspected pole, together with the requirement to maintain a constant direct line of sight between the operator and the quadcopter, ensures that each mission covers only a limited section of the power transmission line. As a result, the algorithm does not generate excessively long routes that could exceed the quadcopter’s autonomous flight time. Thus, at least for the requirements in [12], the separate division of the planned flight routes to fit the battery time is not needed. At the same time, in case of development, such functionality can be easily added for commercial applications.
In this simulation experiment, the inspection team’s speed while traveling on roads was 10 km/h. The time required for a qualified operator to prepare the UAV for launch is approximately 2 min. In comparison, the landing procedure takes about 4 min, totaling 2 h and 6 min across all zones. The total time required to complete the flight missions is 3 h and 46 min, while the travel time between the launch zones is 9 h and 30 min, including an inspection of one pole that a drone could not inspect. As a result, the total time required to inspect 135 poles is 15 h and 20 min. These model results outperform those reported in [21], which describes the inspection of 40 poles in 8 h (within one working day) and about 77 poles over an equivalent period, corresponding to a 75% increase in the number of inspected poles. The comparison data are also presented in Table 5.
Table 5.
Comparison of the number of examined poles over a certain period of time.
In addition, the proposed approach was compared with popular route planning applications, including Yandex Maps, 2GIS, and Google Maps, in terms of route length and travel time at an average speed of 15 km/h (Table 6). The use of this average speed is justified by an on-site assessment of the actual maximum safe driving speed in the experimental area conducted by the authors.
Table 6.
Comparison of route length and travel time.
To broaden the understanding of the method’s applicability and its potential extrapolation for use in other countries, a series of simulation experiments was conducted in other regions, namely Kazakhstan and South Korea. Kazakhstan was selected due to its varied terrain. At the same time, South Korea was considered for its high degree of urbanization and the use of an additional 345 kV pole type, which is also of interest for evaluating the method’s extrapolation potential. The experiments were carried out using the criteria specified in the standard [12], which was used in all simulation experiments, thereby making the results more comparable. We acknowledge that national aviation regulations and industry-specific requirements in Kazakhstan and South Korea may introduce additional constraints in practical deployment.
The first simulation experiment was carried out for a 17 km section of a 500 kV power transmission line containing 50 poles and located within a 54 km2 area in the Kazakh steppe. The results are presented in Figure 17.
Figure 17.
The result of the framework’s work, where the inspection team route is shown in orange, the 500 kV power transmission line poles are shown in green, and the flight missions and start zone are shown in red.
During the simulation experiment, 6 inspection start zones and 9 inspection routes were generated. It should also be noted that there were 4 false detections with incorrect pole type identification, which is reflected in the number of generated routes: 3 out of 9 routes were generated due to incorrect pole type identification. The execution time of the proposed solution was 4 min and 35 s, which is explained by the relatively small amount of geoinformation data processed in this case. Of this time, 45 s were spent entering the required information into the plugins, 3 min were spent on pole type identification, including data loading from QGIS, and 27 s were required to generate the flight missions, of which 23 s were spent on data input. The total route length was 14 km and 909 m, while the maximum duration of a flight mission was 14 min. These results demonstrate the applicability of the proposed solution under steppe conditions.
The second simulation experiment was conducted in South Korea and coincided with one of the experimental sites considered in [13]. The selected section contains a 4 km segment of a 345 kV power transmission line with 13 poles, located within an 8 km2 agricultural area in South Korea. The results are presented in Figure 18. For this simulation experiment, an additional pole model characteristic of this region was recreated. The modeling process took 2 h and 10 min (Figure 19), while another 1 h and 33 min were required to collect and annotate the dataset.
Figure 18.
The result of the framework’s work in South Korea, where the inspection team route is shown in orange, the 345 kV power transmission line poles are shown in green, and the flight missions and start zone are shown in red.
Figure 19.
The modeled 345 kV pole: (a) a photo of a real pole, (b) the created 3D model.
During the simulation experiment, 2 inspection start zones and 3 inspection routes were generated. The number of false detections with incorrect pole type identification was 1, which is also reflected in the number of generated routes: 1 out of 3 routes was generated due to this error. The execution time of the proposed solution was 3 min and 39 s, which is explained by the relatively small amount of geoinformation data processed in this case. Of this time, 42 s were spent entering the required information into the plugins, 2 min and 15 s were spent on pole type identification, including data loading from QGIS, and 24 s were required to generate the flight missions, of which 22 s were spent on data input. The total route length was 2 km and 180 m, while the maximum duration of a flight mission was 11 min. These simulation experiments demonstrate that the proposed solutions can be extrapolated to other countries without the need to obtain new scientific knowledge, requiring only engineering adaptation of the criteria to local industry standards.
7.3. Real Inspection Flights
The actual inspection flights were conducted over a single 600 m segment of a 220 kV power line. The area was limited by local flight regulations. Nevertheless, the inspected power line segment included poles of different types, enabling us to test a proposed pole-identification method and an automatic route-generation method for different drones in the wild.
We used two drones (Figure 20) during the real inspection flights: the GeoScan Gemini surveying drone equipped with a 20 MP Sony camera, and an ArduPilot-based drone equipped with an A8 Mini 8 MP gimbal camera. The GeoScan Gemini has a manually rotated camera that can be fixed at 0, 24, or 48 degrees to the right of the drone body. In this research, the camera on the Gemini drone was always fixed at 48 degrees. A KML file was used to import the mission into the GeoScan Planner, which controls the Gemini drone. In contrast, missions for ArduPilot-based drones were initially generated in the Mission Planner format (standard software used to control ArduPilot drones). It was assumed that an ArduPilot-based drone equipped with a gimbal would be used to inspect more complex U-220 lattice poles while hovering, and monopole UB-110 poles would be inspected by GeoScan Gemini “on-the-fly” without stopping to reduce overall inspection time. The corresponding settings were configured in the developed QGIS plugin.
Figure 20.
Drones used for experimental studies: (a) GeoScan Gemini; (b) ArduPilot-based inspection drone.
The first stage involved automatically identifying the start and end zones of the flight missions and generating drone flight trajectories. The plugins described above were used to obtain these zones. Figure 21 shows the resulting zones and routes.
Figure 21.
Automatically generated start and end zones of flight missions and the flight path of drones, where the arrows show the direction of the drone’s movement, where, (a) shows the route of the quadcopter’s inspection flight around the U-220 pole; (b) the route of the quadcopter’s inspection flight around the UB-110 poles support.
The power line selected for inspection features several pole types: part of the line runs straight across a field and includes UB-110 poles (monopoles), while another section includes a corner pole of type U-220 (lattice). In this case, the inspection of the UB-110 poles is performed using the GeoScan Gemini drone, which provides higher inspection speed in automatic mode and allows the camera to be rigidly fixed, minimizing the time required to capture a single pole for the inspection of the more complex U-220 pole, which has a more complicated insulator arrangement, a custom-built drone was used, as it provides a higher degree of aiming precision, compensating for its less clear camera. Figure 20 shows the drones used for the inspection at the launch points: Figure 20a presents the GeoScan Gemini drone, and Figure 20b presents the drone built specifically for this experiment.
A comparison was also made between the inspection time achieved using the proposed methods and the time required for manual drone operation. The comparison results are also presented in Table 7. For the ArduPilot-based drone, no data are available to prepare a flight mission for manual control, as the on-site pilot selected the trajectory during the inspection. In the proposed solution, the flight missions were generated during the pre-flight preparation stage, with a generation time of 4 s. In addition, the experimental results were extrapolated to the simulation data to refine the estimated reduction in inspection time over 1 working day (8 h). Thus, the proposed solution enables reducing inspection time by approximately 34 min per day for one type of inspection and approximately 1 h for the second. The ArduPilot-based drone was used to inspect U-220 poles, while the GeoScan Gemini was used to inspect UB-110 poles. In this case, the flight mission start zones were also automatically selected using the proposed solution, thereby eliminating any increase in the time required to select the flight start point under manual drone control and further reducing the overall pole inspection time.
Table 7.
Comparison of drones proposed solution and manually.
The images collected during the inspection flights were analyzed using a two-stage intelligent processing approach. First, DeepLabV3+ is used to perform initial objects of interest localization, after which its output is concatenated with the original input image to form an extended feature representation that is subsequently processed by a U-Net++ network for fine-grained refinement of segmentation masks and improved delineation of object boundaries, as described in [40]. Then, defect-related features are identified by post-processing the segmented regions using computer vision and machine learning techniques [41]. As shown in Figure 22, the image quality and angle of view enable robust recognition of poles, wires, and insulators using artificial intelligence techniques. It is worth noting that the drone’s position and camera orientation were evaluated during route generation using the proposed solutions and were not adjusted during flight. This experiment demonstrates that the proposed path-planning approach, based on complex geoinformation data analysis, is well-suited for data collection within the framework of an intelligent power line equipment diagnostic system.
Figure 22.
Examples of processed data collected during the inspection process: (a) Example of checking the U-220 pole (lattice); (b,c) Example of checking the UB-110 pole (monopole).
The proposed approach occupies an intermediate yet independent position between works focused on flight safety and those on large-scale, fully autonomous inspection platforms. In contrast to the approach presented in [13], where the main emphasis is placed on the safe GIS/GPS-based operation of a drone near power lines and on the manual preparation of flight geometry with safe distances taken into account, the proposed solution is extended to the stage of automating launch zone selection and route generation directly from geoinformation data. Compared with [21], which presents a more complex, infrastructure-heavy system with an autonomous station, battery replacement, and high overall productivity, the proposed work improves the inspection process by automatically preparing geoinformation-based missions for line sections and different pole types, without specialized infrastructure.
Additionally, we use a maximum flight range limitation that reflects the specific drone’s capabilities, while [21] limits the maximum number of poles inspected in a single flight. Thus, our approach allows us to fully utilize the drone’s potential by inspecting up to 2 times as many poles per drone flight for 110 kV or 220 kV power lines.
During the experimental flights, it was found that the mission planning software predicted the flight time was 1.5 times shorter than the actual drone flight time. It should be noted that the flight time estimated by mission-planning software is an idealized value and may differ from the actual flight duration. This discrepancy is typical for inspection routes containing many waypoints, since standard planners may not fully account for UAV yaw changes, gimbal rotation, acceleration and deceleration phases, precise positioning at waypoints, and image acquisition delays. A detailed analysis of this problem is presented in [5], where the authors show that errors in commercial mission-planning software can be significant for inspection missions. In the present study, a separate flight-time prediction model was not considered, since the main contribution of the work concerns geospatial planning of inspection routes, selection of launch zones, and automatic generation of UAV missions. To make the comparison more conservative, the planned flight time was multiplied by a correction factor of 1.5, which reflects the observed difference between planned and actual flight durations under experimental conditions. This coefficient depends on the specific UAV, payload, flight controller settings, and mission structure. Even with this conservative correction, the proposed approach demonstrates better inspection efficiency than the compared methods [21]: our mission planning approach required approximately 17 h to inspect 135 poles of a 500 kV power line, or 63.5 poles per 8-h working day. This result is 58.7% better than the result reported in [21], which offers a ready-made, tested framework that assumes a maximum of 40 pillars to be examined during the working day. For the sake of comparison, we will assume this is 8 h. Moreover, even if the correction factor was 2, our approach will still provide 42.1% better efficiency compared to the previous art.
7.4. Timing Analysis
This section is dedicated to computational time analysis of the developed software. Figure 23 presents a general scheme of time allocation across different stages of power line inspection planning within the proposed framework. The numerical values in this scheme were measured directly during the simulation experiment presented above on inspection crew mission planning in Russia, Kazakhstan, and South Korea.
Figure 23.
The scheme of the framework’s operation, where Permanent data is highlighted in blue, Target data is highlighted in orange, and Local data is highlighted in purple.
In the description of the experiments, the labor costs associated with the preparation of the input data were excluded from consideration. The data used and generated during the operation of the framework can be divided into four conditional groups: Input data which are required for the first launch of the plugins and for obtaining the routes; Permanent data which are generated once and can then be reused regardless of the specific task; Target data which include the data used to construct solutions for inspection tasks related to a specific power transmission line; and Local data which may change during the operation of the framework as new information is refined or updated.
The input data include SRTM elevation-map data, geoinformation data on roads, forests, and rivers, as well as the initial map of power transmission line locations. During repeated plugin runs, these data can be replaced by more compact versions from the permanent data group.
Permanent data include pole models, which must be accurately recreated once and can then be reused for any power transmission lines containing the corresponding pole types. The time required to create a model of a single pole varies with its complexity and the level of detail required. For example, a pole-type UB-100 pole was recreated in 15 min when a drawing was available, whereas PP-750 and 345 kV poles were modeled in 4 h and 27 min and 2 h and 10 min, respectively. Moreover, the process of creating pole models can be carried out in parallel by several specialists, as can the preparation of the dataset. In the case considered, with 6 backgrounds, the dataset preparation time was 1 h and 33 min per pole type. This process can also be parallelized, and the final dataset can be assembled from pre-prepared annotated presets. Training YOLOv26 on an H100 GPU in Google Colab for 50 or 100 epochs took no more than 1 h. Therefore, even when using open geoinformation data sources, the total time required to add data for a new pole type is 3 h and 43 min.
Target data include all data obtained for a specific power transmission line and its inspection. A representative example is the trained YOLO neural network weights obtained using the synthetic dataset. Since the model training time is relatively short, the model can be trained for a specific line immediately before the inspection preparation stage. Target data also includes layers obtained after primary processing, which can subsequently serve as input data. For example, running the framework on processed and pre-prepared data reduced the time required to generate the Inspection Crew Route and Start Zones from 49 min to 3 min. Such data include the Launch Polygons and Corrected Towers layers. The use of these layers significantly reduces the amount of information considered. It accelerates the route-planning process, since the Launch Polygons layer stores height-map information only within areas potentially suitable for quadcopter launches during inspection flights. The target data group may also include the road_vertices_augmented, road_graph, Start Zones, and Artifacts layers, as these layers enable route reprocessing when necessary. A substantial change in the input data also requires these layers to be regenerated.
The final group consists of local data, which includes data such as the final routes that may change as a result of modifications at any of the previous stages. The Inspection Crew Route layer is the most sensitive to such changes, since it accounts for the visibility of takeoff and landing zones, as well as poles that UAVs cannot inspect. Flight tasks may also be regenerated due to on-site line-of-sight violations, which may result from outdated or partially incorrect data. In addition, they may be adjusted based on the pilot’s experience or local operational requirements, for example, in response to changing weather conditions.
8. Limitations
The main technical contribution of this paper is an integrated pre-flight planning framework that converts incomplete open geospatial data and satellite imagery into executable inspection missions for power line diagnostics. Unlike works focused only on UAV flight control, battery replacement, autonomous inspection execution, or post-flight defect detection, the proposed approach addresses the upstream planning problem: how to automatically prepare all mission-critical data before the inspection starts. The framework jointly performs ground-route planning for the inspection crew, selection of takeoff and landing zones under regulatory and line-of-sight constraints, preliminary pole-type identification from satellite images, and generation of type-specific UAV image acquisition points. Pole-type recognition is used not as an independent mapping task, but as an input for constructing diagnostically meaningful flight trajectories. The complete pipeline is implemented as an open-source QGIS plugin that produces both inspection-team routes and UAV mission files.
The precision of the input geoinformation data limits the precision of the mission planning using the proposed framework. E.g., forest data rapidly becomes outdated, while openly available satellite images or street maps may have inaccuracies in object positions. Moreover, the proposed method for filling missing poles is based on statistical patterns inferred from line analysis, which cannot be fully reliable. At the same time, the results of inspection flights conducted during experimental studies demonstrate that, even with openly available data, it is possible to automatically generate routes and collect data for further intelligent analysis without human corrections. Also, all the proposed solutions, including the developed QGIS plugin, can be used with precise proprietary geoinformation data available to companies that maintain power lines.
The efficiency of the proposed pole identification method was tested on a subset of poles that have different shapes. At the same time, because this method relies on shadow analysis, it may mix up different pole classes with similar geometries but different sizes. Also, the proposed method will not work if the satellite image was captured orthogonally to the power line at the same time and under the same conditions, when shadows are not distinguishable. However, it should be further investigated how often such issues occur during the planning of real inspection tasks. Although the current studies and results are substantial, a more thorough understanding of this issue requires a larger dataset and further research, including more real inspection flights.
The proposed solution is generally applicable only to inspections of forested environments and is limited to lines with a voltage rating of 110 kV or higher. In this case, a UAV-safe zone is formed around the power line at a distance of 20 m or more from the outermost conductors. For lower-voltage lines, more precise identification of collision situations between the route and the forest canopy is required, a topic for future work. Also, it is worth noting that for lines with voltages below 110 kV, the safe flight conditions under Park’s criteria [13] are generally not satisfied.
In addition, it is important to note that the proposed solution can be fairly easily extrapolated for use in other countries. Tests were carried out under the conditions of the Kazakh steppe and in the suburban areas of South Korea. The proposed method demonstrates sufficient inspection accuracy, even without refinement, in line with the industry standards of these countries. For full-scale implementation in other countries, it is recommended to study the relevant national industry standards, after which the application of engineering procedures will enable the proposed solution to be integrated into the power transmission pole inspection process.
The proposed pole-type identification method depends on the availability of cloud-free high-resolution satellite imagery. In the considered experiments, satellite images from open sources, such as Google Earth, were used. Since the method is applied at the inspection planning stage, its performance is not affected by weather conditions during the actual field inspection. However, if suitable imagery is unavailable, outdated, partially occluded, or has insufficient spatial resolution, reliable pole-type identification may become difficult or impossible. It should also be noted that the proposed method automates a procedure already used in practice: the visual identification of pole types from satellite images and their shadow patterns. In most typical cases, the geometry of the pole and the shape of its shadow provide sufficient information for manual interpretation. The proposed approach reduces repetitive manual work by automatically performing this interpretation. Nevertheless, when the pole type cannot be reliably determined from satellite imagery, it must be verified in the field. Such situations may require manual correction of the assigned pole type and regeneration of the corresponding flight missions. However, based on practical experience with manual shadow-based interpretation, such cases are quite rare.
The current route-planning algorithm and its implementations do not directly limit the generated drone missions by battery time. All the routes generated during experimental studies fit within the drones’ capabilities because industrial standard [12] and airspace usage rules strictly limit the distance between the operator and the drone during inspection and require keeping the drone within the operator’s line of sight. At the same time, from a safety perspective, the route planner must analyze battery usage and generate routes based on this analysis (similar to the solution proposed in [5]). The corresponding functionality will be added to the developed solution in the future.
The accuracy of the proposed framework directly depends on the quality and completeness of the input geospatial data. At the same time, compared to other methods, we introduce multiple solutions to improve the layers derived from open sources (e.g., OpenStreetMap) by fixing pole positions, automatically detecting pole types, etc. Also, our approach and proposed software solution are fully compatible with precise proprietary geoinformation data, which can improve mission planning when the accuracy of open data sources is not sufficient for the specific territory.
Most of the proposed algorithms aimed to improve input geoinformation data, like the ones adding missing poles or performing pole identification, do not provide 100% accuracy, which may lead to errors in mission planning. In case of such errors, the inspection crew will need to correct the error, regenerate mission and repeat the flight. Similar errors and consequences also occur in cases when the inspection mission is planned manually. However due to the mission generation process is automated the inspection crew can perform re-planning in a matter of minutes.
Discussing the geoinformation sources, if more accurate utility-, commercial-, or field-validated geospatial layers are available, they should be used instead of the corresponding OpenStreetMap layers, as this would directly improve route planning, launch-zone selection, line-of-sight estimation, and the generation of diagnostic imaging points. The proposed algorithms are fully compatible with such data and do not require OpenStreetMap as the sole source of geospatial information.
At the same time, an important advantage of the proposed framework is that it includes several correction and verification procedures, making it applicable even when only open geospatial data are available. Positional errors of mapped poles are partially mitigated by the Sobel-based pole-position correction method. In contrast, possible missing poles are handled by the restoration procedure, which is based on the analysis of distances between neighboring poles and natural obstacles. In addition, launch-zone selection includes distance, accessibility, safety, and line-of-sight checks, which reduce the risk of generating infeasible UAV missions due to incomplete data.
Nevertheless, some limitations remain. Missing road data may result in longer, suboptimal, or partially infeasible ground routes for the inspection crew. Missing forest or canopy information may lead to incorrect line-of-sight estimates and, consequently, to the selection of launch zones that require additional on-site verification. Missing rivers, water bodies, or terrain obstacles may cause the planner to overestimate off-road passability, whereas false or outdated obstacles may make the generated route overly longest. In addition, errors in SRTM elevation data are directly inherited by the framework, since this source is used as the base height map for terrain analysis. In the workflow considered, however, this limitation is not critical for UAV mission generation because all altitude-dependent calculations are performed consistently using the same elevation model. Moreover, UAV flight altitudes are calculated relative to the selected takeoff point, so a systematic elevation bias is inherited in a largely uniform way and does not usually create an inconsistency between the generated route and the local height reference used for mission execution.
Despite these limitations, the use of open geospatial data is important for the practical applicability and reproducibility of the proposed approach. It allows inspection missions to be prepared without access to closed utility databases and without additional non-disclosure restrictions, making the framework usable by a wider range of inspection teams and UAV operators. The field experiments confirmed that, even when based on open data, the proposed framework can generate UAV missions that provide diagnostically useful images suitable for subsequent analysis.
9. Conclusions
The paper presents a framework and an open-source software solution for automating the planning of power transmission line inspections using ground vehicles and UAVs, based on automated analysis of satellite imagery and cartographic data. The proposed solution includes a software module for the QGIS package that generates inspection team routes and flight missions under conditions of incomplete cartographic information, as well as a pretrained neural network model for detecting and preliminarily classifying all major types of power transmission line poles used in the Russian Federation. The proposed method for pole type identification is based on the YOLO v26n detector and additional algorithmic refinements that account for the most probable pole class and its position within a line section, determined by the power line’s intersections with roads and water bodies, as well as changes in line direction.
The developed neural network model demonstrates a pole-type classification accuracy of 89.5% on the tested dataset, representing a 39.9% improvement over the reference prior-art methods, enabling automated preliminary classification of objects and the generation of appropriate aerial inspection scenarios.
Finally, we developed an open-source QGIS plugin that automates pre-flight preparation and generates inspection routes that meet flight safety and image quality requirements, in accordance with industry standards and flight regulations. For a 50 km power line section with 135 poles, the module automatically planned a 95 km ground route for the inspection team, identified takeoff/landing zones, and generated 21 drone flight missions. And the proposed route of the inspection group is shorter by 1.3 to 2.3 times compared with widely used geographic information systems for traffic conditions on the Central Russian plain. They also showed the scalability of the proposed solution for use in other countries. The time to create a separate support and add it to the general dataset was 3 h and 43 min.
The inspection flights conducted during experimental studies demonstrated that the proposed path-planning approach, based on complex geoinformation data analysis, is well-suited to automatic data collection within the framework of an intelligent power line equipment diagnostic system. And it allows us to talk about reducing the labor costs for conducting inspection flights from 34 to 53 min during the working day.
Author Contributions
Conceptualization, A.B., S.E. and A.R.; methodology, A.B. and A.R.; software, A.B.; validation, A.B. and S.E.; formal analysis, A.B.; investigation, A.B.; resources, S.E. and A.R.; data curation, A.B.; writing—original draft preparation, A.B.; writing—review and editing, S.E. and A.R.; visualization, A.B.; supervision, A.R.; project administration, S.E. All authors have read and agreed to the published version of the manuscript.
Funding
The reported study was supported by the Russian Science Foundation, research project No. 22-79-10315-Π
Institutional Review Board Statement
Not applicable.
Informed Consent Statement
Not applicable.
Data Availability Statement
The original data presented in the study are openly available in the Zenodo repository at https://zenodo.org/records/20306957, accessed on 1 July 2026.
Conflicts of Interest
The authors declare no conflicts of interest.
Abbreviations
The following abbreviations are used in this manuscript:
| LiDAR | Light Detection and Ranging |
| ATSS | Adaptive Training Sample Selection |
| CNN | Convolutional Neural Network |
| CSV | Comma Separated Values |
| GIS | Geographic Information System |
| GNSS | Global Navigation Satellite System |
| OSM | OpenStreetMap |
| RGB | Red-Green-Blue |
| SRTM | Shuttle Radar Topography Mission |
| KML | Keyhole Markup Language |
| UAV | Unmanned Aerial Vehicle |
| WRI | World Resources Institute |
| YOLO | You Only Look Once |
| NMS | Non-Maximum Suppression mechanism |
References
- Khalyasmaa, A.I.; Uteuliyev, B.A.; Tselebrovskii, Y.V. Methodology for analysing the technical state and residual life of overhead transmission lines. IEEE Trans. Power Deliv. 2020, 36, 2730–2739. [Google Scholar] [CrossRef] [Scilit]
- Mendu, B.; Mbuli, N. State-of-the-Art Review on the Application of Unmanned Aerial Vehicles (UAVs) in Power Line Inspections: Current Innovations, Trends, and Future Prospects. Drones 2025, 9, 265. [Google Scholar] [CrossRef] [Scilit]
- Schofield, O.B.; Iversen, N.; Ebeid, E. Autonomous power line detection and tracking system using UAVs. Microprocess. Microsyst. 2022, 94, 104609. [Google Scholar] [CrossRef] [Scilit]
- Gyrichidi, N.; Khalyasmaa, A.; Eroshenko, S.; Romanov, A. Are modern market-available multi-rotor drones ready to automatically inspect industrial facilities? Drones 2024, 8, 549. [Google Scholar] [CrossRef] [Scilit]
- Romanov, A.M.; Gyrichidi, N.; Volkova, M.A.; Eroshenko, S.A.; Matrenin, P.V.; Khalyasmaa, A.I. Automated mission planning for aerial large-scale power plant thermal inspection. J. Field Robot. 2024, 41, 1313–1348. [Google Scholar] [CrossRef] [Scilit]
- Ollero, A.; Suarez, A.; Papaioannidis, C.; Pitas, I.; Marredo, J.M.; Hoang, V.D.; Ebeid, E.; Kratky, V.; Saska, M.; Hanoune, C.; et al. Multi-Aerial Robotic System for Power Line Inspection and Maintenance: Comparative Analysis from the AERIAL-CORE Final Experiments. IEEE Trans. Field Robot. 2025, 2, 549–573. [Google Scholar] [CrossRef] [Scilit]
- Lan, B.; Xing, M.; Lv, H. An improved trajectory generation algorithm for outdoor power line inspection. J. Mech. Sci. Technol. 2026, 40, 1403–1415. [Google Scholar] [CrossRef] [Scilit]
- Wang, Q.; Zhang, Z.; Wang, W. An Autonomous UAV Power Inspection Framework with Vision-Based Waypoint Generation. Appl. Sci. 2026, 16, 76. [Google Scholar] [CrossRef] [Scilit]
- Stöcker, C.; Bennett, R.; Nex, F.; Gerke, M.; Zevenbergen, J. Review of the current state of UAV regulations. Remote. Sens. 2017, 9, 459. [Google Scholar] [CrossRef] [Scilit]
- Xu, C.; Liao, X.; Tan, J.; Ye, H.; Lu, H. Recent research progress of unmanned aerial vehicle regulation policies and technologies in urban low altitude. IEEE Access 2020, 8, 74175–74194. [Google Scholar] [CrossRef] [Scilit]
- Tarr, A.A.; Tarr, J.A.; Thompson, M.; Ellis, J. Drone Law and Policy: Global Development, Risks, Regulation and Insurance; Routledge: London, UK, 2021. [Google Scholar]
- Finko, L. Methodological Guidelines for the Use of Unmanned Aerial Vehicles for the Inspection of Overhead Power Transmission Lines and Energy Facilities; Standard; Federal Grid Company of Unified Energy System: Moscow, Russia, 2016; Available online: https://www.rosseti.ru/upload/iblock/aff/e06zv3mdai4nc4fjxiahtq4qyhf3u17v.pdf?ysclid=mr57527h82646087147 (accessed on 1 July 2026).
- Park, J.Y.; Kim, S.T.; Lee, J.K.; Ham, J.W.; Oh, K.Y. Method of operating a GIS-based autopilot drone to inspect ultrahigh voltage power lines and its field tests. J. Field Robot. 2020, 37, 345–361. [Google Scholar] [CrossRef] [Scilit]
- Eroshenko, S.A.; Romanov, A.M. Decision support system for science-technical solutions efficiency assessment based on hybrid neural networks. In Proceedings of the 2016 XIX IEEE International Conference on Soft Computing and Measurements (SCM), St. Petersburg, Russia, 25–27 May 2016; pp. 462–465. [Google Scholar] [CrossRef] [Scilit]
- Akdağ, M.; Pedersen, T.A.; Fossen, T.I.; Johansen, T.A. A decision support system for autonomous ship trajectory planning. Ocean. Eng. 2024, 292, 116562. [Google Scholar] [CrossRef] [Scilit]
- Anfyorov, M.A. Clustering of multidimensional temporal data as part of information support for management decisions. Russ. Technol. J. 2026, 14, 7–16. [Google Scholar] [CrossRef] [Scilit]
- Caballero, A.; Roman-Escorza, F.J.; Maza, I.; Ollero, A. A Multi-UAV Approach for Fast Inspection of Overhead Power Lines: From Route Planning to Field Operation. J. Intell. Robot. Syst. 2025, 111, 67. [Google Scholar] [CrossRef] [Scilit]
- Hu, Z.L.; Deng, Y.Z.; Peng, H.; Han, J.M.; Zhu, X.B.; Zhao, D.D.; Wang, H.; Zhang, J. Optimal Path Planning with Minimum Inspection Teams and Balanced Working Hours For Power Line Inspection. Front. Phys. 2022, 10, 955499. [Google Scholar] [CrossRef] [Scilit]
- Gauce, D.; Lektauers, A.; Solovjova, I.; Grants, R.; Kolosovs, D.; Litvinenko, A. Application of digital twin in medium-voltage overhead distribution network inspection. Remote. Sens. 2023, 15, 489. [Google Scholar] [CrossRef] [Scilit]
- Shuang, F.; Chen, X.; Li, Y.; Wang, Y.; Miao, N.; Zhou, Z. PLE: Power line extraction algorithm for UAV-based power inspection. IEEE Sens. J. 2022, 22, 19941–19952. [Google Scholar] [CrossRef] [Scilit]
- Li, Z.; Zhang, Y.; Wu, H.; Suzuki, S.; Namiki, A.; Wang, W. Design and application of a UAV autonomous inspection system for high-voltage power transmission lines. Remote. Sens. 2023, 15, 865. [Google Scholar] [CrossRef] [Scilit]
- Gomes, M.; Silva, J.; Gonçalves, D.; Zamboni, P.; Perez, J.; Batista, E.; Ramos, A.; Osco, L.; Matsubara, E.; Li, J.; et al. Mapping utility poles in aerial orthoimages using atss deep learning method. Sensors 2020, 20, 6070. [Google Scholar] [CrossRef] [Scilit] [PubMed]
- Marty, B.; Gaudin, R.; Piperno, T.; Rouquette, D.; Schwob, C.; Mezeix, L. Methodology to classify high voltage transmission poles using CNN approach from satellite images for safety public regulation application: Study case of rural area in Thailand. Syst. Soft Comput. 2024, 6, 200080. [Google Scholar] [CrossRef] [Scilit]
- Rodrigues, F.; Santos, R.; Borges, R.; Coelho, A.; Välja, T. GridDrone: Use of drones to perform thermographic distance measurement and visual inspection of the HV and MV aerial network. In Proceedings of the 27th International Conference on Electricity Distribution (CIRED 2023), Rome, Italy, 12–15 June 2023; Volume 2023, pp. 3929–3933. [Google Scholar] [CrossRef] [Scilit]
- Wang, B.; Han, L.; Zhang, H.; Wang, Q.; Li, B. A flying robotic system for power line corridor inspection. In Proceedings of the 2009 IEEE International Conference on Robotics and Biomimetics (ROBIO), Guilin, China, 19–23 December 2009; pp. 2468–2473. [Google Scholar] [CrossRef] [Scilit]
- Kähler, O.; Hochstöger, S.; Kemper, G.; Birchbauer, J. Automating powerline inspection: A novel multisensor system for data analysis using deep learning. Int. Arch. Photogramm. Remote. Sens. Spat. Inf. Sci. 2020, 43, 747–754. [Google Scholar] [CrossRef] [Scilit]
- Sun, G.; Ranson, K.; Kimes, D.; Blair, J.; Kovacs, K. Forest vertical structure from GLAS: An evaluation using LVIS and SRTM data. Remote. Sens. Environ. 2008, 112, 107–117. [Google Scholar] [CrossRef] [Scilit]
- Chernikhovsky, D.; Alekseev, A. Determination of heights and stocks of stands of woody plants based on processing the results of the SRTM (Shuttle Radar Topographic Mission) topographic radar survey. Aerosp. Methods Geoinf. Technol. For. For. Ecol. Rep. VII All-Russ. 2019, 22, 16. [Google Scholar]
- Shortridge, A.; Messina, J. Spatial structure and landscape associations of SRTM error. Remote. Sens. Environ. 2011, 115, 1576–1587. [Google Scholar] [CrossRef] [Scilit]
- Becek, K. Investigation of elevation bias of the SRTM C-and X-band digital elevation models. SZTS Géogr. 2008, XXXVII, 38. [Google Scholar]
- Bychkov, A.; Romanov, A. GIS Plugin for Planning Movement on Various Types of Roads. In Proceedings of the 2025 IEEE 26th International Conference of Young Professionals in Electron Devices and Materials (EDM); IEEE: Piscataway, NJ, USA, 2025; pp. 1380–1385. [Google Scholar] [CrossRef] [Scilit]
- Bychkov, A.; Romanov, A. Algorithms for automating the construction of routes for inspection teams during the aerial inspection of power lines using quadrocopters. Inform. Autom. 2026, 4, 39. [Google Scholar] [CrossRef]
- Rolnov, M.; Bychkov, A. Wavefront-based pathfinding algorithm for static and dynamic environments. In Proceedings of the 2025 IEEE XVII International Scientific and Technical Conference on Actual Problems of Electronic Instrument Engineering (APEIE), 2025; IEEE: Piscataway, NJ, USA, 2025; pp. 1–5. [Google Scholar] [CrossRef] [Scilit]
- Cornebise, J.; Orsolic, I.; Kalaitzis, F. Open High-Resolution Satellite Imagery: The WorldStrat Dataset—With Application to Super-Resolution. In Proceedings of the Thirty-Sixth Conference on Neural Information Processing Systems Datasets and Benchmarks Track, Virtual, 28 November–9 December 2022. [Google Scholar] [CrossRef] [Scilit]
- Bychkov, A. Open-Source Solutions for a Complex Analysis of Geoinformation Data for Automatic Aerial Inspection Pathplanning. Zenodo, 2026. Available online: https://zenodo.org/records/20306957 (accessed on 1 July 2026).
- Prechelt, L. Automatic early stopping using cross validation: Quantifying the criteria. Neural Netw. 1998, 11, 761–767. [Google Scholar] [CrossRef] [Scilit] [PubMed]
- Everingham, M.; Van Gool, L.; Williams, C.K.; Winn, J.; Zisserman, A. The pascal visual object classes (voc) challenge. Int. J. Comput. Vis. 2010, 88, 303–338. [Google Scholar] [CrossRef] [Scilit]
- Lin, T.Y.; Maire, M.; Belongie, S.; Hays, J.; Perona, P.; Ramanan, D.; Dollár, P.; Zitnick, C.L. Microsoft coco: Common objects in context. In Proceedings of the European Conference on Computer Vision; Springer: Berlin/Heidelberg, Germany, 2014; pp. 740–755. [Google Scholar] [CrossRef] [Scilit]
- Wernecke, J. The KML Handbook: Geographic Visualization for the Web; Pearson Education: Upper Saddle River, NJ, USA, 2008. [Google Scholar]
- Matveev, I.V.; Khalyasmaa, A.I.; Matrenin, P.V. Analysis of the Robustness of Deep Convolutional Neural Networks to Data Augmentation in the Problem of Power Line Insulators Recognition. In Proceedings of the 2025 IEEE XVII International Scientific and Technical Conference on Actual Problems of Electronic Instrument Engineering (APEIE), Novosibirsk, Russia, 14–16 November 2025; pp. 1–6. [Google Scholar] [CrossRef] [Scilit]
- Khalyasmaa, A.; Zinovieva, E.; Mazunina, M.; Lider, S.; Harlashkin, D.; Harlashkina, M. Localization of the overhead power transmission line insulators defects using computer vision algorithms. In Proceedings of the 2023 Belarusian-Ural-Siberian Smart Energy Conference (BUSSEC), Ekaterinburg, Russia, 25–29 September 2023; pp. 165–168. [Google Scholar] [CrossRef] [Scilit]
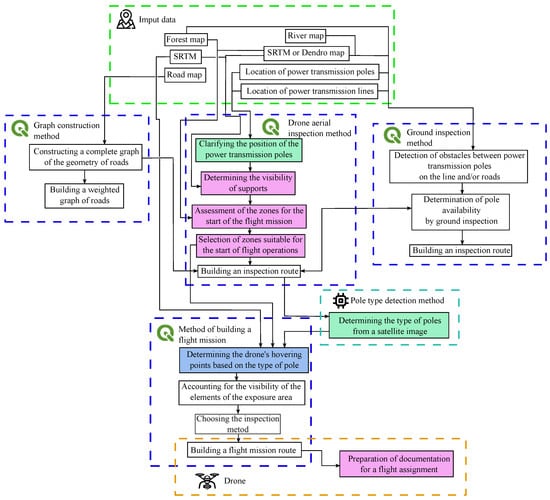
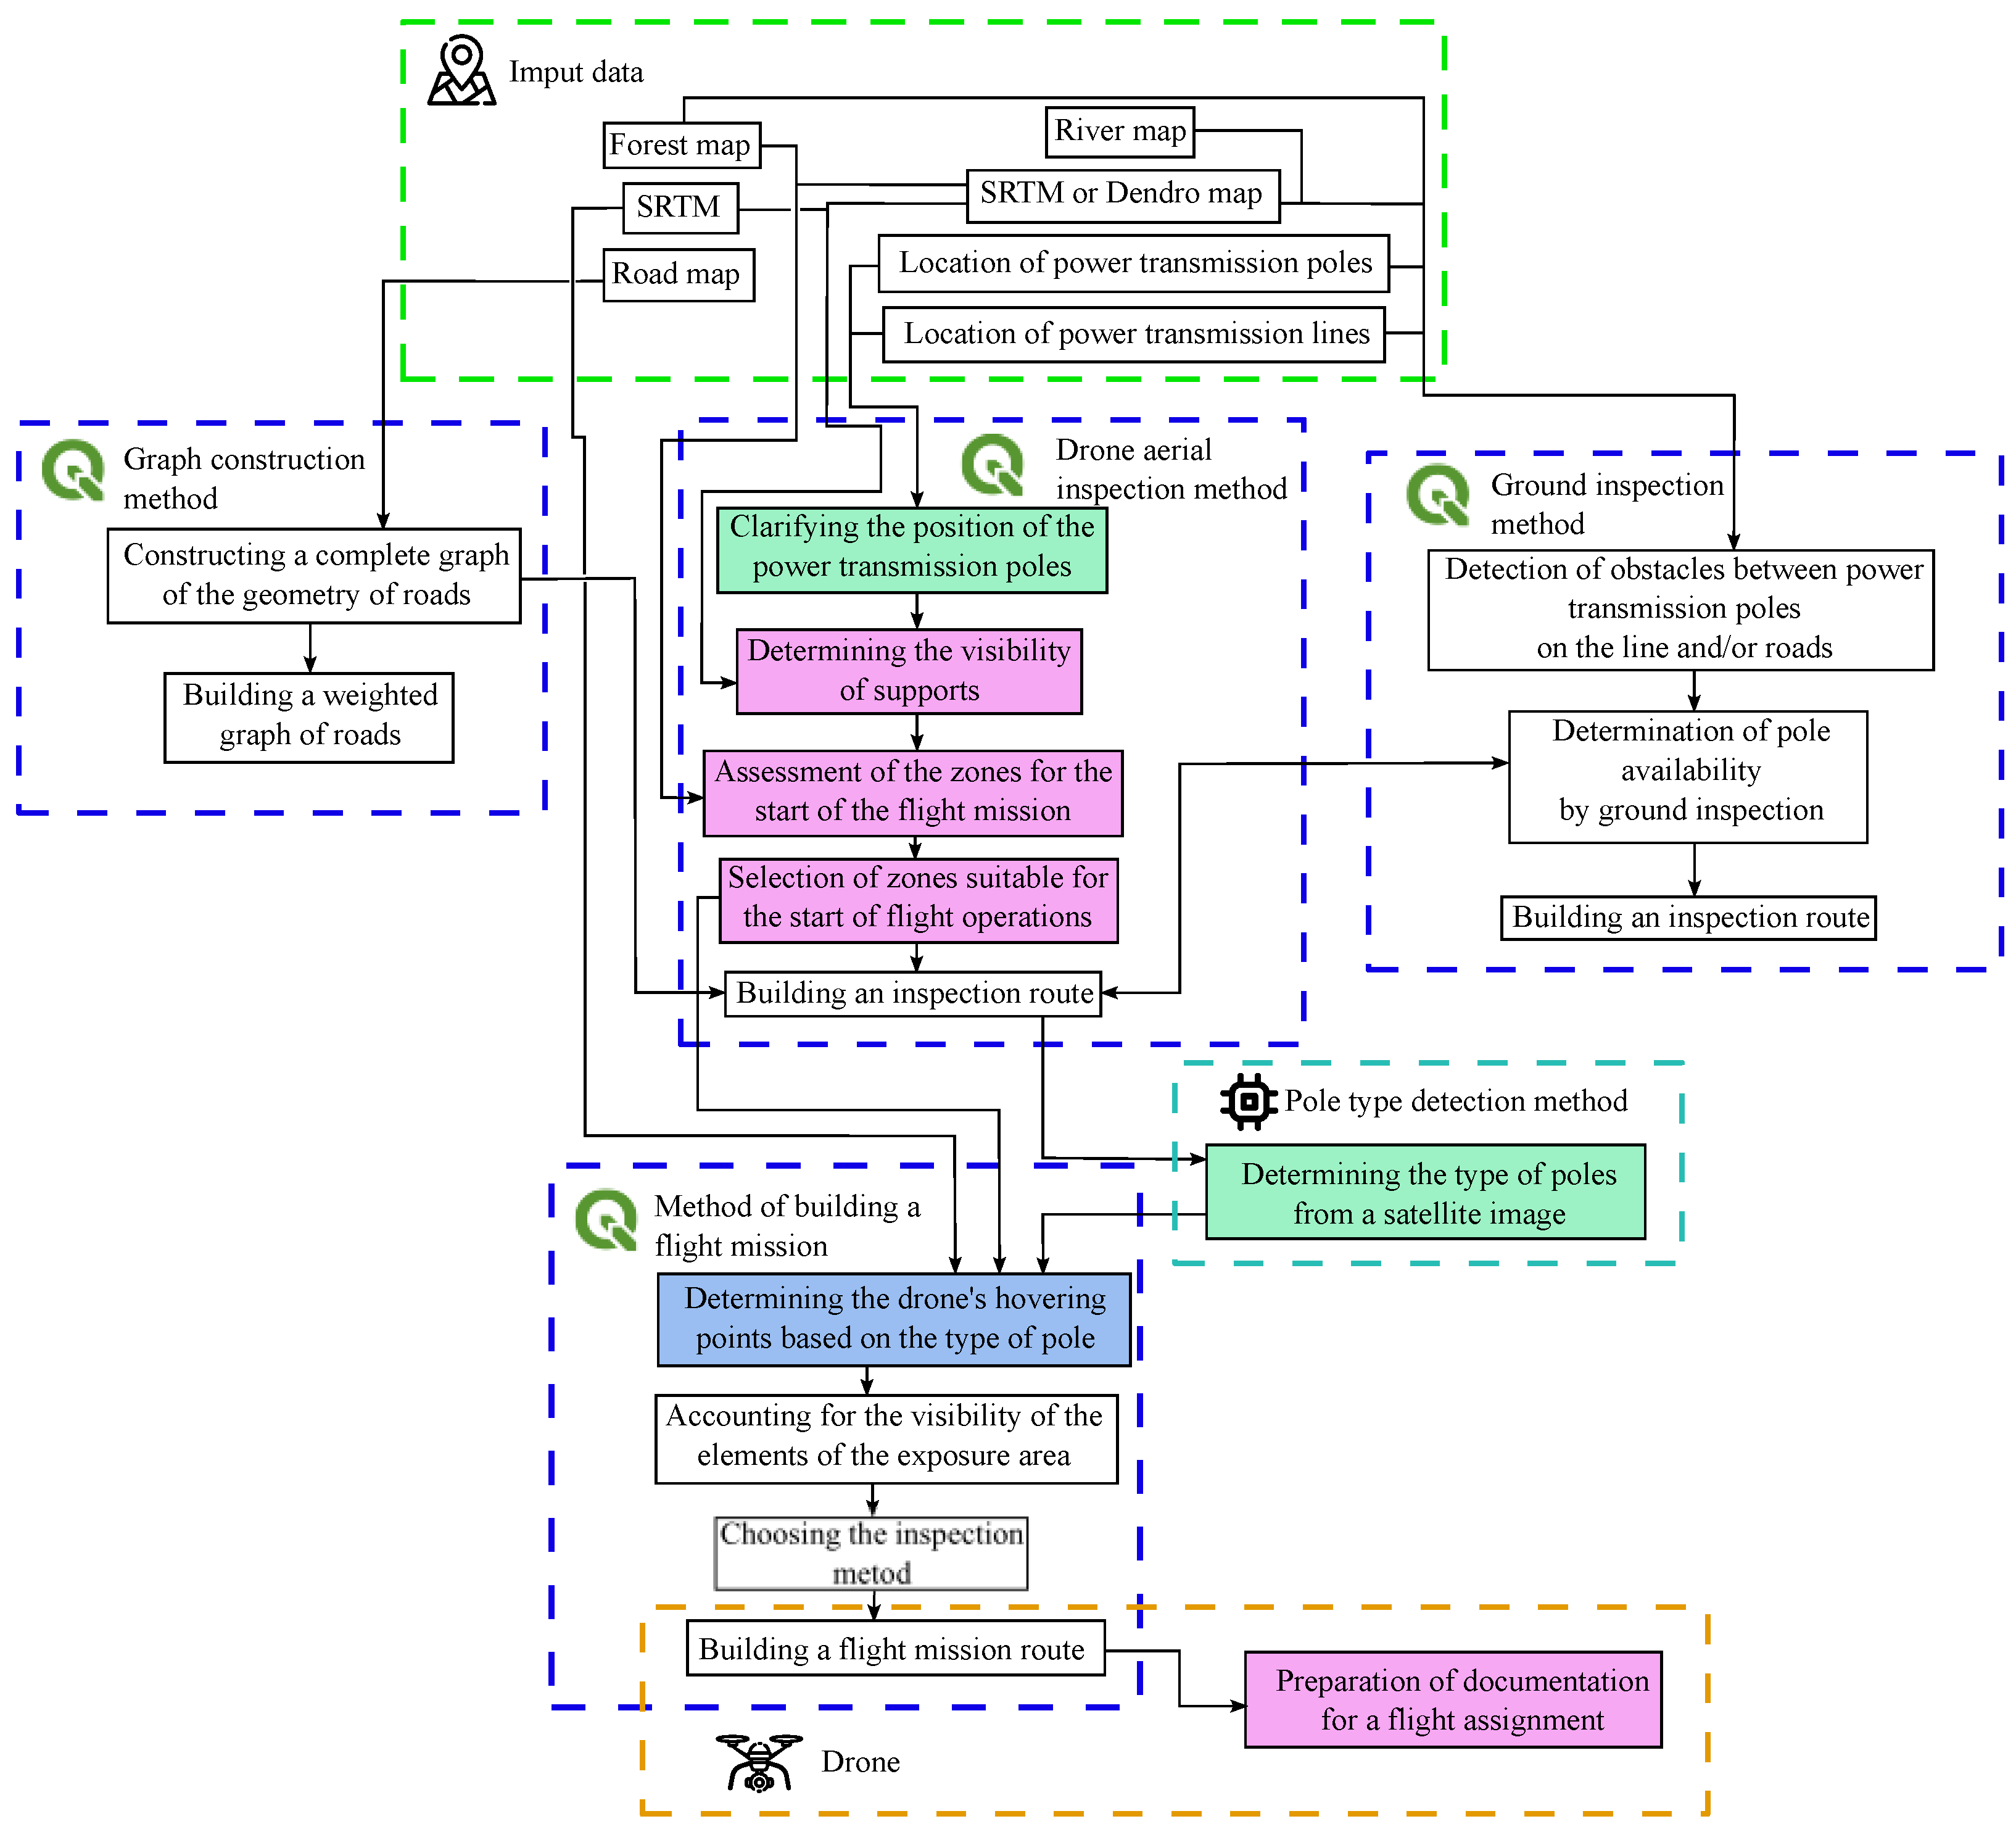
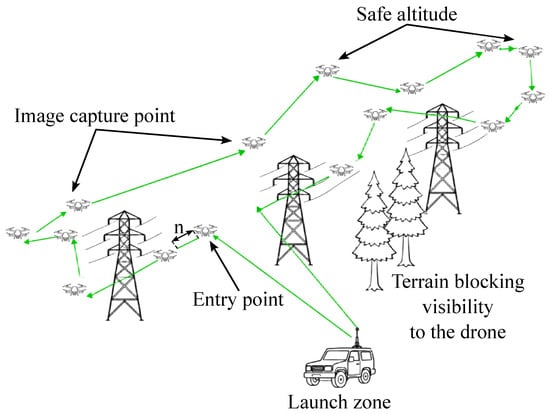
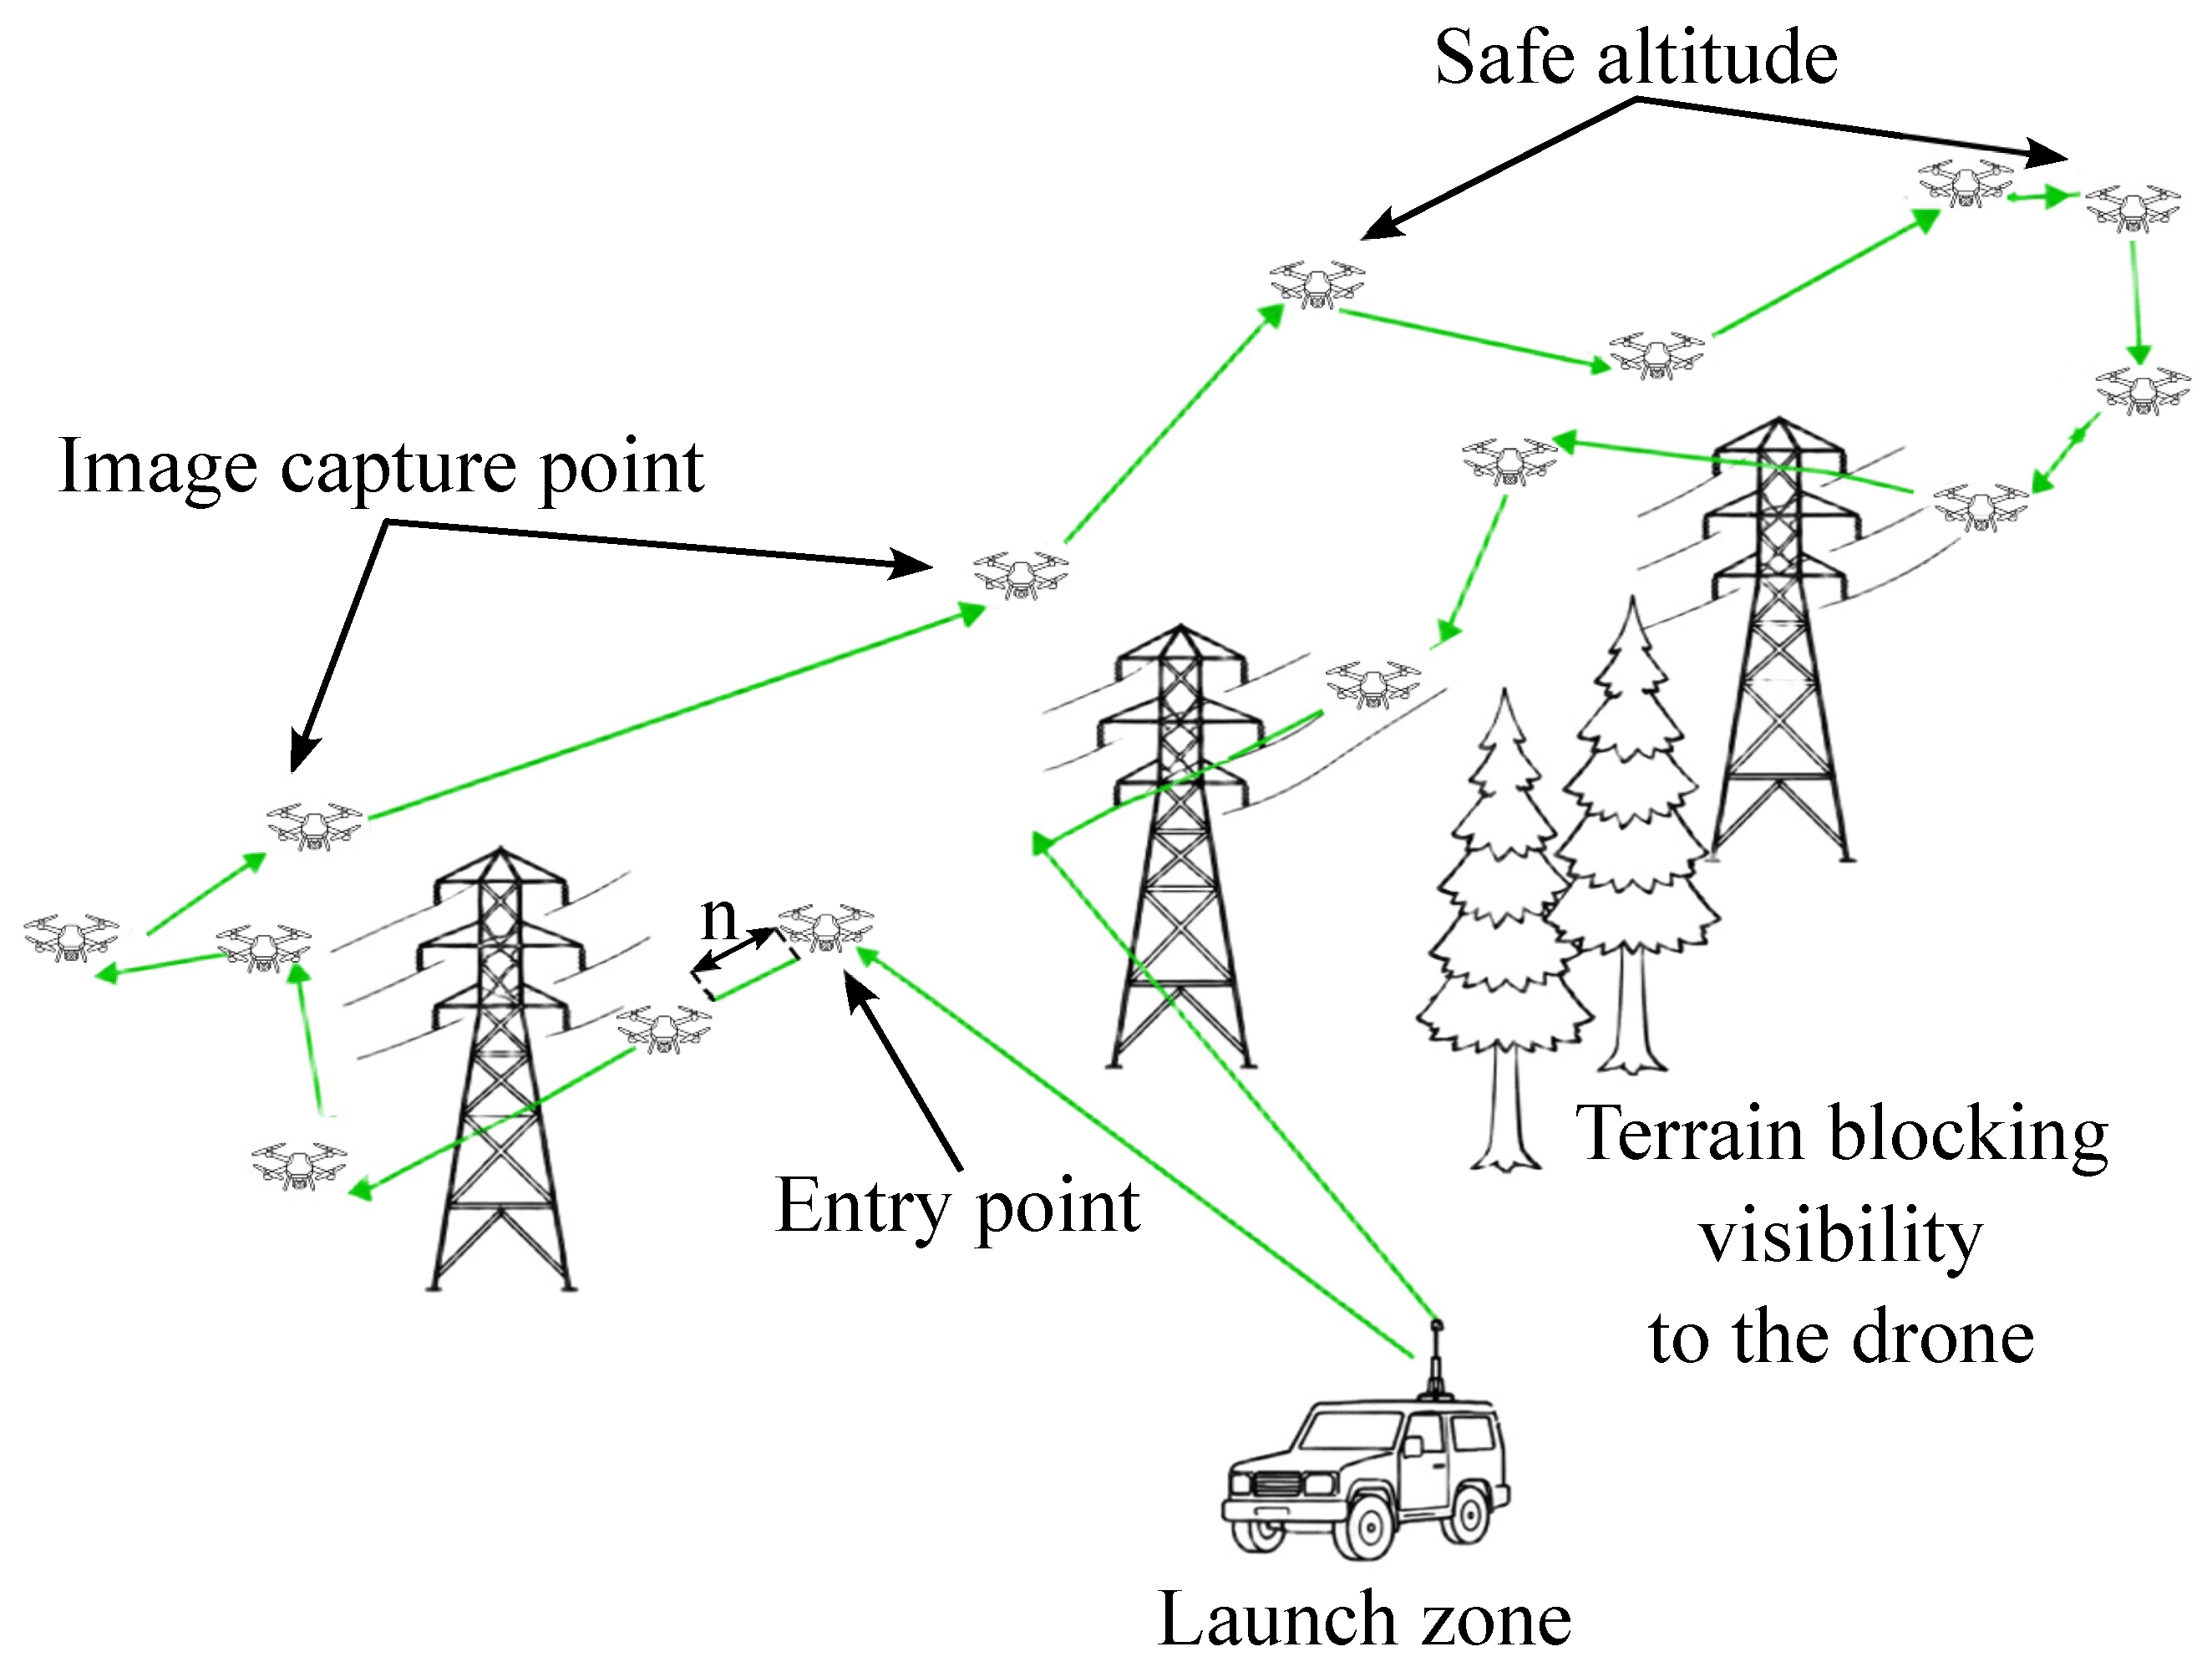
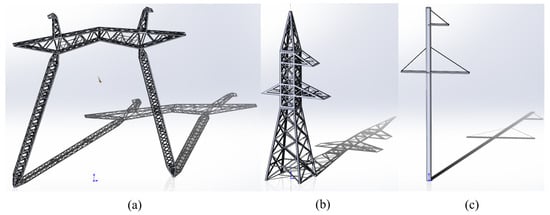
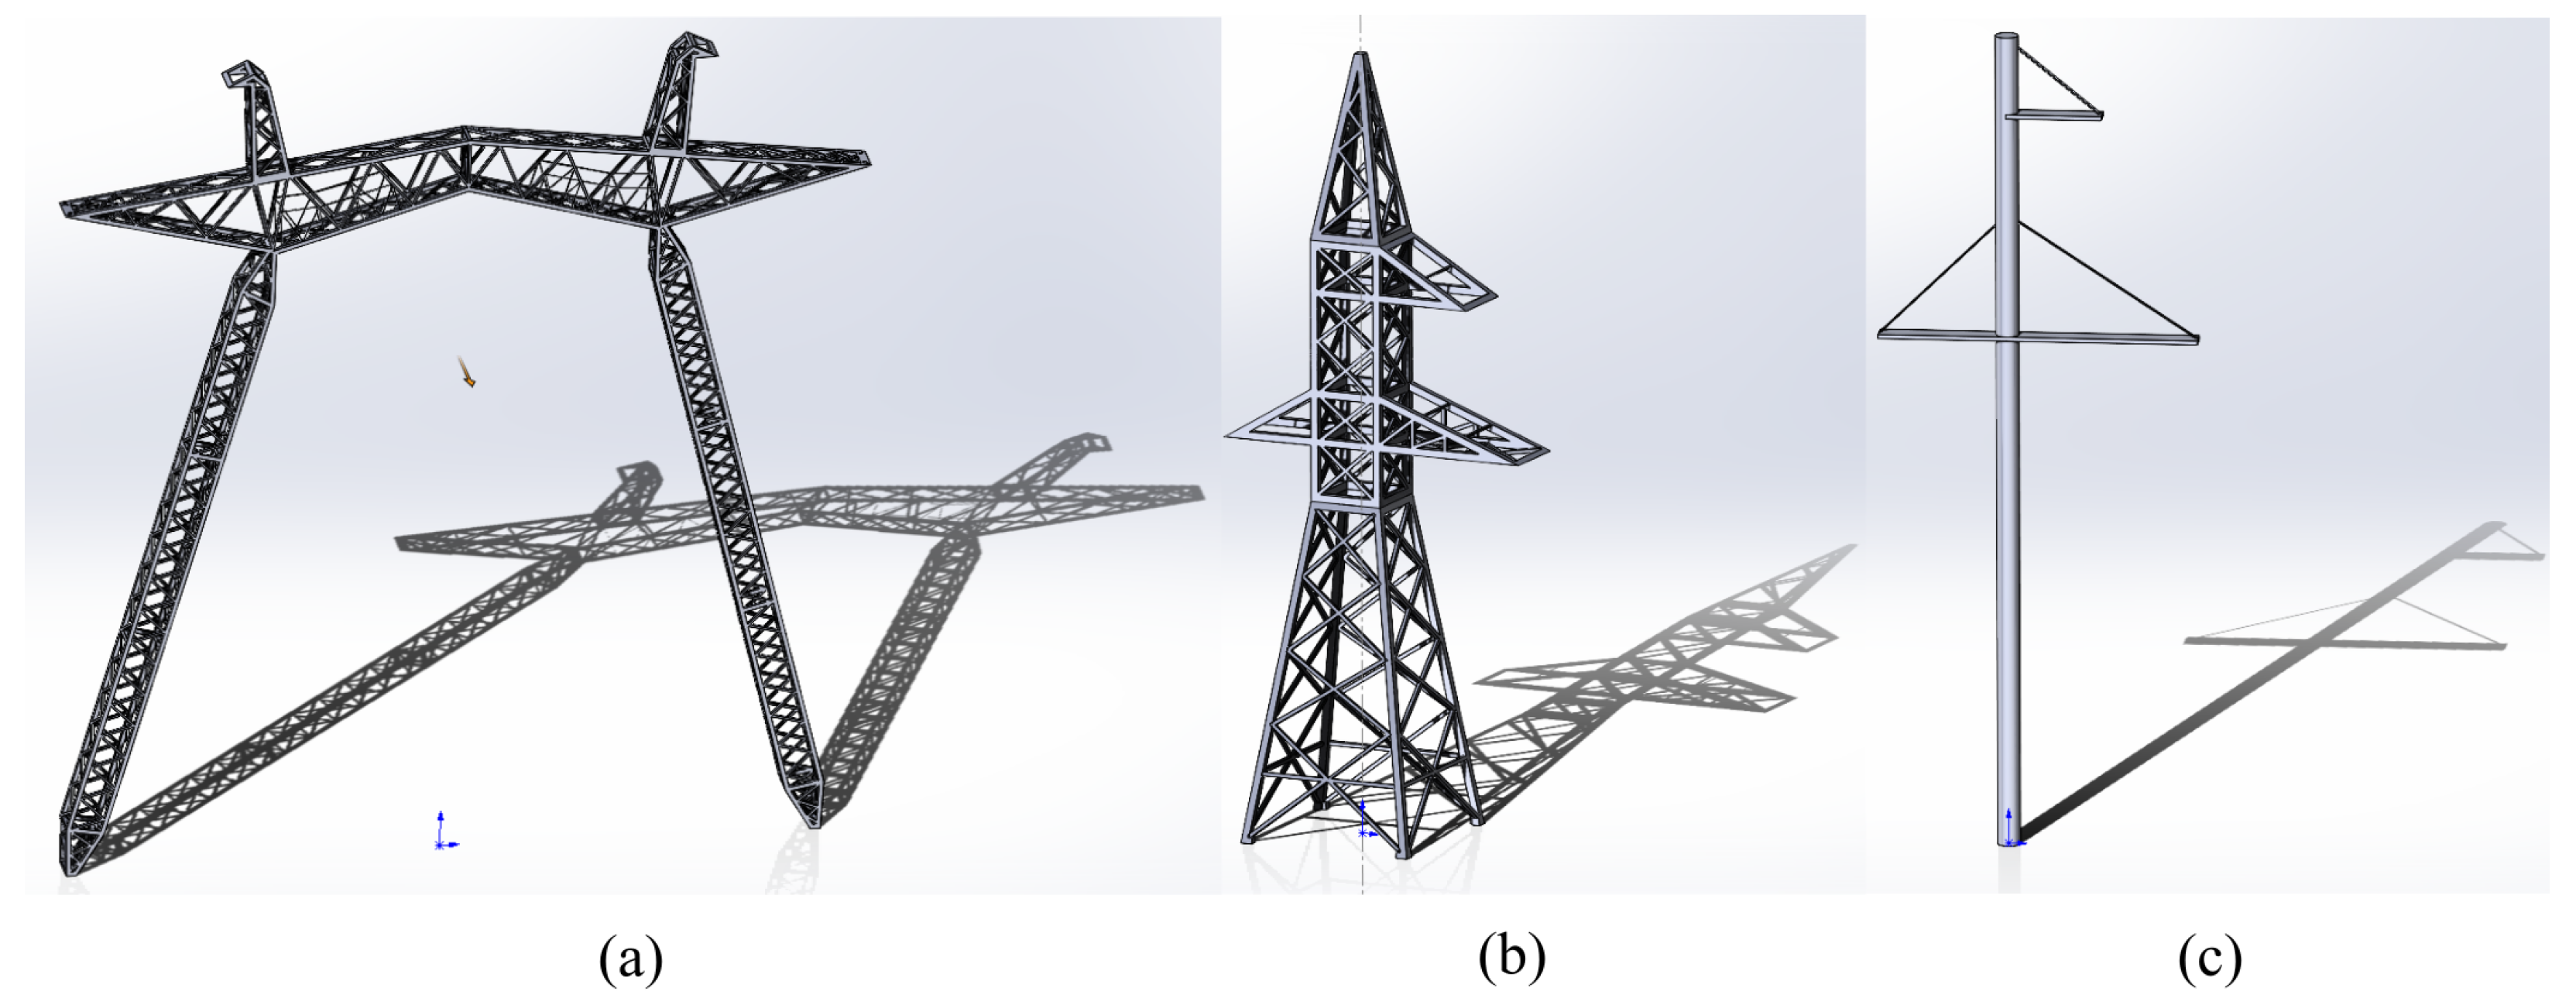
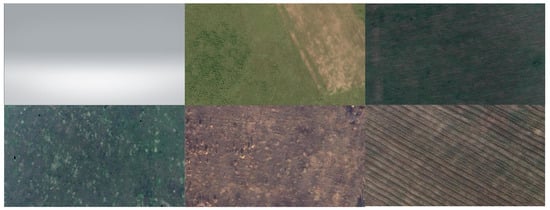
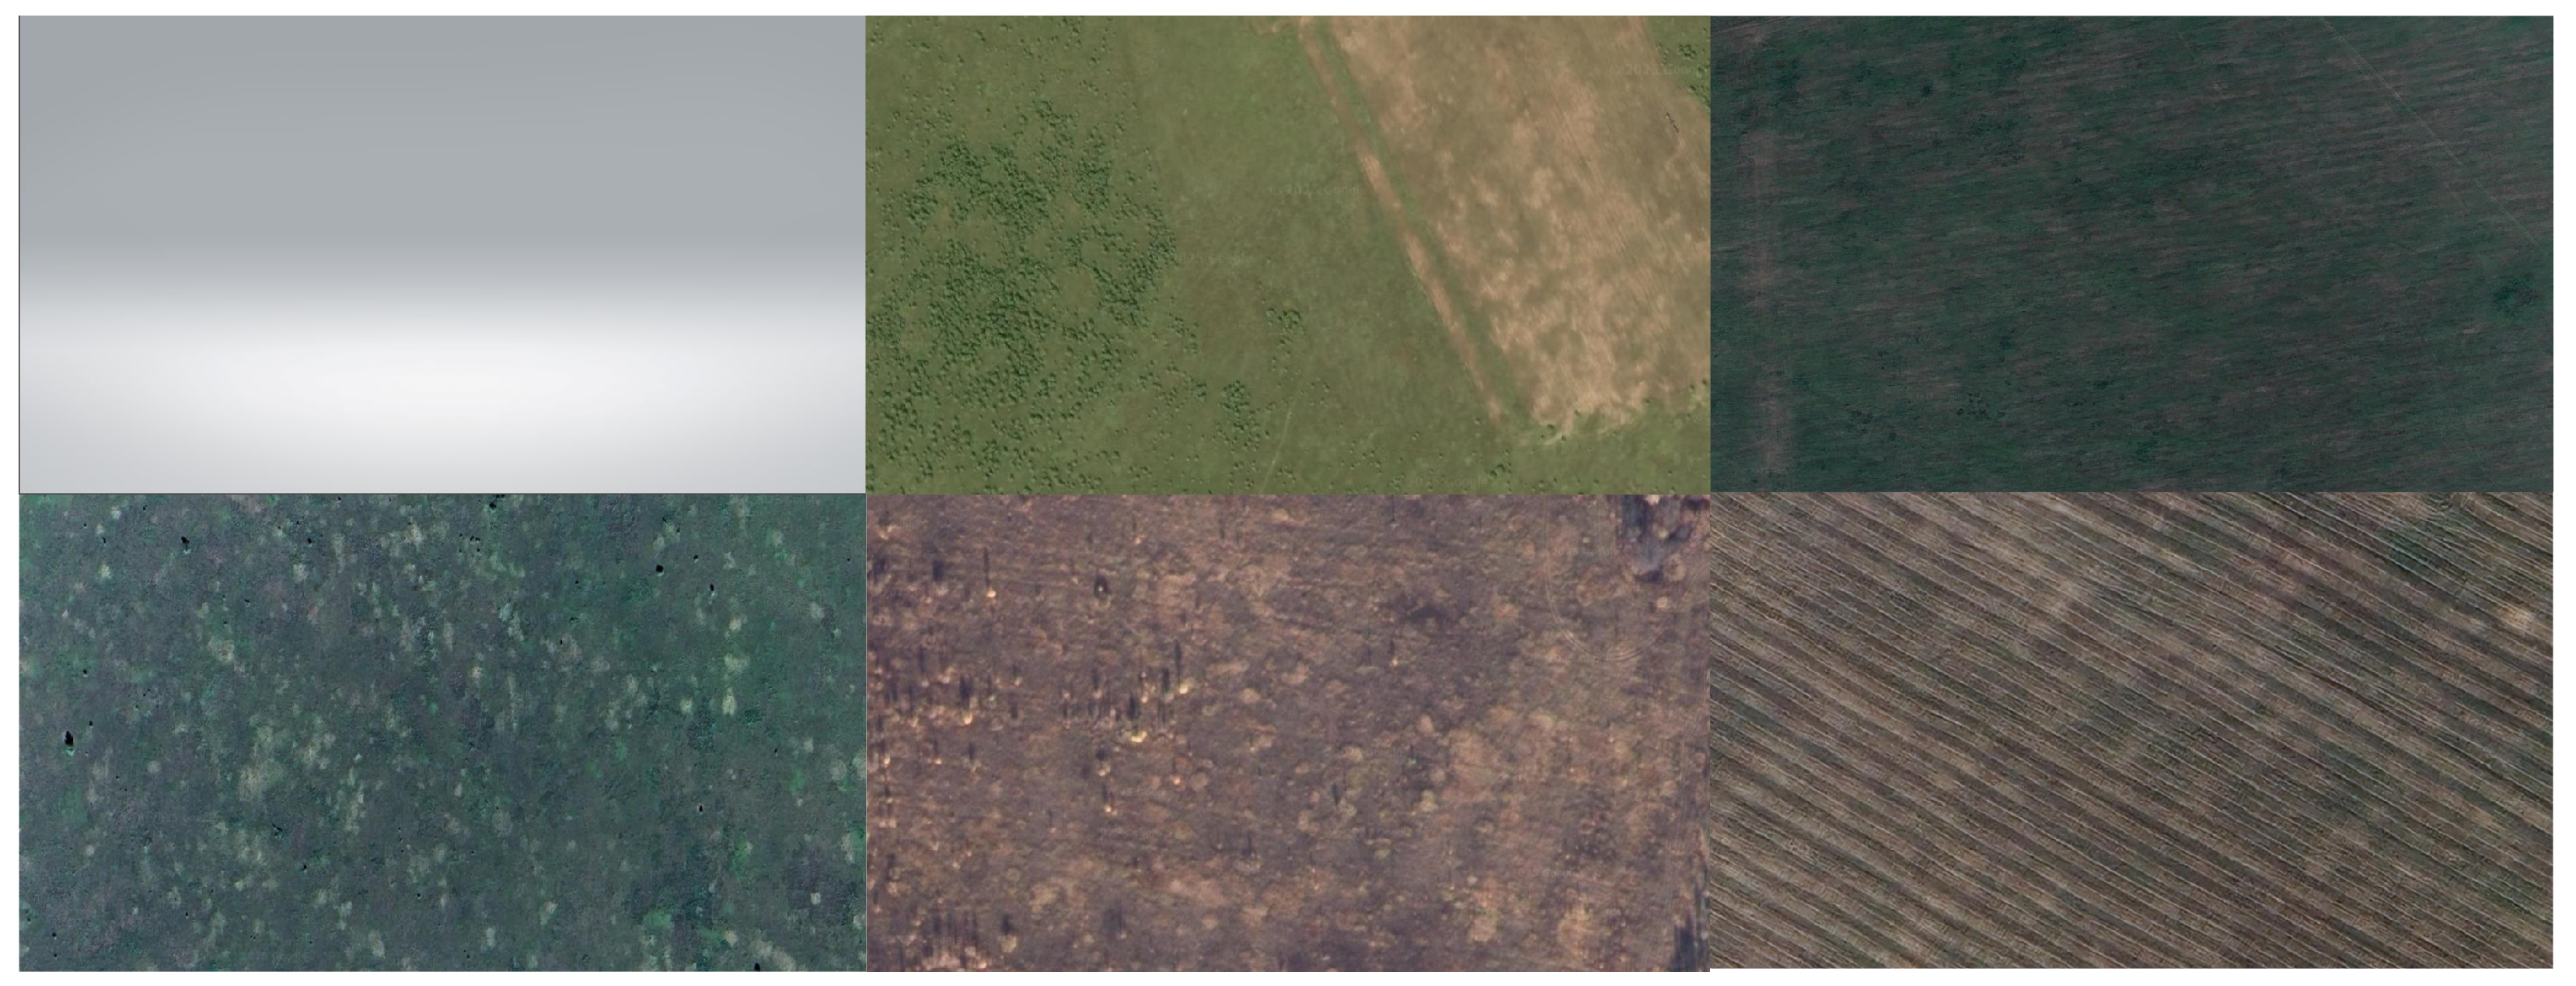
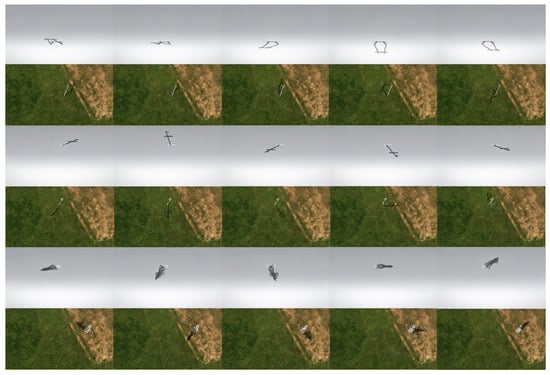
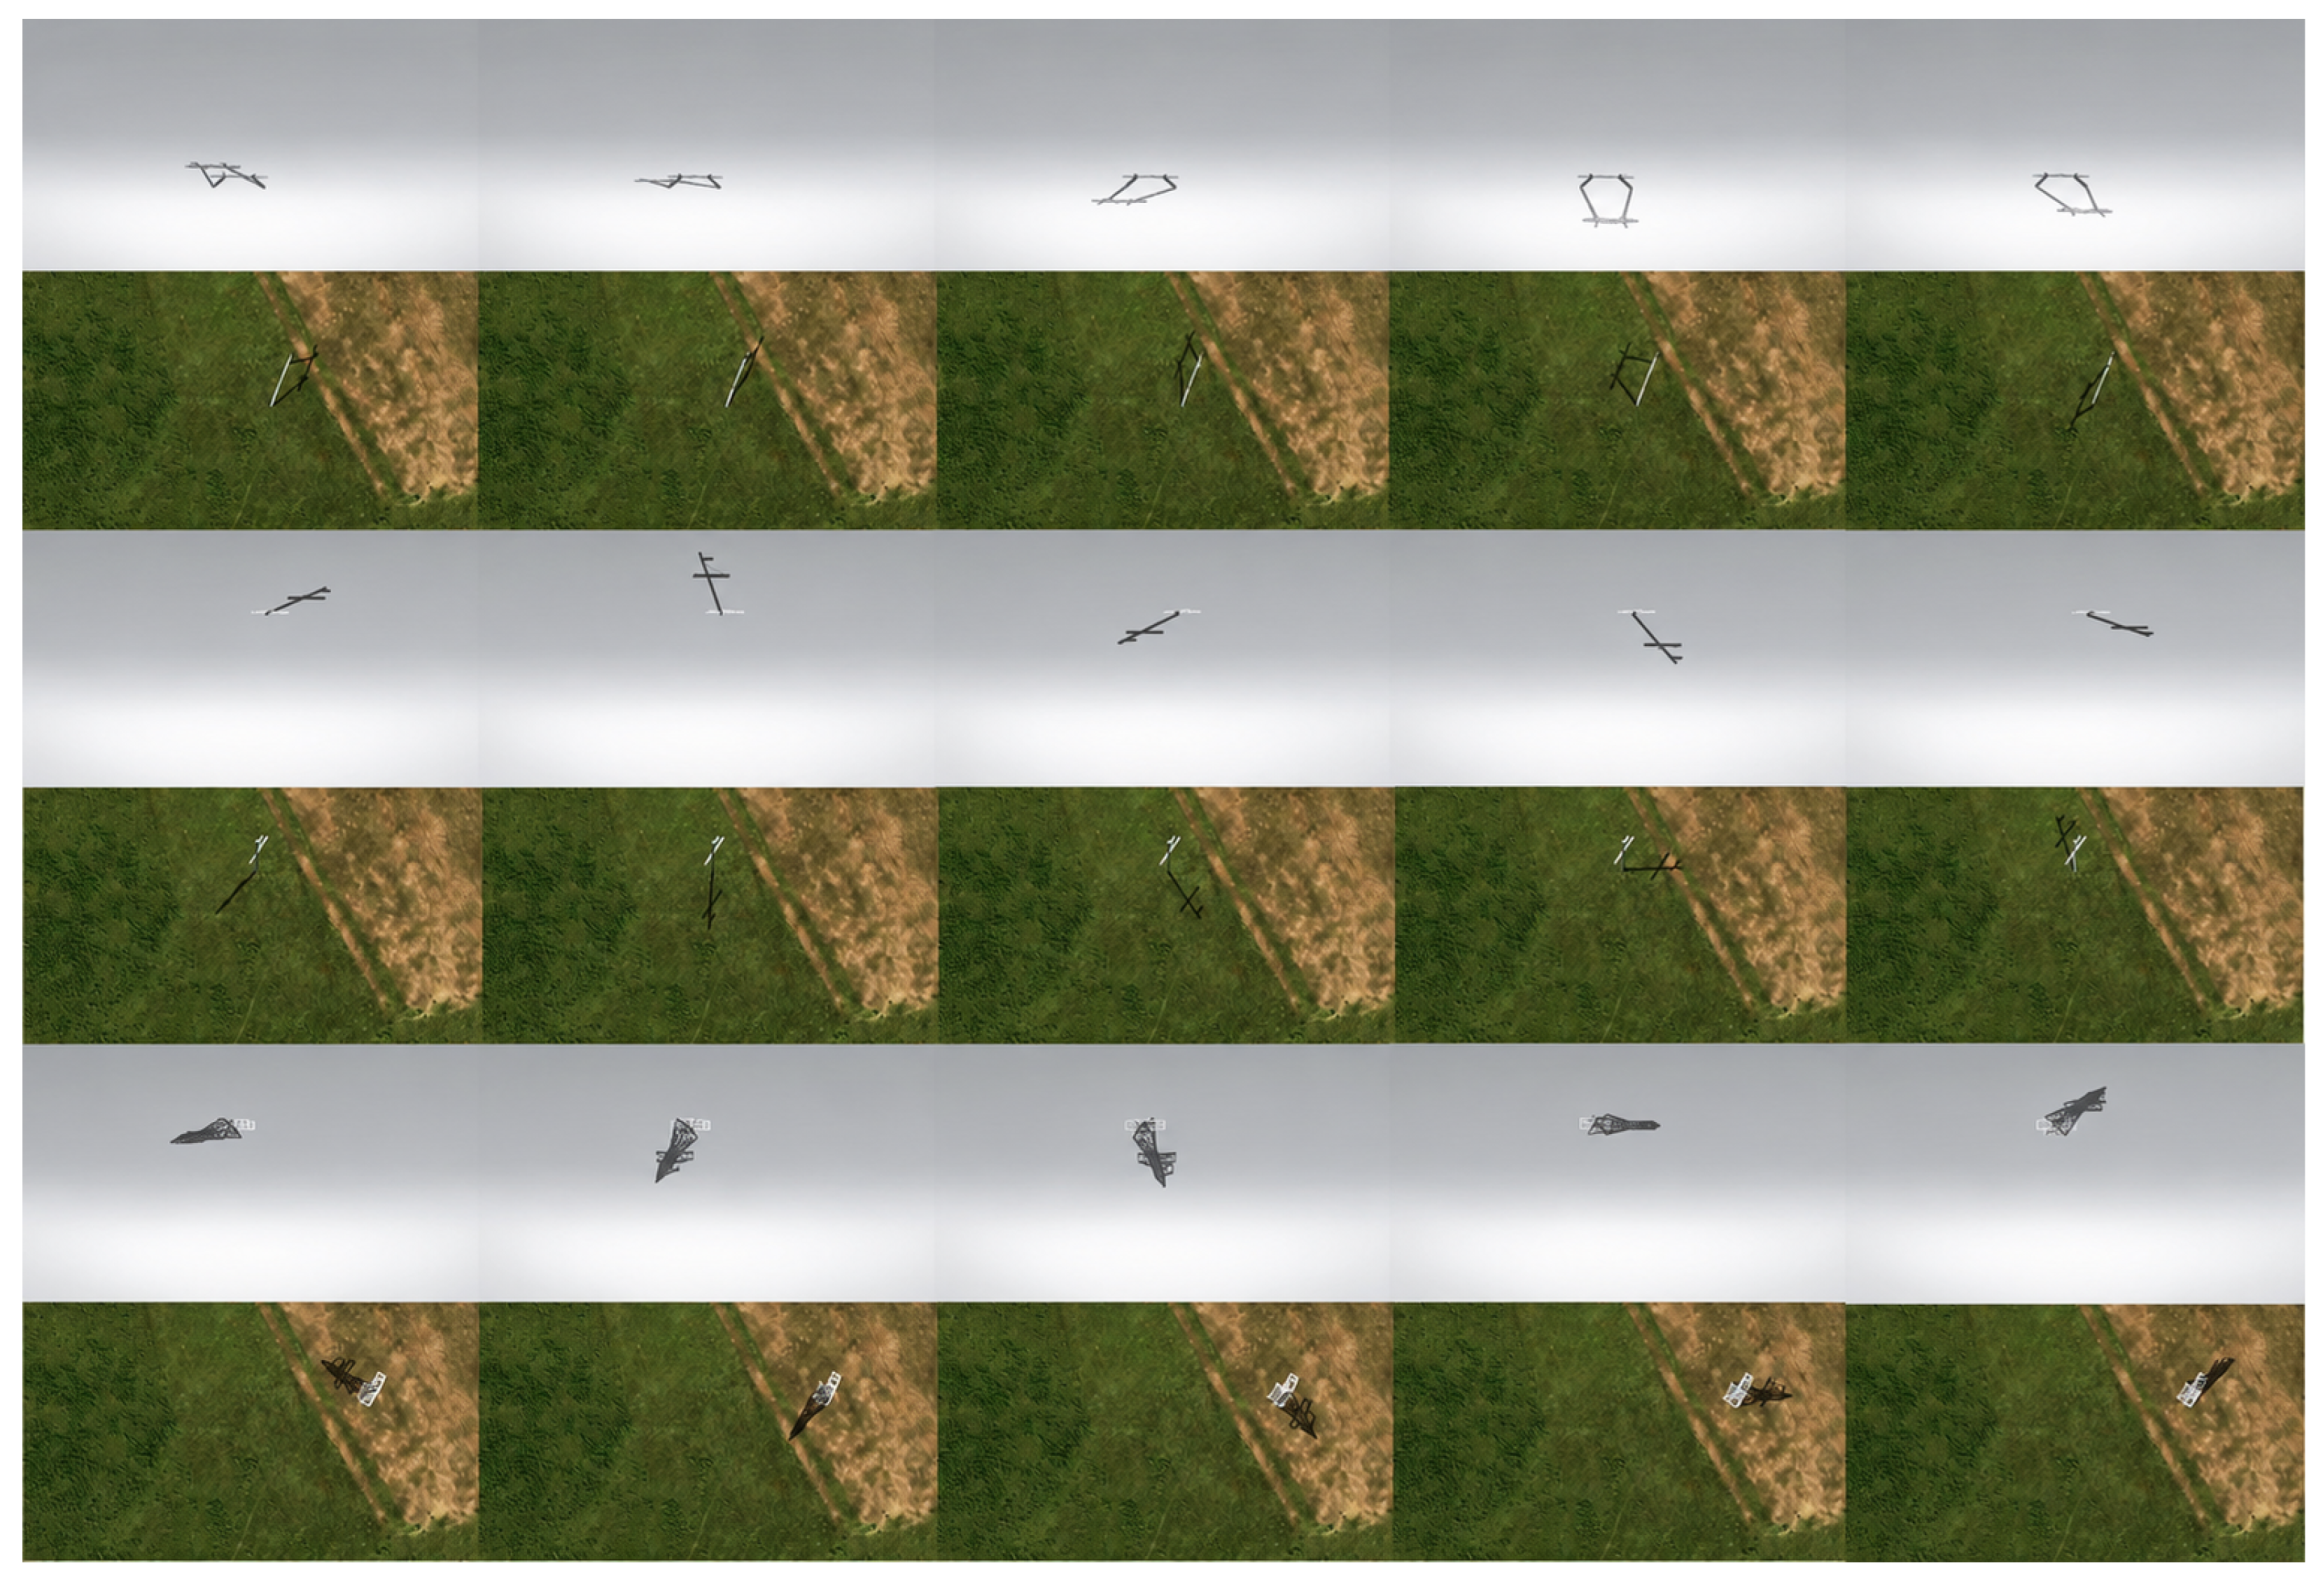
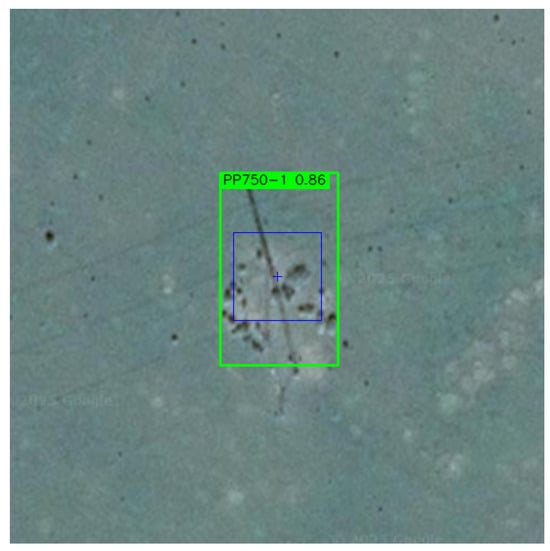
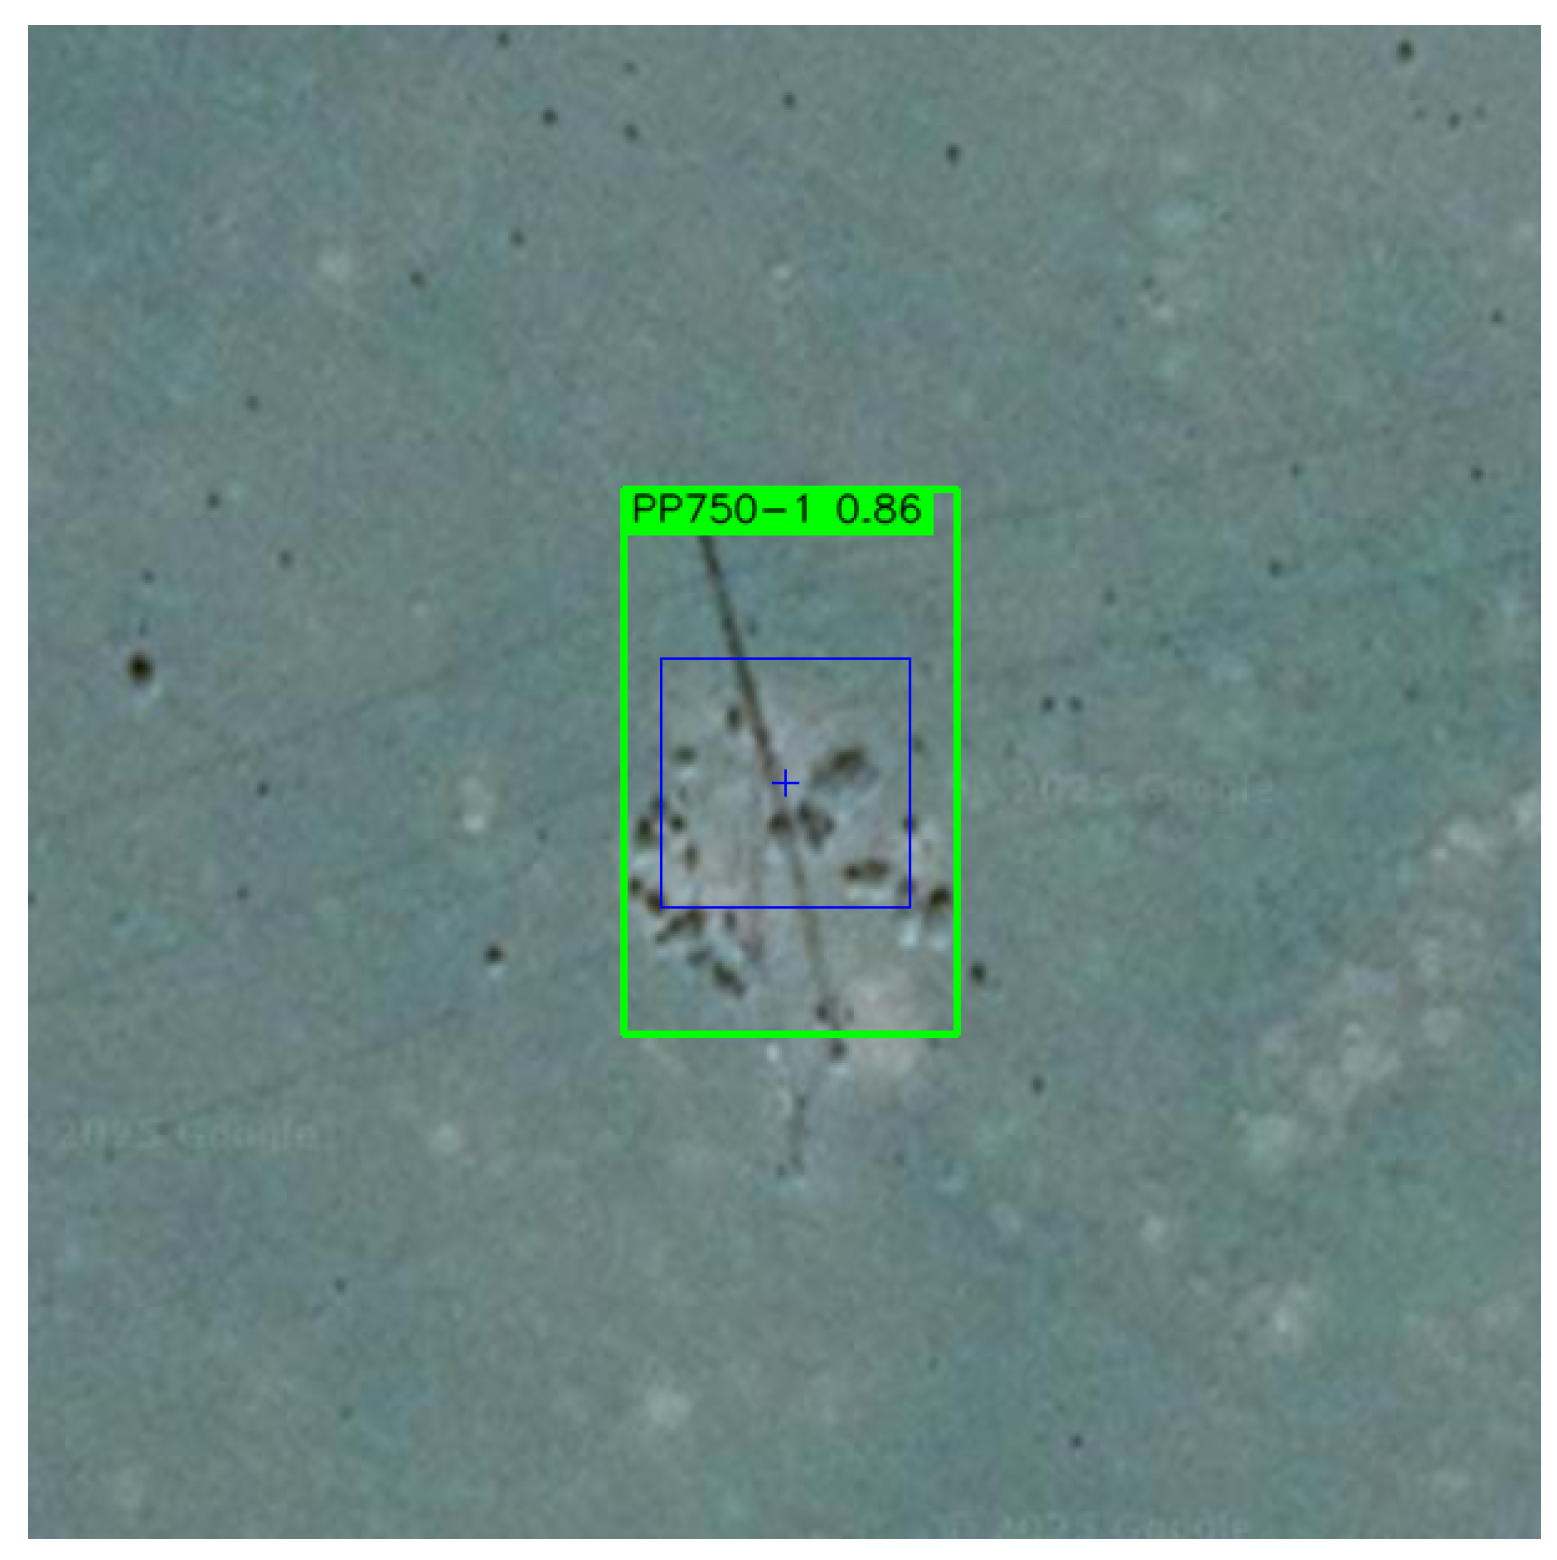
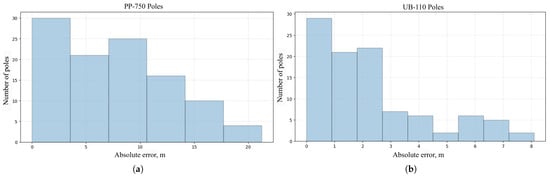
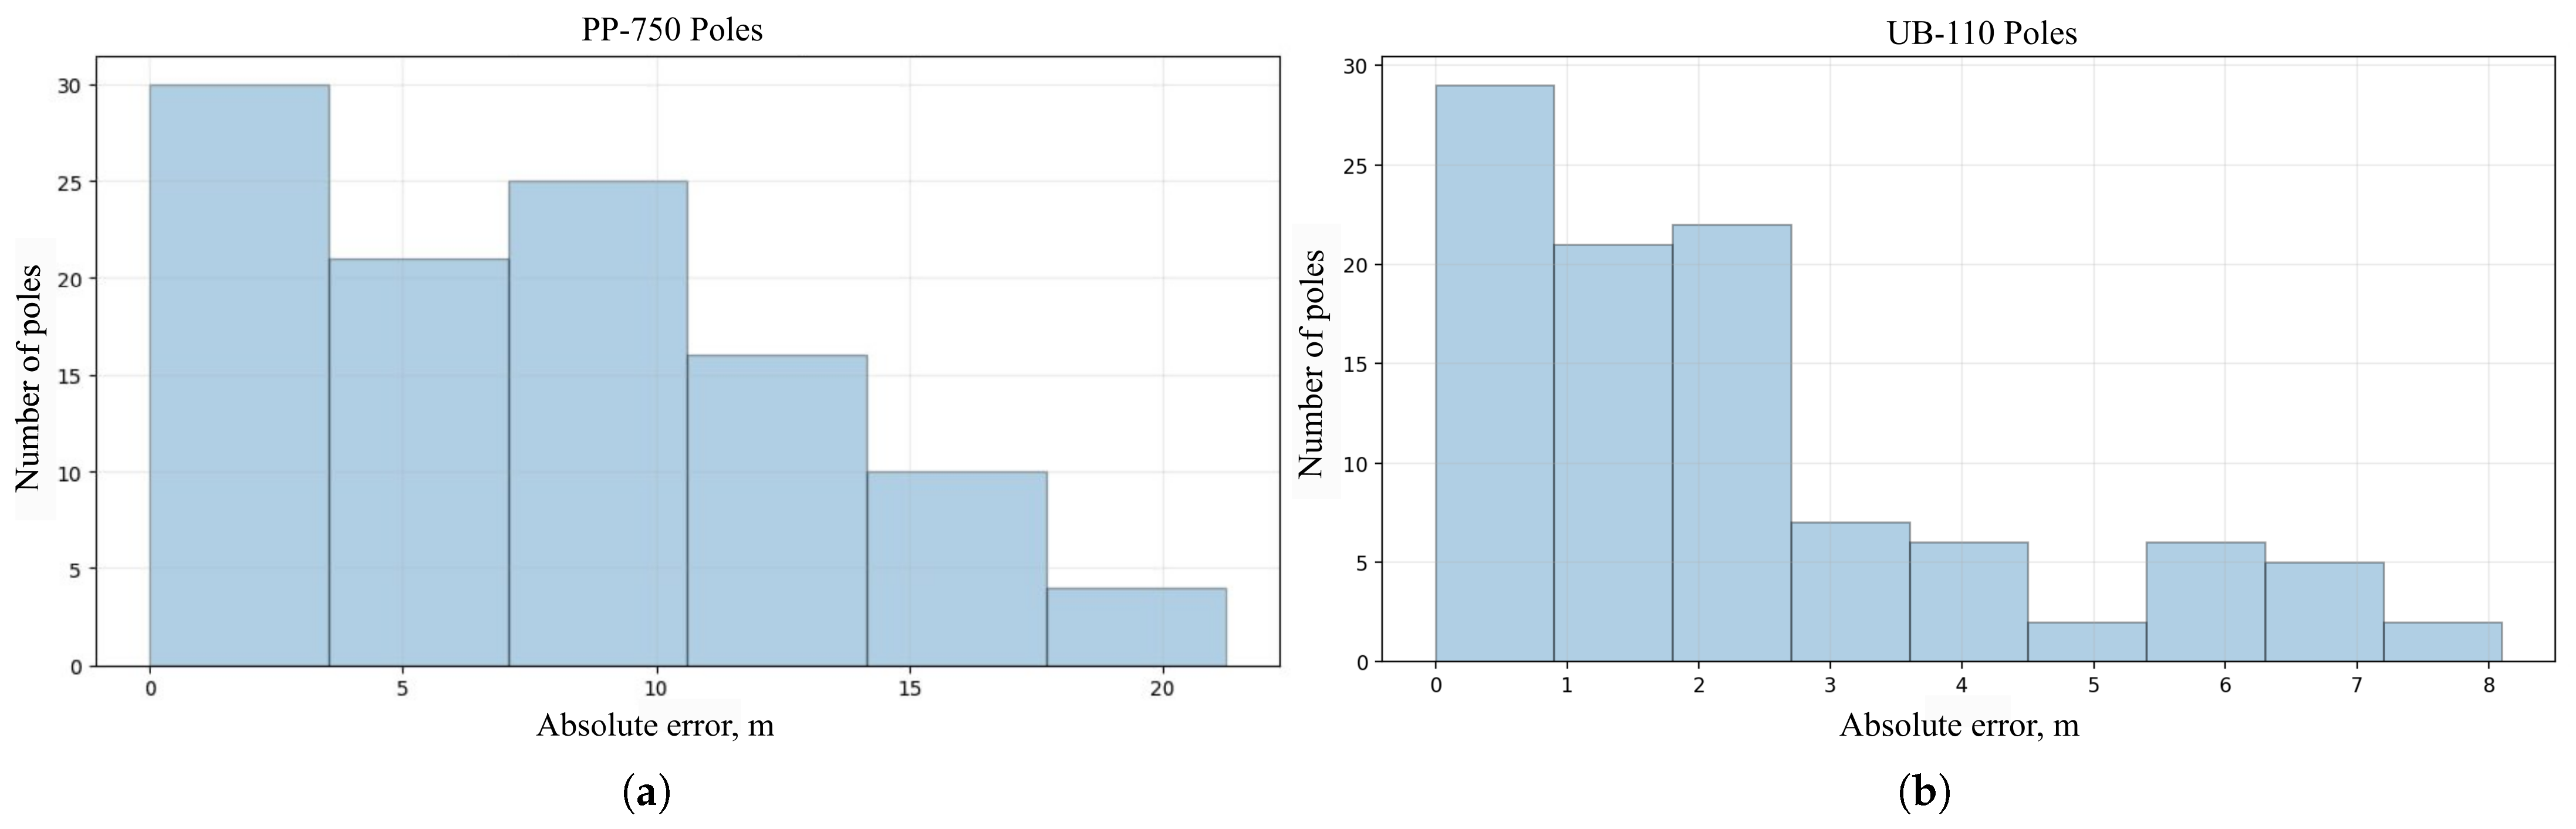
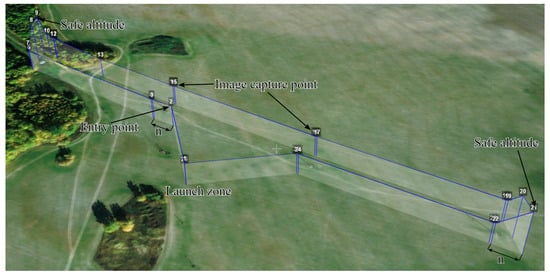
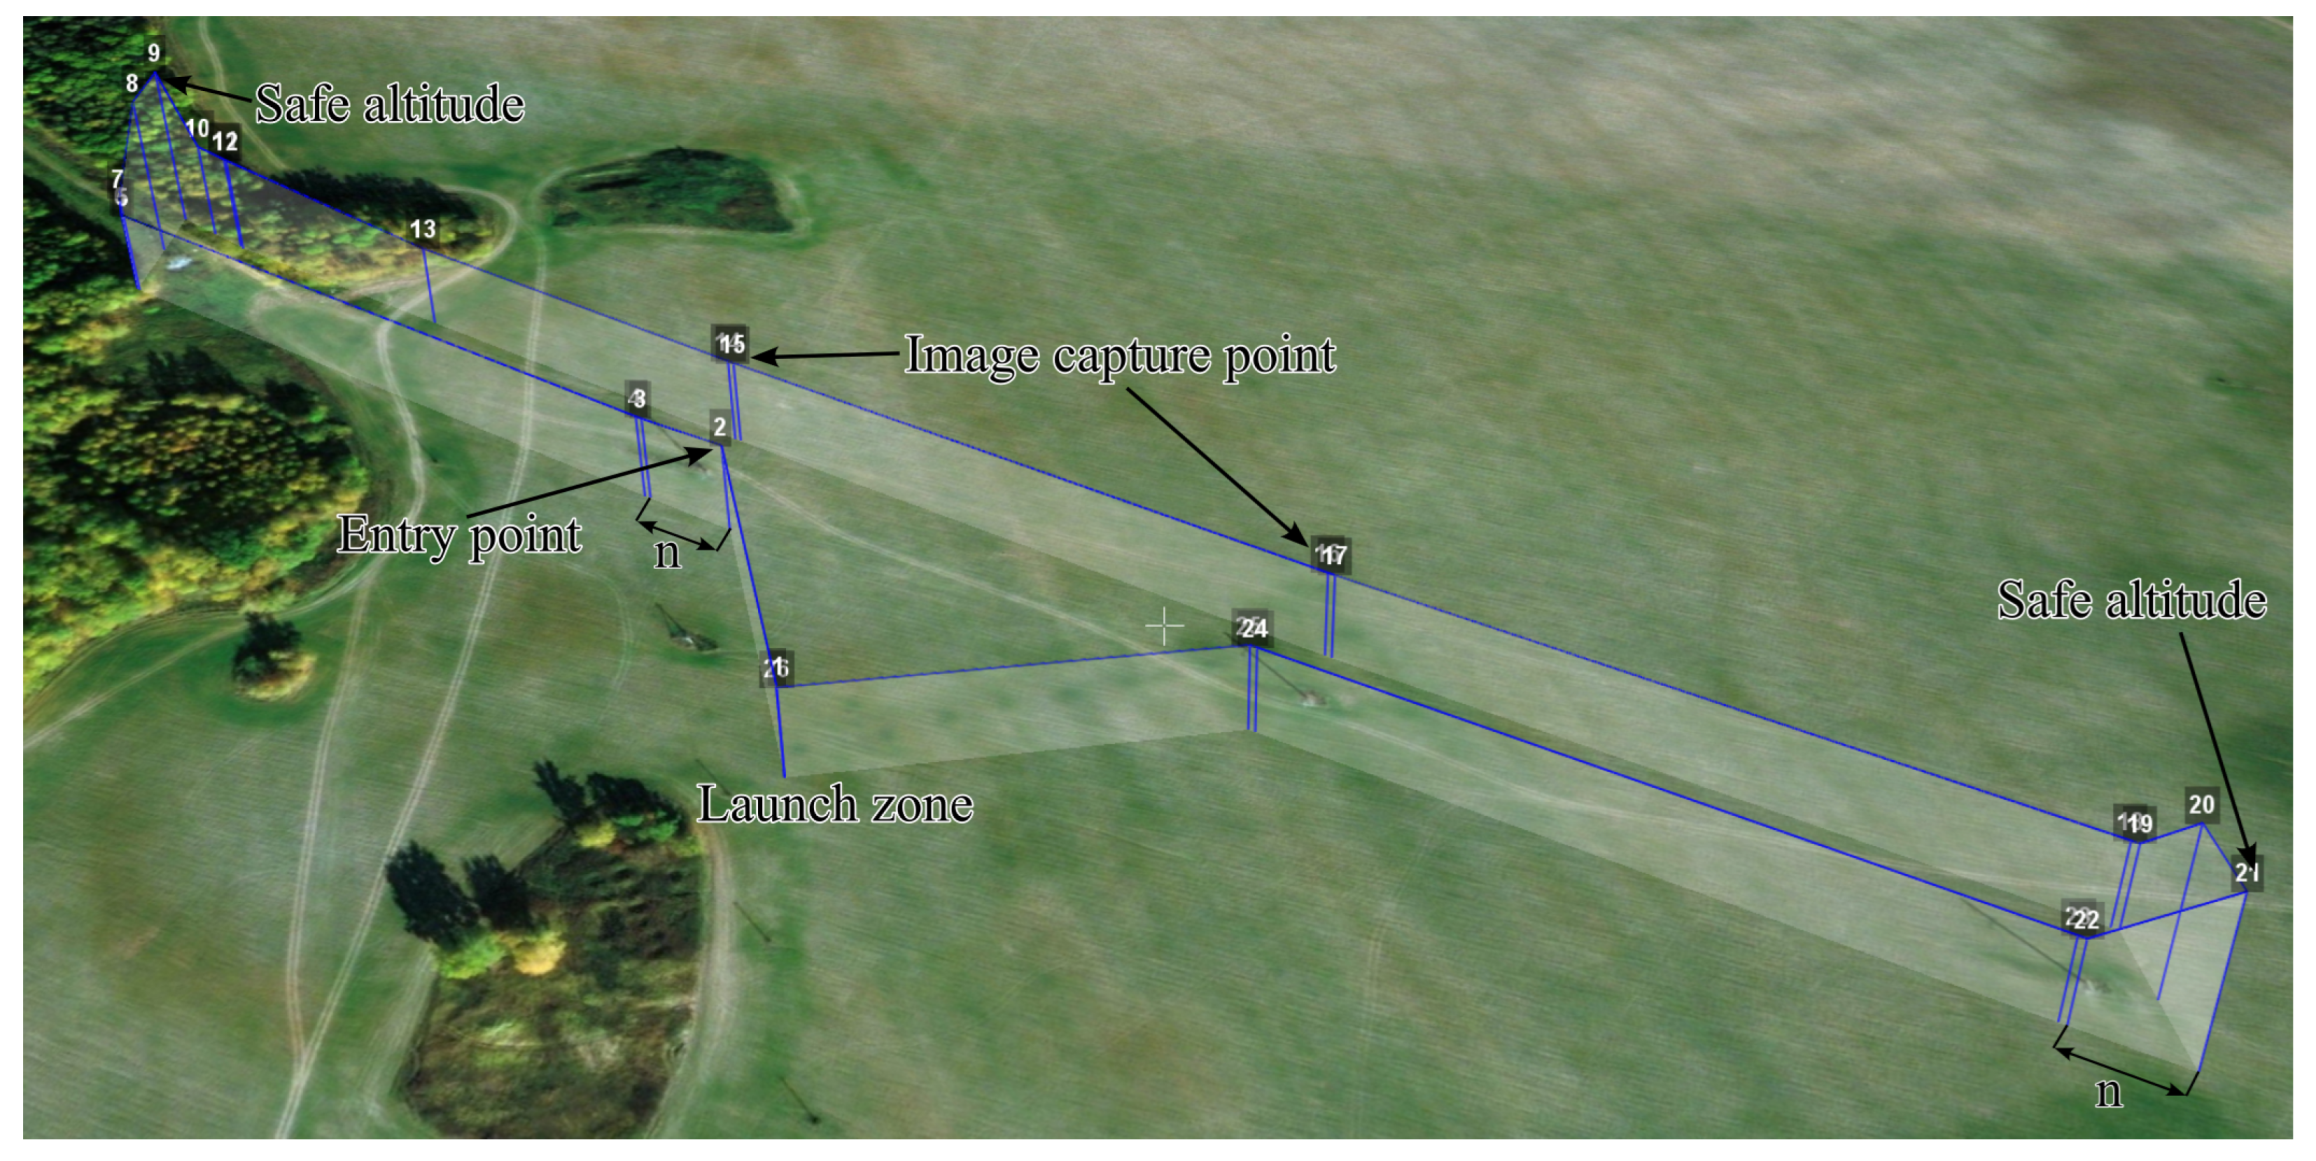
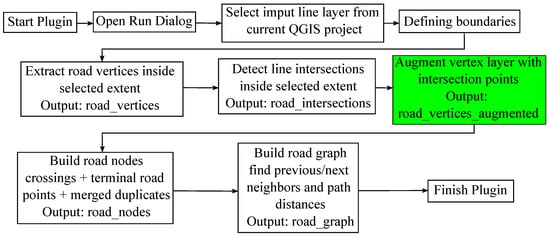
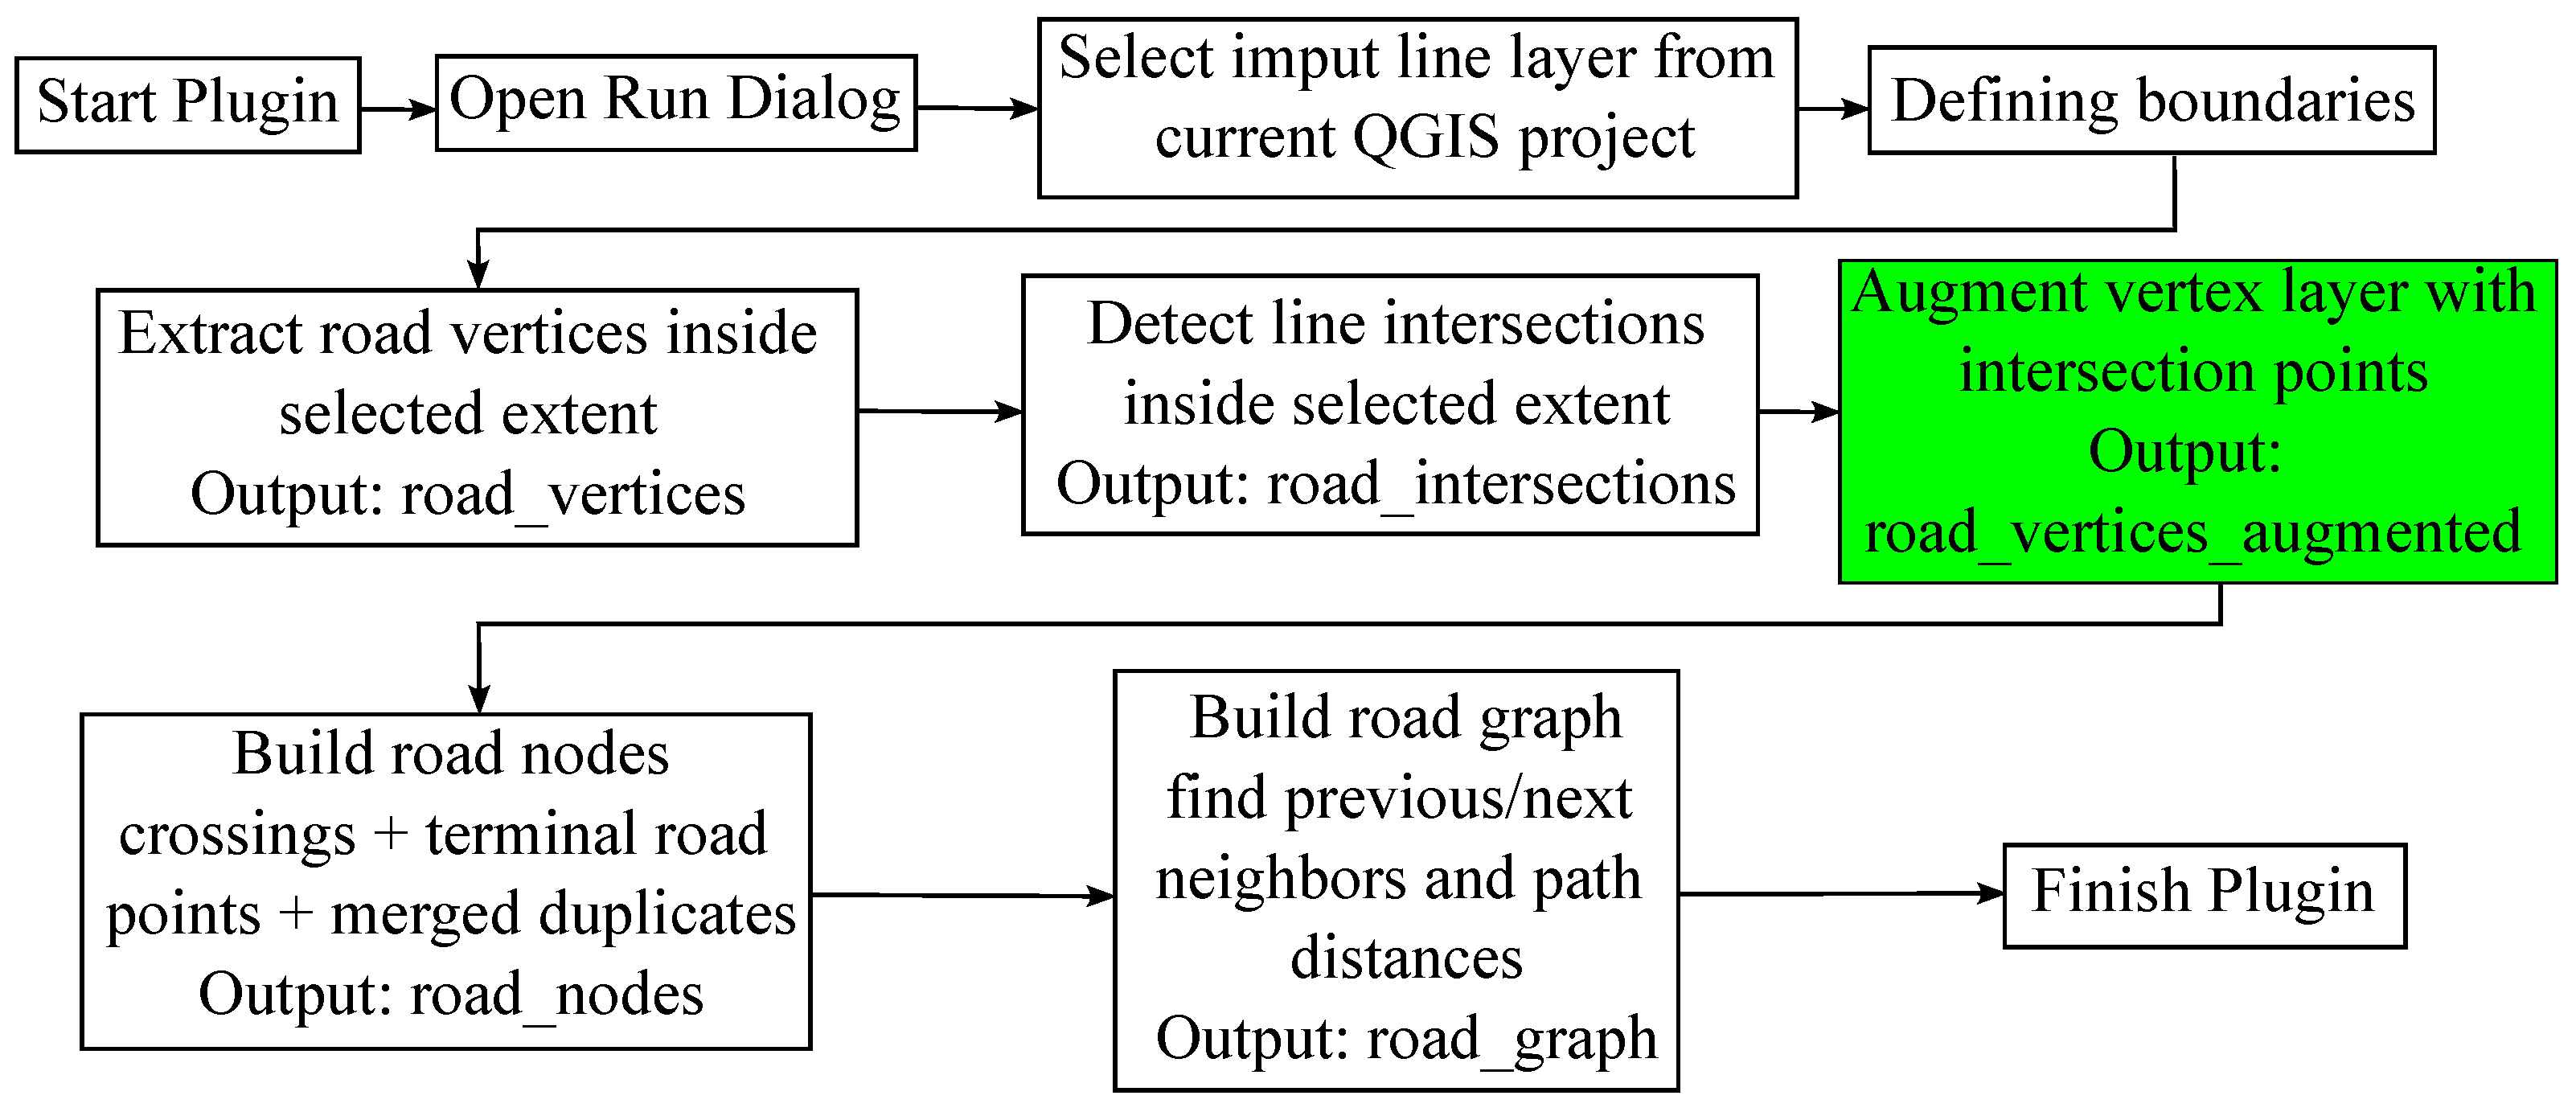
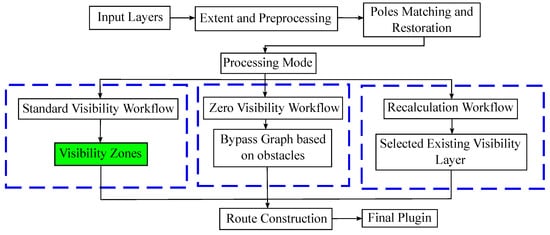
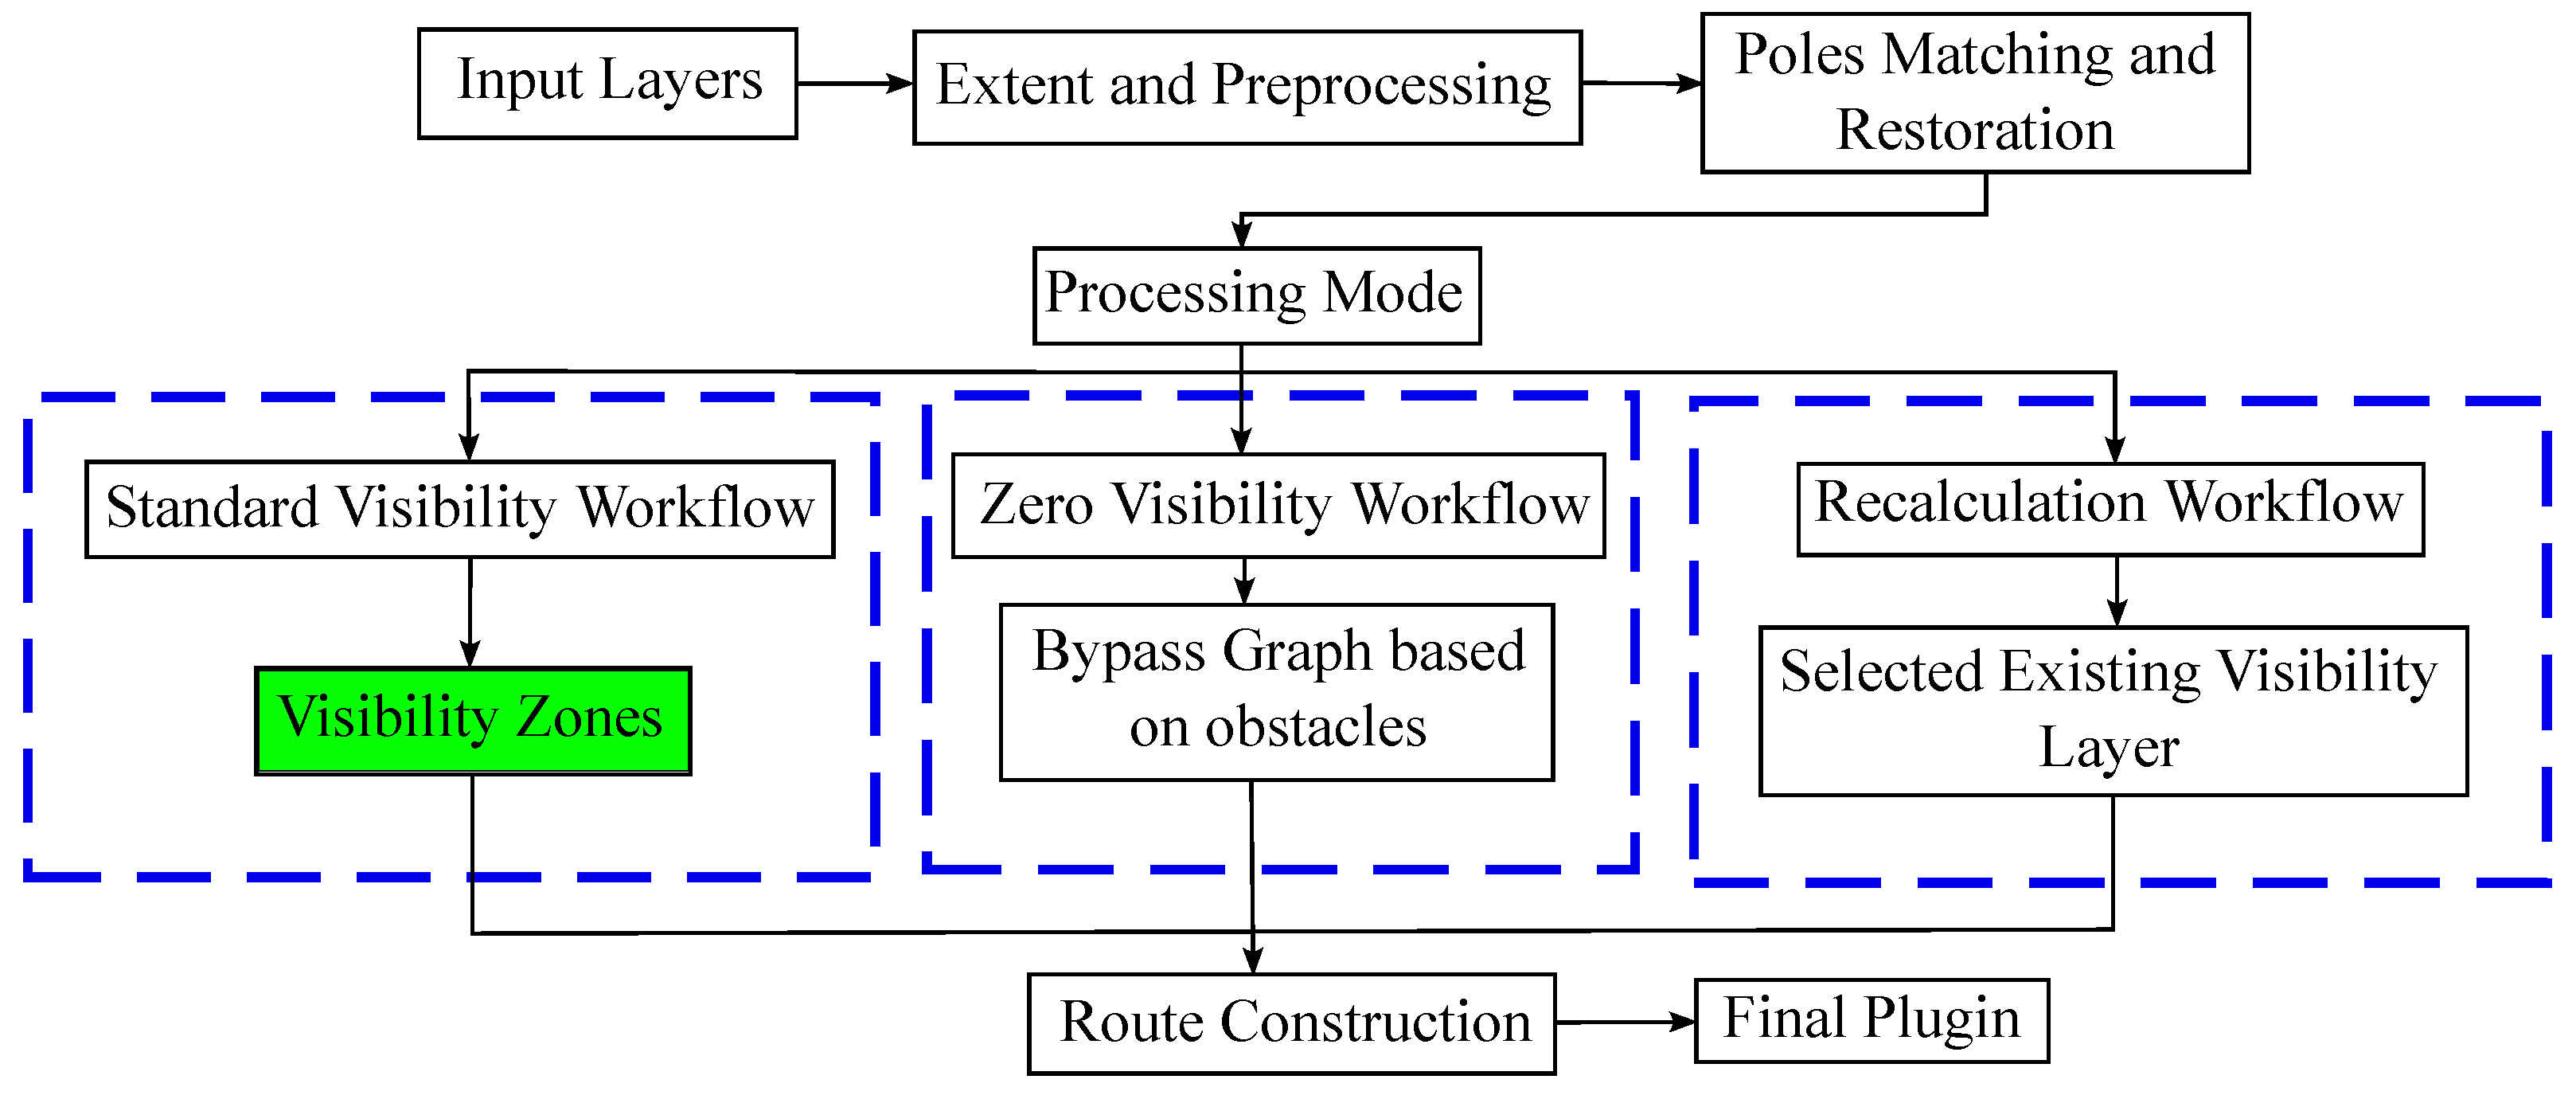


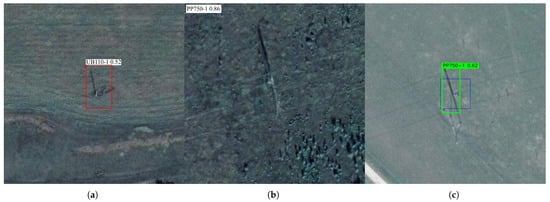
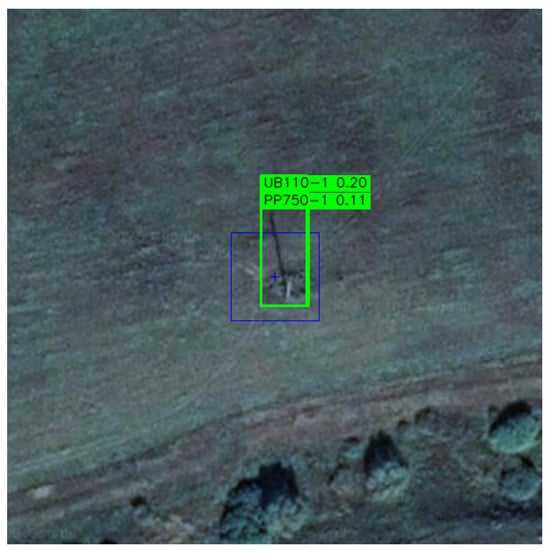
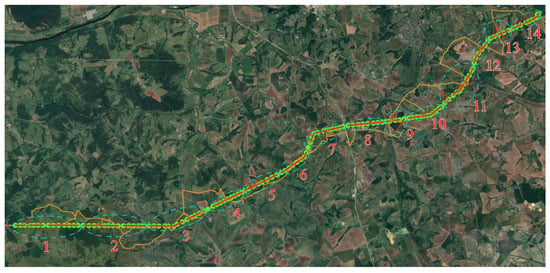
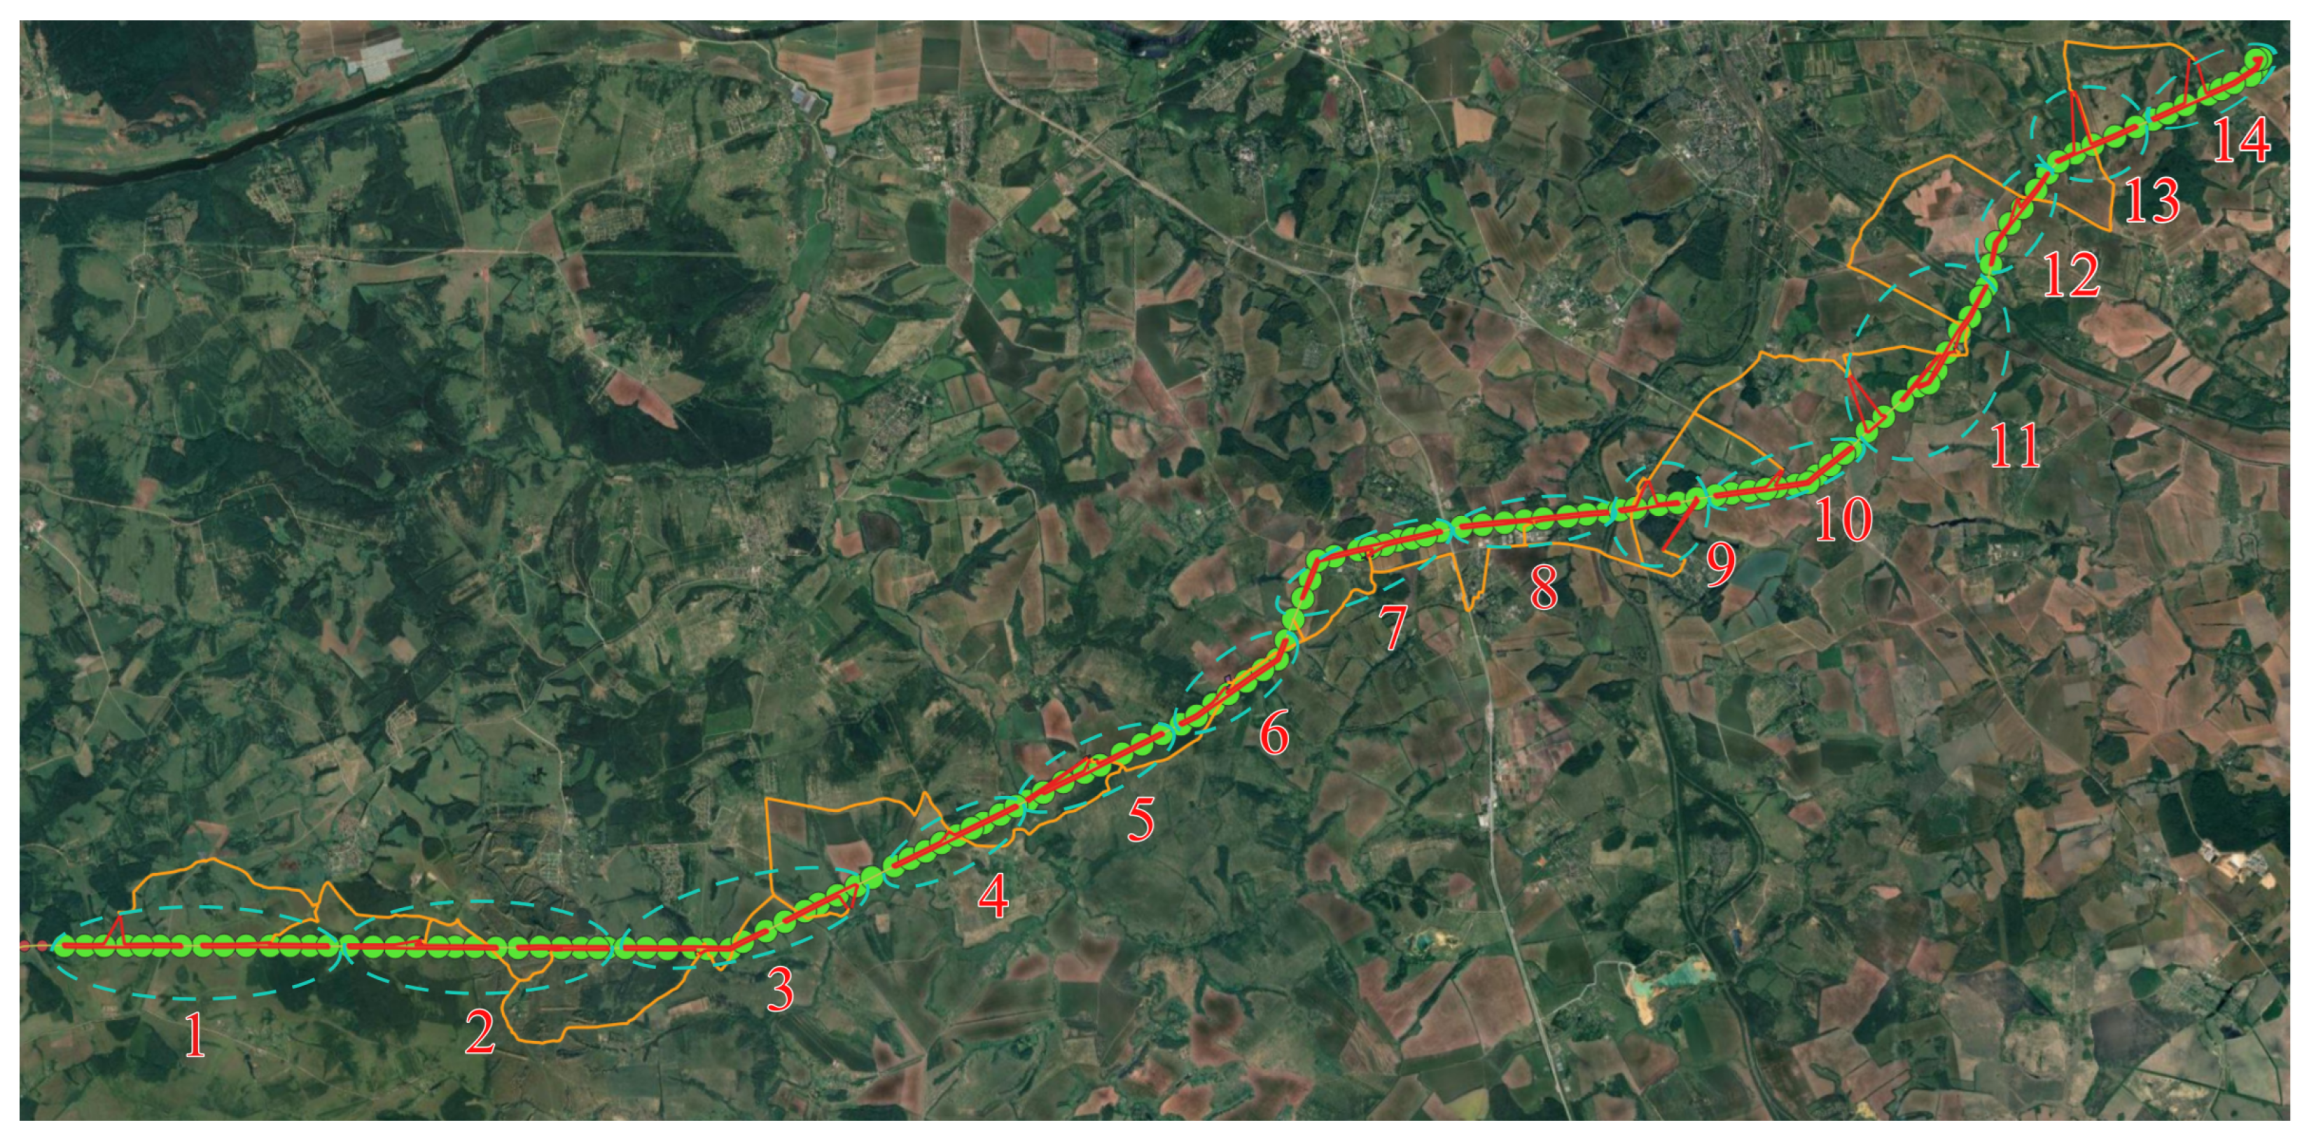
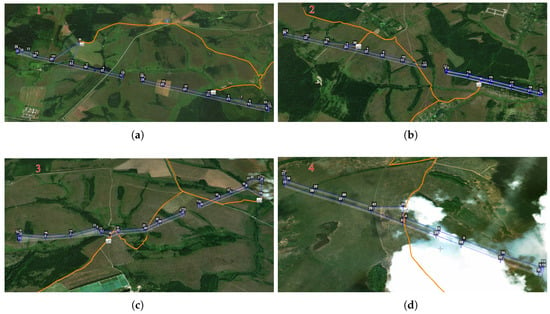
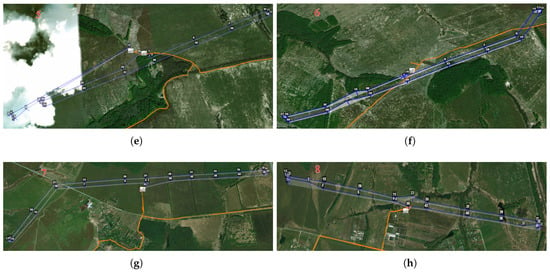
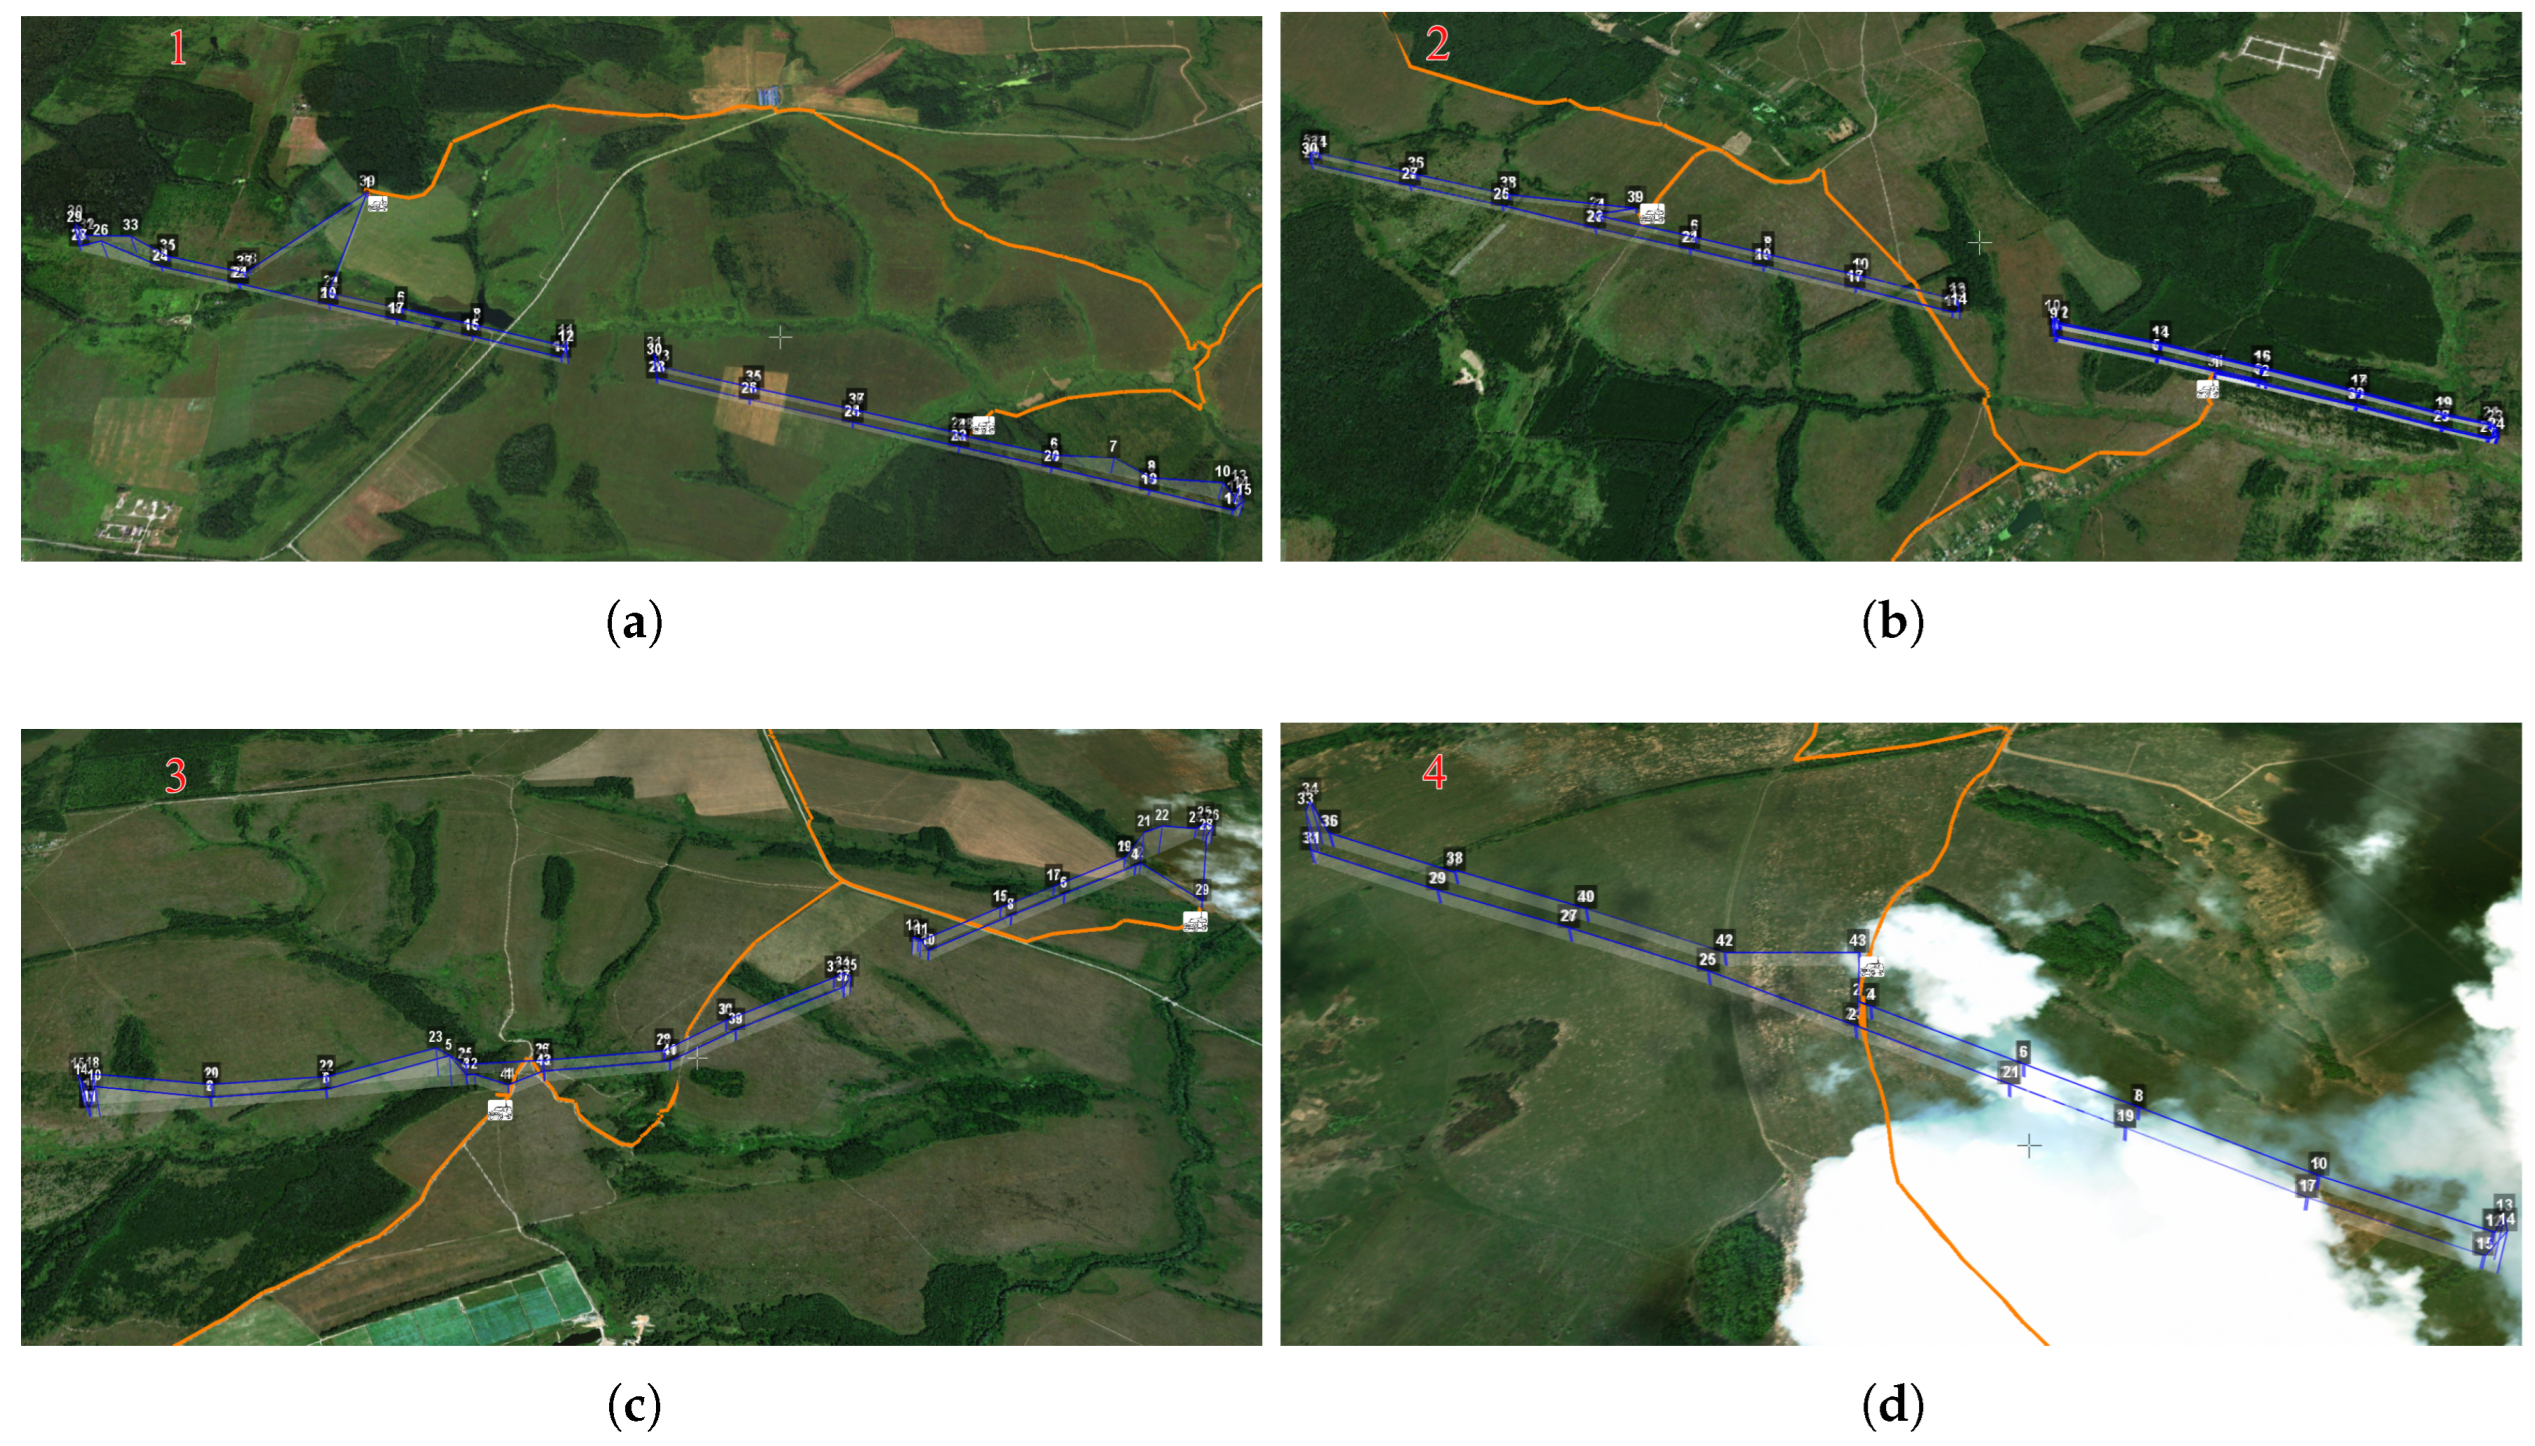
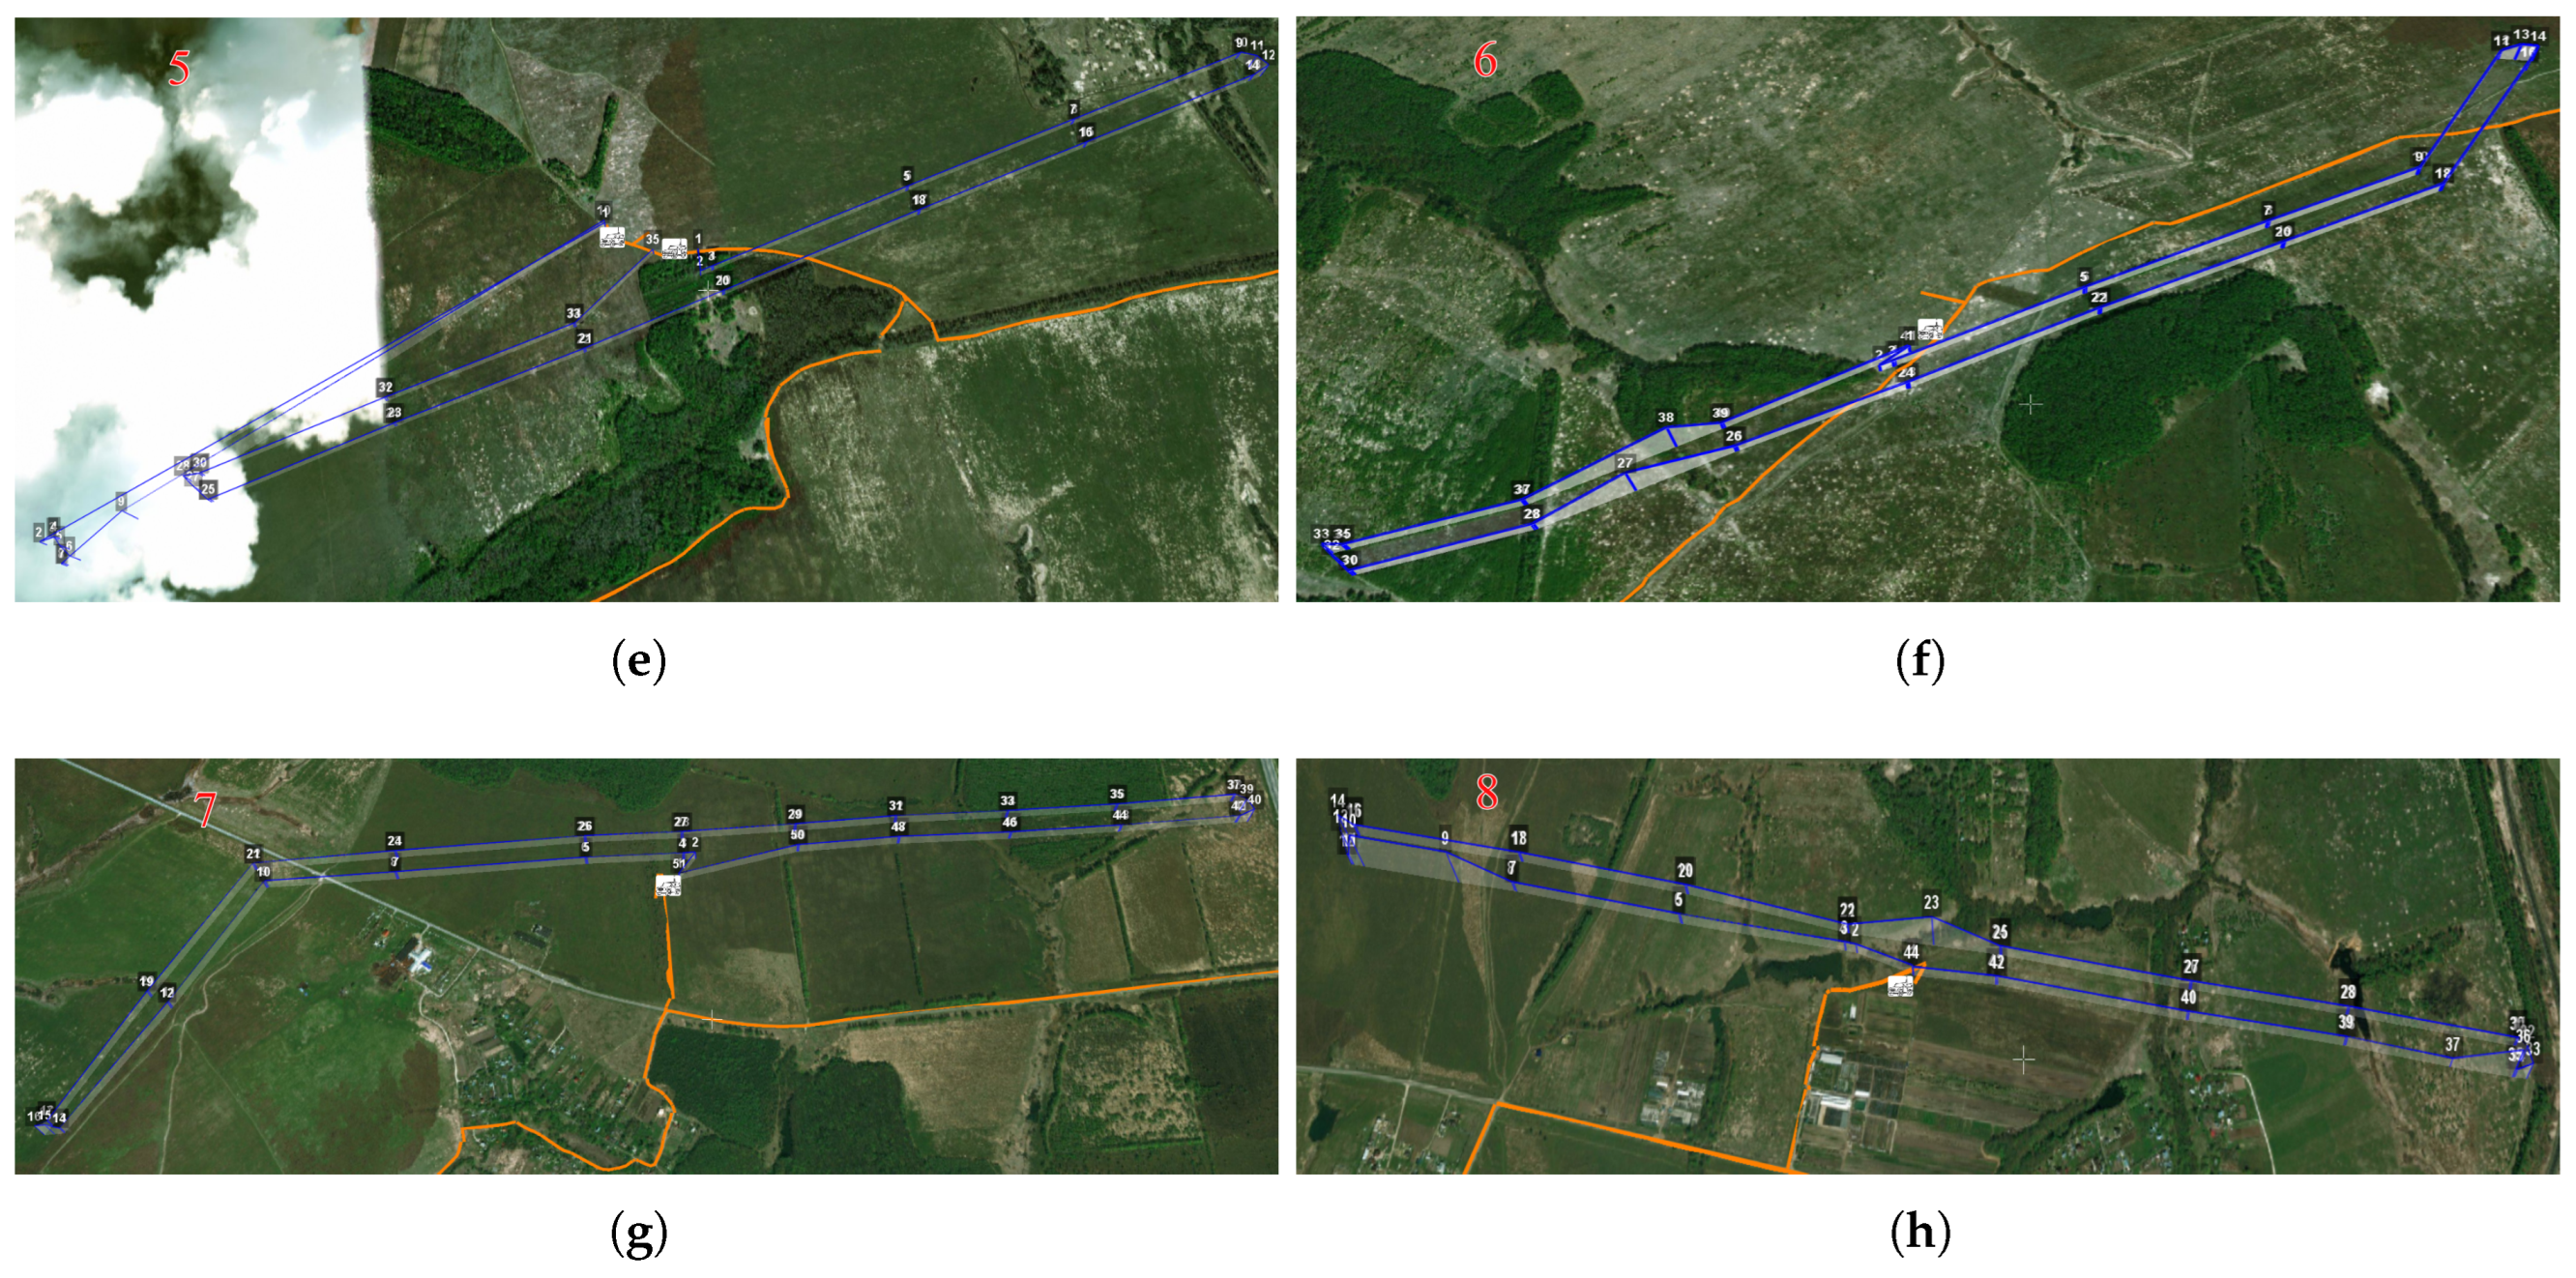
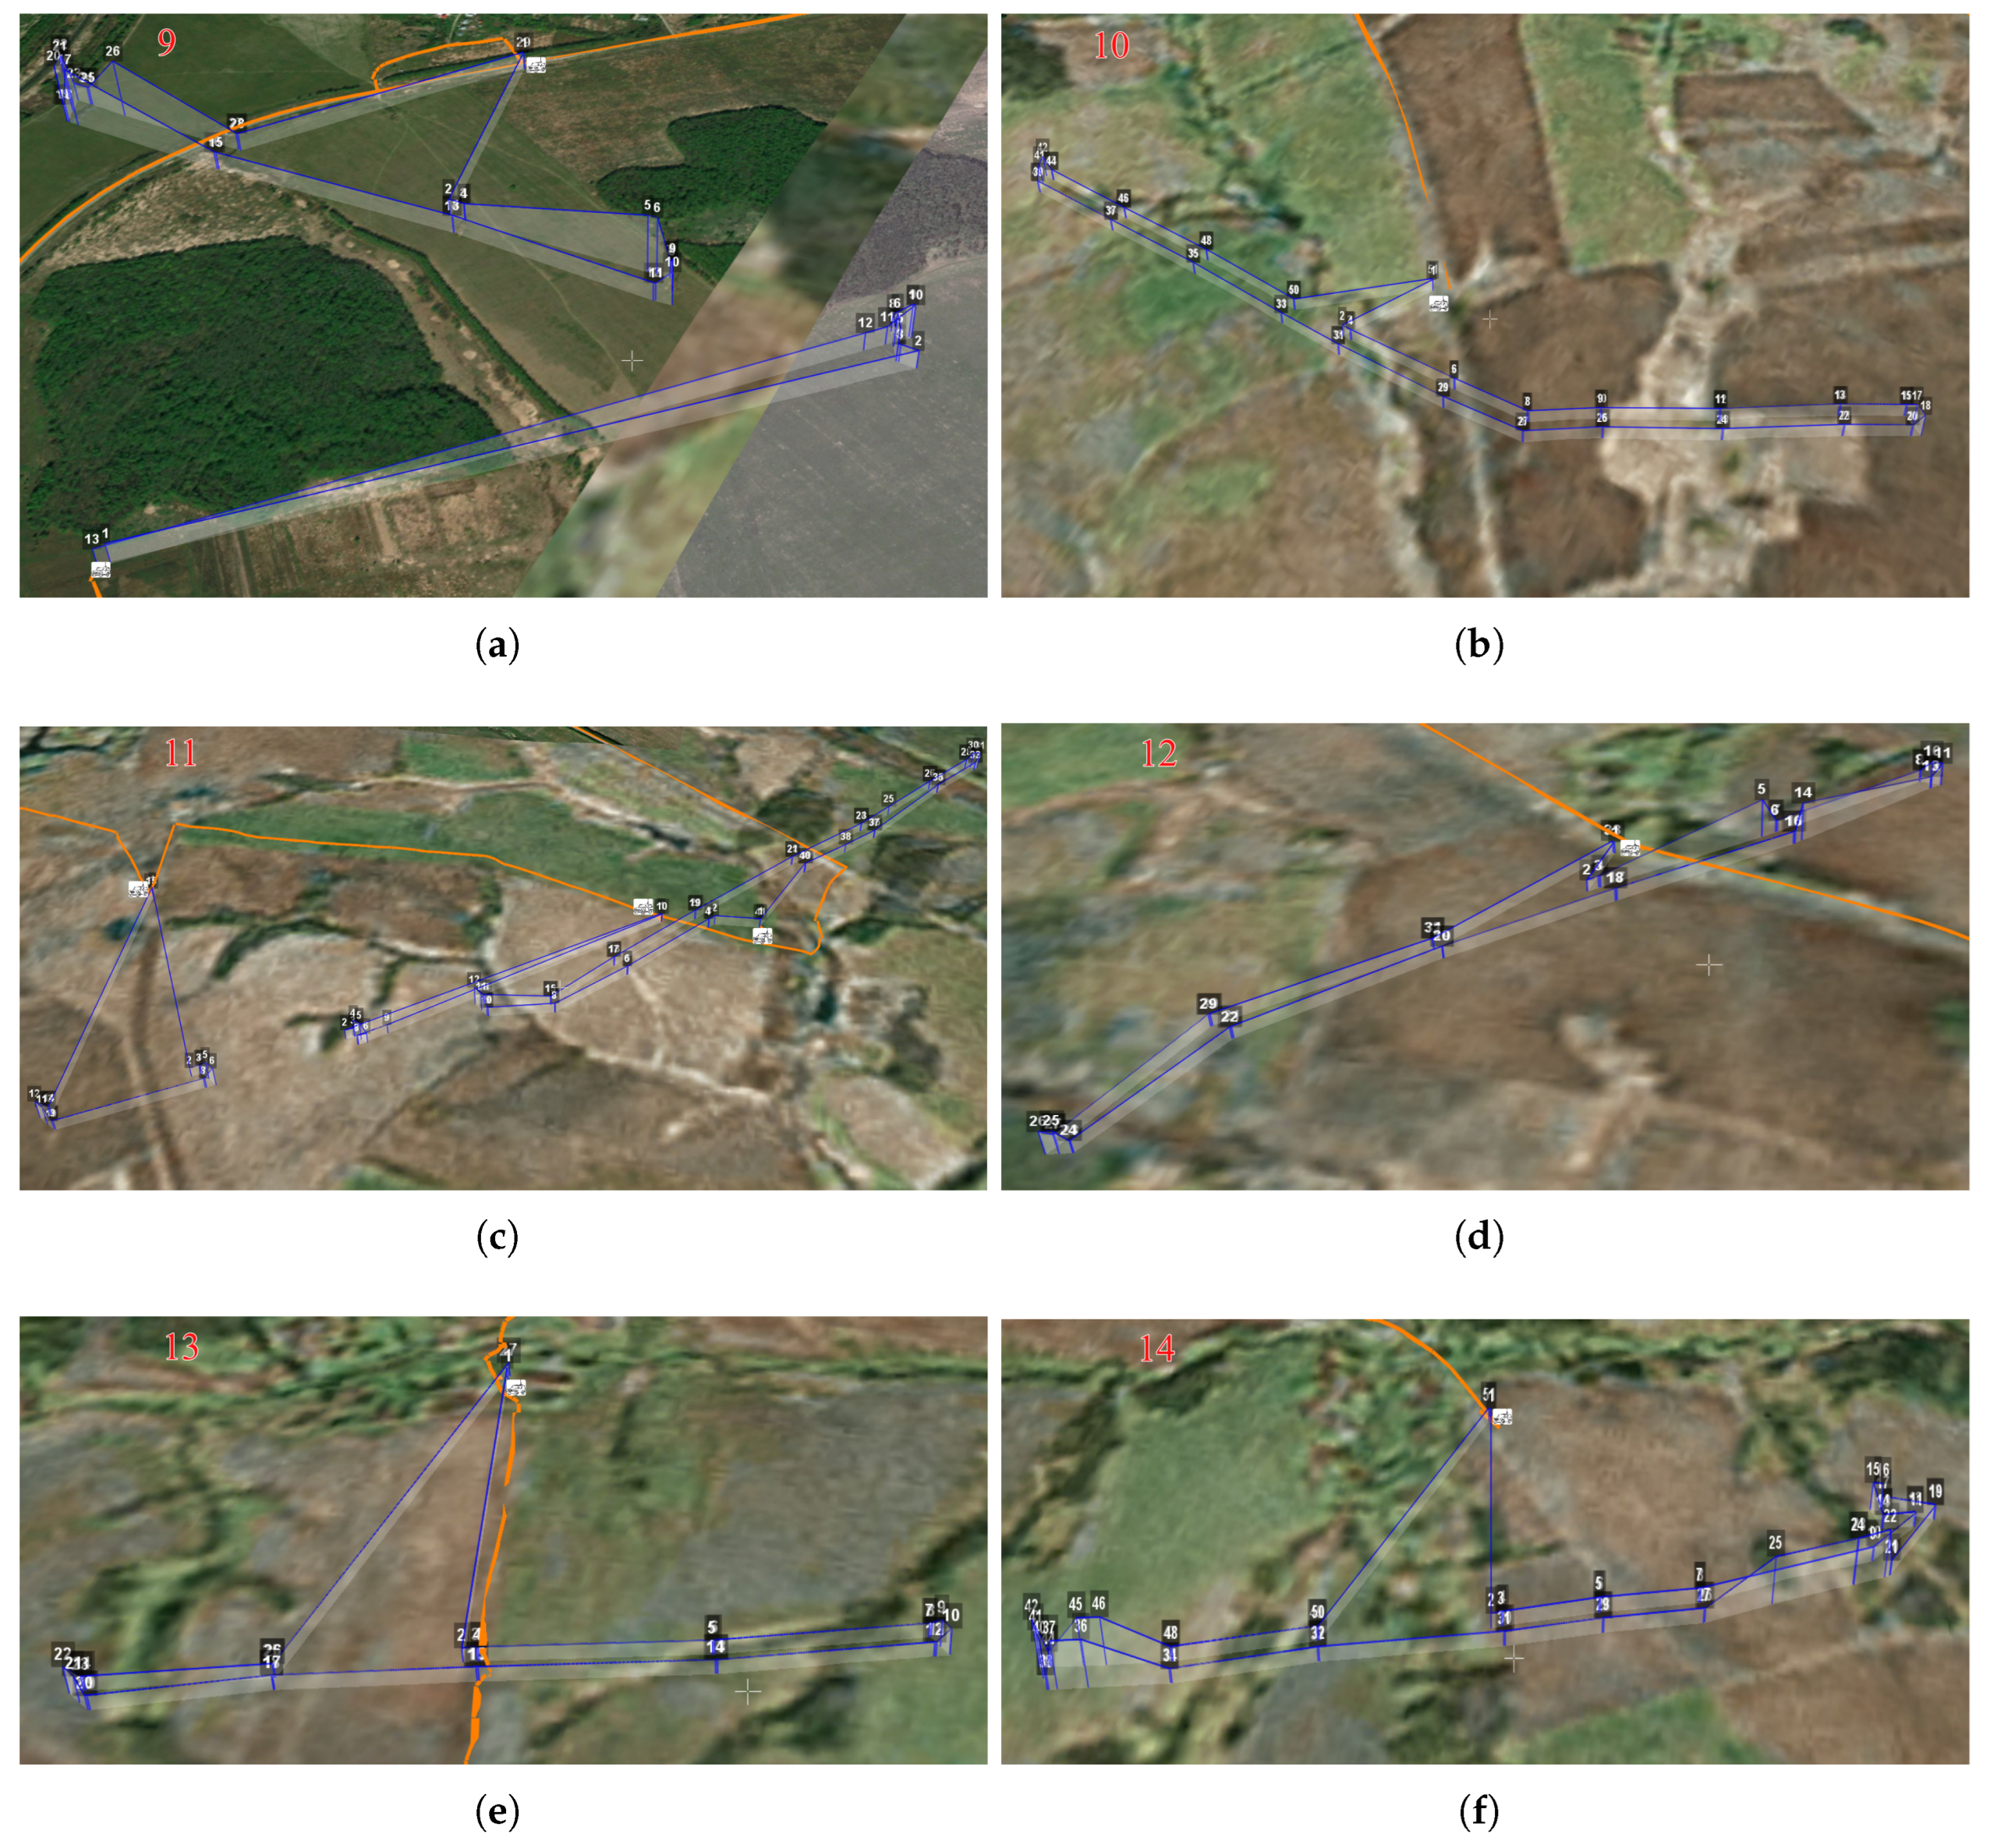


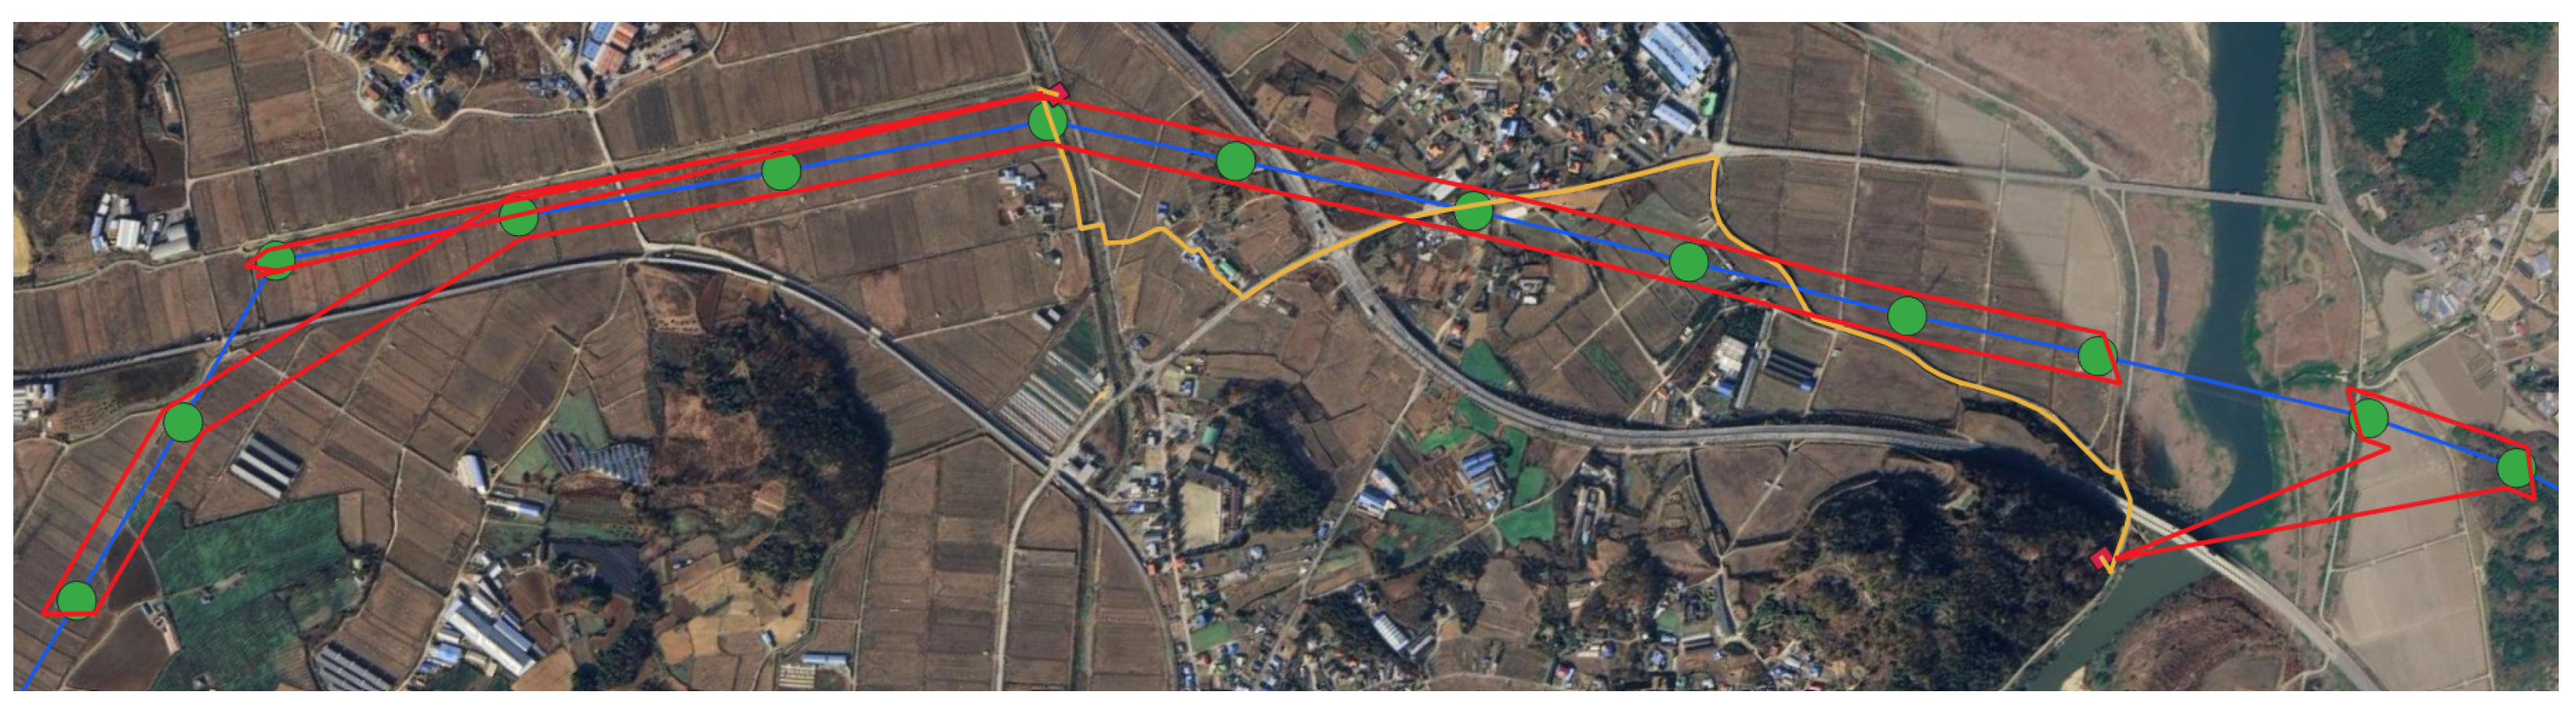
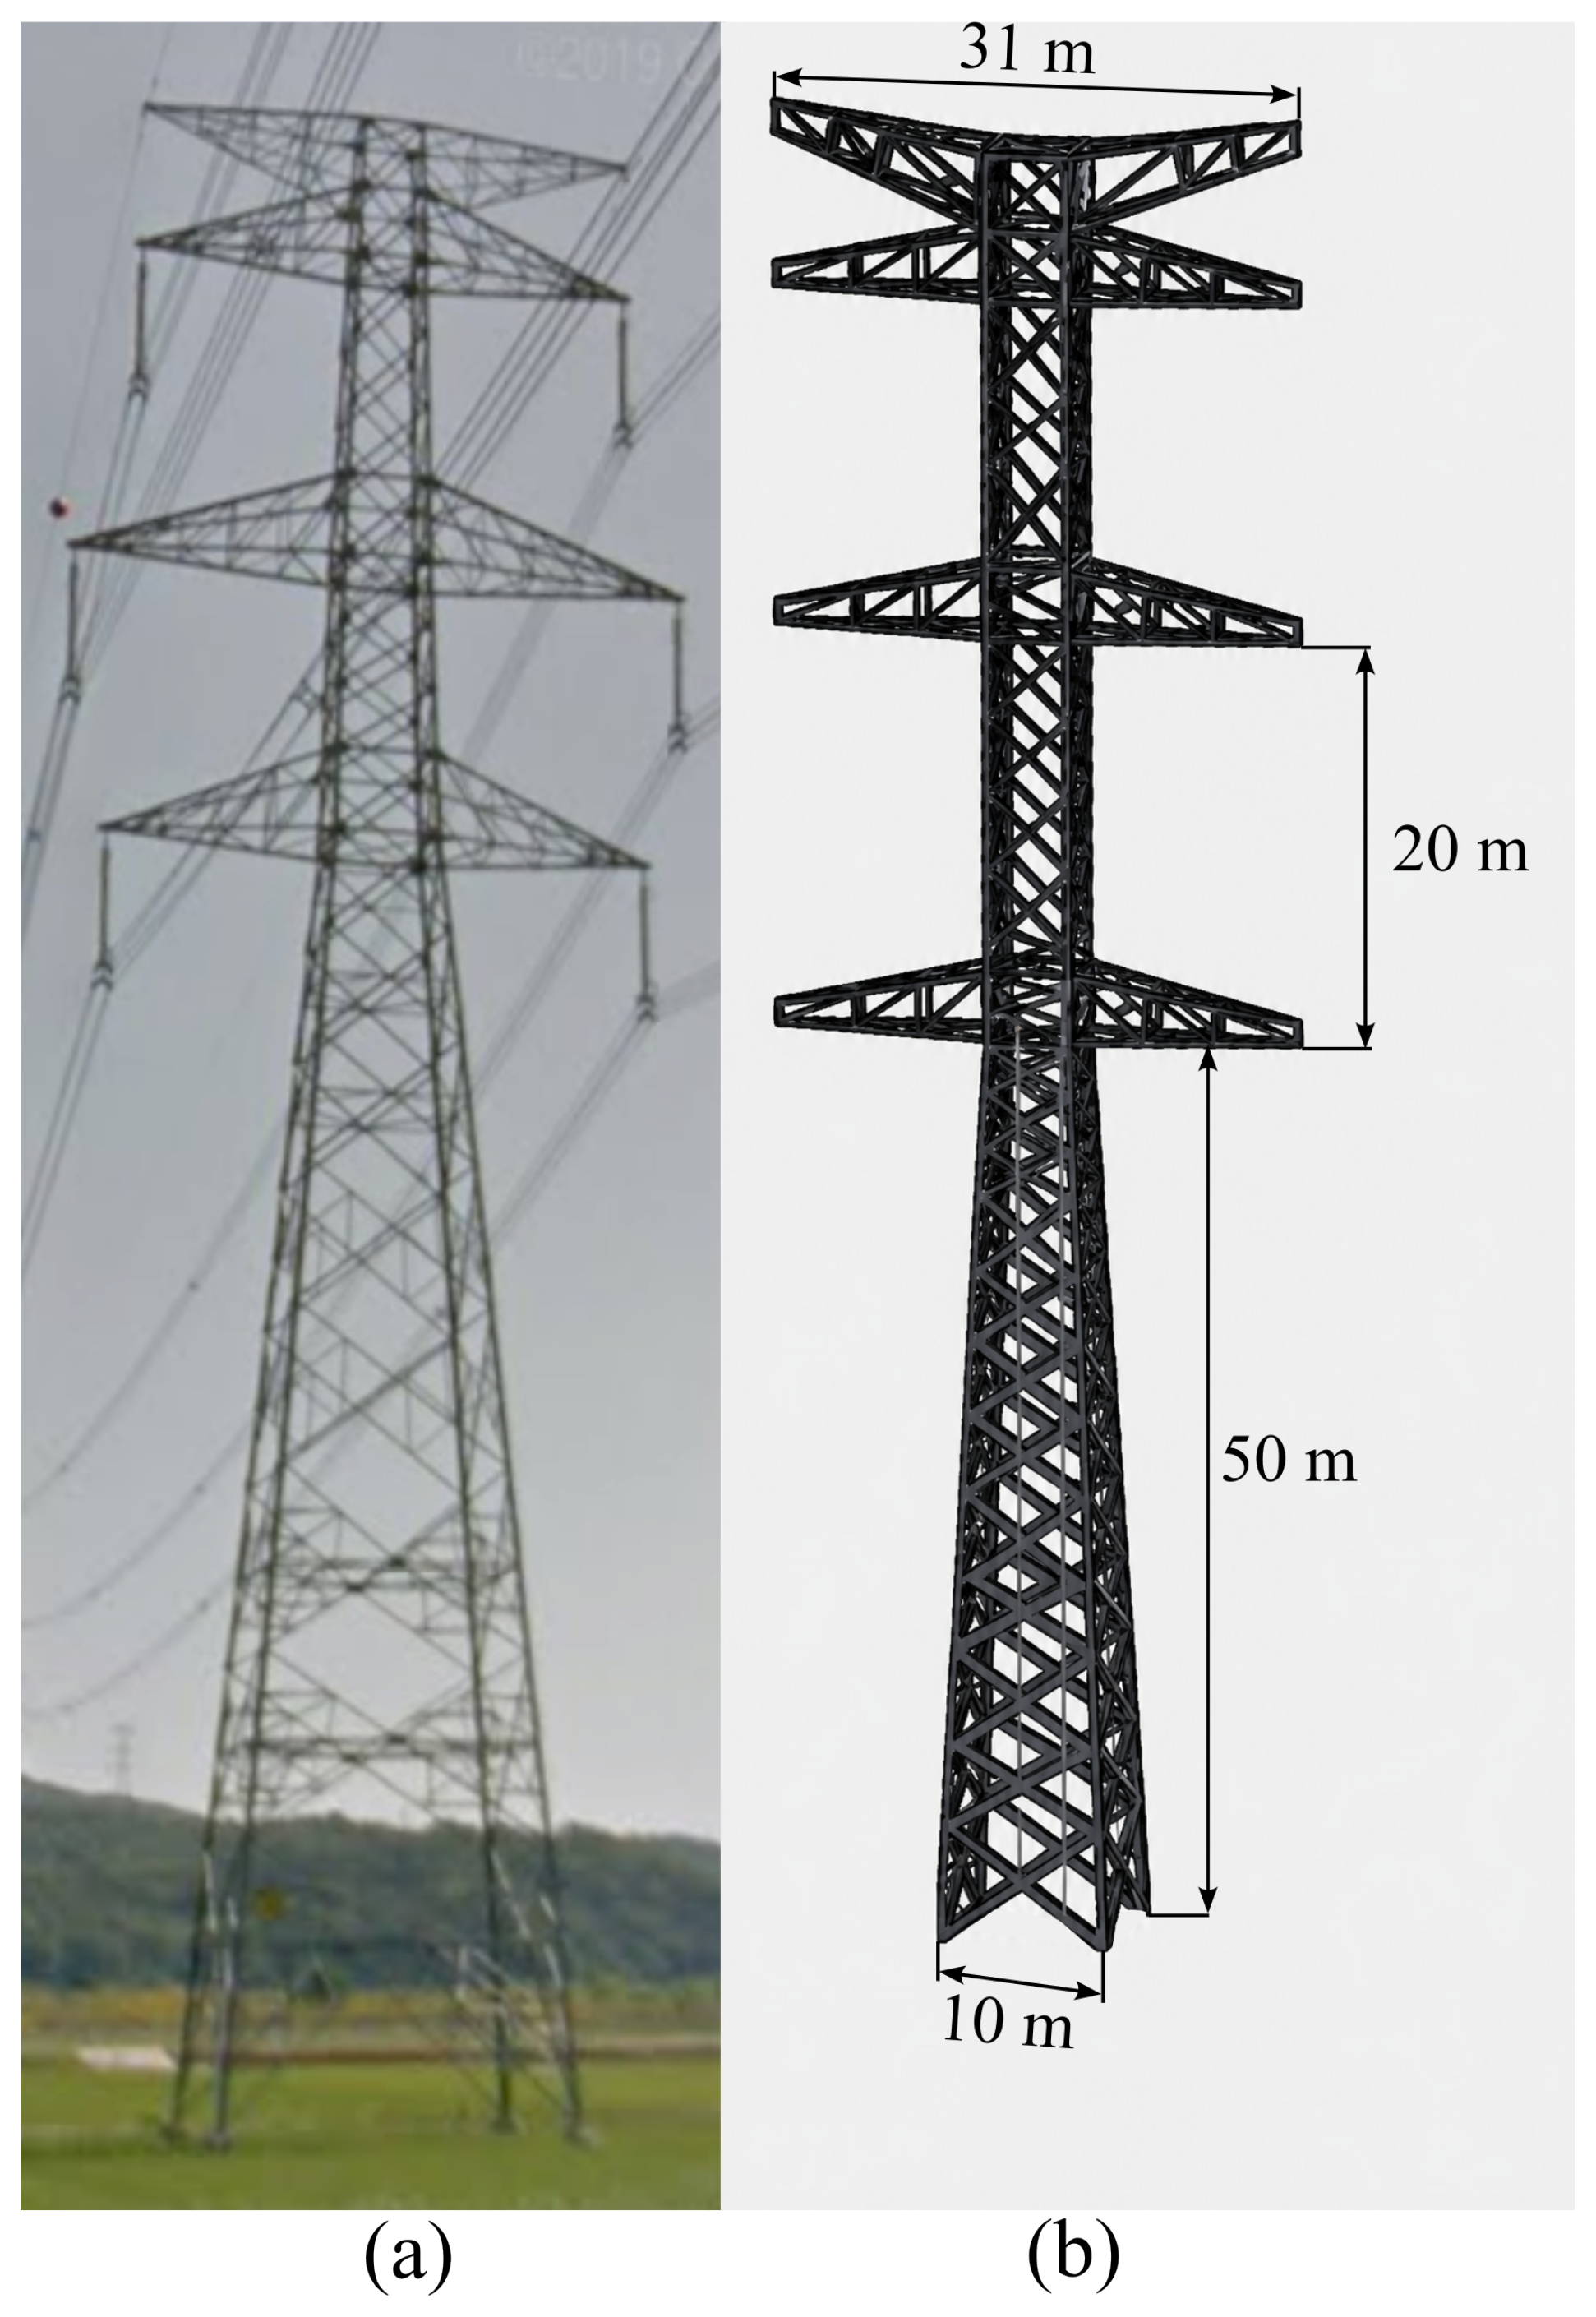
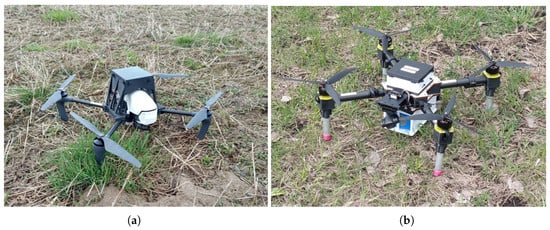
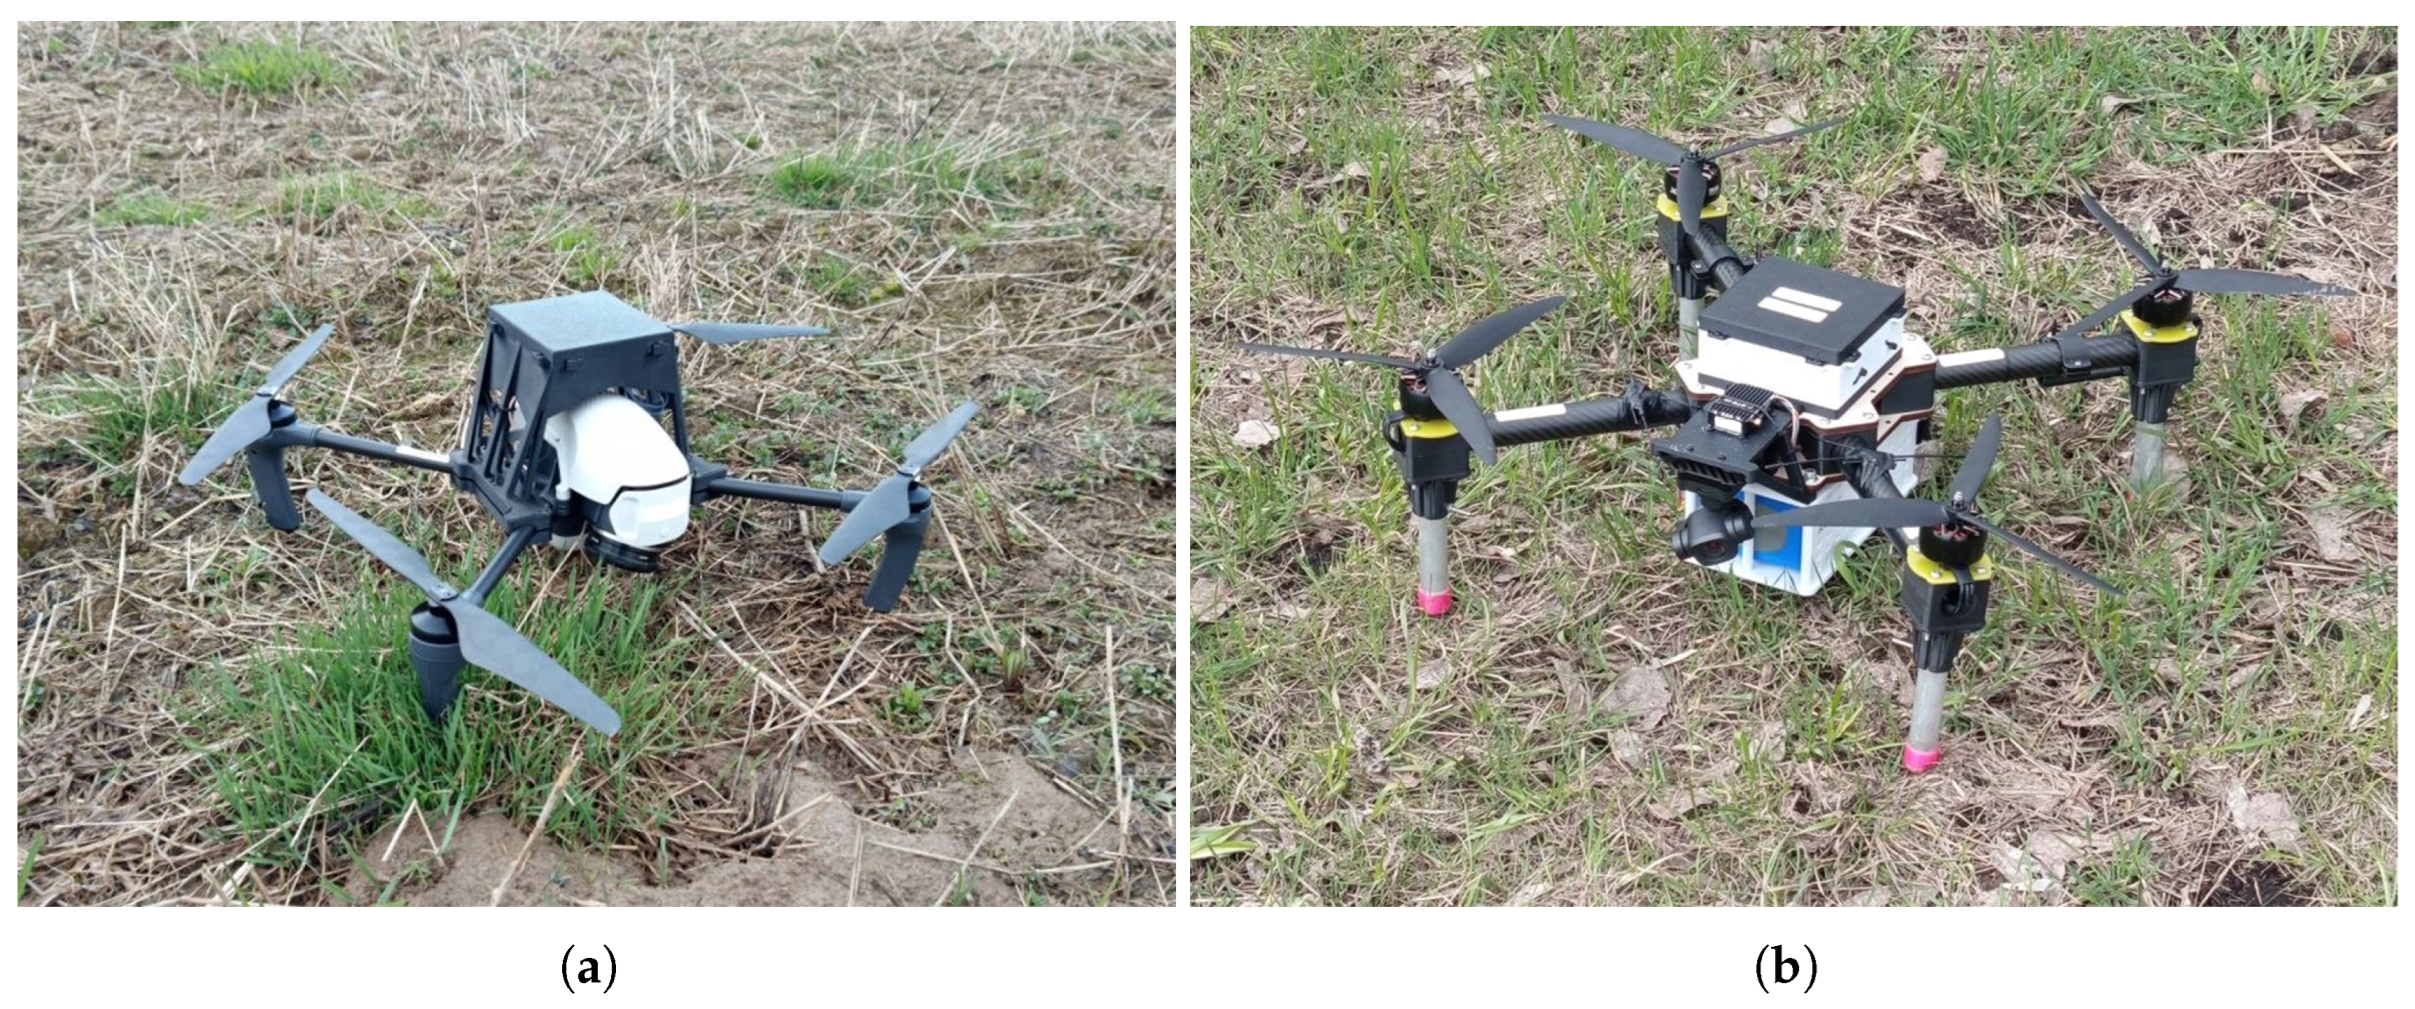
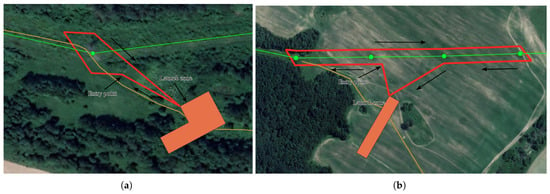
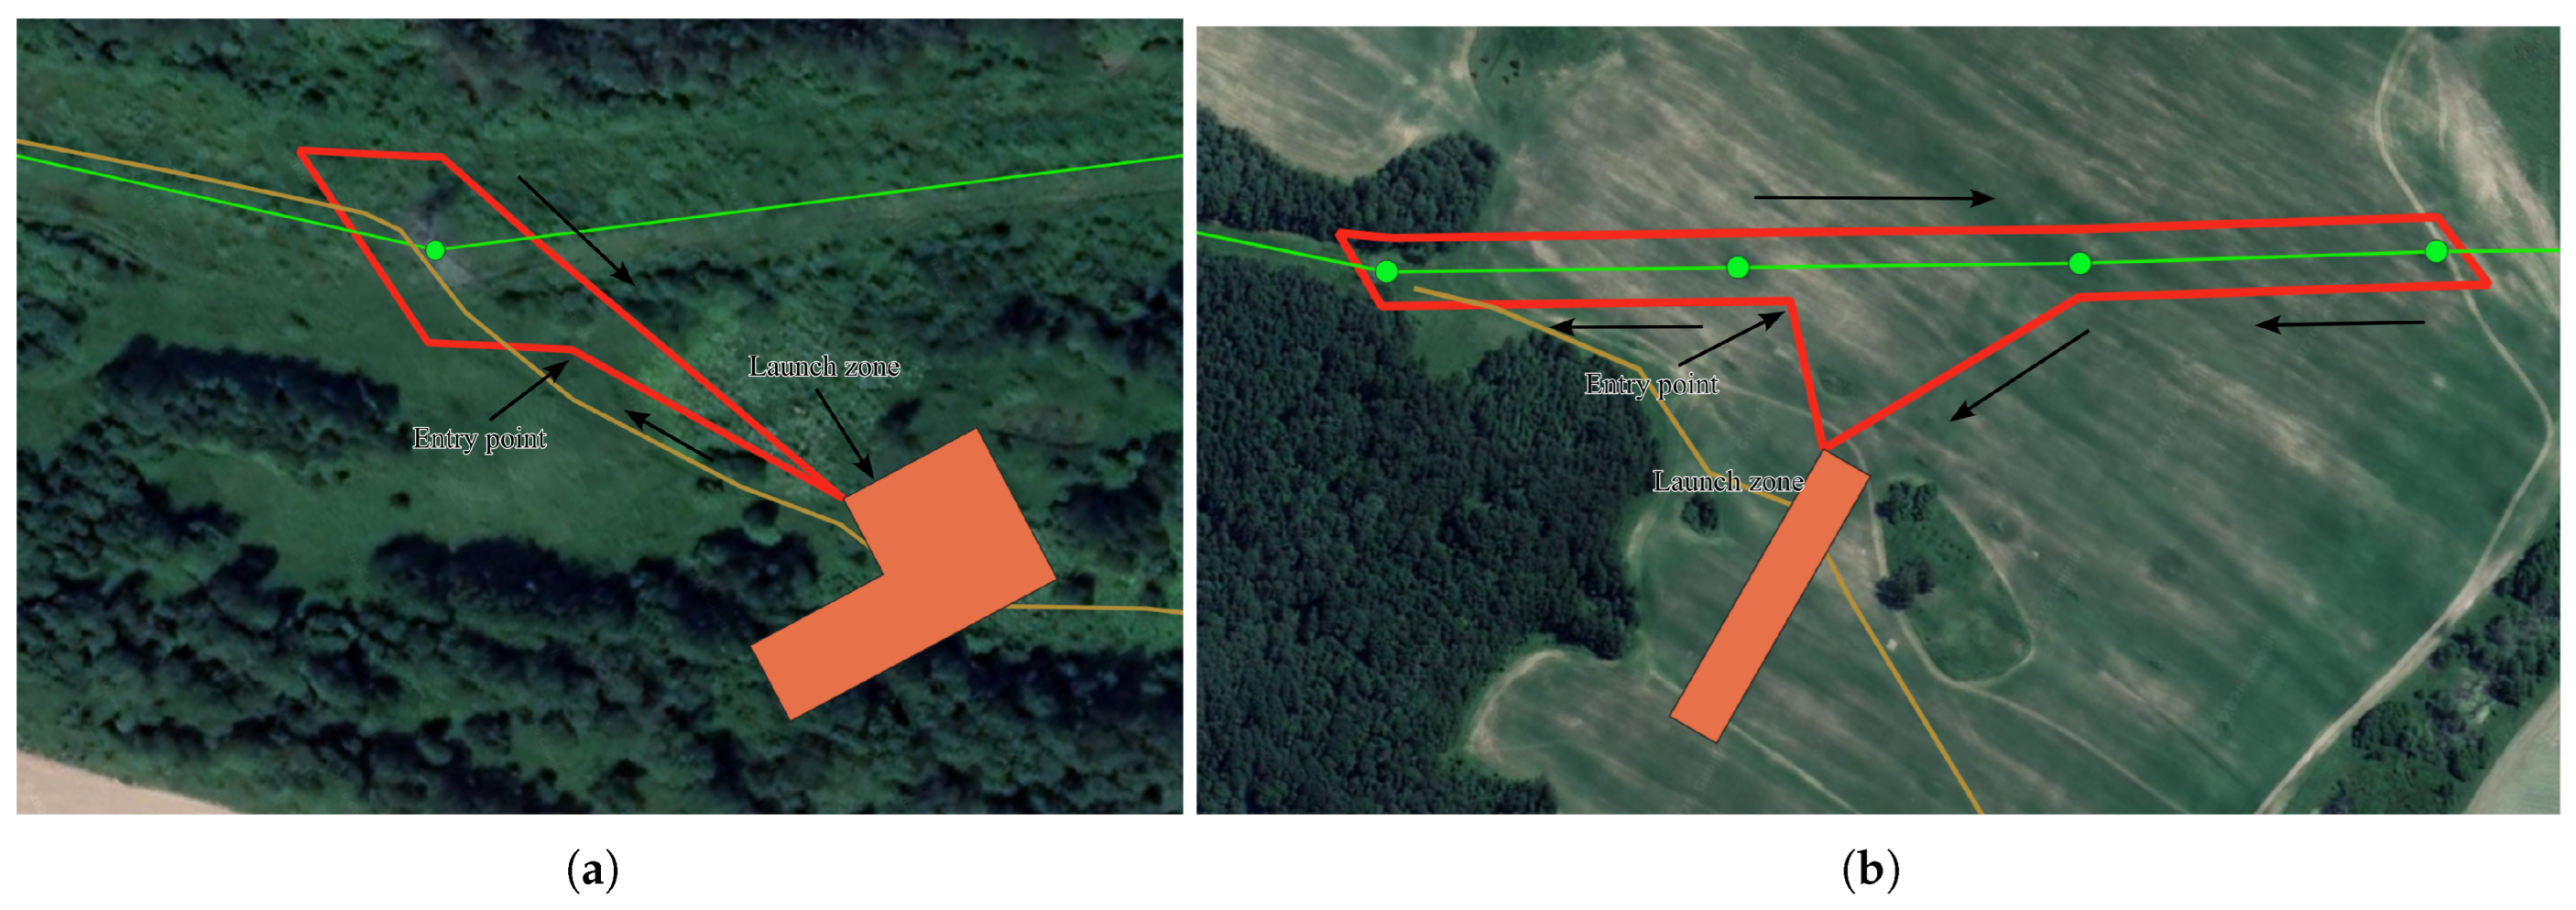
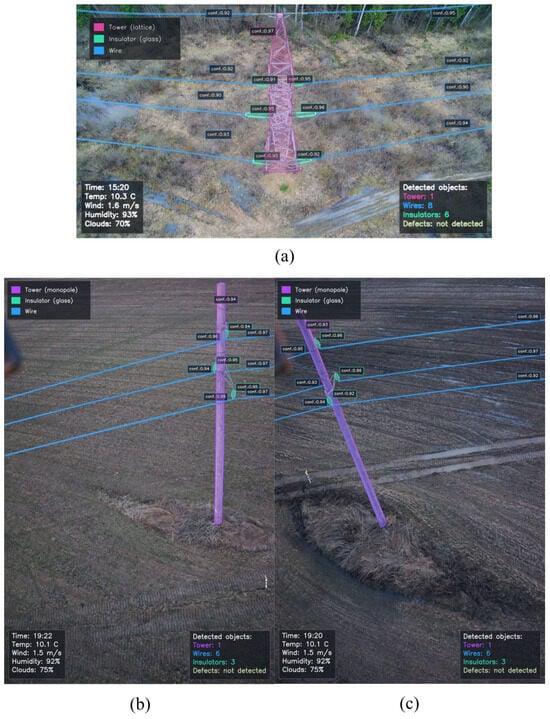
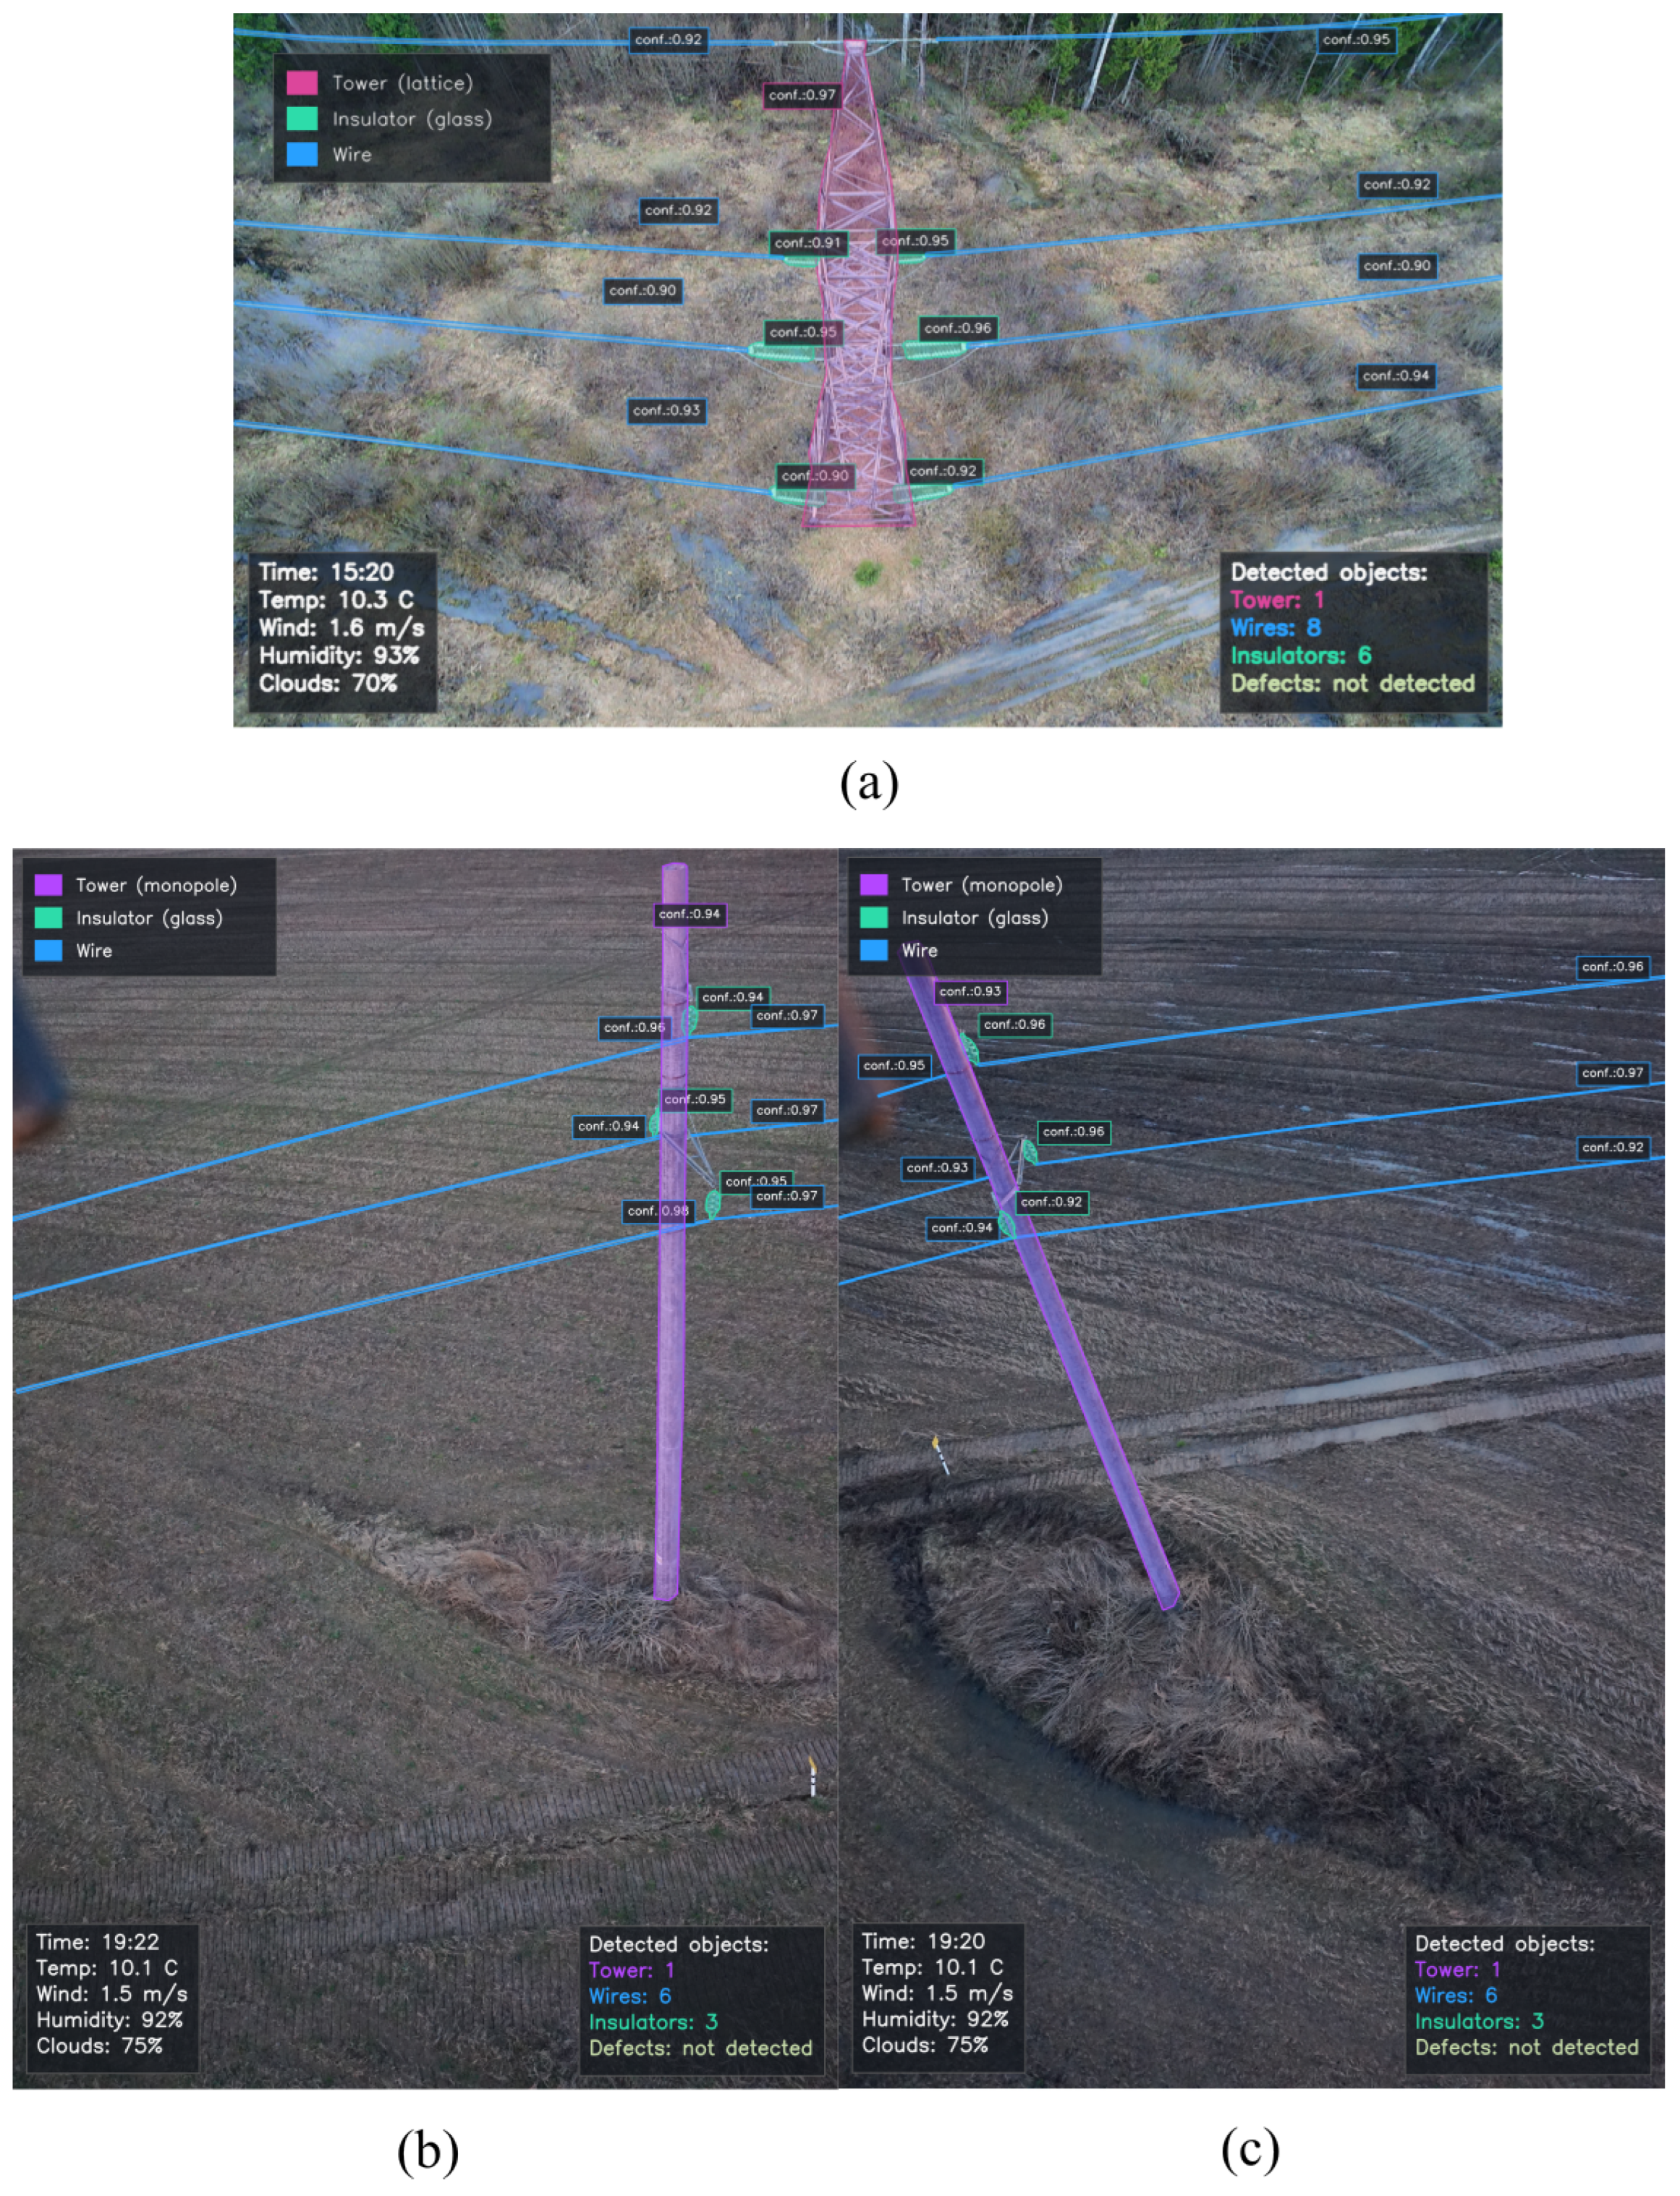
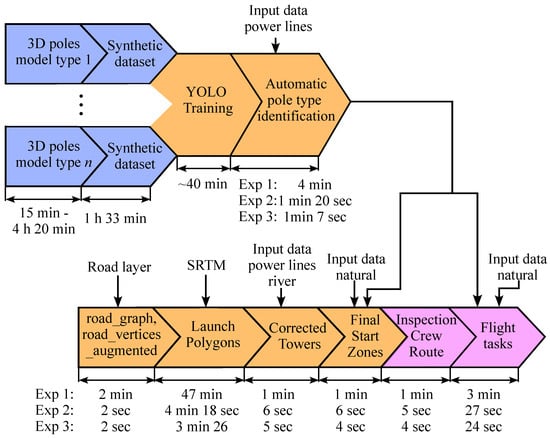
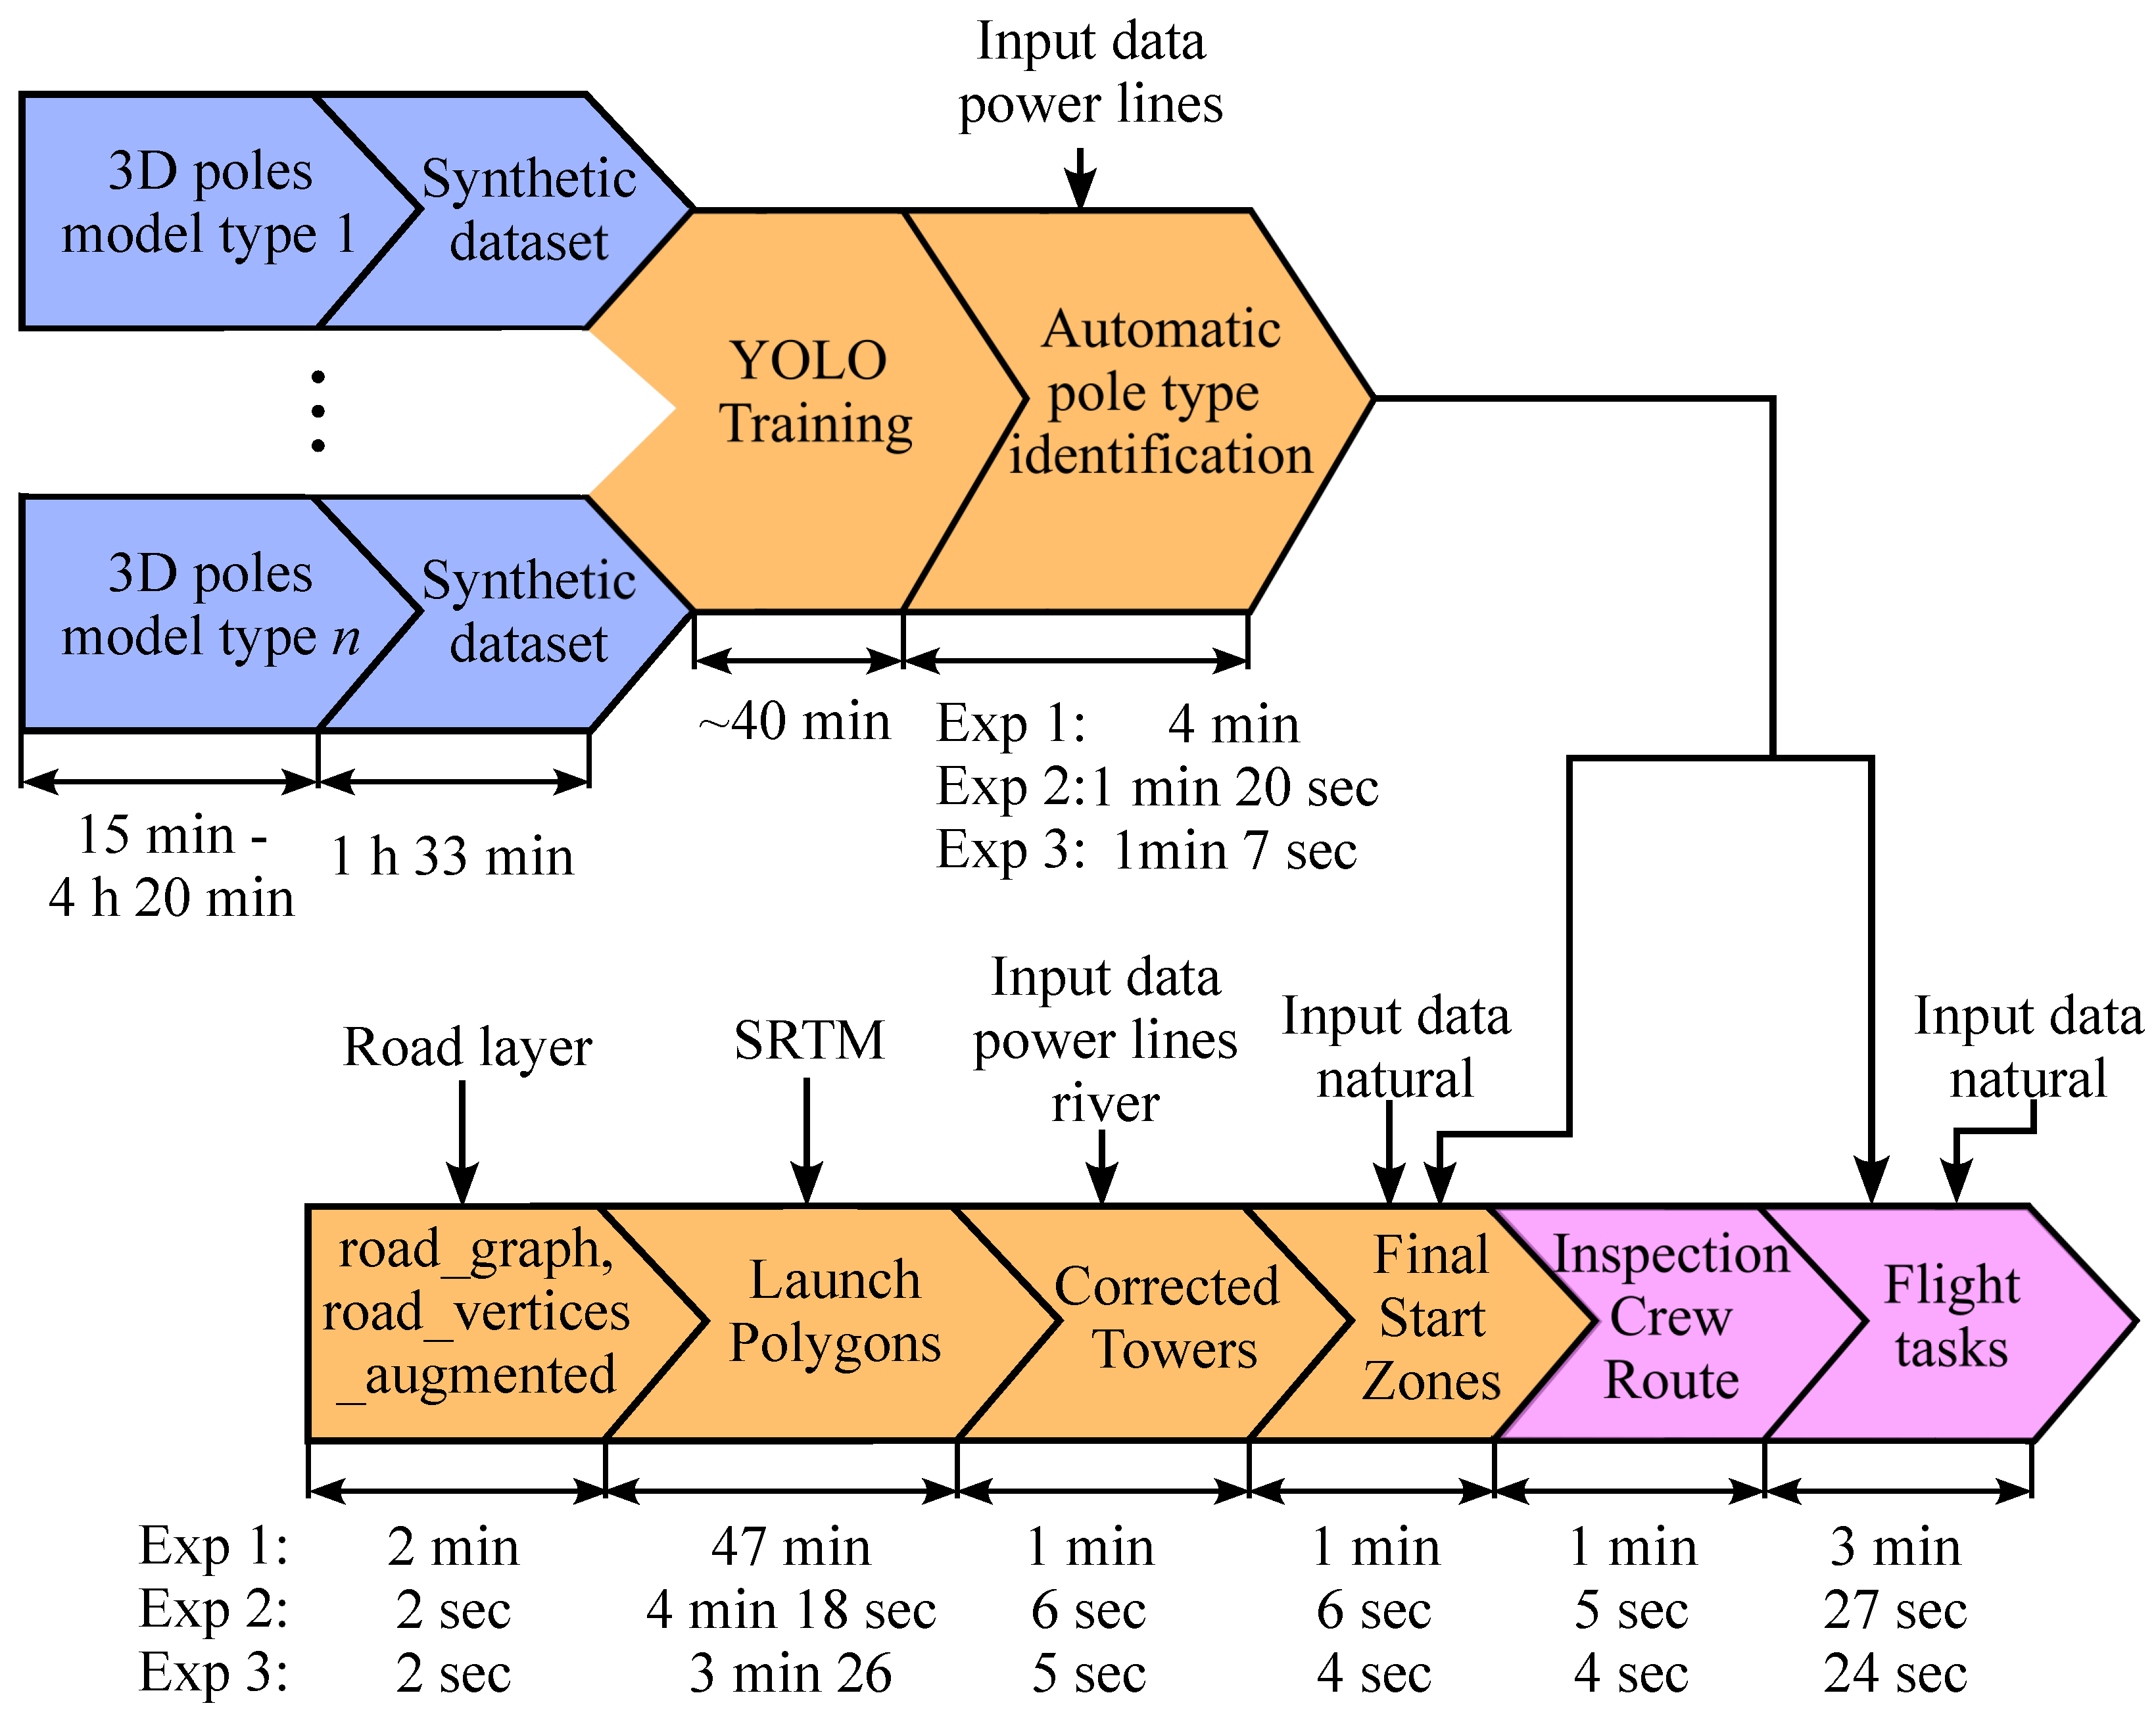

Disclaimer/Publisher’s Note: The statements, opinions and data contained in all publications are solely those of the individual author(s) and contributor(s) and not of MDPI and/or the editor(s). MDPI and/or the editor(s) disclaim responsibility for any injury to people or property resulting from any ideas, methods, instructions or products referred to in the content. |
© 2026 by the authors. Licensee MDPI, Basel, Switzerland. This article is an open access article distributed under the terms and conditions of the Creative Commons Attribution (CC BY) license.