


Highlights
What are the main findings?
- To achieve a low-cost solution, a two-layer drone structure was successfully developed, separating safety-critical stabilization on the Pixhawk PX4 from communication, sensor management, data logging, and energy management operations handled by the Raspberry Pi 4.
- Additional tests to evaluate the PX4-Gazebo suite, composed of 45 simulated runs and 3000 recorded sector-level measurements, were performed and demonstrated that the computed control solution regarding vertical and horizontal proximity logic, six-sector LiDAR processing, speed limitation, and data-staleness watchdog logic resulted in no simulated collisions or false sector recognition under the evaluated conditions.
What are the implications of the main findings?
- In summary, our combined prototype-based and simulation-based results demonstrated that low-cost sensors and edge computing offer the capability for a prototype-level semi-autonomous structural data collection system even in conditions with a lack of global positioning data, limited communications, and battery power limitations.
- At present, results have only been obtained at prototype level and from simulation testing at the simulated-sub-system stage, but it is intended that the behavior in avoiding collisions and the acoustic performance of the ultrasonic sensors should be rigorously validated in the laboratory using computer-controlled hardware testing or hardware-in-the-loop testing.
Abstract
While there are evident advantages to deploying UAVs for structural inspection applications within reinforced-concrete structures where human access may be hazardous or restricted, UAV deployment is still inhibited within structures due to a lack of GPS, payload and power limitations, signal attenuation, limited transmission opportunities, and low bandwidth for communication. Within the confines of the present project, a low-cost two-layer six-rotor architecture was developed; a single Pixhawk PX4 manages stabilized flight, while a Raspberry Pi 4 manages mission-level operations. The complete prototype integrated a relative-pose/nearby-object estimator, hybrid 433 MHz and Wi-Fi/MQTT communications, avionics-side energy management, mission continuity via SQLite, and human-in-the-loop fail-safe support. Prototype experiments revealed reduced horizontal drift compared to both tested comparison configurations, continued operation under constrained communication conditions, and a 62.0% reduction in avionics-side power consumption, excluding propulsion. This was followed by a complementary PX4–Gazebo evaluation probing horizontal and vertical proximity responses, six-sector LiDAR processing, and stale-data watchdog functionality. Across 45 repeated simulation runs and 3000 retained sector-level observations, no simulated collisions occurred during the horizontal-approach, vertical-proximity, or watchdog tests. No false sector assignments were observed, and the overall mean absolute error was 0.0285 m. From this limited demonstration, the architecture appears satisfactory at the prototype and simulated-subsystem levels. Further physical testing will be needed prior to operational deployment.
1. Introduction
Structural health monitoring (SHM) and post-disaster structural analysis increasingly use unmanned aerial vehicle (UAV)-based technologies to inspect areas that are difficult, hazardous, or operationally inefficient for humans to access [1,2]. In reinforced-concrete structures affected by seismic events or long-term deterioration, semi- or fully autonomous data acquisition may enable safer inspection practices and more detailed documentation of structural conditions. Sensors including optical, thermal, multispectral, and laser-scanning systems have been studied as potential solutions for façade assessment and damage-related data collection [3,4]. UAV-based data have also been used for three-dimensional reconstruction and automated image-to-BIM registration [5,6]. Edge-computing approaches have enabled adaptive crack inspection and infrastructure defect analysis closer to the data source [7,8]. Lightweight convolutional models have also been developed for real-time building-surface defect detection [9]. A BIM-enabled method has been proposed for generating collision-aware inspection paths based on structural information [10]. Additionally, autonomous indoor inspection and vision-based façade following within built environments have been explored [11,12]. Structure-prior-aided visual-inertial navigation has also been proposed to improve localization accuracy during building inspection [13]. High-rise façade modeling using UAVs and UAV-based crack detection and quantification in concrete structures have likewise been investigated [14,15]. Low-collision UAV-based automated structural surface inspection has also been studied [16]. Scientometric analyses further show that drone-based SHM research increasingly incorporates sensors, imaging, artificial intelligence, and machine learning [17]. Similar technical concerns and the need for further practical development have been documented in reviews of UAV- and mobile-robot-based damage inspection for reinforced-concrete structures [18].
1.1. Background and Motivation
Significant progress has been made in UAV-based structural inspection through the use of optical, thermal, multispectral, LiDAR, and other sensing modalities for automated structural data acquisition [3,4]. UAV-derived image and point-cloud data have also supported three-dimensional reconstruction and automated image-to-BIM integration [5,6]. Edge-computing approaches have further extended UAV inspection systems by moving selected processing tasks closer to the data source [7,8]. Lightweight convolutional models have also enabled real-time building-surface defect detection on resource-constrained platforms [9]. However, these approaches may still require stable communication links, sufficient computing resources, or suitable operating conditions that may not be consistently available in reinforced-concrete indoor and post-disaster environments.
This study develops a semi-autonomous UAV prototype capable of operating in GPS-denied environments while improving energy utilization and maintaining data integrity. To reduce the possibility that computationally intensive mission workloads interfere with flight stabilization, the proposed system separates flight-control and mission-processing functions into two physically and logically distinct layers. The Pixhawk PX4 flight controller manages safety-critical stabilization, while the Raspberry Pi mission computer handles sensor processing, communication management, local storage, and mission-level decision-making. The design is also motivated by the mission-continuity requirement, as a structural inspection may exceed the endurance of a single battery cycle and require database-level continuity across fragmented flight sessions.
1.2. Problem Statement
A primary limitation of deploying unmanned aerial vehicles in indoor and structurally confined environments is the loss or unreliability of Global Positioning System (GPS) signals. Alternative approaches to GPS-dependent navigation have been researched for GPS-denied conditions, including heterogeneous robotic exploration and Simultaneous Localization and Mapping (SLAM) [19,20]. Stereo visual-inertial localization and vision-based indoor inspection have both been researched for bridge inspection and industrial applications where GPS data are either unavailable or unreliable [21,22]. Another method for supporting the continued operation of a UAV under GPS-denied conditions is the use of an integrated framework that provides the required control, localization, and mapping functions [23]. Although optical-flow sensors offer a lightweight method for measuring relative motion, their accuracy may vary depending on vehicle tilt and the orientation of the observed surface [24]. The fusion of LiDAR and optical-flow measurements has therefore been proposed to improve odometry performance in structured GPS-denied environments [25]. For inspection missions requiring transitions between open and GNSS-challenging areas, LiDAR/IMU/RTK fusion and GNSS/INS/LiDAR integration methods have been studied [26,27]. Although these studies have improved UAV localization, performance may still be limited by sensor constraints, accumulated estimation errors, environmental geometry, and available onboard processing capacity.
Two other significant challenges facing UAV-based edge computing are limited onboard energy and communication resources. Joint edge-computing and data-compression methods have been developed to reduce the energy and communication costs associated with data transmission in UAV-assisted networks [28]. Multi-UAV MEC studies have also investigated joint communication and computation optimization [29]. Other transmission strategies include projection-based compressive data gathering and semantic communication, which can reduce the amount of information transmitted through bandwidth-constrained wireless channels [30,31]. Energy-efficient resource allocation and opportunistic networking have also been investigated to reduce energy consumption in UAV-enabled communication systems [32,33]. Reliability-aware approaches can jointly optimize resource allocation, data-transmission scheduling, and UAV motion [34]. Deep-reinforcement-learning-based methods have also been proposed for resource allocation in multi-UAV MEC networks [35]. However, most of these methods have been evaluated in networked mobile edge-computing environments whose infrastructure and computational assumptions differ from those of the low-cost indoor inspection prototype considered in this study.
1.3. Scope and Contributions
In this research, we describe the design and prototype-level testing of a hexacopter unmanned aerial vehicle system intended for structural inspection in reinforced-concrete environments. The proposed UAV platform integrates edge-computing capabilities, sensor fusion, hybrid communication, energy-aware mission-management techniques, mission continuity, and fail-safe mechanisms. The primary research contributions and experimental findings of this study are as follows:
- Evidence at the system level of the viability of separating safety-critical flight stabilization from the mission-level components of sensing, communicating, managing data, and energy is provided by this research, thereby paving the way for integration of such components into a low-cost UAV platform without considering the mission computer as the safety-critical flight-stabilization component.
- The prototype analysis quantifies the navigation performance of the tested multisensor setup in a GPS-denied indoor environment. Compared to the IMU + optical flow setup, the proposed setup decreased the horizontal RMSE by about 62.4%, vertical RMSE by 58.3%, and horizontal drift rate by 77.8% in the tested conditions, although the findings are limited to relative positioning and not autonomous absolute positioning.
- Both the communications assessment and energy evaluation identify specific limitations in the use of architectural resources. CRC32 checking with selective-repeat ARQ decreased the effective loss rate of the 433 MHz channel from around 5% to 0.5 ± 0.1%, while the Energy-Aware Mission Manager lowered the propulsion-off power use from around 15.0 W to 5.7 W. The latter translates into a 62.0% decrease in avionics-side energy usage that cannot be considered as an equivalent increase in overall endurance time.
- The paper presents a technique for database-level mission continuity through the use of Mission_ID, Drone_ID, timestamp, and mission state information. The shown technique maintains logical mission continuity and chronological data continuity for separate operator-controlled flights, rather than for autonomous in-flight task transfer or precise three-dimensional positioning of UAVs.
- Complementary PX4-Gazebo testing provides repeatable subsystem-level evidence for the implemented horizontal and vertical proximity logic, six-sector LiDAR data processing, velocity restrictions, and data staleness watchdogs. During the 45 simulations carried out and 3000 sector-level observations, no simulated collisions occurred, there were no false six-sector LiDAR data assignments, and the mean absolute error of the six sectors was 0.0285 m.
1.4. Organization of the Paper
The rest of this paper is organized as follows: In Section 2, the related literature on UAV-based structural inspection, GPS-denied navigation, edge computing, communication, and energy management is introduced. In Section 3, the architecture and hardware, sensing, processing, communication, and data-flow design of our proposed UAV are described. In Section 4, the procedures of the navigation, communication, energy management, mission continuity, fail-safe, and supplemental PX4-Gazebo simulation mechanisms are presented. In Section 5, the integrated navigation, communication, energy, and mission-continuity prototype results and the aforementioned simulation-based subsystem outcomes are separately presented and demonstrated. Section 6 explains and discusses the outcomes of the experimental works and lists some engineering design trade-offs and constraints identified when applying the supplemental simulation-based evaluation methods. Conclusions and future works are detailed in Section 7, and related patent information is available in Section 8.
2. Related Work
UAVs were initially used mainly as tools for visual inspection in structural assessments. Their role has since expanded, and modern systems may also perform sensing, navigation, onboard processing, and communication functions. Studies on their use for building inspections and post-disaster assessments mainly focus on three related areas. The first concerns the acquisition of structural data using UAVs, while the second deals with navigation when GPS signals are weak or unavailable. A third area investigates how the available computing power, communication bandwidth, and onboard energy can be used more efficiently. These challenges often occur together in reinforced-concrete environments, where access is limited, signals may be attenuated or affected by multipath propagation, and the equipment carried by the UAV is restricted by its payload capacity.
2.1. UAV-Based Structural Inspection Systems
UAV-based structural inspection has become increasingly common as an alternative to conventional manual inspection, particularly for high-rise buildings, complex façades, and other hard-to-access areas [2,18]. Optical, thermal, multispectral, and LiDAR sensors have been used to automate inspection data collection while extending the spatial coverage of inspections. RGB images support the detection of visible surface defects, whereas thermal and multispectral imaging can assist in identifying moisture-related damage and thermally observable anomalies [3,4]. LiDAR and photogrammetric data have also been used for three-dimensional geometric reconstruction and documentation of inspected structures [4,5]. UAV data can be integrated into BIM-supported inspection workflows [1]. Automated image-to-BIM registration has also been developed for building-façade inspection [6]. Geometric and semantic information contained in BIM models can be used to define inspection regions and support UAV path planning [1,10]. Low-collision UAV-based automated structural surface inspection methods have also been developed specifically for structural inspection [16]. Edge computing enables onboard image processing and adaptive crack inspection during UAV operations [7,8]. Lightweight convolutional models can further support real-time building-surface defect detection on resource-constrained platforms [9]. Autonomous indoor inspection and vision-based façade-following methods have been explored in complex built environments [11,12]. Structure-prior-aided visual-inertial navigation has also been implemented to improve localization accuracy during building inspection [13]. In addition, UAV-based methods have been developed for high-rise façade modeling [14] and for crack detection and quantification in concrete structures [15].
According to UAV and mobile robot inspection reviews, autonomous robotic inspection is still in the initial phase, and further practical work is needed [18]. In practice, the effectiveness of multiple sensors is also dependent on their calibration, synchronization in time, and stability of the localization process [18]. The limitations of the computing power aboard the system may limit the complexity of the models employed and the amount of computationally intensive tasks that can be performed simultaneously [9].
2.2. Navigation in GPS-Denied Environments
Navigation in GPS-denied environments, including indoor structural and bridge-inspection settings, remains a significant challenge. UAV localization must therefore rely on onboard sensing and estimation techniques rather than satellite-based positioning. Approaches used to support autonomous localization and mapping include hierarchical graph-based SLAM for bridge inspection [19] and heterogeneous UAV–UGV systems developed for cooperative exploration and mapping in unknown three-dimensional environments [20].
Visual-inertial methods provide another approach to navigation in GPS-denied environments. Stereo visual-inertial localization combined with fiducial-marker corrections has been used to reduce accumulated drift during long-distance navigation in large-scale bridge environments [21]. Vision-based approaches have also been evaluated for indoor inspection in structured industrial environments [22]. Integrated control, localization, and mapping architectures have further been investigated to coordinate UAV motion and map generation under GPS-denied operating conditions [23]. Nonetheless, many vision-based techniques depend on adequate illumination and surface texture, while their performance may also be affected by limited onboard computing resources and accumulated estimation errors. Optical flow provides a relatively low-cost means of estimating horizontal velocity and relative motion [24]. The previously described optical-flow method may suffer from a drop in overall accuracy due to changes in the vehicle attitude that affect the alignment of the sensor with the observed surface. This problem is alleviated by using a gimbal-stabilized optical-flow configuration [24]. Optical-flow estimation has been combined with LiDAR odometry to improve robustness in organized GPS-denied environments [25].
LiDAR is also a good fit for low-light and visually repetitive environments. LiDAR measurements can be used together with inertial measurement unit (IMU) data and odometry algorithms to provide geometric information for mapping and pose estimation [19,25]. For instance, a LiDAR/IMU/RTK system was developed for bridge-inspection missions, including transitions between open areas and regions with difficult GNSS reception [26]. The combination of GNSS, INS, and LiDAR has also been investigated as a way to maintain navigation performance when the availability of the GNSS signal varies during the flight [27]. The literature shows that no single sensing technology can provide reliable localization under all GPS-denied inspection conditions. Multisensor fusion can improve robustness by fusing complementary visual, inertial, optical-flow, and LiDAR measurements. However, its performance is still conditioned by the sensor quality, the calibration stability, the operating conditions, and the processing capacity available on board the UAV.
2.3. Edge Computing, Communication, and Energy Optimization in UAVs
A major limitation of UAV operation is that sensing, onboard processing, wireless transmission, and flight all depend on a limited energy supply. Communication problems can create an additional burden because large amounts of data must be transmitted to a ground station. Edge computing can reduce this dependence by processing selected data locally on the UAV and transmitting only the required results. This approach may also support faster decision-making by reducing communication latency. In one study, the joint optimization of task offloading, data compression, transmission power, and computing resources reduced energy consumption by at least 28.2% under the evaluated conditions for a raw task size of 4 Mbit [28].
Multi-UAV communication–computation optimization has further considered the joint management of computing resources, transmission decisions, and UAV movement [29]. Other methods aim to reduce the amount of information transmitted through constrained wireless links. Projection-based compressive data gathering collects and forwards compressed representations of sensor information [30]. Semantic communication follows a related principle by transmitting task-relevant information rather than complete raw data [31]. Research on UAV-enabled networks has also examined energy-efficient resource allocation and opportunistic networking [32,33]. Reliability-aware approaches can jointly optimize resource allocation, data-transmission scheduling, and UAV motion [34]. Deep-reinforcement-learning-based methods have also been proposed for resource allocation in multi-UAV MEC networks [35].
These studies provide useful algorithms for UAV-assisted networks, although many of them assume communication infrastructure and computing resources that differ from those available in a low-cost indoor inspection prototype. Their optimization models may therefore not transfer directly to a Raspberry Pi-based platform operating with intermittent connectivity. Communication is more restrictive during indoor inspection of reinforced-concrete structures. Under weak Wi-Fi conditions, the continuous transmission of high-resolution images may not be practical, whereas a narrowband radio link can still carry low-volume critical telemetry. The communication strategy should therefore combine energy-aware computation with asymmetric data routing, data compression, store-and-forward operation, and selective retransmission. These requirements motivate the lightweight communication and energy-management mechanisms implemented in the proposed system.
2.4. Research Gap and Positioning of This Study
Many advances have occurred across several UAV-related research disciplines. However, these areas are often studied independently or under assumptions that differ from those of a low-cost indoor inspection platform. Research on structural inspection has included sensor-based pathology detection [3] and lightweight defect detection [9]. BIM-supported workflows and automated flight-planning methods have also been developed [1,10]. Research on GPS-denied navigation has examined SLAM and stereo visual-inertial localization approaches [19,21]. Optical-flow-based navigation [24] and LiDAR–optical-flow fusion methods [25] have also been investigated. Joint edge-computing and data-compression optimization has been investigated in UAV-assisted networks [28], while reliability-aware approaches address transmission scheduling and UAV motion [34]. A significant research gap remains in the development of a low-cost UAV architecture that jointly addresses GPS-denied localization, limited onboard computing capacity, intermittent broadband connectivity, narrowband telemetry, restricted energy availability, and mission continuity across fragmented flight sessions. These limitations are particularly relevant to indoor inspection in reinforced-concrete environments, where sensing, communication, and mission-management functions must operate on resource-constrained hardware.
To mitigate this gap, this work describes and demonstrates the design and analysis of a hexacopter architecture that decouples mission planning and low-level safe flight control. The Pixhawk PX4 is utilized to implement low-level attitude and velocity stabilization, while the Raspberry Pi 4 is responsible for sensing, communication, local logging, and mission-level support functions. Instead of computationally expensive real-time learning or network-level optimization, we utilize relative state estimation, proximally based obstacle awareness, asymmetric data flows, data integrity checks, and selective retransmissions; we incorporate avionics-side power controls, and utilize a mission continuation mechanism that uses a local SQLite database. The implemented capabilities are examined as an entire proof-of-concept system against a real-world configuration in terms of energy, communications, and computing limitations.
3. Proposed UAV System Architecture
The proposed system architecture is developed with a focus on flight control stability and mission management flexibility in reinforced-concrete environments. This architectural approach physically and logically separates lower-level stabilization tasks from higher-level mission processes. A dedicated flight controller performs real-time motor control and stabilization, whereas the mission computer handles perception and communication tasks that are computationally intensive. With this configuration, the responsiveness of the low-level flight control is preserved even if the mission-level component experiences high computational loads or software delays. The layered connection structure of these two units can be seen in Figure 1.
Figure 1.
General system architecture of the proposed UAV platform.
3.1. Overall System Architecture
The system’s architecture was developed to enable semi-autonomous operation in GPS-denied areas. A multimodal sensor suite processes raw input data via the edge computing platform, creating a local representation of the environment and managing that local data. This should allow it to reduce its reliance on high-bandwidth wireless communications when operating within confined spaces. Data flow into this system as follows: raw input data from both LiDAR and ultrasonic sensors are fed into the mission computer for use in state estimation and obstacle detection. Simultaneously, the flight controller sends basic flight telemetry via the MAVLink protocol to the mission computer for unified situational awareness. All of these inputs are processed and sent to the ground station via the hybrid communication layer, depending upon the current link quality and priority of the data.
3.2. UAV Hardware Platform
The hexacopter (X) configuration was chosen because it provides more payload and redundancy than a standard quadcopter. Six rotors offer greater potential for redundancy than four rotors (quadcopter) and may also facilitate controlled recovery from selected propulsion failures depending on the type of failure and flight conditions. The weights and weight distribution of all hardware comprising the prototype are listed in Table 1. The total weight at takeoff is approximately 2805 g.
Table 1.
UAV hardware components and weight distribution.
3.2.1. Frame and Propulsion System
This S550 frame was chosen for this build because it is designed in a modular format and has sufficient room to install both the computer hardware and sensor array. For the propulsion system, six EMAX XA2212 980 KV Brushless DC Motors were used along with six 10 × 4.5-inch propellers. Each motor was also connected to a 40 A Skywalker electronic speed controller. These ESCs provide a thermal protection margin above what would be required for normal operation based on the expected maximum current output of the motors.
3.2.2. Power Distribution Architecture
The energy system includes two 3S 5000 mAh 100C LiPo Batteries that are placed into a paralleled configuration. This results in a combined capacity of 10,000 mAh with a nominal voltage of 11.1 V. Since the batteries will be in a paralleled configuration, they will continue to maintain a common voltage of 3S. Also, by paralleling the batteries, we can increase the total available battery capacity to support both propulsion electronics and onboard avionics. The power distribution board (PDB) supplies power directly to the motor while supplying the rest of the avionics systems (such as the Raspberry Pi, sensors, and telemetry modules) through a 5 V DC switching regulator (LM2596) with a low equivalent series resistance (ESR) electrolytic capacitor and an LC filter for reduced electromagnetic interference to the avionics.
3.2.3. Sensor Array and Integration
The multimodal sensor array minimizes blind zones associated with individual sensors. Horizontal distance measurements and detection of obstacles with 360-degree views are provided by the RPLIDAR A1M8. Vertical proximity information is available from two HC-SR04 ultrasonic distance sensors. Theoretically capable of measuring distances up to 4 m, the reliability of these distance measurements is limited due to motor wash-down of air (prop-wash) and acoustic interference. These proximity sensors will therefore be used primarily during low-altitude maneuvers. In addition to the use of the above-mentioned sensors for detecting distance or velocity, a PMW3901 optical flow sensor on the bottom-front of the vehicle measures horizontal velocities for input into the flight controller to determine GPS-denied environment drift. The visual structural data are collected by a fixed Raspberry Pi Camera Module 3 mounted at the bottom-front of the vehicle.
3.2.4. Computing and Communication Units
There are two tiers to the architectural design that enable both systems to operate with high efficiency. Tier, one consists of a Pixhawk PX4 2.4.8 flight control unit (FCU), which provides real-time stability through stabilization and basic sensor integration. Tier two is the mission computer based on a Raspberry Pi 4 Model B, which enables mission-level processing, sensor management, local logging of data, as well as routing communications. The communication structure is a hybrid combination of three wireless frequencies to reduce possible signal loss. The 915 MHz band will be utilized for all system configurations; the 433 MHz band will be used for all mission telemetry, including preview images when they are compressed. Under a stable Wi-Fi connection, high-data-rate mission products, such as full-resolution JPEG and log files, are sent over the Wi-Fi/MQTT link.
3.3. Edge-Computing and Flight-Control Layer
The operating logic of the UAV is contained in a non-symmetrical processing flow that separates flight stabilization from higher-level mission tasks. At the base level of processing, the Pixhawk PX4 represents the safety layer for flight stabilization. This is because it utilizes an Extended Kalman Filter (EKF2) to continuously estimate the vehicle state at a high frequency. This isolation of functions was developed to help preserve flight stability even if the mission computer experiences high CPU usage and/or delays in software execution. On the other hand, the Raspberry Pi 4 serves as an edge-computing unit. It uses local computation of the raw sensor data to assist in mission continuity. Additionally, the Raspberry Pi performs image compression. There is communication between the two units via a serial link at 921,600 bps that utilizes the MAVLink protocol. When an obstacle is detected, the Raspberry Pi can send a binary “obstacle flag” to the Pixhawk to request a transition into position-hold mode. Additionally, the Raspberry Pi maintains an SQLite database to provide a method for maintaining data integrity across multiple flight sessions.
3.4. Hybrid Communication Layer
In order to combat the effects of radio frequency (RF) attenuation in reinforced-concrete structures, this system uses a multi-layered hybrid communication architecture. The architecture depicted in Figure 2 utilizes three separate bands to manage data flow based on priority. The backbone of this system is a Wi-Fi network using an MQTT broker. If structural elements block the Wi-Fi signal or degrade it to an unusable state, the system automatically switches to the 433 MHz telemetry network. The narrowband telemetry channel has a baud rate of 115,200 and an air data rate of 250 kbps, supporting critical telemetry data and compressed AVIF thumbnails. The 915 MHz band is completely isolated from mission-related activity and is reserved for maintenance and pre-flight configuration. Therefore, configuration access is separated from mission-related workloads.
Figure 2.
Hybrid communication architecture and asymmetric data-routing strategy.
3.5. Safety-Oriented System Design
Safety and reliability in complex indoor operations are integrated at the architectural level for the safe operation of flight control systems. The system architecture provides a basis for controlled behavior during sensor or communication failures by coordinating hardware-level protection from the Pixhawk with software-based decision support on the Raspberry Pi. This modular isolation aims to prevent software issues involving the mission computer from affecting basic flight stabilization. Also, the architecture includes the human-in-the-loop principle that allows the system to request pilot intervention via the hybrid communication layer when the configured recovery response is insufficient. This hierarchical approach for operational safety was designed to prioritize stabilization and provide the operator with real-time health data from both the flight control and mission computing layers.
4. Materials and Methods
The hardware operation of this proposed UAV system combines real-time processing of flight stabilization and mission management through edge computing to address the complexities associated with the use of UAVs in reinforced-concrete structures. The software architecture was designed to maintain a functional separation between low-level reflexive responses and higher-level mission processes. An asymmetric division of tasks is used so that the system can execute sensor fusion, communication optimization, and energy management concurrently. The overall goal of this framework is to provide a basis for navigating in a GPS-denied environment while providing the necessary data integrity and safety required for structural inspection missions.
4.1. Sensor Fusion and GPS-Denied Navigation Method
Indoor or GPS-denied environment operation requires relative state estimation as well as local obstacle detection. In the proposed design, these two tasks are kept apart: relative motion estimation is carried out by using optical flow and flight-state information from the MAVLink protocol, while obstacles are detected and safety decisions are made using LiDAR and ultrasound sensors. SLAM and stereo visual-inertial localization have been investigated for structural and bridge inspection under GPS-denied conditions [19,21]. Optical-flow and LiDAR-based odometry have also been used to support relative motion estimation and localization in structured environments [24,25].
4.1.1. EKF-Based Sensor Fusion Formulation
The estimation of the UAV position and velocity in GPS-denied environments is performed using a recursive Extended Kalman Filter (EKF) formulation. In the proposed architecture, the estimation process is organized as a dual-layer structure to separate low-level flight stabilization from mission-level environmental interpretation. The low-level layer is implemented on the Pixhawk PX4 flight controller, where EKF2 processes high-frequency inertial and barometric measurements, together with optical-flow-related flight information, to support attitude stabilization and short-term relative motion estimation. The mission-level layer is run on the Raspberry Pi 4 board. The data regarding flight state that are sent via MAVLink, including optical flow data, will be used in order to process local relative state estimation, while the data from RPLIDAR A1M8 and HC-SR04 ultrasonic sensors will be processed as proximity sensing for local environmental awareness, obstacle detection, and safety distance checks.
The state vector used in the mission-level EKF is composed of the three-dimensional position and velocity components of the UAV. This state representation is defined in Equation (1):
In Equation (1), (), (), and () denote the estimated position components, while (), (), and () denote the corresponding velocity components. Based on this state definition, the prediction stage estimates the UAV state at the next time step using the previous state estimate, the control input, and the process noise term, as expressed in Equation (2):
Here, (f()) represents the nonlinear state transition function, () denotes the system input, and () represents the process noise. In parallel with the state prediction, the error covariance matrix is propagated to estimate the uncertainty associated with the predicted state. This covariance prediction is given in Equation (3):
Equation (3) represents an expression for predicting the error covariance matrix (). In this equation, () is the Jacobian matrix of the nonlinear state transition function, and () represents the process noise covariance matrix. This component provides the uncertainty model, which will later be corrected based on sensor measurements.
In the step for updating the estimate based on the measurement, the mission-level estimator processes flight-state observations transmitted via MAVLink, which includes the horizontal velocity data received from the PMW3901 optical flow sensor. The RPLIDAR A1M8 and HC-SR04 measurements are processed independently as proximity measurements and not absolute position measurements. The PMW3901 provides relative-motion information over the observed ground texture to assist in estimating horizontal drift in GPS-denied areas. The HC-SR04 ultrasonic sensors provide proximity measurements during low-altitude phases of flight and are also used for vertical safety-related checks. They have a theoretical measurement range of approximately 4 m, but acoustic noise and propwash caused by the six-motor propulsion system reduce their reliable operating range to approximately 1.0–1.5 m during flight.
The difference between the actual measurement vector and the predicted measurement is defined as the measurement residual, or innovation, as shown in Equation (4):
In Equation (4), () denotes the nonlinear measurement function that maps the predicted state into the measurement space. The innovation covariance, which represents the uncertainty of this residual, is computed using Equation (5):
Here, () is the Jacobian matrix of the measurement function and () is the measurement noise covariance matrix. The Kalman gain is then calculated according to Equation (6):
The Kalman gain determines the relative contribution of the predicted state and the new sensor measurements during the update stage. The corrected state estimate is obtained using Equation (7):
Finally, the error covariance matrix is updated after incorporating the measurement information, as expressed in Equation (8):
This estimation framework delivers a continually refined relative state estimate to the mission computer. The LiDAR and ultrasonic proximity sensor data are processed using the parallel obstacle awareness and safety layer discussed in Section 4.1.2. The mission-level estimator operates in a local Cartesian coordinate frame initialized at the takeoff position. The state-transition model assumes approximately constant velocity over the sampling interval Δt. Optical-flow measurements provide horizontal velocity observations, while the ultrasonic sensors are used only as auxiliary vertical-proximity inputs. RPLIDAR data were processed as horizontal range measurements for a given angular sector, which are used as relative-distance information rather than direct absolute-position measurements. HC-SR04 data were used to provide vertical-direction proximity information only at the lower altitudes where it provides reasonable and reliable height information, acting as a supplementary safety input. The process- and measurement-noise covariance matrices were determined through manual tuning during preliminary indoor trials. The tuning experiments were carried out independently of the 10 indoor flights used for the reported navigation evaluation. Once tuning was completed, the covariance values used were not changed during any of the 10 indoor navigation-evaluation flights. For the sake of reproducibility, however, covariance tuning can be performed using separate preliminary runs that are independent of the evaluation dataset. The process-noise covariance must be varied depending on the amount of uncertainty of the position and velocity estimates, with higher values corresponding to increased sensitivity of the estimator to the input measurements and lower values meaning increased dependency on the state transition model. Measurement noise covariance needs to be varied depending on the actual reliability of measurements, with higher values used for more noisy measurements. While tuning the covariance matrices, it is important to observe the results of the estimation algorithm for possible drifting, oscillating, or high sensitivity to specific input measurements and adjust the covariances accordingly. It is important not to adjust the covariances after their initial tuning with respect to the evaluation dataset. The resulting state and distance information is then used by the semi-autonomous decision logic described in the following subsection.
4.1.2. Obstacle Detection and Semi-Autonomous Decision Logic
The updated state estimate () obtained from the Extended Kalman Filter provides the spatial context for the obstacle detection and semi-autonomous safety logic executed on the Raspberry Pi 4 mission computer. This logic is designed to support safe operation of the UAV by monitoring horizontal and vertical safety margins during GPS-denied indoor flight. Instead of implementing complex autonomous avoidance maneuvers, which may be difficult to validate in narrow reinforced-concrete corridors, the proposed system uses a conservative safety-override strategy. When the measured distance to an obstacle falls below a predefined threshold, the mission computer requests a transition from the active mission state to a hover or position-hold state through the flight controller. Horizontal obstacle awareness is provided by the RPLIDAR A1M8, which performs 360° scans around the UAV. The LiDAR data are processed sectorally to evaluate potential obstacles in the front, rear, front-right, front-left, rear-right, and rear-left directions. To reduce false detections caused by the UAV structure itself, a sectoral mask is applied to exclude LiDAR measurements originating from angular regions blocked by the landing gear. Vertical safety is monitored using the upper and lower HC-SR04 ultrasonic sensors, which provide auxiliary proximity information for ceiling-side and ground-side obstacle checks.
Two predetermined safety limits were used in a decision-making process. A horizontal limit was established at (d_h = 1.5) m, and a vertical limit was established at (d_v = 1.0) m. When the minimum distance measured by LiDAR filtering (d_min) drops below (d_h), or when either of the ultrasonic sensors detects objects inside (d_v), the obstacle flag (f_obs) will be set to 1. Once the obstacle flag is activated (i.e., f_obs = 1), the mission state variable (m) is switched from MISSION to HOVER, and flags/mode requests for this new mission state are sent via MAVLink to the Pixhawk flight control system. This sequence of events is graphically represented in Algorithm 1 with an edge-based model describing the process for detecting obstacles and overriding safe operation.
| Algorithm 1. Edge-Based Obstacle Detection and Safety Override Procedure |
| Input: LiDAR distance array d_lidar, Upper ultrasonic distance d_us_up, Lower ultrasonic distance d_us_down, Horizontal safety threshold d_h = 1.5 m, Vertical safety threshold d_v = 1.0 m. Output: Obstacle flag f_obs, Flight mode request m. 1: Initialize f_obs ← 0 2: Initialize m ← MISSION 3: while system is active do 4: Apply sector mask to d_lidar 5: Compute filtered LiDAR array d_lidar,f 6: Compute minimum horizontal distance d_min ← min(d_lidar,f) 7: if d_min < d_h or d_us_up < d_v or d_us_down < d_v then 8: Set f_obs ← 1 9: Set m ← HOVER 10: Send MAVLink message containing f_obs and m to Pixhawk FCU 11: Log obstacle detection event to SQLite with timestamp 12: else 13: Set f_obs ← 0 14: Set m ← MISSION 15: Send MAVLink message containing f_obs and m to Pixhawk FCU 16: end if 17: Wait for Δt 18: end while |
The Raspberry Pi 4 operates at a Mission Level (obstacle evaluation) to create an obstacle-related input signal, which then sends a small safety signal and Mode Request to the FCU via Pixhawk. Once f_obs = 1, the Raspberry Pi sends a message via MAVlink, requesting either HOVER or Position hold from the autopilot so the pilot can pause the mission. All events are stored within a local SQLite database with the time stamp of each event and the state of all applicable sensors for post-mission analysis and cross-platform data correlation after a mission session has been broken into fragments.
4.2. Reliable Data Transmission and Protocol Optimization
High-bandwidth, uninterrupted communication to the ground station is not always achievable due to various communication impediments, including radio-frequency attenuation, multipath propagation, and connectivity dropouts. In order to account for these challenges, we introduce asymmetric data routing that chooses a data representation and the transmission channel based on data size, operational importance, and quality of the communication link. High-resolution images and log data will be sent over Wi-Fi/MQTT when a reliable and strong Wi-Fi signal is available. However, if the quality of the Wi-Fi link drops below a defined threshold, it prioritizes sending crucial telemetry, alarm notifications, small state summaries, and low-resolution, compressed data previews through the 433 MHz link. CRC32 checksumming, field-level delta compression, on-board storage, and selective-repeat ARQ protocols ensure minimized unnecessary transmission and enable successful recovery of corrupted and lost information.
4.2.1. Asymmetric Data Routing and Compression
Depending on the condition of the current links and the type of data being sent, the communication architecture dictates the format of transmission and the channel through which the data are transmitted. In the case where a Wi-Fi connection exists and the signal received is above the specified threshold, the Raspberry Pi publishes high-volume data over an MQTT broker. Here, structural images are transmitted as JPEG because it has a feasible trade-off between image quality, coding cost, and transmission size in case of high-bandwidth transmission. In case the UAV gets behind reinforcement bars or the Wi-Fi quality dips below the specified RSSI threshold, the high-volume real-time transmission is halted. In that scenario, raw/high-resolution visual data are saved locally on the mission computer while lower-resolution images are sent as a preview in case there’s a requirement for real-time operator awareness. The edge-computing module scales the image to grayscale, downsizes the image to a thumbnail, converts to AVIF, and then transmits over the limited 433 MHz channel. This should help to minimize data transmitted without treating the narrowband link as a substitute for high-resolution.
Image compression was also used in conjunction with small binary framing for communication of small amounts of mission-state information. Remote-control connectivity, active sensor states, and lighting conditions are represented by means of simple flags or small fields, instead of lengthy message bodies. This helps decrease the percentage of protocol overhead on the 433 MHz telemetry channel and makes it possible for essential state transitions to be communicated with less bandwidth overhead. In contrast to the mission data path, the 915 MHz telemetry channel was kept as an independent channel that was only to be used for configuration, maintenance, and direct flight-controller access, so configuration and flight processing were not to share one channel.
4.2.2. Delta Encoding and Bandwidth Reduction
The 433 MHz telemetry link uses a 115,200 baud asynchronous UART interface; meanwhile, the radio module uses a 250 kbps air data rate. Since the effective bandwidth on this link is limited and not adequate for transmitting large amounts of continuous data, on-board delta encoding is applied to reduce redundancy in the telemetry. Instead of transmitting the entire state report, each field of the current state is compared with the field of the most recent, successfully acknowledged state, and only the changed fields such as battery voltage, RSSI, sensor mode, lighting state, and obstacle info are transmitted in the current message. A small bitmask specifies the contents of the message frame and enables the ground station to update its local copy of the state, rather than receiving an entirely new state vector. If nothing has changed, then the transmission of state updates is inhibited.
The UAV maintains the most recently successfully sent state update on-board, and this is updated after a successful transmission and acknowledgment; this prevents updates due to failed transmission attempts from causing state inconsistencies between the UAV and the ground station. If no acknowledgment is received within a defined timeout period, the message is held and can be resent according to the retry limits specified in Algorithm 2. Large volume data streams are handled differently from state information. If the quality of the Wi-Fi connection falls below a predefined RSSI, continuous image transmission is disabled, and all of the images are buffered on the Raspberry Pi onboard mission computer; a low-resolution AVIF thumbnail image of each of the captured images is periodically sent over the 433 MHz channel when operator input may be needed. Images, videos, and other high-volume records remain stored on the Raspberry Pi and are transmitted via the broadband link when the UAV is within Wi-Fi range.
| Algorithm 2. Reliable Data Transmission and Selective-Repeat ARQ Procedure |
| Input: data_type current_state previous_state image_payload wifi_rssi Wi-Fi threshold r_wifi = −75 dBm acknowledgment timeout T_ack maximum retry count R_max Output: transmission_status updated previous_state 1: Initialize transmission_status ← NOT_SENT 2: if data_type = STATE then 3: changed_fields ← empty set 4: for each field f in current_state do 5: if current_state[f] ≠ previous_state[f] then 6: Add f and current_state[f] to changed_fields 7: end if 8: end for 9: if changed_fields is empty then 10: Return transmission_status ← DROPPED_NO_CHANGE 11: end if 12: Create state frame S containing: sequence_id, timestamp, changed-field bitmask, changed_fields 13: if wifi_rssi > r_wifi then 14: Serialize S as a compact MQTT message 15: Send S through Wi-Fi/MQTT 16: if transmission is successful then 17: Update previous_state only for fields contained in changed_fields 18: Return transmission_status ← STATE_SENT_VIA_WIFI 19: else 20: Store S locally for later transmission 21: Return transmission_status ← STATE_BUFFERED 22: end if 23: else 24: Encode S as a compact binary frame 25: Compute CRC32 for S 26: Append CRC32 to S 27: Send S through the 433 MHz UART channel 28: Wait for acknowledgment for T_ack 29: if acknowledgment is received and CRC32 is valid then 30: Update previous_state only for fields contained in changed_fields 31: Return transmission_status ← STATE_SENT_VIA_433_MHZ 32: else 33: Store S locally for retransmission 34: Return transmission_status ← STATE_BUFFERED 35: end if 36: end if 37: else if data_type = IMAGE then 38: if wifi_rssi > r_wifi then 39: Encode image_payload as JPEG 40: Send JPEG data through Wi-Fi/MQTT 41: if transmission is successful then 42: Return transmission_status ← IMAGE_SENT_VIA_WIFI 43: else 44: Store image_payload locally 45: Return transmission_status ← IMAGE_BUFFERED 46: end if 47: else 48: Generate a reduced-resolution grayscale thumbnail 49: Encode the thumbnail as AVIF 50: Split AVIF data into chunks C 51: for each chunk c in C do 52: Add sequence_id, image_id, chunk_id, and total_chunks 53: Compute CRC32 for c 54: Send c through the 433 MHz UART channel 55: end for 56: retry_count ← 0 57: Wait for receiver feedback for T_ack 58: Receive missing-or-corrupted chunk list M 59: while M is not empty and retry_count < R_max do 60: for each chunk identifier m in M do 61: Resend the corresponding chunk 62: end for 63: retry_count ← retry_count + 1 64: Wait for updated receiver feedback for T_ack 65: Receive updated missing-or-corrupted chunk list M 66: end while 67: if M is empty then 68: Return transmission_status ← IMAGE_SENT_VIA_433_MHZ 69: else 70: Store the complete image and unsent chunk information locally 71: Return transmission_status ← IMAGE_PARTIALLY_SENT_AND_BUFFERED 72: end if 73: end if 74: end if |
4.2.3. CRC32-Based Error Checking and Selective-Repeat ARQ
CRC32-based integrity check is performed on important telemetry frames and fragmented image-preview chunks at the application level. The transmitter appends the CRC32 value to each chunk, and then the ground station recalculates the checksum of each chunk received. Based on the sequence and chunk IDs, chunks with invalid checksums or missing chunks (those which are not received prior to the acknowledgment timeout) can be distinguished. The ground station only sends a negative acknowledgment (NACK) for corrupted/lost chunks. The UAV retransmits the lost/corrupted chunks in a selective-repeat ARQ protocol; the overall workflow is given in Algorithm 2. The packet header contains sequenceid, chunkid, totalchunks, missioned, and image_id needed for reassembly and mission-level linking.
For mission state messages, the algorithm uses a field-level delta encoding: the algorithm compares the current value of each parameter against the value of that parameter in the previous successfully acknowledged state. Only the changed fields are included in the next message, prefaced by a bitmask that succinctly encodes which fields are included in the message. This enables the ground station to update its local view of the mission state without needing the complete state vector in every message, as the previous state is only updated after a message has been successfully acknowledged, so state inconsistencies caused by a failed message do not persist.
For image data, the Raspberry Pi transmits full-resolution JPEG-encoded images over Wi-Fi/MQTT whenever the broadband connection is available. In conditions of poor Wi-Fi performance, the Raspberry Pi transmits a low-resolution, grayscale preview that has been encoded in AVIF and broken into small, individually addressable chunks. Every chunk is prefixed with its own CRC32 value, and the ground station selectively requests missing or corrupted chunks in a repeat ARQ scheme up to a maximum of R_max attempts, after which it stores the unreceived chunks for later attempts.
4.3. Energy-Aware Mission Management
Energy Availability is the primary operational constraint for the proposed UAV platform because it not only needs the propulsion system, but also a mission computer with multiple sensors and wireless communication modules onboard. An Energy-Aware Mission Manager runs on the Raspberry Pi 4 mission computer to address the avionic energy demands and adapt software and hardware energy modes based on the mission phase, computation demand, sensing demand, and communication demand. Figure 3 gives an overview of the major functional blocks of the Energy-Aware Mission Manager, including dynamic CPU scaling, peripheral power gating, LiDAR motor control, and store-and-forward transmission.
Figure 3.
Energy-aware mission management strategy for avionics-side power reduction.
The mission manager can receive battery voltage (V_bat) and current (I_bat) sensor data from the Pixhawk PX4 power module via MAVLink. When operating in flight, these sensor data are only consumed in a supervisory fashion, as the power module measures across the entire supply and is not able to resolve the consumption by the propulsion motors and avionics. Power consumption calculation as shown in Section 5.4 thus was performed during ground testing with no power supplied to the propulsion motors. Under various conditions dependent on current computation usage, sensor usage, and wireless link quality, the mission manager implements three strategies that are dynamic voltage/frequency scaling (DVFS), power gating peripheral modules and the LiDAR motor, and store-and-forward data communications. These techniques aim at minimizing non-essential power consumption on the avionics system without affecting flight stabilization capabilities.
4.3.1. Dynamic Voltage and Frequency Scaling
The power draw from the Raspberry Pi 4 has a number of factors that can be influenced by both the operation speed of the processor and the type of work being performed. The Energy-Aware Mission Manager uses the Linux cpufreq subsystem to switch the CPU between predefined operating-frequency profiles according to the current workload. Any associated voltage adjustment is handled internally by the Raspberry Pi platform and was not controlled or measured independently in this study. The manager will switch between the two predefined cpufreq modes (powersave, performance) depending on the nature of the task currently executing.
When either no processing or low-level processing is occurring at the mission computer (i.e., idle), it is placed into the powersave state with an operating frequency of 600 MHz. The powersave state is applied during periods of time when the mission computer does not need to perform computationally demanding functions such as updating the Extended Kalman Filter, compressing images, or processing communications. When a higher operational load is detected, the manager will place the mission computer into the performance state and raise its operating frequency to 1.5 GHz. Higher frequencies are utilized for tasks such as performing EKF matrix operations, encoding AVIF images, and processing packets in real-time communications. Following completion of each high-priority task, the operating frequency is switched back down to lower operational states. Ultimately, this approach is intended to provide a balancing act between providing sufficient performance to support the needs of the Avionics System while minimizing the total amount of energy consumed by the mission computer.
4.3.2. Peripheral Power Gating and LiDAR Motor Control
The peripheral power-gating technique is applied to limit unnecessary power consumption of components not needed during a particular phase of the mission. At the software level (i.e., through the operating system), unused interfaces can be deactivated. For instance, the Bluetooth interface can be deactivated through the command-line tool rfkill when it is no longer necessary for the mission. Also, communication interfaces or unused ports may be put into a low-power state when they are not linked to any actively sensed parameters or telemetry modules. On the hardware side, for a few of the sensors, power ON or OFF may be activated through MOSFET-based switching circuits that may be controlled through Raspberry Pi’s GPIOs. This configuration enables the mission computer to selectively switch ON or OFF sensing units based on the operational environment. As an illustration, during operation in open atmosphere where the obstacle probability is negligible and with a guaranteed GPS fix, the indoor-related sensor systems might be brought to a low-power state, whereas during indoor operations or during loss of GPS fix, a relative positioning-related sensor system will continue to be active for object detection and avoidance.
The RPLIDAR A1M8 requires additional attention because its rotating motor creates a continuous power load during 360° scanning. When full horizontal scanning is not required, the mission manager can issue a software command to stop the LiDAR motor. During indoor or GPS-denied flight, however, the LiDAR motor remains active because horizontal obstacle perception is required for safe operation. If periodic LiDAR operation is used during extended hover or low-risk phases, the manager must also consider the inrush current associated with restarting the motor. This avoids treating LiDAR motor control as a simple on/off mechanism and keeps the power-management strategy compatible with the stability of the avionics supply line.
4.3.3. Store-and-Forward Transmission
Wireless transmission is another source of avionics-side energy consumption, especially when the UAV operates in reinforced-concrete environments where Wi-Fi signal quality may decrease due to attenuation and multipath propagation. In order to prevent a large number of transmissions at low bandwidths that would require high-volume transmissions due to poor signal strength, the Energy Aware Mission Manager stores all data captured by the Raspberry Pi locally until a good signal strength is available. The Raspberry Pi continuously checks the RSSI of its wireless connection (r_wifi = −75) dBm. If the RSSI of the wireless connection drops below r_wifi, no new image or log data will be sent over the wireless network. Instead, they will be saved to the local SQLite database as “pending”. During this time, the wireless module can also enter a low-power state. However, if necessary, the critical telemetry and compact states will be sent via the low-bandwidth communication channel. Once the UAV reaches an area where the RSSI of the wireless connection is strong enough, all pending data will be sent, and their respective entries in the database will be changed to “sent”.
This method was created to minimize unnecessary transmissions when there is poor signal strength, but still keep all data available on the UAV after each mission so that they could be retrieved later. This integrated logic is summarized in Algorithm 3.
| Algorithm 3. Energy-Aware Mission Management Procedure |
| Input: Battery voltage V_bat Battery current I_bat Task load state task_load Environment state environment GPS state GPS Wi-Fi RSSI value wifi_rssi Wi-Fi threshold r_wifi = −75 dBm Output: CPU governor state Sensor power state Transmission state SQLite data status 1: Initialize battery monitoring parameters 2: Initialize Wi-Fi threshold r_wifi ← −75 dBm 3: while system is active do 4: Read V_bat and I_bat from Pixhawk via MAVLink 5: if task_load = HIGH then 6: Set cpufreq governor ← performance 7: Set CPU frequency ← 1.5 GHz 8: else 9: Set cpufreq governor ← powersave 10: Set CPU frequency ← 600 MHz 11: end if 12: if environment = OUTDOOR and GPS = STABLE then 13: Stop RPLIDAR motor if full scanning is not required 14: Disable indoor-specific sensors through MOSFET gating 15: else 16: Start RPLIDAR motor 17: Enable navigation-related sensors 18: end if 19: if wifi_rssi < r_wifi then 20: Suspend high-volume transmission 21: Store images in the local file system and record their file paths, log metadata, and status = pending in SQLite 22: Set Wi-Fi module to reduced-power mode if applicable 23: else if wifi_rssi ≥ r_wifi and pending data exist then 24: Transmit buffered data over Wi-Fi 25: Update SQLite status ← sent 26: end if 27: Wait for next management cycle 28: end while |
4.4. Multi-Sortie Mission Continuity and Data Management
Large-scale structural-inspection tasks may exceed the endurance available within a single UAV battery cycle and may therefore require multiple flight sessions or multiple UAV platforms. The mission-continuity mechanism developed in this study does not perform autonomous swarm coordination or automatic in-flight task transfer between UAVs. Instead, it preserves mission context at the database level so that images, telemetry records, sensor metadata, and mission-state information collected during separate flight segments can be associated with the same inspection task. This approach allows operator-supervised flight sessions to be combined into a unified and chronologically ordered mission dataset using shared Mission_ID values, platform-specific Drone_ID values, timestamps, and mission_state records.
4.4.1. Mission Identification and Local Data Storage
The mission continuity framework utilizes a hierarchy of identification methods. A unique Drone_ID is assigned to each UAV. That ID will then be added (read-only) into an SQLite database on the mission computer for the purpose of tracking that particular UAV. When applicable, the Drone_ID will also be added to packet(s), telemetry records, etc., to identify what platform sent the information. On the other hand, Mission_ID is utilized as the common identifier for all tasks. A mission label defined by the ground station, such as Building_A_Damage_Scan, will be designated to all UAVs executing the same inspection task. With the use of both Drone_ID and Mission_ID, it is possible to correlate data from multiple sources (platforms) collected during multiple time frames as being part of the same mission.
SQLite is utilized for local data management within the Raspberry Pi 4 mission computer. High-resolution image files are not directly written as binary objects within the database because this would create additional I/O overhead. Images are instead written to the local file system, and the file path, timestamp, telemetry info, Drone_ID, Mission_ID, etc., are recorded in the SQLite database. Additionally, there will be a transfer status value (i.e., pending, sent, error) in each record to assist in synchronizing with the ground station when communications may be sporadic.
4.4.2. Mission Continuation and Time Synchronization
There should be chronological coherence when merging the data of several UAVs after an inspection. Therefore, the system has developed a time synchronization process based on the ground station as reference. All UAVs synchronize their internal clocks at the start of the mission or once a connection via Wi-Fi is made. They accomplish this through a ground-station-based synchronization procedure analogous to NTP. Images, telemetry files, and sensor logs have all been assigned a standard timestamp (with millisecond precision). The structured timestamping described above forms the temporal base for reconstructing the sequence of events during post-processing. Mission continuation is performed as a manual supervised procedure rather than as an entirely automatic transition at the level of the swarm. Once the actively flying UAV reaches a threshold of either energy (battery) or mission-related criteria, it stores the current mission status and performs a return or landing, according to the operating procedures that were previously specified. The next UAV will be sent manually with a matching Mission_ID from the ground station interface. Prior to continuing with the mission, the ground station will transmit the latest information about mission state and corresponding sensor configuration from the earlier mission session to the newly launched UAV. The mission context data will be saved to the local SQLite database of the new UAV and loaded by the mission management software. This context identifies the last fully completed segment, previously inspected areas, logical continuation points, and the correct sensors for the upcoming segment. The transferred mission context identifies a logical continuation point rather than guaranteeing autonomous repositioning of the next UAV to the exact three-dimensional coordinates at which the preceding flight ended. Inheriting the stored mission context is intended to reduce methodical discrepancies between flight sessions while maintaining operator control over the mission-continuation process.
The mission_state table was created to keep track of how far along an inspection is in terms of completing each mission. It keeps track of items such as the current floor number being inspected; what areas have been scanned; what areas remain or were interrupted; where to begin scanning again; and what sensors are currently configured. By allowing the next UAV or future flight session to pick up from where they left off versus creating another independent dataset, this table enables continued mission continuity and data merging. The overall mission-continuity and data-merging procedure is summarized in Algorithm 4.
| Algorithm 4. Multi-Sortie Mission Continuity and Data Merging Procedure |
| Input: Drone_ID Mission_ID Captured image data Telemetry records Sensor metadata Battery state mission_state table Output: Merged mission dataset Chronological inspection log Structural inspection report 1: Assign Drone_ID to the UAV platform 2: Receive Mission_ID from the ground station 3: Synchronize the UAV clock with the ground station timestamp 4: while mission is active do 5: Capture image and sensor data 6: Store image file in the local file system 7: Insert record into SQLite with Drone_ID, Mission_ID, file_path, timestamp, metadata, and status = pending 8: Update mission_state with current_floor, covered_area, handoff_point, and sensor_config 9: if battery level reaches the defined mission limit then 10: Record the latest handoff_point in mission_state 11: Return or land the UAV according to the defined operating procedure 12: Wait for operator-supervised launch of Drone(n+1) 13: Pair Drone(n+1) with the same Mission_ID through the ground station 14: Transfer the latest mission_state and sensor_config records to Drone(n+1) 15: Store the received mission context in the local SQLite database of Drone(n+1) 16: Load the transferred mission context before mission resumption 17: end if 18: end while 19: Collect SQLite records from all Drone_IDs associated with the same Mission_ID 20: Merge records chronologically using timestamps 21: Use mission_state records to calculate cumulative coverage information 22: Generate the final inspection report with floor, UAV, time, image, and sensor metadata |
4.4.3. Data Merging and Report Continuity
After completing all flight missions, the ground station collects fragmented data from each UAV by using the Mission_ID. Each UAV’s Drone_ID identifies where data originated, and the timestamp synchronizes data (images, telemetry logs, etc.) to be ordered chronologically. In addition to providing chronological ordering of data, the mission_state table adds additional context to provide information about the overall mission reporting (floor-level completion, area coverage, continuation points). Additionally, the synchronization will handle any data stored locally during periods when there were Wi-Fi interruptions. Any pending records can be sent once a connection has been established and the status changed to “sent”. Once all data have been transferred, the ground station will query local databases with the same Mission_ID and generate an inspection report in HTML or PDF format. The inspection report will indicate which floor/structural section(s) were inspected by which UAV, at what time, and with which corresponding sensor records.
4.5. Fail-Safe and Human-in-the-Loop Safety Mechanisms
The operational reliability of the proposed UAV platform in GPS-denied reinforced-concrete environments depends on its ability to respond to hardware, sensing, communication, and software anomalies in a controlled manner. For this purpose, the safety architecture is organized as a multi-layered fault-handling framework that classifies faults according to their severity and assigns the response either to the Pixhawk PX4 flight controller or to the Raspberry Pi 4 mission computer. This separation is intended to reduce the possibility that mission-level software interruptions affect low-level flight stabilization, while still providing the operator with diagnostic information during degraded operating conditions. The human-in-the-loop safety architecture and pilot decision-support flow are illustrated in Figure 4.
Figure 4.
Human-in-the-loop safety and pilot decision-support architecture.
4.5.1. Fault Classification and Response Logic
The fault handling logic operates at three levels: flight-critical, navigation-critical, and mission-critical. This means that mission-level failures are not handled as flight-critical issues, but any failures that impact stabilization or propulsion are given top priority. A flight-critical fault has a direct impact on stabilization, propulsion, or the integrity of the aircraft. Examples include loss of IMU, loss of barometer, motor or ESC failure, loss of ESC link, and critically low battery voltage. This class is primarily managed by the default Pixhawk PX4 low-level fail-safe settings. When flying indoors with no GPS available and an autonomous LAND can be safely initiated, this option is prioritized. If the localization is good, the UAV will attempt RTH only after verification of a safe return path. If stabilization still exists and neither LAND nor RTH are viable, the mission computer asks for hover/land supervised by the pilot. If such an event occurs, the mission computer on Raspberry Pi does not interfere with the low-level flight controller.
Navigation fault reduces the efficiency of localization, relative-motion estimation, or obstacle detection without interfering with the stabilization process itself. Such faults might be a loss of connection between the LiDAR and the Raspberry Pi, loss of optical-flow data, and a problem with the ultrasonic sensor. In this case, the Raspberry Pi detects the occurrence of the fault and sends an SOS signal along with a HOVER/Position Hold command to the Pixhawk via MAVLink. This will pause the current mission, allowing the operator enough time to evaluate the situation and take manual control when necessary. A mission fault is any malfunction that does not interfere with the flight stabilization process but affects the execution of the current inspection mission. Examples of such faults may include camera breakdown, loss of the Wi-Fi connection, errors in the image storage process, and errors in writing information to the SQLite database. In case of detecting such a fault, the system either pauses or degrades the affected mission and logs the occurrence while maintaining low-level flight stabilization with the help of the Pixhawk PX4. The three fault categories and their corresponding response protocols are summarized in Table 2.
Table 2.
Three-level fault classification and response protocols.
4.5.2. Sensor and Communication Loss Handling
In addition to the general sensor fault behaviors, sensor-specific actions were specified under degraded sensing environments: when the RPLIDAR A1M8 is not able to report useful data, HOVER or Position Hold are requested at the mission computer because the system is no longer able to predict obstacles on the horizontal plane. For failed ceiling-proximity HC-SR04 (upper ultrasonic sensor), vertical motion is restricted due to lack of ceiling proximity, and follows the defined safety logic. When the lower ultrasonic sensor is unable to report values, altitude is rather more important than other data, and the pilot is notified of the limited accuracy of the current estimate during descent/landing; in case PMW3901 is unable to report data, drift estimation on the horizontal plane is not so precise, and the operator is alerted about the risk of necessary correction of manual control. Lost communication is dealt with using the hybrid communication and store-and-forward functionalities, presented in the above sections: if RSSI is less than a specific threshold, massive image transmission is aborted, and crucial telemetry still proceeds via 433 MHz where possible. The data unable to reach the receiver are stored in a local SQLite database, marked as pending, and verification and tracking through CRC32 and a status field are performed to enable correct synchronization later. Sensor fault scenarios, resulting in lost functionality, desired system behavior, and user action, are summarized in Table 3.
Table 3.
Fail-safe scenarios based on sensor loss and affected capabilities.
4.5.3. Watchdog Monitoring and Pilot Intervention
A watchdog timer within the Raspberry Pi 4 keeps track of the age of the newest, valid message received from each sensor and data source. Different timeout values for each individual sensor are necessary since the built-in sensors run at different rates. Short timeouts are set for the fast MAVLink flight state and optical flow messages, and longer timeouts are set for the ultrasonic and LIDAR data streams according to their respective sampling and scanning periods. A data stream is considered to be stale or missing if it times out on its own sensor-specific timeout period. In the implemented configuration, the timeout values were set to 250 ms for optical-flow/MAVLink state messages, 120 ms for ultrasonic measurements, and 350 ms for LiDAR scans. It also chooses an appropriate response based on the detected fault. Outdated readings can therefore no longer influence decisions made by the navigation or obstacle-detection functions. The safety architecture used for non-flight-stabilization emergencies includes a human in the loop. The human operator is given system health information through the ground station, including sensor status, battery state, RSSI level, current mission state, and active fault flags. From this information, the operator can make decisions such as resuming the mission, continuing with degraded capabilities, returning the aircraft, or performing a manual landing. The integrated monitoring and response procedure is detailed in Algorithm 5.
| Algorithm 5. Fail-Safe Monitoring and Human-in-the-Loop Response Procedure |
| Input: sensor_type error_level sensor update timestamps RSSI level battery state pilot input Output: fail-safe response fault log entry pilot notification 1: Define Trigger_Error_Handler(sensor_type, error_level) 2: if error_level = FLIGHT_CRITICAL then 3: Request Pixhawk hardware-level fail-safe procedure 4: if localization is valid and the return path is verified as safe then 5: Request RTH through the Pixhawk fail-safe procedure 6: else 7: Request LAND or pilot-supervised landing 8: end if 9: Log flight-critical event 10: Notify operator of Pixhawk fail-safe response 11: Return fail-safe status 12: else if error_level = NAVIGATION_CRITICAL then 13: Request POSITION_HOLD or HOVER mode via MAVLink 14: Send SOS flag and sensor-specific error code through the communication layer 15: Log navigation-critical event 16: Initialize waiting timer t_wait ← 0 17: while t_wait < T_hover do 18: if pilot input = MANUAL_OVERRIDE then 19: Transfer control priority to pilot 20: break 21: end if 22: Wait for 1000 ms 23: Update t_wait ← t_wait + 1000 ms 24: end while 25: else if error_level = MISSION_CRITICAL then 26: Pause mission execution script 27: Log mission-critical event 28: Maintain flight stabilization through Pixhawk 29: Continue under degraded mission mode if allowed by the operator 30: end if |
4.6. Complementary PX4–Gazebo Simulation-Based Subsystem Evaluation
In addition to prototype evaluation and as complementary and repeatable support evidence to the obstacle-awareness and fail-safe functions, a simulation-based subsystem level evaluation has been implemented utilizing PX4 Software (v1.13.3)-in-The-Loop together with Gazebo Harmonic. No effort has been spent to copy any of the already carried out flight tests with prototypes, nor to give similar, substitute measurements of navigation, communication, or energy experiments. Rather, the focus of simulation was directed at assessing the performance related to the horizontal and vertical proximity logic, six-sector lidar evaluation and velocity-restriction response, and sensor-data-watchdog logic.
4.6.1. Simulation Platform and UAV Model
The simulator environment was created using PX4 v1.17.0 in software-in-the-loop (SITL) and Gazebo Harmonic 8.14.0. A custom model of the S550 Hexa-X was made to represent the physical UAV platform described in Section 3.2. The total mass of the simulated aircraft was about 2.805 kg, and the model included six motor-propeller units in a hexacopter configuration. A customized PX4 airframe for this model was set up; the flight controller, vehicle dynamics, sensor outputs, and offboard velocity commands were all executed in SITL. For the ceiling-approach, six-sector ranging, floor-approach, and wall-approach scenarios, specific worlds were set up in Gazebo. The custom S550 Hexa-X model and the Gazebo environments used for the horizontal, six-sector, and vertical evaluation scenarios are shown in Figure 5.
Figure 5.
PX4–Gazebo simulation platform and evaluation environments: (a) custom S550 Hexa-X simulation model; (b) horizontal wall-approach environment; (c) six-sector LiDAR validation environment; and (d) ceiling- and floor-approach environment used for vertical proximity evaluation.
4.6.2. Sensor Models and Safety Parameters
The horizontal perception channel was represented by a simulated 360° LiDAR sensor. This had 800 range samples per scan over a scan angle range of −π to +π, which made a 10 Hz acquisition rate. The measurement range of the LiDAR was between 0.15 m and 12.0 m. Gaussian range noise was incorporated with a standard deviation of 0.01 m. A 0.30 m software-based self-masking procedure was performed during range processing in order to eliminate features originating from the body of the simulated vehicle.
For the upward and downward movements, simulated range sensors were ideally constructed as equivalent to the ultrasonic sensor. The upward sensor pointed along the positive vertical direction of the vehicle and the downward sensor toward the ground. Both sensors had a small multi-ray field of vision (FoV), measured data at 20 Hz with a range of 0.05–5.0 m, and recorded measurements with added Gaussian noise with a standard deviation of 0.005 m. The models of these distance sensors were applied to tests on direction-dependent proximity thresholds, restriction of vertical motion, and detection of stale data. We did not attempt to replicate the behavior of physical ultrasonic sensors concerning propeller-wash interference, surface-dependent reflections, or signal attenuation based on material properties.
The limits for obstacle distance-space boundaries include a horizontal obstacle distance threshold set to 1.5 m as well as upward and downward obstacle range limits set to 1.0 m, based on the safety logic mentioned in Section 4.1.2 and Section 4.5. The staleness criteria were set to 350 ms and 120 ms for the LiDAR and upward & downward range channels, respectively. On occurrence of a proximity condition or a staleness situation, the commanded actual velocity in the corresponding direction was replaced by a zero-velocity command. In order to maintain a stable vehicle while preventing it from motion toward the detected obstacle, only those commands are substituted with zeros whose existence triggered a safety condition.
4.6.3. Simulation Scenarios and Repeated Trials
In order to measure the performance of the horizontal collision-avoidance behavior, wall-approaching runs were executed at forward velocities of 0.25, 0.5, and 0.75 m/s. For each velocity, 5 trials were executed, so a total of 15 horizontal approaching experiments were logged. The data that were logged for each test run consisted of: measured forward speed, distance at threshold trigger, minimum clearance, closure after threshold, stopping distance, stopping time, maximum LiDAR message age, watchdog status, and collision status. The six-sector LiDAR method was tested with six targets positioned in the six sectors: front, front right, rear right, rear, rear left, and front left. The simulation was run five times independently. Excluding the very initial transient data captured, 100 reliable scans per sector were collected from each repetition to yield 500 measurements per sector and 3000 sector measurements total. These data were treated as repeated range measurements rather than 3000 statistically independent trials due to the temporal correlation between successive LiDAR scans.
The vertical safety behavior was assessed independently for upward and downward directions. In ceiling-approach trials, the vehicle moved upward at a commanded speed of 0.25 m/s until the upward range was detected when passing the threshold distance of 1.0 m. Similarly, for floor-approach trials, the vehicle moved downward at a commanded speed of 0.25 m/s until the downward range was detected when passing the threshold distance of 1.0 m. For each direction, five runs were repeated to provide five ceiling-approach trials and five floor-approach trials.
4.6.4. Stale-Data Injection and Evaluation Metrics
Sensor data loss events were simulated by simply not reading any incoming range measurement, keeping the previous one indefinitely. In order to do this, the most recent valid measurement from the sensor in question would effectively never change in the face of this synthetic failure, but the rest of the control system (the vehicle itself and the controller’s logic loop) could continue running as if they were reading data normally from the faulty system. Specifically, five stale-data tests were simulated using the 350 ms horizontal watchdogs, along with five tests for each of the 120 ms vertical watchdogs on the upward and downward channels, respectively. In every simulated case, the synthetic error was inserted prior to the proximity threshold. This allows the watchdog behavior to be observed separately from the standard behavior when obstacles trigger a response normally. For the approach tests, performance metrics used were measured velocity just before activation, distance to trigger activation, minimum simulated clearance, additional closure after activation, stopping time, and position-based stopping distance. For the watchdog evaluation, the performance metrics were age of last accepted range message at activation, the distance travelled between the last measurement and watchdog activation, stopping time after activation, and additional vehicle displacement until satisfying the stopping criterion. The stopping criterion was defined as an absolute value of velocity below 0.05 m/s over five consecutive control samples. After the synthetic data freeze, this recorded range value would be left stale as intended. For this reason, values after the fault were not treated as new sensor measurements. When it was necessary, they were inferred using the last available valid range, combined with a delta in the local position update of PX4. Repeated-run data were documented via the arithmetic mean and standard deviation of the samples.
The principal simulation parameters, safety settings, and repeated-test scenarios are summarized in Table 4.
Table 4.
PX4–Gazebo simulation configuration and test matrix.
5. Prototype-Based and Simulation-Based Evaluation
The assessment consisted of observations on the prototype-based proof-of-concept in conjunction with a complementary simulation study based on PX4-Gazebo. The proof-of-concept segment demonstrated the combined navigation, communication, avionics-based energy-management, and mission-continuity architecture under similar controlled environments to those outlined in subsequent sections. The simulation segment yielded subsystem-demonstrated, repeatable responses to such scenarios; e.g., horizontal object detection, six-sector LiDAR scan, vertical proximity assurance, velocity-restriction responses, and handling of stale-sensor values. Data from the simulation were assessed independently from the prototype proof-of-concept navigation, communication, and energy/mission-continuity segments, rather than serving as replacement evidence thereof.
5.1. Prototype-Based Experimental Setup and Performance Metrics
The experimental testing was performed within two distinct test environments. Firstly, an indoor GPS-denied test environment and secondly, a reference outdoor environment. The indoor test area comprised approximately 100 m2 of corridor and rooms featuring wall panels and columns, along with confined turning areas providing confined indoor geometry representative of selected spatial constraints relevant to structural inspection. Reinforcement density, wall-specific RF attenuation, multipath characteristics, and surface-texture effects on optical-flow performance were not independently quantified in this environment. The testing in the indoor area was designed to understand the performance of the RPLIDAR A1M8/HC-SR04/PMW3901 sensing pipeline in a GPS-denied setting. Outdoor reference trials were carried out in open space in order to assess the communication performance of the Wi-Fi and 433 MHz links, and also to evaluate general flight performance in relation to environmental disturbance (wind). These trials were not considered to be structural inspection experiments; they were designed to provide outdoor reference conditions for the trials in the limited indoor space. A representative prototype flight in the controlled indoor GPS-denied test environment used for the proof-of-concept evaluation is shown in Figure 6.
Figure 6.
Representative prototype flight in the controlled indoor GPS-denied test environment used for the proof-of-concept evaluation.
Our ground station software was implemented on a high-powered laptop to provide us with both a central interface to control the system and a central place to store all data recorded by our systems. We comprised a set of software components which include: a Mosquito-based MQTT broker to support rapid data transport; a mission logging database written with an SQLite backend and a custom-built Python (version 3.11)/Qt-based control and operator interface. In addition to this, we use network analysis tools to log and capture every transmitted and received packet to allow us to analyze their contents, timing, and transmission characteristics. In order to compare the performance of our prototype in our two test scenarios, we recorded quantitative performance metrics using a collection of data collected over 10 indoor and 10 outdoor test flights, for a total of 20 physical flight sessions, and presented the recorded quantities using the mean and standard deviation. Evaluation of navigation performance is achieved through comparison of the EKF position estimate reported by our Raspberry Pi with the actual position reported by a ground-based laser Total Station. The navigation performance measures were horizontal RMSE, vertical RMSE, and horizontal drift rate.
The horizontal RMSE for each flight session was calculated as follows:
The vertical RMSE for each flight session was calculated as follows:
In Equations (9) and (10), denotes the flight session, represents the number of temporally matched samples in that session, and denotes the sample index. The terms , and represent the position estimates produced by the EKF, whereas , and represent the corresponding total-station ground-truth measurements. The RMSE values were calculated separately for each of the 10 flight sessions, and Table 5 reports the mean and standard deviation across these sessions.
Table 5.
Navigation performance comparison under tested GPS-denied conditions.
Performance of communications was determined through packet loss rate, end-to-end latency, and the behavior of the selective repeat ARQ protocol that operated across both the Wi-Fi/MQTT and 433 MHz telemetry channels. The power-consumption values for the Pixhawk PX4 power module were logged using MAVLink through repetitive ground testing with propulsion disabled. In such a case, the current logged by the module was exclusively attributed to the non-propulsion onboard electronic loads, which included the Raspberry Pi 4, the Pixhawk flight controller, the RPLIDAR A1M8, the telemetry units, camera, built-in sensors, as well as the idle draw of the rest of powered electronics. Thus, they must be interpreted as propulsion-disabled on-board-electronics measurements instead of total in-flight power consumption values for the UAV. Database-level mission continuity was examined through a scripted fragmented-session scenario involving shared Mission_ID values, distinct Drone_ID values, mission_state transfer, and chronological record merging. These tests focused on three areas: Mission_ID synchronization, SQLite-based data storage, and chronological merging of all records collected by either multiple platforms or sessions. Overall, the experimental design was intended to yield an initial indication of how well the prototype performed and behaved when integrated into these specific environments. Detailed performance results for each area of interest include navigation, communications, avionics-side power consumption, and continuity of mission, which are detailed below in the following subsections.
5.2. Navigation Performance
The navigation performance of the prototype under GPS-denied conditions was evaluated by comparing the EKF-based position estimates with ground-truth position measurements acquired using a laser-based total station in the controlled indoor test environment described in Section 5.1. UAV-side sensor and state-estimation records were timestamped with millisecond precision using the ground-station-referenced synchronization procedure. For each of the 10 flight sessions, the EKF-based estimates were compared with the corresponding total-station reference measurements. Navigation accuracy was quantified using the horizontal and vertical RMSE definitions given in Equations (9) and (10), together with the horizontal drift rate. The navigation results are summarized in Table 5.
In the IMU-and-barometer configuration, the largest positioning error with respect to the tested conditions was found with a horizontal RMSE of 2.54 ± 0.42 m and a horizontal drift rate of 1.20 ± 0.25 m/min. By fusing IMU, barometer, and PMW3901 optical-flow information, the horizontal RMSE was further improved to 0.85 ± 0.14 m, while the horizontal drift rate decreased to 0.45 ± 0.08 m/min. The data demonstrated that information derived from relative motion via optical flow successfully reduced horizontal drift in the given GPS-denied test conditions. The best results among the configurations investigated were found with the proposed multimodal system, achieving horizontal RMSE values of 0.32 ± 0.04 m and horizontal drift rates of 0.10 ± 0.02 m/min. With regard to the IMU + Optical Flow setup, this translated to a 62.4% reduction in horizontal RMSE, a 58.3% reduction in vertical RMSE, and a 77.8% reduction in horizontal drift rate; with respect to the IMU-and-barometer setup, the drift rate improvement was 91.7%. It should be highlighted that these results were gathered within a specifically created and controlled environment used for the proof-of-concept demonstration of our proposed approach, rather than a demonstration of a fully autonomous positioning system capable of real-world absolute localization. The IMU-and-barometer configuration is retained as a weak inertial reference, whereas the IMU + Optical Flow configuration provides the stronger low-cost comparator in the present evaluation.
The data collected for vertical placement should be viewed in combination with the limitations of the HC-SR04 ultrasonic sensor technology. While the sensors are capable of measuring distances up to approximately 4 m, they performed reliably at distances of approximately 1.0–1.5 m due to interference generated by the hexacopter’s acoustic noise and propwash. Due to these factors, the use of the ultrasonic sensors was viewed as auxiliary proximity inputs and not relied upon as a main reference input for altitude, especially outside the low-altitude operating range. In addition, the LiDAR processing algorithm used sector masking to help eliminate false detection related to the UAV landing gear. Sector masking prevented self-structure reflection of the landing gear as objects in the environment were detected while performing horizontal scans. Overall, the navigation data are indicative of the potential for supporting relative positioning and hovering assistance using a low-cost EKF-based relative-state-estimation method in GPS-denied indoor settings.
5.3. Communication Performance
The hybrid communication layer was then tested under both physical (test environment) and electromagnetic (radiated signal) constraints to assess the behavior of a hybrid communication layer in a controlled indoor environment. For purposes of link analysis, attention was given to the behavior of the Wi-Fi/MQTT communication in supporting high-volume structural data transmission, the behavior of the 433 MHz telemetry link for transmitting critical real-time mission data and compressed preview images, and the behavior of the 915 MHz telemetry link for transmitting configuration and maintenance messages. Average end-to-end latency, packet loss rate, and effective throughput were the three link performance metrics selected for examination across the indoor and outdoor reference flight sessions. Communication results can be viewed in Table 6 below.
Table 6.
Communication channel performance under evaluated conditions.
Table 6 shows that while the Wi-Fi/MQTT connection has the highest effective throughput under stable link conditions, the average latency is 45 ± 14 ms, and there is an approximate throughput is about 5 Mbps. This link can provide the best method for transferring high-volume data like JPEG images and log files if the UAV remains within its optimal operational communication zone. However, during the evaluated indoor operations, Wi-Fi link quality could decrease, which may periodically reduce the RSSI to below the defined level of r_wifi = −75 dBm. When this occurs, the system will temporarily suspend high-volume Wi-Fi transfers and direct all critical communications to the telemetry layer.
The 433 MHz telemetry channel has both a longer latency and lower throughput than the Wi-Fi/MQTT link, with an average latency of 120 ± 18 ms and an approximate throughput of 15 kbps. This bandwidth is insufficient to continuously transmit full-resolution images. However, the bandwidth does support critical telemetry, alarm functions, compact state packets, and compressed AVIF thumbnails. Before selective-repeat ARQ was applied, the packet loss rate on the 433 MHz channel was approximately 5%. After CRC32-based verification and selective-repeat retransmission were applied, the effective packet loss rate decreased to 0.5 ± 0.1% under the evaluated link conditions. This result indicates that the application-layer recovery mechanism improved the delivery of fragmented telemetry and preview data, although it does not eliminate packet loss or replace the need for local storage. The 915 MHz telemetry channel was evaluated as a separate maintenance and configuration path rather than as a primary mission-data channel. It showed an average latency of 90 ± 12 ms and a packet loss rate of 0.8 ± 0.2% under the tested conditions. Its separation from mission traffic allowed configuration and direct flight-controller access to remain independent from high-volume mission-data routing. Therefore, the role of the 915 MHz channel should be interpreted as operational separation rather than as a redundant broadband communication path.
The AVIF thumbnail mechanism contributed to operator awareness when Wi-Fi connectivity was degraded. In such cases, the system did not attempt to transmit full-resolution structural imagery over the 433 MHz link. Instead, the Raspberry Pi generated grayscale thumbnails and transmitted them as constrained-link previews, while full-resolution images were stored in the local file system, and their paths, metadata, and transfer status were recorded in SQLite for later synchronization. Overall, the communication results provide an initial indication that the hybrid communication architecture can support mission-state awareness and data recovery under constrained indoor link conditions. However, the findings should be interpreted within the evaluated test environment and should not be generalized as full communication reliability in all reinforced-concrete structures.
5.4. Avionics-Side Power Consumption
The influence of the Energy-Aware Mission Manager on the prototype power budget was evaluated by measuring the current draw and power consumption of the avionics payload. This payload includes the Raspberry Pi 4 mission computer, RPLIDAR A1M8, telemetry modules, and the integrated sensor suite. The influence of the Energy-Aware Mission Manager was evaluated by recording current measurements from the Pixhawk PX4 power module during propulsion-disabled ground tests. The measured load included the Raspberry Pi 4 mission computer, Pixhawk flight controller, RPLIDAR A1M8, telemetry modules, camera, and integrated sensor suite. The brushless DC propulsion motors were not operated during these measurements. Therefore, the results represent the power demand of the powered onboard electronic systems under the evaluated ground-test conditions and should not be interpreted as total in-flight UAV power consumption or as a direct improvement in flight endurance. Therefore, the results should be interpreted as avionics-side energy consumption rather than total UAV energy consumption or direct flight-endurance improvement. The purpose of this evaluation was to examine whether the proposed software- and hardware-level power-management strategies could reduce the additional energy demand introduced by onboard edge computing, sensing, and communication. These two operating modes were tested over 10 repeat passes of ground-based measurements for each configuration. The first one is referred to as “Optimizations Disabled” or “Baseline”, where the Raspberry Pi 4 runs with the performance governor at 1.5 GHz (and therefore always uses fixed maximum CPU frequency), the RPLIDAR A1M8 motor is constantly powered, and the Wi-Fi module remains enabled no matter what the connection quality is. The second one is called “Optimizations Active” or “Energy Aware”. In this mode, the system is using the cpufreq powersave profile (at 600 MHz) if there is little load on it; MOSFET-based peripheral power gating is activated; the LiDAR motor is deactivated when the drone is in a “safe zone” and does not require a complete scan; the store-and-forward mechanism for high-volume transmissions is triggered when the received signal strength indicator (RSSI) falls under −75 dBm. The measured avionics-side current and power values for these modes are summarized in Table 7.
Table 7.
Impact of energy-aware operation on propulsion-disabled onboard-electronics power consumption.
According to the data shown in Table 7, avionics current consumption was reduced from 1.35 ± 0.05 A to 0.51 ± 0.03 A when energy-aware operation was employed. This corresponds to a reduction in avionics power consumption from approximately 15.0 ± 0.6 W to 5.7 ± 0.4 W at the nominal 11.1 V supply level. This indicates a 62.0% reduction for the measured avionics payload when the described energy-aware operating modes were active under the tested operating conditions. The current measurements have been recorded from the Pixhawk PX4 power module tied to the main electrical system with propulsion motors disabled. Therefore, these results refer to a propulsion-disabled onboard electronics consumption for the configuration as presented rather than measuring the power consumption of a separated electrical system. We calculated the avionics-side power consumption from the measured avionics current and the nominal 11.1 V supply; thus, the presented power values represent estimates based on the nominal voltage rather than time-resolved measurements of instantaneous electrical power. The total measured reduction was the result of the combined operation of the CPU-frequency scaling scheme, peripheral and LiDAR power management, and the store-and-forward scheme. Because we did not separate the effect of each operating scheme, we were not able to measure the individual contribution of each one to the total reduction. In the first place, DVFS reduced the operating frequency of the Raspberry Pi 4 when the computational load was low, rather than keeping the mission computer continuously in the “performance” state.
Secondly, LiDAR motor control and peripheral power gating reduced the power consumed by components when they were not required during different stages of the mission, thereby reducing unnecessary sensor-side power consumption.
Thirdly, our store-and-forward strategy reduced repeated high-volume Wi-Fi transmission attempts when the communication link was weak by storing data locally in SQLite until a stronger connection became available.
These findings suggest that the Energy-Aware Mission Manager reduced the additional avionics-side power load incurred by the edge-computing and sensing layers. The 62.0% reduction is not a direct increase in flight time, as this measurement did not include propulsion power, which represents by far the largest share of the UAV’s energy use. This is, however, a first indication that avionics-level power management may decrease the secondary onboard energy consumption in specific situations. In order to establish the relationship between the above-mentioned reduction in avionics and the overall electrical power requirement of the complete aircraft, a second reference calculation has been performed with respect to the prototype takeoff weight and the closest published test value of the XA2212 980 KV motor [36]—as presented in Table 8. However, this reference calculation cannot be taken as the propulsion data in flight because the published test of the motor was conducted using an APC 10 × 4.7 propeller, while the prototype uses 10 × 4.5-inch propellers.
Table 8.
Propulsion-inclusive reference power-budget estimate.
In terms of the reference calculation, the roughly 15.0 W avionics load accounts for about 3.2% of the total 471 W reference power requirement. In turn, bringing down the avionics load to 5.7 W equates to a roughly 2.0% reduction in the total reference power requirement. With the assumption that the battery energy available and the propulsion requirement remain constant, this means there will be only roughly a 2.0% increase in endurance, not a 62.0% increase in flight time. The evaluated energy-management modes did not include trajectory or route optimization, and route distance and mission duration were therefore not treated as optimization variables in this comparison.
5.5. Scripted Mission-Continuity Demonstration
The need for multiple flight sessions may arise during large-scale structural inspections when the inspection area exceeds the endurance available from a single battery charge. To evaluate the database-level approach to mission continuity across multiple flights, a scripted 10-story inspection scenario was executed as two separate mission segments. The use case does not include the actual on-board visual inspection of a 10-story building; instead, it uses two separate inspection flights and determines if the records created from the separately operated segments can be associated with a shared mission and appended to form a continuous inspection data set. Records within the first mission flight correspond to the physical inspection of floors 1–5 and are recorded with Drone_ID 1. When the battery was at the predetermined capacity of 20% remaining, the mission state was saved in the mission_state table, including currentfloor (coverage), currenthandoff (logical point for handoff), currentsensors (active set), and recordtransferstatus. The first flight was ended and completed. A demonstration was performed using two physically separate UAV platforms which were operated in turn under the same Mission_ID. The platforms were not run concurrently and were not demonstrating any kind of autonomous swarm control.
The second physical UAV that had the Drone_ID specified by the ID field in the data payload was tied to the same Mission_ID as the previous entry through the ground-station interface. The mission_state information was retrieved, and the second segment was started from the logical continuation point from the first segment. Records created during this second segment reflect coverage from floors six to ten. The continuation was initiated by the operator on the database and mission-management interface, not automatically in flight. Once each of the segments had been completed, the data generated in both was collected at the ground station under a common Mission_ID, with Drone_ID identifying the platform/session that created the records, timestamps ensuring their correct sequence and mission_state indicating the coverage status of the recorded segment and whether a continuation point was recorded within it. The configuration for this scripted demonstration is provided in Table 9.
Table 9.
Configuration of the scripted database-level mission-continuity demonstration.
The script run indicated that records produced from distinct mission segments were connectable via a common Mission_ID and could be sorted chronologically at the ground station. Drone_ID allowed individual record ownership to be established to the originating UAV or session, whereas mission_state retained the logical continuation point, coverage status, and currently used sensor type. Image data stayed in the local file system with only their associated path, time stamp, metadata, and transfer status stored in SQLite. For the communication loss during the run, those records not successfully sent from the UAV were left locally until connectivity resumed. After which the ground station synced up with the UAV to get any missing files; all records successfully uploaded were set to a sent status. Merging of the output was also preserved for both mission segments in their original temporal order. In effect, it became possible to create a mission report composed of data from the distinct mission segments. This illustrates the correct functioning of a mission-continuity method at the database level, although it does not address testing for autonomous multi-UAV coordination or the physical scanning of a 10-story building.
5.6. Simulation-Based Subsystem Evaluation
The verification and validation data for the complementary simulation are separate from the results for navigation, communication, and energy, based on data from prototype hardware and mission continuity. The areas investigated were: horizontal wall-approach responses at three commanded velocities, LiDAR stale-data detection, six-sector range processing, upward proximity protection, downward proximity protection, and stale-data responses from the upward and downward range channels. The complementary simulation data detailed below were obtained for the flight configurations and repeated-test methods outlined in Section 4.6.
5.6.1. Horizontal Collision-Avoidance and LiDAR Watchdog Results
All 15-horizontal wall-approach trials showed successful stopping responses without crashing or unforeseen watchdog engagements. We see increases in measured approach velocity, post-threshold additional closure, as well as increasing stopping time with increasing commanded velocity. At commanded velocities of 0.25, 0.50, and 0.75 m s−1, the measured velocities were 0.251 ± 0.002, 0.516 ± 0.003, and 0.780 ± 0.004 m s−1, and the corresponding minimum distances to the obstacle were 1.300 ± 0.019, 1.091 ± 0.022, and 0.840 ± 0.017 m, respectively. The closest approach any of the stops made to the obstacle during an individual run was 0.816 m.
The setpoint for LiDAR was set to 1.5 m, and mean trigger distances close to this were observed for all of the approach velocities tested. The trigger distances observed were 1.487 ± 0.008 m, 1.462 ± 0.013 m, and 1.441 ± 0.013 m for approach commands of 0.25, 0.50, and 0.75 m/s, respectively. Post-trigger closure increased from 0.188 ± 0.014 m at 0.25 m/s to 0.371 ± 0.010 m at 0.50 m/s and 0.600 ± 0.028 m at 0.75 m/s. Associated stop times were 0.931 ± 0.025 s, 1.194 ± 0.030 s, and 1.370 ± 0.069 s, and the position-based stop distances were 0.134 ± 0.016 m, 0.299 ± 0.024 m, and 0.447 ± 0.023 m.
In all five of the LiDAR stale-data trials, synthetic ranges were artificially held static as the vehicle traveled to the wall at a commanded velocity of 0.35 m/s. The watchdog (rated to expire at 350 ms) triggered upon the arrival of the LiDAR message at an age of 371.1 ± 14.9 ms, or 21.1 ± 14.9 ms past its configured delay. The measured horizontal speed of the vehicle when it was triggered was 0.359 ± 0.007 m/s. From the last good measurement from the LiDAR sensor to the watchdog trigger, the vehicle covered a distance of 0.124 ± 0.008 m. The stopping distance from the point at which the watchdog triggered to when the vehicle came to a halt was 0.193 ± 0.008 m. The vehicle was brought to a stop within a time interval from the watchdog trigger of 1.082 ± 0.043 s. The total traveling distance from the first stale LiDAR data point to a full stop was 0.317 ± 0.013 m. In all trials, the watchdog successfully caught the stale LiDAR data set and triggered a halt without incident. The horizontal approach behavior, clearance reduction with increasing velocity, post-trigger closure, and LiDAR stale-data response are presented in Figure 7.
Figure 7.
Horizontal collision-avoidance and LiDAR stale-data watchdog results: (a) representative front-sector distance traces at commanded velocities of 0.25, 0.50, and 0.75 m/s; (b) minimum obstacle clearance at each commanded velocity; (c) additional closure after threshold activation; and (d) LiDAR-message age during the injected stale-data trials. The dashed lines indicate the configured safety or watchdog thresholds.
5.6.2. Six-Sector LiDAR Validation
The LiDAR validation involving six sectors yielded consistent range estimates in the front, front-right, rear-right, rear, rear-left, and front-left directions. Five simulations were carried out, and a total of 500 observations per sector were taken, which gave a total of 3000 sector-wise observations. For all six sectors, the overall mean absolute error was 0.0285 m, the root-mean-square error was 0.0344 m, and the mean bias was −0.0169 m. The negative bias in this case shows that the LiDAR simulation generally underestimated the distance, providing conservative estimates. The measured mean ranges for 1.20, 1.50, 1.80, 2.10, 2.40, and 2.70 m reference distances were 1.168 ± 0.025, 1.469 ± 0.029, 1.784 ± 0.027, 2.097 ± 0.026, 2.397 ± 0.030, and 2.684 ± 0.027 m, respectively. The maximum error for a single measurement was 0.092 m, and all 3000 observations fell within ±0.15 m of the reference distances. No misclassification of sectors was made during the five simulation runs. The test geometry, expected vs. measured ranges, and sectorwise errors are shown in Figure 8.
Figure 8.
Six-sector LiDAR validation: (a) placement of the static reference targets around the simulated UAV; (b) comparison between the reference and measured sector distances; and (c) sector-level measurement errors. The results were obtained from five simulation runs with 500 retained measurements per sector.
5.6.3. Vertical Proximity and Range-Watchdog Results
Upward and downward proximity responses were tested in five trials to approach the ceiling and five trials to approach the floor. In each of these trials, the threshold of 1.0 m restricted the vehicle from making any further progress without collision or unexpected watchdog activation. The actual measured velocities during ascent and descent were 0.242 ± 0.010 m/s upward and 0.281 ± 0.012 m/s downward. When approaching the ceiling, the upward channel was activated at 0.996 ± 0.003 m, the minimum ceiling clearance recorded was 0.881 ± 0.069 m, and an additional closure of 0.115 ± 0.066 m was observed.
The stopping time was 0.276 ± 0.028 s, and the positional stopping distance was 0.043 ± 0.010 m. When approaching the floor, the downward channel was activated at 0.991 ± 0.006 m. The minimum floor clearance was 0.950 ± 0.011 m, and the additional closure distance, stopping time, and positional stopping distance were 0.041 ± 0.013 m, 0.257 ± 0.001 s, and 0.027 ± 0.010 m, respectively. All five upward and five downward stale-data trials also successfully elicited a response from the watchdog before approaching the normal proximity limit. Given a stale data period of 120 ms, the upward watchdog was activated at a message age of 145.9 ± 21.4 ms, whereas the downward watchdog was activated at 152.6 ± 12.7 ms. The corresponding upward and downward speeds of the vehicle at activation were 0.245 ± 0.004 m/s and 0.300 ± 0.015 m/s, with consequent stopping times of 0.308 ± 0.001 s in either direction and positional stopping distances of 0.044 ± 0.005 m and 0.026 ± 0.012 m, respectively. All watchdog trials were performed with no collision. The post-fault clearance estimates were derived from the final valid range data and the change in the PX4 local position after activation; since the range value itself remained stale after synthetic data freezing, these estimates calculated the relative vehicle displacement rather than treating the stale signals as fresh range measurements. The two different types of vertical vehicle responses are summarized graphically in Figure 9.
Figure 9.
Vertical proximity and range-watchdog evaluation: (a) upward range response during the five ceiling-approach trials; (b) downward range response during the five floor-approach trials; (c) upward-channel range-message age following synthetic data freezing; and (d) downward-channel range-message age following synthetic data freezing. Dashed lines indicate the configured 1.0 m proximity threshold or 120 ms stale-data limit.
6. Discussion
Taken together, the combined prototype and simulation-based evidence presented allow for a discussion about the real-world applicability of the described UAV design for inspection in GPS-denied environments. While it is prudent to avoid the characterization of the current prototype as a “fully tested autonomous inspection system,” the observations may be regarded as supportive but separate sets of evidence arising from laboratory conditions and a simulated environment, respectively. Navigation, communications, avionics-side energy management, and database mission continuity have been explored through prototype-based experiments, and horizontal obstacle avoidance, six-sector LiDAR interpretation, vertical separation guarding, velocity limitation responses, and stale sensor data management have been illustrated via PX4 and Gazebo-based tests. The following chapter extrapolates on the implications of these different test observations within the scope and limitations of their respective environments.
6.1. Interpretation of the Experimental Results
The preliminary findings from experiments suggest that the dual-layer system can support semi-autonomous structural monitoring in GPS-denied indoor environments using lower-cost hardware. Separating low-level flight stability (i.e., stabilization and configured flight-control response) from higher levels of mission processing (e.g., monitoring, decision making) has been demonstrated to be a viable approach for reducing interactions between critical flight control processes and computing-intensive edge-processing applications. Within this layered approach, the primary function of the Pixhawk PX4 remains that of stabilization and configured flight-control response, while the mission-level processing, monitoring, and decision-support functions are performed by the Raspberry Pi 4. In terms of navigation performance, the multisensor configuration incorporating RPLIDAR A1M8, PMW3901 optical flow, and HC-SR04 ultrasonic sensors resulted in both lower horizontal position errors and reduced drift relative to both tested comparison configurations under the conditions studied. The observed horizontal RMSE of 0.32 ± 0.04 m and drift rate of 0.10 ± 0.02 m/min suggest that the integration of relative velocity and distance measurements can support hover assistance and low-speed relative positioning in GPS-denied environments. Relative to the IMU + Optical Flow configuration, the proposed configuration reduced horizontal RMSE by approximately 62.4%, vertical RMSE by 58.3%, and horizontal drift rate by 77.8% under the evaluated conditions. Nevertheless, the given setup does not comprise the full autonomous navigation system nor a universal absolute positioning tool. The readings of the HC-SR04 must also be considered, given their detected range during flights. The interference produced by the noise (acoustic noise and propwash) limited the range to ~ 1–1.5 m so that it was useful for auxiliary range readings at low altitudes and for vertical safety checks, rather than as a primary source of three-dimensional localization. Ultimately, it should be thought of as a supplementary distance-checking tool in vertical and low-level safety roles and not as a primary source of in-depth 3D location information.
The communication results indicate that the hybrid communication layer provided different roles for different link conditions. The Wi-Fi/MQTT channel was able to support high-volume data transfers as long as the link quality was adequate. Indoor structural conditions decreased the observed Wi-Fi link quality, resulting in less reliable continuous broadband transmissions. The 433 MHz telemetry link, under degraded Wi-Fi conditions, supplied a very restricted but still usable bandwidth for critical telemetry data, alarm signals, compact state information, and AVIF-compressed grayscale previews of camera feeds. It should never be considered as an alternative method of transmitting full resolution images. Rather, it is a low-bandwidth failover path that will allow operator awareness to remain when the Wi-Fi channel is either unavailable or unstable. The reduction in effective packet loss after CRC32 verification and selective-repeat ARQ indicates that the application-layer recovery mechanism improved data recovery under the evaluated link conditions, although it does not guarantee complete data integrity in all reinforced-concrete environments.
The energy results should also be interpreted within their measurement scope. The reported 62.0% reduction refers only to avionics-side current and power consumption, decreasing from approximately 15.0 W to 5.7 W under the tested operating conditions. This reduction was associated with the Energy-Aware Mission Manager, particularly DVFS-based CPU frequency scaling, LiDAR motor control, peripheral power gating, and store-and-forward transmission. However, this value should not be interpreted as a proportional increase in total flight endurance, since propulsion power was not included in the measurement and remains the dominant component of the UAV energy budget. The result therefore indicates that avionics-level optimization can reduce secondary onboard power demand, not that the complete UAV energy system was optimized by the same percentage. The propulsion-inclusive reference estimate in Table 8 indicates that the corresponding total-power and theoretical endurance effects are on the order of approximately 2% under the stated assumptions. The multiple-UAV mission continuation scenario also shows how Mission_ID, Drone_ID, SQLite records of state, time stamps for synchronization of states, and mission-state tracking could provide a means to continue the mission at a database level over flight sessions that are broken up. A benefit of this organization was the ability to merge data collected from several UAVs or flight sessions in order to have one inspection dataset. However, we would like to emphasize that the mission-continuation mechanism is considered operator-supervised or semi-automatic, and not as completely automated swarm coordination. Likewise, we interpret the failsafe design as a layer-based response strategy; The low-level stabilization and configured fail-safe responses were provided by the Pixhawk PX4 (low level), while the mission-level monitoring, fault flags, and mode request functions were performed by the Raspberry Pi 4 (mission level). Therefore, under the evaluated conditions, the hierarchical nature of this system allowed for safer transition of the mission due to interrupted flight conditions, with pilot intervention possible when the system was operating in a degraded mode. The layered architectural design should not be understood as assurance of self-reconfiguration to recover from a fault or to provide collision avoidance. It supports layered fault monitoring, mode-request capability, and operator intervention capability under the degraded condition.
The horizontal simulation data reveal that the threshold of the 1.5 m LiDAR was successful in triggering the speed restriction at each of the three approach speeds, albeit with decreases in minimum clearance and an increase in post-trigger closure for the faster vehicles—as expected when a greater distance is needed to brake and reduce velocity post-threshold. All fifteen wall-approach runs resulted in zero collisions, in spite of the increased distance required to safely decelerate. The six-sector analysis confirmed the retention of the direction and relative distances of detected sector-based objects throughout the proposed approach, and reported a mean absolute error of 0.0285 m with a maximum single-measurement error of 0.092 m; none of the 3000 captured sectors were incorrectly detected or assigned to a non-existent sector. Similar findings were observed for both the upward- and downward-moving safety channels. The 1.0 m Proximity threshold prevented any additional movement to any of the five ceiling-approach and five floor-approach tests without resulting in a collision in any of the cases. Also, results of stale data tests confirm that the active velocity commands in the vertical directions are now set to zero when the age of the last approved range message passes 120 ms by means of the set stale-data limit. While our activation ages for the up and downward channels of 145.9 ± 21.4 ms and 152.6 ± 12.7 ms are not exactly 120 ms, the detection occurs upon the acquisition of the next control-loop Samples, as the command for that iteration has become a zero-velocity command and the data are beyond the stale threshold value. The LiDAR’s safety channel was activated 371.1 ± 14.9 ms. Its stale data limit is set at 350 ms. These results do confirm that the implemented stale data threshold and watchdog are active and responsive, but do not confirm the real physical sensor performance of the acoustic unit or validate the collision avoidance system with a physical airframe. All of the above suggest that what the current study contributes is mainly the experimental assessment of how the integration of the following functions works on the resource-limited UAV: navigation assistance, constrained link communication, energy management from the side of the avionics, mission continuity, and safety-related subsystems logic. The study does not introduce a new standalone localization, communication, or path planning algorithm but assesses their operation in the context of the proposed architecture.
6.2. Engineering Trade-Offs and Practical Constraints
The development of the proposed UAV prototype involved several engineering trade-offs shaped by the physical, computational, and communication constraints of reinforced-concrete environments. One of the main trade-offs concerns the use of low-cost sensing hardware for GPS-denied navigation. Instead of relying on high-end localization sensors or computationally intensive SLAM hardware, the prototype combines EKF-based relative-state estimation using optical-flow and flight-state information with LiDAR and ultrasonic proximity sensing. Under the tested indoor conditions, this configuration supported relative positioning with a horizontal RMSE of 0.32 ± 0.04 m. However, this result should be interpreted within the evaluated proof-of-concept scope. The use of low-cost sensors requires careful filtering, calibration, and sensor-role separation, particularly because the ultrasonic sensors were affected by propwash and acoustic interference beyond approximately 1.0–1.5 m.
The second trade-off involves utilizing edge computing on the Raspberry Pi 4. Processing onboard offloads the requirement of persistent broadband communication to allow the onboard system to conduct image compression, sensor interpretation, data recording, and mission decision support. At the expense, the mission computer and supporting sensing layer add avionics-side power requirements and system integration complexity to the UAV platform. The Energy-Aware Mission Manager used DVFS, LiDAR motor control, periphery power gating, and store-and-forward transmission to realize a 62.0% reduction in avionics-side power draw under the given operating conditions. It should be noted, however, that this power savings is not directly transferable to a proportionate increase in overall mission endurance, as propulsion is not contained within the avionics-side calculation and remains the predominant component of the UAV energy budget. Also, route length and duration could play a significantly larger role in the UAVs’ total energy usage since energy required for propulsion will play the dominant role in energy expenditure of the flight. In this study, different route planning approaches for achieving the same purpose were not considered. Thus, one should analyze the avionics-related energy usage separately from the energy savings that could be achieved by taking a different path.
The communications architecture compromises between the high data rate of structural interior throughput and robust propagation. For example, the use of Wi-Fi/MQTT works sufficiently for high throughput of data (such as structural images, logs). While Wi-Fi may suffer from signal loss or degradation in reinforced-concrete environments due to attenuation and multipath effects. Using a lower-bandwidth 433 MHz telemetry link is therefore a good alternative method of communication, which provides a robust link for sending small data rate commands (such as alerts, state packets, preview images which are AVIF compressed). However, it is not suitable to transfer high volumes of image data. The layered Pixhawk PX4 and Raspberry Pi 4 architecture also offers another valuable trade-off. By splitting the low-level stabilization from mission-level processing, there is reduced risk of mission computer computational latency affecting the responsiveness of the flight control system. However, this comes with the added complexities of integrating the two together through a combination of MAVLink communications, state synchronization, mode request handling, and interpretation of fault messages between the two systems. Likewise, the use of a simple binary obstacle flag and a HOVER/Position Hold request for interruption is chosen to bias toward an interrupted rather than sophisticated autonomous response to obstacle detection, and is suitable for an indoor prototype, although it is obviously a limit on the level of autonomous capability over that achieved by real-time path replanning.
The multi-sortie mission-continuity mechanism must be seen as a database-level continuity mechanism and not a complete self-directed distributed coordination algorithm. MissionID, DroneID, SQLite record data, timestamps, and mission_state make it possible to relate flights taken at different times for different drones into the same inspection task. The mechanism can be used for achieving the reporting continuity of inspection tasks in deployments that go beyond the range that can be covered by a single battery charge cycle. Even at the database level, there is a need for human intervention for mission continuation off using the global time reference from the base station, hence the justification for seeing this as an experimental platform which can test edge computing, sensor fusion, hybrid communications, and mission continuity under constrained reinforced-concrete inspection conditions.
Another trade-off involves interpreting the vertical sensing data. The physical prototype uses ultrasonic sensors whose beam propagation can be influenced by the propeller wash, other acoustic noises, angle of incidence on the target surface, material characteristics of the surface, and reflection coefficients. In contrast, the Gazebo up-down channels were idealized, ultrasonic-equivalent range sensors designed to explore the directional-thresholding capabilities, motions-denial response, and staleness logic. Accordingly, the uniformly reliable activation in Gazebo near 1.0 m should be understood as the verification of the implemented control software logic and not a physical validation for accurate operation range and sensitivity of the hardware sensors. Further analysis using physical testing is needed for vertical safety software to be used in real operations.
6.3. Scope and Limitations of the Prototype and Complementary Simulation Evaluations
However, the outcomes of this research need to be considered with respect to the scope limitations of prototype-based proof-of-concept validation. While the developed architecture gives some evidence on the feasibility of UAV-supported structural assessment in a GPS-denied setting, there are certain practical limitations. Indeed, the experiment was conducted in a controllable indoor corridor and room area of approximately 100 square meters. Although this area reproduced selected confined-space constraints relevant to indoor structural inspection, it could not reproduce the complexity of geometry, unexpected obstacles, dust, occlusions, or adverse atmosphere that can occur in post-disaster field tests. Furthermore, the prototype evaluation comprised 20 physical flight sessions in total, consisting of 10 indoor test flights and 10 outdoor reference flights. The navigation-performance results reported in Table 5 were obtained from the 10 indoor GPS-denied flight sessions. Hence, the localization, communication, and energy management results cannot be applied to any reinforced concrete structure until more testing is performed under various wall thicknesses, reinforcement levels, floor configurations, RF interference situations, low-texture surfaces, and different link-attenuation conditions.
The current results are therefore most likely to degrade under prolonged low-texture optical-flow conditions, severe wireless-link attenuation or interference, irregular obstacle geometries, and environmental conditions substantially different from the controlled test area. Moreover, the results obtained through navigation require cautious interpretation. This analysis takes into account the three configurations for navigation that were mentioned in Table 5. The alternative configuration with optical flow and rangefinder or monocular visual odometry was not analyzed during the prototype tests; thus, the findings should not be considered as proof of superiority of the analyzed configuration over those alternatives. Therefore, the configuration IMU + Optical Flow is a better low-cost option to compare against for analyzing the performance gain of the proposed configuration. The application of the Extended Kalman Filter to optical-flow and flight-state information, together with independent LiDAR and ultrasonic proximity sensing, contributed to better relative positioning capabilities in the tested indoor environment; however, the suggested architecture can hardly be considered an independent autonomous absolute navigation system. The HC-SR04 ultrasonic sensors had a specific limitation associated with the indoor environment, since the reliable range of operation was limited to about 1.0–1.5 m due to the acoustic noise and the air current produced by the hexacopter propulsion system. Acoustic measurement systems serve as an additional means of obtaining proximity data for vertical safety at low altitudes; however, due to the high thrust output provided by the rotors of the hexacopter, acoustic sensing is not applicable as a sole vertical navigation system. Communication, like any other component of the test setup, was affected by the testing environment as well as by the nature of the selected radio link. While the 433 MHz telemetry link suffered less from structural barriers in comparison to Wi-Fi, the limited bandwidth of only 250 kbps made this link appropriate solely for transmitting important telemetry data, state information, and AVIF thumbnails. Hence, it was impossible to transmit full-resolution images using this link. The real-time structural imaging still required a constant Wi-Fi/MQTT connection, which might not always be available while operating inside a reinforced-concrete building. Therefore, the hybrid communication layer should be viewed as a fallback strategy to manage data rather than a comprehensive remedy for indoor communication loss.
The 62.0% reduction in power consumption relates only to the current and power consumption of the avionics section; the scope of the evaluation is limited to the mission computer, sensors, LiDAR, and communication systems. Therefore, the aforementioned percentage does not imply a corresponding increase in flight time. Flight time still depends on the limitations of thrust, payload, the prototype’s 2805 g takeoff weight, and the 3S battery configuration. Furthermore, a multi-sortie mission continuity framework has been implemented at the database level; this framework utilizes mission ID synchronization, UAV ID tracking, and the storage of mission status timestamps in an SQLite database. This architecture ensures the logical continuity of segmented flight sessions, but the mission continuation process is still manually controlled by the operator. We should consider the multi-layer (safety-first) fault handling and decision support of the system as assisting in fault recovery rather than guaranteeing complete automatic recovery. Low-level stabilization and fail-safe settings still belong to the Pixhawk PX4, while the Raspberry Pi 4 provides system monitoring, fault reporting, and mode requests at the mission level. However, it will continue to rely on human supervision when the robot is indoors, because automated landing and avoidance may create more dangers in this situation. The structural defect diagnostic algorithm is not the focus and scope of this project’s validation. Therefore, future work is necessary to develop algorithms to automatically detect structural defects by exploiting AI technology. The limits above show the prototype system should be tested in various larger and uncontrolled surroundings before its operational status is realized.
Additional analysis was conducted via the “complementary” simulation, which was designed to give robust evidence at the sub-systems level, rather than being an attempt to re-create the experiments on the bench. As well as defining geometry, control inputs and flight boundaries, it replicated orientation and the range of set points, control and avionics actions of the main aircraft system, although by no means was all the mechanical and aerodynamic behaviors included. This includes dynamics of propellers, body and batteries and motor response, along with wind, communication link delays and errors. It is important not to therefore validate the real-world avionics energy consumption, communication, navigation accuracy, or mission assurance based on these simulation results. Repeated LiDAR readings collected in the six-sector test were temporally correlated; thus, they were processed and considered as repeated observations at the sector level rather than independent trials. During the stale-data tests, the last valid ranging readings remained unchanged even after the synthetic fault was created, whereas after-fault clearance values were estimated based on the last ranging information by taking into consideration the positional change derived from PX4. Based on the zero-velocity responses received under SITL, the effectiveness of the current threshold selection, directional limitation, and watchdog functionality is confirmed, but its entire performance for aircraft collision avoidance is far from demonstrated.
7. Conclusions and Future Research Directions
Within this project, a low-cost edge-computing architecture based on a UAV was developed and demonstrated that addressed GPS-denied, reinforced concrete-specific structural data acquisition. This prototype-based study addressed the aspects of embedded navigation, hybrid communication, avionics power, on-database mission recovery, and the fail-safe structural implementation on hardware under controlled environmental conditions. A concurrent PX4-Gazebo study addressed specific subsystems regarding planar obstacle detection, six-sectioned LiDAR detection, vertical proximity protection, stale data policy implementation, and was performed to supplement specific and repeatable, subsystem-level evidence of operation of certain components of the full UAV-stack in an experimental manner, to support those found within the other conducted research into structural inspection of buildings using UAVs. The principal findings from both of the above-mentioned, although complementary, evaluations are summarized in the following sections, which detail required further validation.
7.1. Main Conclusions
The current research has created and tested a hexacopter prototype with a low-cost structure that is able to collect data in reinforced concrete indoor environments where GPS signals are not available. The multi-tier design allows for separating the safety-critical aspects of flight control at the low level from mission control at the high level. The Pixhawk PX4 is responsible for the stabilization of the flight, while the Raspberry Pi 4 is responsible for mission-level sensor processing, communications, storage of data, and decision making. Considering the test environment, the introduced solution based on the EKF multimodal estimation technique outperformed both tested comparison configurations concerning the horizontal error and drift. However, the presented system should be seen as one that assists in relative navigation and obstacle awareness but cannot provide autonomous absolute localization of the object. The HC-SR04 ultrasonic sensors were utilized solely as vertical proximity sensing devices due to interference and propeller wash effects. Their operational distance was limited to 1.0–1.5 m.
This hybrid communication layer provided an interface for Wi-Fi/MQTT, 433 MHz telemetry, AVIF compressed previews, and CRC32-based verification, selective repeat ARQ, in order to sustain communication over link impairments. Wi-Fi/MQTT will be the preferred option to sustain a large amount of data on a good-quality link, whereas 433 MHz would take over for sensitive telemetry or for AVIF preview if the Wi-Fi quality was poor. From the communication results of this hybrid communication, one could suggest that the new approach of the new scheme offers better results for the data recovered in all environments studied; however, it is not guaranteed for data integrity within reinforced buildings.
The Energy Aware Mission Manager realized 62.0% savings in avionics-side energy consumption by using techniques like DVFS, LiDAR motor management, peripherals power gating, and store-and-forward data transfer. This reduction applies only to the measured mission-computer, sensing, LiDAR, and communication payload. That should not be interpreted as a similarly proportional increase in overall flight endurance, however, as power for propulsion was not considered in the calculation and remained the most energy-intensive part of the drone’s budget. The propulsion-inclusive reference calculation instead suggests an effect of approximately 2% on total power demand and theoretical endurance under the stated assumptions. The demonstration of mission continuity via script proves that mission records created using SQLite through distinct flight phases supervised by an operator can be tied together and unified based on time using Mission_ID, Drone_ID, timestamp, and mission_state information. The above is an illustration of continuity at the database level and not multi-UAV mission execution coordination. Following suit, the fail-safe design is best understood in the context of fault handling and decision making, where Pixhawk PX4 handles stability while Raspberry Pi 4 assists with monitoring the mission, flagging faults, and processing mode requests.
The complementary PX4-Gazebo study leveraged this simulation to add to the “prototype level” results, with more detailed scrutiny of several particular examples of both obstacle response and sensor failure at highly repeatable states. The flight simulation plan was the basis of 45 repeated flight trials, resulting in the acquisition of 3000 sector-level recordings, the retention of which comprised the data set. No collision was experienced in any of the 15 horizontal wall-approach flight trials, the 10 vertical proximity flight trials, or the 15 stale-data watchdog test flight trials. In the case of the six-sector approach trial, there were no false sector entries detected, and the mean absolute error was 0.0285 m. These data support the developed implementation of the proposed threshold logic, direction-processing, velocity-restriction, and stale-data response schemes at the sub-system level simulated. As such, these should be construed neither as complete hardware validation of autonomy-assisted obstacle avoidance, nor as a full hardware validation of the ultrasonic sensor’s acoustics.
7.2. Future Work
Future work should extend the evaluation of the proposed platform to larger and more diverse reinforced-concrete structures. Additional experiments with structures containing varying wall thicknesses, reinforcement densities, floor layouts, communication and RF-attenuation conditions would assist in determining if the findings of this research can be generalized across the navigation and communication systems. Semi-realistic inspection tests involving debris, occlusions, dust, low-texture surfaces, and irregular structural geometries to mimic post-disaster scenarios would enable an evaluation of how the system functions in a field environment versus controlled test conditions.
Further work should firstly transfer our complementary results to real and hardware-in-the-loop physical testing and validation. Similarly, consistent indoor flight tests should also look at horizontal and vertical obstacle responses for varying approach speeds and with realistic structural obstacles, and compare the stopping phenomenon observed with the PX4-Gazebo results. Physical ultrasonic sensor testing should focus on their response to propeller wash, their acoustic noise immunity, and varying angles to detect structures and differing materials. It is needed to identify if the current threshold and stale data responses on the physical drone remain reliable.
Improvements to GPS-denied navigation subsystems might include SLAM-enabled navigation and visual-inertial odometry with stereo vision [19,21]. Studies could also explore the use of odometry through LiDAR and optical flow or fusion between LiDAR, IMU, and RTK measurements [25,26]. Moreover, considering the problems associated with the use of ultrasonic sensors, there may be opportunities to incorporate other proximity sensors like Time-of-Flight sensors for increased safety with regard to altitude checks in future platform iterations. All suggested improvements should be analyzed under the limitations of the onboard mission computer. More research is needed in order to solve challenges concerning handovers and cooperation between multiple UAVs. Currently, mission continuation is performed on the database side and requires operator oversight. Possible areas of future research may include development of automatic handover routines while maintaining operator-in-the-loop safety, especially taking into account that indoor autonomous recovery and landing may involve additional risks.
Another important aspect of progress to be achieved within this project is the area of artificial-intelligence-assisted damage analysis. Currently, priority is given to data gathering, edge computing, communication control, and continuity of operation of the mission rather than complete validation of automated damage detection. Possible future directions may include using lightweight convolutional neural networks or other edge computing models for detection of defects on the surface of buildings [8,9]. Special approaches for crack detection and damage quantification can be explored using images acquired with the help of UAVs [15]. Recent studies in post-disaster damage assessment have shown that explainable ensemble learning techniques are suitable for the classification of multi-class structural damage. Recent explainable ensemble CNN methods may inform future ground-station damage-classification modules; however, their UAV-based or onboard deployment remains outside the scope of the present study and should be validated in future work [37]. Even though the mentioned approach focuses on image-based analysis rather than inference performed onboard a UAV, it provides valuable methodology for inclusion of explainable damage classification in the proposed UAV solution. This would enable analysis of UAV images at the ground station and, after model compression and hardware optimization, its further use on the Raspberry Pi mission computer. Any developed model will need to be tested under various realistic lighting, texture, and occlusion conditions.
Last of all, the communications and energy systems would benefit from future optimization. 5G opportunistic communications might be explored in future revisions to mitigate dependency on a pure direct connection with the Wi-Fi base station [33]. Also, alternatives like mesh networking and relay-supported communication may be explored in two separate future research studies. More complete propulsion-inclusive energy analysis is required in order to quantitatively link avionics optimization to actual flight duration, taking into account payload weight and battery setup. Future evaluations should also compare route distance and mission duration for alternative planning strategies that accomplish the same inspection objective. Such a system extension would make a more real-world application of the platform, with respect to structural inspection.
8. Patent
The broader research project underlying this study is associated with two pending patent applications filed with the Turkish Patent and Trademark Office. As of the submission date of this manuscript, neither application has resulted in a granted patent: “Decision Support System for Damage Detection and Analysis in Reinforced Concrete Buildings via Unmanned Aerial Vehicles (HABITAP)” (Application No. 2025/017446; Document No. 2025-GE-758381; filed on 14 November 2025) and “XR-Based AI-Powered Real-Time Structural Damage Detection System and Method” (Application No. 2026/003968; Document No. 2026-GE-180591; filed on 17 March 2026).
Author Contributions
Conceptualization, G.G. and M.U.; methodology, A.B. and G.G.; software, A.S., H.G. and M.U.; validation, N.B.A., B.B.E. and N.A.A.; formal analysis, A.S. and A.B.; investigation, A.S., M.A.U., G.G. and H.G.; resources, M.U.; data curation, N.B.A., B.B.E. and N.A.A.; writing—original draft preparation, G.G.; writing—review and editing, A.S., G.G., M.U. and A.B.; visualization, A.S., G.G. and A.B.; supervision, M.U. and A.B.; project administration, M.A.U.; funding acquisition, M.U. and A.B. All authors have read and agreed to the published version of the manuscript.
Funding
This study was supported by TUBITAK 1001-Grant Project No: 123M860. This study was supported by the Scientific Research Projects Coordination Unit of Fırat University under the Comprehensive Research Project program, Project No. MIF.26.02, entitled “Unmanned Aerial Vehicle-Based Autonomous Damage Detection and Decision Support System for Reinforced Concrete Buildings after Earthquakes: The HABITAP Approach”.
Institutional Review Board Statement
Not applicable.
Informed Consent Statement
Not applicable.
Data Availability Statement
Simulation results are available from the corresponding author upon reasonable request. Prototype-based navigation, power, communication, and mission-continuity results from the reported experiments are not publicly available because they form part of the operational project record. The present article and experiments are closely related to pending patent applications.
Conflicts of Interest
The authors declare no conflicts of interest.
Abbreviations
The following abbreviations are used in this manuscript:
| AI | Artificial Intelligence |
| ARQ | Automatic Repeat Request |
| AVIF | AV1 Image File Format |
| BIM | Building Information Modeling |
| CNN | Convolutional Neural Network |
| CPU | Central Processing Unit |
| CRC32 | 32-bit Cyclic Redundancy Check |
| DC | Direct Current |
| DVFS | Dynamic Voltage and Frequency Scaling |
| EKF | Extended Kalman Filter |
| EKF2 | PX4 EKF2 state estimator |
| ESC | Electronic Speed Controller |
| ESR | Equivalent Series Resistance |
| FCU | Flight Control Unit |
| GNSS | Global Navigation Satellite System |
| GPS | Global Positioning System |
| GPIO | General-Purpose Input/Output |
| Grad-CAM | Gradient-weighted Class Activation Mapping |
| HITL | Human-in-the-Loop |
| HTML | Hypertext Markup Language |
| I/O | Input/Output |
| IMU | Inertial Measurement Unit |
| INS | Inertial Navigation System |
| JPEG | Joint Photographic Experts Group |
| LiDAR | Light Detection and Ranging |
| LiPo | Lithium-Polymer |
| MAVLink | Micro Air Vehicle Link |
| MEC | Mobile Edge Computing |
| MQTT | Message Queuing Telemetry Transport |
| NACK | Negative Acknowledgment |
| NTP | Network Time Protocol |
| PDB | Power Distribution Board |
| Portable Document Format | |
| RF | Radio Frequency |
| RMSE | Root Mean Square Error |
| RSSI | Received Signal Strength Indicator |
| RTH | Return-to-Home |
| RTK | Real-Time Kinematic |
| SHM | Structural Health Monitoring |
| SLAM | Simultaneous Localization and Mapping |
| UAV | Unmanned Aerial Vehicle |
| UGV | Unmanned Ground Vehicle |
References
- Tan, Y.; Li, S.; Liu, H.; Chen, P.; Zhou, Z. Automatic Inspection Data Collection of Building Surface Based on BIM and UAV. Autom. Constr. 2021, 131, 103881. [Google Scholar] [CrossRef] [Scilit]
- Rakha, T.; Gorodetsky, A. Review of Unmanned Aerial System (UAS) Applications in the Built Environment: Towards Automated Building Inspection Procedures Using Drones. Autom. Constr. 2018, 93, 252–264. [Google Scholar] [CrossRef] [Scilit]
- Guedes, J.V.F.; Meira, G.D.S.; Bias, E.D.S.; Pitanga, B.; Lisboa, V. Performance of Sensors Embedded in UAVs for the Analysis and Identification of Pathologies in Building Façades. Buildings 2025, 15, 875. [Google Scholar] [CrossRef] [Scilit]
- Mader, D.; Blaskow, R.; Westfeld, P.; Weller, C. POTENTIAL OF UAV-BASED LASER SCANNER AND MULTISPECTRAL CAMERA DATA IN BUILDING INSPECTION. Int. Arch. Photogramm. Remote Sens. Spat. Inf. Sci. 2016, XLI-B1, 1135–1142. [Google Scholar] [CrossRef] [Scilit]
- Chodura, N.; Boase, D.; Woods, J.; Greeff, M. Cold Region Building Inspection Using UAV-Based Three-Dimensional Reconstruction. ISPRS Ann. Photogramm. Remote Sens. Spat. Inf. Sci. 2025, X-2/W2-2025, 15–22. [Google Scholar] [CrossRef] [Scilit]
- Zhang, C.; Wang, F.; Zou, Y.; Dimyadi, J.; Guo, B.H.W.; Hou, L. Automated UAV Image-to-BIM Registration for Building Façade Inspection Using Improved Generalised Hough Transform. Autom. Constr. 2023, 153, 104957. [Google Scholar] [CrossRef] [Scilit]
- Tan, Y.; Yi, W.; Chen, P.; Zou, Y. An Adaptive Crack Inspection Method for Building Surface Based on BIM, UAV and Edge Computing. Autom. Constr. 2024, 157, 105161. [Google Scholar] [CrossRef] [Scilit]
- Han, C. BIM -Integrated UAV -Based Defect Detection with Edge Computing for Infrastructure Inspection. Internet Technol. Lett. 2026, 9, e70180. [Google Scholar] [CrossRef] [Scilit]
- Asif, K.M.S.; Isty, M.N.; Islam, R.U.; Gani, R.; Islam, T.; Khan, M.S.H.; Ahmed, J.; Rashid, M.R.A. Real-Time UAV-Based Building Surface Defect Detection: A Dataset-Driven Lightweight CNN Framework with Grad-CAM Explainability. In Proceedings of the 2025 International Conference on Quantum Photonics, Artificial Intelligence, and Networking (QPAIN), Rangpur, Bangladesh, 31 July–2 August 2025; pp. 1–6. [Google Scholar]
- Huang, X.; Liu, Y.; Huang, L.; Stikbakke, S.; Onstein, E. BIM-Supported Drone Path Planning for Building Exterior Surface Inspection. Comput. Ind. 2023, 153, 104019. [Google Scholar] [CrossRef] [Scilit]
- Gao, C.; Wang, X.; Wang, R.; Zhao, Z.; Zhai, Y.; Chen, X.; Chen, B.M. A UAV-Based Explore-Then-Exploit System for Autonomous Indoor Facility Inspection and Scene Reconstruction. Autom. Constr. 2023, 148, 104753. [Google Scholar] [CrossRef] [Scilit]
- Lyu, Y.; Cao, M.; Yuan, S.; Xie, L. Vision-Based Plane Estimation and Following for Building Inspection with Autonomous UAV. IEEE Trans. Syst. Man Cybern. Syst. 2023, 53, 7475–7488. [Google Scholar] [CrossRef] [Scilit]
- Lyu, Y.; Yuan, S.; Xie, L. Structure Priors Aided Visual-Inertial Navigation in Building Inspection Tasks with Auxiliary Line Features. IEEE Trans. Aerosp. Electron. Syst. 2022, 58, 3037–3048. [Google Scholar] [CrossRef] [Scilit]
- Mathur, P.; Sharma, C.; Azeemuddin, S. Autonomous Inspection of High-Rise Buildings for Façade Detection and 3D Modeling Using UAVs. IEEE Access 2024, 12, 18251–18258. [Google Scholar] [CrossRef] [Scilit]
- Ding, W.; Yang, H.; Yu, K.; Shu, J. Crack Detection and Quantification for Concrete Structures Using UAV and Transformer. Autom. Constr. 2023, 152, 104929. [Google Scholar] [CrossRef] [Scilit]
- An, Y.; Ning, J.; Hou, C.; Ou, J. Efficient Low-Collision UAV-Based Automated Structural Surface Inspection Using Geometric Digital Twin and Voxelized Obstacle Information. Autom. Constr. 2025, 171, 105972. [Google Scholar] [CrossRef] [Scilit]
- Fayyad, T.M.; Taylor, S.; Feng, K.; Hui, F.K.P. A Scientometric Analysis of Drone-Based Structural Health Monitoring and New Technologies. Adv. Struct. Eng. 2025, 28, 122–144. [Google Scholar] [CrossRef] [Scilit]
- Wang, J.; Ueda, T. A Review Study on Unmanned Aerial Vehicle and Mobile Robot Technologies on Damage Inspection of Reinforced Concrete Structures. Struct. Concr. 2023, 24, 536–562. [Google Scholar] [CrossRef] [Scilit]
- Jung, S.; Choi, D.; Song, S.; Myung, H. Bridge Inspection Using Unmanned Aerial Vehicle Based on HG-SLAM: Hierarchical Graph-Based SLAM. Remote Sens. 2020, 12, 3022. [Google Scholar] [CrossRef] [Scilit]
- Qin, H.; Meng, Z.; Meng, W.; Chen, X.; Sun, H.; Lin, F.; Ang, M.H. Autonomous Exploration and Mapping System Using Heterogeneous UAVs and UGVs in GPS-Denied Environments. IEEE Trans. Veh. Technol. 2019, 68, 1339–1350. [Google Scholar] [CrossRef] [Scilit]
- Wang, F.; Zou, Y.; Zhang, C.; Buzzatto, J.; Liarokapis, M.; Del Rey Castillo, E.; Lim, J.B.P. UAV Navigation in Large-Scale GPS-Denied Bridge Environments Using Fiducial Marker-Corrected Stereo Visual-Inertial Localisation. Autom. Constr. 2023, 156, 105139. [Google Scholar] [CrossRef] [Scilit]
- Hung, T.-C.; He, R.; Peng, C.-C. Evaluation of a Vision Based UAV Indoor Inspection for a Well-Structured Heavy Industry Environment. In Proceedings of the 2024 International Conference on Consumer Electronics—Taiwan (ICCE-Taiwan), Taichung, Taiwan, 9–11 July 2024; pp. 139–140. [Google Scholar]
- Munguia, R.; Grau, A.; Bolea, Y.; Obregón-Pulido, G. A Simultaneous Control, Localization, and Mapping System for UAVs in GPS-Denied Environments. Drones 2025, 9, 69. [Google Scholar] [CrossRef] [Scilit]
- Flores, J.; Gonzalez-Hernandez, I.; Salazar, S.; Lozano, R.; Reyes, C. Improving Optical Flow Sensor Using a Gimbal for Quadrotor Navigation in GPS-Denied Environment. Sensors 2024, 24, 2183. [Google Scholar] [CrossRef] [Scilit]
- Zhang, J.; Huang, Z.; Zhu, X.; Guo, F.; Sun, C.; Zhan, Q.; Shen, R. LOFF: LiDAR and Optical Flow Fusion Odometry. Drones 2024, 8, 411. [Google Scholar] [CrossRef] [Scilit]
- Liang, A.; Pan, Y.; Huo, Y.; Li, Q.; Zhou, B.; Chen, Z. A Seamless LiDAR/IMU/RTK Fused Localization Method for UAV-Based Bridge Inspection. Int. Arch. Photogramm. Remote Sens. Spat. Inf. Sci. 2025, XLVIII-G-2025, 937–943. [Google Scholar] [CrossRef] [Scilit]
- Elamin, A.; Abdelaziz, N.; El-Rabbany, A. A GNSS/INS/LiDAR Integration Scheme for UAV-Based Navigation in GNSS-Challenging Environments. Sensors 2022, 22, 9908. [Google Scholar] [CrossRef] [Scilit]
- Cheng, K.; Fang, X.; Wang, X. Energy Efficient Edge Computing and Data Compression Collaboration Scheme for UAV-Assisted Network. IEEE Trans. Veh. Technol. 2023, 72, 16395–16408. [Google Scholar] [CrossRef] [Scilit]
- Pervez, F.; Sultana, A.; Yang, C.; Zhao, L. Energy and Latency Efficient Joint Communication and Computation Optimization in a Multi-UAV-Assisted MEC Network. IEEE Trans. Wirel. Commun. 2024, 23, 1728–1741. [Google Scholar] [CrossRef] [Scilit]
- Ebrahimi, D.; Sharafeddine, S.; Ho, P.-H.; Assi, C. UAV-Aided Projection-Based Compressive Data Gathering in Wireless Sensor Networks. IEEE Internet Things J. 2019, 6, 1893–1905. [Google Scholar] [CrossRef] [Scilit]
- Hoa, N.T.; Hai, C.T.T.; Hung, H.L.; Cong Luong, N.; Niyato, D. Joint Edge Computing and Semantic Communication in UAV-Enabled Networks. IEEE Commun. Lett. 2025, 29, 80–84. [Google Scholar] [CrossRef] [Scilit]
- Yang, Z.; Pan, C.; Wang, K.; Shikh-Bahaei, M. Energy Efficient Resource Allocation in UAV-Enabled Mobile Edge Computing Networks. IEEE Trans. Wirel. Commun. 2019, 18, 4576–4589. [Google Scholar] [CrossRef] [Scilit]
- Qasim, N.H.; Jawad, A.M. 5G-Enabled UAVs for Energy-Efficient Opportunistic Networking. Heliyon 2024, 10, e32660. [Google Scholar] [CrossRef] [Scilit]
- Zhou, J.; Wang, M.; Tian, D.; Qu, K.; Qu, G.; Duan, X.; Shen, X. Reliability-Optimal UAV-Assisted Mobile Edge Computing: Joint Resource Allocation, Data Transmission Scheduling and Motion Control. IEEE Trans. Mob. Comput. 2025, 24, 4217–4234. [Google Scholar] [CrossRef] [Scilit]
- Chen, J.; Cao, X.; Yang, P.; Xiao, M.; Ren, S.; Zhao, Z.; Wu, D.O. Deep Reinforcement Learning Based Resource Allocation in Multi-UAV-Aided MEC Networks. IEEE Trans. Commun. 2023, 71, 296–309. [Google Scholar] [CrossRef] [Scilit]
- EMAX Model. XA2212 Brushless Motor + Accessories. Available online: https://shop.emaxmodel.com/products/xa2212-brushless-motor-accessories (accessed on 18 August 2026).
- Sezgin, A.; Açıkgenç Ulaş, M.; Gök, G.; Güler, H.; Avcı, N.B.; Ekici, B.B.; Akyıldız, N.A.; Ulaş, M.; Boyacı, A. Explainable Ensemble Convolutional Neural Networks for Automated Post-Disaster Structural Damage Assessment. Appl. Sci. 2026, 16, 5682. [Google Scholar] [CrossRef] [Scilit]
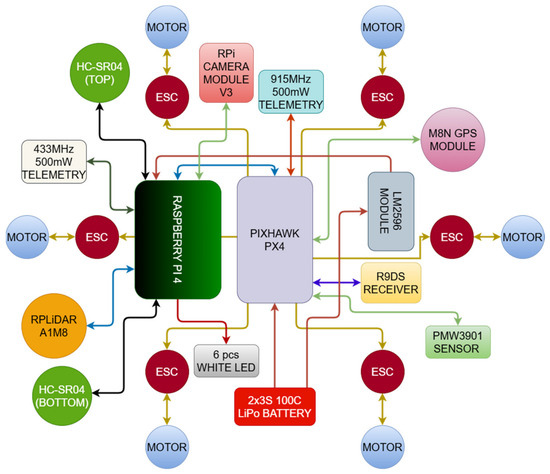
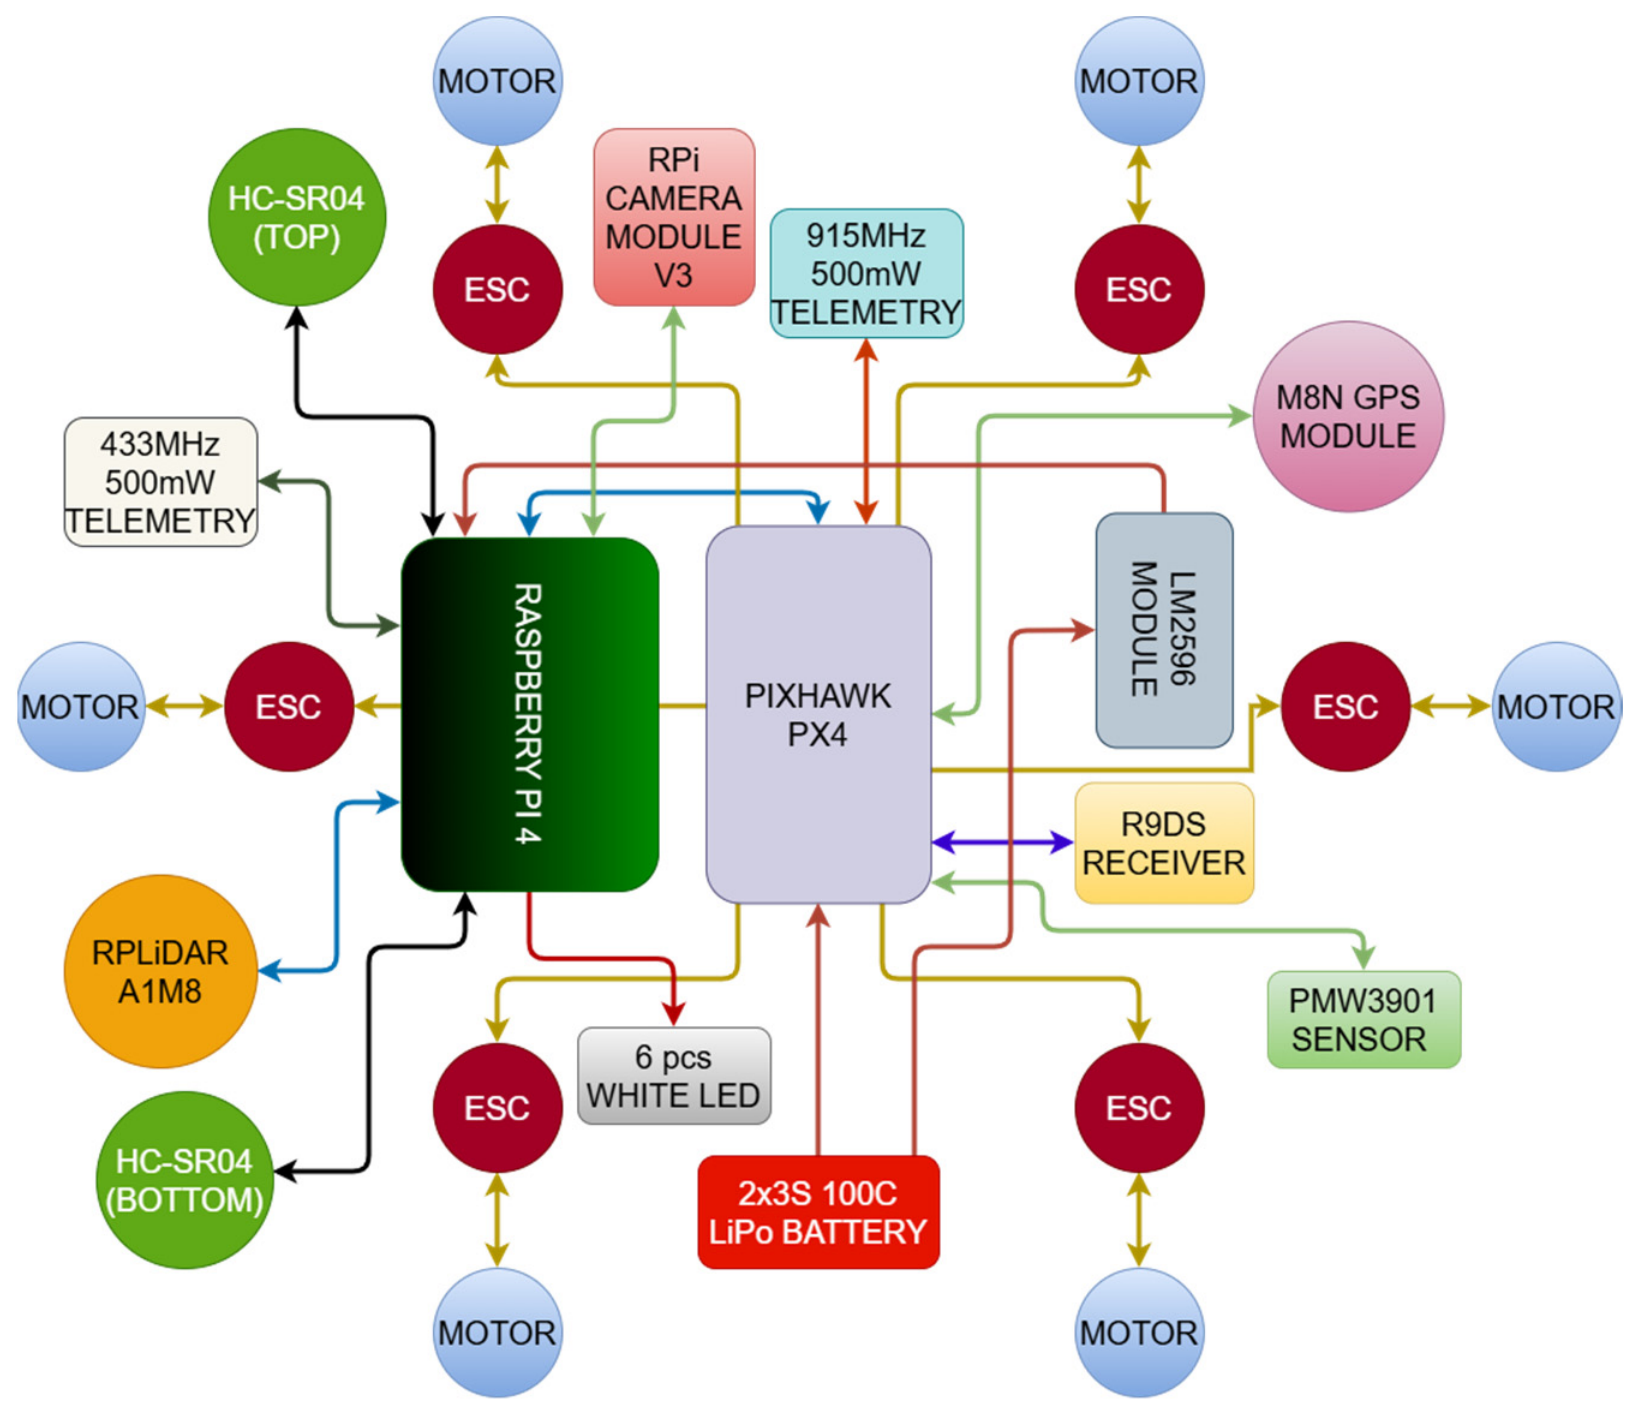
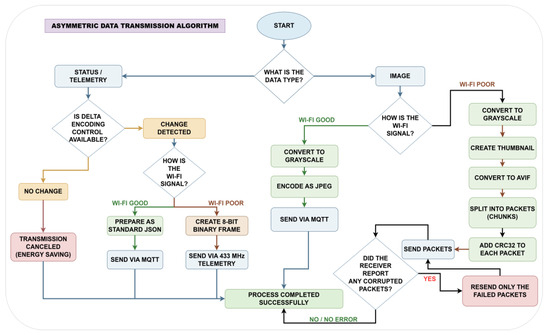
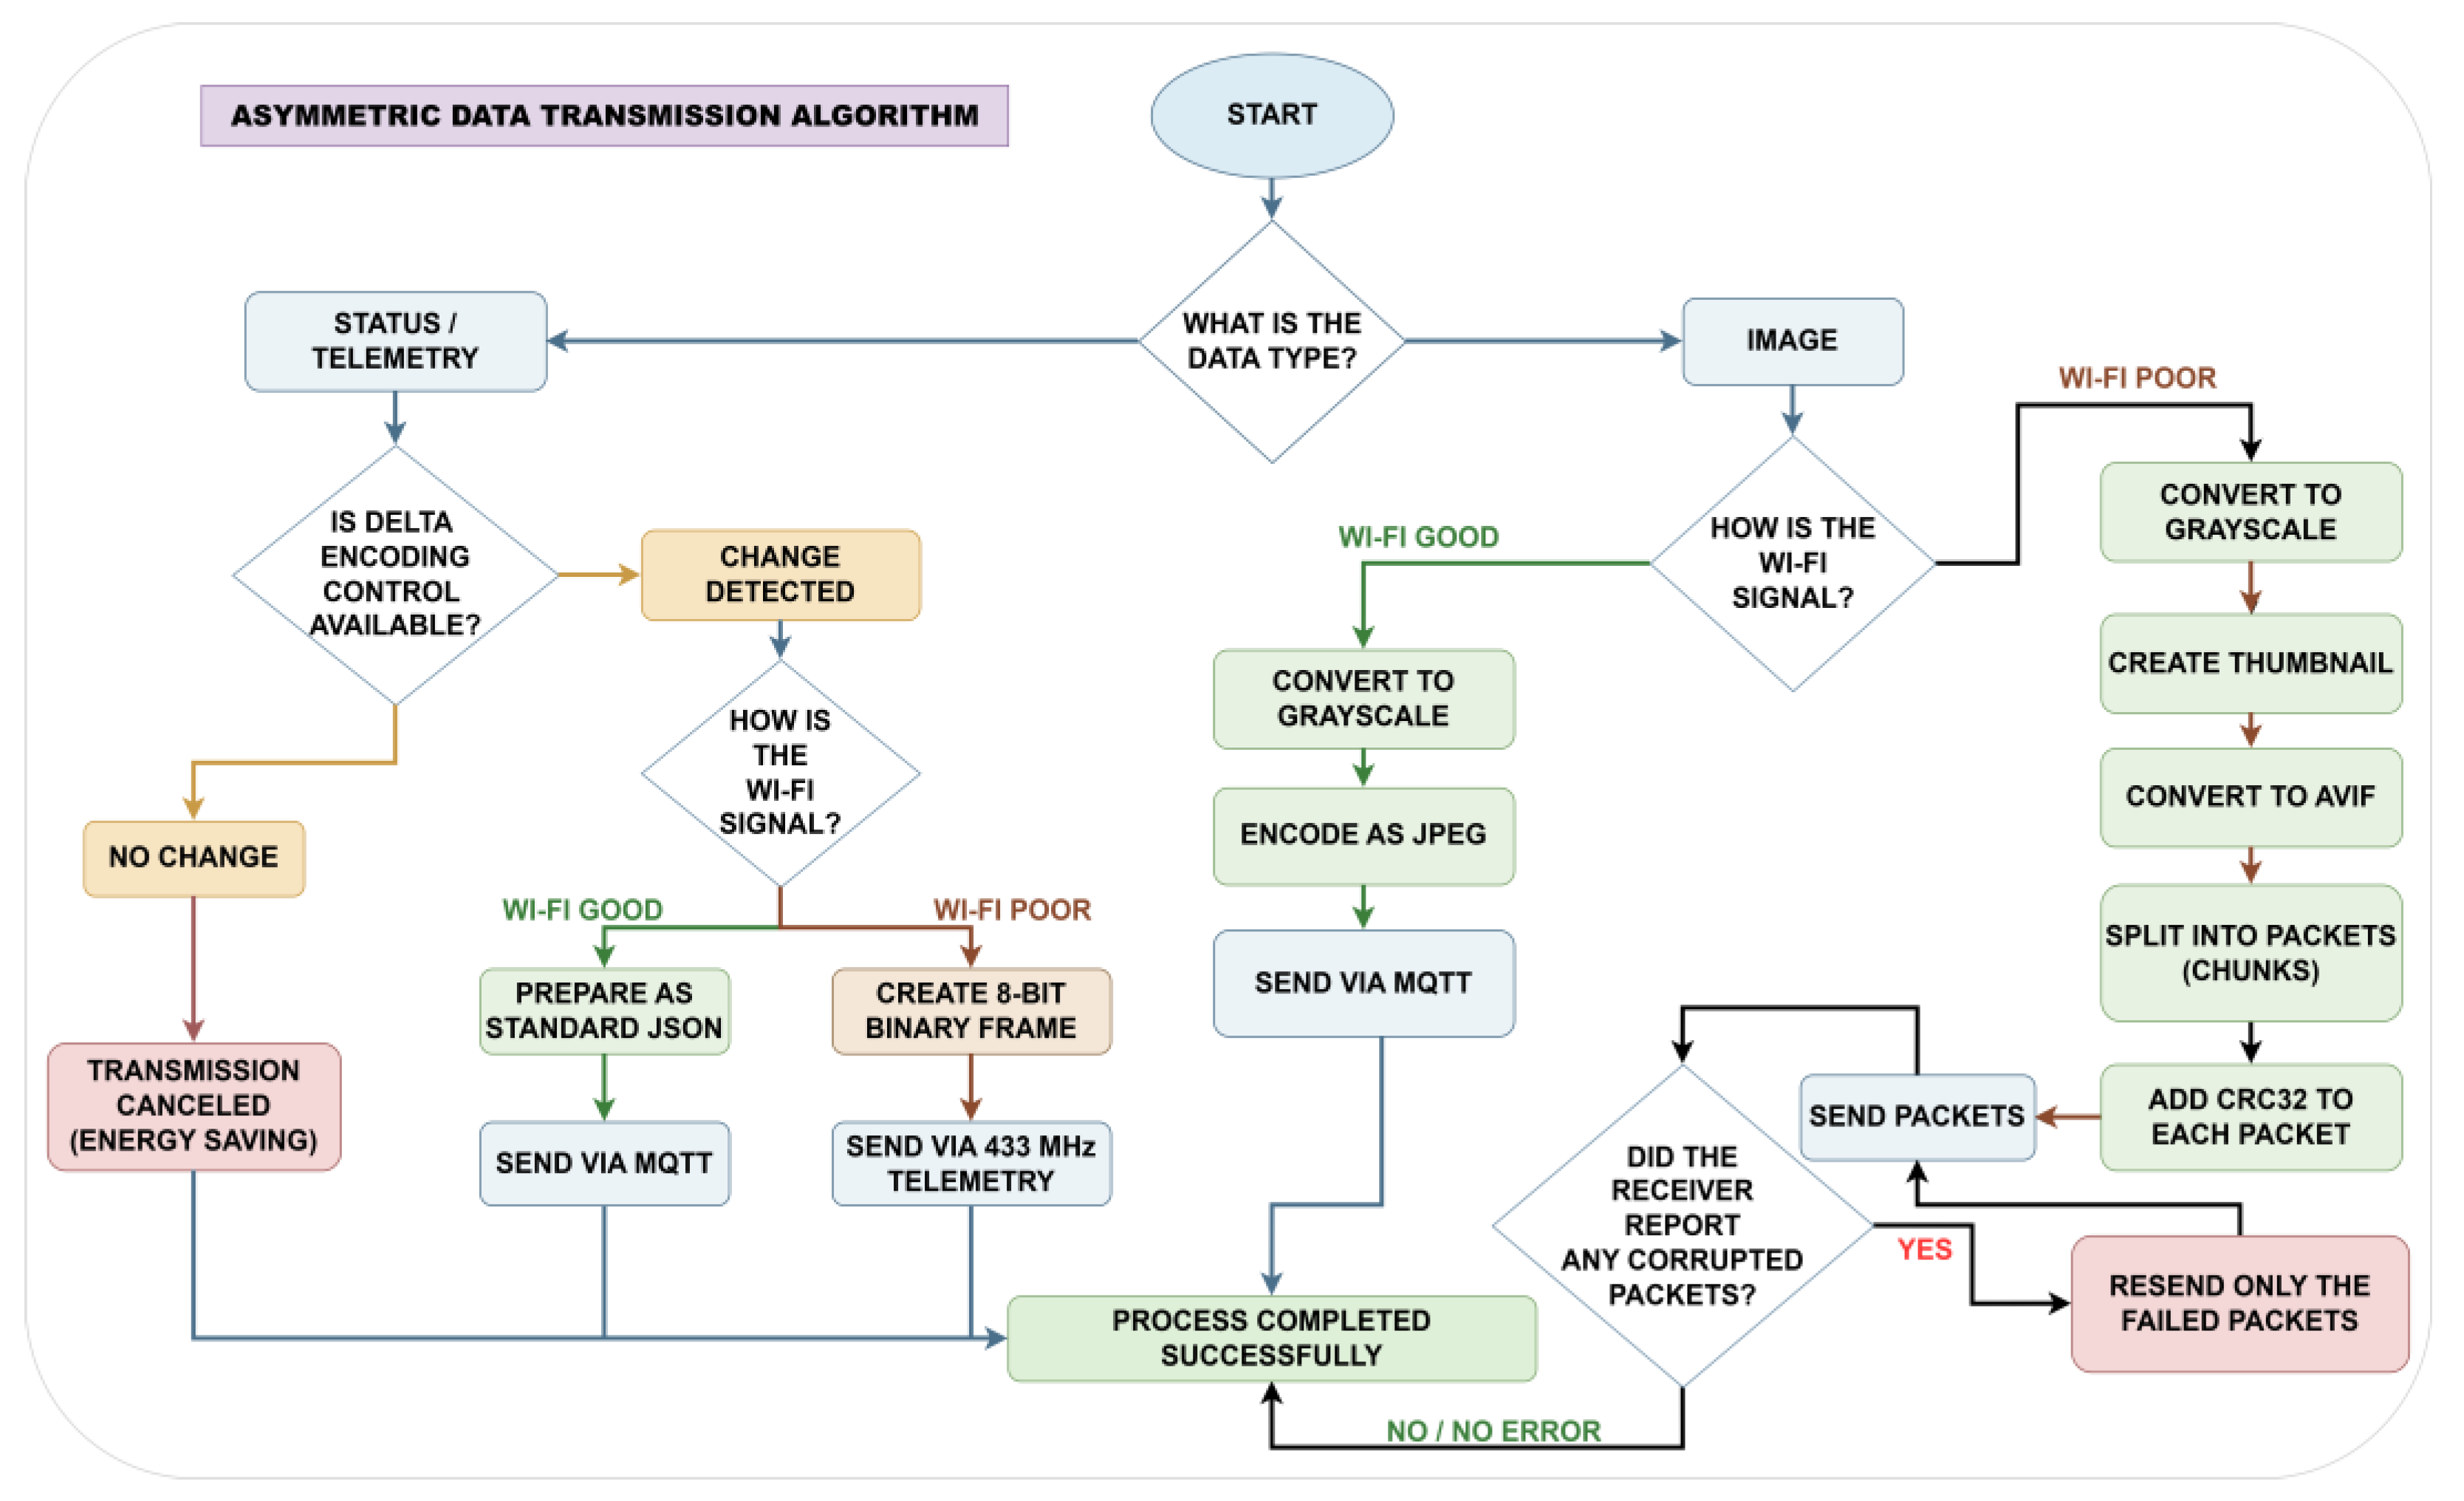
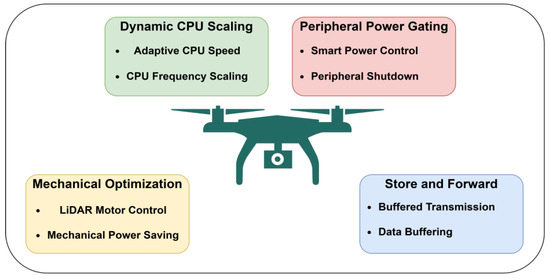
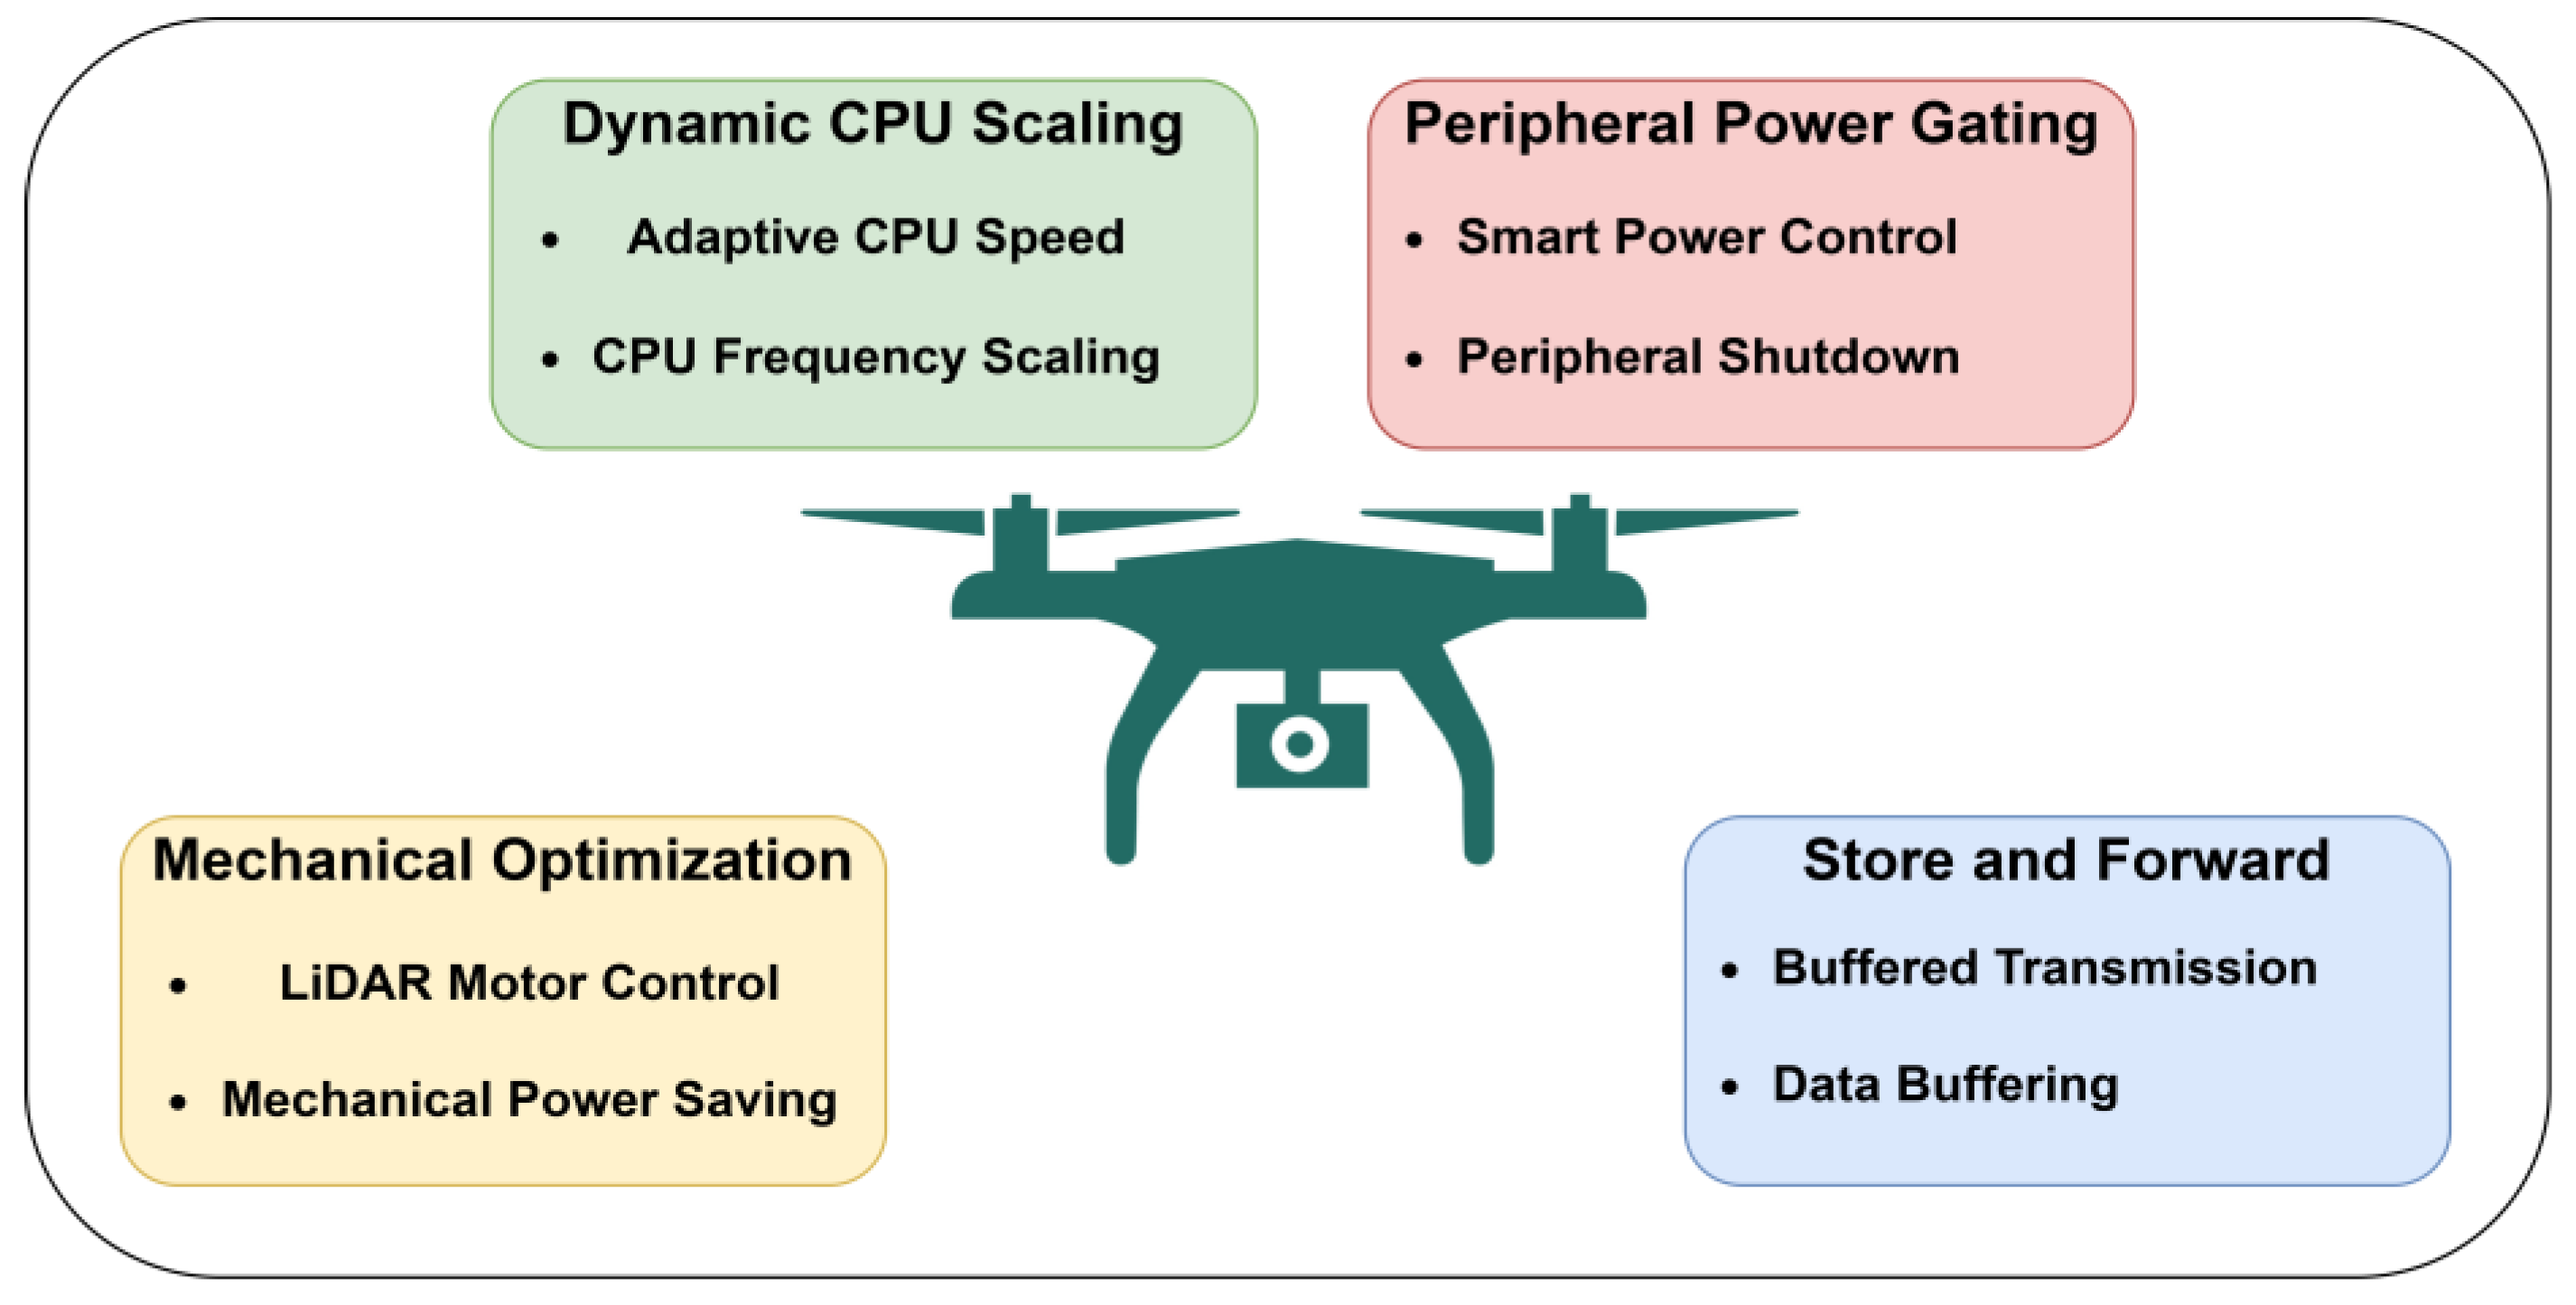
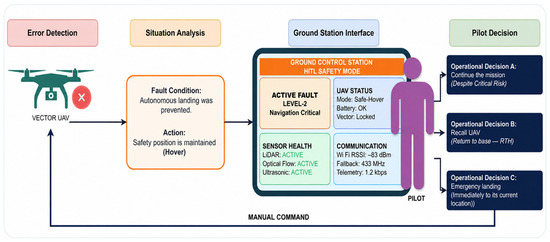
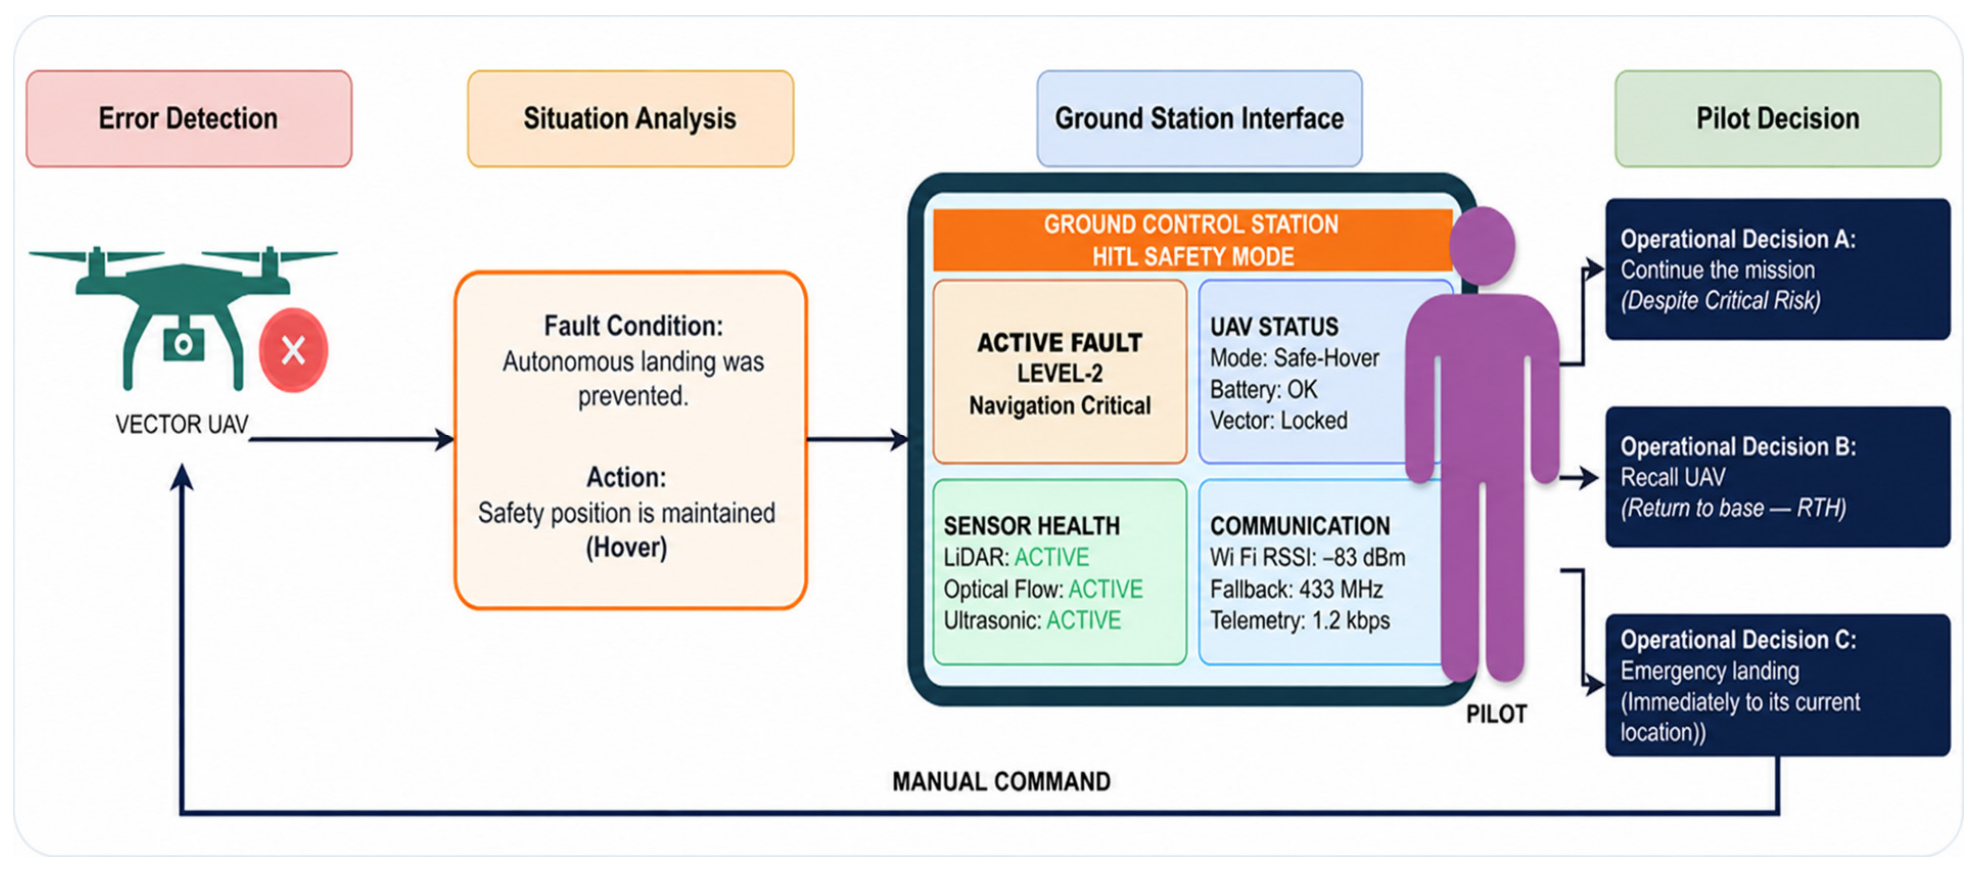
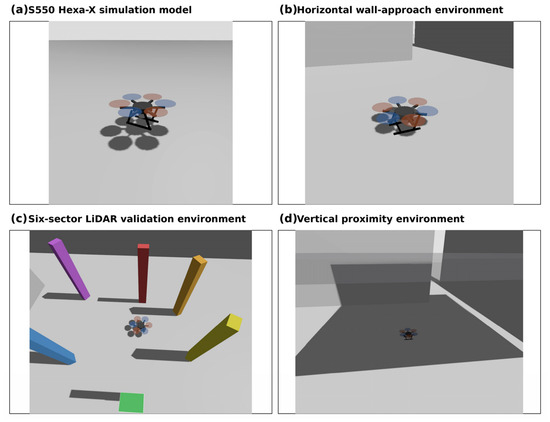
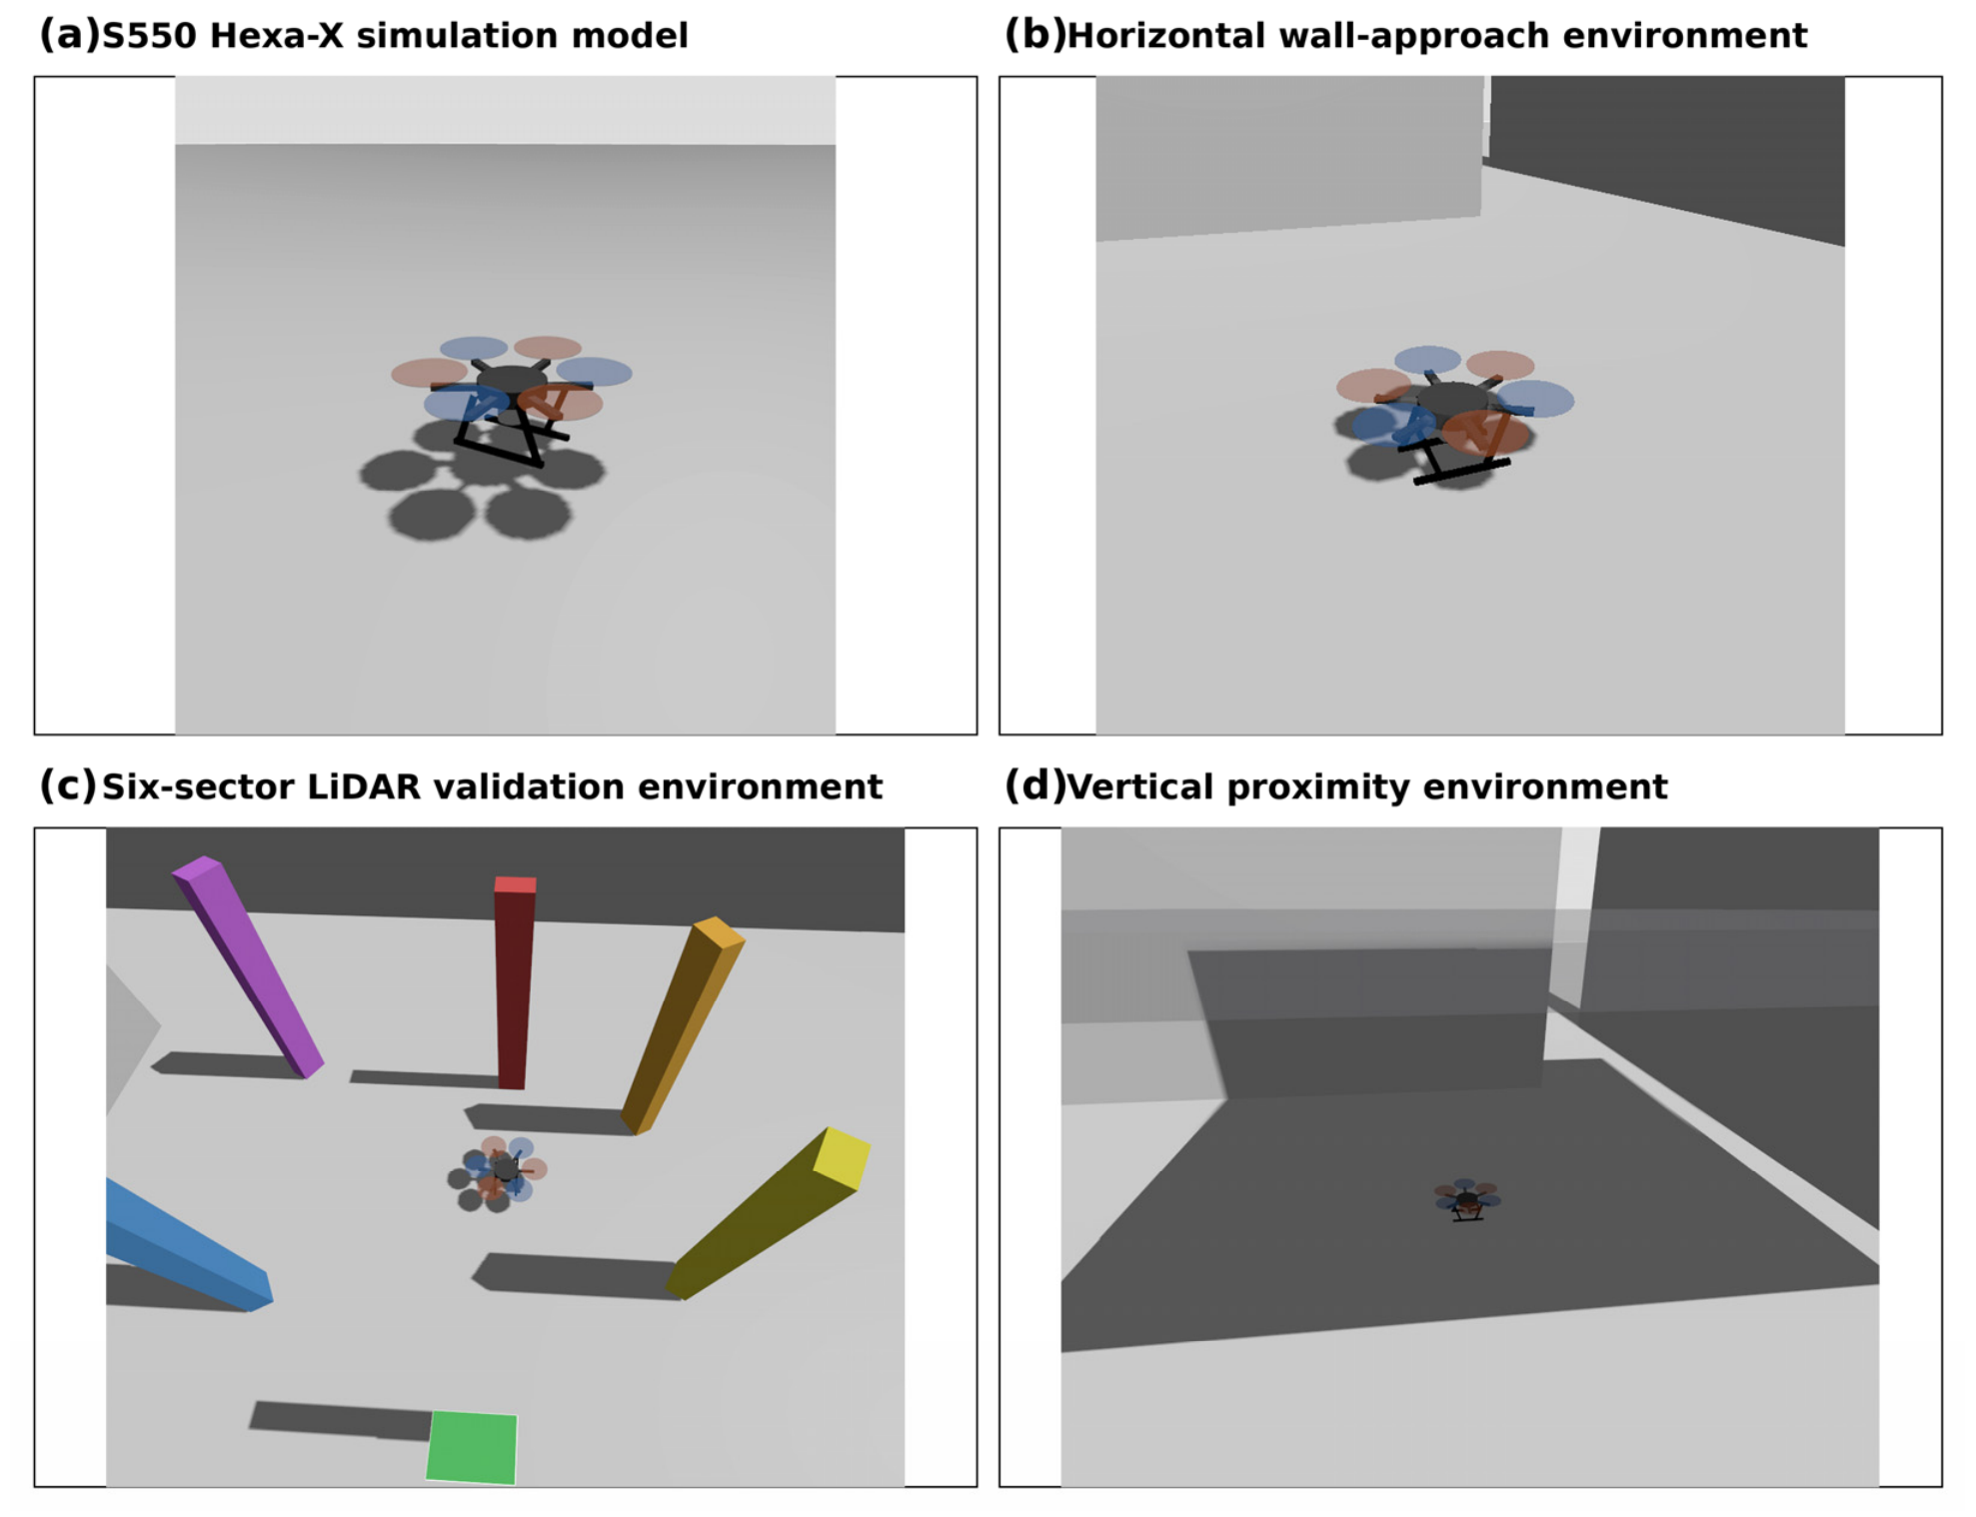
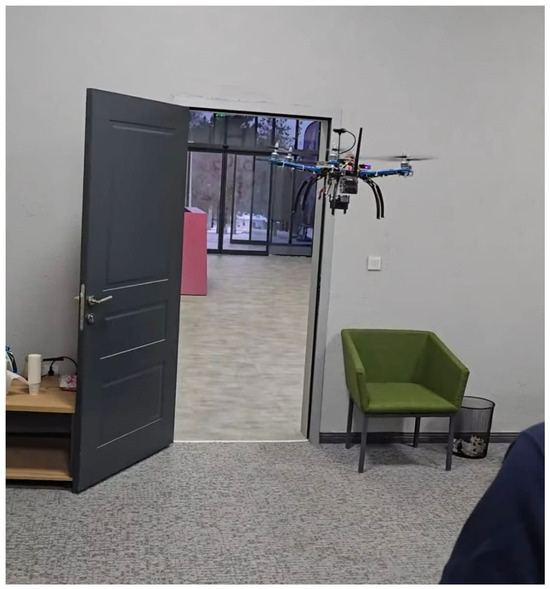
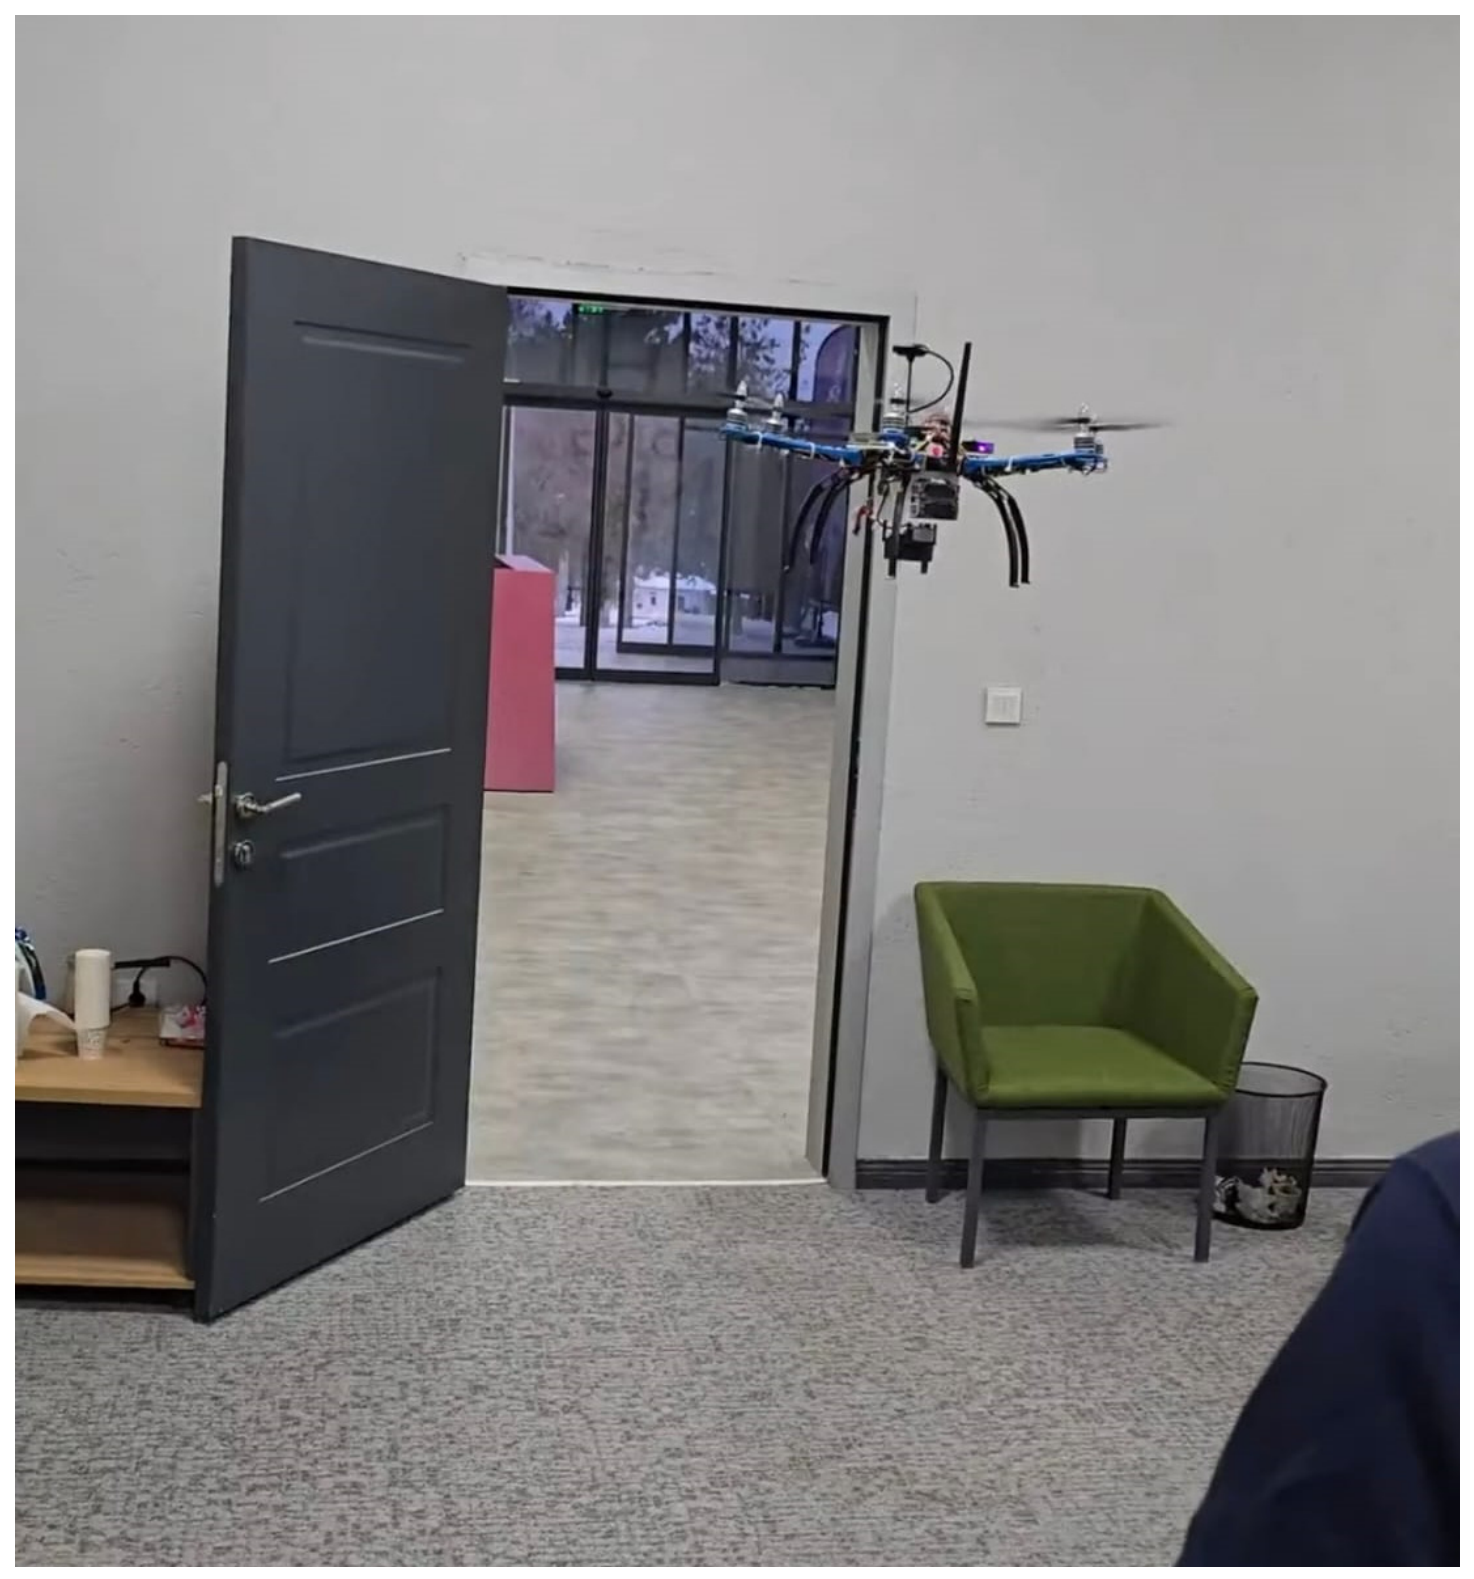
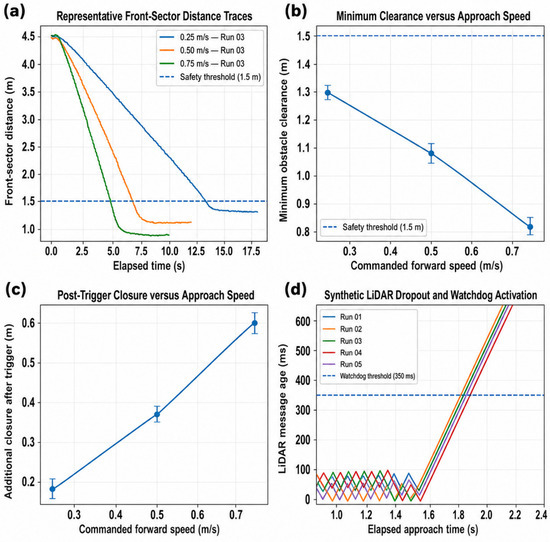
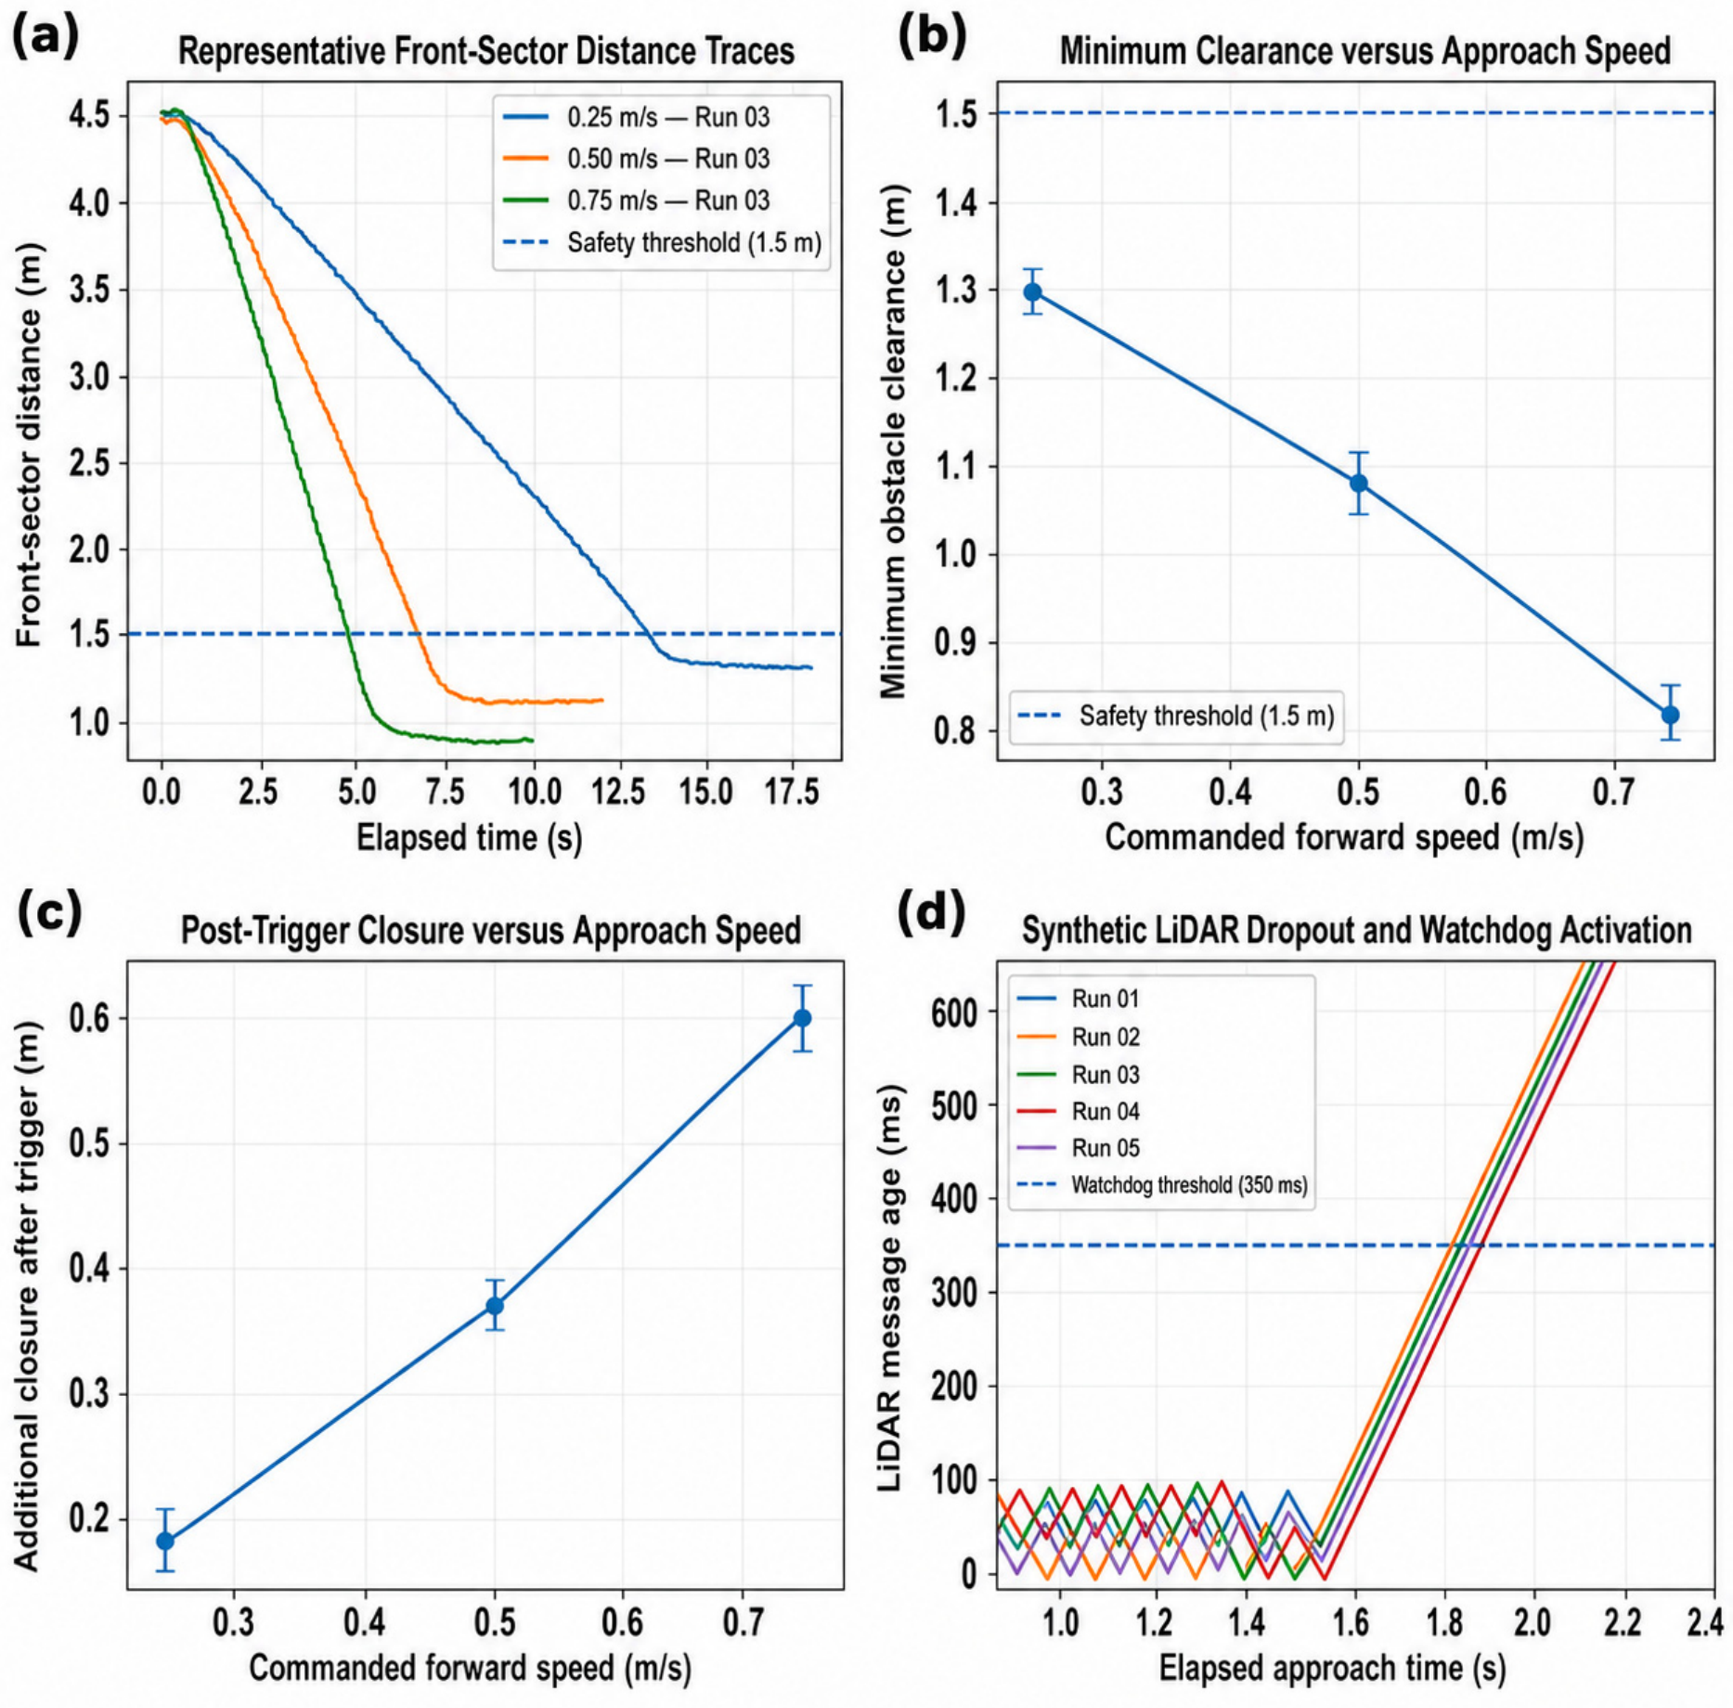
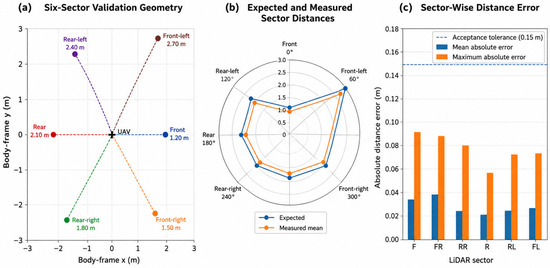
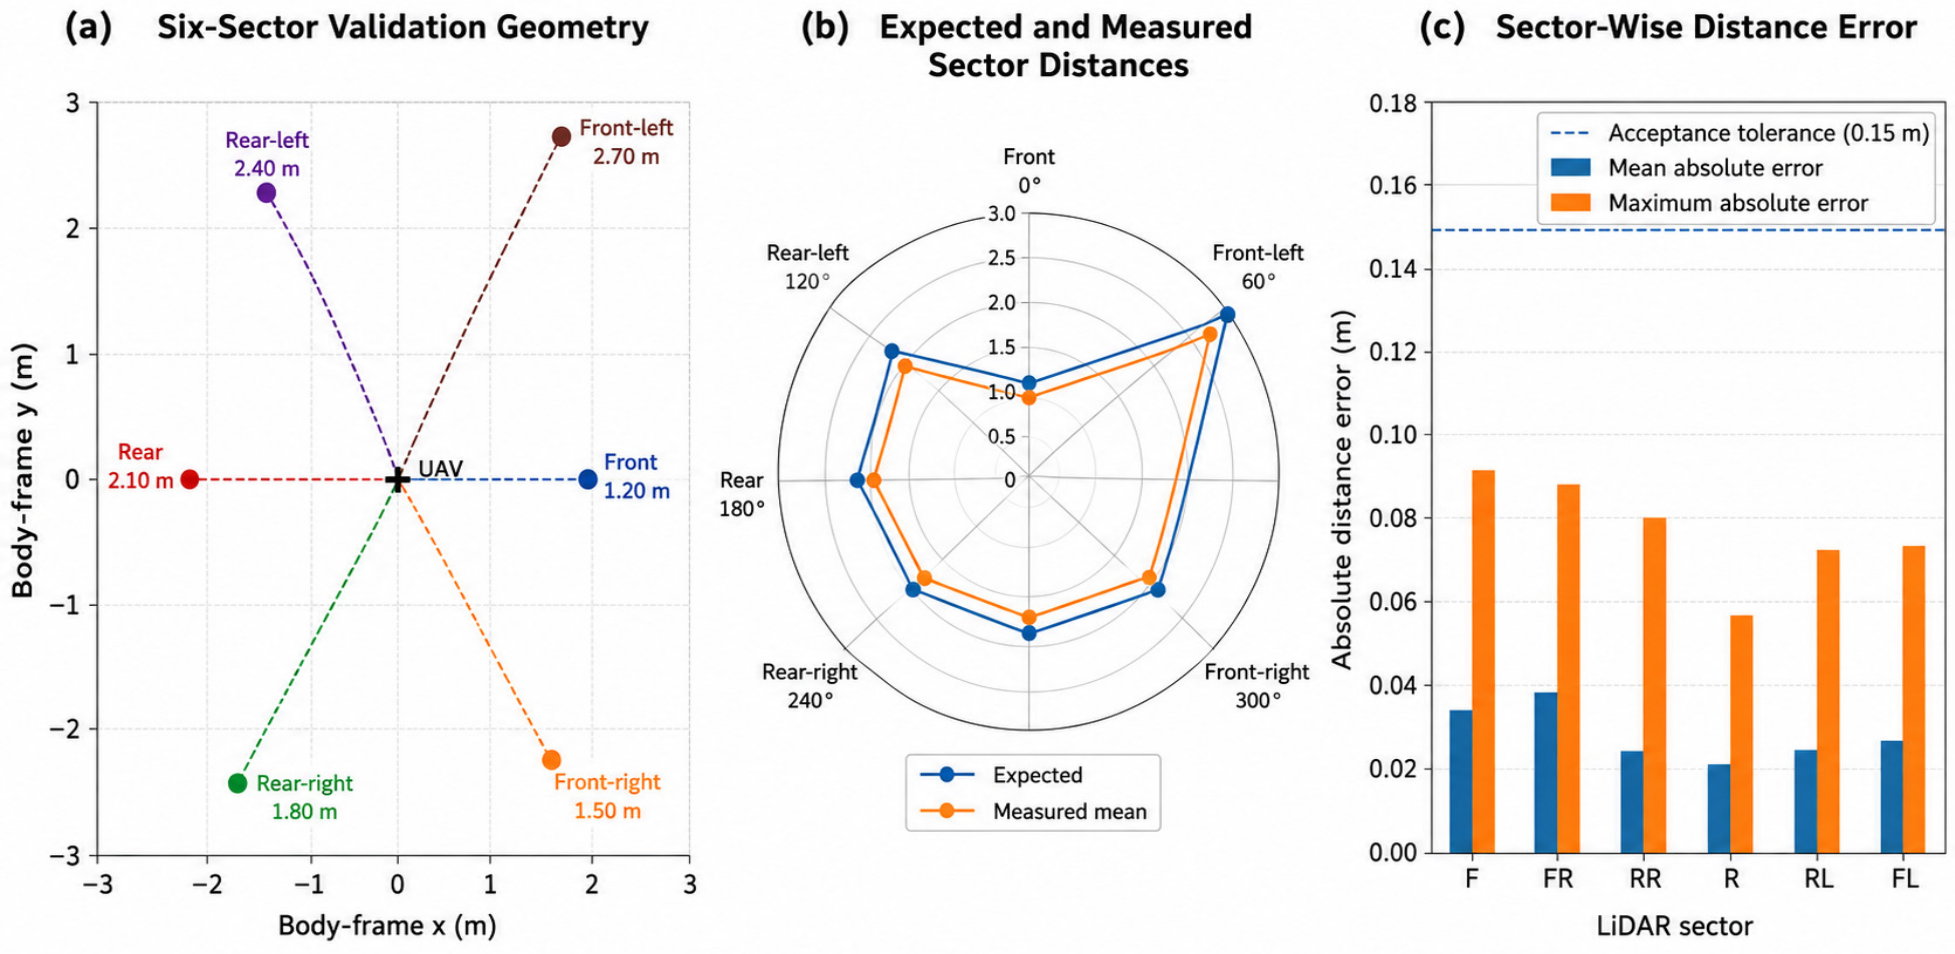
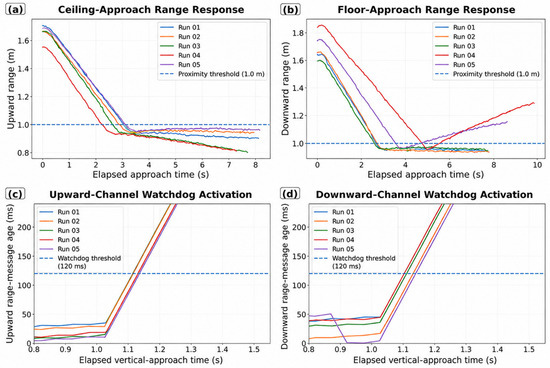
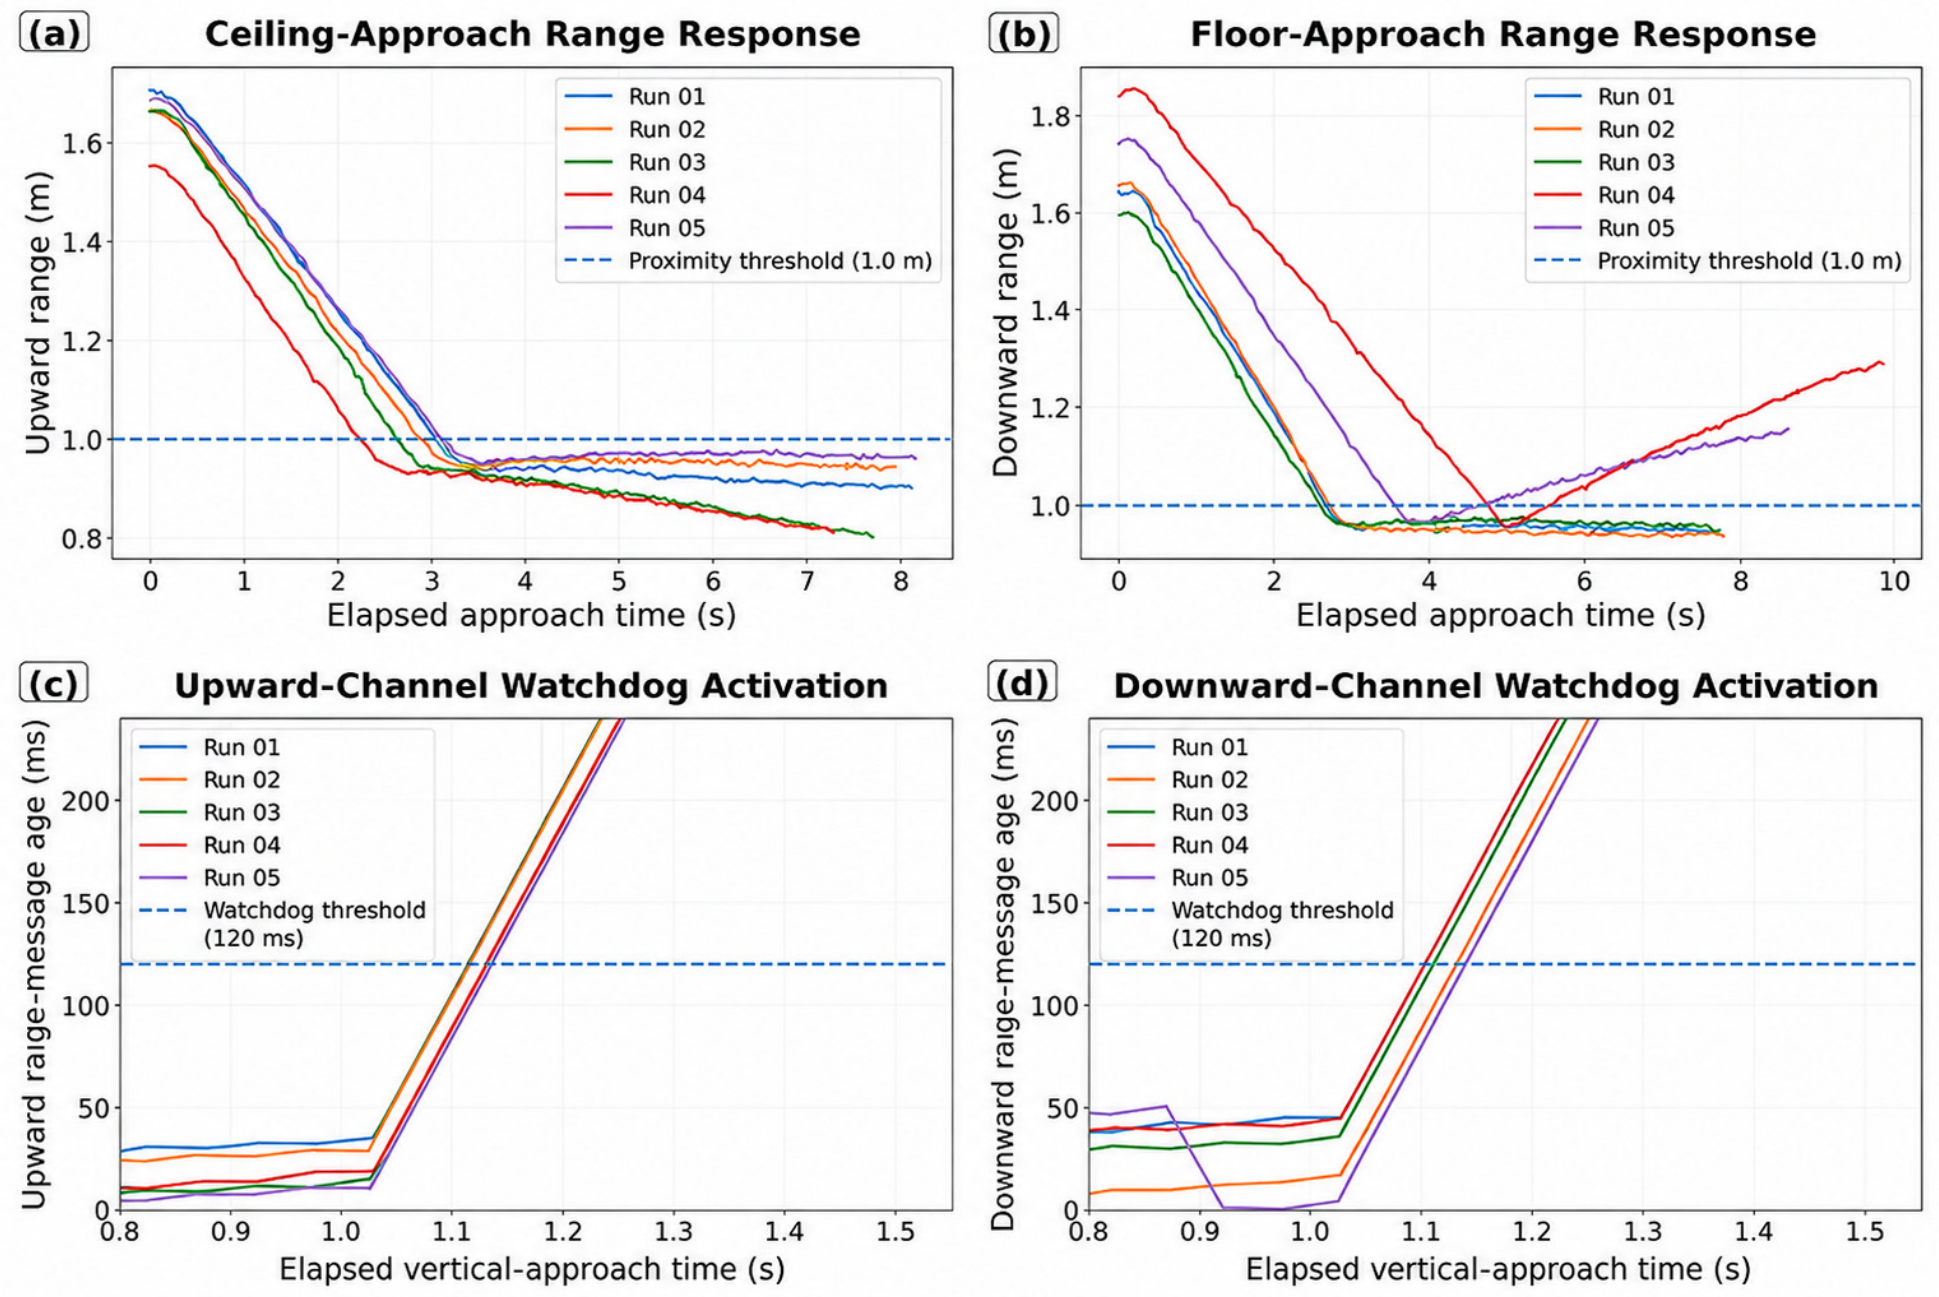

Disclaimer/Publisher’s Note: The statements, opinions and data contained in all publications are solely those of the individual author(s) and contributor(s) and not of MDPI and/or the editor(s). MDPI and/or the editor(s) disclaim responsibility for any injury to people or property resulting from any ideas, methods, instructions or products referred to in the content. |
© 2026 by the authors. Licensee MDPI, Basel, Switzerland. This article is an open access article distributed under the terms and conditions of the Creative Commons Attribution (CC BY) license.