


Highlights
What are the main findings?
- A SAM-based automated framework was developed for oyster reef extraction from UAV (Unmanned Aerial Vehicle) DOM (Digital Orthophoto Map) imagery.
- Optimized parameters significantly improved segmentation accuracy under both illuminated and shaded conditions.
What are the implications of the main findings?
- The proposed method enhances the robustness of intertidal habitat monitoring under complex environmental conditions.
- It provides a scalable solution for high-precision coastal ecological assessment using UAV remote sensing.
Abstract
Monitoring the spatial distribution of oyster reefs in an accurate, efficient, and flexible manner is crucial for assessing changes in nearshore fishery habitat environments. However, traditional optical remote sensing methods are often affected by illumination variation, tidal fluctuation, and spectral confusion in complex intertidal environments. An automated extraction framework based on the SAM (Segment Anything Model) using UAV (Unmanned Aerial Vehicle) DOM (Digital Orthophoto Map) imagery is proposed to achieve high-precision oyster reef identification and area estimation. Multi-resolution UAV imagery was processed, and key SAM parameters were systematically optimized under different illumination conditions. The results show that spatial resolution significantly influences segmentation accuracy, and appropriate resolution selection improves both stability and reliability. Based on UAV data acquired in 2025, the total oyster reef area in the study region was estimated to be 2.24 ha. After parameter optimization, segmentation accuracy improved from 93.22% to 97.61% in illuminated areas and from 93.30% to 96.67% in shaded areas. The proposed method demonstrates strong robustness under varying environmental conditions and effectively enhances boundary detection accuracy. A scalable and reliable approach is provided for coastal habitat monitoring and offers new insights into automated object extraction in complex remote sensing imagery.
1. Introduction
Oyster reefs not only provide crucial habitat spaces for various marine organisms and fishery resources in the nearshore area but also play important ecological service functions through processes such as water filtration, carbon sequestration, nitrogen removal, and coastal stability [1,2,3,4,5]. Therefore, based on their ecological and resource value, high-precision monitoring of the spatial distribution pattern of oyster reefs has become one of the important means for assessing environmental changes in the nearshore fishery habitats. In the main distribution area of oyster reefs, the Oyster Hill National Marine Park in Nantong City, Jiangsu Province, houses the largest intertidal live oyster reef in China, which has significant scientific research and ecological protection value.
However, under the combined influence of overfishing, coastal development, and climate change, the habitat of oyster reefs is showing a continuous-degradation and rapid-reduction trend [6,7,8]. The increase in sea temperature, rise in sea level, and frequent occurrence of extreme weather events caused by climate change have further exacerbated the instability of the ecosystem [9,10]. At the same time, environmental pressures such as water eutrophication, sediment accumulation, and pollutant input have significantly affected the growth of oysters and the stability of the reef structure [11]. Therefore, it is urgent to establish a high-precision, repeatable, and spatially quantitative monitoring method to achieve refined assessment of the spatial distribution and area changes of oyster reefs.
In recent years, with the development of remote sensing technology and geographic spatial analysis methods, multi-source data have been increasingly applied to extract information about oyster reef habitats [12,13,14,15].
Previous studies have demonstrated the feasibility of remote sensing techniques for oyster reef mapping using both satellite and UAV imagery. Satellite remote sensing has been widely applied for large-scale coastal habitat monitoring and provides an effective means for mapping oyster reef distribution over broad spatial extents. However, its application to intertidal oyster reefs remains limited by relatively coarse spatial resolution, cloud contamination, fixed revisit intervals, and the mismatch between satellite overpass times and favorable low-tide conditions, which often reduce the visibility of exposed oyster reefs [16,17]. Compared with satellite imagery, UAV-based remote sensing provides centimeter-level spatial resolution and flexible data acquisition, making it particularly suitable for detailed oyster reef mapping and quantitative area estimation. Recent studies have demonstrated that UAV imagery can effectively improve the identification of oyster reef boundaries and habitat characteristics [16,18,19]. Nevertheless, most existing methods still rely on manual interpretation, object-based image analysis, or conventional machine learning algorithms, which remain sensitive to illumination variation, shadow interference, and complex sediment backgrounds, especially when delineating fine reef boundaries.
However, due to factors such as tidal changes, sedimentary environment, meteorological conditions, and satellite revisit cycle, the application of high-resolution satellite images in the intertidal zone still faces problems such as poor timeliness of acquisition and insufficient spatial accuracy, making it difficult to meet the requirements for precise boundary identification and quantitative estimation of the area of oyster reefs [20]. Therefore, UAV (Unmanned Aerial Vehicle) technology, due to its advantages of ultra-high spatial resolution, flexible deployment, and rapid data acquisition, has gradually become an important means for nearshore ecological monitoring [20,21]. Especially of note, the DOM (Digital Orthophoto Map) images constructed based on UAV images, through geometric correction and image stitching, can provide high-precision spatial data with a real geographical scale, enabling the extraction of target areas to have clear physical meaning and high quantitative reliability [12,13,14,15,16]. Therefore, UAV DOM images provide key data support for the spatial distribution and precise estimation of the area of oyster reefs [22,23,24].
Although the images captured by drones have significant advantages in terms of spatial resolution, in the complex intertidal environment, they are affected by factors such as light changes, shadow effects, sediment background, and water body reflection. Only by relying on traditional threshold-based or rule-based segmentation methods can the boundary of the oyster reef be highly accurately identified. Especially in small-scale structures and boundary transition areas, this process is prone to false segmentation or missed segmentation, thereby directly affecting the accuracy of area extraction [25]. The edge of the oyster reef is usually located in the transitional area between the reef body and the surrounding tidal flats or sediment environment, with weak spectral feature differences and a complex spatial structure [26]. Under the combined effect of sediment coverage and light changes, the reef boundary often presents blurred or broken characteristics, leading to significant uncertainty in area estimation based on traditional methods. Therefore, how to achieve high-precision boundary identification and stable segmentation under complex environmental conditions has become a key issue to improve the accuracy of oyster reef area extraction.
With the development of deep learning technology, segmentation methods based on visual foundation models have gradually become an important direction for remote sensing information extraction [25,27]. Among them, the SAM (Segment Anything Model) is a universal segmentation model with strong generalization ability which can achieve high-quality target-level segmentation without the need for re-training for specific tasks [28]. Compared with traditional methods, the SAM shows stronger boundary perception ability and structural expression ability in complex scenes and is particularly suitable for intertidal environments with complex target shapes and significant background interference.
Recently, the Segment Anything Model (SAM) has attracted considerable attention in remote sensing owing to its excellent zero-shot segmentation capability. Previous studies have successfully applied the SAM to seafloor mapping [29], river-water extraction [30], and multispectral image labeling [31], demonstrating its strong adaptability in complex natural environment. However, to the best of our knowledge, the SAM has not yet been applied to automated oyster reef segmentation, and its performance under varying tidal conditions, illumination, and multi-resolution UAV imagery remains largely unexplored.
In addition, the SAM can be flexibly adapted in different spatial scales and light conditions through a multi-parameter regulation mechanism, thereby improving the stability of the results while maintaining the accuracy of segmentation. Based on the orthophoto images from the drone, the system analyzes and optimizes the parameters of the SAM, which is expected to significantly improve the accuracy of oyster reef boundary identification and further enhance the reliability and consistency of area extraction results. Therefore, based on the orthophoto image data from the drone, this study constructs an automated oyster reef extraction framework that integrates the SAM. Through systematic parameter optimization and accuracy evaluation, it focuses on analyzing the performance changes of the model under different light conditions and target scales, thereby achieving high-precision extraction and quantitative estimation of the spatial distribution of oyster reefs. Not only does this research provide an effective method for target extraction in complex coastal environments, but it also offers a new technical path for the application of drone remote sensing in ecological monitoring.
2. Materials and Methods
2.1. Research Area
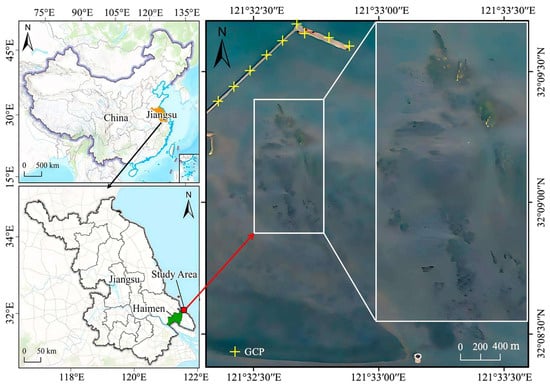
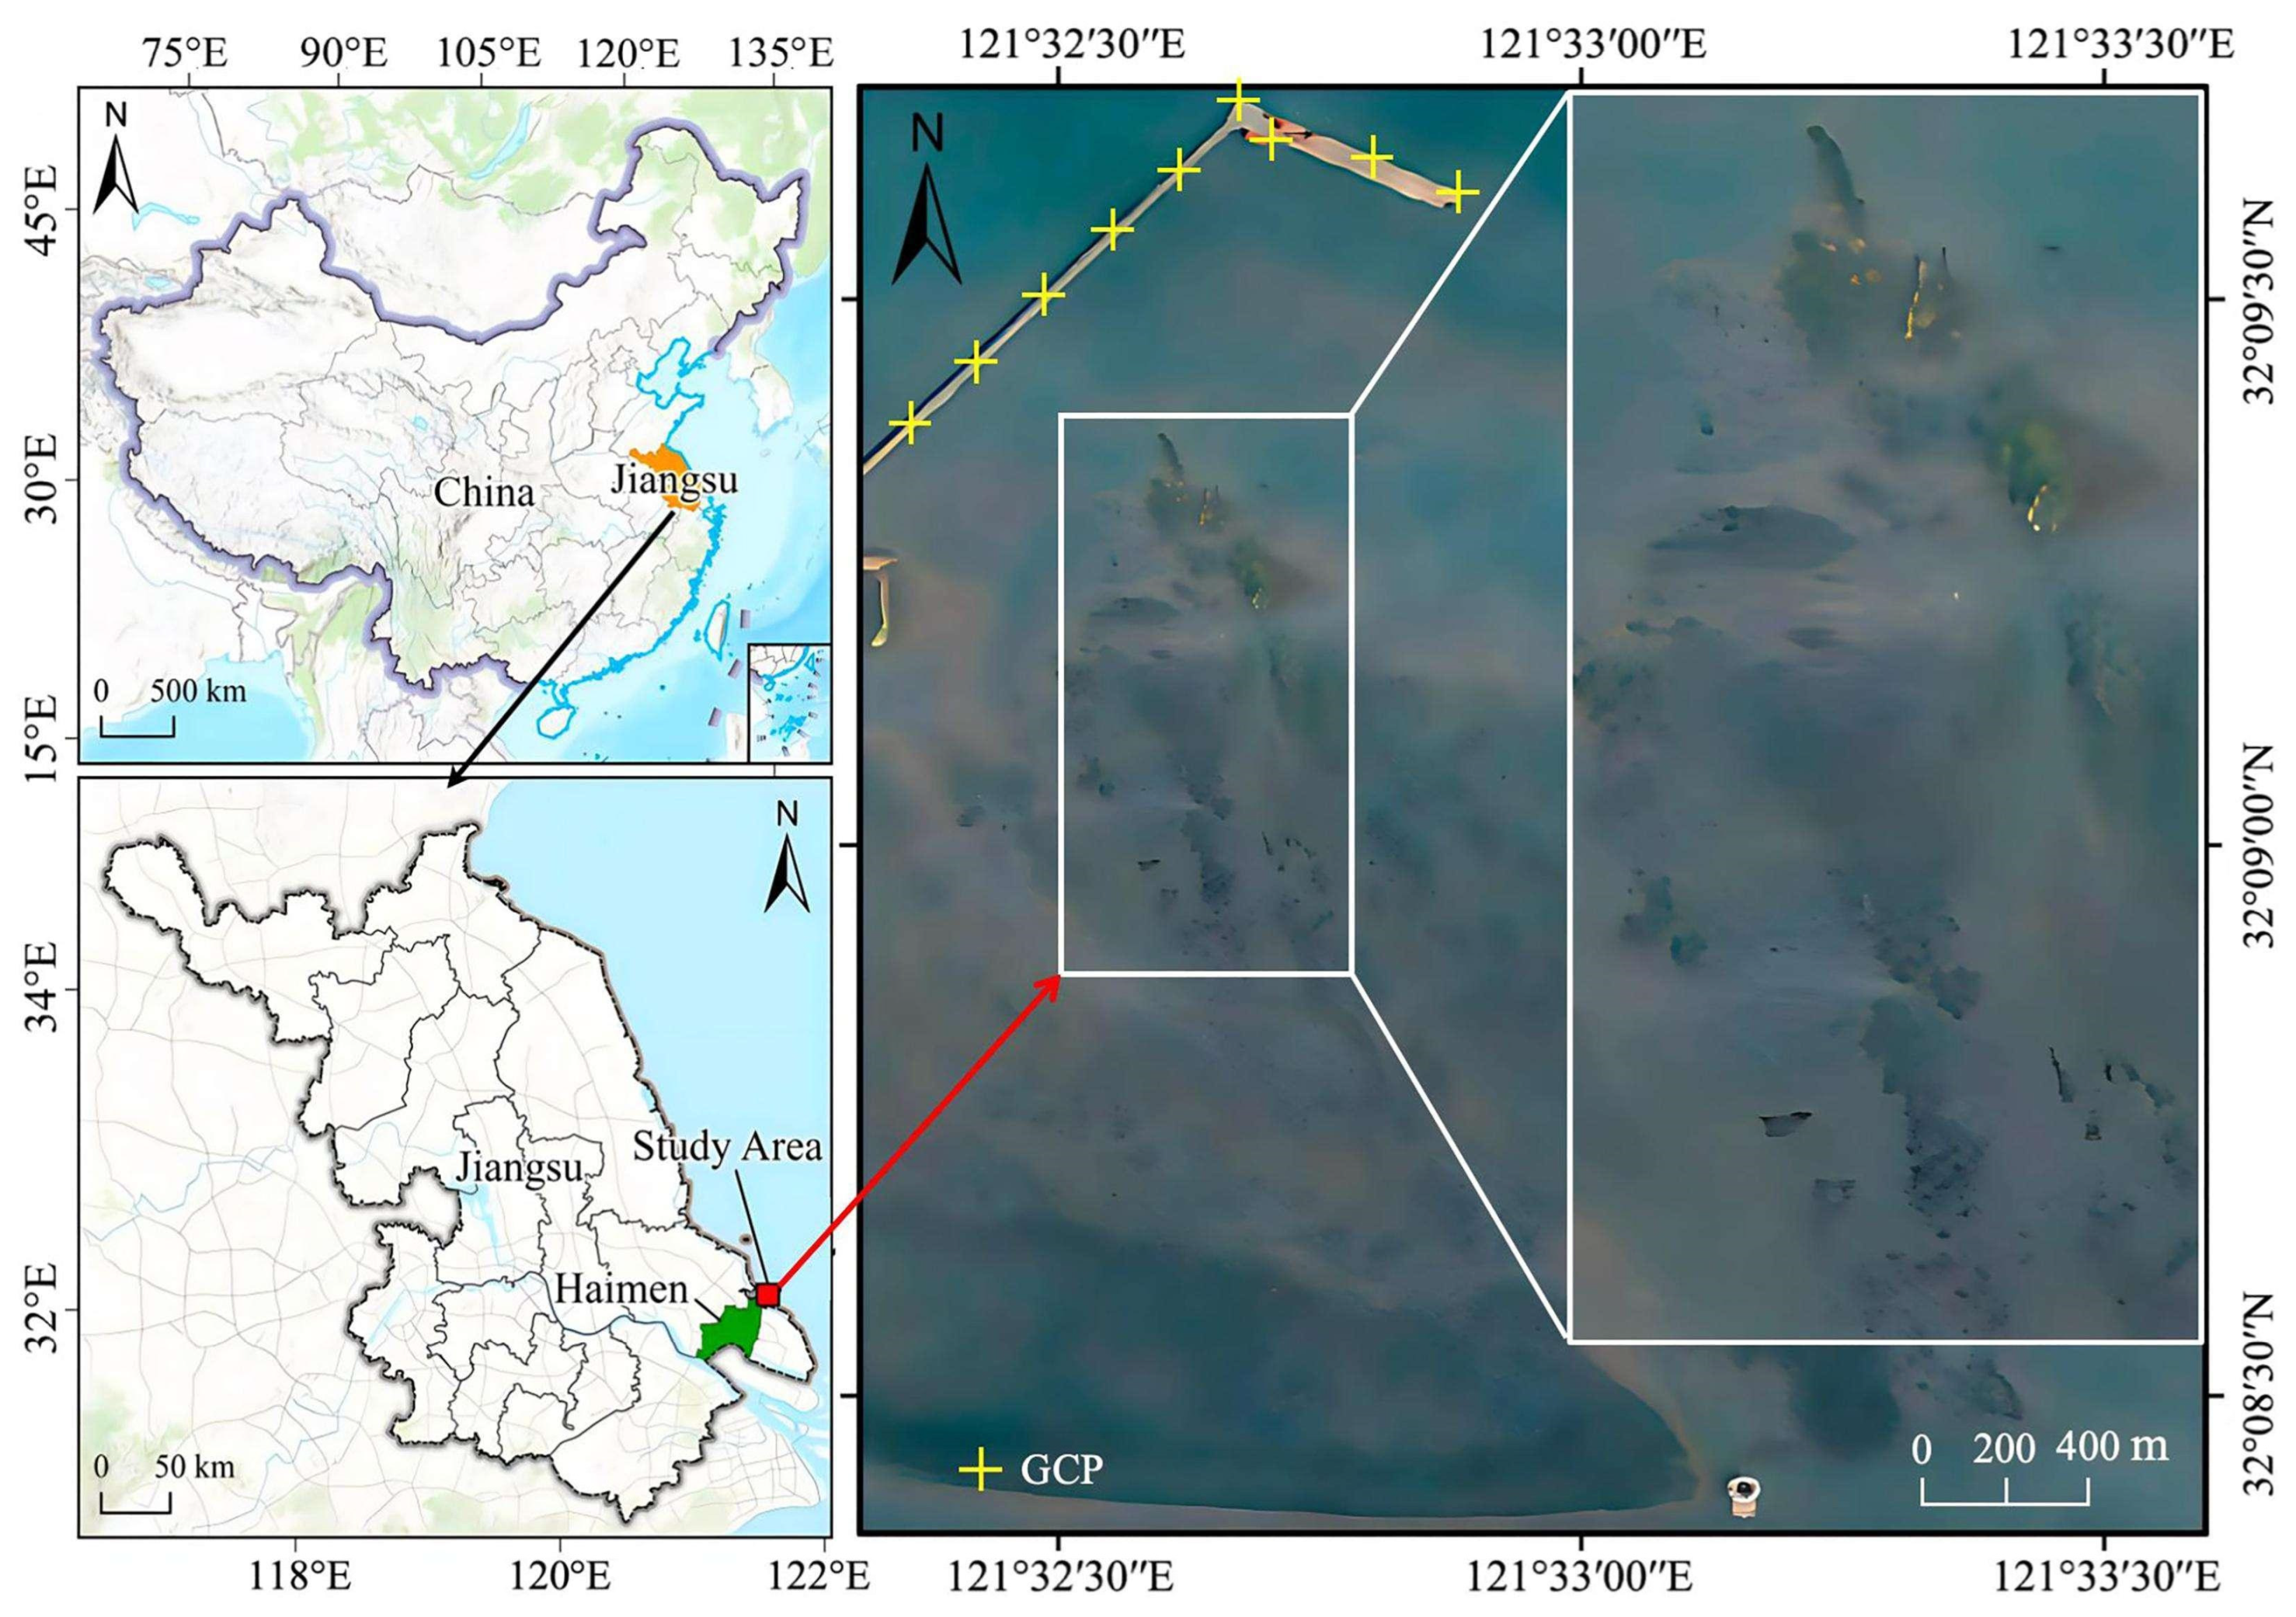
A field survey campaign was conducted from 3 to 8 December 2025 in Nantong City, Jiangsu Province, China. During this period, UAV image acquisition and field investigations were carried out under different tidal and weather conditions. The research area is located within the Haimen Liya Mountain National Marine Park (121°32′15″ E, 32°9′5″ N; see Figure 1), which hosts the largest known intertidal natural oyster reef in China, with a formation history exceeding 1400 years and significant ecological protection and scientific research value [32,33,34].
Figure 1.
Map of the study water area in Nantong City, Jiangsu Province (the icon in the bottom right corner represents a lighthouse).
The oyster reef system consists of multiple oyster species, primarily Crassostrea angulata, Crassostrea ariakensis, Crassostrea sikamea, Crassostrea gigas, and Crassostrea tolonata [35,36]. Among these, C. angulata and C. gigas are also important economically valuable aquaculture species along Chinas coast. The study area lies in an open intertidal zone approximately 1–2 km beyond the Longqiao coastline, with terrain conditions conducive to UAV remote sensing observations. The relatively close coastal distance enables efficient acquisition of high-resolution data despite limited UAV endurance, supporting multi-temporal repeated observations [20,21].
The study area exhibits a dense distribution of oyster reefs with significant spatial variability, with individual reef patches ranging from several square meters to more than 100 square [32,33]. Although high-resolution satellite imagery can provide sufficient spatial resolution for oyster reef identification, satellite overpass times are fixed and often do not coincide with favorable low-tide conditions in intertidal environments [12,13,14,15]. As a result, oyster reefs may not be adequately exposed during image acquisition, limiting the applicability of satellite imagery for routine monitoring [37,38,39]. In contrast, UAV observations can be flexibly scheduled according to both tidal conditions and illumination requirements, making them more suitable for high-precision oyster reef mapping.
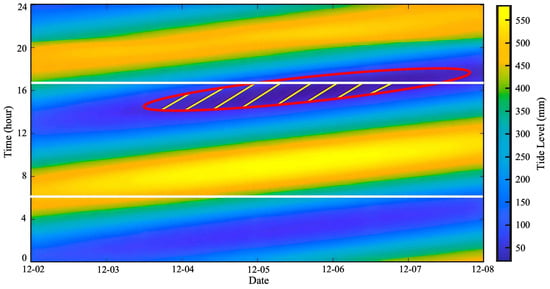
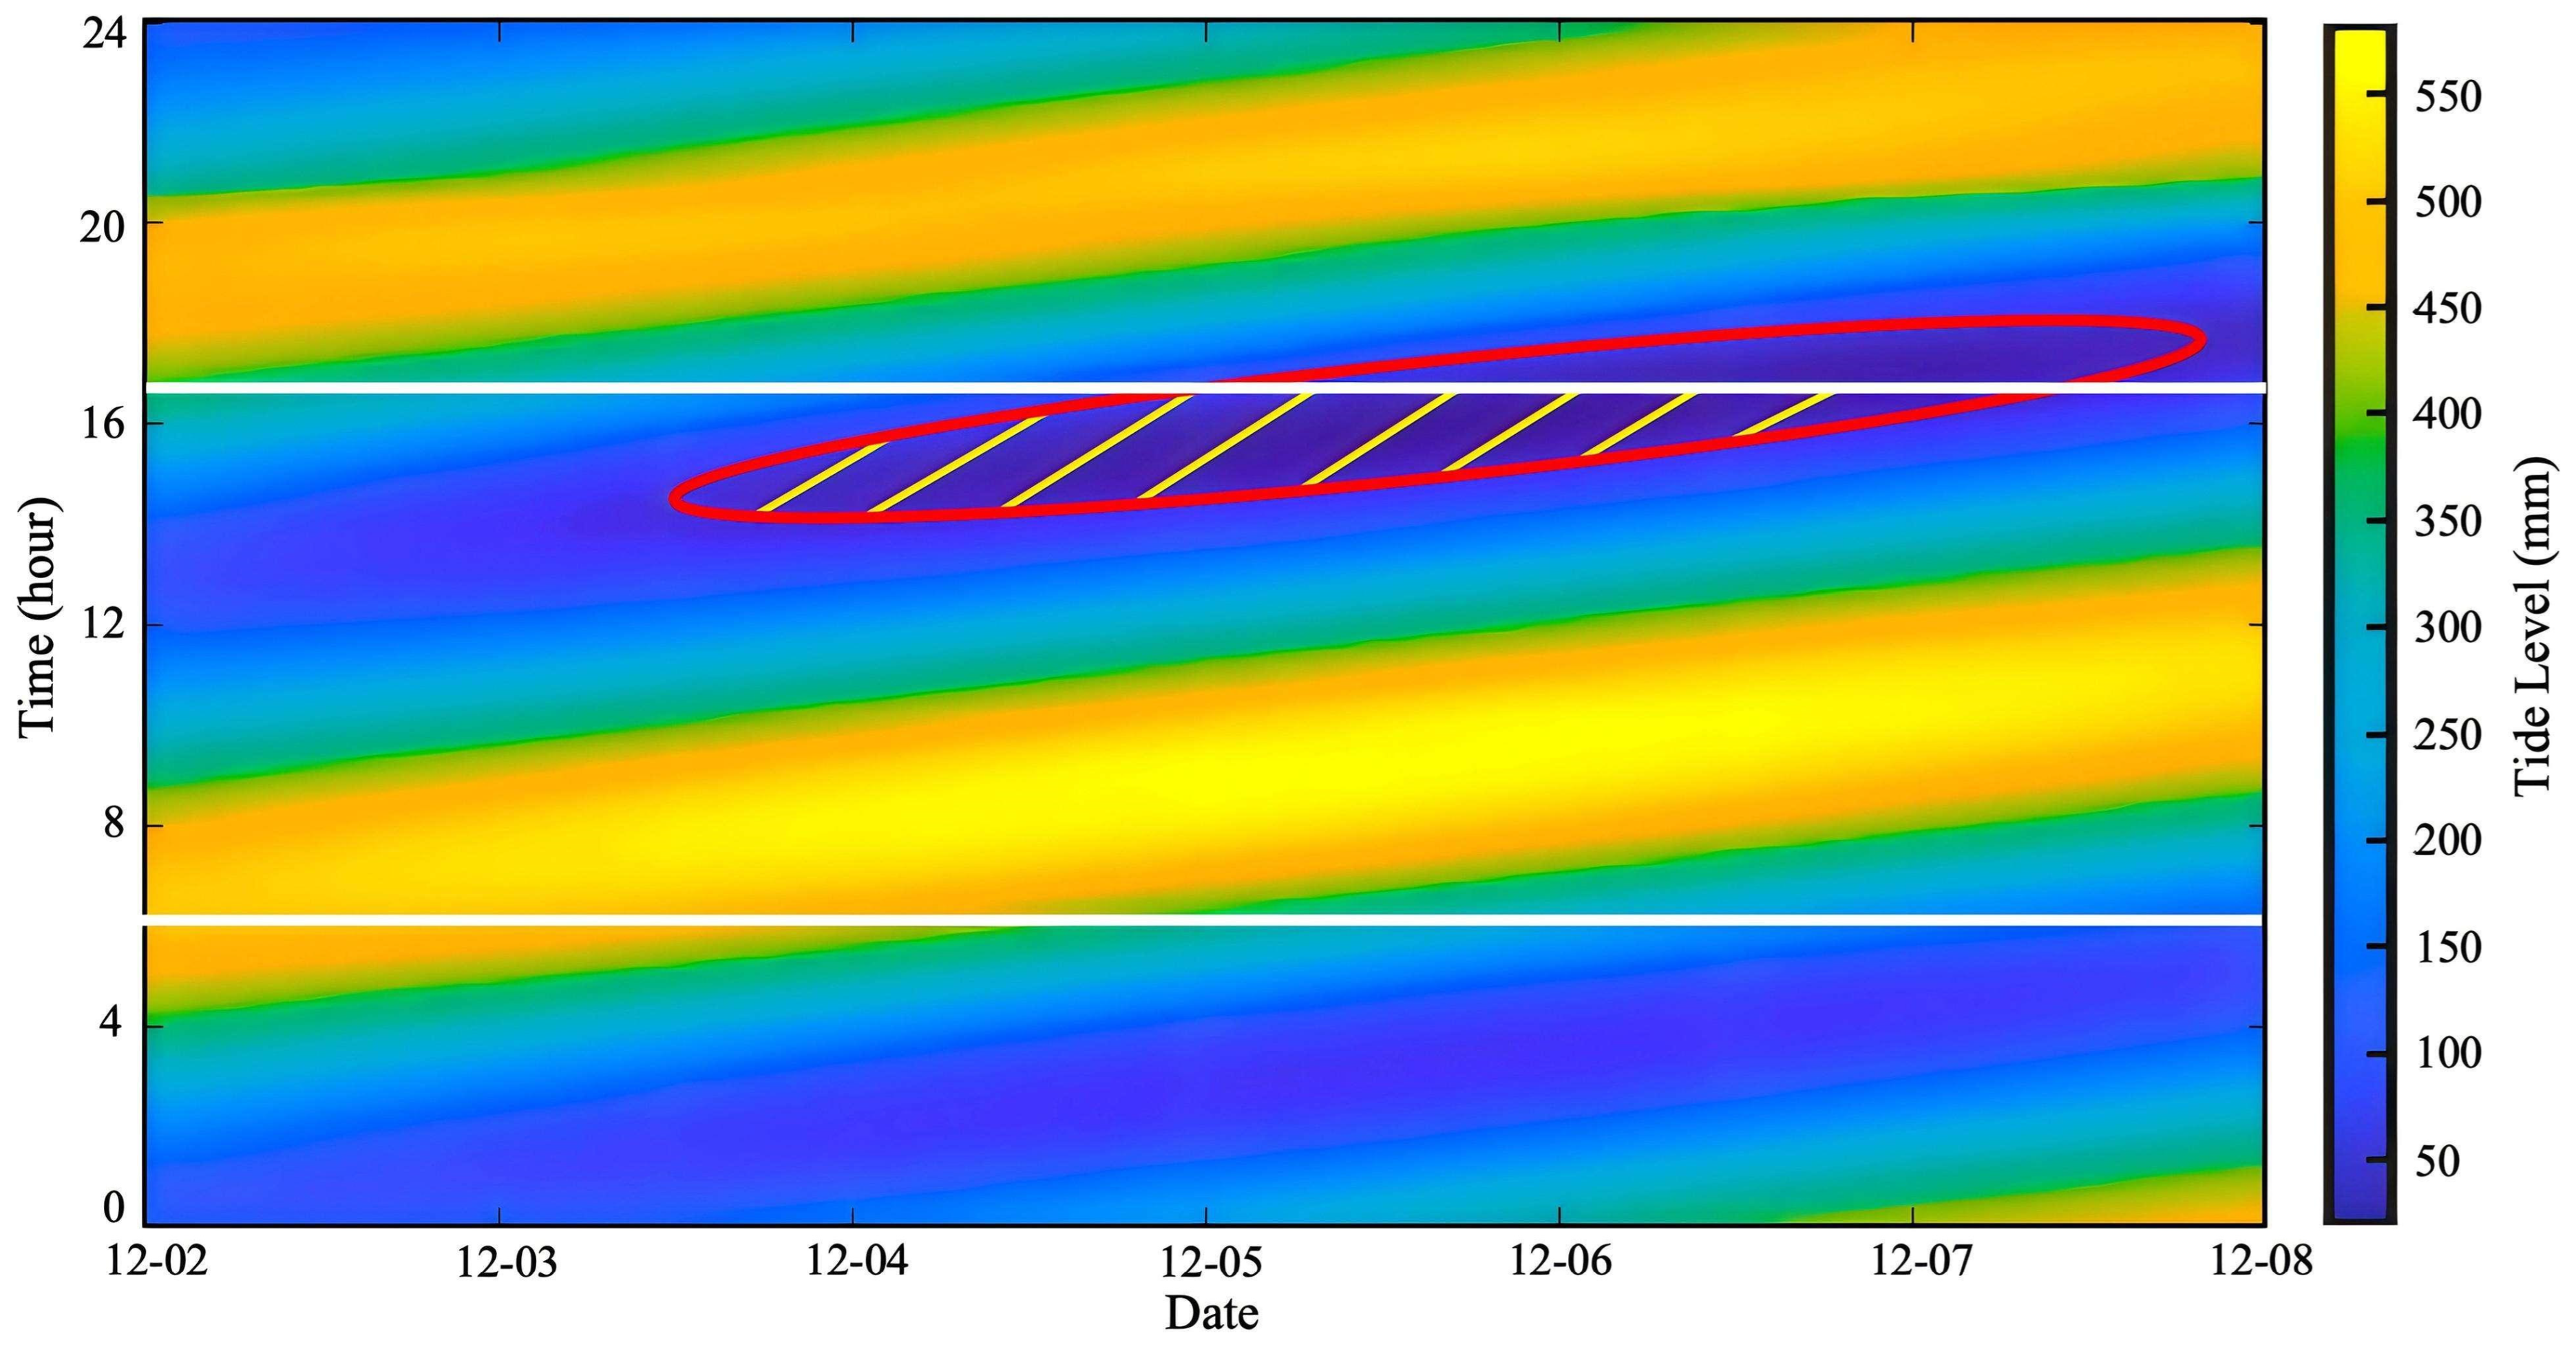
The study area is characterized by a typical semi-diurnal tidal regime, with two high tides and two low tides each day [40,41]. The tidal variations in the Liya Mountain area during the study period are shown in Figure 2. The x-axis represents observation dates, the y-axis represents time (hours), and the color scale indicates tidal elevation (mm). The two white horizontal lines denote the local sunrise and sunset times, respectively. The red ellipse highlights the period with relatively low tidal levels, during which the oyster reefs are more exposed. The yellow hatched area indicates the overlap between daylight hours (after sunrise and before sunset) and low-tide conditions, representing the optimal time window when the oyster reefs are both well illuminated and sufficiently exposed. Unlike a simple low-tide requirement, the periods of maximum oyster reef exposure do not completely coincide with daylight hours. Consequently, the UAV survey time was determined by jointly considering tidal level and solar illumination to ensure that the oyster reefs were sufficiently exposed while maintaining favorable imaging conditions [12,15,16]. Following image quality assessment, including tidal exposure, illumination conditions, and image clarity, the UAV imagery acquired on December 5 was selected for the subsequent SAM-based segmentation and quantitative analysis because it provided the best overall imaging quality.
Figure 2.
The tidal level variation during the UAV survey period.
2.2. Data Acquisition and Preprocessing
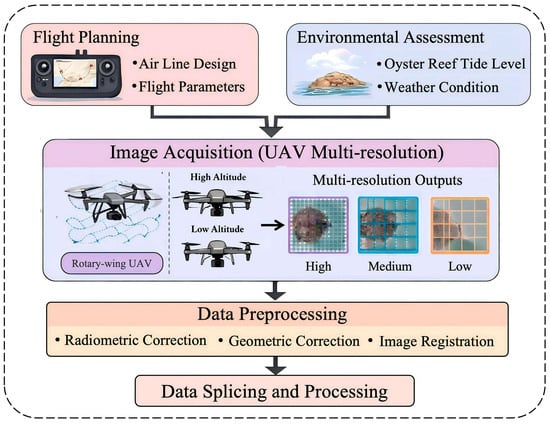
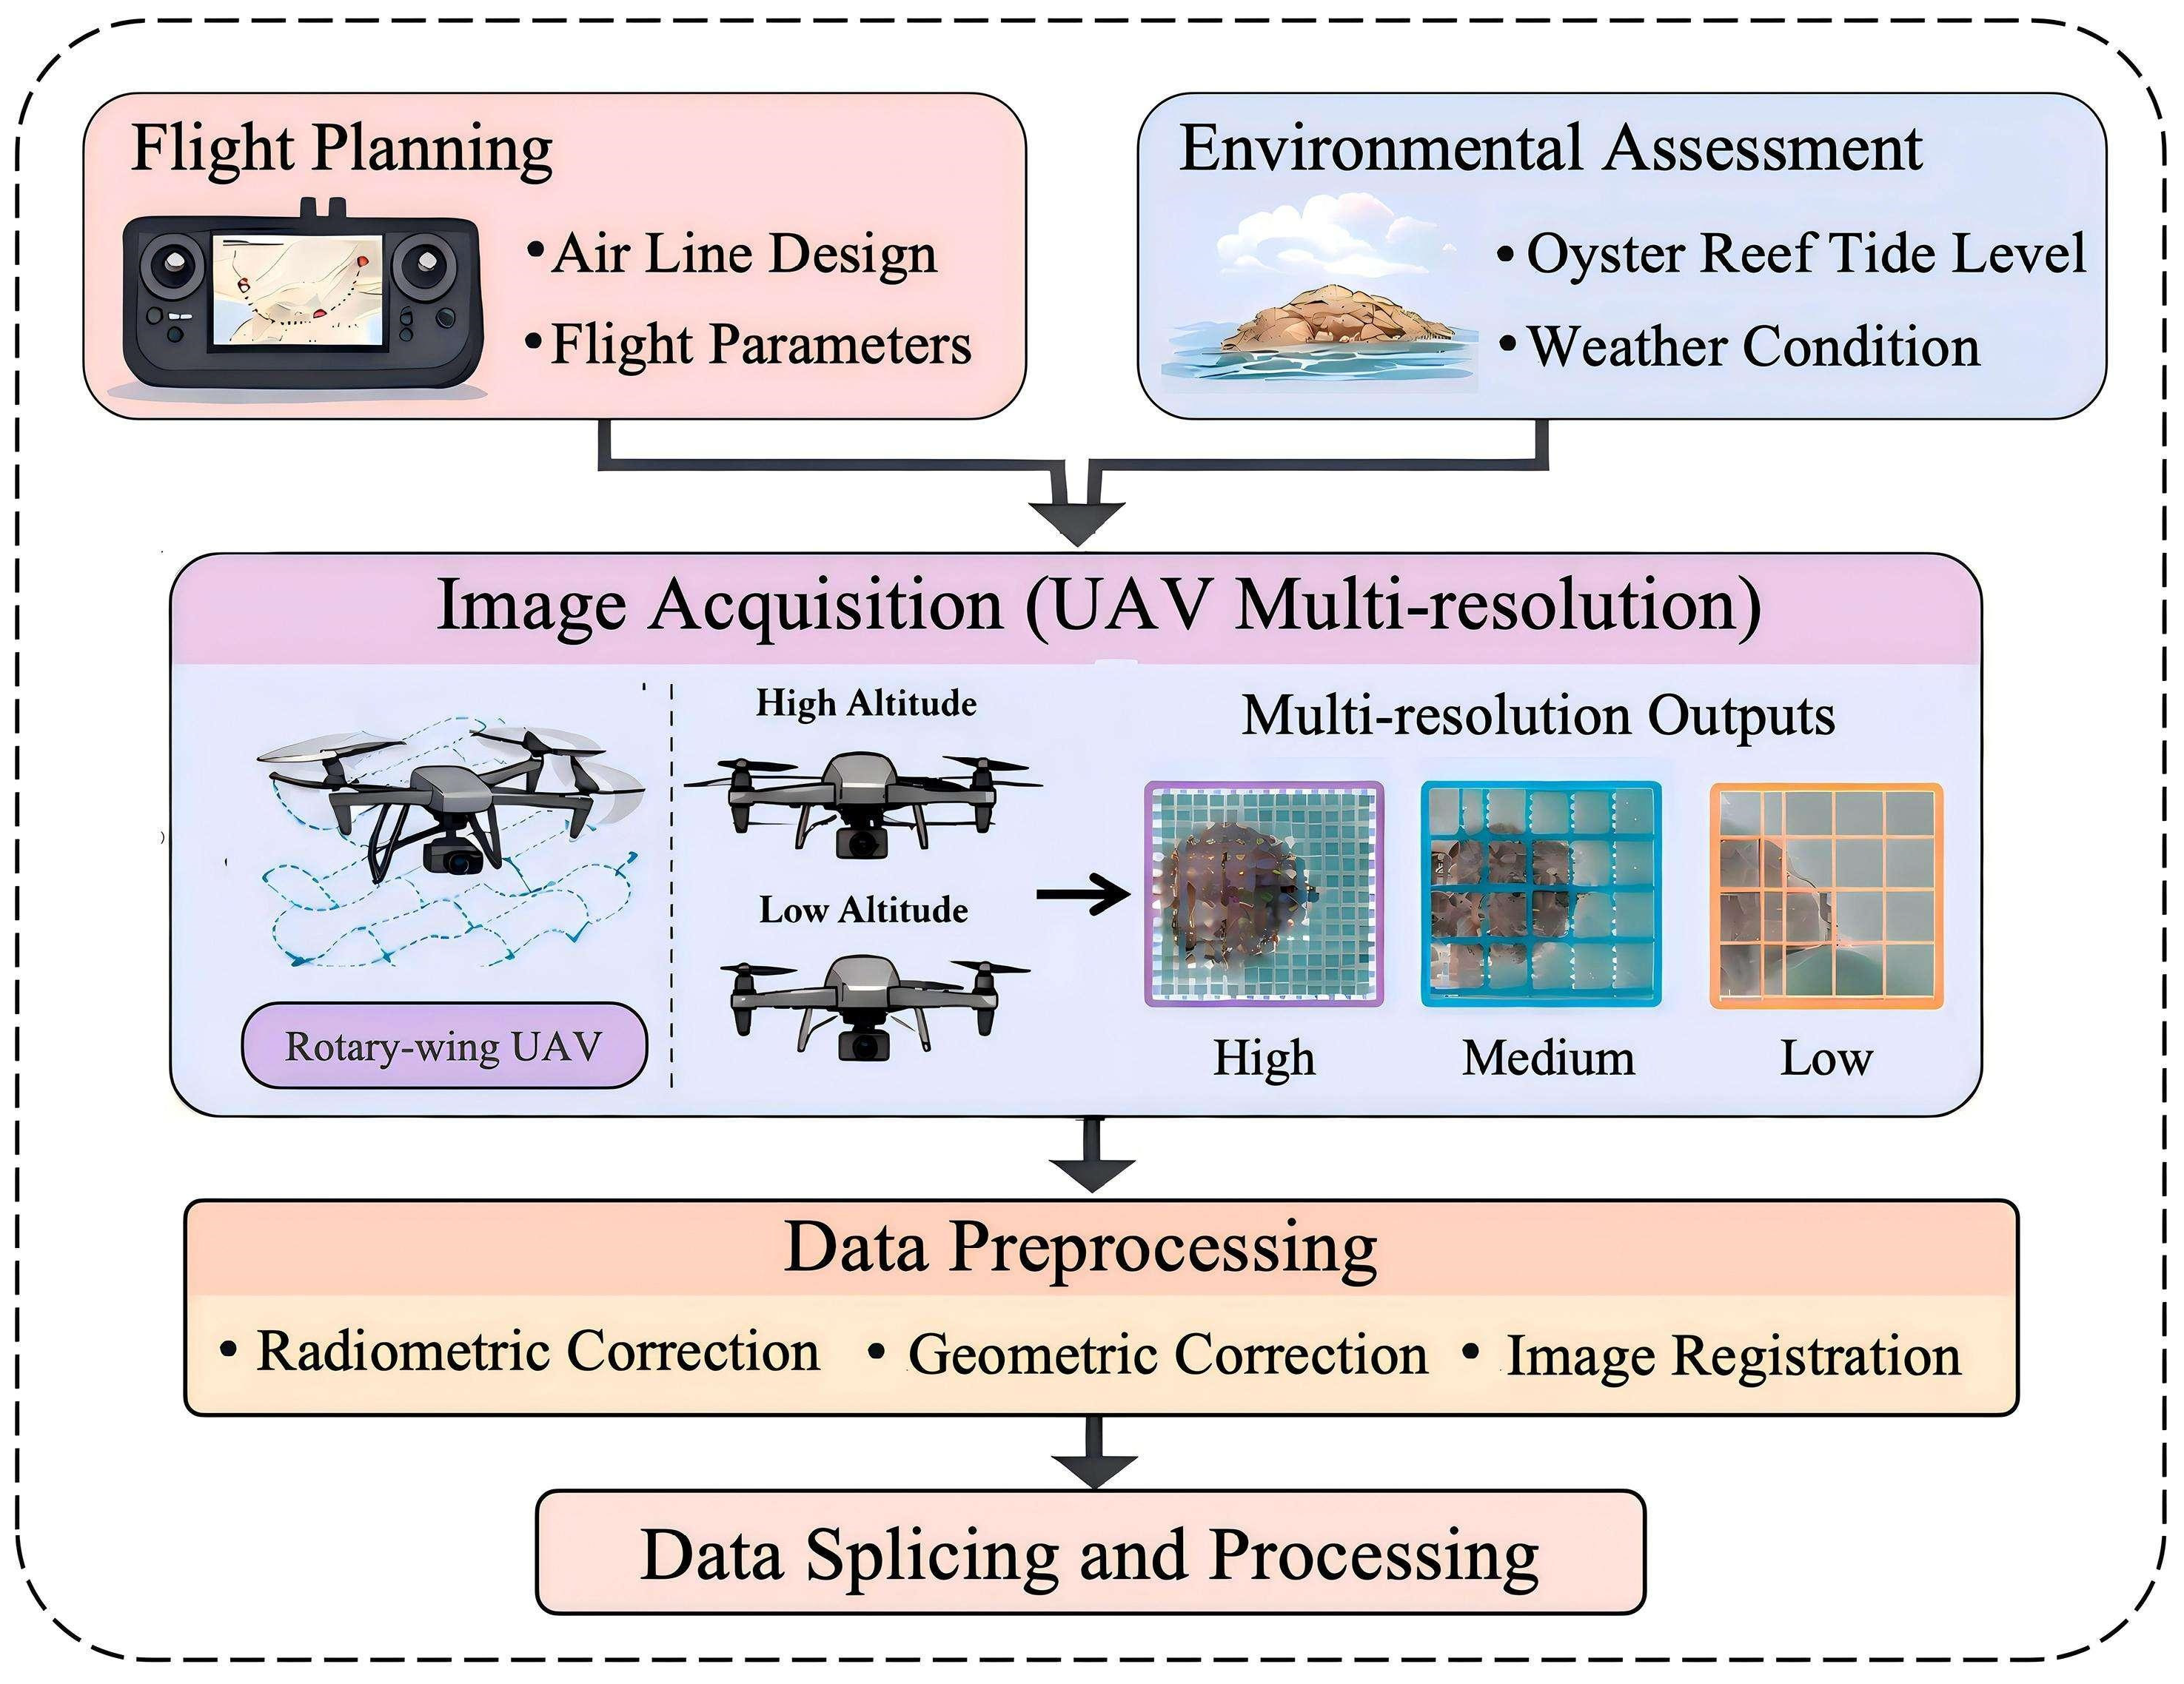
Figure 3 illustrates the workflow of UAV image acquisition and preprocessing adopted in this study. To obtain remote sensing data with both high spatial resolution and multi-scale information, a multi-resolution imaging strategy was implemented using a single multi-rotor UAV operated at different flight altitudes. During flight planning, both flight route design and flight parameters were optimized, while environmental factors, including tidal conditions and weather, were jointly considered to determine the appropriate survey time and ensure high-quality image acquisition.
Figure 3.
Flow chart of UAV images acquiring. Note: Some graphical elements in this figure were created or enhanced using AI-assisted tools, while the scientific content, workflow design, and interpretation were developed by the authors.
During the image acquisition phase, all data were collected using a DJI Matrice 300 RTK multi-rotor UAV (DJI Technology Co., Ltd., Shenzhen, China) equipped with an RGB camera. No LiDAR data were used in this study, and all analyses were based on RGB orthophoto imagery. UAV flights were conducted at four different altitudes (50, 100, 200, and 300 m), generating images with spatial resolutions (GSDs) of 1.36 cm, 2.73 cm, 5.46 cm, and 8.19 cm, respectively, to construct a multi-resolution dataset. Nine Ground Control Points (GCPs) were deployed across the study area and measured using an RTK-GNSS system, providing centimeter-level positioning accuracy and improving geometric correction together with onboard RTK data.
The UAV images were processed in DJI Terra to generate high-resolution orthophoto mosaics (DOMs), including radiometric correction, geometric correction, image stitching, and feature matching using the SIFT algorithm with weighted blending to ensure mosaic consistency. The resulting DOMs served as the input data for subsequent oyster reef segmentation and analysis. Figure 3 illustrates the overall UAV data acquisition and processing workflow.
Prior to data acquisition, the drone flight path was designed based on the topographic features and tidal variation patterns of the study area. To evaluate the influence of spatial resolution on oyster reef extraction, UAV surveys were conducted at four flight altitudes (50, 100, 200, and 300 m), corresponding to different image resolutions (Table 1). For each flight mission, forward and side overlap rates were maintained at 80% and 70%, respectively, to ensure sufficient image overlap and geometric consistency during image stitching. Given the significant influence of light and tidal levels on intertidal zones, drone operations were scheduled between 16:30 and 17:30 daily to obtain image data of oyster reefs under low-tide exposure conditions. After data collection, the acquired imagery and flight records underwent quality assessment, while meteorological conditions and tidal level information were simultaneously recorded to improve the reliability and reproducibility of data interpretation.
Table 1.
UAV Experimental Operation Parameters.
During the data-processing phase, DOM (Digital Orthophoto Map) images and their corresponding positioning information are first processed. Geometric correction of the images is performed using AT (aerial triangulation) and bundle adjustment methods, yielding high-precision orthophotos. Throughout this process, RTK positioning data from drones enhances spatial positioning accuracy, ensuring geometric consistency and spatial precision of the data.
To produce high-quality imaging products, unified Ortho photogrammetric correction and spatial registration were applied to the UAV RGB images acquired by the DJI Matrice 300 RTK. A total of nine Ground Control Points (GCPs) were evenly distributed across the study area, including both the boundary and central regions, and their coordinates were measured using a Real-Time Kinematic Global Navigation Satellite System (RTK-GNSS), providing centimeter-level positioning accuracy. During image processing, DJI Terra (Version 4.0) combined the onboard RTK positioning data with the GCPs to perform aerial triangulation and geometric optimization, thereby improving the absolute positional accuracy of the orthophoto products. The Scale-Invariant Feature Transform (SIFT) algorithm was employed to automatically identify and match tie points between overlapping images, ensuring robust image alignment and geometric consistency. Weighted blending was subsequently applied to minimize brightness differences and stitching seams in overlapping regions. Finally, orthorectification, projection transformation, and geometric correction were performed to generate high-precision digital orthophoto maps (DOMs).
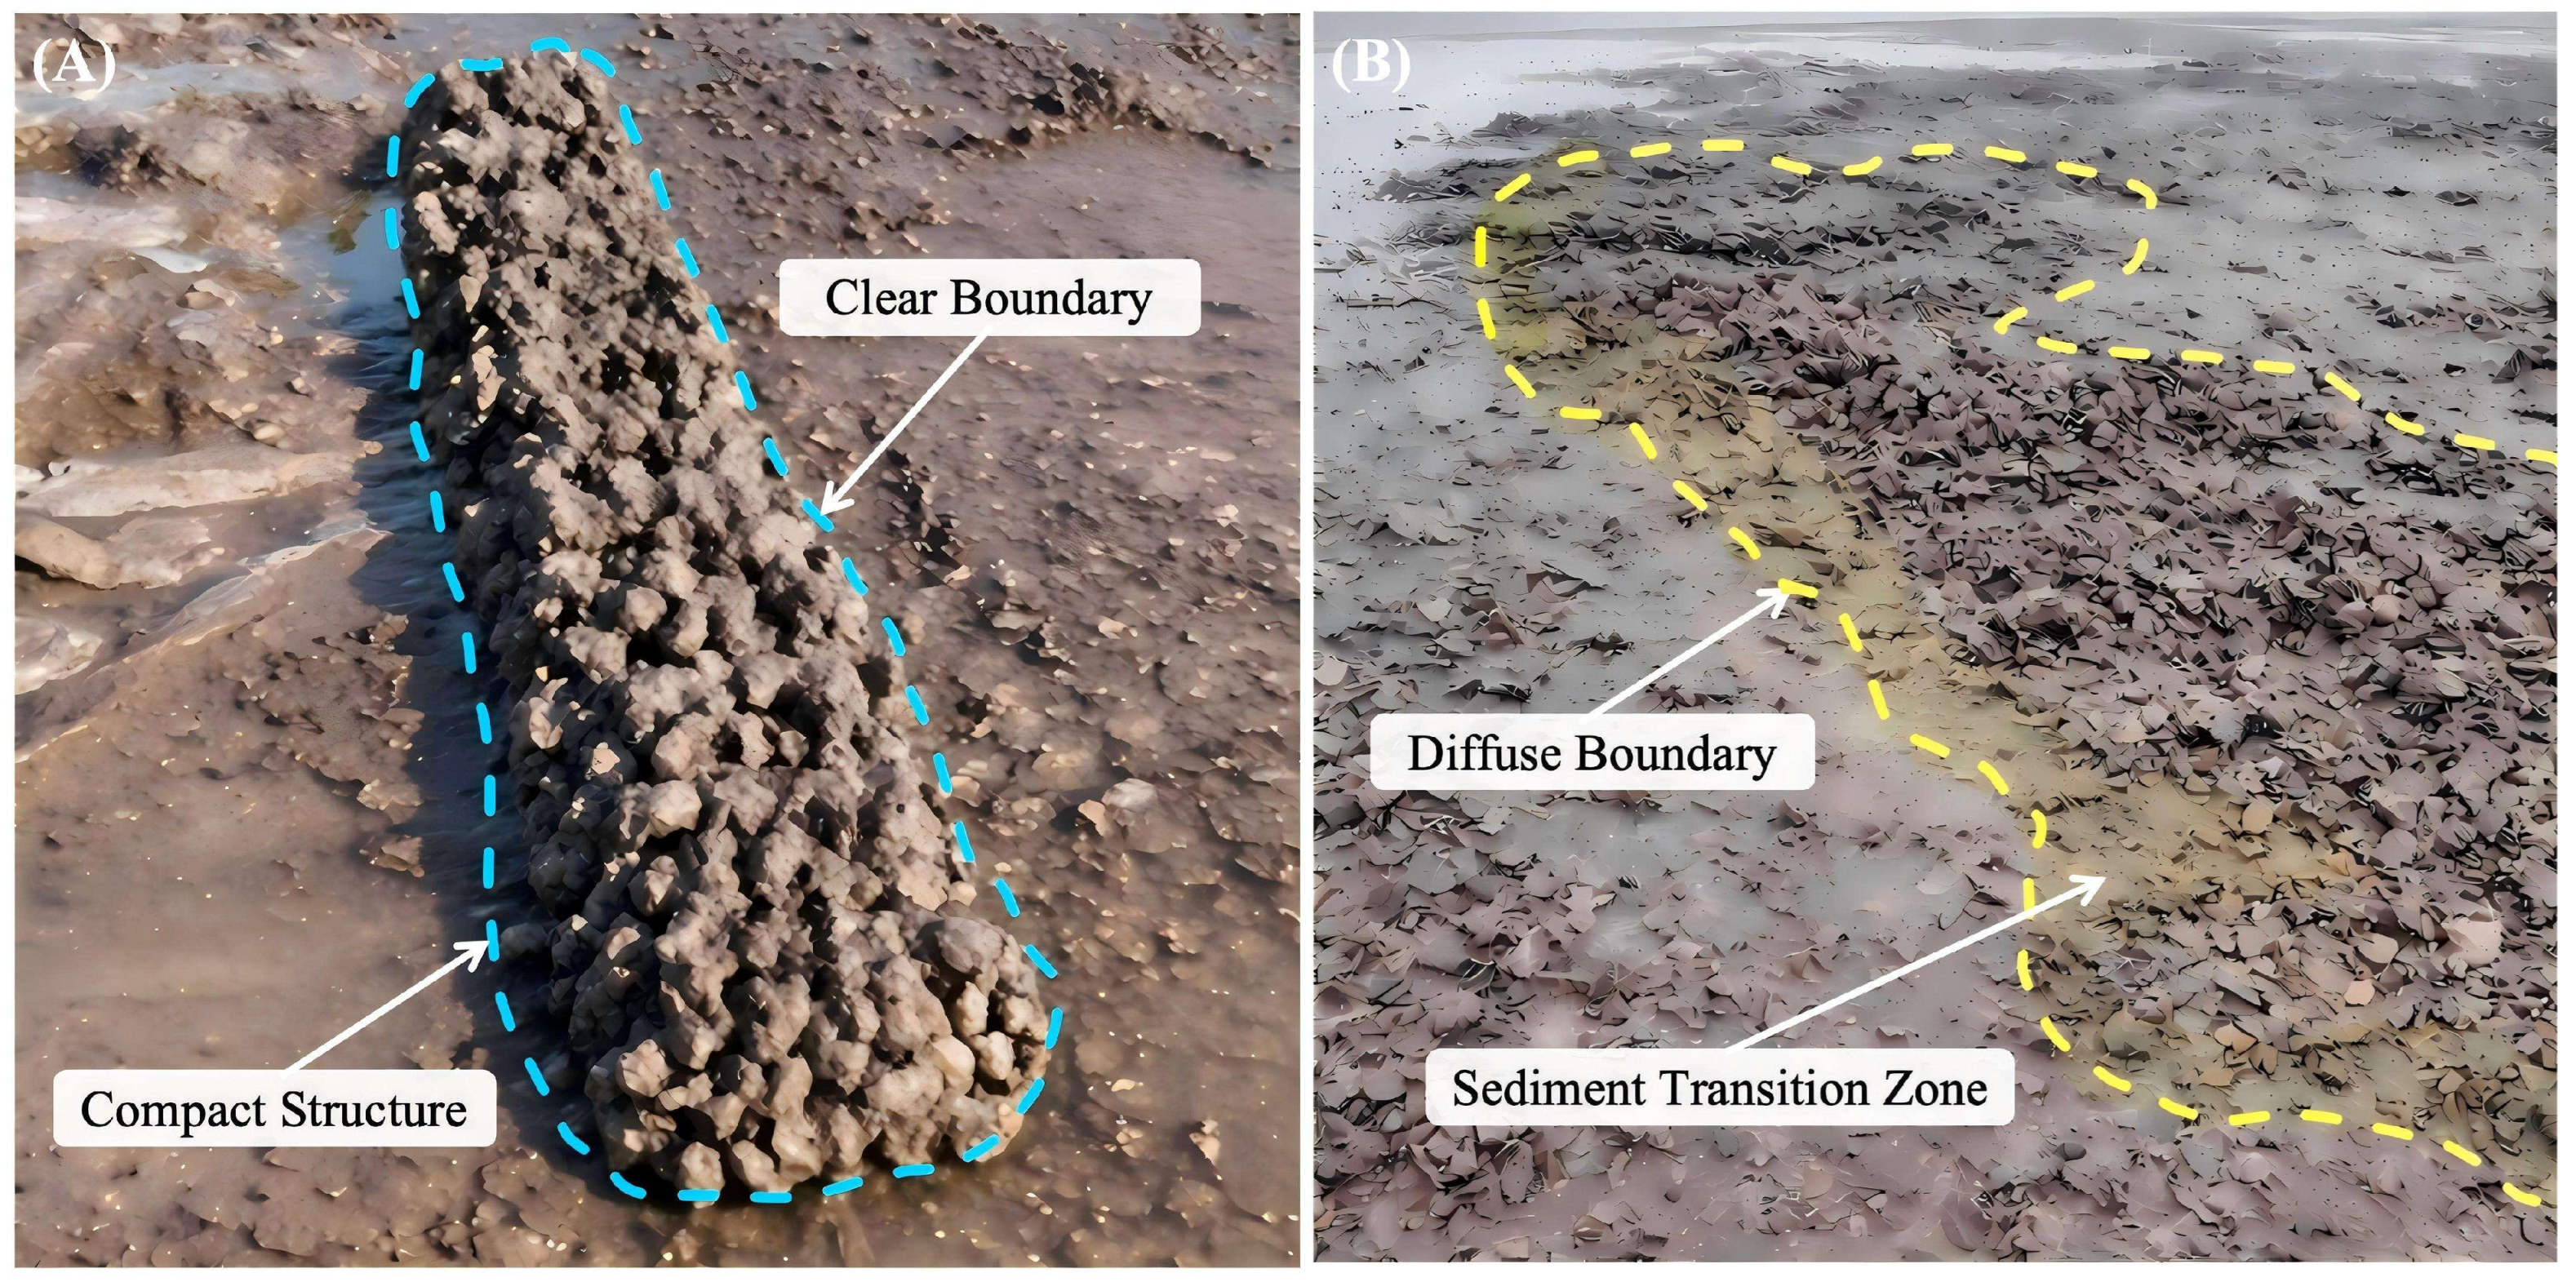
To validate the remote sensing interpretation results, field surveys were conducted during low tide, when the oyster reefs were fully exposed. Close-range photographs of representative oyster reef patches were acquired, and their locations were recorded using a handheld RTK-GNSS receiver. The field investigation focused on documenting reef boundary characteristics, shell accumulation patterns, and their spatial relationship with the surrounding tidal flats. As shown in Figure 4, small-scale oyster reefs generally exhibit compact structures with well-defined boundaries, whereas large-scale oyster reefs display gradual transitions between the reef margins and adjacent sediments, resulting in relatively diffuse boundaries. These field observations were qualitatively compared with the UAV-derived orthophotos and the SAM segmentation results to verify the consistency of reef morphology and boundary delineation, thereby providing ground-truth reference data for the interpretation of the remote sensing imagery.
Figure 4.
Field photographs illustrating the boundary characteristics of small and large oyster reefs in the study area. (A) The boundary of the small oyster reef; (B) The boundary of the large oyster reef.
2.3. Segment Anything Model
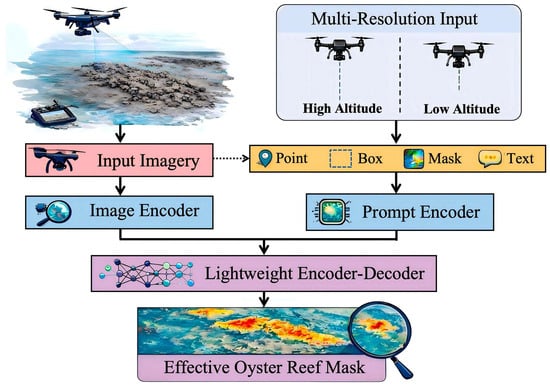
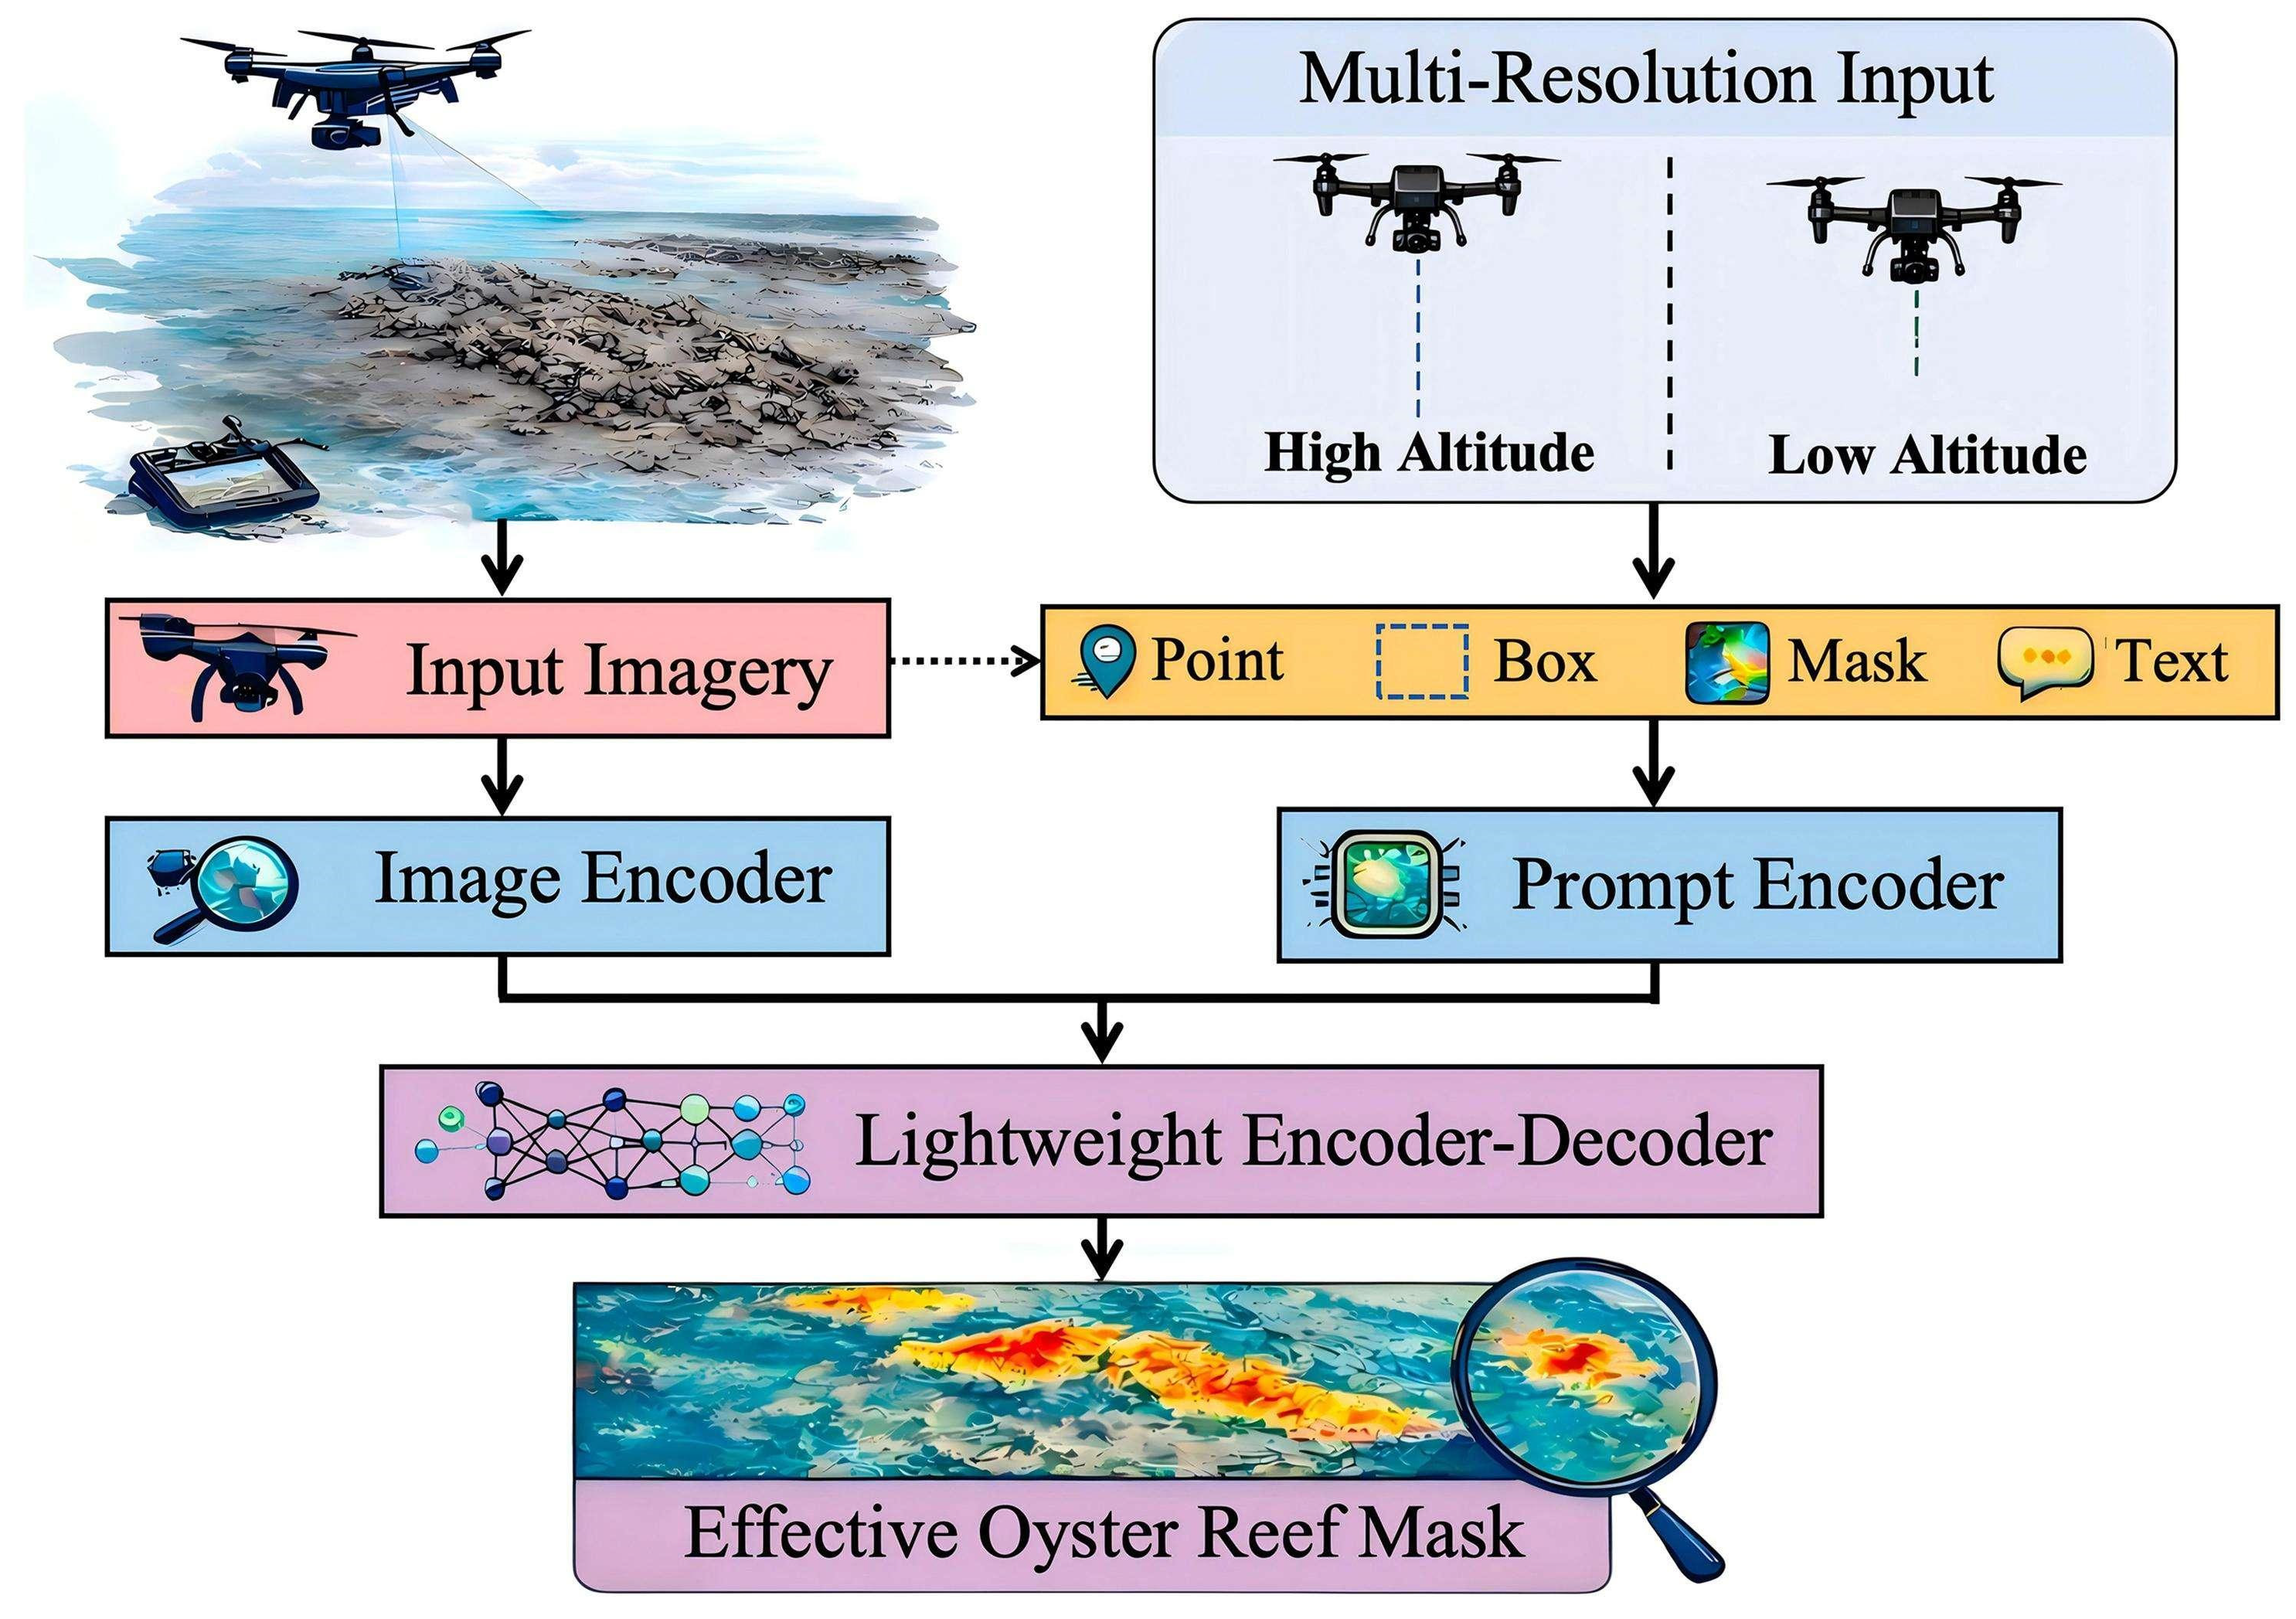
The SAM, developed by Meta AI (Meta Artificial Intelligence), is a deep learning image segmentation framework designed for general-purpose scenarios [42]. Unlike traditional segmentation methods that rely on task-specific training data, the SAM demonstrates zero-shot segmentation capability, enabling direct application to unseen data without additional task-specific training or parameter tuning. The SAM was pre-trained on the SA-1B dataset, which contains more than 1 billion segmentation masks generated from approximately 11 million diverse, licensed images covering a wide range of natural scenes, objects, and imaging conditions [43,44]. Although this dataset does not specifically include UAV imagery of oyster reefs or intertidal environments, its diversity enables the SAM to learn general object representations and boundary characteristics, providing strong generalization ability across different image domains. Structurally, as shown in Figure 5, the SAM consists of three key modules: the Image Encoder, the Prompt Encoder, and the Mask Decoder. The Image Encoder extracts feature from the input image, mapping it to a high-dimensional feature space to capture rich visual semantic information. The Prompt Encoder processes various auxiliary inputs—including points, bounding boxes, and existing masks—to enable interactive segmentation control based on prompts. The Mask Decoder then generates the final segmentation result by integrating image features with prompt information.
Figure 5.
Working Principle of the SAM. Note: Some graphical elements in this figure were created or enhanced using AI-assisted tools, while the scientific content, workflow design, and interpretation were developed by the authors.
Specifically, the mask-decoding process integrates global semantic information from the image encoder with local constraint information provided by the prompt encoder to extract target regions from high-dimensional feature spaces, producing segmentation masks with excellent spatial consistency and clear boundaries. Through the synergistic interaction of these three modules, the SAM rapidly generates high-quality segmentation results across diverse input formats and complex scenarios, demonstrating strong adaptability and application potential in various fields such as remote sensing analysis [28].
Recently, the SAM has been increasingly applied in remote sensing image analysis due to its strong zero-shot segmentation capability. Luo et al. [45] further adapted the SAM for remote sensing instance segmentation and demonstrated that appropriate fine-tuning and prompt design significantly improve segmentation performance on high-resolution remote sensing imagery. Moghimi et al. [30] successfully applied the SAM to river water extraction under complex environmental conditions. Gallagher et al. [31] further extended the SAM to multispectral image labeling, highlighting its potential for remote sensing applications beyond conventional RGB imagery. These studies demonstrate the adaptability of the SAM across diverse remote sensing scenarios. However, its application to intertidal oyster reef extraction remains limited, particularly under complex tidal and illumination conditions, which motivates the present study.
2.4. Random Forest Classification Methodology
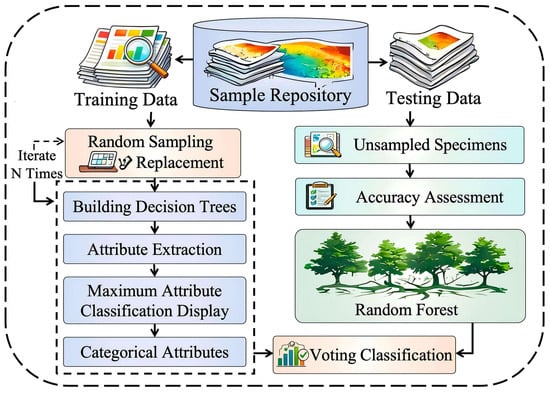
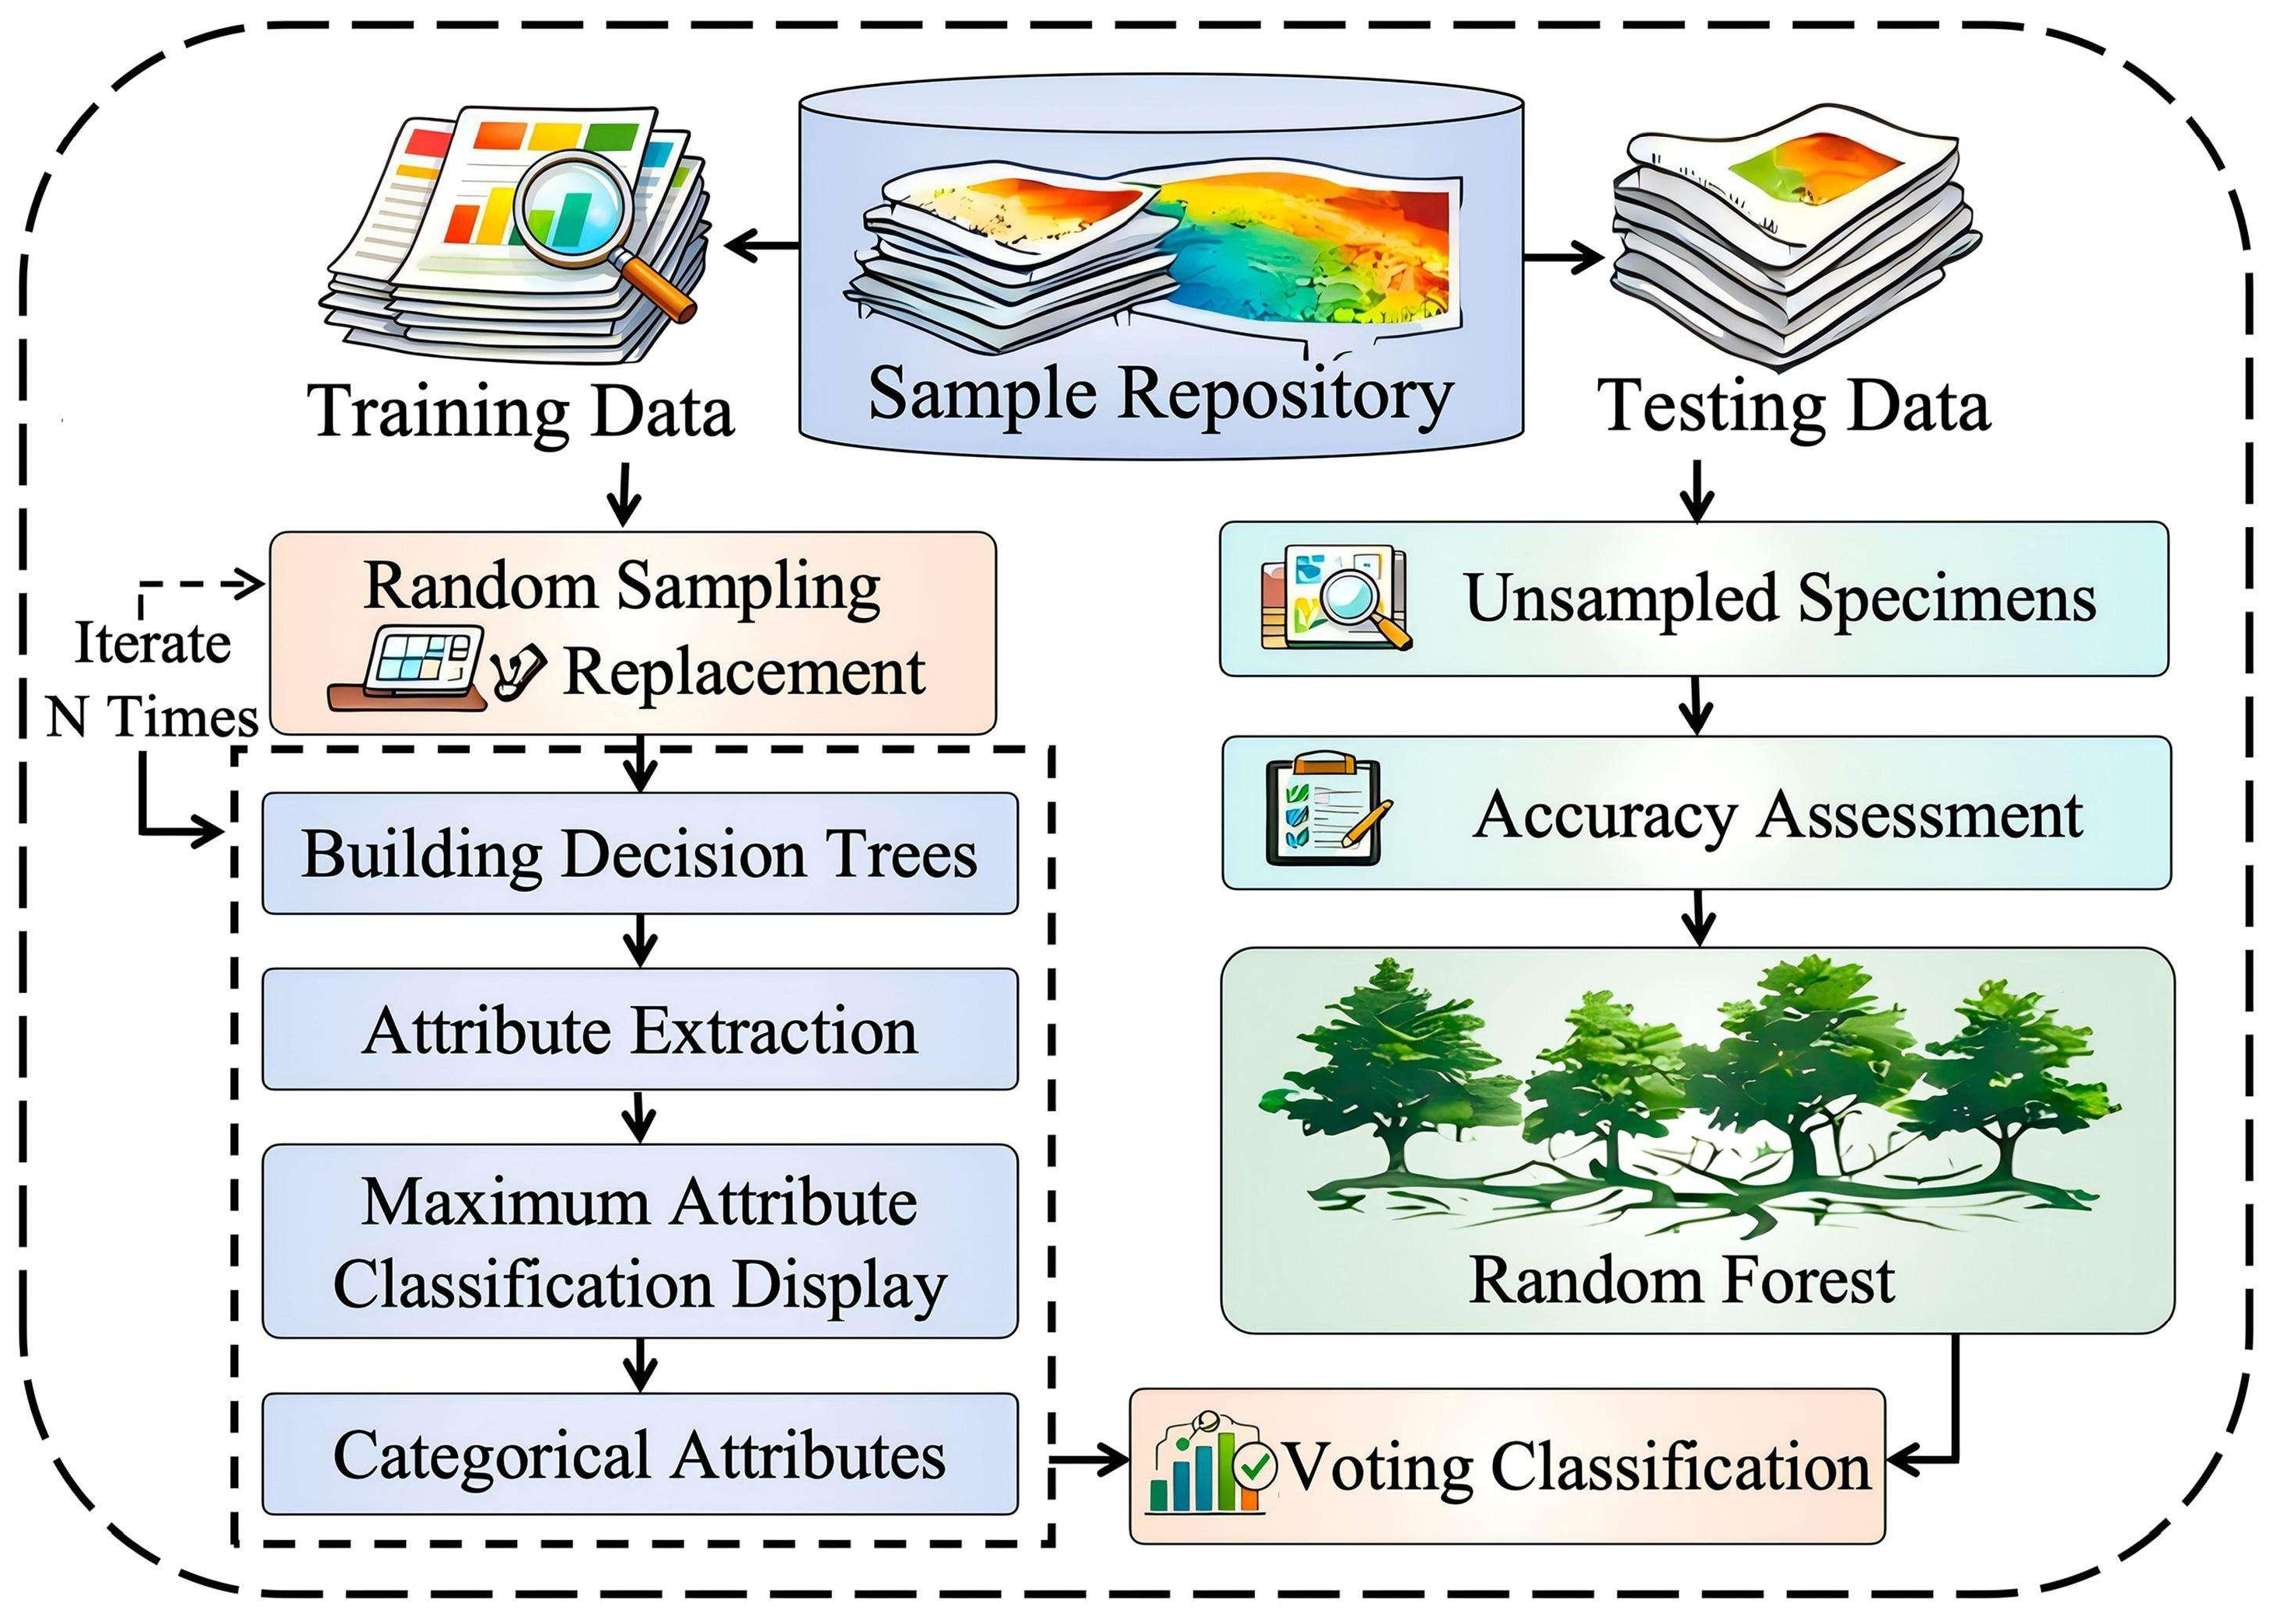
In the automated extraction framework based on the SAM proposed in this study, the RF (Random Forest) algorithm is employed to further refine the segmentation results, thereby enhancing the accuracy and stability of oyster reef spatial distribution extraction. Compared to target recognition methods that rely solely on segmentation outputs, this approach integrates multidimensional feature information to conduct a secondary screening of candidate regions identified by the SAM, effectively mitigating the impact of incorrect segmentation, as shown in Figure 6.
Figure 6.
Flowchart of the Random Forest Algorithm. Note: Some graphical elements in this figure were created or enhanced using AI-assisted tools, while the scientific content, workflow design, and interpretation were developed by the authors.
First, the segmentation masks generated by the SAM were used to identify potential candidate areas of oyster reefs. To refine these candidate regions, the SAM candidate masks were divided into 16 × 16-pixel tiles, and spectral and texture features were extracted from each tile-level sample for Random Forest classification. Candidate tiles containing fewer than 12 SAM pixels were excluded to avoid unstable feature statistics caused by insufficient target pixels. In total, 1365 tile-level samples were used for RF training, including 673 positive oyster reef samples and 692 negative non-reef/background samples, with a positive-to-negative ratio of 673:692. Positive and negative labels were assigned according to the spatial overlap between the SAM candidate tiles and the manually interpreted oyster reef reference masks.
Each RF sample was represented by a 9-dimensional feature vector. The spectral features included the mean digital values of the red (R), green (G), and blue (B) channels, as well as the mean image brightness of each candidate tile. For texture characterization, Gray-Level Co-occurrence Matrix (GLCM)-based texture descriptors, including contrast, homogeneity, entropy, correlation, and angular second moment (ASM), were extracted to describe the spatial structural characteristics of oyster reefs. These spectral and texture features were subsequently combined to establish a comprehensive feature set integrating spectral and spatial structural information, thereby improving the discrimination between oyster reefs and surrounding tidal flat backgrounds [46].
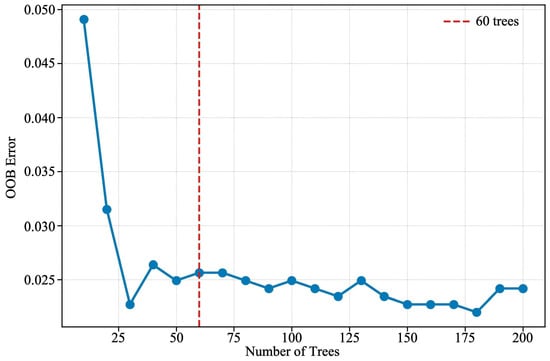
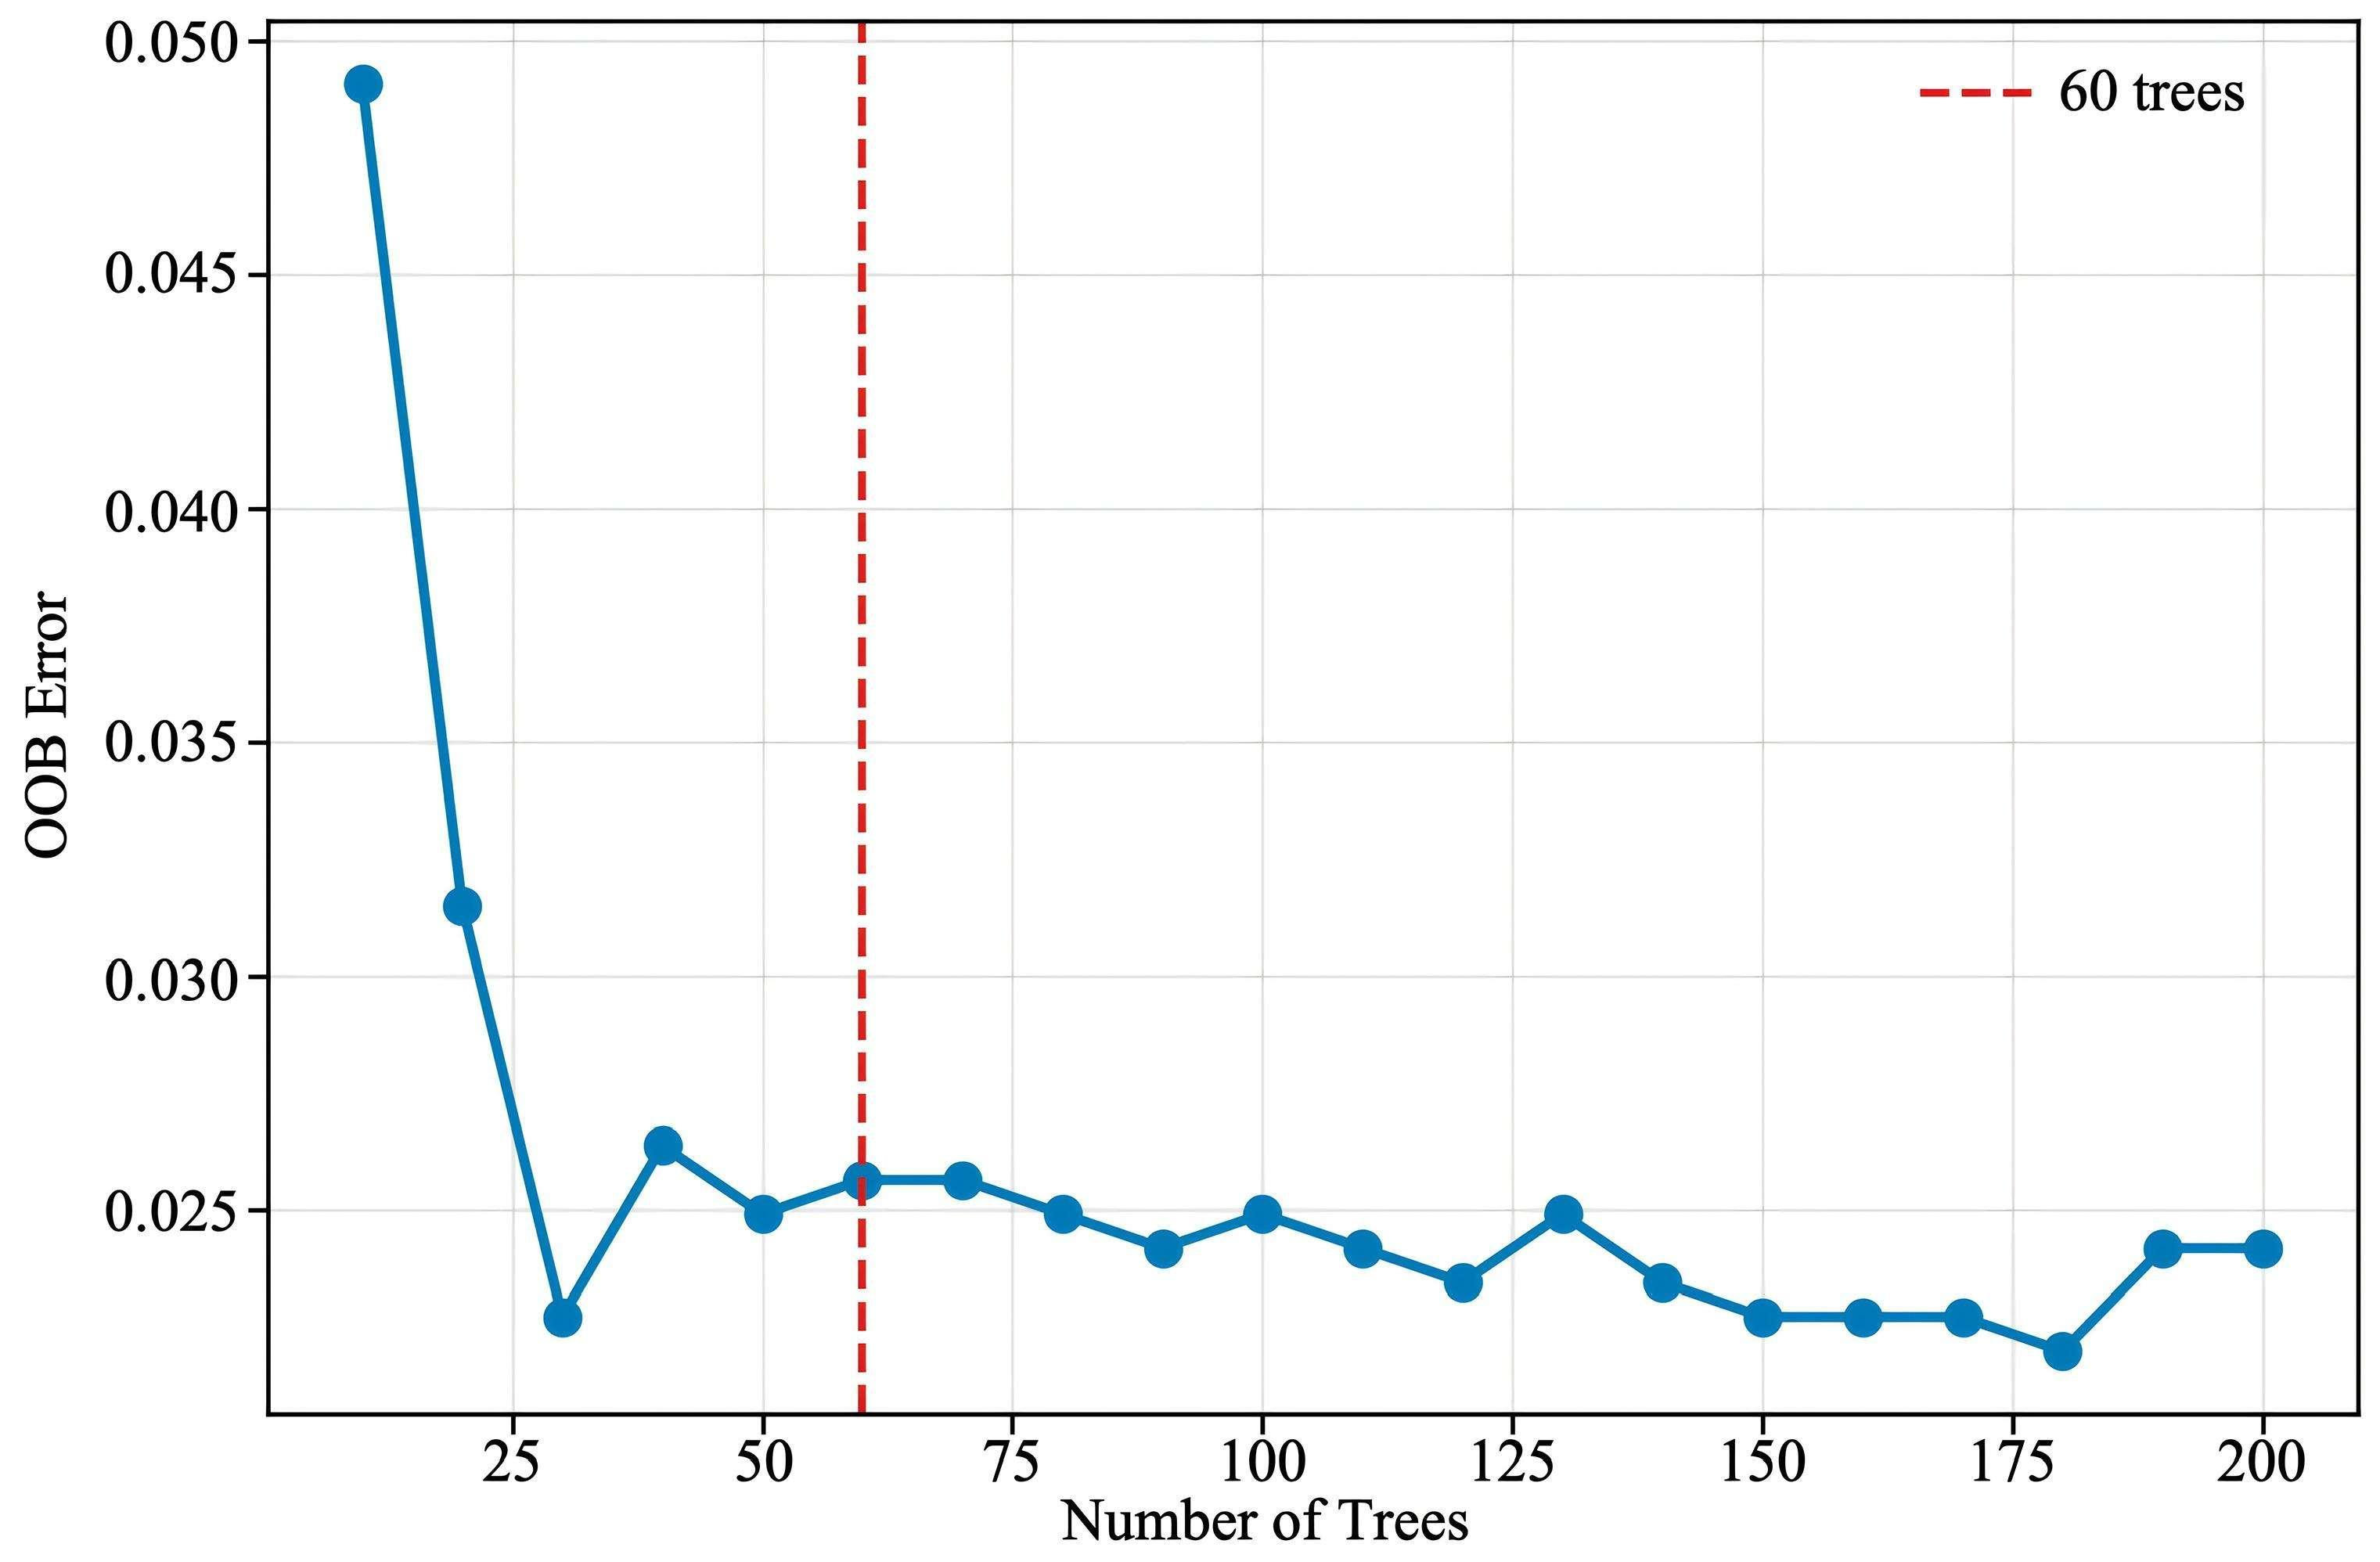
The Random Forest classification model was implemented using Scikit-learn (version 1.4.0) [47,48]. Bootstrap sampling was enabled during model training, and an individual decision tree was trained based on each bootstrap sample. The maximum number of features considered at each node was set to the square root of the input feature dimension to improve model generalization and reduce the risk of overfitting. To determine an appropriate number of decision trees and evaluate the stability of the RF classifier, the Out-of-Bag (OOB) error was calculated for RF models with 10–200 trees. As shown in Figure 7, the OOB error decreased rapidly when the number of trees increased from 10 to 30 and then fluctuated within a relatively narrow range. After approximately 60 trees, the OOB error remained generally stable, indicating that further increasing the number of trees contributed limited additional improvement. Therefore, 60 trees, marked by the red dashed line in Figure 7, were selected for the final RF model. The final classification result was determined by majority voting among all decision trees [49,50].
Figure 7.
Variation in Out-of-Bag (OOB) error with the number of decision trees in the Random Forest model.
In the overall workflow, SAM segmentation and Random Forest classification form a two-stage collaborative processing strategy. The SAM first extracts potential target regions from complex backgrounds, while the random forest model further utilizes multidimensional features to perform precise discrimination of these regions. This approach effectively narrows the classification scope, enabling the model to identify only candidate regions, thereby reducing interference from non-target areas, improving classification accuracy, and lowering computational complexity [51]. Accuracy evaluation using test data and unsampled samples further validates the stability and generalization capability of the model.
To evaluate the individual contribution of the RF component, an ablation experiment was conducted by comparing SAM-only segmentation with the proposed SAM + RF framework, as shown in Table 2. SAM-only segmentation achieved an IoU of 79.52%, Precision of 97.03%, Recall of 81.51%, F1-score of 88.59%, and Kappa of 0.871. After RF-based candidate screening, the SAM + RF framework achieved an IoU of 80.51%, Precision of 98.68%, Recall of 81.38%, F1-score of 89.20%, and Kappa of 0.878. Compared with the SAM alone, the RF stage reduced false-positive detections and improved Precision and F1-score, indicating that RF provides an effective secondary screening mechanism for removing non-reef candidate regions caused by spectral similarity and shadow interference. The quantitative comparison between SAM-only segmentation and the SAM + RF framework is presented in Table 2.
Table 2.
Ablation comparison between SAM-only and SAM + RF.
2.5. Oyster Reef Extraction Method
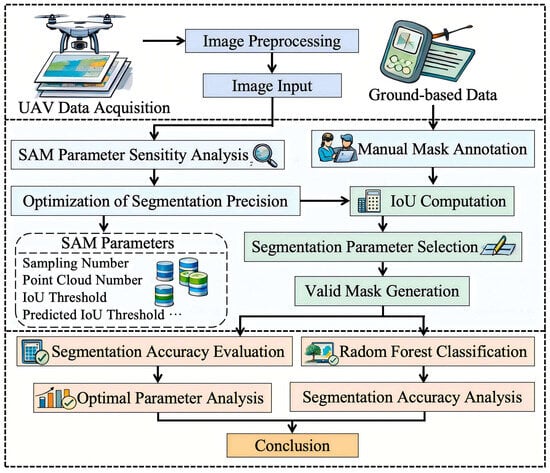
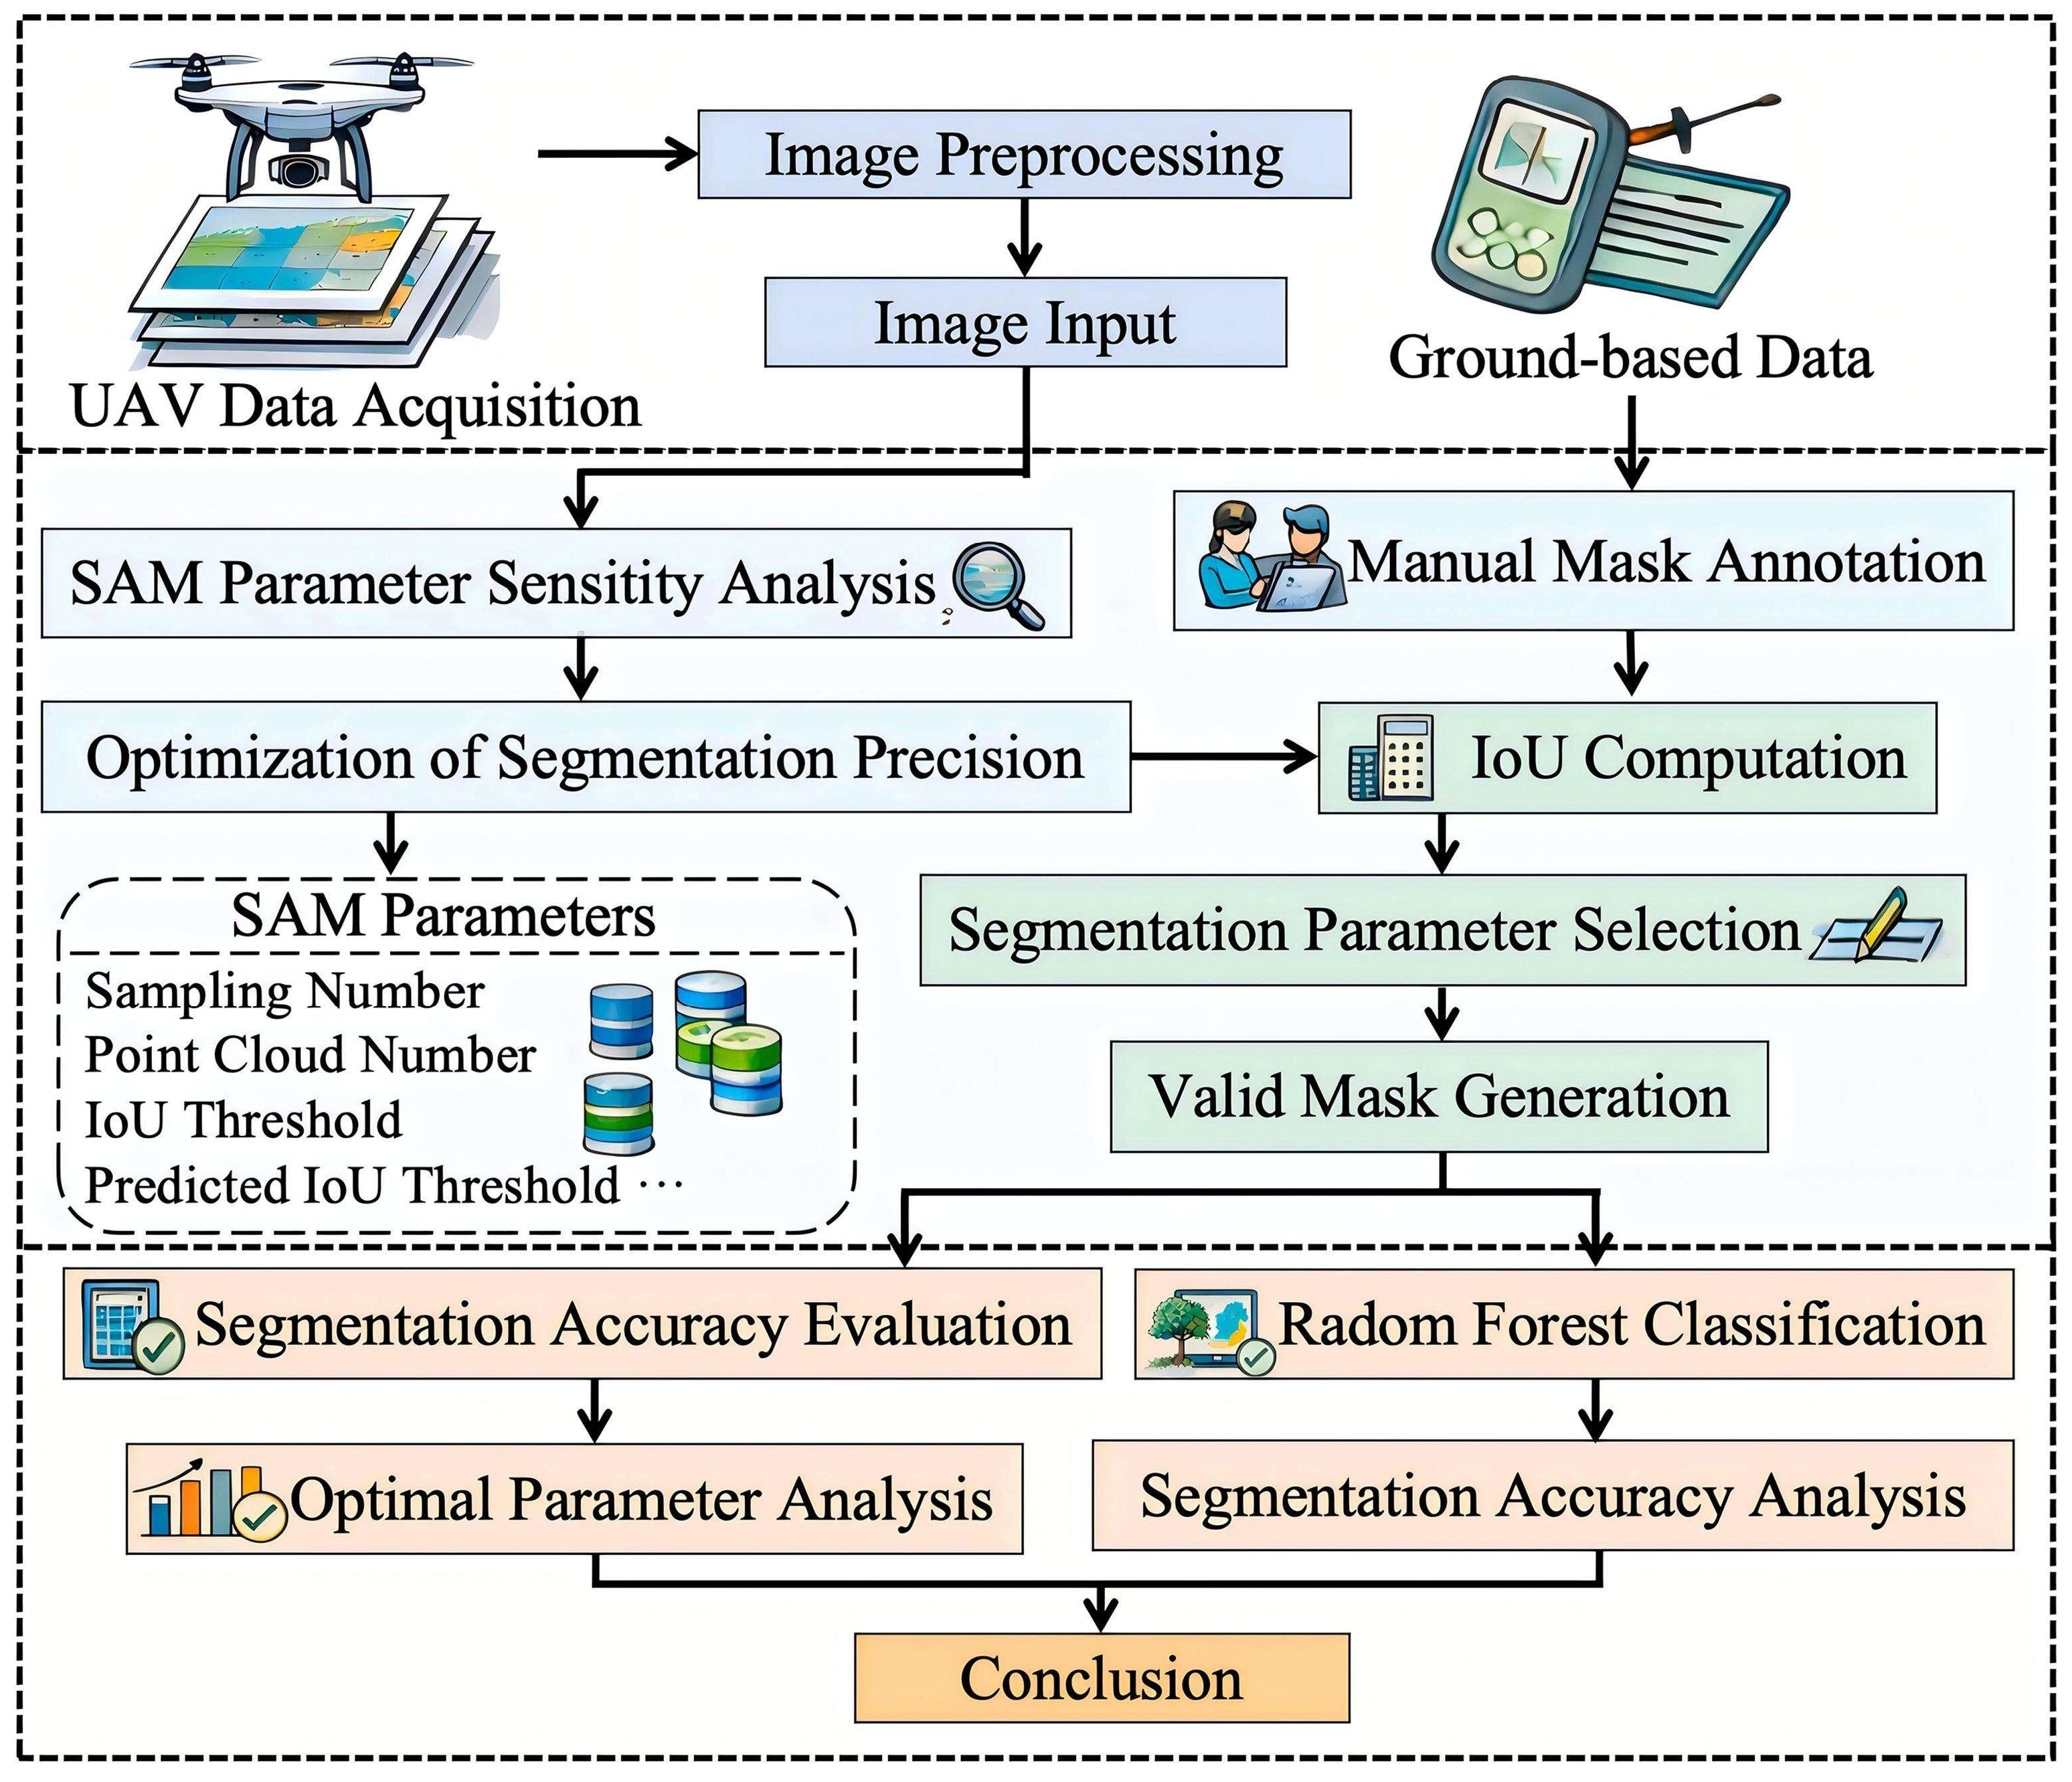
The extraction process for the spatial distribution of oyster reefs is illustrated in Figure 8. The overall methodology comprises three main stages: data preparation, model optimization and segmentation, and result evaluation and analysis. During the data preparation stage, multi-spectral imagery obtained via drone platforms serves as the primary source, supplemented by field survey data for reference. All original images undergo radiation and geometric correction to enhance data consistency and spatial accuracy. Subsequently, the Region of Interest (ROI) was manually delineated according to the boundary of the study area using the orthophoto imagery. The ROI was then used to crop the images, excluding irrelevant regions such as open water, coastal infrastructure, and non-study areas, thereby reducing background interference and improving the efficiency of the subsequent segmentation process.
Figure 8.
The extraction flowchart of oyster reefs. Note: Some graphical elements in this figure were created or enhanced using AI-assisted tools, while the scientific content, workflow design, and interpretation were developed by the authors.
During the model optimization and segmentation phase, the preprocessed DOM images were fed into the SAM for segmentation. To account for the impact of varying oyster reef scales and lighting conditions on segmentation accuracy, this study employed a control variable approach to systematically optimize key parameters—including sampling density, IoU threshold, prediction IoU threshold, and stability threshold—and analyzed how parameter changes affected segmentation precision [52,53]. Ground-truth masks were manually delineated from UAV orthophotos based on field survey observations of oyster reef boundaries and served as reference data for model validation [54]. A total of 35 representative validation samples were used for the accuracy assessment. These ground-truth masks were used exclusively for the final accuracy assessment and were not involved in either the Random Forest training process or SAM parameter optimization. By comparing the SAM-generated masks with the ground-truth masks, the Intersection over Union (IoU) was calculated to quantitatively evaluate segmentation accuracy. Based on these validation results, the optimal parameter combination was selected to achieve precise extraction of oyster reef boundaries and generate high-quality segmentation masks.
During the result analysis phase, UAV flights were conducted at four altitudes (50, 100, 200, and 300 m), producing spatial resolutions of 1.36 cm, 2.73 cm, 5.46 cm, and 8.19 cm. Additionally, the RF classification method was employed to further assess the SAM segmentation results. By integrating spectral and texture features, candidate regions were meticulously screened to minimize the impact of incorrect segmentation. Extraction accuracy was evaluated for oyster reefs of varying scales (small, medium, and large) to reveal the models performance differences across distinct spatial structures. These analyses further confirm the effectiveness of the proposed method in enhancing extraction accuracy and stability.
In remote sensing applications, the SAM demonstrates strong adaptability when processing high-resolution drone imagery. Its prompt-based segmentation mechanism enables rapid extraction of complex targets while reducing reliance on manual annotation [55]. Compared to traditional threshold-or rule-based methods [56,57], the proposed framework is more robust to tidal variation, illumination changes, and spectral confusion, providing an efficient approach for automated oyster reef extraction. The IoU was adopted as the primary evaluation metric because it directly measures the spatial overlap between the predicted segmentation and the ground-truth masks. It is defined as the ratio of the intersection area to the union area between the predicted region and the actual region [58].
Among them, represents the set of pixels in the predicted segmentation, and represents the set of pixels in the ground truth. The IoU metric can simultaneously reflect the accuracy of target area positioning and the degree of boundary matching. It has good stability and interpretability in remote sensing target extraction tasks.
3. Results and Analysis
3.1. Aviation Image Analysis
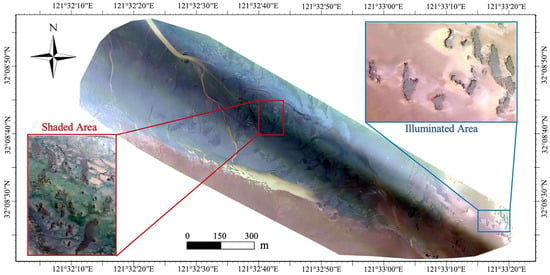
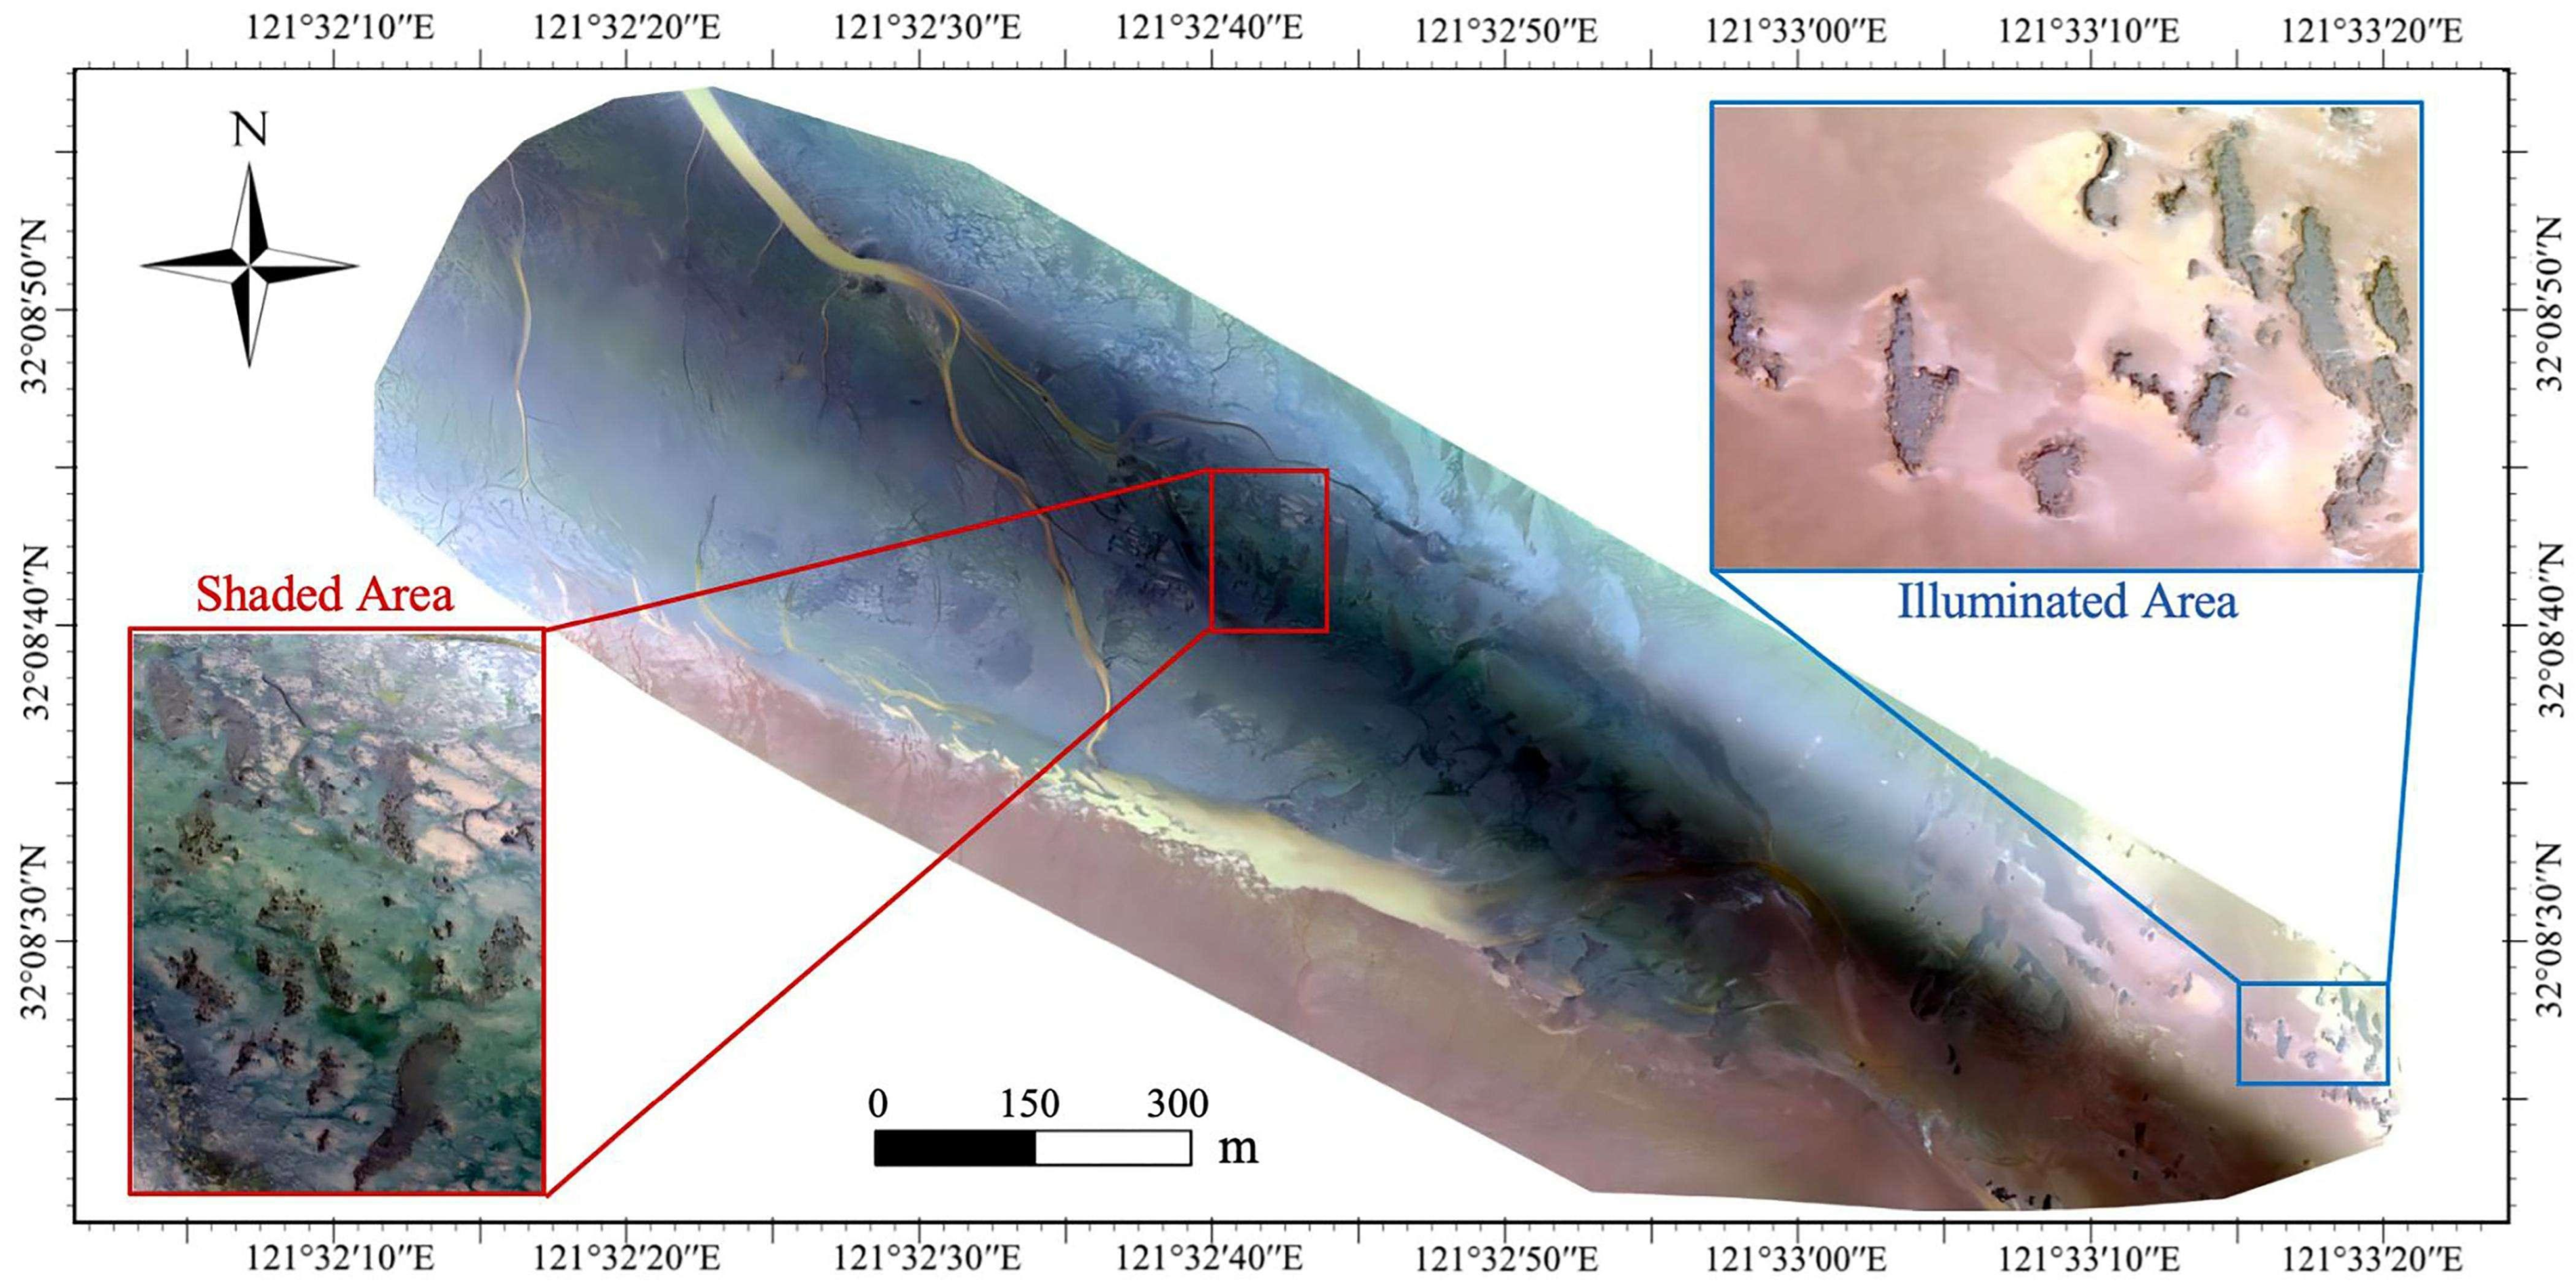
Due to limitations in drone endurance, flight altitude, and sensor field of view, the imagery obtained in this study exhibits spatial constraints in its coverage. Consequently, representative subregions within the study area were selected for detailed analysis to ensure the reliability and comparability of the results. As shown in Figure 9, the study area is divided into two distinct zones: the illuminated area and the shaded area.
Figure 9.
UAV orthophoto with shaded and illuminated areas.
Under low solar elevation conditions, a dark band-like structure distributed diagonally is visible in the central part of the study area. This phenomenon is primarily caused by the shadow cast by a lighthouse located in the lower-right area of the experimental site, which partially blocked sunlight under low solar elevation angle conditions, resulting in a long linear shadow over the reef area. In shaded areas, images exhibit reduced overall brightness, diminished texture contrast, and relatively blurred boundaries of the oyster reef structure, whereas in fully illuminated regions, the spatial structure and texture features of the oyster reef are clearly discernible.
The variation in image characteristics caused by differences in lighting poses a significant challenge for target extraction in optical remote sensing and is one of the key factors affecting segmentation accuracy. Therefore, this study employs the SAM to perform parameter optimization and accuracy evaluation under different lighting conditions (shaded and illuminated areas), systematically analyzing how lighting variations impact the extraction of oyster reef spatial distribution and thereby enhancing the adaptability of model and stability in complex environmental settings.
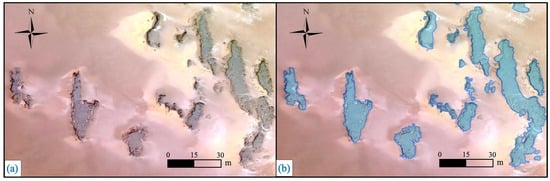
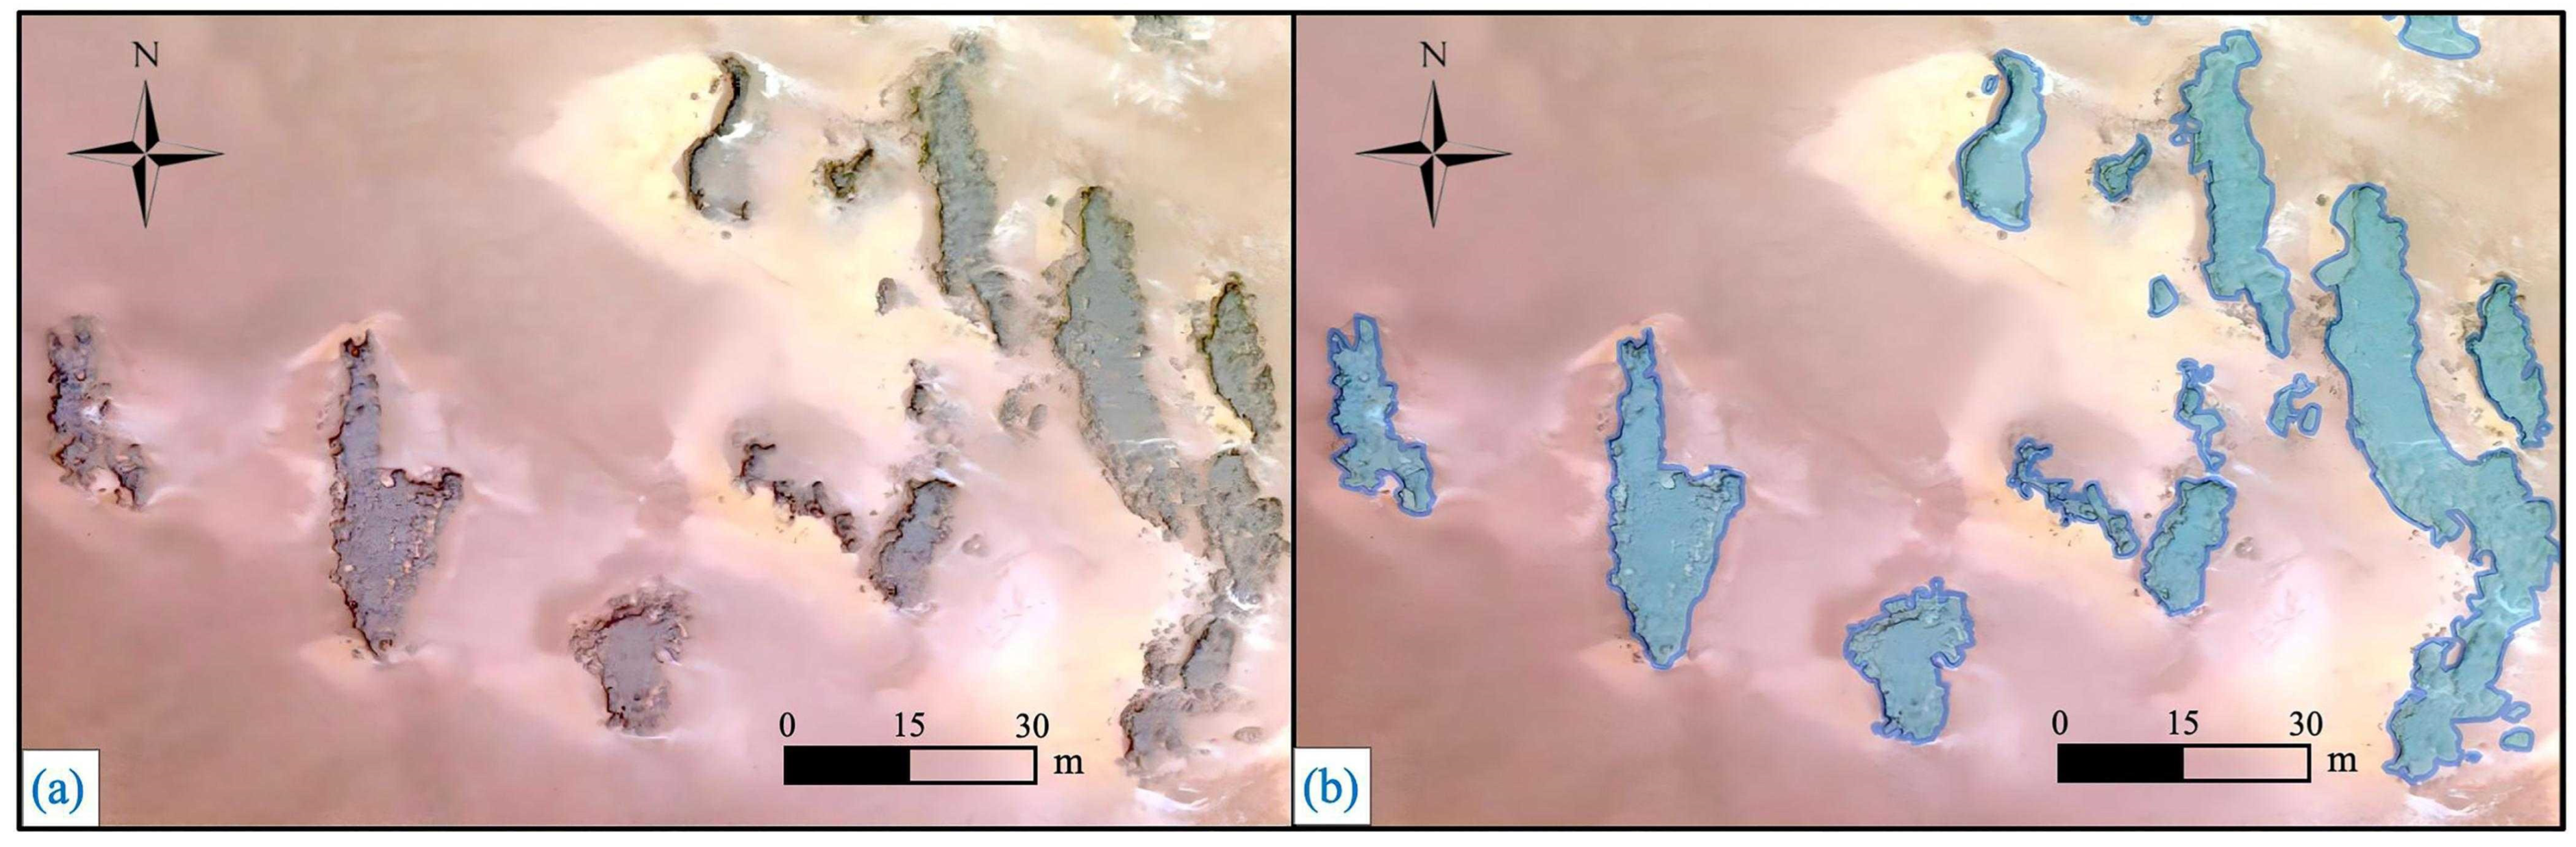
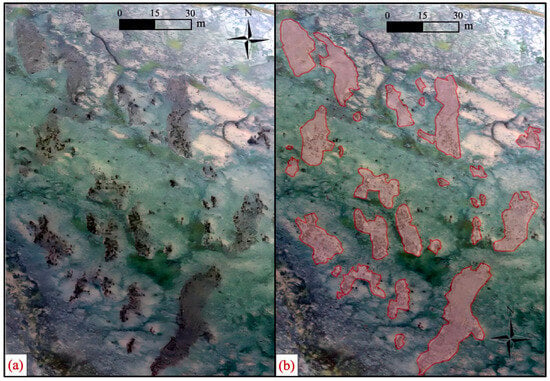
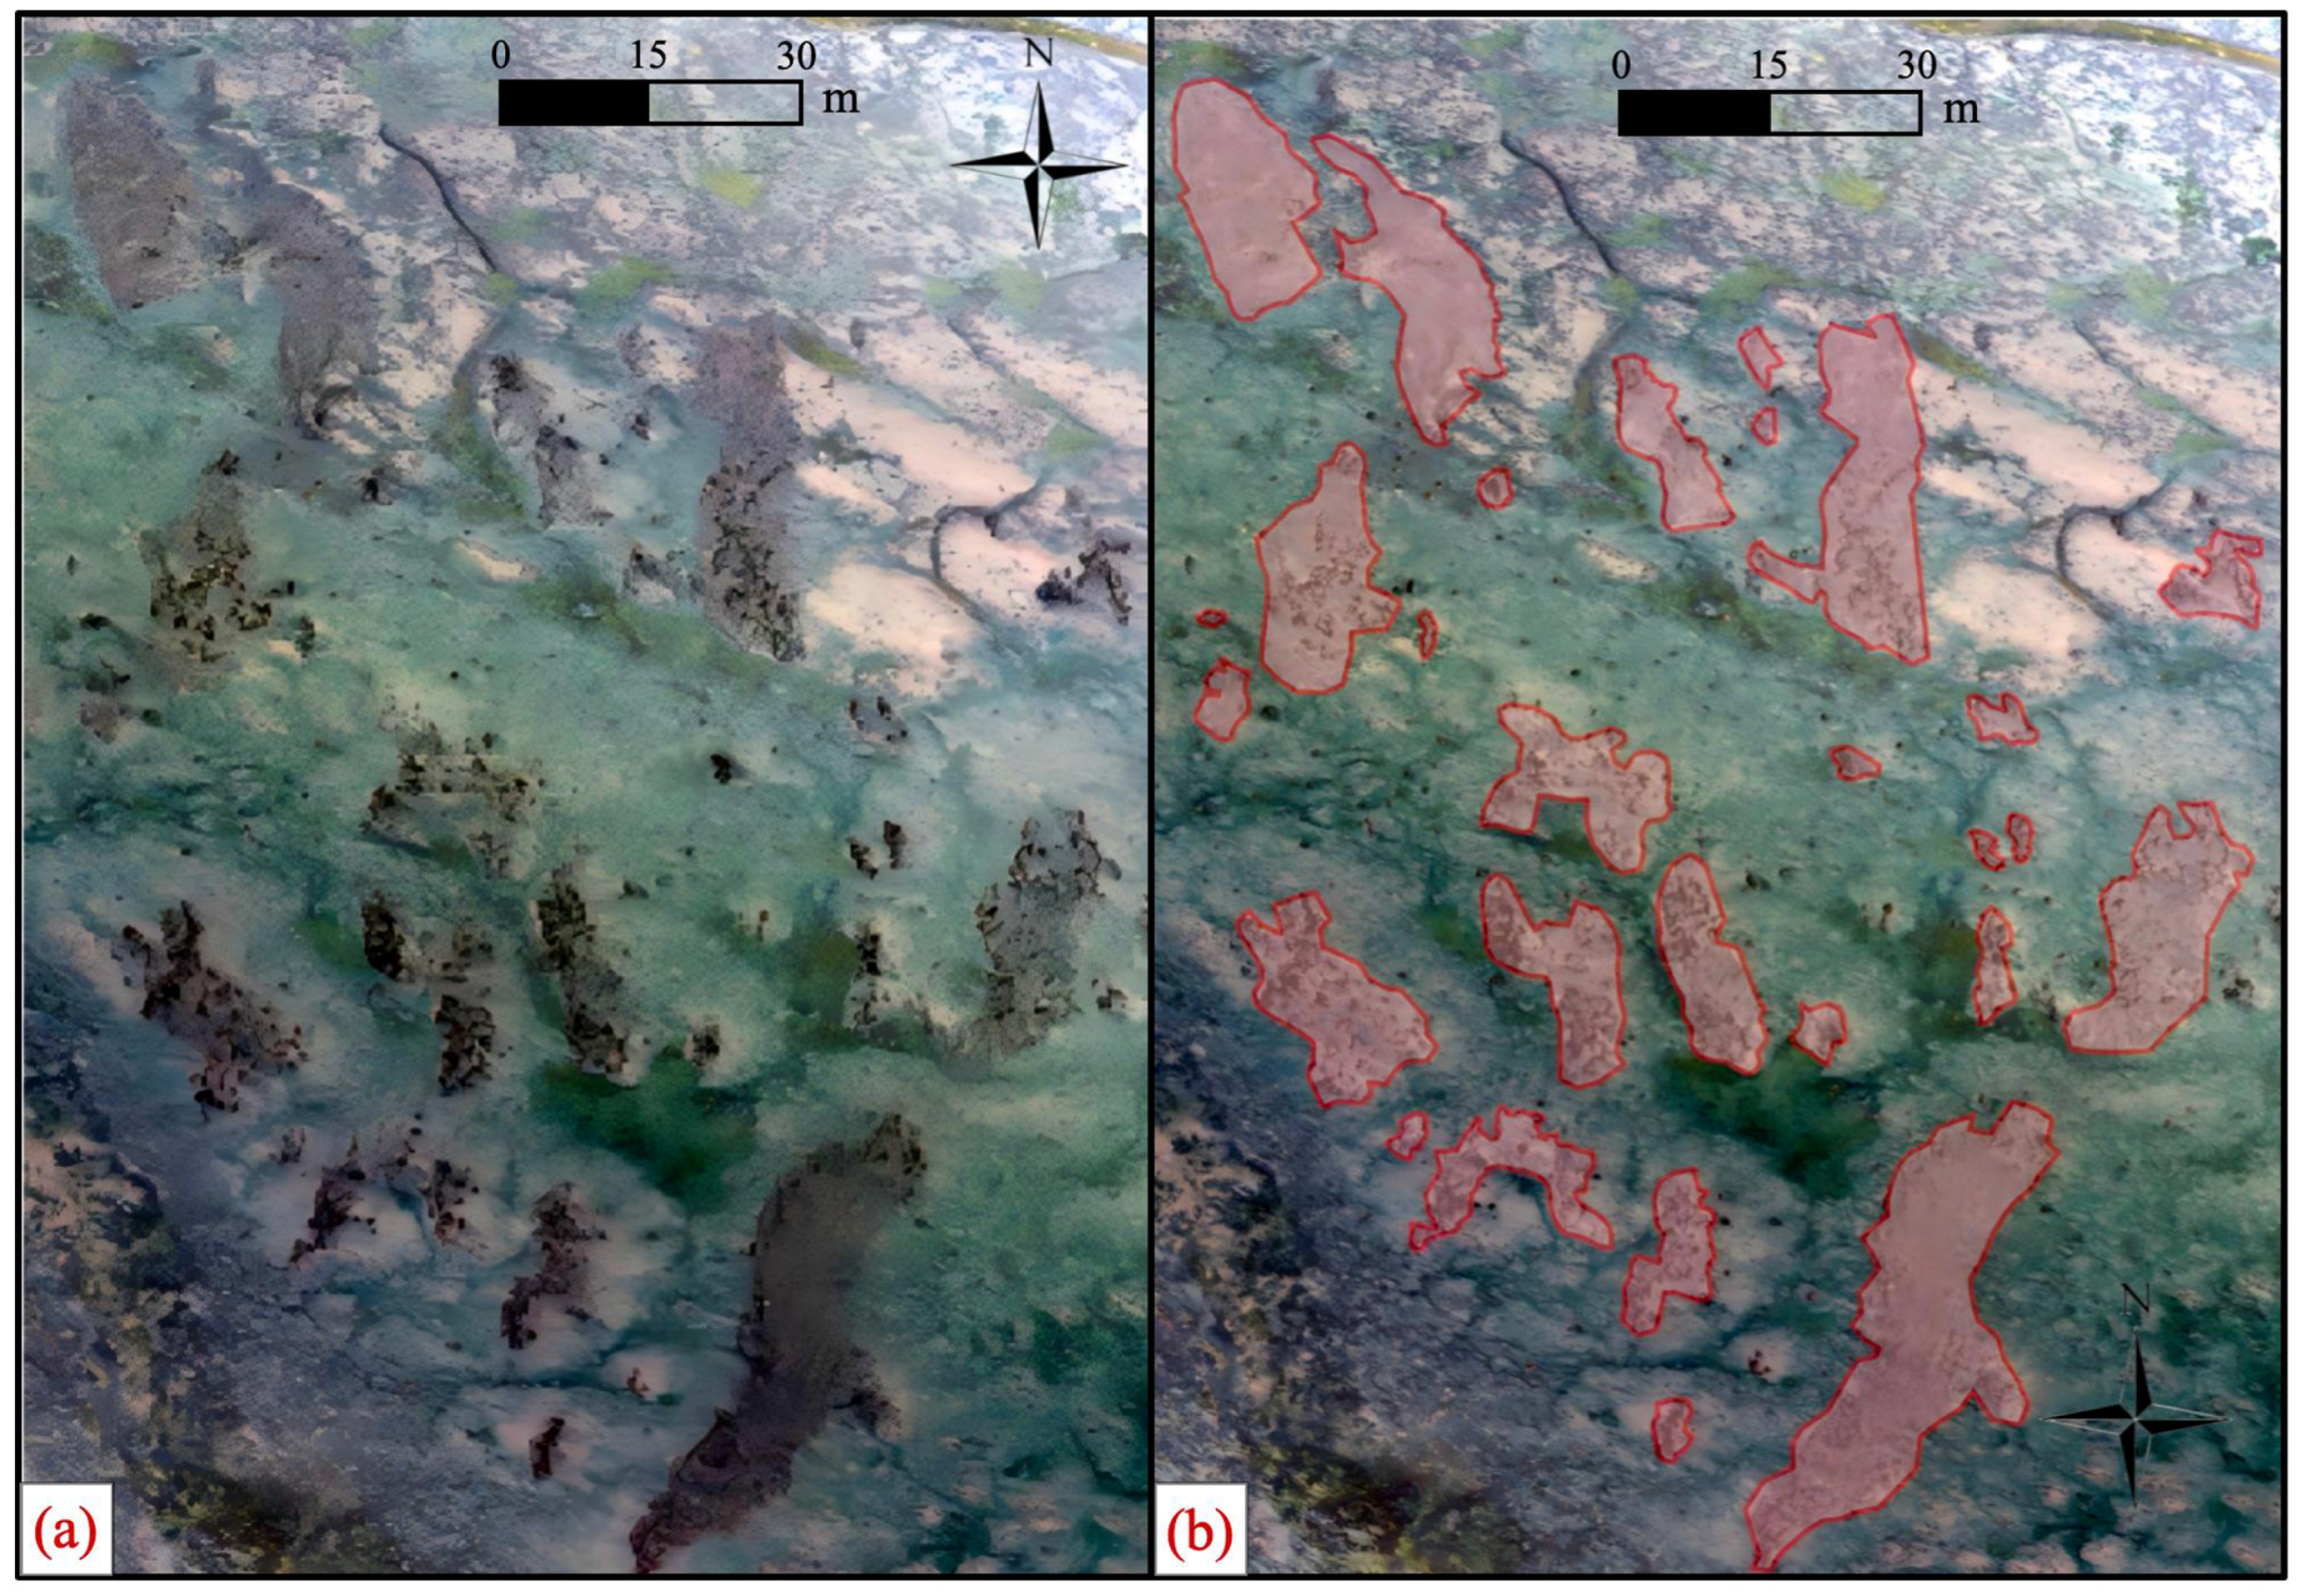
Building upon the above classification of typical illumination conditions, a detailed comparative analysis was conducted between the shaded and illuminated zones, with results presented in Figure 9 and Figure 10, respectively. Figure 10 demonstrates the segmentation results within the illuminated region. Under uniform lighting conditions, a more pronounced reflectivity difference is observed between the oyster reef and its surrounding environment, with clearer structural contours and texture features, facilitating precise target boundary localization by the model. The segmentation outcomes reveal well-defined reef contours and continuous boundaries, with significantly reduced misclassification and omission rates.
Figure 10.
Oyster reef segmentation results in illuminated area. (a) The original DOM image; (b) The segmentation results of the oyster reef based on the SAM.
In contrast, Figure 11 displays the original image and segmentation results of the oyster reef within the shaded area. The image reveals that under insufficient illumination, the spectral contrast between the oyster reef and the surrounding substrate diminishes, with some reef boundaries appearing blurred or even fractured, resulting in incomplete target morphology. Nevertheless, the segmentation achieved using the SAM effectively identifies the primary reef structures while maintaining high spatial consistency [59] across complex backgrounds, demonstrating the methods robustness even under low-light or shadow interference conditions.
Figure 11.
Oyster reef segmentation results in shaded area. (a) The original DOM image; (b) The segmentation results of the oyster reef based on the SAM.
A comparison of Figure 10 and Figure 11 reveals that lighting conditions significantly affect the recognizability of oyster reefs: shaded areas exhibit blurred boundaries and missing details, whereas illuminated areas display clear structures and stable segmentation. This difference further underscores the importance of parameter optimization in complex coastal environments—adjusting SAM parameters under varying lighting conditions effectively improves segmentation accuracy and result stability. Consequently, this study will systematically optimize parameter settings for both shaded and illuminated regions in subsequent analyses to achieve more accurate extraction of oyster reef spatial distribution.
3.2. Analysis of Optimal Partition Parameters
During the optimization of SAM segmentation parameters, it is essential to comprehensively consider both image resolution and the scale variations of oyster reef targets to achieve a balance between segmentation accuracy and computational efficiency. The SAM provides a set of adjustable parameters, including sampling number, prompt points number, predicted IoU threshold, stability score threshold, crop layers, point downscaling factor, minimum mask region area, and bounding box NMS (Non-Maximum Suppression) threshold. Based on systematic parameter sensitivity analysis, this study identified an optimal parameter combination 64 sampling points, 128-prompt points, with both the prediction IoU threshold and stability threshold set to 0.9 (Table 3). The number of cropping layers is 0, the point down sampling factor is 4, the minimum mask area is 50, and the NMS threshold for bounding boxes is 0.7. Under this parameter configuration, the model demonstrates excellent segmentation stability and accuracy across various lighting conditions and scale variations, indicating that this parameter combination possesses strong generalization capabilities.
Table 3.
Optimal Segmentation Parameter for Different Area.
Specifically, the number of sampling points determines the spatial sampling density, with its square corresponding to the total number of input reference points; the prompt points number controls the number of points processed per segmentation batch. Increasing these parameters within reasonable ranges enhances object recognition accuracy but significantly increases computational complexity and memory consumption. The IoU prediction threshold screens out low-quality masks, while the bounding box NMS threshold further reduces redundant overlapping segmentation results; the stability threshold filters outcomes based on internal mask consistency. In contrast, our study demonstrates that under current data conditions, multi-scale cropping (i.e., crop layers = 0) is unnecessary—appropriate point down sampling (factor = 4) achieves high segmentation precision while maintaining efficiency. Additionally, the minimum mask area parameter effectively removes noise and small-scale false-detection targets, playing a crucial role in improving spatial consistency. Overall, this optimal parameter combination enables stable extraction of oyster reef spatial distribution in complex coastal environments and provides a reliable foundation for subsequent partitioning optimization analyses under varying lighting conditions.
Based on the determined optimal parameter combination, to further quantify the improvement in parameter optimization on segmentation accuracy, a comparative analysis was conducted on the overall classification results of illuminated and shaded regions, with the results presented in Table 4. It is evident that under the unified parameter optimization strategy, the segmentation accuracy for both region types has been significantly enhanced.
Table 4.
Mean IoU of SAM segmentation after parameter optimization under different illumination conditions.
The results demonstrate that the proposed parameter optimization strategy not only significantly enhances the segmentation performance of the model under ideal lighting conditions but also maintains strong adaptability and stability in complex environments with significant shadow interference. In comparison, the mean IoU in illuminated regions is slightly higher than in shaded regions due to their clearer spectral characteristics and structural information; whereas despite illumination constraints, the shaded regions still achieve effective segmentation enhancement through appropriate parameter configurations, reducing both misclassification and missed detection incidents.
3.3. Split Parameter Sensitivity Analysis
Based on comparative analyses under different lighting conditions, quantitative evaluations were conducted on the key parameters of the SAM. A one-factor-at-a-time (OFAT) strategy was adopted for parameter optimization, in which one parameter was varied while the remaining parameters were fixed at their default or previously optimized values. This approach facilitated the interpretation of the individual influence of each parameter while reducing computational complexity. Although potential interactions among parameters cannot be completely excluded, the OFAT strategy provides a practical and widely adopted framework for parameter sensitivity analysis.
The dataset used for parameter optimization was independent of the dataset used for the final accuracy evaluation. The optimized parameter combination was subsequently validated using an independent test dataset to reduce the risk of overfitting.
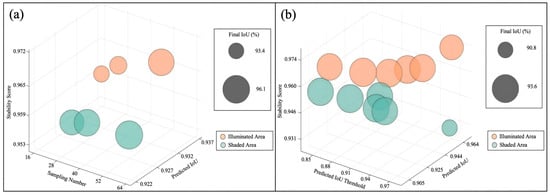
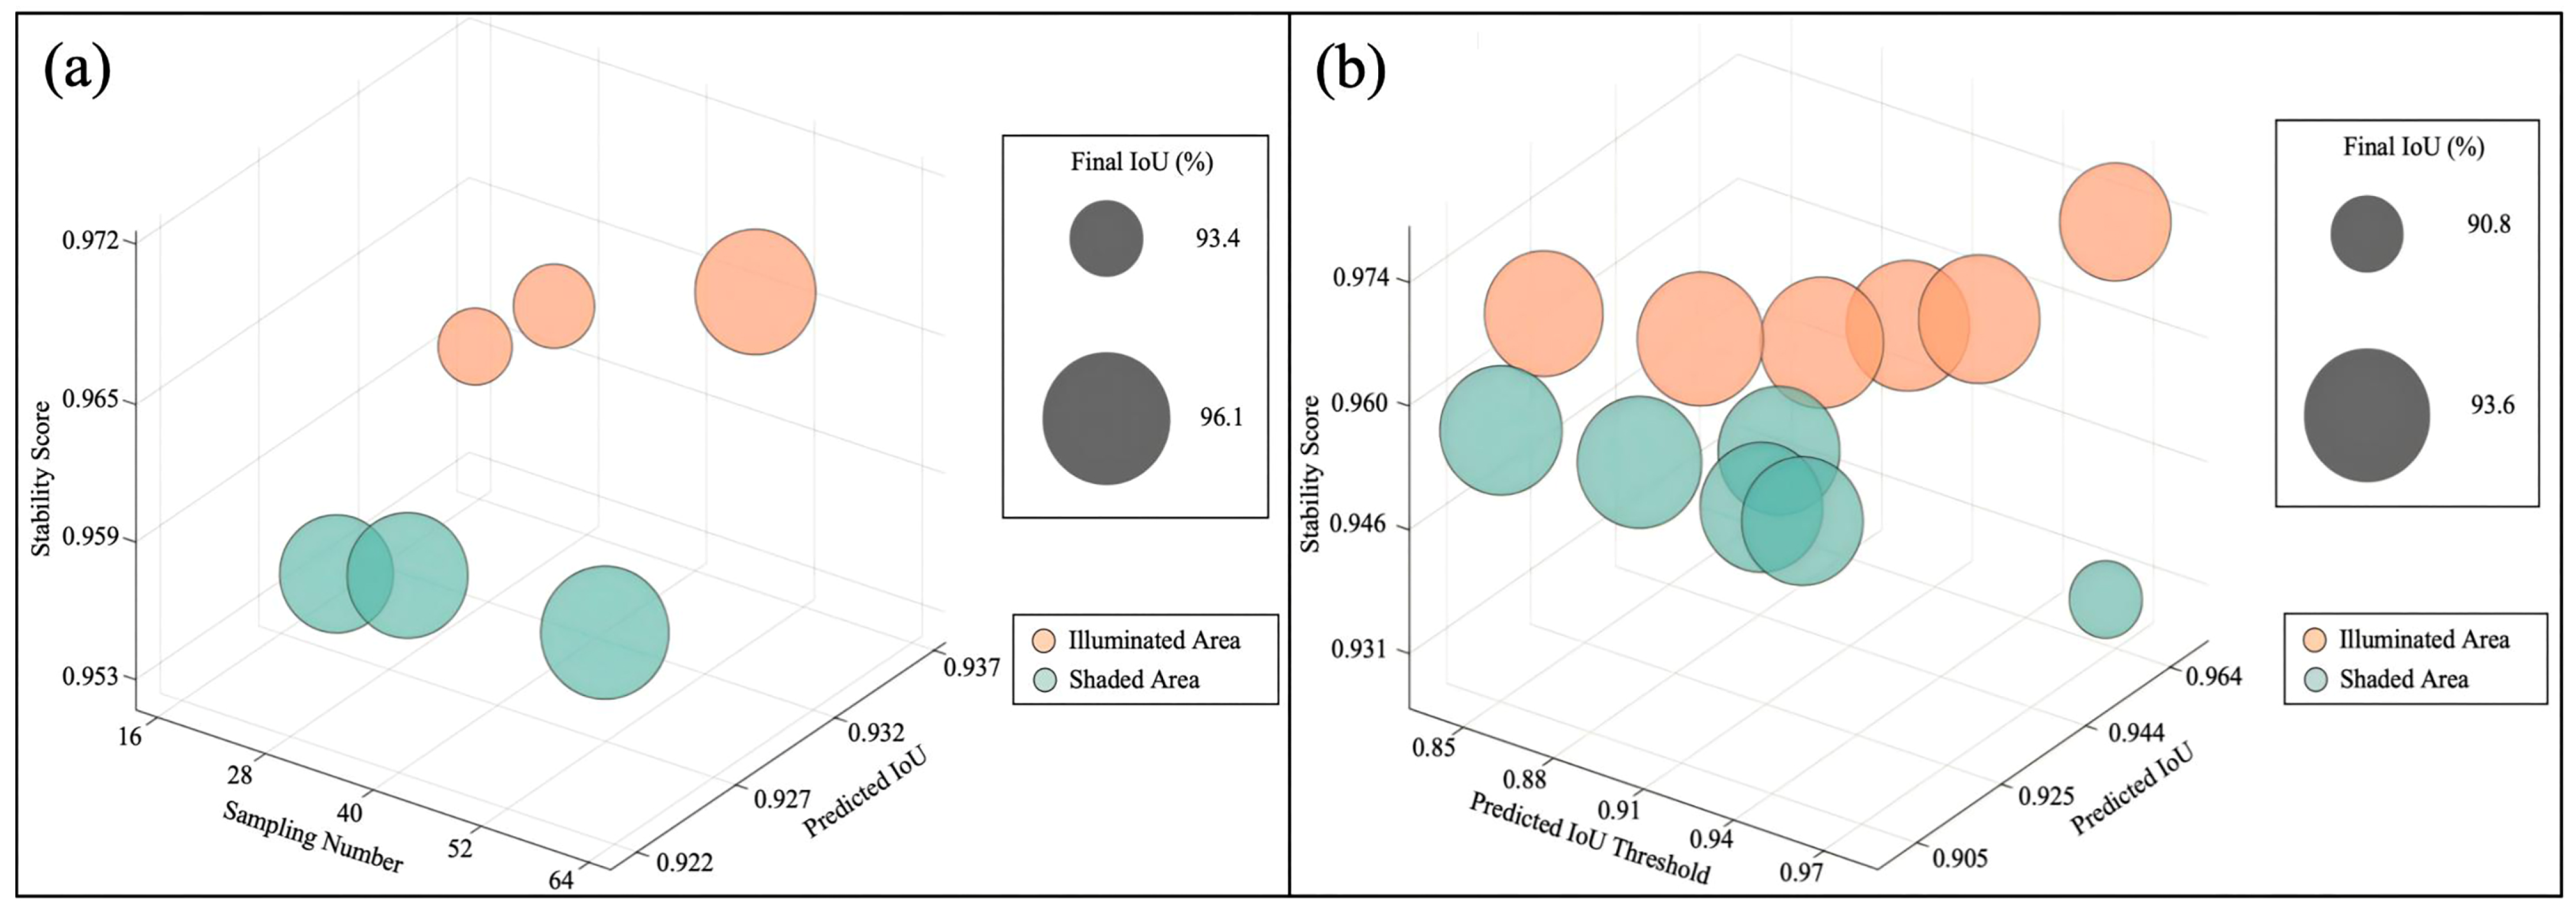
Figure 12 presents the sensitivity analysis of sampling number and predicted IoU threshold under illuminated and shaded conditions. Overall, illuminated regions exhibited more stable parameter responses and higher segmentation performance than shaded regions. As the sampling number increased, stability scores and final IoU in illuminated areas gradually improved, whereas shaded areas showed weaker responses and localized fluctuations. For the predicted IoU threshold, illuminated regions displayed an initial increase followed by stabilization, while shaded regions experienced performance declines at higher thresholds, indicating that excessive threshold constraints may lead to the omission of valid targets in low-contrast environments.
Figure 12.
Parameter sensitivity analysis of SAM segmentation in illuminated and shaded areas. (a) Effect of sampling number; (b) Effect of Predicted IoU Threshold.
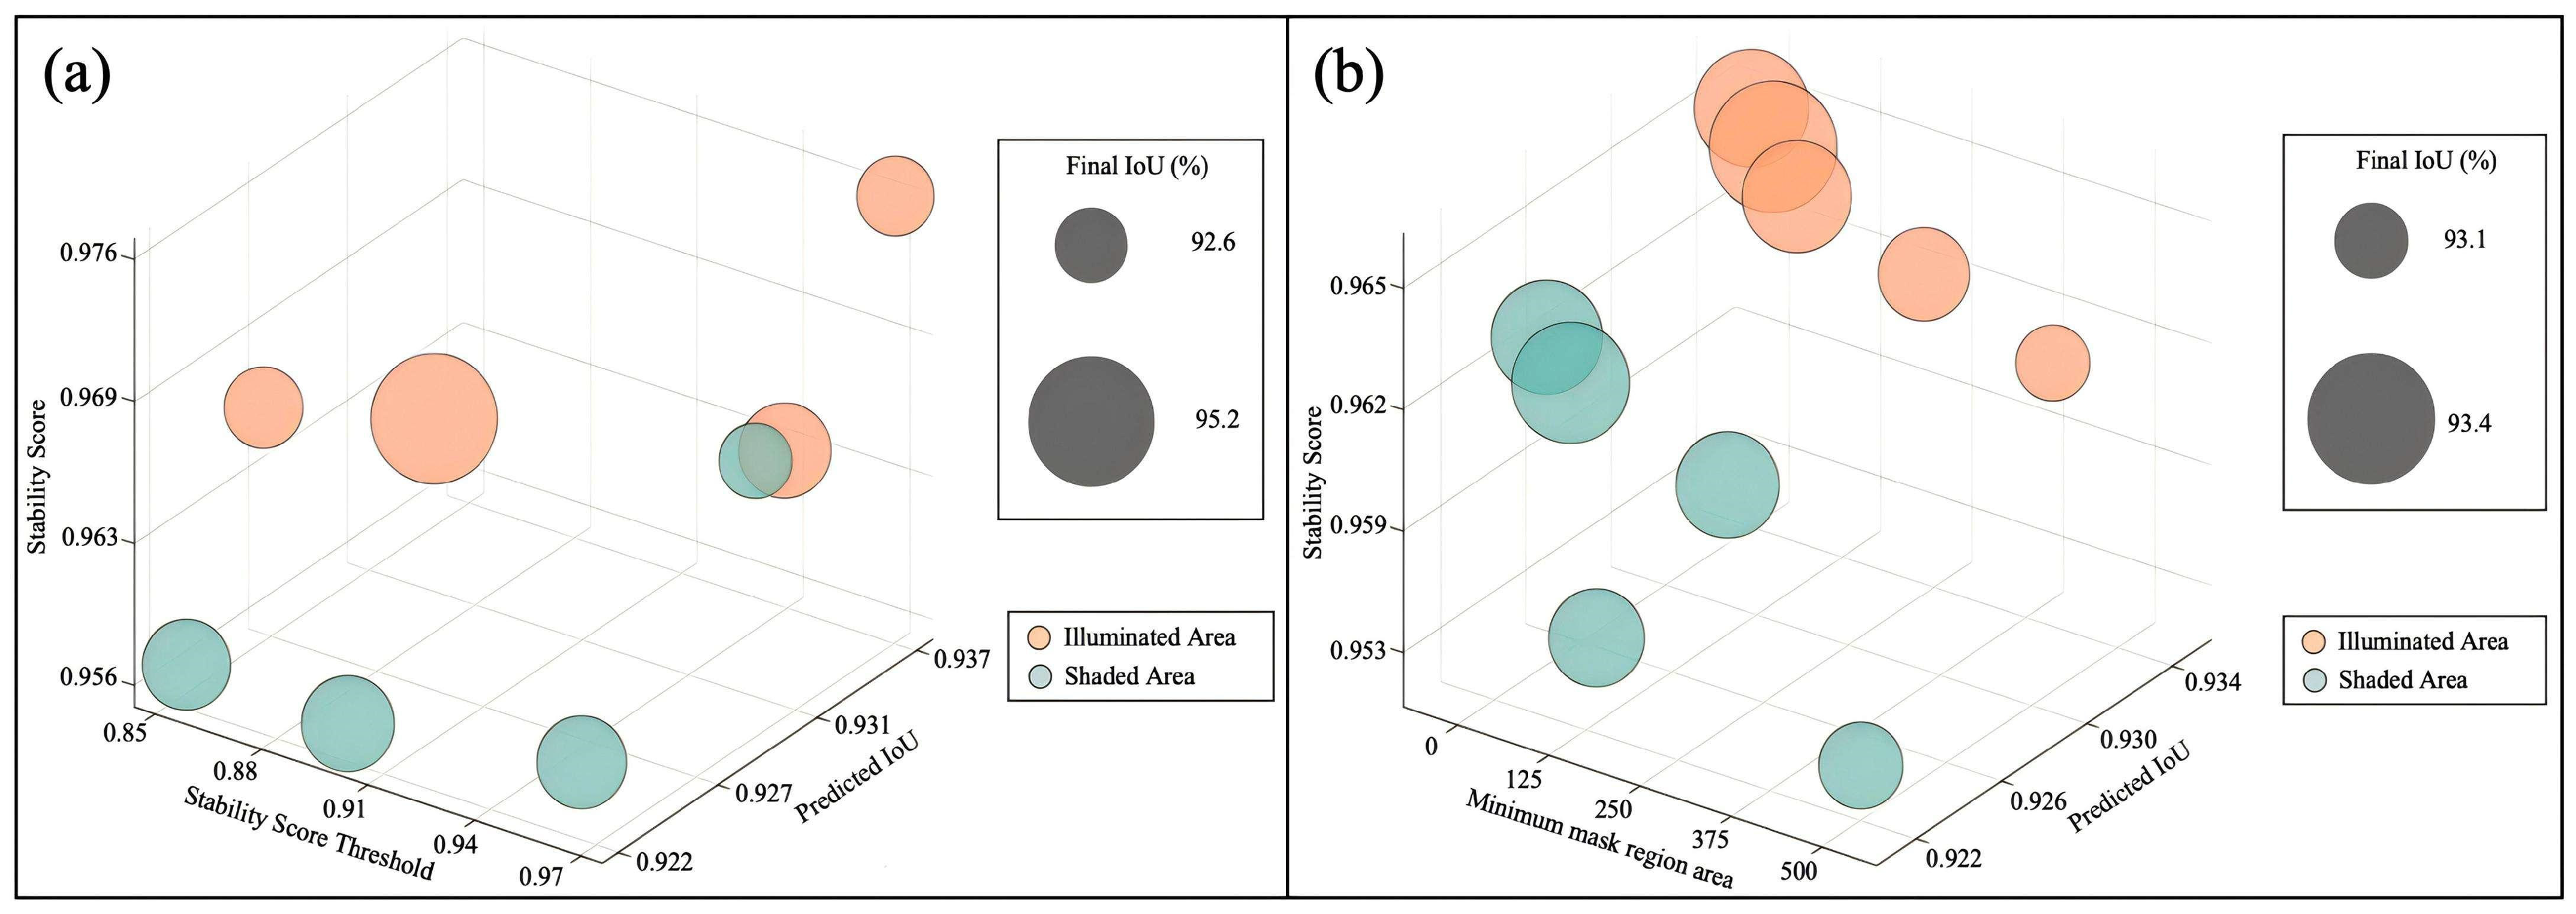
Figure 13 illustrates the effects of stability score threshold and minimum mask region area on segmentation performance. Illuminated regions maintained relatively stable trends, whereas shaded regions showed stronger volatility. Increasing the stability score threshold slightly improved segmentation consistency in illuminated areas but produced limited IoU gains in shaded areas. In contrast, larger minimum mask region areas resulted in overall declines in stability score and IoU, especially in shaded regions, suggesting that excessive filtering negatively affects the recognition of small-scale oyster reef targets.
Figure 13.
Parameter sensitivity analysis of SAM segmentation in illuminated and shaded areas. (a) Effect of Stability Score Threshold; (b) Effect of Minimum Mask Region Area.
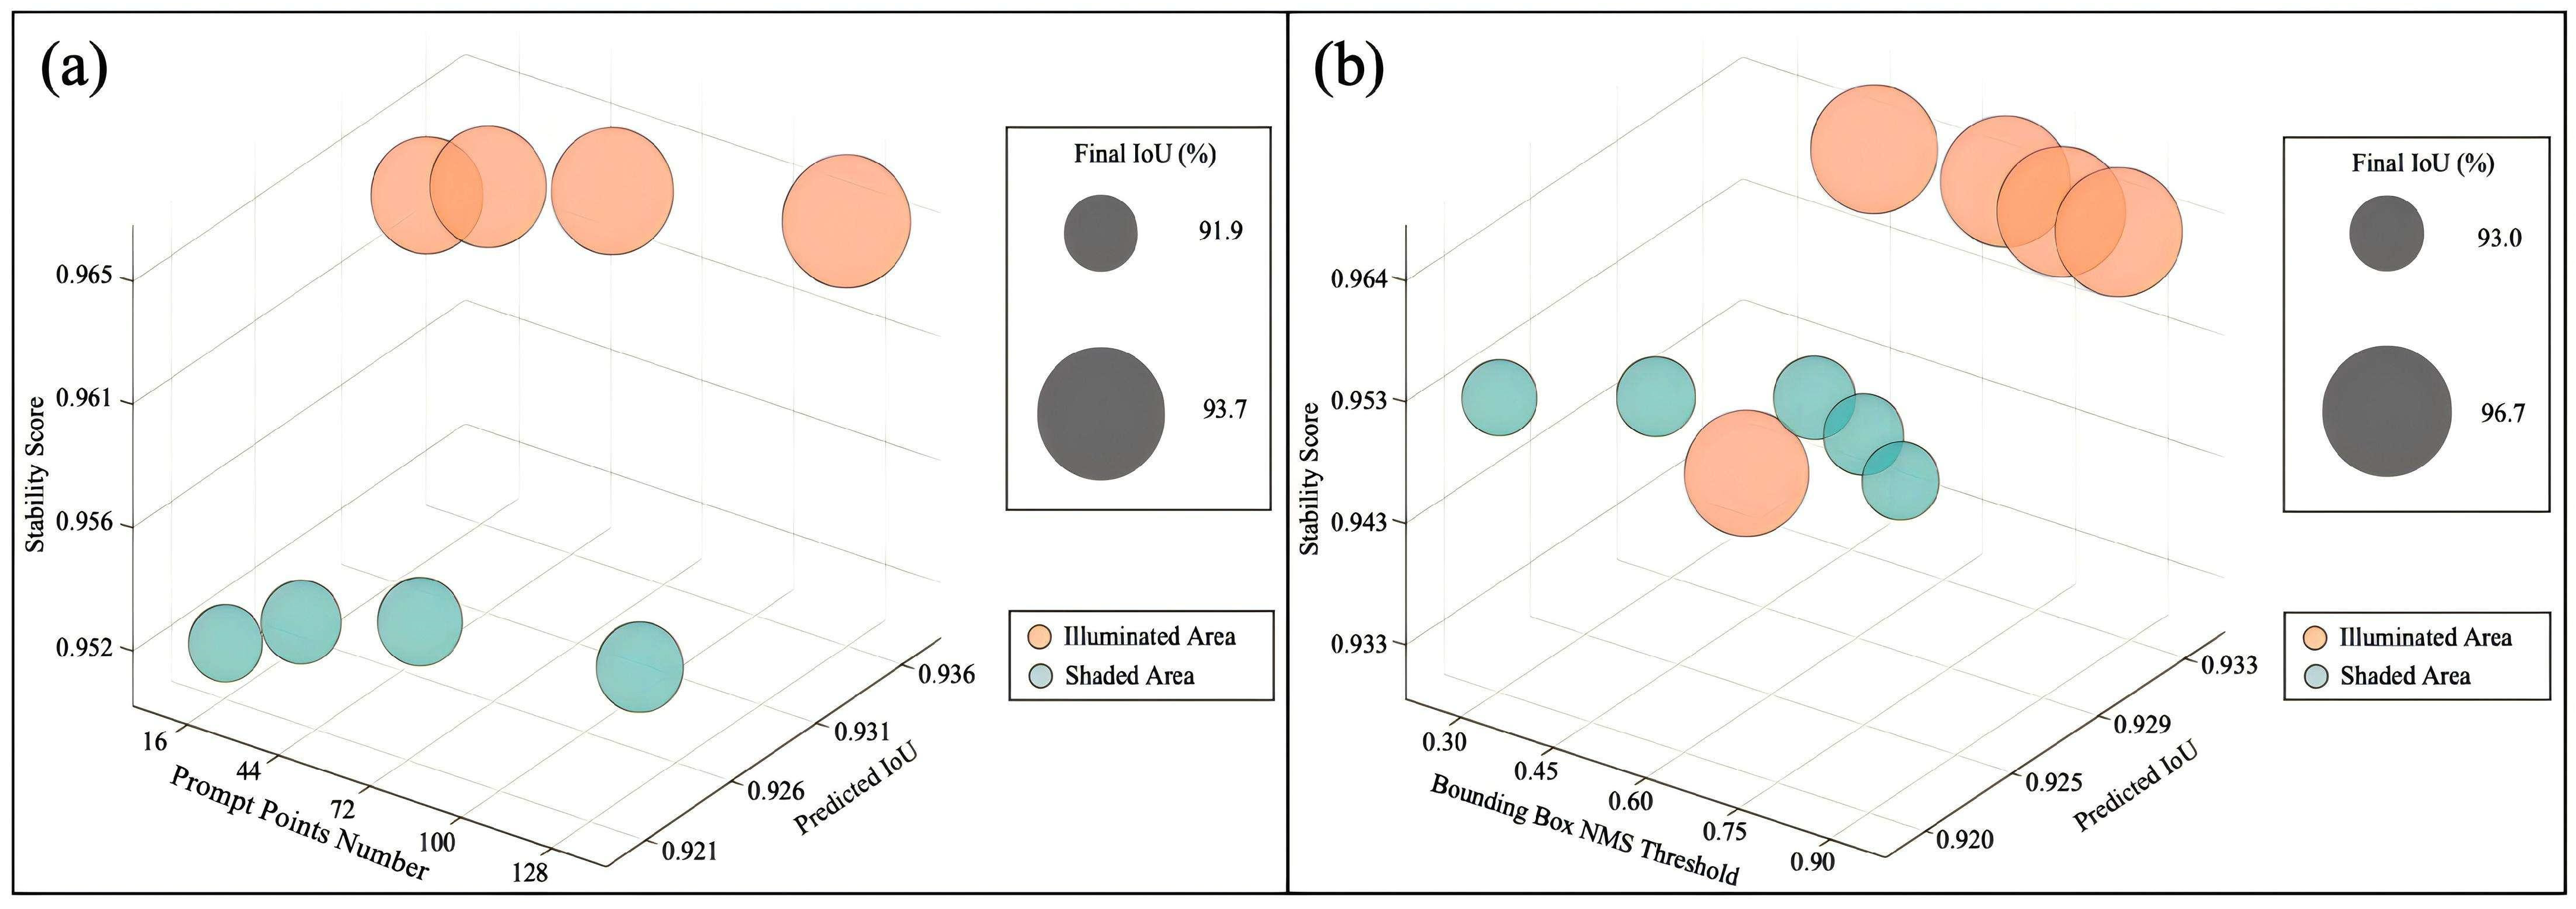
Figure 14 shows the influence of prompt points number and bounding box NMS threshold on segmentation performance. Increasing the number of prompt points improved IoU and stability in illuminated regions, while shaded regions exhibited only minor improvements. For the NMS threshold, moderate values achieved the best segmentation performance in illuminated areas, indicating that appropriate redundancy suppression improves extraction integrity. However, shaded regions remained relatively unstable under different threshold settings.
Figure 14.
Parameter sensitivity analysis of SAM segmentation in illuminated and shaded areas. (a) Effect of Prompt Points Number; (b) Effect of Bounding Box NMS Threshold.
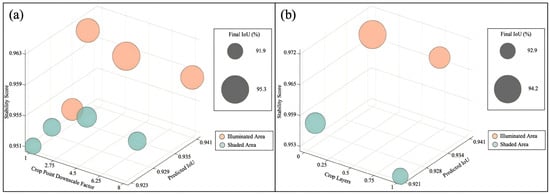
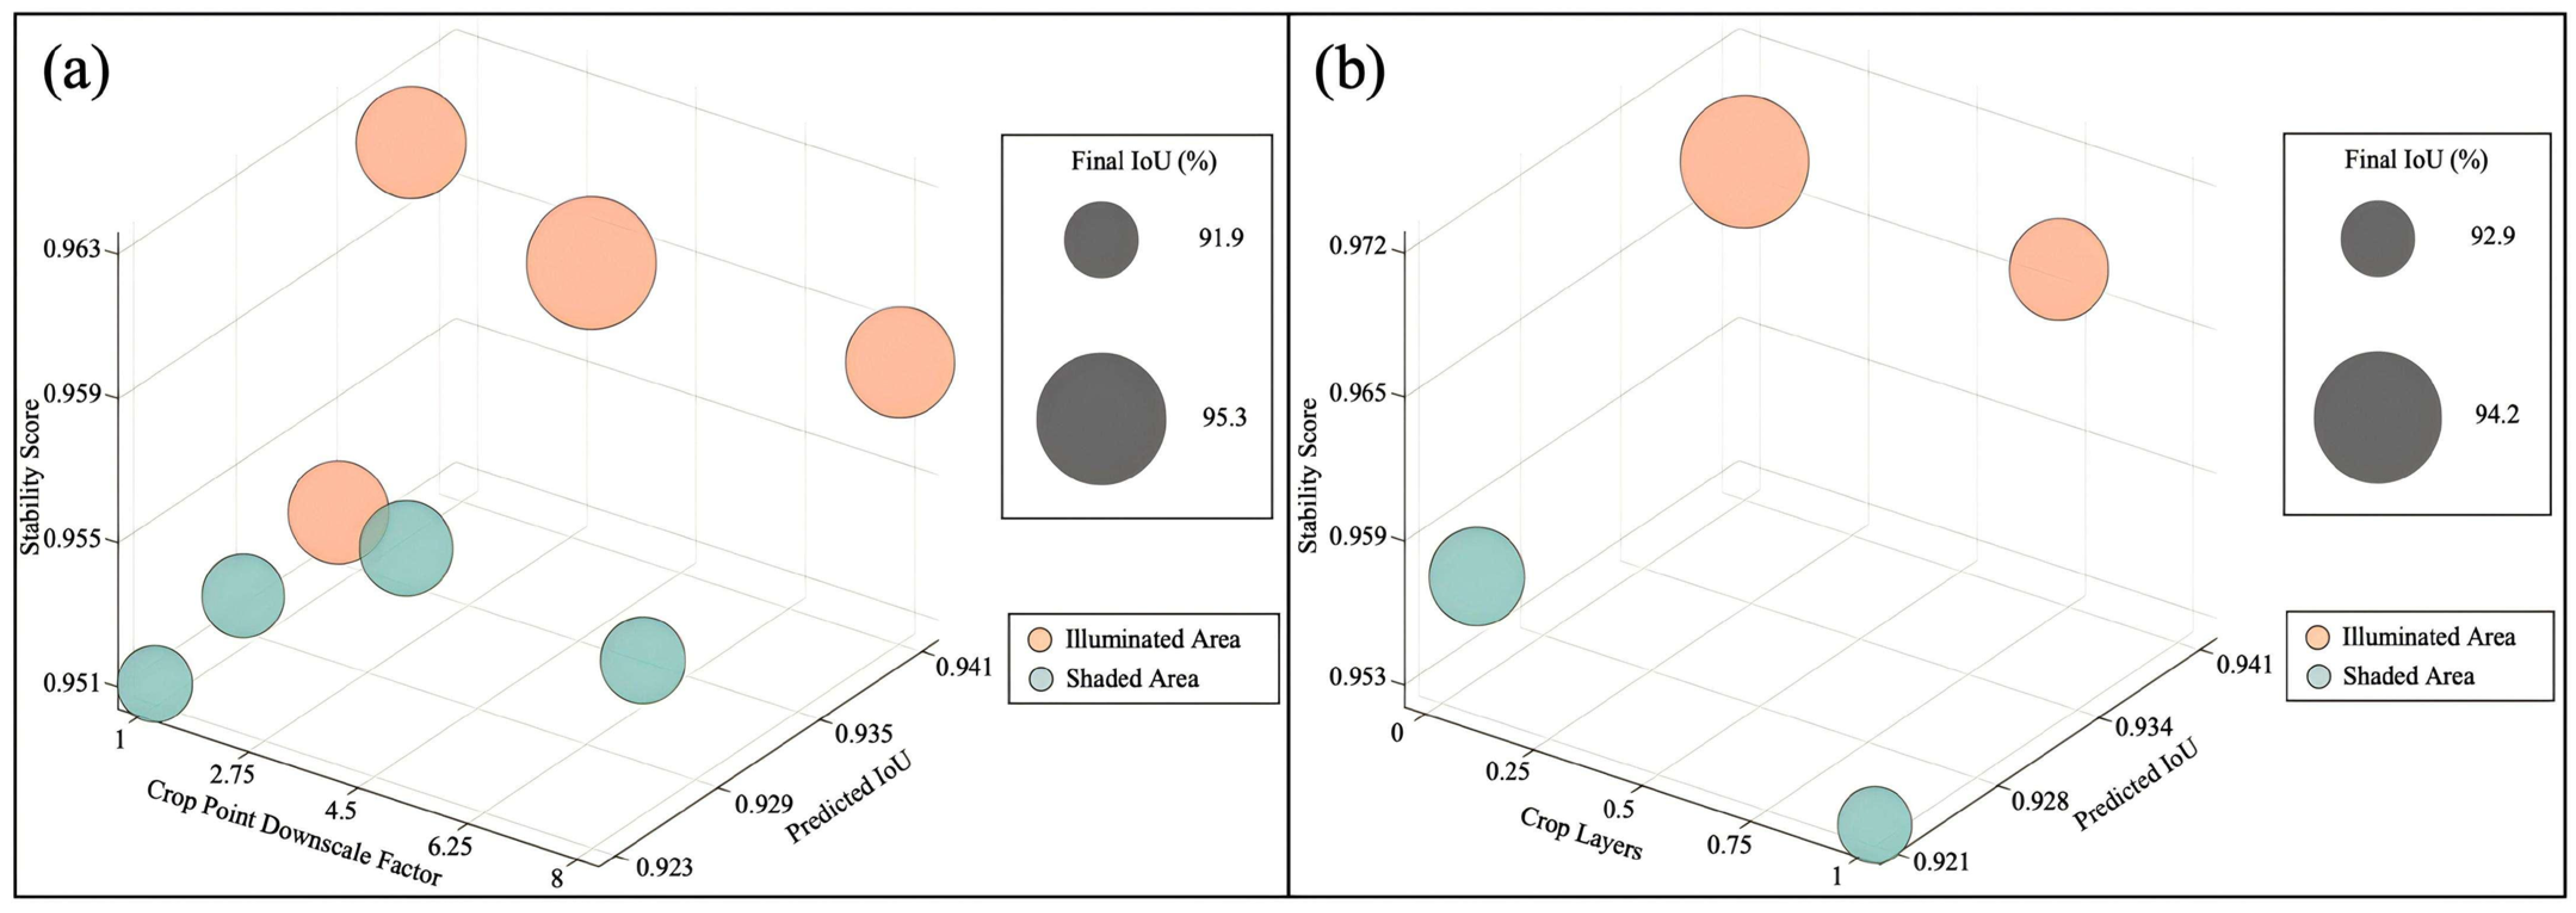
Figure 15 presents the sensitivity analysis of crop point downscale factor and crop layers. As the crop point downscale factor increased, stability scores slightly decreased while IoU remained relatively stable, indicating that moderate downsampling reduces computational complexity without significantly affecting segmentation accuracy. The introduction of additional crop layers did not significantly improve performance and, in some cases, reduced stability, suggesting limited benefits of multi-scale cropping strategies under high-resolution coastal imagery conditions.
Figure 15.
Parameter sensitivity analysis of SAM segmentation in illuminated and shaded areas. (a) Effect of Crop Point Downscale Factor; (b) Effect of Crop Layers.
3.4. Comparative Analysis of Segmentation and Extraction Accuracy
To further evaluate the applicability and stability of the proposed parameter optimization strategy across oyster reef targets at different scales, reference data were extracted from the study area through manual visual interpretation of oyster reef patches and compared with the segmentation results obtained by the SAM. Based on patch area, the oyster reefs in the study area were classified into three categories: small-scale reefs (0 < Size ≤ 50 m2), medium-scale reefs (50 < Size ≤ 200 m2), and large-scale reefs (Size ≥ 200 m2). The classification accuracy statistics are presented in Table 5.
Table 5.
Accuracy comparison of oyster classified results.
Overall, parameter optimization significantly improved the segmentation accuracy of oyster reefs across different scales. Specifically, the classification accuracy for small-scale reefs increased from 91.63% to 95.32%, a rise of 3.69%; for medium-scale reefs, it rose from 93.94% to 97.92%, an improvement of 3.98%; and for large-scale reefs, it increased from 91.21% to 96.46%, a gain of 5.25%. It is evident that parameter optimization exerts a pronounced positive effect on targets at all scales, with the most significant improvement observed for large-scale oyster reefs.
From the perspective of scale variation, under default parameter conditions, the classification accuracy of oyster reefs at different scales exhibits certain fluctuations. Medium-scale targets demonstrate relatively superior performance, while small-scale and large-scale targets show slightly lower accuracy. This is primarily attributed to the morphological complexity and boundary uncertainty arising from changes in target scale. Small-scale reef structures, due to their smaller dimensions, are susceptible to noise interference and spatial resolution limitations; conversely, large-scale reef structures present greater challenges for model segmentation owing to their intricate internal structures and diverse boundary variations.
After implementing the parameter optimization strategy, the classification accuracy for oyster reefs across different scales improved overall and became more balanced, consistently remaining above 95%. This demonstrates that the optimized parameter combination significantly enhances the adaptability of model to multi-scale targets. Notably, the greatest mean IoU was observed for large-scale targets, highlighting the parameter optimizations more pronounced effectiveness in improving segmentation of complex structural features.
Because oyster reefs occupy only a small fraction of the UAV DOM image, relying only on IoU may not fully reflect model performance under class imbalance. Therefore, Precision, Recall, F1-score, and Kappa coefficient were added to the accuracy assessment. Precision measures the reliability of predicted reef regions, Recall reflects the completeness of reef detection, F1-score balances commission and omission errors, and Kappa evaluates classification agreement while accounting for chance agreement.
As shown in Table 6, the extraction accuracy varied among oyster reefs of different size classes. For small reefs with an area of 0 < Size ≤ 50, the Precision reached 97.80%, indicating that most regions identified as oyster reefs were correct. However, the Recall was only 67.04%, suggesting that small oyster reefs were more likely to be missed due to their limited spatial extent, fragmented distribution, and weak boundary characteristics. For medium-sized reefs with an area of 50 < Size ≤ 200, the Precision increased to 99.07%, while the Recall improved to 78.59%, resulting in an F1-score of 87.65% and a Kappa coefficient of 0.832. This indicates that the model achieved a better balance between detection reliability and completeness for medium-sized reefs. For large reefs with an area of Size > 200, the Recall further increased to 90.71%, and the F1-score and Kappa coefficient reached 94.50% and 0.922, respectively, demonstrating the best overall extraction performance. These results indicate that the proposed method performs particularly well for medium and large oyster reefs, while the omission of small reef patches remains the main source of uncertainty.
Table 6.
Accuracy metrics for oyster reefs of different size classes.
4. Discussion
4.1. Impact of Spatial Resolution on the Extraction Performance of Oyster Reefs
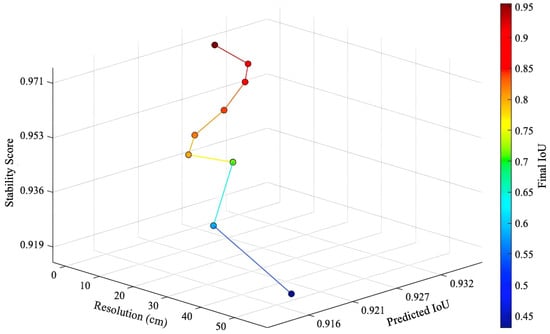
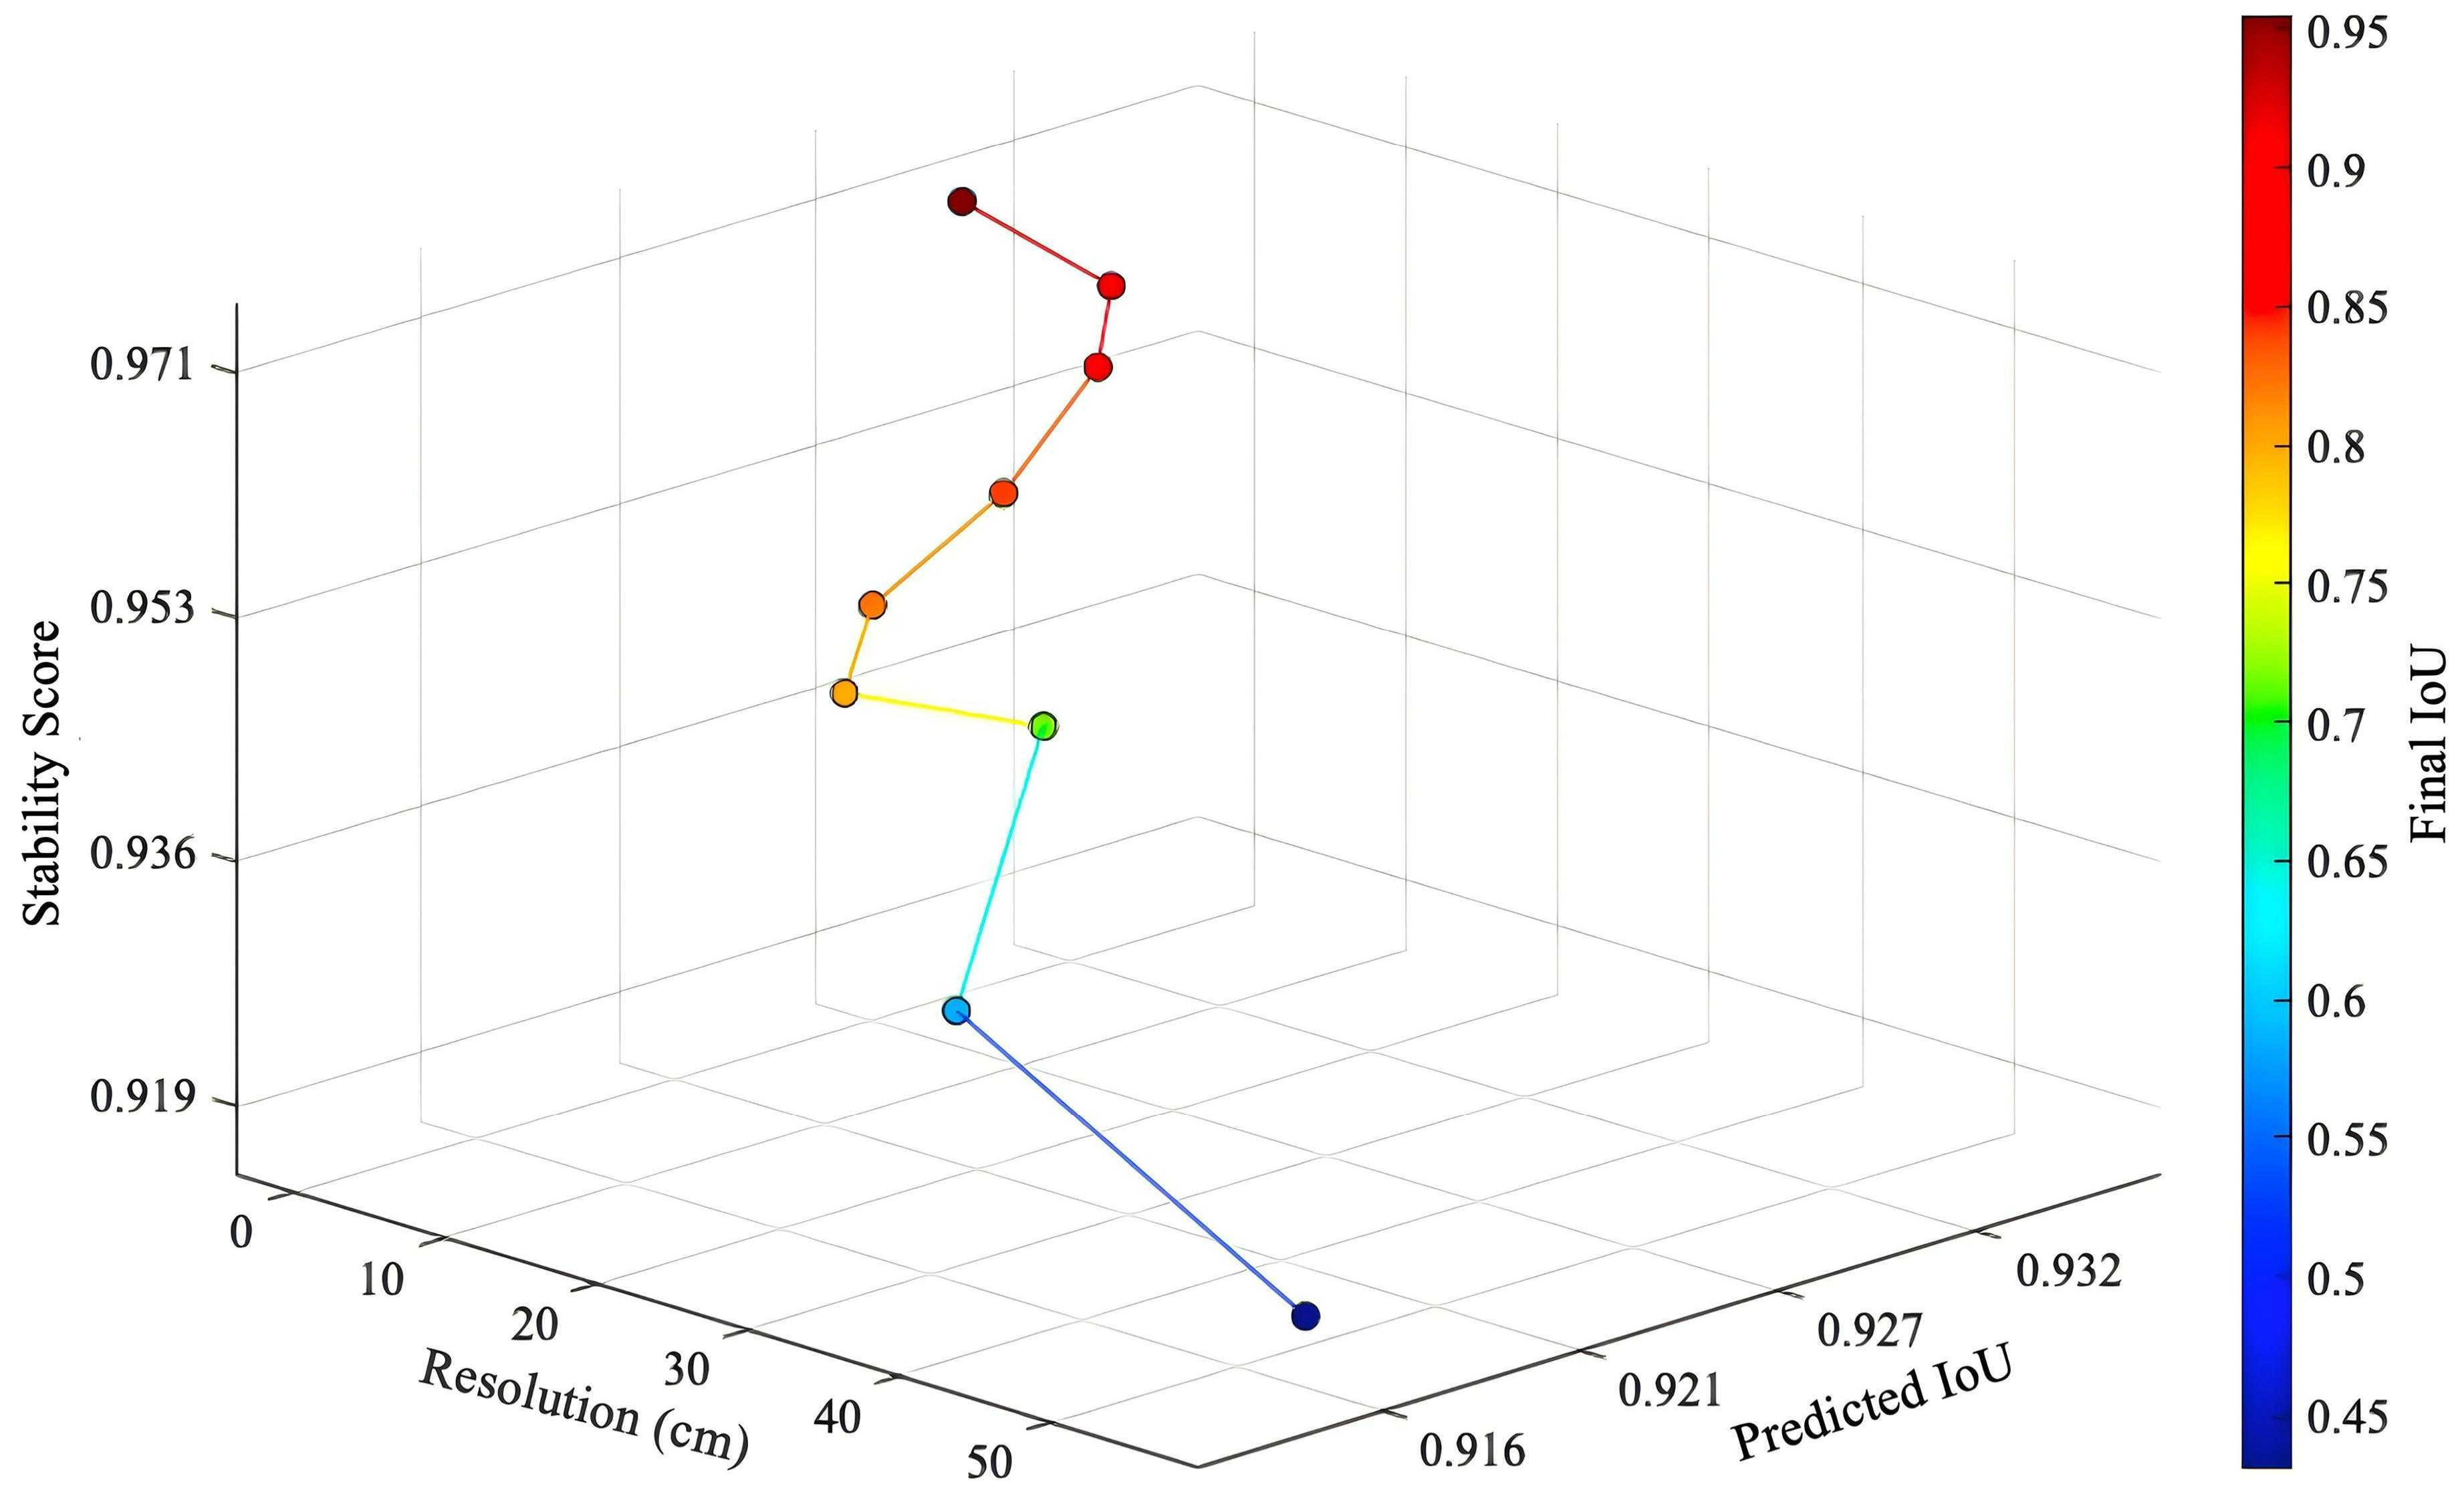
The relationship between spatial resolution and segmentation performance is illustrated in Figure 16, exhibiting a distinct non-monotonic variation pattern. The spatial variability in this analysis originates from UAV observations conducted at different flight altitudes (50, 100, 200, and 300 m), corresponding to spatial resolutions of 1.36, 2.73, 5.46, and 8.19 cm, respectively. At higher spatial resolutions, the model effectively preserves the detailed structure and boundary information of the oyster reef, yielding high final IoU values and stability scores. When the resolution decreases to moderate levels, segmentation performance remains robust while achieving an optimal balance between stability and accuracy. However, as resolution further declines, the final IoU drops significantly; although stability scores remain relatively high in some cases, the loss of spatial detail substantially limits segmentation accuracy.
Figure 16.
Effect of spatial resolution on segmentation performance.
The phenomenon demonstrates that resolution influences model performance through a dual mechanism: on one hand, higher resolution enhances target boundary representation and improves spatial matching accuracy; on the other hand, excessively high or low resolutions may negatively impact model stability or generalization ability. At low resolutions, small-scale reef structures tend to be smoothed or merged, resulting in blurred or even lost target contours and significantly reducing the IoU metric. The spatial resolution affects oyster reefs across different scales consistently: within optimal resolution ranges, all targets exhibit high and stable classification accuracy; however, reduced resolution leads to varying degrees of accuracy decline for both large-scale and small-scale targets. These findings highlight the critical importance of appropriately selecting spatial resolution for effective multi-scale target recognition.
Furthermore, in Figure 16, the stability score and the final IoU did not consistently move in tandem, indicating that a single evaluation metric cannot fully capture segmentation performance. In certain low-resolution scenarios, despite higher stability scores, the IoU still decreased significantly, suggesting that while the model produced relatively consistent outputs under these conditions, its spatial alignment with the actual targets remained inadequate. Therefore, in practical applications, both stability and IoU metrics should be considered comprehensively to achieve an accurate assessment of segmentation performance.
The result highlights that the proposed workflow is sensitive to image resolution, which is directly determined by UAV flight altitude or sensor configuration. Therefore, in practical applications, careful selection of flight altitude or imaging sensor is required to ensure an optimal balance between spatial detail and segmentation robustness. Overall, the research findings indicate the existence of an optimal resolution range that balances spatial detail representation with model stability, enabling high-precision extraction of oyster reef spatial distribution. This discovery provides crucial guidance for selecting drone image resolutions and optimizing subsequent parameters.
4.2. Impact of SAM Parameter Optimization on Extraction Accuracy of Oyster Reef
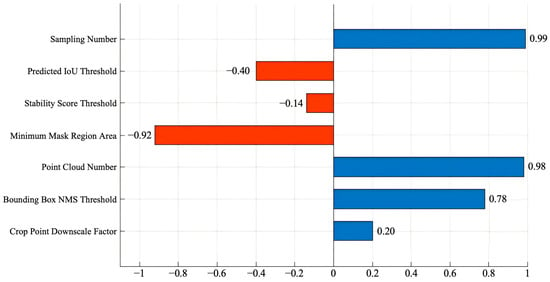
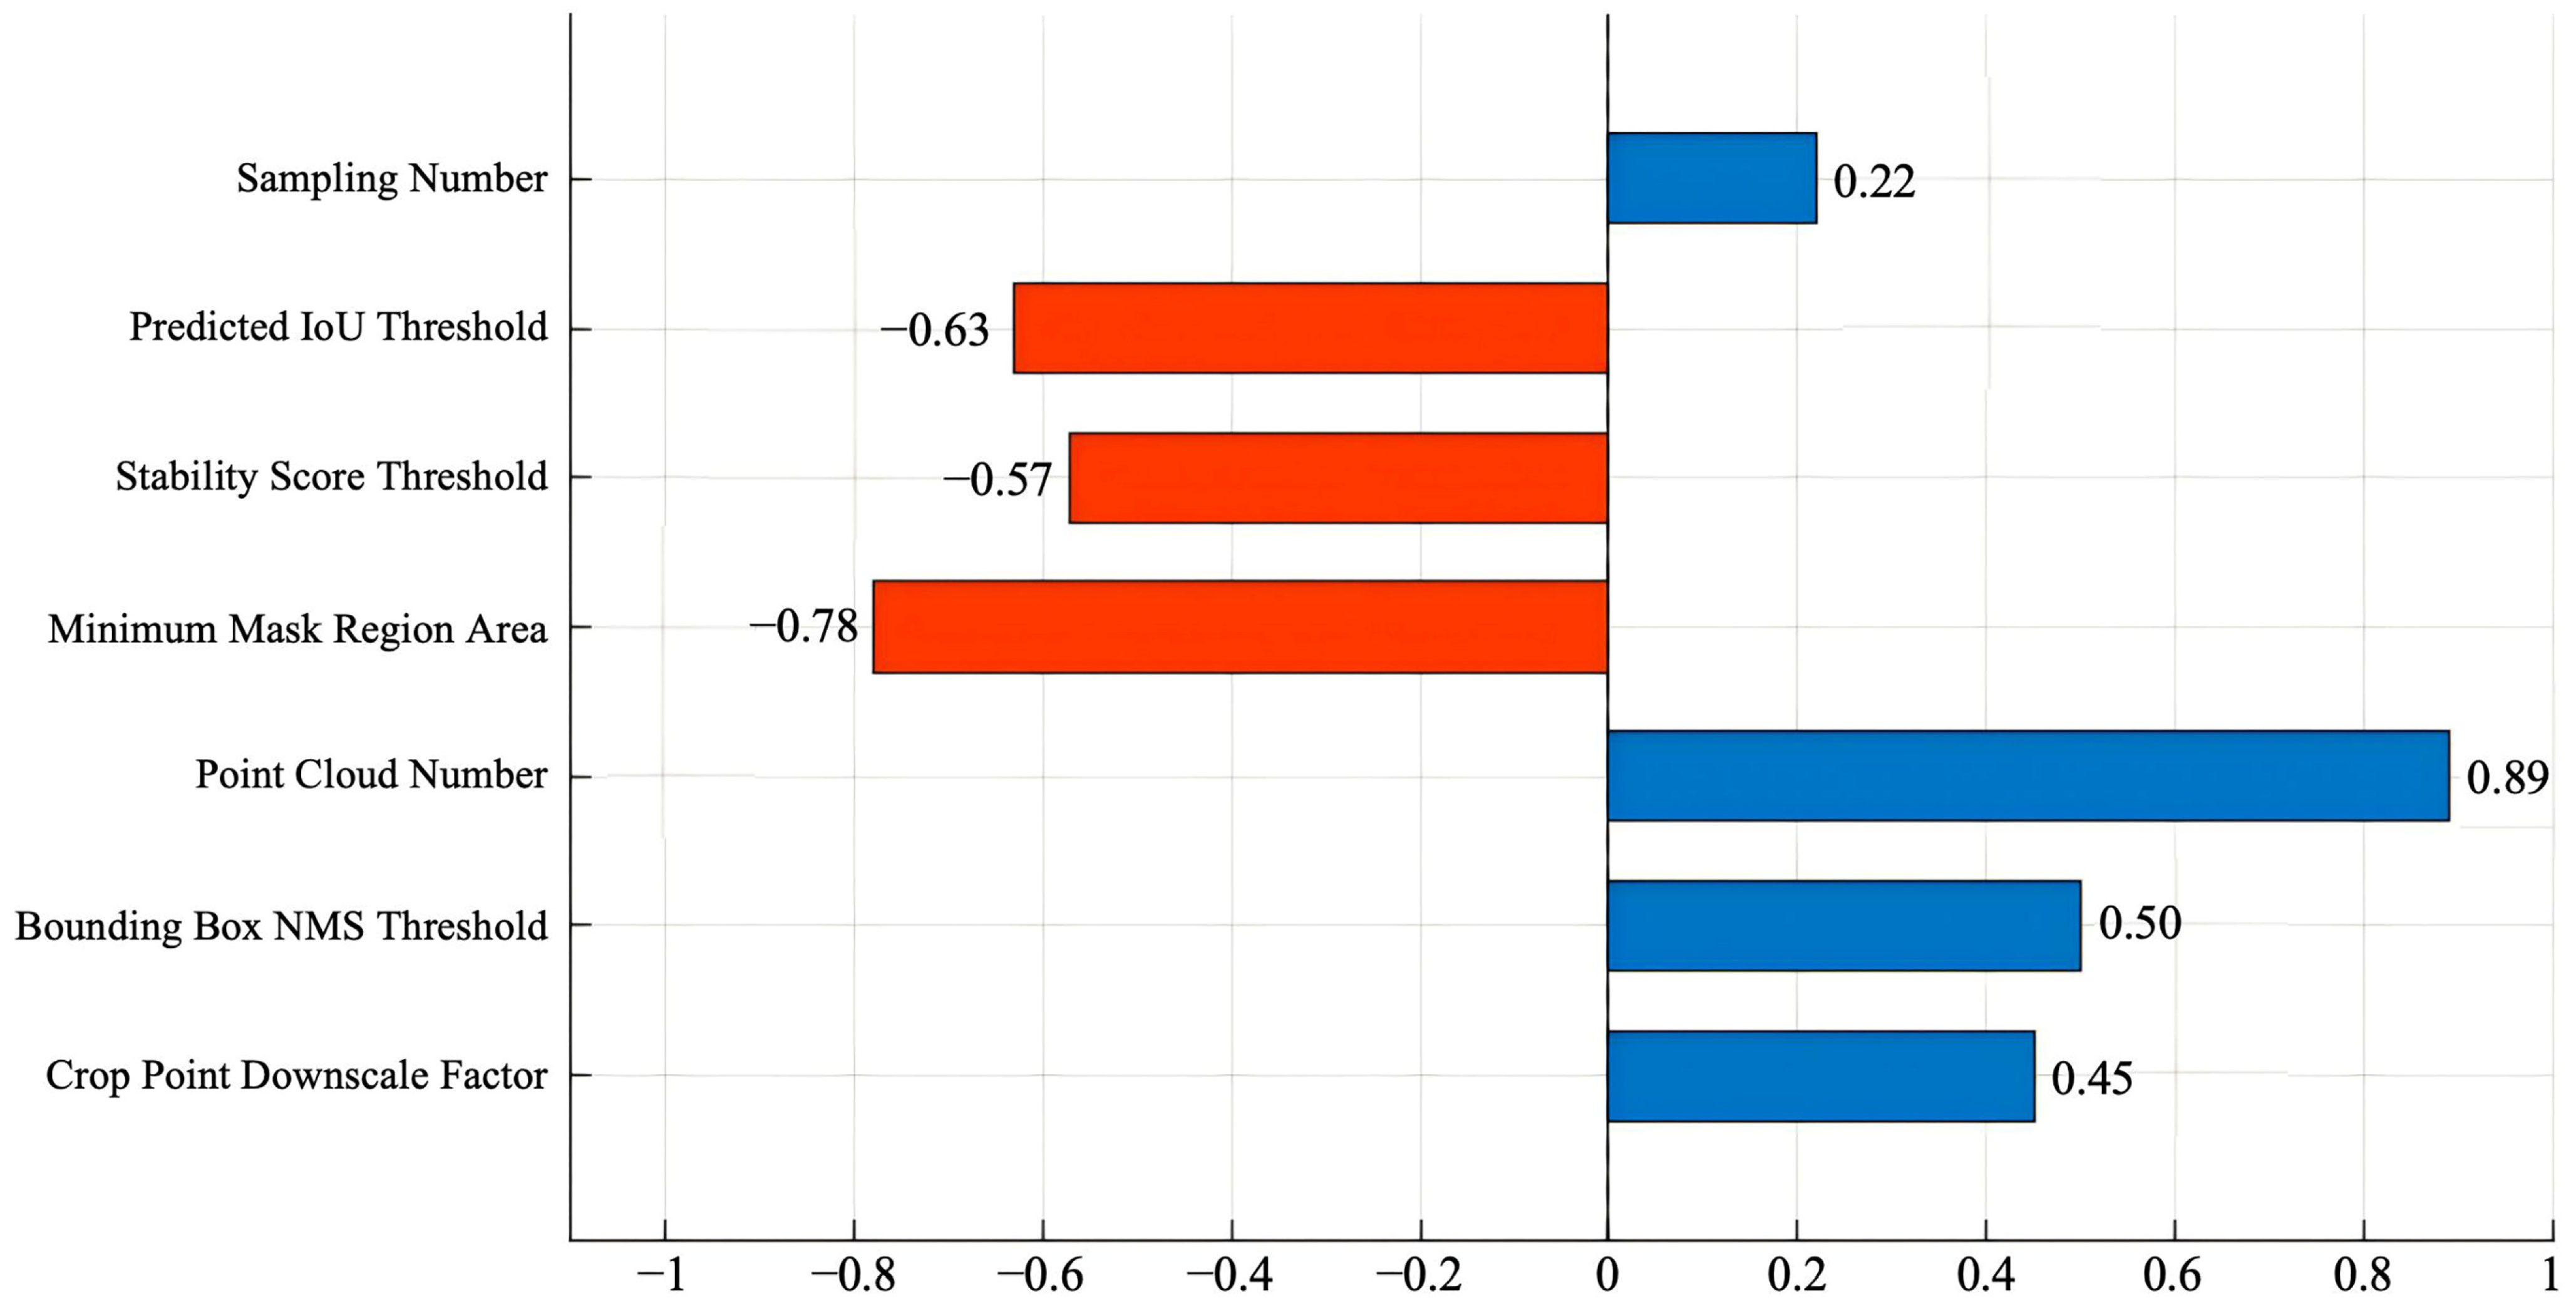
To quantify the relationships between the SAM parameters and segmentation performance, Pearson’s correlation coefficient was calculated. Pearson’s correlation was selected because both the SAM parameter values and the corresponding mean IoU values are continuous variables, and the analysis aimed to evaluate their linear relationships. The correlation coefficients shown in Figure 17 and Figure 18 therefore represent Pearson’s r values.
Figure 17.
Correlation analysis of SAM parameters to IoU in the illuminated area.
Figure 18.
Correlation analysis of SAM parameters to IoU in the shaded area.
In regions with optimal lighting conditions (Figure 17), a clear correlation structure emerges between various parameters and segmentation accuracy. Both the number of sampling points and the volume of prompt points exhibit significant positive correlations, with correlation coefficients approaching 0.99 and 0.98, respectively. This indicates that under conditions of sufficient spectral information and well-defined target boundaries, increasing sampling density and the number of candidate regions effectively enhances the ability of model to capture spatial details, thereby improving segmentation accuracy. The bounding box NMS threshold also shows a strong positive correlation, suggesting that an appropriate redundancy suppression strategy improves the completeness and consistency of target extraction. In contrast, the predicted IoU threshold exhibits a negative correlation with the stability score threshold: the correlation coefficient for the predicted IoU threshold is approximately −0.40, while that for the stability score threshold is weaker indicating that excessively high screening criteria may overly exclude valid targets. The minimum mask area parameter demonstrates the strongest negative correlation, suggesting that an excessively large area threshold significantly impairs the recognition of small-scale targets. Additionally, the cropping point down sampling factor shows a weak correlation, indicating its limited impact on segmentation performance.
In the shaded region (Figure 18), the relationship between parameters and IoU exhibits a stronger negative correlation trend and lower stability overall. Both the predicted IoU threshold and stability score threshold show significant negative correlations, while the minimum mask area maintains a strong negative correlation. This indicates that under low-contrast conditions, stringent filtering strategies are more prone to erroneously excluding real target regions, thereby compromising segmentation integrity. Compared to the illuminated region, the positive correlation of sampling points in the shaded area is significantly weaker, suggesting limited benefits from increasing sampling density. The prompt points number retains a moderate positive correlation, though below the level observed in the illuminated region, indicating its diminished effectiveness in complex environments. The bounding box NMS threshold and the cropping point down sampling factor demonstrate moderate positive correlations, indicating that model performance under shadow conditions relies more heavily on coordinated regulation of redundancy control and sampling strategies.
The comparative analysis of both illumination conditions reveals that the impact of the SAM parameters on segmentation performance exhibits distinct environmental dependence. In illuminated areas, model performance is primarily driven by spatial information representation capabilities, demonstrating high sensitivity to sampling density and the number of candidates regions, whereas in shaded areas, the model relies more heavily on threshold parameters for noise and uncertainty suppression. These findings indicate that a unified parameter configuration struggles to meet segmentation requirements across varying environmental conditions. Implementing zonal parameter optimization strategies tailored to illumination variations is crucial for enhancing the accuracy and stability of oyster reef spatial distribution extraction. Therefore, practical applications should employ zonal parameter optimization strategies based on image illumination characteristics. By adjusting key parameters separately for illuminated and shaded zones, segmentation precision can be improved while enhancing the stability of the model and generalization capability in complex coastal environments. This conclusion further validates the central role of parameter optimization in automated oyster reef extraction processes and provides critical evidence for developing adaptive parameter adjustment methodologies.
5. Conclusions
An automated framework is proposed for extracting spatial distribution patterns of oyster reefs based on the SAM combined with drone DOM imagery to achieve high-precision target recognition in complex coastal environments. Compared to traditional methods reliant on human expertise or rule-based constraints, this framework employs a unified model architecture and parameter optimization mechanism that effectively mitigates interference from environmental factors such as spectral confusion, tidal variations, and lighting variations, thereby significantly enhancing segmentation efficiency and extraction accuracy.
Through systematic parameter sensitivity analysis and optimization, this study elucidated the functional patterns of key SAM parameters under varying illumination conditions and target scales. The results demonstrate that parameters such as sampling point density, prediction IoU threshold, and stability score threshold significantly influence segmentation performance, with optimal configurations exhibiting distinct differences between illuminated and shaded regions. Specifically, the model shows greater sensitivity to spatial sampling density under adequate lighting conditions, whereas in shaded areas, segmentation outcomes rely more heavily on the regulatory capacity of threshold-related parameters for mitigating noise and uncertainty. Based on these findings, the proposed partition parameter optimization strategy effectively enhances the adaptability and stability of model in complex environments.
The experimental results further demonstrate a significant correlation between spatial resolution and segmentation accuracy. Within the optimal resolution range, the model achieves an optimal balance between stability and IoU; however, when resolution is too low, the loss of target boundary information significantly reduces extraction accuracy. Based on multi-spectral imagery data acquired by drones in 2025, the total area of oyster reefs in the study region was estimated at 2.24 hectares, validating the reliability of this method in practical applications.
Furthermore, comparative experiments under varying lighting conditions demonstrate that parameter optimization significantly enhances segmentation performance. In illuminated areas, accuracy improved from 93.22% to 97.61%, while in shaded areas, it rose from 93.30% to 96.67%, indicating the method’s robustness and generalization capability under complex lighting conditions. These results further confirm that appropriate parameter configurations effectively mitigate the impact of environmental interference on segmentation performance.
Overall, this study establishes a robust, efficient, and highly scalable automated method for extracting the spatial distribution of oyster reefs, providing reliable technical support for refined monitoring of coastal fishery habitats [16,28]. Future research could further integrate multi-source remote sensing data with time-series observational information to enhance identification capabilities and dynamic monitoring performance under complex environmental conditions [60,61,62], thereby offering more comprehensive data support for intertidal ecosystem management and sustainable utilization. In addition, high-spatial-resolution data and downscaling methods help improve the accuracy of in situ temperature and other environmental parameter retrievals [63]. The downlink light sensor correction and solar trajectory correction models of unmanned aerial vehicle images can further improve the quality of orthophoto generation and the comparability across different time phases [64,65]. In addition, studies on the identification of breeding targets based on unmanned aerial vehicle data and methods for extracting aquaculture information by integrating multi-source remote sensing data and SAMs also provide methodological references for the expansion of the automated monitoring framework for oyster reefs [66], thereby providing more comprehensive data support for the management and sustainable utilization of intertidal ecosystems.
Author Contributions
Conceptualization, methodology, investigation and validation by F.W., W.Q., R.F. and D.Y.; formal analysis, writing, review, editing and visualization by X.X. and F.W.; project administration and funding acquisition by W.F. and F.W. All authors have read and agreed to the published version of the manuscript.
Funding
This study is supported by the Central Public-Interest Scientific Institution Basal Research Fund, CAFS (No. 2024TD04) and the National Non-Profit Institutes (East China Sea Fisheries Research Institute) (2025TD02).
Data Availability Statement
The dataset generated in this study is available at Figshare (https://doi.org/10.6084/m9.figshare.32616651).
Acknowledgments
During the preparation of this manuscript, the authors used ChatGPT (GPT-5.5, OpenAI) for language polishing, grammar checking, and improving the clarity and readability of the manuscript. The authors have reviewed and edited the output and take full responsibility for the content of this publication.
Conflicts of Interest
The authors declare no conflicts of interest.
Abbreviations
The following abbreviations are used in this manuscript:
| UAV | Unmanned Aerial Vehicle |
| SAM | Segment Anything Model |
| DOM | Digital Orthophoto Map |
| RF | Random Forest |
| IoU | Intersection over Union |
| OOB | Out-of-Bag |
| AT | Aerial Triangulation |
| GCP | Ground Control Point |
| SIFT | Scale-Invariant Feature Transform |
| GPS | Global Positioning System |
| RTK | Real-Time Kinematic |
| GLCM | Gray-Level Co-occurrence Matrix |
| ASM | Angular Second Moment |
| OFAT | one-factor-at-a-time |
| NMS | Non-Maximum Suppression |
| Meta AI | Meta Artificial Intelligence |
References
- Beck, M.W.; Brumbaugh, R.D.; Airoldi, L.; Carranza, A.; Coen, L.D.; Crawford, C.; Defeo, O.; Edgar, G.J.; Hancock, B.; Kay, M.C.; et al. Oyster Reefs at Risk and Recommendations for Conservation, Restoration, and Management. Bioscience 2011, 61, 107–116. [Google Scholar] [CrossRef] [Scilit]
- Van Der Schatte Olivier, A.; Jones, L.; Vay, L.L.; Christie, M.; Wilson, J.; Malham, S.K. A Global Review of the Ecosystem Services Provided by Bivalve Aquaculture. Rev. Aquac. 2020, 12, 3–25. [Google Scholar] [CrossRef] [Scilit]
- Grabowski, J.H.; Peterson, C.H. Restoring Oyster Reefs to Recover Ecosystem Services. Theor. Ecol. Ser. 2007, 4, 281–298. [Google Scholar] [CrossRef] [Scilit]
- Zu Ermgassen, P.S.E.; Spalding, M.D.; Grizzle, R.E.; Brumbaugh, R.D. Quantifying the Loss of a Marine Ecosystem Service: Filtration by the Eastern Oyster in US Estuaries. Estuaries Coasts 2013, 36, 36–43. [Google Scholar] [CrossRef] [Scilit]
- Piazza, B.P.; Banks, P.D.; La Peyre, M.K. The Potential for Created Oyster Shell Reefs as a Sustainable Shoreline Protection Strategy in Louisiana. Restor. Ecol. 2005, 13, 499–506. [Google Scholar] [CrossRef] [Scilit]
- Kirby, M.X. Fishing down the Coast: Historical Expansion and Collapse of Oyster Fisheries along Continental Margins. Proc. Natl. Acad. Sci. USA 2004, 101, 13096–13099. [Google Scholar] [CrossRef] [Scilit] [PubMed]
- Alleway, H.K.; Connell, S.D. Loss of an Ecological Baseline through the Eradication of Oyster Reefs from Coastal Ecosystems and Human Memory: Loss of Oyster Reefs to History. Conserv. Biol. 2015, 29, 795–804. [Google Scholar] [CrossRef] [Scilit] [PubMed]
- Lotze, H.K.; Lenihan, H.S.; Bourque, B.J.; Bradbury, R.H.; Cooke, R.G.; Kay, M.C.; Kidwell, S.M.; Kirby, M.X.; Peterson, C.H.; Jackson, J.B.C. Depletion, Degradation, and Recovery Potential of Estuaries and Coastal Seas. Science 2006, 312, 1806–1809. [Google Scholar] [CrossRef] [Scilit] [PubMed]
- Harley, C.D.G.; Randall Hughes, A.; Hultgren, K.M.; Miner, B.G.; Sorte, C.J.B.; Thornber, C.S.; Rodriguez, L.F.; Tomanek, L.; Williams, S.L. The Impacts of Climate Change in Coastal Marine Systems. Ecol. Lett. 2006, 9, 228–241. [Google Scholar] [CrossRef] [Scilit] [PubMed]
- Solomon, J.A.; Donnelly, M.J.; Walterst, L.J. Effects of Sea Level Rise on the Intertidal Oyster Crassostrea Virginica by Field Experiments. J. Coast. Res. 2014, 68, 57–64. [Google Scholar] [CrossRef] [Scilit]
- Lenihan, H.S.; Peterson, C.H. How Habitat Degradation Through Fishery Disturbance Enhances Impacts of Hypoxia on Oyster Reefs. Ecol. Appl. 1998, 8, 128–140. [Google Scholar] [CrossRef]
- Windle, A.; Poulin, S.; Johnston, D.; Ridge, J. Rapid and Accurate Monitoring of Intertidal Oyster Reef Habitat Using Unoccupied Aircraft Systems and Structure from Motion. Remote Sens. 2019, 11, 2394. [Google Scholar] [CrossRef] [Scilit]
- Windle, A.E.; Puckett, B.; Huebert, K.B.; Knorek, Z.; Johnston, D.W.; Ridge, J.T. Estimation of Intertidal Oyster Reef Density Using Spectral and Structural Characteristics Derived from Unoccupied Aircraft Systems and Structure from Motion Photogrammetry. Remote Sens. 2022, 14, 2163. [Google Scholar] [CrossRef] [Scilit]
- Chand, S.; Bollard, B. Multispectral Low Altitude Remote Sensing of Wild Oyster Reefs. Glob. Ecol. Conserv. 2021, 30, e01810. [Google Scholar] [CrossRef] [Scilit]
- Espriella, M.C.; Lecours, V.; Frederick, P.C.; Camp, E.V.; Wilkinson, B. Quantifying Intertidal Habitat Relative Coverage in a Florida Estuary Using UAS Imagery and GEOBIA. Remote Sens. 2020, 12, 677. [Google Scholar] [CrossRef] [Scilit]
- Hoffmann, T.K.; Pfennings, K.; Hitzegrad, J.; Brohmann, L.; Welzel, M.; Paul, M.; Goseberg, N.; Wehrmann, A.; Schlurmann, T. Low-Cost UAV Monitoring: Insights into Seasonal Volumetric Changes of an Oyster Reef in the German Wadden Sea. Front. Mar. Sci. 2023, 10, 1245926. [Google Scholar] [CrossRef] [Scilit]
- Khoo, M.D.Y.; Lim, B.T.; Soh, M.C.; Loy, R.H.; Lua, H.; Lee, B.P.-H.; Loo, A.H.; Er, K.B. Persistence of a Locally Endangered Mouse-Deer amidst the Re-Emergence of Two Larger Ungulates in Small Urban Rainforest Fragments. Glob. Ecol. Conserv. 2021, 30, e01807. [Google Scholar] [CrossRef] [Scilit]
- Ventura, D.; Bruno, M.; Lasinio, G.J.; Belluscio, A.; Ardizzone, G. A low-cost drone based application for identifying and mapping of coastal fish nursery grounds. Estuar. Coast. Shelf Sci. 2016, 171, 85–98. [Google Scholar] [CrossRef] [Scilit]
- Bueno, J.; Lester, S.E.; Breithaupt, J.L.; Brooke, S. The Application of Unoccupied Aerial Systems (UAS) for Monitoring Intertidal Oyster Density and Abundance. Remote Sens. Ecol. Conserv. 2025, 11, 187–199. [Google Scholar]
- Klemas, V.V. Coastal and Environmental Remote Sensing from Unmanned Aerial Vehicles: An Overview. J. Coast. Res. 2015, 315, 1260–1267. [Google Scholar] [CrossRef] [Scilit]
- Anderson, K.; Gaston, K.J. Lightweight Unmanned Aerial Vehicles Will Revolutionize Spatial Ecology. Front. Ecol. Environ. 2013, 11, 138–146. [Google Scholar] [CrossRef] [Scilit]
- Espriella, M.C.; Lecours, V.; Camp, E.V.; Lassiter, H.A.; Wilkinson, B.; Frederick, P.C.; Pittman, S.J. Drone Lidar-Derived Surface Complexity Metrics as Indicators of Intertidal Oyster Reef Condition. Ecol. Indic. 2023, 150, 110190. [Google Scholar] [CrossRef] [Scilit]
- Ridge, J.T.; DiGiacomo, A.E.; Rodriguez, A.B.; Himmelstein, J.D.; Johnston, D.W. Comparison of 3D Structural Metrics on Oyster Reefs Using Unoccupied Aircraft Photogrammetry and Terrestrial LiDAR across a Tidal Elevation Gradient. Remote Sens. Ecol. Conserv. 2023, 9, 501–511. [Google Scholar] [CrossRef] [Scilit]
- Román, A.; Prasyad, H.; Oiry, S.; Davies, B.F.R.; Brunier, G.; Barillé, L. Mapping Intertidal Oyster Farms Using Unmanned Aerial Vehicles (UAV) High-Resolution Multispectral Data. Estuar. Coast. Shelf Sci. 2023, 291, 108432. [Google Scholar] [CrossRef] [Scilit]
- Minaee, S.; Boykov, Y.; Porikli, F.; Plaza, A.; Kehtarnavaz, N.; Terzopoulos, D. Image Segmentation Using Deep Learning: A survey. IEEE Trans. Pattern Anal. Mach. Intell. 2021, 44, 3523–3542. [Google Scholar]
- Long, J.; Shelhamer, E.; Darrell, T. Fully Convolutional Networks for Semantic Segmentation. In Proceedings of the IEEE Conference on Computer Vision and Pattern Recognition; IEEE: Piscataway, NJ, USA, 2015; pp. 3431–3440. [Google Scholar]
- Zou, Z.; Shi, Z.; Guo, Y.; Ye, J. Object Detection in 20 Years: A Survey. Proc. IEEE 2023, 111, 257–276. [Google Scholar] [CrossRef] [Scilit]
- Osco, L.P.; Wu, Q.; De Lemos, E.L.; Gonçalves, W.N.; Ramos, A.P.M.; Li, J.; Marcato, J. The Segment Anything Model (SAM) for Remote Sensing Applications: From Zero to One Shot. Int. J. Appl. Earth Obs. Geoinf. 2023, 124, 103540. [Google Scholar] [CrossRef] [Scilit]
- Song, B.; Yang, H.; Wu, Y.; Zhang, P.; Wang, B.; Han, G. A Multispectral Remote Sensing Crop Segmentation Method Based on Segment Anything Model Using Multistage Adaptation Fine-Tuning. IEEE Trans. Geosci. Remote Sens. 2024, 62, 4408818. [Google Scholar] [CrossRef] [Scilit]
- Moghimi, A.; Welzel, M.; Celik, T.; Schlurmann, T. A Comparative Performance Analysis of Popular Deep Learning Models and Segment Anything Model (SAM) for River Water Segmentation in Close-Range Remote Sensing Imagery. IEEE Access 2024, 12, 52067–52085. [Google Scholar] [CrossRef] [Scilit]
- Gallagher, J.E.; Gogia, A.; Oughton, E.J. A Multispectral Automated Transfer Technique (MATT) for Machine-Driven Image Labeling Utilizing the Segment Anything Model (SAM). IEEE Access 2024, 13, 4499–4516. [Google Scholar] [CrossRef] [Scilit]
- Luo, F.; Chen, Z.; Wu, H.; Zhu, F.; Zeng, J.; Quan, W. Hydrodynamic and Sediment Dynamic Impact of Human Engineering Activity on Liyashan Oyster Reefs, China. Front. Mar. Sci. 2022, 9, 1051868. [Google Scholar] [CrossRef] [Scilit]
- Lin, H.; Yu, Q.; Du, Z.; Fan, Y.; Wang, Y.; Gao, S. Geomorphology and Sediment Dynamics of the Liyashan Oyster Reefs, Jiangsu Coast, China. Acta Oceanol. Sin. 2021, 40, 118–128. [Google Scholar] [CrossRef] [Scilit]
- Palmer, S.C.J.; Kutser, T.; Hunter, P.D. Remote Sensing of Inland Waters: Challenges, Progress and Future Directions. Remote Sens. Environ. 2015, 157, 1–8. [Google Scholar] [CrossRef] [Scilit]
- Liu, S.; Xue, Q.; Xu, H.; Lin, Z. Identification of Main Oyster Species and Comparison of Their Genetic Diversity in Zhejiang Coast, South of Yangtze River Estuary. Front. Mar. Sci. 2021, 8, 662515. [Google Scholar] [CrossRef] [Scilit]
- Zhang, G.; Fang, X.; Guo, X.; Li, L.; Luo, R.; Xu, F.; Yang, P.; Zhang, L.; Wang, X.; Qi, H.; et al. The Oyster Genome Reveals Stress Adaptation and Complexity of Shell Formation. Nature 2012, 490, 49–54. [Google Scholar] [CrossRef] [Scilit] [PubMed]
- Drusch, M.; Del Bello, U.; Carlier, S.; Colin, O.; Fernandez, V.; Gascon, F.; Hoersch, B.; Isola, C.; Laberinti, P.; Martimort, P.; et al. Sentinel-2: ESA’s Optical High-Resolution Mission for GMES Operational Services. Remote Sens. Environ. 2012, 120, 25–36. [Google Scholar] [CrossRef] [Scilit]
- Roy, D.P.; Wulder, M.A.; Loveland, T.R.; Ce, W.; Allen, R.G.; Anderson, M.C.; Helder, D.; Irons, J.R.; Johnson, D.M.; Kennedy, R.; et al. Landsat-8: Science and Product Vision for Terrestrial Global Change Research. Remote Sens. Environ. 2014, 145, 154–172. [Google Scholar] [CrossRef] [Scilit]
- Zhu, Z.; Woodcock, C.E. Object-Based Cloud and Cloud Shadow Detection in Landsat Imagery. Remote Sens. Environ. 2012, 118, 83–94. [Google Scholar] [CrossRef] [Scilit]
- Gill, S. Sea-Level Science: Understanding Tides, Surges, Tsunamis and Mean Sea-Level Changes. Phys. Today 2015, 68, 56–57. [Google Scholar] [CrossRef] [Scilit]
- Wang, N.; Gao, Y.; Guo, H.; Lu, J. Analysis of Characteristics of Tide and Tidal Current in the East China Seas. J. Phys. Conf. Ser. 2023, 2486, 12039. [Google Scholar] [CrossRef] [Scilit]
- Kirillov, A.; Mintun, E.; Ravi, N.; Mao, H.; Rolland, C.; Gustafson, L.; Xiao, T.; Whitehead, S.; Berg, A.C.; Lo, W.-Y.; et al. Segment Anything. In Proceedings of the 2023 IEEE/CVF International Conference on Computer Vision (ICCV), Paris, France, 1–6 October 2023. [Google Scholar]
- Zhang, J.; Li, Y.; Yang, X.; Jiang, R.; Zhang, L. RSAM-Seg: A SAM-Based Model with Prior Knowledge Integration for Remote Sensing Image Semantic Segmentation. Remote Sens. 2025, 17, 590. [Google Scholar] [CrossRef] [Scilit]
- Ma, X.; Wu, Q.; Zhao, X.; Zhang, X.; Pun, M.-O.; Huang, B. SAM-Assisted Remote Sensing Imagery Semantic Segmentation with Object and Boundary Constraints. IEEE Trans. Geosci. Remote Sens. 2024, 62, 5636916. [Google Scholar] [CrossRef] [Scilit]
- Luo, M.; Zhang, T.; Wei, S.; Ji, S. SAM-RSIS: Progressively Adapting SAM with Box Prompting to Remote Sensing Image Instance Segmentation. IEEE Trans. Geosci. Remote Sens. 2024, 62, 4413814. [Google Scholar] [CrossRef] [Scilit]
- Haralick, R.M.; Shanmugam, K.; Dinstein, I. Textural Features for Image Classification. IEEE Trans. Syst. Man Cybern. 1973, SMC-3, 611–621. [Google Scholar] [CrossRef] [Scilit]
- Garreta, R.; Moncecchi, G. Learning Scikit-Learn: Machine Learning in Python; Community Experience Distilled; Packt Publishing Ltd.: Birmingham, UK, 2013. [Google Scholar]
- Pedregosa, F.; Pedregosa, F.; Varoquaux, G.; Varoquaux, G.; Org, N.; Gramfort, A.; Gramfort, A.; Michel, V.; Michel, V.; Fr, L.; et al. Scikit-Learn: Machine Learning in Python. J. Mach. Learn. Res. 2011, 12, 2825–2830. [Google Scholar]
- Belgiu, M.; Drăguţ, L. Random Forest in Remote Sensing: A Review of Applications and Future Directions. ISPRS J. Photogramm. Remote Sens. 2016, 114, 24–31. [Google Scholar] [CrossRef] [Scilit]
- Breiman, L. Random Forests. Mach. Learn. 2001, 45, 5–32. [Google Scholar] [CrossRef] [Scilit]
- Dong, X.; Yu, Z.; Cao, W.; Shi, Y.; Ma, Q. A Survey on Ensemble Learning. Front. Comput. Sci. 2020, 14, 241–258. [Google Scholar]
- Bischl, B.; Binder, M.; Lang, M.; Pielok, T.; Richter, J.; Coors, S.; Thomas, J.; Ullmann, T.; Becker, M.; Boulesteix, A.-L.; et al. Hyperparameter Optimization: Foundations, Algorithms, Best Practices, and Open Challenges. Wiley Interdiscip. Rev. Data Min. Knowl. Discov. 2023, 13, e1484. [Google Scholar] [CrossRef] [Scilit]
- Yang, L.; Shami, A. On Hyperparameter Optimization of Machine Learning Algorithms: Theory and Practice. Neurocomputing 2020, 415, 295–316. [Google Scholar] [CrossRef] [Scilit]
- Casella, E.; Collin, A.; Harris, D.; Ferse, S.; Bejarano, S.; Parravicini, V.; Hench, J.L.; Rovere, A. Mapping Coral Reefs Using Consumer-Grade Drones and Structure from Motion Photogrammetry Techniques. Coral Reefs 2017, 36, 269–275. [Google Scholar]
- Schnebele, E.; Tanyu, B.F.; Cervone, G.; Waters, N. Review of Remote Sensing Methodologies for Pavement Management and Assessment. Eur. Transp. Res. Rev. 2015, 7, 7. [Google Scholar] [CrossRef] [Scilit]
- Xu, X.; Xu, S.; Jin, L.; Song, E. Characteristic Analysis of Otsu Threshold and Its Applications. Pattern Recognit. Lett. 2011, 32, 956–961. [Google Scholar] [CrossRef] [Scilit]
- Yousefi, J. Image Binarization Using Otsu Thresholding Algorithm; University of Guelph: Guelph, ON, Canada, 2011; Volume 10. [Google Scholar]
- Everingham, M.; Van Gool, L.; Williams, C.K.I.; Winn, J.; Zisserman, A. The Pascal Visual Object Classes (VOC) Challenge. Int. J. Comput. Vis. 2010, 88, 303–338. [Google Scholar]
- Remondino, F.; Nocerino, E.; Toschi, I.; Menna, F. A Critical Review of Automated Photogrammetric Processing of Large Datasets. Int. Arch. Photogramm. Remote Sens. Spat. Inf. Sci. 2017, 42, 591–599. [Google Scholar] [CrossRef] [Scilit]
- Weng, Q. Remote Sensing of Impervious Surfaces in the Urban Areas: Requirements, Methods, and Trends. Remote Sens. Environ. 2012, 117, 34–49. [Google Scholar] [CrossRef] [Scilit]
- Reiche, J.; De Bruin, S.; Hoekman, D.; Verbesselt, J.; Herold, M. A Bayesian Approach to Combine Landsat and ALOS PALSAR Time Series for Near Real-Time Deforestation Detection. Remote Sens. 2015, 7, 4973–4996. [Google Scholar] [CrossRef] [Scilit]
- Lefsky, M.A.; Cohen, W.B.; Parker, G.G.; Harding, D.J. Lidar Remote Sensing for Ecosystem Studies. Bioscience 2002, 52, 19–30. [Google Scholar] [CrossRef] [Scilit]
- Wu, S.; Zhang, S.; Wang, F. Object-Based Downscaling Method for Land Surface Temperature with High-Spatial-Resolution Multispectral Data. Appl. Sci. 2025, 15, 4211. [Google Scholar] [CrossRef] [Scilit]
- Wu, S.; Lu, Y.; Fan, W.; Zhang, S.; Wu, Z.; Wang, F. An Efficient Downwelling Light Sensor Data Correction Model for UAV Multi-Spectral Image DOM Generation. Drones 2025, 9, 491. [Google Scholar] [CrossRef] [Scilit]
- Wu, S.; Nie, K.; Lu, X.; Fan, W.; Zhang, S.; Wang, F. A Solar Trajectory Model for Multi-Spectral Image Correction of DOM from Long-Endurance UAV in Clear Sky. Drones 2025, 9, 196. [Google Scholar] [CrossRef] [Scilit]
- Yang, D.; Zhang, S.; Xu, X.; Wu, Q.; Fan, W.; Zhang, L.; Wu, S.; Wang, F. Yield Estimation of Longline Aquaculture by the Shadows of Buoys Based on UAV Orthophoto Image. Drones 2025, 9, 786. [Google Scholar] [CrossRef] [Scilit]

Disclaimer/Publisher’s Note: The statements, opinions and data contained in all publications are solely those of the individual author(s) and contributor(s) and not of MDPI and/or the editor(s). MDPI and/or the editor(s) disclaim responsibility for any injury to people or property resulting from any ideas, methods, instructions or products referred to in the content. |
© 2026 by the authors. Licensee MDPI, Basel, Switzerland. This article is an open access article distributed under the terms and conditions of the Creative Commons Attribution (CC BY) license.