


Highlights
What are the main findings?
- A lightweight YOLOv26n model enables simultaneous detection of above-ground pipelines and visual anomaly/leak indicators from UAV imagery with 92.4% mAP@0.5.
- The optimized model sustains real-time onboard inference (18 FPS) on an NVIDIA Jetson Xavier NX, demonstrating embedded edge feasibility.
What are the implications of the main findings?
- The proposed framework supports low-latency, cloud-independent UAV inspection of critical infrastructure in heterogeneous environments.
- Edge-deployable deep learning enables scalable, autonomous corridor monitoring and timely maintenance prioritization for pipeline safety management.
Abstract
Ensuring the structural integrity and operational safety of oil and gas pipelines is a critical challenge due to their extensive geographical coverage and exposure to environmental and anthropogenic risks. Traditional inspection approaches including ground patrols and manned aerial surveys are labor-intensive, costly, and often lack real-time responsiveness. While unmanned aerial vehicles (UAVs) enable flexible and high-resolution monitoring, their practical deployment requires lightweight, robust detection models capable of real-time inference on embedded edge hardware under heterogeneous environmental conditions. This paper presents an end-to-end, edge-deployable UAV inspection framework for simultaneous detection of above-ground pipelines and visually observable anomaly/leak indicators using the official Ultralytics YOLOv26n object detector. A curated dataset of 6127 UAV images acquired across desert, semi-urban, and industrial environments was annotated with two classes (Pipeline and Anomaly/Leak) and partitioned into training 87.5%, validation 8.3%, and testing 4.2% subsets. The detector was fine-tuned from COCO-pretrained weights for 300 epochs at 600 × 600 resolution and evaluated using COCO-style metrics. On the held-out test set, the proposed model achieved 92.4% mAP@0.5 and 75.0% mAP@0.5:0.95, with 89.7% precision, 90.2% recall, and 89.9% F1-score at the selected operating threshold. Optimized TensorRT deployment on an NVIDIA Jetson Xavier NX sustained real-time inference at 18 FPS, demonstrating suitability for onboard UAV processing. Rather than proposing a new detector architecture, the study contributes a domain-specific annotated UAV dataset, deployment-oriented benchmarking, and an end-to-end edge inference workflow for corridor-scale monitoring. The proposed framework can help reduce environmental contamination risk and improve personnel safety during pipeline inspection.
1. Introduction
Oil and gas pipeline networks extend over thousands of kilometers and constitute critical infrastructure whose failure can result in severe environmental damage, safety hazards, and economic loss. Routine inspection is therefore essential to detect corrosion, leakage, third-party encroachment, structural degradation, and other integrity threats. Conventional inspection strategies—such as ground patrols, crewed aircraft surveys, and shutdown-based manual assessments—are resource-intensive, operationally disruptive, and often constrained by accessibility and safety considerations. Pipeline incidents may be driven by corrosion, mechanical damage, ground movement, or third-party activities, and can remain undetected between scheduled inspections. For above-ground assets, early warning can often be inferred from visual cues such as localized staining, surface wetness, disturbed soil, or changes near joints and valves. Improving revisit rate and reducing the time between observation and decision making are therefore central goals of modern integrity management.
Unmanned aerial vehicles (UAVs) have emerged as a transformative technology for infrastructure monitoring, enabling rapid deployment, flexible coverage, and high-resolution data acquisition. Recent advances in deep learning have further enhanced UAV capabilities by enabling automated object detection and scene understanding directly from aerial imagery. Surveys in UAV remote sensing and object detection highlight the growing adoption of convolutional and transformer-based models for real-time perception tasks [1,2,3]. However, translating algorithmic advances into operational inspection systems remains challenging. UAV imagery is particularly valuable because it captures fine-grained surface evidence at low altitude while reducing human exposure in hazardous or remote areas. However, many inspection workflows still rely on manual review or offline processing, which delays alarm generation and limits the ability to react during the same flight. Onboard (edge) inference provides immediate feedback to the pilot or autopilot, enabling adaptive behaviors such as re-flying suspicious segments, hovering for closer inspection, or triggering additional sensing for verification.
Edge deployment introduces strict constraints on compute, power, and memory. In practical UAV platforms, perception must run continuously alongside navigation, communication, and safety logic on embedded processors. These constraints motivate lightweight detectors that remain robust to heterogeneous backgrounds (desert textures, urban clutter, and industrial structures) while meeting real-time latency requirements for operational decision support. Several limitations persist in current UAV-based pipeline monitoring research. First, many studies emphasize either large-scale satellite mapping or specialized gas-sensing modalities, rather than RGB-based visual anomaly detection suitable for routine patrol operations. Second, reported models often prioritize detection accuracy without demonstrating embedded inference performance on realistic edge hardware. Third, joint detection of both pipeline assets and visually observable anomaly/leak indicators under heterogeneous environmental backgrounds remains insufficiently explored.
To address these gaps, this study proposes a lightweight, edge-deployable UAV inspection framework based on YOLOv26n for simultaneous detection of above-ground pipelines and visually observable anomaly/leak indicators in RGB imagery. Importantly, the contribution of this paper is systems-oriented rather than architectural: the official Ultralytics YOLOv26n implementation is used without modifying the backbone, neck, detection head, or loss formulation. The contributions are therefore threefold. First, we curate and document a UAV dataset of 6127 images acquired across desert, semi-urban, and industrial scenes for two-class detection (Pipeline and Anomaly/Leak). Second, we provide deployment-oriented benchmarking of a lightweight detector under consistent training, export, and embedded-inference workflow. Third, we analyze practical failure modes and discuss how edge perception can support autonomous re-inspection, GIS reporting, and maintenance prioritization in field operations. Recent pipeline monitoring research spans regional mapping, right-of-way safety, and leak detection. Satellite-based deep learning can identify pipeline pathways from medium-resolution imagery for large-area screening [4] and has also been used to map other types of critical linear infrastructure in high-resolution satellite scenes [5,6]. For UAV-based safety monitoring, deep networks have been applied to detect hazardous ground objects around pipelines to mitigate third-party damage [7]. Beyond RGB imagery, drone-based mission concepts for leak surveys and operational constraints have been discussed [8], and methane-sensing UAV studies demonstrate how specialized sensors can support gas leak detection [9]. These lines of work motivate automated, high-frequency corridor monitoring but also highlight the need for robust perception under diverse backgrounds and operating conditions.
From a perception perspective, object detection localizes and classifies targets (e.g., pipelines or anomalies) using bounding boxes. Two-stage detectors typically provide strong accuracy but can be computationally heavy for onboard deployment, whereas one-stage detectors in the YOLO family prioritize real-time performance [10,11]. In the pipeline domain, deep learning has also been used for defect identification from non-visual inspection data such as magnetic flux leakage signals, combining YOLO-based detection with transformer models for improved classification [12]. More recently, autonomous aerial detection and tracking have been demonstrated using YOLOv26 integrated with UAV control algorithms [13]. Despite rapid progress, many published pipelines for UAV inspection either focus on specialized sensing for gas detection or emphasize algorithmic accuracy without reporting embedded throughput and deployment considerations. Recent detector families relevant to lightweight benchmarking include YOLOv5, YOLOv8, YOLOv10, YOLO11, and RT-DETR [14,15,16,17,18,19]. In parallel, broader UAV inspection reviews in power systems and civil infrastructure emphasize that sensing modality, platform autonomy, and deployment constraints must be considered jointly when translating perception algorithms into operational inspection systems [20]. Embedded platforms such as NVIDIA Jetson modules enable onboard inference [21], and inference optimizers such as NVIDIA TensorRT can further improve speed and energy efficiency [22]. Motivated by these gaps, we evaluate a YOLOv26n-based detector for joint pipeline and anomaly/leak detection and report both accuracy and edge inference performance.
By jointly addressing detection accuracy, computational efficiency, and deployment realism, this work advances UAV-based infrastructure inspection from laboratory evaluation toward scalable real-world application. The remainder of this paper is structured as follows: Section 2 describes the dataset and methodology; Section 3 presents quantitative and qualitative results; Section 4 discusses operational implications and limitations; and Section 5 concludes the paper.
2. Materials and Methods
2.1. UAV Data Acquisition
UAV imagery was collected along above-ground pipeline corridors in three representative environment types—desert, semi-urban, and industrial—to capture variations in background texture, pipeline materials, and clutter. The UAV-mounted RGB camera (commercial off-the-shelf platform; manufacturer details not disclosed due to confidentiality restrictions) acquired nadir and near-nadir views during multiple sorties to include diverse illumination and operational conditions. Frames with severe motion blur or obvious acquisition artifacts were excluded during curation. The resulting imagery reflects common visual scenarios encountered in routine pipeline corridor inspections.
To promote generalization, imagery was curated to span diverse backgrounds and operational contexts, including wide corridor views and more cluttered scenes near industrial facilities. Near-nadir perspectives were retained because practical flights may be constrained by obstacles and no-fly buffers, and oblique viewpoints can introduce strong appearance changes. Because pipeline corridors are safety-critical infrastructure, the manuscript focuses on the visual and methodological aspects of data collection rather than disclosing sensitive geospatial identifiers; however, the released experimental protocol is sufficient to reproduce the training and evaluation pipeline.
2.2. Dataset Annotation and Splits
Pipeline annotations were drawn to cover the visible pipe segment within each frame; when a pipeline extended beyond the image boundary, bounding boxes were applied only to the observable portion. The Anomaly/Leak class represents visually observable indicators consistent with potential abnormal conditions in RGB imagery, including localized staining or wet areas, pooling, discoloration, disturbed surrounding material, and unusual visual signatures near joints or valves. This coarse label is intended for screening from standard RGB images and does not replace specialized thermal or gas-sensing inspection. Dataset partitions were constructed manually to preserve representation from desert, semi-urban, and industrial scenes while reducing overlap between subsets. This curation step was intended to limit near-duplicate leakage and to ensure that reported performance reflects generalization to unseen backgrounds rather than memorization of neighboring frames. A formal statistical variance or distribution-divergence analysis across the splits was not performed in the original study; we now state this explicitly as a limitation.
Each image was annotated with axis-aligned bounding boxes for two classes: Pipeline and Anomaly/Leak. Annotations were produced and managed using Roboflow’s dataset tooling [23] (Roboflow Inc., USA). After initial labeling, the dataset underwent manual quality control to remove obvious outliers (e.g., severely blurred frames and major acquisition artifacts) and to correct clearly inconsistent boxes during visual review. The final curated dataset contains 6127 labeled images and was split into training (5361 images), validation (511 images), and testing (255 images) subsets, corresponding to 87.5%, 8.3%, and 4.2% of the dataset, respectively as shown in Table 1. Preprocessing and augmentation were applied prior to training. Auto-orientation was enabled and images were resized by stretching to a fixed 600 × 600 resolution to match the detector’s input size; annotations were adjusted accordingly [24]. Contrast stretching was used to reduce illumination variability. Data augmentation was applied to the training split only, including random cropping (0–20% zoom), random grayscale conversion (0–15%), and hue/saturation variation (−25 to +25), with three augmented copies generated per training image to improve generalization [25]. The dataset was exported in YOLO format and used directly with the Ultralytics training pipeline [26].
Table 1.
Dataset summary and preprocessing settings.
2.3. Model Architecture
The detector is based on the official Ultralytics YOLOv26n [27,28] (Ultralytics LLC, United States) architecture, where “n” denotes the nano variant optimized for lightweight and embedded deployment. YOLOv26n is used in this study as an application-ready baseline rather than as a novel architecture introduced by the authors. The model follows a one-stage detection design with a convolutional backbone for multi-scale feature extraction, a feature-aggregation neck, and a decoupled detection head for bounding-box regression and classification.
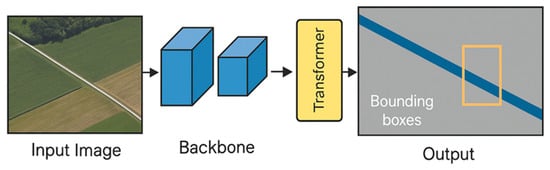
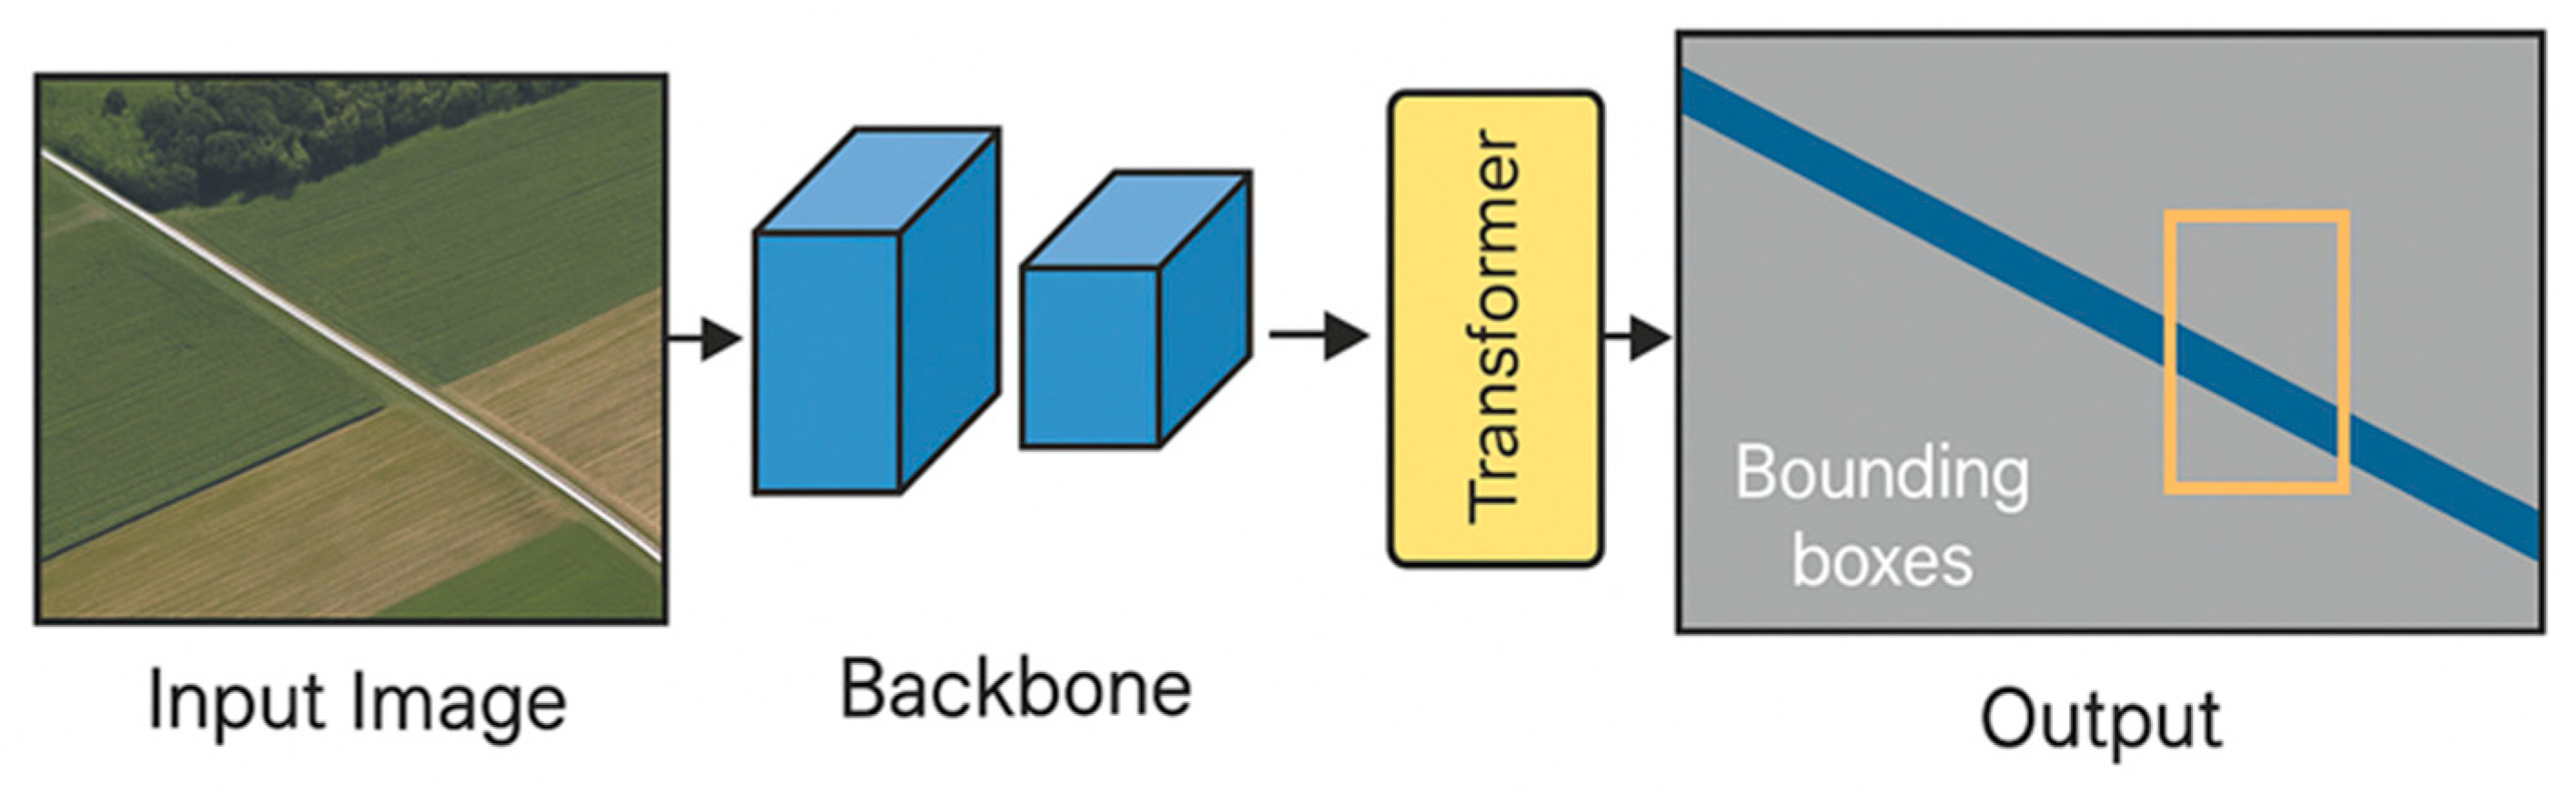
The YOLOv26n model contains approximately 3.2 million parameters and requires approximately 8.7 GFLOPs at an input resolution of 600 × 600 pixels, making it suitable for real-time edge inference. The lightweight design prioritizes computational efficiency while maintaining competitive detection accuracy. Figure 1 provides a simplified schematic of the official detection pipeline used in this study and highlights why multi-scale representations are useful for disambiguating pipelines from visually similar linear structures such as roads, fences, and elongated shadows.
Figure 1.
Simplified schematic of the official Ultralytics YOLOv26n detection pipeline used in this study.
2.4. Training Configuration
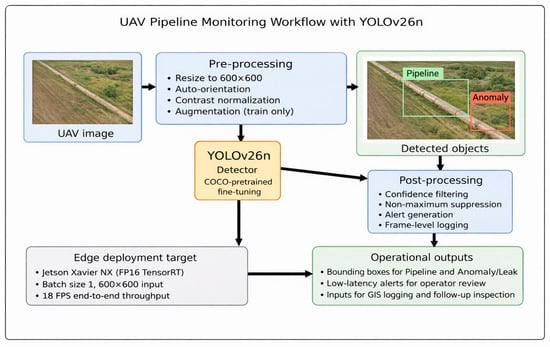
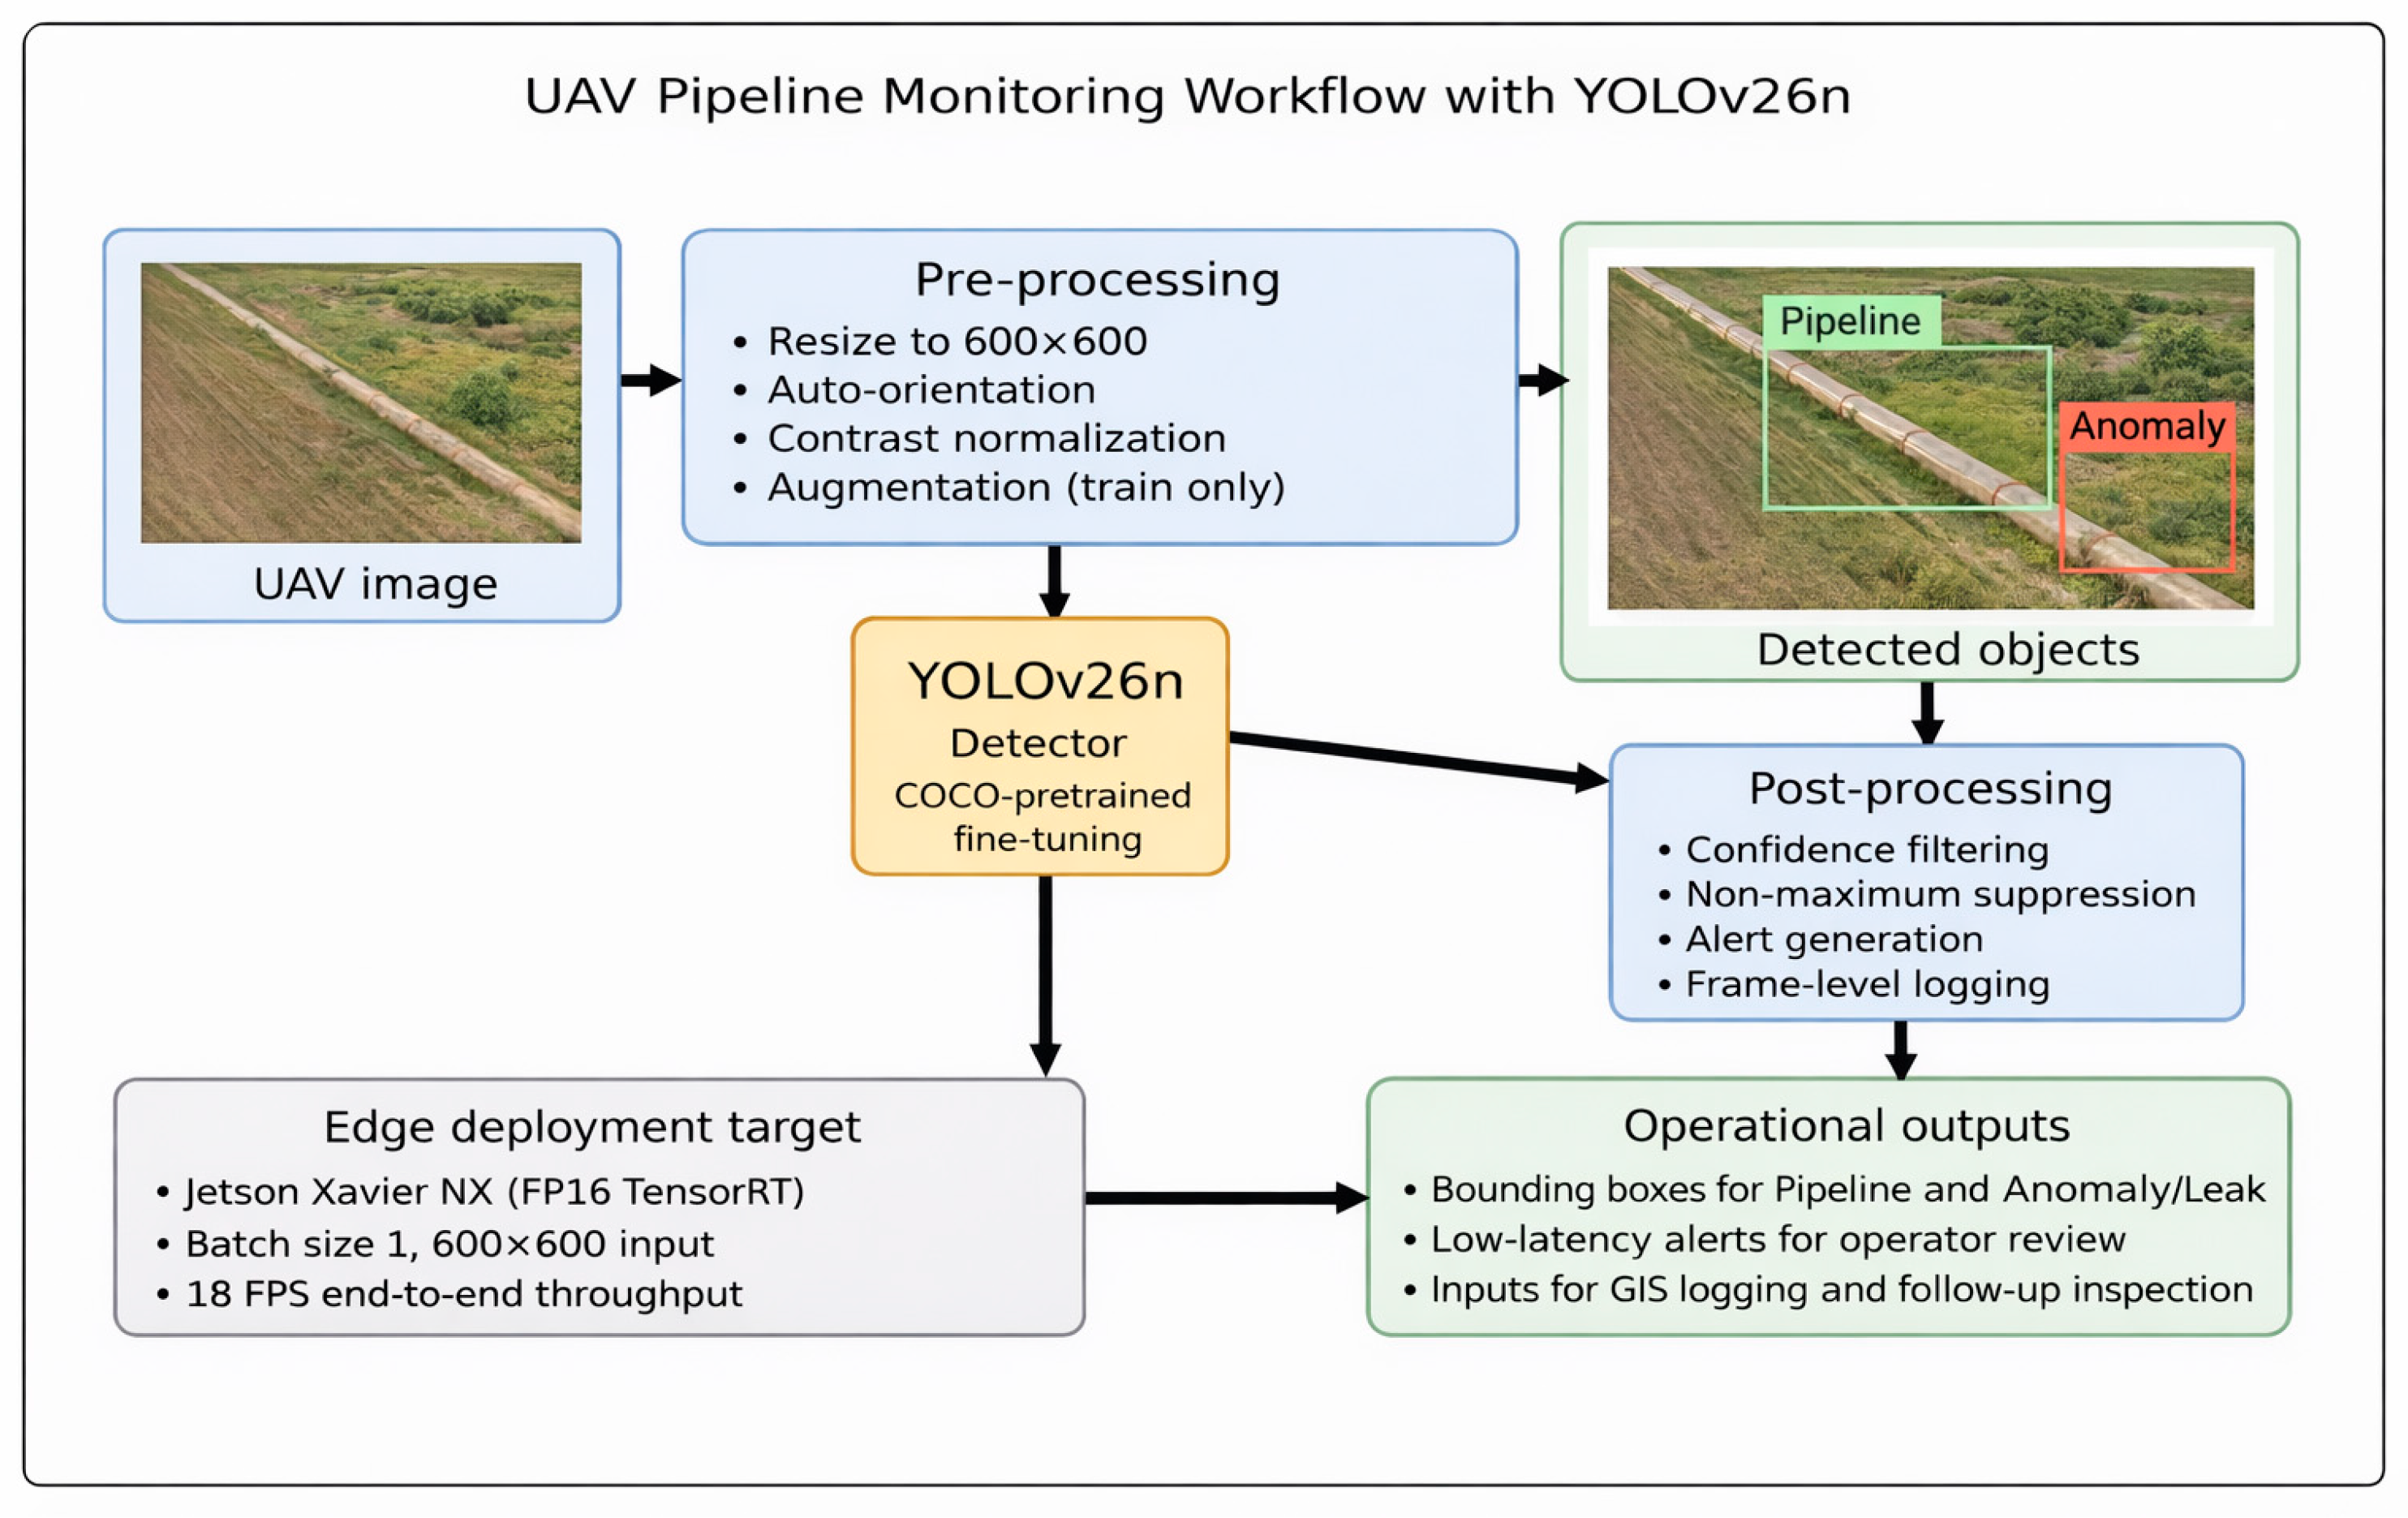
Transfer learning from COCO-pretrained weights [29] was used to accelerate convergence. The YOLOv26n model was trained for 300 epochs with an input size of 600 × 600 pixels. Training was performed on a single NVIDIA RTX 4090 GPU (NVIDIA Corporation, Santa Clara, CA, USA) (24 GB VRAM) using the Ultralytics framework. The model was optimized using AdamW with an initial learning rate of 0.001, weight decay of 0.01, batch size of 16, cosine learning rate decay, and 3 warmup epochs. Default Ultralytics augmentation settings were enabled, including mosaic augmentation, horizontal flipping, scaling, and color jittering. The best-performing checkpoint was selected based on validation mAP@0.5:0.95 to mitigate overfitting. Training and validation losses were monitored throughout the training process to ensure stable convergence. The detection head outputs two classes (Pipeline and Anomaly/Leak) as shown in Figure 2, and non-maximum suppression is applied at inference to remove duplicate detections.
Figure 2.
High-resolution end-to-end UAV pipeline monitoring workflow using YOLOv26n (pre-processing, detection, and post-processing).
Unless otherwise stated, evaluation and deployment used the same 600 × 600 input resolution with a batch size of 1 at inference. Detections were filtered using a confidence threshold and non-maximum suppression (NMS) to remove duplicates. For the precision and recall values reported in Section 4, the operating confidence threshold was selected on the validation set to provide a balanced trade-off between missed detections and false alarms, which is important for safety-critical inspection workflows. To support reproducibility, the key training and deployment settings are summarized in Table 2.
Table 2.
Summary of key training and deployment settings for reproducibility.
2.5. Edge Deployment in Jetson
For embedded evaluation, the trained YOLOv26n model was exported to ONNX format and optimized using NVIDIA TensorRT (NVIDIA Corporation, Santa Clara, CA, USA) for accelerated inference on an NVIDIA Jetson Xavier NX (16 GB) edge module [21]. Inference was performed using FP16 precision with a batch size of 1 and an input resolution of 600 × 600 pixels. The device was configured in maximum performance (15W) mode. The reported throughput of 18 frames per second (FPS) reflects end-to-end inference time, including preprocessing, model inference, and non-maximum suppression. Detailed runtime power draw and CPU/GPU utilization were not instrumented during the original experiment and are therefore not reported; this is an important target for future deployment studies.
2.6. Evaluation Metrics
Detection performance is evaluated using standard COCO-style metrics [30]. We report mean Average Precision (mAP) at an Intersection-over-Union (IoU) threshold of 0.5 (mAP@0.5) and the averaged mAP over IoU thresholds from 0.5 to 0.95 in steps of 0.05 (mAP@0.5:0.95). In addition, precision and recall are computed based on the standard confusion matrix formulation for object detection. As a complementary interpretability diagnostic, Section 4 also reports an image-level dominant-class confusion matrix obtained by reducing each test image to its highest-confidence retained detection after post-processing; this auxiliary view is intended to aid class-wise interpretation and does not replace box-level COCO metrics.
Average Precision (AP) is computed as the area under the precision–recall curve, and mAP is the mean AP across all classes. These metrics jointly summarize localization accuracy, classification quality, and the trade-off between missed detections and false alarms.
3. Results
3.1. Baselines and Experimental Protocol
To contextualize performance, we compared the proposed YOLOv26n detector against three lightweight YOLO-family baselines commonly used as practical references in aerial inspection: YOLOv5, YOLOv8, and YOLOv10. These models were chosen to span several recent generations of one-stage detectors within a comparable Ultralytics-centered training and export ecosystem, providing a controlled comparison of accuracy-speed trade-offs under the same dataset split and deployment workflow. This benchmark should therefore be interpreted as a generational baseline rather than an exhaustive comparison with all contemporary detector families such as YOLOv9, YOLO11, or RT-DETR [14,15,16,17,18,19]. All models were fine-tuned on the same training split and evaluated on the same held-out test set using transfer learning and the metrics described in Section 2.6.
3.2. Quantitative Results
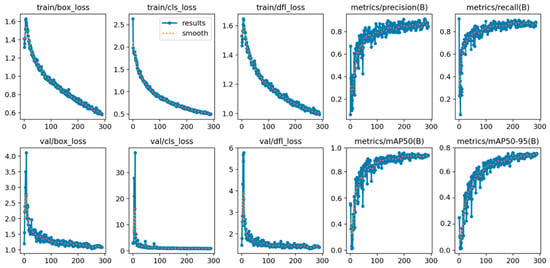
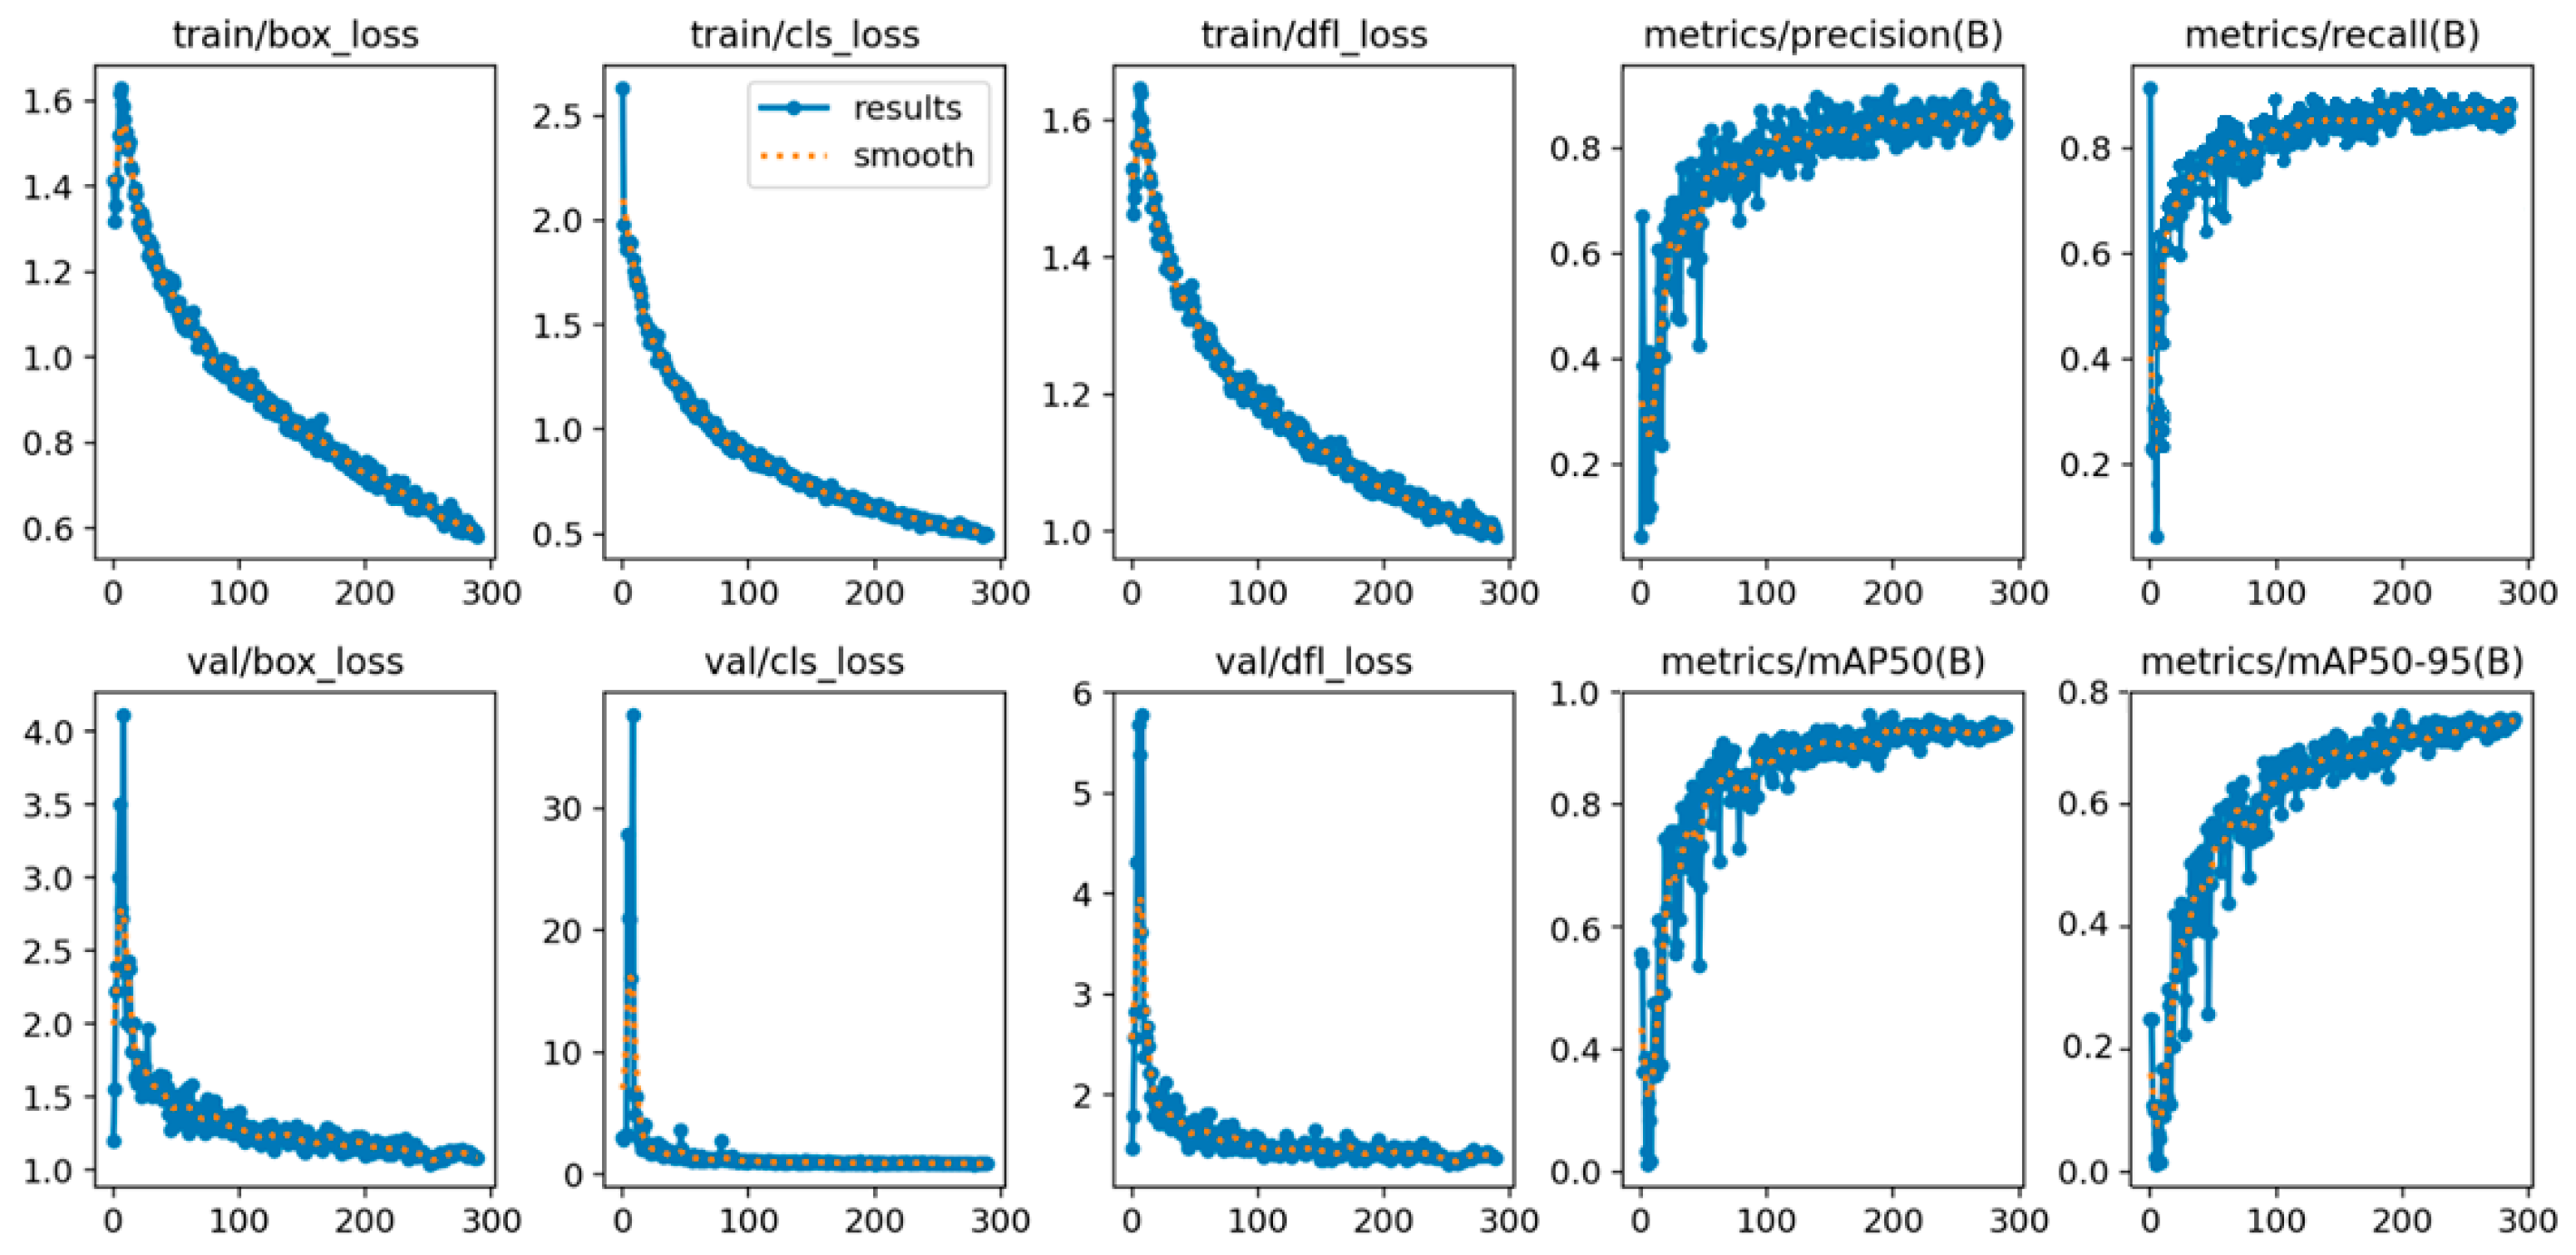
Table 3 summarizes the quantitative box-level results. On the held-out test set (255 images), the proposed YOLOv26n model achieved 92.4% mAP@0.5 and 75.0% mAP@0.5:0.95, with 89.7% precision, 90.2% recall, and 89.9% F1-score at the selected operating threshold. Compared with the reported baselines, YOLOv26n improved mAP@0.5 by 5.1 percentage points over YOLOv10 and by 7.9 percentage points over YOLOv5. The embedded benchmark further indicates that the model can operate in real time (18 FPS) on Jetson Xavier NX hardware. Figure 3 shows the training and validation losses together with the evolution of detection metrics across epochs, illustrating stable convergence and consistent improvement during training.
Table 3.
Quantitative box-level performance comparison on the held-out UAV test set (255 images).
Figure 3.
Training/validation losses and box-level detection metrics across epochs for YOLOv26n.
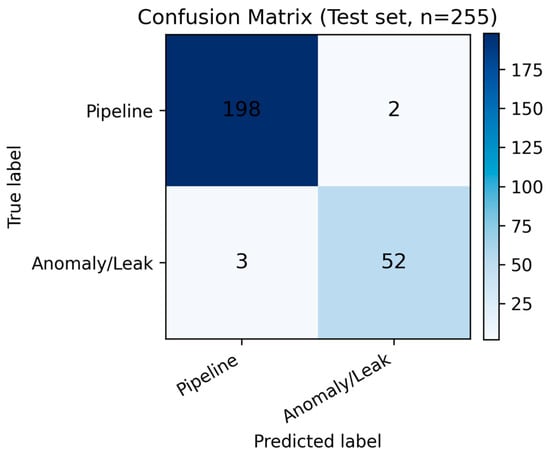
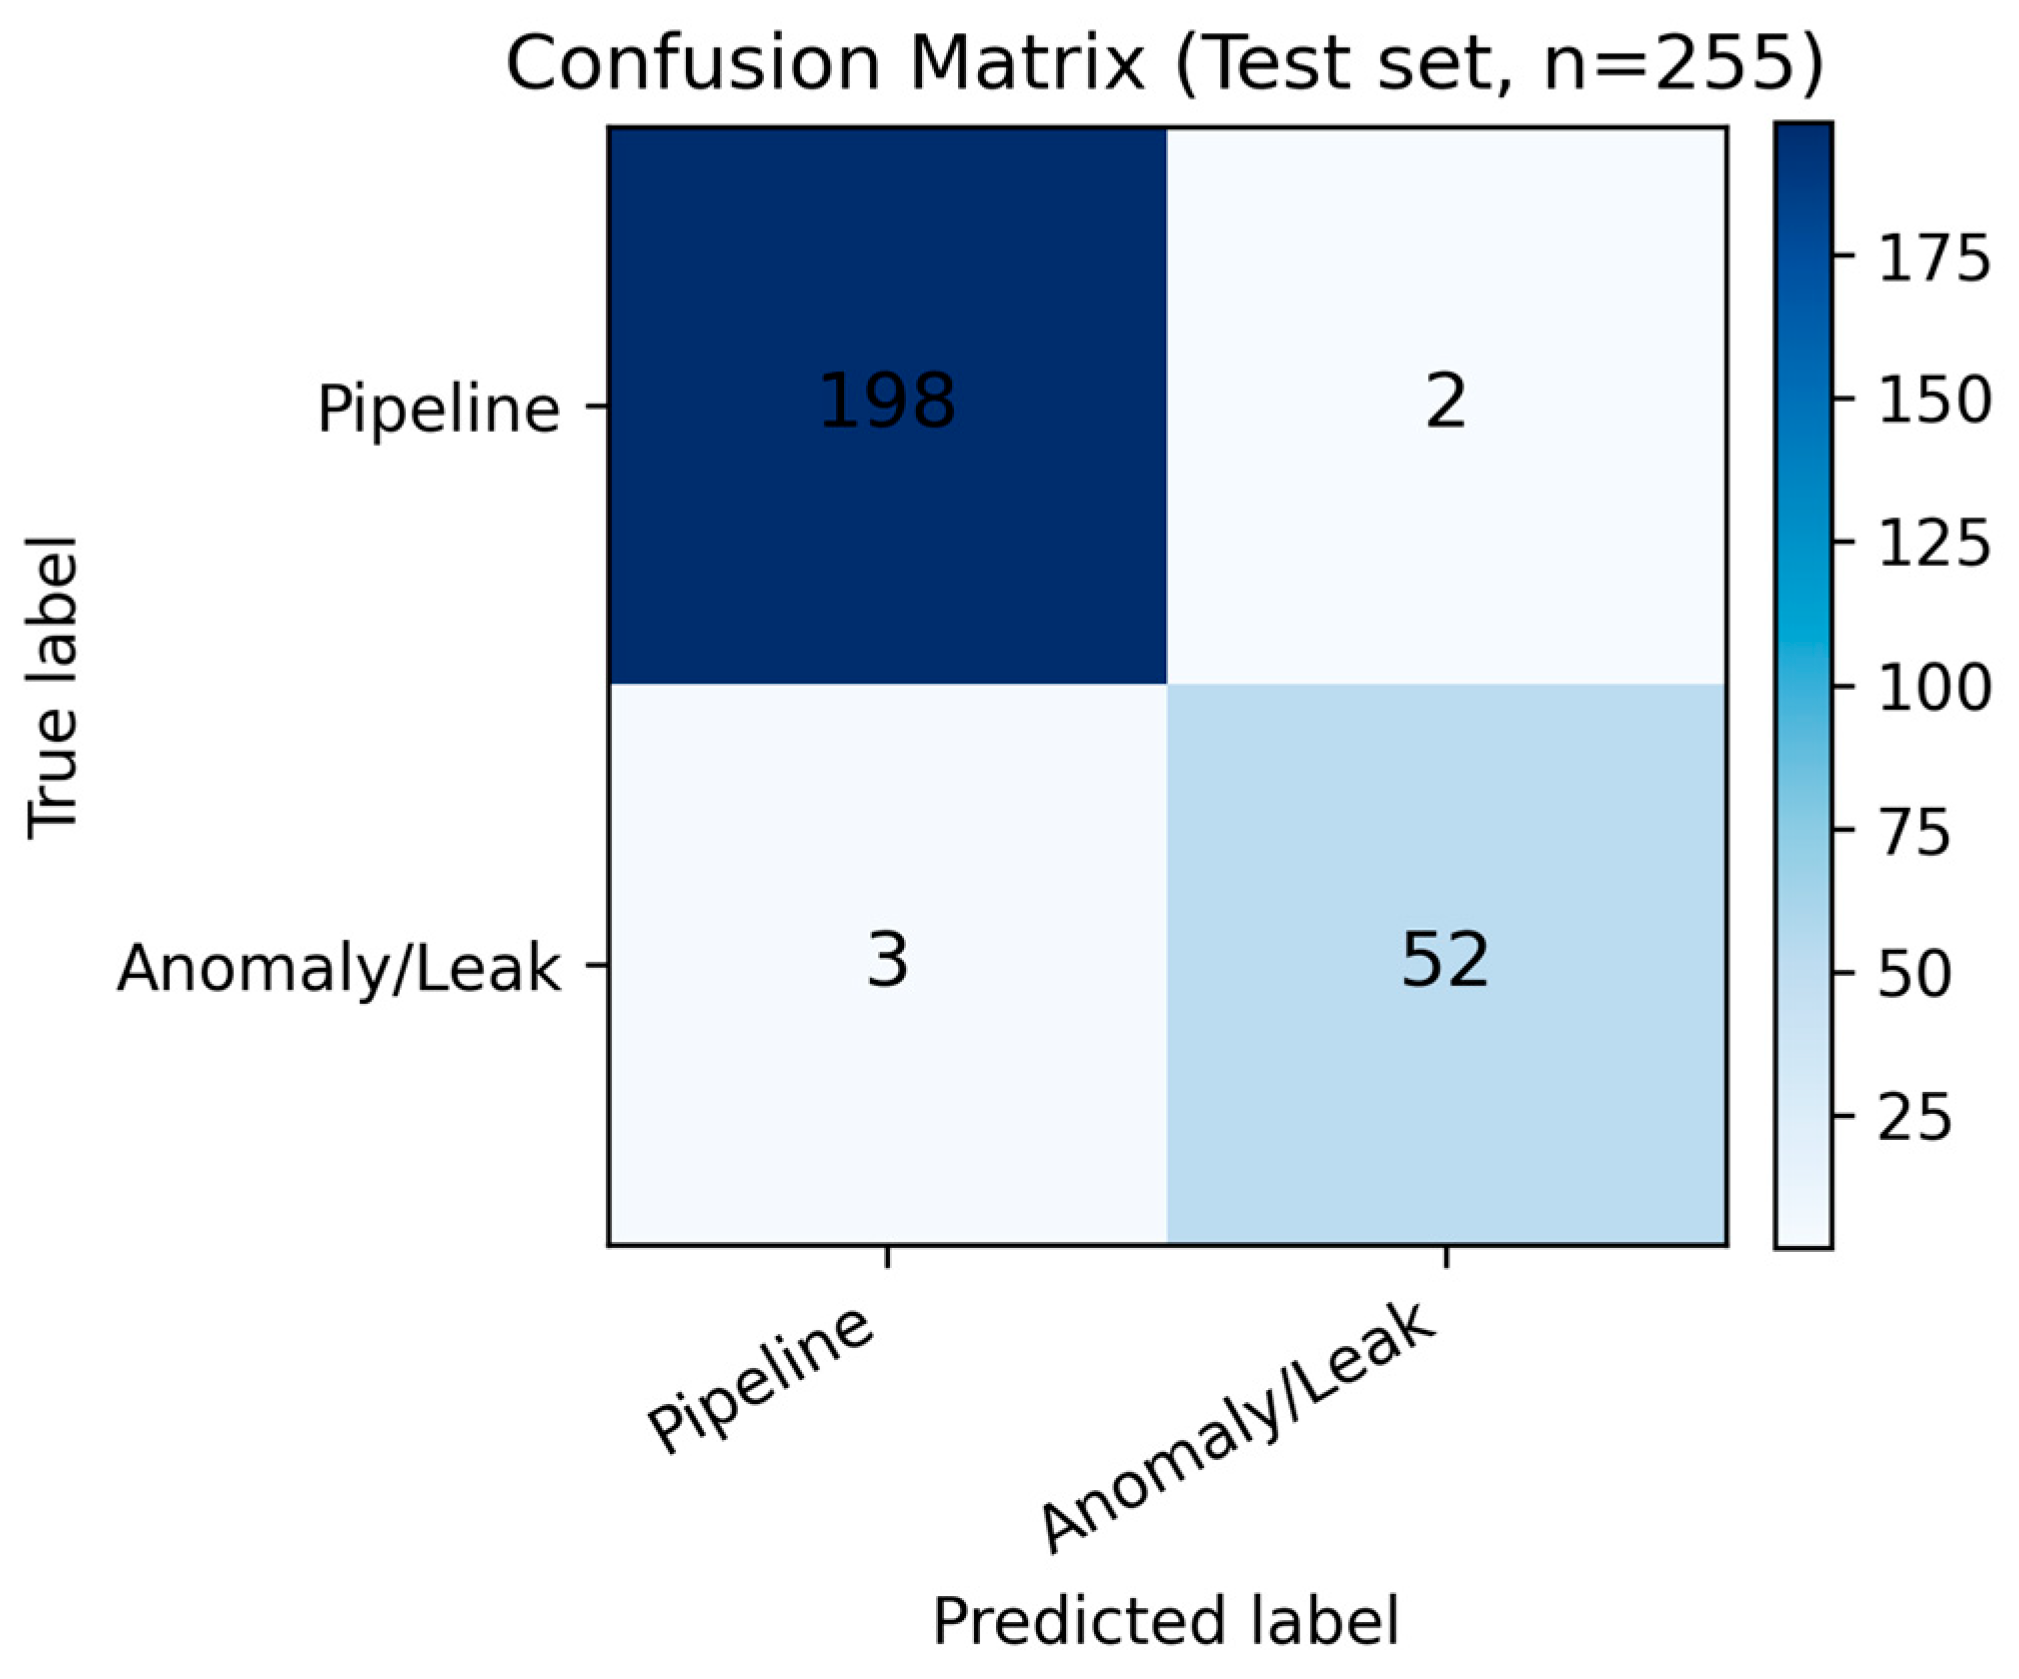
As a complementary image-level diagnostic, Figure 4 presents a dominant-class confusion matrix on the held-out split, obtained after reducing each image to its highest-confidence retained detection. The matrix indicates that anomaly/leak-dominant scenes remain more difficult than pipeline-dominant scenes (52/55 versus 198/200 correct assignments), which is consistent with the smaller size and greater heterogeneity of anomaly cues.
Figure 4.
Image-level dominant-class confusion matrix on the held-out test split (n = 255).
As shown in Table 4, detection performance differs between classes. The Pipeline class achieves higher AP due to its larger spatial extent, consistent linear structure, and stronger visual contrast in many scenes. In contrast, the Anomaly/Leak class exhibits lower AP, reflecting its smaller size, higher intra-class variability, and dependence on subtle visual cues such as discoloration or localized material disturbance. This class imbalance and variability are consistent with the confusion matrix analysis, where anomaly-dominant scenes show slightly lower classification reliability. Overall, the results indicate that YOLOv26n provides a favorable accuracy–speed trade-off for UAV corridor inspection. Performance is strongest in high-contrast scenes and can degrade in cluttered environments or under low illumination.
Table 4.
Per-class detection performance.
3.3. Qualitative Results and Error Analysis
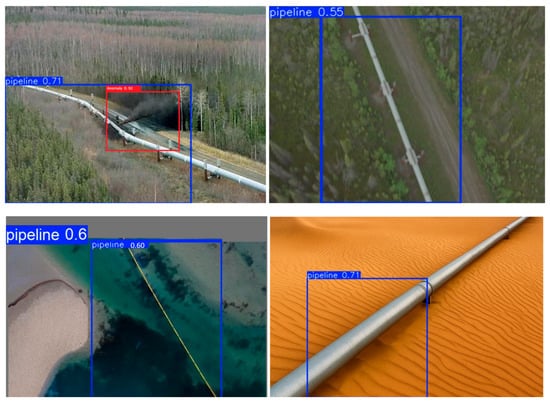
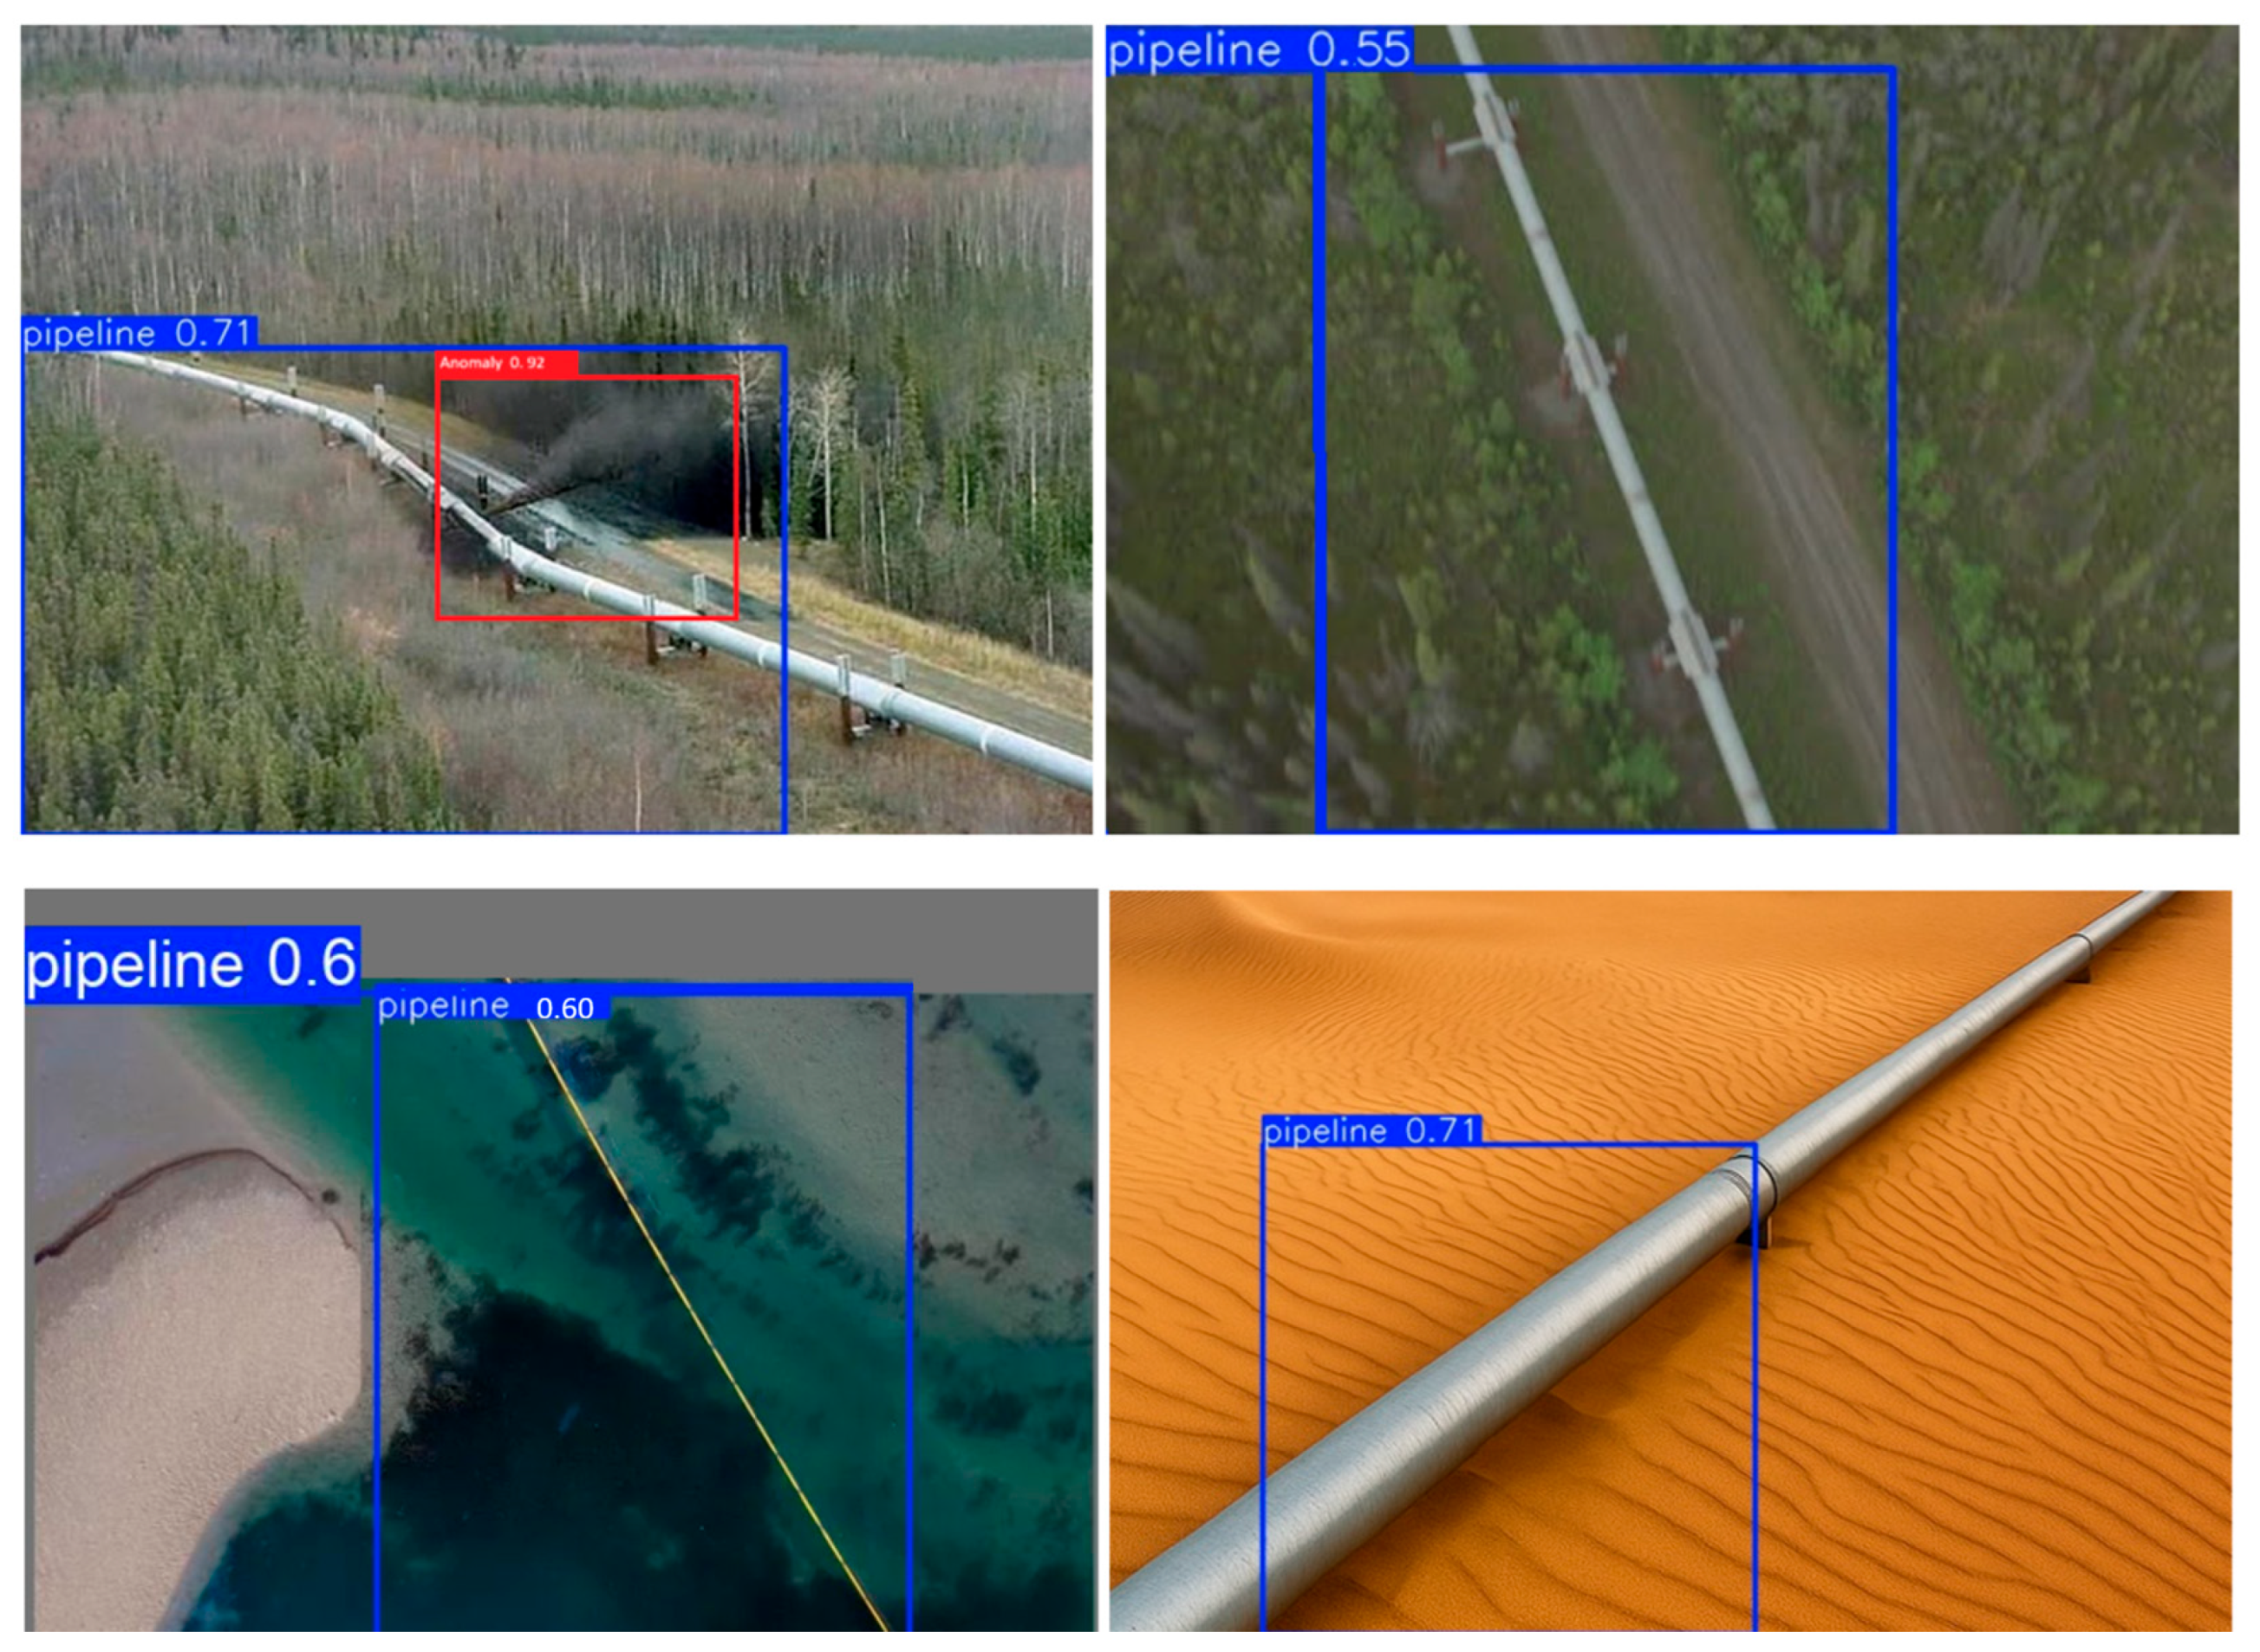
Representative detections across diverse scenes are provided in Figure 5. Most false positives are associated with visually similar linear structures (e.g., roads, field boundaries, and elongated shadows), while false negatives tend to occur under heavy occlusion, low contrast, motion blur, high-altitude wide-area views, or extreme viewing angles. Examples of the Anomaly/Leak label include localized dark wet areas, staining, disturbed soil, and abnormal material accumulation near the pipeline corridor. These observations motivate additional training data from challenging conditions and the use of context-aware post-processing.
Figure 5.
Representative qualitative detections of pipelines and visually observable anomaly/leak cues across diverse scenes.
4. Discussion
This work evaluates a complete UAV-to-edge pipeline monitoring workflow, and the results highlight the practical trade-off between detection accuracy, robustness, and embedded runtime. The proposed YOLOv26n detector achieves strong performance on heterogeneous UAV imagery while sustaining real-time inference on a Jetson Xavier NX, suggesting that onboard perception for corridor inspection is feasible without cloud connectivity. This system-level perspective is consistent with recent UAV inspection reviews, which emphasize that sensing modality, autonomy, and embedded computation must be considered jointly rather than isolated algorithmic components [1,2,3,20]. Beyond headline accuracy, the qualitative analysis provides insight into when and why the model fails and what mitigation strategies are realistic in an operational inspection setting.
4.1. Accuracy and Efficiency for Onboard Inspection
For UAV inspection missions, latency is not only a computational metric but also an operational constraint: detections must be produced fast enough to support timely decisions during flight. In this study, the optimized YOLOv26n model sustains 18 FPS on a Jetson Xavier NX, corresponding to an end-to-end per-frame latency of approximately 56 ms (including preprocessing and non-maximum suppression). This throughput is compatible with typical UAV video rates and supports near-real-time alerting while the UAV is still over the inspected segment. Compared with heavier alternatives and newer real-time detector families, lightweight YOLO-based models remain attractive for embedded deployment because they offer a practical balance between accuracy, implementation maturity, and latency on constrained hardware [14,15,16,17,18,19,21,22]. The present results therefore support YOLOv26n as a viable operating point within this broader family of lightweight detectors rather than as a claim of universal superiority over all current methods [14,15,16,17,18,19].
The reported precision and recall values also underline an important design consideration for safety-critical monitoring: missing a true anomaly can be more costly than flagging a small number of false alarms. Accordingly, the confidence threshold should be chosen based on the intended operating scenario (e.g., routine screening vs. emergency response), and the validation set should be used to select a balanced operating point that preserves high recall while keeping the false-alarm rate manageable for human review. Similar deployment-oriented screening logic has been emphasized in UAV safety-monitoring studies and broader application reviews, where rapid triage and operator verification are preferred to slow fully manual review workflows [7,20]. In practice, operators may run the detector in a high-recall mode during the flight and apply stricter filtering offline when generating maintenance work orders.
4.2. Robustness Across Environments and Dominant Failure Modes
Although overall accuracy is strong, error patterns reveal the conditions that remain challenging. Most false positives originate from visually similar elongated structures, including road edges, fences, pipelines of different types, shadows, and field boundaries. These confusions are expected for appearance-based detectors because pipelines are primarily defined by long linear geometry and material reflectance, which can be mimicked by many corridor-adjacent objects. False negatives are more common under low contrast, partial occlusion, heavy clutter in industrial scenes, and extreme viewing angles, where both pipeline boundaries and subtle anomaly cues become difficult to distinguish from background texture. Comparable challenges are repeatedly noted in UAV object-detection surveys and practical leak-detection studies, especially when RGB imagery is used without complementary sensing modalities [1,2,3,8,9,20].
Several practical mitigation strategies follow from this analysis. First, the detector output can be constrained by geospatial priors when available (e.g., known right-of-way polygons or centerlines), suppressing detections far from the expected corridor. Second, temporal consistency across video frames can reduce isolated false alarms by requiring that an anomaly persists for multiple consecutive frames or that detections exhibit smooth motion consistent with UAV ego-motion. Third, lightweight tracking or tubelet formation can improve stability and provide confidence over time, which is often more informative for operators than single-frame detections. These mitigation directions are aligned with recent work on autonomous aerial detection and with broader reviews of closed-loop UAV inspection workflows [13,20].
4.3. Deployment Considerations and Reproducibility
A recurring gap in the UAV inspection literature is that models are frequently evaluated only on desktop GPUs, without reporting the engineering steps and embedded performance required for deployment [1,2,3,20]. By reporting an ONNX-to-TensorRT workflow and profiling results on a Jetson platform, this work provides deployment-oriented evidence that complements the detection metrics [21,22]. In operational settings, edge inference offers additional benefits: reduced dependency on communication links, lower latency for decision making, and improved data governance for critical infrastructure imagery. At the same time, deployment requires attention to numerical precision, memory use, and consistent preprocessing between training and inference. To improve transparency, the key settings for training and deployment are consolidated in Table 2, and the evaluation protocol follows standard COCO-style metrics.
It is also important to recognize that open science requirements must sometimes be balanced with infrastructure security. As broader UAV inspection reviews note, real-world deployment often requires reconciling reproducibility goals with restrictions on platform details, sensor metadata, and geospatially sensitive assets [20]. While the full-resolution imagery and exact corridor locations may not be publicly distributable, the methodology, model configuration, and evaluation procedure can still be shared in sufficient detail for independent reproduction on comparable datasets. Where possible, releasing a de-identified subset of imagery or synthetic surrogates can further strengthen reproducibility without disclosing sensitive geospatial information.
4.4. Practical Applications for UAV Pipeline Monitoring
The proposed detector can support several operational use cases. During routine patrols, onboard detection can highlight segments that merit closer inspection, enabling operators to prioritize time in areas with higher risk signatures and reducing the burden of reviewing large volumes of imagery. For incident response, near-real-time detection can guide the UAV to hover over suspicious regions to capture additional viewpoints, improving the quality of evidence delivered to maintenance teams. At the fleet level, detections can be aggregated and visualized in GIS dashboards to generate inspection reports, track recurring hotspots, and support risk-based maintenance planning. These use cases are consistent with prior UAV safety-monitoring studies and application reviews that frame perception as part of a larger inspection-and-response pipeline rather than as an isolated vision task [7,13,20].
Integration with autonomy is a natural extension. When the detector flags a potential anomaly, the UAV can switch to a verification mode, for example by executing a short loiter pattern, reducing speed, or collecting higher-resolution imagery from multiple viewing angles. Such closed-loop perception-and-action is consistent with the broader trend toward autonomous aerial inspection, where perception outputs become direct inputs to decision-making and navigation modules [13,20].
4.5. Limitations and Future Research Directions
Several limitations should be considered when interpreting the results. First, the anomaly class aggregates multiple visual phenomena into a single screening label, which is appropriate for rapid flagging but insufficient for downstream maintenance decisions that require defect typing and severity estimation; finer-grained defect categorization has been explored in other inspection contexts using richer sensing or more specialized labels [12]. Second, RGB imagery may fail to reveal leaks that are not visually salient, particularly under low illumination or when the leak manifests primarily as gas rather than liquid, which is why drone-based methane and multimodal leak-detection studies remain highly relevant complements to RGB-only inspection as reported in [8,9]. Third, performance can degrade under domain shifts such as new pipeline materials, seasonal changes, unseen background textures, adverse weather, or changes in flight altitude and motion blur. Fourth, the empirical comparison in this study is limited to three representative YOLO-family baselines, so the manuscript should not be interpreted as claiming superiority over all contemporary lightweight detectors, including newer YOLO variants and transformer-based real-time alternatives [14,15,16,17,18,19]. In addition, the archived experimental outputs do not include runtime power logs or CPU/GPU utilization traces, and the split was curated manually without a formal divergence analysis; these factors should be considered when interpreting the engineering generality of the reported results.
Future work will therefore focus on expanding the anomaly taxonomy, incorporating temporal reasoning over video (tracking, temporal ensembling, or sequence models), and exploring multimodal sensing such as thermal cameras or methane sensors to improve sensitivity to non-visual leaks [8,9]. Additional benchmarking against YOLOv9, YOLO11n, and RT-DETR would strengthen the accuracy-efficiency comparison, while broader class-wise evaluation across alternative detectors, power/use profiling, and sensitivity analyses over thresholds and input resolution would improve deployment rigor [14,15,16,17,18,19]. Because the current study uses the official detector configuration without architectural modification, ablation studies on internal modules were not applicable; future work should instead focus on application-relevant ablations such as export precision, post-processing thresholds, and video-level smoothing, which are more consistent with deployment-oriented UAV inspection research [13,20].
5. Conclusions
This study presented a real-time, edge-deployable UAV inspection framework for above-ground oil pipeline and anomaly detection using the official YOLOv26n object detector. Leveraging a curated dataset of 6127 annotated UAV images collected across diverse environmental settings, the model achieved 92.4% mAP@0.5 and 75.0% mAP@0.5:0.95 on a held-out test set while sustaining 18 FPS on an NVIDIA Jetson Xavier NX edge device. These results demonstrate that lightweight one-stage detectors can meet both accuracy and real-time constraints required for operational UAV corridor monitoring. The contribution of the paper is systems-oriented rather than architectural: it provides a domain-specific dataset, a reproducible training-to-deployment workflow, and an analysis of practical failure modes relevant to UAV inspection. Future work will focus on broader model benchmarking, finer-grained anomaly labels, temporal reasoning, multimodal sensing, and richer deployment profiling for safety-critical field use.
Author Contributions
H.K.: Conceptualization, Funding acquisition, Methodology, Project administration, Software, Validation, Visualization, Formal analysis, Writing—original draft, Writing—review & editing. A.A.: Project administration, Investigation, Data curation, Formal analysis, Writing—review & editing, Visualization, Formal analysis. All authors have read and agreed to the published version of the manuscript.
Funding
This research was supported by institutional funding from King Fahd University of Petroleum & Minerals and the Interdisciplinary Research Center for Aviation & Space Exploration (IRC-ASE). No external grant number is associated with this funding.
Data Availability Statement
Because the dataset contains imagery of critical infrastructure, raw images and precise geospatial metadata are not publicly released. The experimental protocol and training/deployment settings are documented in the manuscript. Additional implementation details and de-identified examples may be made available by the corresponding author upon reasonable request and subject to institutional approval.
Acknowledgments
King Fahd University of Petroleum and Minerals.
Conflicts of Interest
The authors declare no conflicts of interest.
References
- Osco, L.P.; Marcato Junior, J.; Ramos, A.P.M.; Jorge, L.A.C.; Fatholahi, S.N.; Silva, J.A.; Matsubara, E.T.; Pistori, H.; Gonçalves, W.N.; Li, J. A review on deep learning in UAV remote sensing. Int. J. Appl. Earth Obs. Geoinf. 2021, 102, 102456. [Google Scholar] [CrossRef] [Scilit]
- Tang, G.; Ni, J.; Zhao, Y.; Gu, Y.; Cao, W. A Survey of Object Detection for UAVs Based on Deep Learning. Remote Sens. 2024, 16, 149. [Google Scholar] [CrossRef] [Scilit]
- Wu, X.; Li, W.; Hong, D.; Tao, R.; Du, Q. Deep Learning for Unmanned Aerial Vehicle-Based Object Detection and Tracking: A Survey. IEEE Geosci. Remote Sens. Mag. 2022, 10, 91–124. [Google Scholar] [CrossRef] [Scilit]
- Dasenbrock, J.; Pluta, A.; Zech, M.; Medjroubi, W. Detecting Pipeline Pathways in Landsat 5 Satellite Images with Deep Learning. Energies 2021, 14, 5642. [Google Scholar] [CrossRef] [Scilit]
- Ye, M.; Ward, P.J.; De Plaen, J.J.-F.G.; Koks, E.E. A deep learning pipeline to power infrastructure detection in high-resolution satellite images. Big Earth Data 2025, 9, 525–546. [Google Scholar] [CrossRef] [Scilit]
- Yan, Y.; Liang, Y.; Zhang, H.; Zhang, W.; Feng, H.; Wang, B.; Liao, Q. A two-stage optimization method for unmanned aerial vehicle inspection of an oil and gas pipeline network. Pet. Sci. 2019, 16, 458–468. [Google Scholar] [CrossRef] [Scilit]
- Meng, L.; Peng, Z.; Zhou, J.; Zhang, J.; Lu, Z.; Baumann, A.; Du, Y. Real-Time Detection of Ground Objects Based on Unmanned Aerial Vehicle Remote Sensing with Deep Learning: Application in Excavator Detection for Pipeline Safety. Remote Sens. 2020, 12, 182. [Google Scholar] [CrossRef] [Scilit]
- Bretschneider, L.; Bollmann, S.; Houssin-Agbomson, D.; Shaw, J.; Howes, N.; Nguyen, L.; Robinson, R.; Helmore, J.; Lichtenstern, M.; Nwaboh, J.; et al. Concepts for drone based pipeline leak detection. Front. Robot. AI 2024, 11, 1426206. [Google Scholar] [CrossRef] [Scilit] [PubMed]
- Iwaszenko, S.; Kalisz, P.; Slota, M.; Rudzki, A. Detection of Natural Gas Leakages Using a Laser-Based Methane Sensor and UAV. Remote Sens. 2021, 13, 510. [Google Scholar] [CrossRef] [Scilit]
- Redmon, J.; Farhadi, A. YOLOv3: An Incremental Improvement. arXiv 2018, arXiv:1804.02767. [Google Scholar] [CrossRef] [Scilit]
- Chen, J.; Xu, H.; Wang, Z. Cascaded Deep Learning for Pipeline Defects Detection and Classification Based on YOLOv5 and Vision Transformer in MFL Data. Mech. Syst. Signal Process. 2024, 206, 110919. [Google Scholar] [CrossRef] [Scilit]
- NVIDIA. Jetson Xavier NX 16GB Datasheet. Available online: https://connecttech.com/pdf/jetson_xavier_nx_16gb_datasheet.pdf (accessed on 16 February 2026).
- Aromoye, O.A.; Sama, M.; Chisala, M.; Jani, S.; Tello, A. Autonomous Aerial Pipeline Detection and Tracking Using YOLOv8 and Control Algorithms. Alex. Eng. J. 2026, 137, 424–442. [Google Scholar] [CrossRef] [Scilit]
- Ultralytics. YOLOv5 Documentation. Available online: https://docs.ultralytics.com/models/yolov5/ (accessed on 23 March 2026).
- Wang, C.-Y.; Yeh, I.-H.; Liao, H.-Y.M. YOLOv9: Learning What You Want to Learn Using Programmable Gradient Information. In Computer Vision—ECCV 2024; Springer: Cham, Switzerland, 2024; pp. 1–21. [Google Scholar]
- Wang, A.; Chen, H.; Liu, L.; Chen, K.; Lin, Z.; Han, J.; Ding, G. YOLOv10: Real-Time End-to-End Object Detection. In Advances in Neural Information Processing Systems 37 (NeurIPS 2024); Curran Associates: Red Hook, NY, USA, 2024. [Google Scholar]
- Ultralytics. YOLO11 Documentation. Available online: https://docs.ultralytics.com/models/yolo11/ (accessed on 23 March 2026).
- Zhao, Y.; Lv, W.; Xu, S.; Wei, J.; Wang, G.; Dang, Q.; Liu, Y.; Chen, J. DETRs Beat YOLOs on Real-Time Object Detection. In Proceedings of the IEEE/CVF Conference on Computer Vision and Pattern Recognition (CVPR), Seattle, WA, USA, 17–21 June 2024; IEEE: New York, NY, USA; pp. 16965–16974.
- He, Y.; Liu, Z.; Guo, Y.; Zhu, Q.; Yu, F.; Yin, Y.; Wang, Y.; Zhang, B.; Liu, Z. UAV-Based Sensing and Imaging Technologies for Power System Detection, Monitoring, and Inspection: A Review. Nondestruct. Test. Eval. 2025, 40, 5681–5748. [Google Scholar] [CrossRef] [Scilit]
- Toriumi, F.Y.; Bittencourt, T.N.; Futai, M.M. UAV-Based Inspection of Bridge and Tunnel Structures: An Application Review. Rev. IBRACON Estrut. Mater. 2023, 16, e16103. [Google Scholar] [CrossRef] [Scilit]
- NVIDIA. NVIDIA TensorRT Documentation. Available online: https://docs.nvidia.com/deeplearning/tensorrt/latest/index.html (accessed on 16 February 2026).
- Roboflow. Roboflow Documentation. Available online: https://docs.roboflow.com (accessed on 16 February 2026).
- Roboflow. Preprocess Images—Roboflow Documentation. Available online: https://docs.roboflow.com/datasets/dataset-versions/image-preprocessing (accessed on 16 February 2026).
- Roboflow. Image Augmentation—Roboflow Documentation. Available online: https://docs.roboflow.com/datasets/dataset-versions/image-augmentation (accessed on 16 February 2026).
- Ultralytics. Roboflow Integration. Available online: https://docs.ultralytics.com/integrations/roboflow/ (accessed on 16 February 2026).
- Jocher, G.; Qiu, J. Ultralytics YOLOv26. Available online: https://github.com/ultralytics/ultralytics (accessed on 16 February 2026).
- Ultralytics. Explore Ultralytics YOLOv26. Available online: https://docs.ultralytics.com/models/yolo26/ (accessed on 16 February 2026).
- Lin, T.-Y.; Maire, M.; Belongie, S.; Hays, J.; Perona, P.; Ramanan, D.; Dollár, P.; Lawrence Zitnick, C. Microsoft COCO: Common Objects in Context. In Computer Vision—ECCV 2014; Springer: Cham, Switzerland, 2014; pp. 740–755. [Google Scholar] [CrossRef] [Scilit]
- Ultralytics. Model Export with Ultralytics YOLO. Available online: https://docs.ultralytics.com/modes/export/ (accessed on 16 February 2026).
- Jocher, G. YOLOv8 by Ultralytics. Available online: https://github.com/topics/yolov8 (accessed on 16 February 2026).

Disclaimer/Publisher’s Note: The statements, opinions and data contained in all publications are solely those of the individual author(s) and contributor(s) and not of MDPI and/or the editor(s). MDPI and/or the editor(s) disclaim responsibility for any injury to people or property resulting from any ideas, methods, instructions or products referred to in the content. |
© 2026 by the authors. Licensee MDPI, Basel, Switzerland. This article is an open access article distributed under the terms and conditions of the Creative Commons Attribution (CC BY) license.