


Highlights
What are the main findings?
- The UAV recognition confidence provides a credibility-based metric for UAV recognition under severe bird interference.
- Multi-frame cumulative UAV recognition confidence significantly improves recognition reliability compared with single-frame decisions or conventional rules.
What are the implications of the main findings?
- UAV recognition systems should adopt credibility-based evaluation metrics rather than relying solely on UAV recognition performance.
- Multi-frame recognition strategies are frequently mandatory to ensure reliable UAV identification in bird-dense environments.
Abstract
Radar plays a pivotal role throughout the entire Counter-Unmanned Aerial Vehicle (C-UAV) process, and there is an urgent need for radar technologies capable of effectively detecting and recognizing non-cooperative Unmanned Aerial Vehicles (UAVs). However, the commonly emphasized UAV True Positive Ratio (TPR) fails to adequately reflect radar performance in environments with high bird density. Frequent bird activity leads to numerous false UAV alarms and unreliable recognition results. To address this issue, this paper introduces the concept of UAV Recognition Confidence (URC), a comprehensive metric that quantifies the credibility of UAV recognition by jointly considering recognition performance indicators and environmental factors. Simulations and field measurements employ a bird random walk model and real-time trajectory statistics to represent the dynamic population variations of birds. Both simulation and X-band radar experimental results verify that the proposed URC framework can effectively characterize the recognition capability of radar systems by capturing the complex interactions between the UAV and surrounding avian activities.
1. Introduction
Traditional air defense radar systems, which are primarily designed for detecting large, high-velocity, and high-Radar Cross- Section (RCS) targets, are generally ineffective at detecting low-altitude, small, and slow (LSS) Unmanned Aerial Vehicles (UAVs) [1]. This limitation has driven increased research into the development of specialized Counter-UAV (C-UAV) radar technologies.
Despite the widespread adoption of C-UAV radar systems, their claimed recognition and classification capabilities often fail to meet expectations in operational conditions [2]. A case in point is the ongoing conflict in Ukraine, where approximately 80% of battlefield casualties are attributed to UAVs [3]. This concerning statistic underscores the substantial gap between the advanced UAV recognition capabilities that C-UAV radars claim to possess and their actual performance in dynamic, cluttered environments. This discrepancy suggests that existing performance evaluation metrics for C-UAV radar systems may not sufficiently capture the complexities of real-world operational environments.
In the engineering field, UAV recognition performance is commonly assessed based on the UAV True Positive Ratio (TPR), and the M-out-of-N () rule [4] is used for system evaluation. The TPR is defined as: TPR , where U represents the UAV, y denotes the recognition output, and x denotes the true class label. The TPR can be considered a statistical value derived from multiple experiments. The implementation of the rule assumes frame independence, meaning that the occurrence probability of the recognition sequence follows a binomial distribution. If at least m UAV recognitions occur within n detections, the target is considered as the UAV. Under conventional controlled evaluation settings, the target set A exclusively includes the cooperative UAV, i.e., . Therefore, the experimental evaluation protocol inherently relies on two idealized conditions. First, the prior probability of UAV occurrence is treated as unity, i.e., . Second, any target classified as a UAV must be the cooperative UAV, implying that the conditional probability satisfies . These assumptions collectively suggest that all UAV recognition results are perfectly reliable, which overlooks the significant presence of non-cooperative targets in complex environments. More importantly, the occurrence of the UAV is a low-probability event, while other airborne objects are more likely to be misidentified.
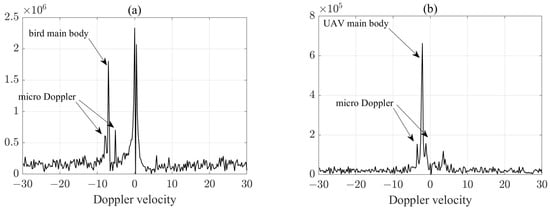
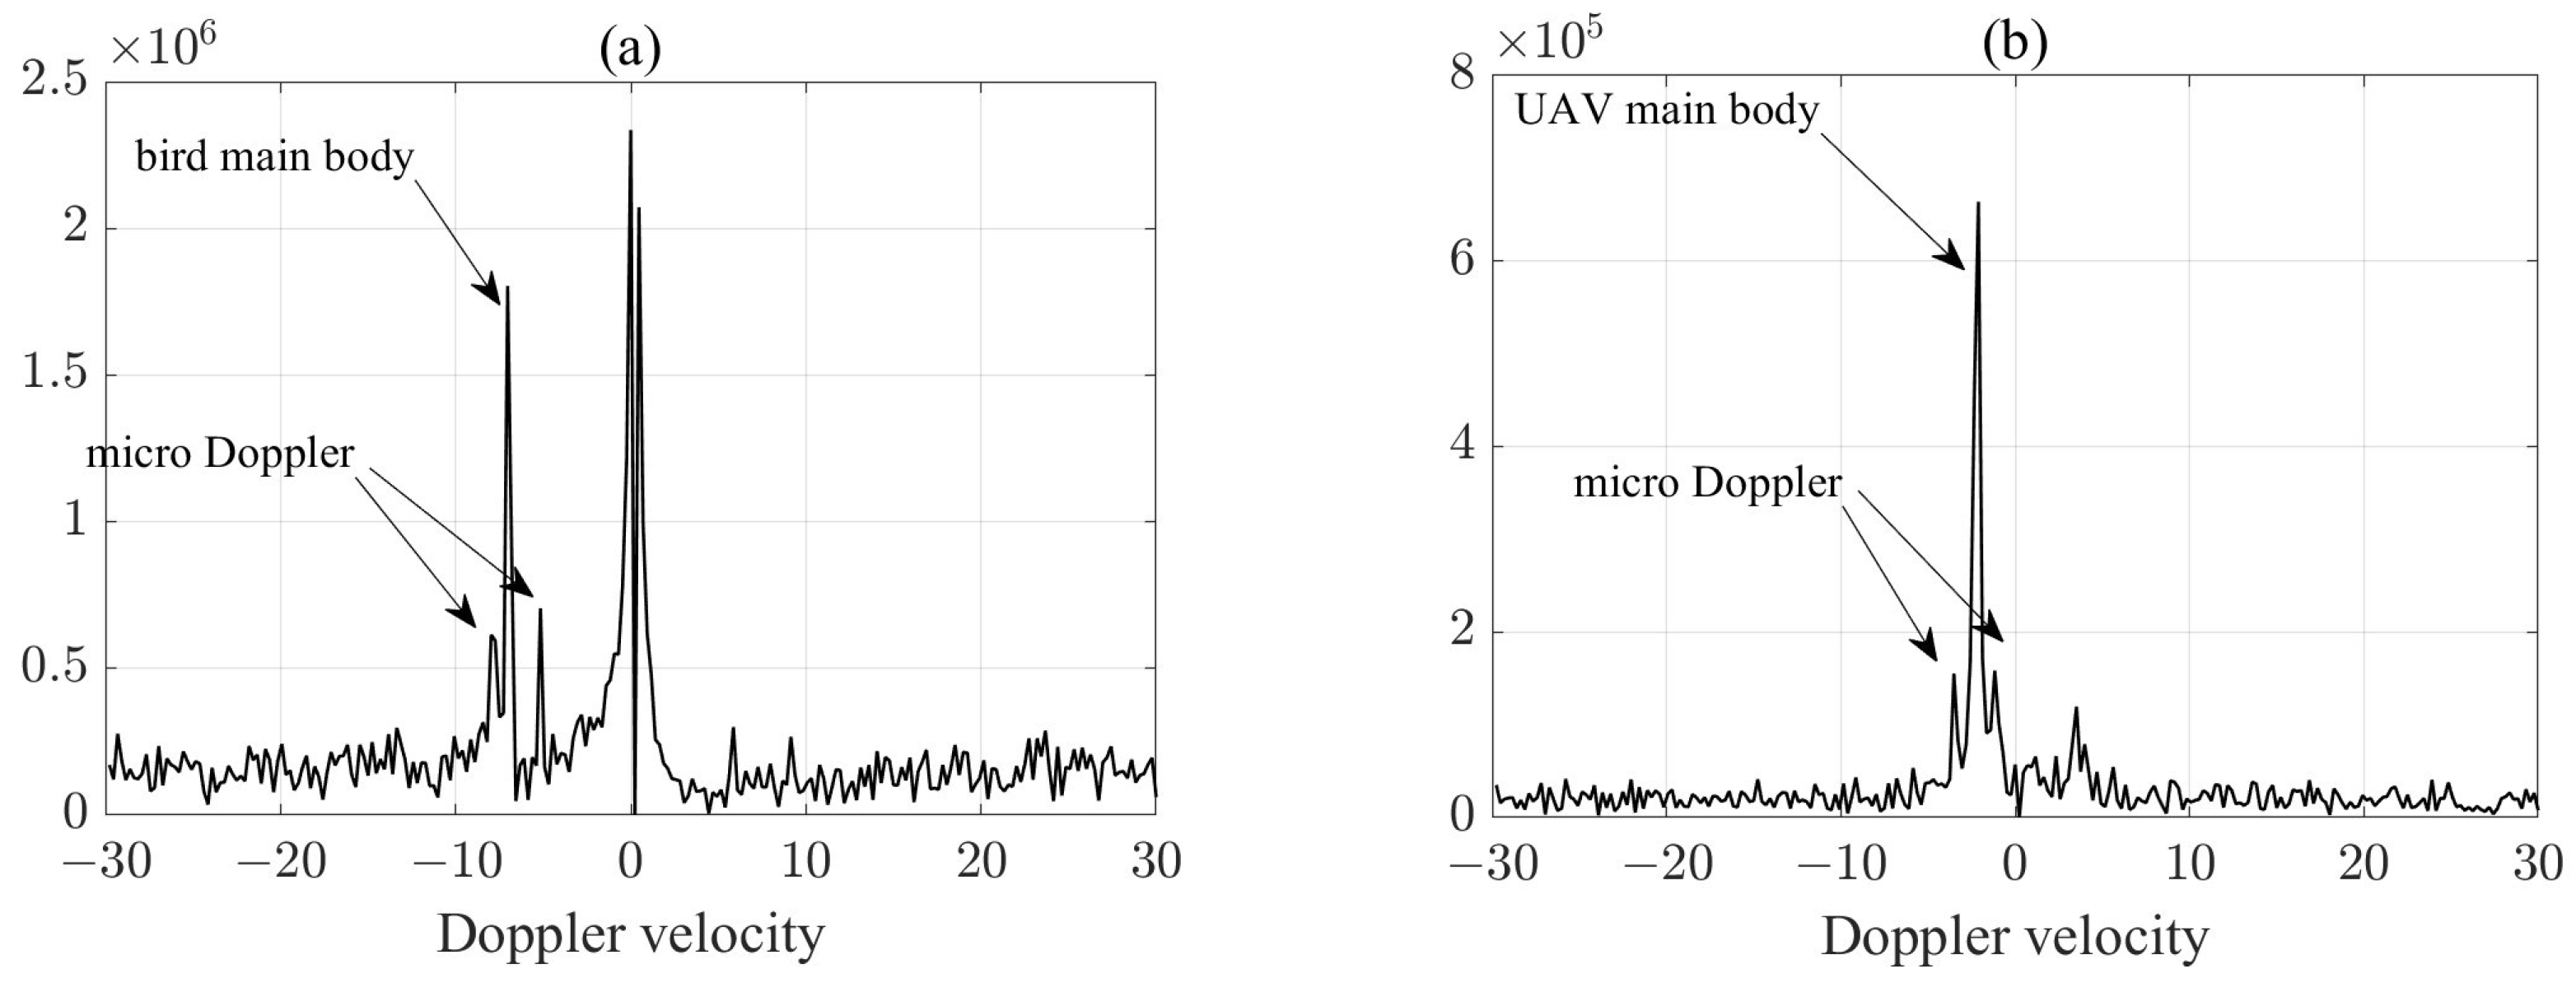
One of the most frequently misidentified targets is the bird. An illustrative example is shown in Figure 1. Figure 1a,b present representative spectra of a bird and a typical UAV. It can be observed that both are low-velocity objects (speeds below 10 m/s) and exhibit pronounced micro-Doppler (mD) signatures. Furthermore, the RCS of birds and UAVs overlap significantly, which further reduces their discrimination capability [5]. In a publicly available LSS presentation [6] released by SAAB for the Giraffe ELSS radar system, birds appear in large numbers within a short time interval, making bird occurrences a high-frequency event. Moreover, spatio-temporal (ST) characteristics and trajectory patterns exhibit inherent limitations in discriminating between birds and UAVs. Consequently, birds constitute the dominant source of interference in UAV recognition [7], both due to their high occurrence rate [8] and the intrinsic difficulty in distinguishing them from UAVs by traditional UAV recognition methods. In addition, some secondary interference sources, such as clutter and insect swarms, may also introduce false recognition under specific conditions. However, after discrimination using fundamental UAV features, their impact is comparatively less significant in typical operational conditions.
Figure 1.
(a) Frequency spectrum of a bird (example). (b) Frequency spectrum of a fixed-wing drone (example). Measurement conditions are detailed in [9].
A comprehensive evaluation should assess not only the correct identification of UAVs but also the suppression of bird-induced false recognitions. A confusion matrix provides a more informative description of recognition performance by jointly considering the TPR for UAVs and the false positive rate (FPR) for non-UAV targets, and it has been widely used in bird–UAV classification studies [10,11,12,13,14]. These works generally aim to maximize TPR while minimizing FPR. However, a static confusion matrix characterizes only the conditional discrimination capability of the classifier. It is typically derived from balanced test sets, whereas actual radar environments are highly imbalanced with target numbers varying over time. Such imbalance not only creates asymmetric operational importance between UAV TPR and FPR but also prevents a single static confusion matrix from accurately reflecting the absolute false-alarm burden and the reliability of recognition results in dynamic radar conditions.
The rule and the static confusion matrix both overlook the inequality between the UAV and interference sources. Consequently, they are insufficient to reflect the credibility of recognition results under realistic deployment conditions. Motivated by this limitation, this work formulates the following scientific hypothesis:
- In non-cooperative radar scenarios, the credibility of a recognition result should fundamentally be modeled as a posterior probabilistic measure jointly determined by the classifier’s TPR, FPR, and the actual prior occurrence probabilities of different target classes.
Under this hypothesis, we construct the UAV Recognition Confidence (URC) metric. Through a Bayesian formulation that integrates recognition performance parameters (TPR and FPR) with target occurrence statistics, URC transforms static performance indicators into a posterior credibility measure aligned with realistic operational deployment conditions.
The main contributions of this paper are summarized as follows:
- The paper proposes the URC metric to quantitatively evaluate the recognition performance of C-UAV radar systems;
- A time-varying Markov modeling approach is developed to extend the instantaneous URC to the cumulative URC;
- Simulations and measurements demonstrate that the URC framework provides a reliable and practically meaningful measure for assessing UAV recognition performance.
Since the TPR and FPR are statistics derived from the recognition algorithm and operating conditions, representative values reported in previous studies are referred [10,11,12,13,14]. The analysis assumes and . The surveillance scenario assumes that one UAV appears within the radar coverage while multiple birds are present. Based on statistical observations over several square kilometers [8], fewer than 97 birds are typically observed within each 6-min window. Therefore, the bird-to-UAV ratio is analyzed within , and a representative median value is adopted in the observation window.
The threshold for (cumulative) URC is set to 0.9—meaning that a (cumulative) URC exceeding 0.9 is deemed a reliable UAV recognition. This choice is motivated by two considerations. First, posterior probabilities above 0.9 are widely regarded as strong evidence in Bayesian inference [15]. Second, practically, the threshold balances decision speed and reliability: too high a value would delay decisions, while too low a value would increase false alarms. Thus, 0.9 offers a reasonable compromise and is adopted as the representative threshold in this study. It should be noted that this threshold is not fixed and can be adjusted according to specific operational requirements.
All simulations are implemented in MATLAB R2021a, and the above parameters are used unless otherwise specified.
2. Problem Formulation and Metric Definition
2.1. Preliminary Assumptions for URC Evaluation
For a radar processing chain, the overall workflow follows a sequential procedure of detection → recognition. The proposed URC-based credibility assessment is performed after the recognition stage. Specifically, the statistical parameters TPR and FPR are treated as prior statistical information in the URC credibility evaluation framework. During real-time operation, when the recognition result is classified as UAV, the URC evaluation is triggered. The credibility value is then computed using the prior statistical parameters TPR, FPR, and the environmental prior ratio . Therefore, the URC analysis is conducted under the following general assumptions regarding the C-UAV radar processing chain:
- Detection-stage preprocessing: Clutter suppression has already been performed through appropriate signal processing techniques such as optimal filter design and adaptive filtering [16]. A UAV-oriented Signal-to-Noise Ratio (SNR) or Constant False-Alarm Rate (CFAR) detector following the Neyman–Pearson criterion is employed for preliminary target screening, ensuring that only a small fraction of noise and residual clutter components pass the detection threshold.
- Recognition-stage feature matching: Conventional UAV recognition features are utilized, including ST characteristics, motion information, trajectory continuity, mD signatures, and RCS characteristics. These features ensure effective discrimination between UAV targets and the majority of non-cooperative objects, residual clutter, and noise.
2.2. URC Formulation and Parameter Sensitivity Analysis
(a) Problem Simplification: UAV versus Bird Discrimination
Feature-based criteria are always defined for the targets of interest. Each detected target is evaluated against these criteria to produce a similarity score, which is compared with a predefined threshold to determine its class label. Targets exceeding the threshold are classified as the target of interest; otherwise, they are treated as unknown targets. Accordingly, the primary performance measures in C-UAV missions are the UAV TPR and FPR. While non-cooperative targets and a limited amount of noise/clutter may pass the initial detection stage and proceed to recognition, their low feature similarity to UAV templates makes them not a primary concern for false UAV declarations. Birds, however, present non-negligible misrecognition events due to the high degree of feature overlap with UAV templates and large quantities. Therefore, for URC analysis, the recognition problem approximately reduces to a two-class discrimination between UAVs and birds:
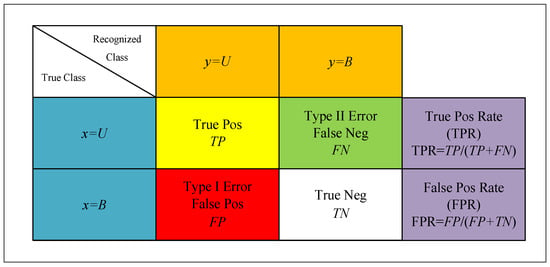
The confusion matrix is illustrated in Figure 2, where B represents the bird. The rows represent the true class x and columns represent the recognized class y.
Figure 2.
Confusion matrix for UAVs and birds.
(b) Basic recognition probabilities
Based on the confusion matrix, the UAV TPR is defined as
The UAV FPR is defined as
(c) Alarm trigger probability
Let , , , and the overall UAV decision probability, also referred to as the alarm trigger probability (ATP), is given by
ATP is a function of TPR, FPR, and . The sensitivities of the with respect to TPR and FPR (i.e., the partial derivative of ATP with respect to TPR and FPR) [17] are, respectively,
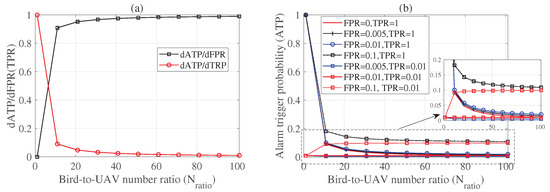
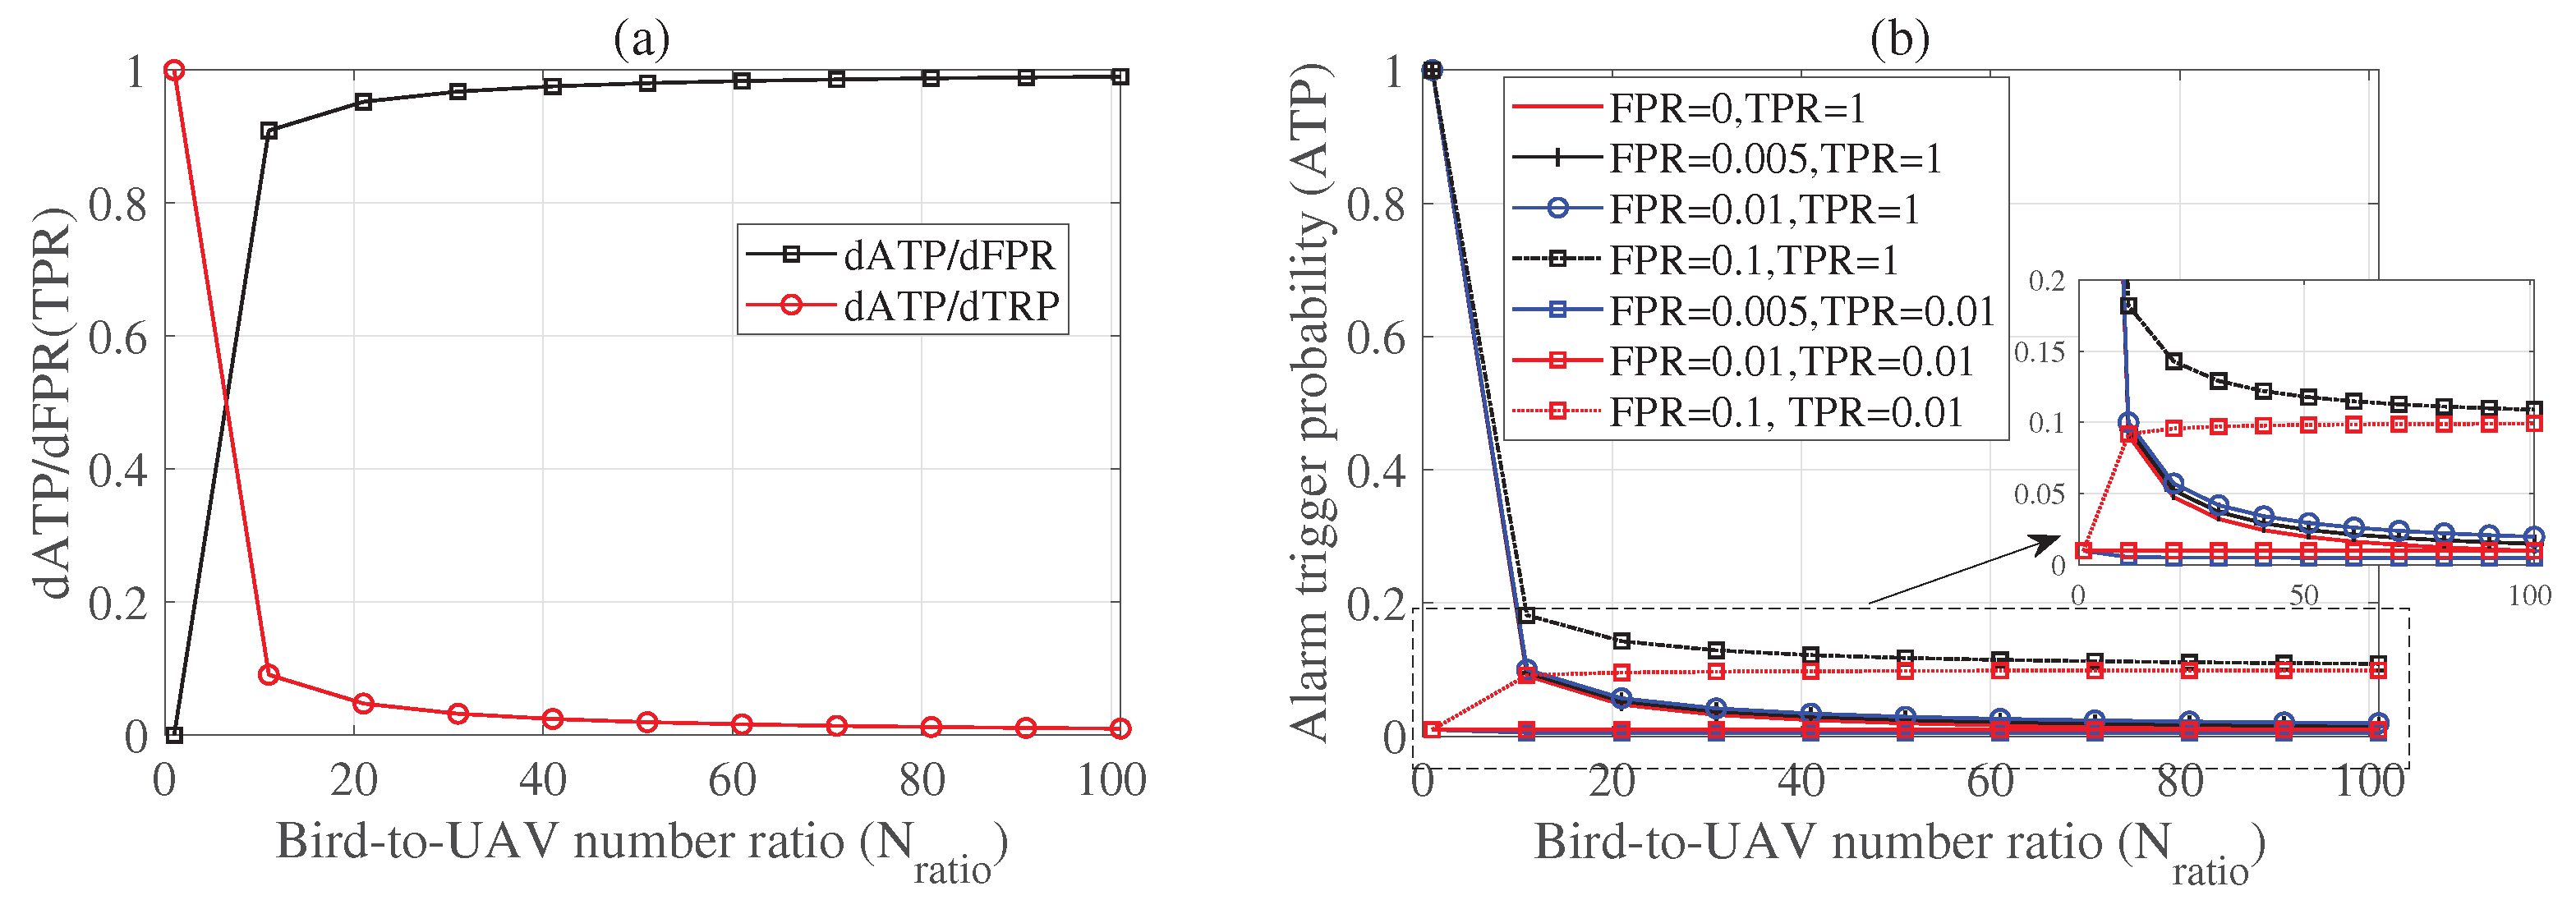
As illustrated in Figure 3a, as the bird occurrence ratio increases, the sensitivity of ATP with respect to FPR rapidly rises and asymptotically approaches unity. Conversely, the sensitivity of ATP to TPR is inversely proportional to the UAV occurrence probability and gradually approaches zero. This indicates that, in bird-dense environments, FPR becomes the dominant factor affecting UAV recognition decisions. This tendency is further confirmed in Figure 3b. For any given UAV TPR, the ATP converges to the FPR as the number of birds increases, demonstrating that false alarms dominate the alarm statistics in high bird-density scenarios. Let N denote the number of birds detected within a observation window. The expected number of false UAV alarms is expressed as
which implies that even a small FPR may lead to a large number of false UAV alarms when the bird population is large. Without adequate control of FPR, birds may lead to persistent all-weather UAV alarm triggering.
Figure 3.
(a) The sensitivity of ATP with respect to TPR (red circle) and FPR (black square) with different bird-to-UAV number ratio (). (b) The ATP with under different TPR and FPR.
(d) UAV Recognition Confidence (URC)
URC can be interpreted as the posterior credibility of a UAV declaration derived from Bayes’theorem by incorporating classifier performance statistics and environmental target occurrence ratios as follows:
The sensitivity of the with respect to TPR is
Similarly, the sensitivities with respect to FPR and are given by
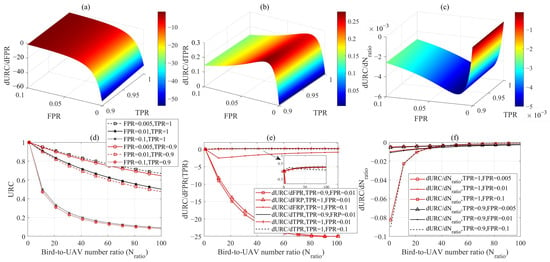
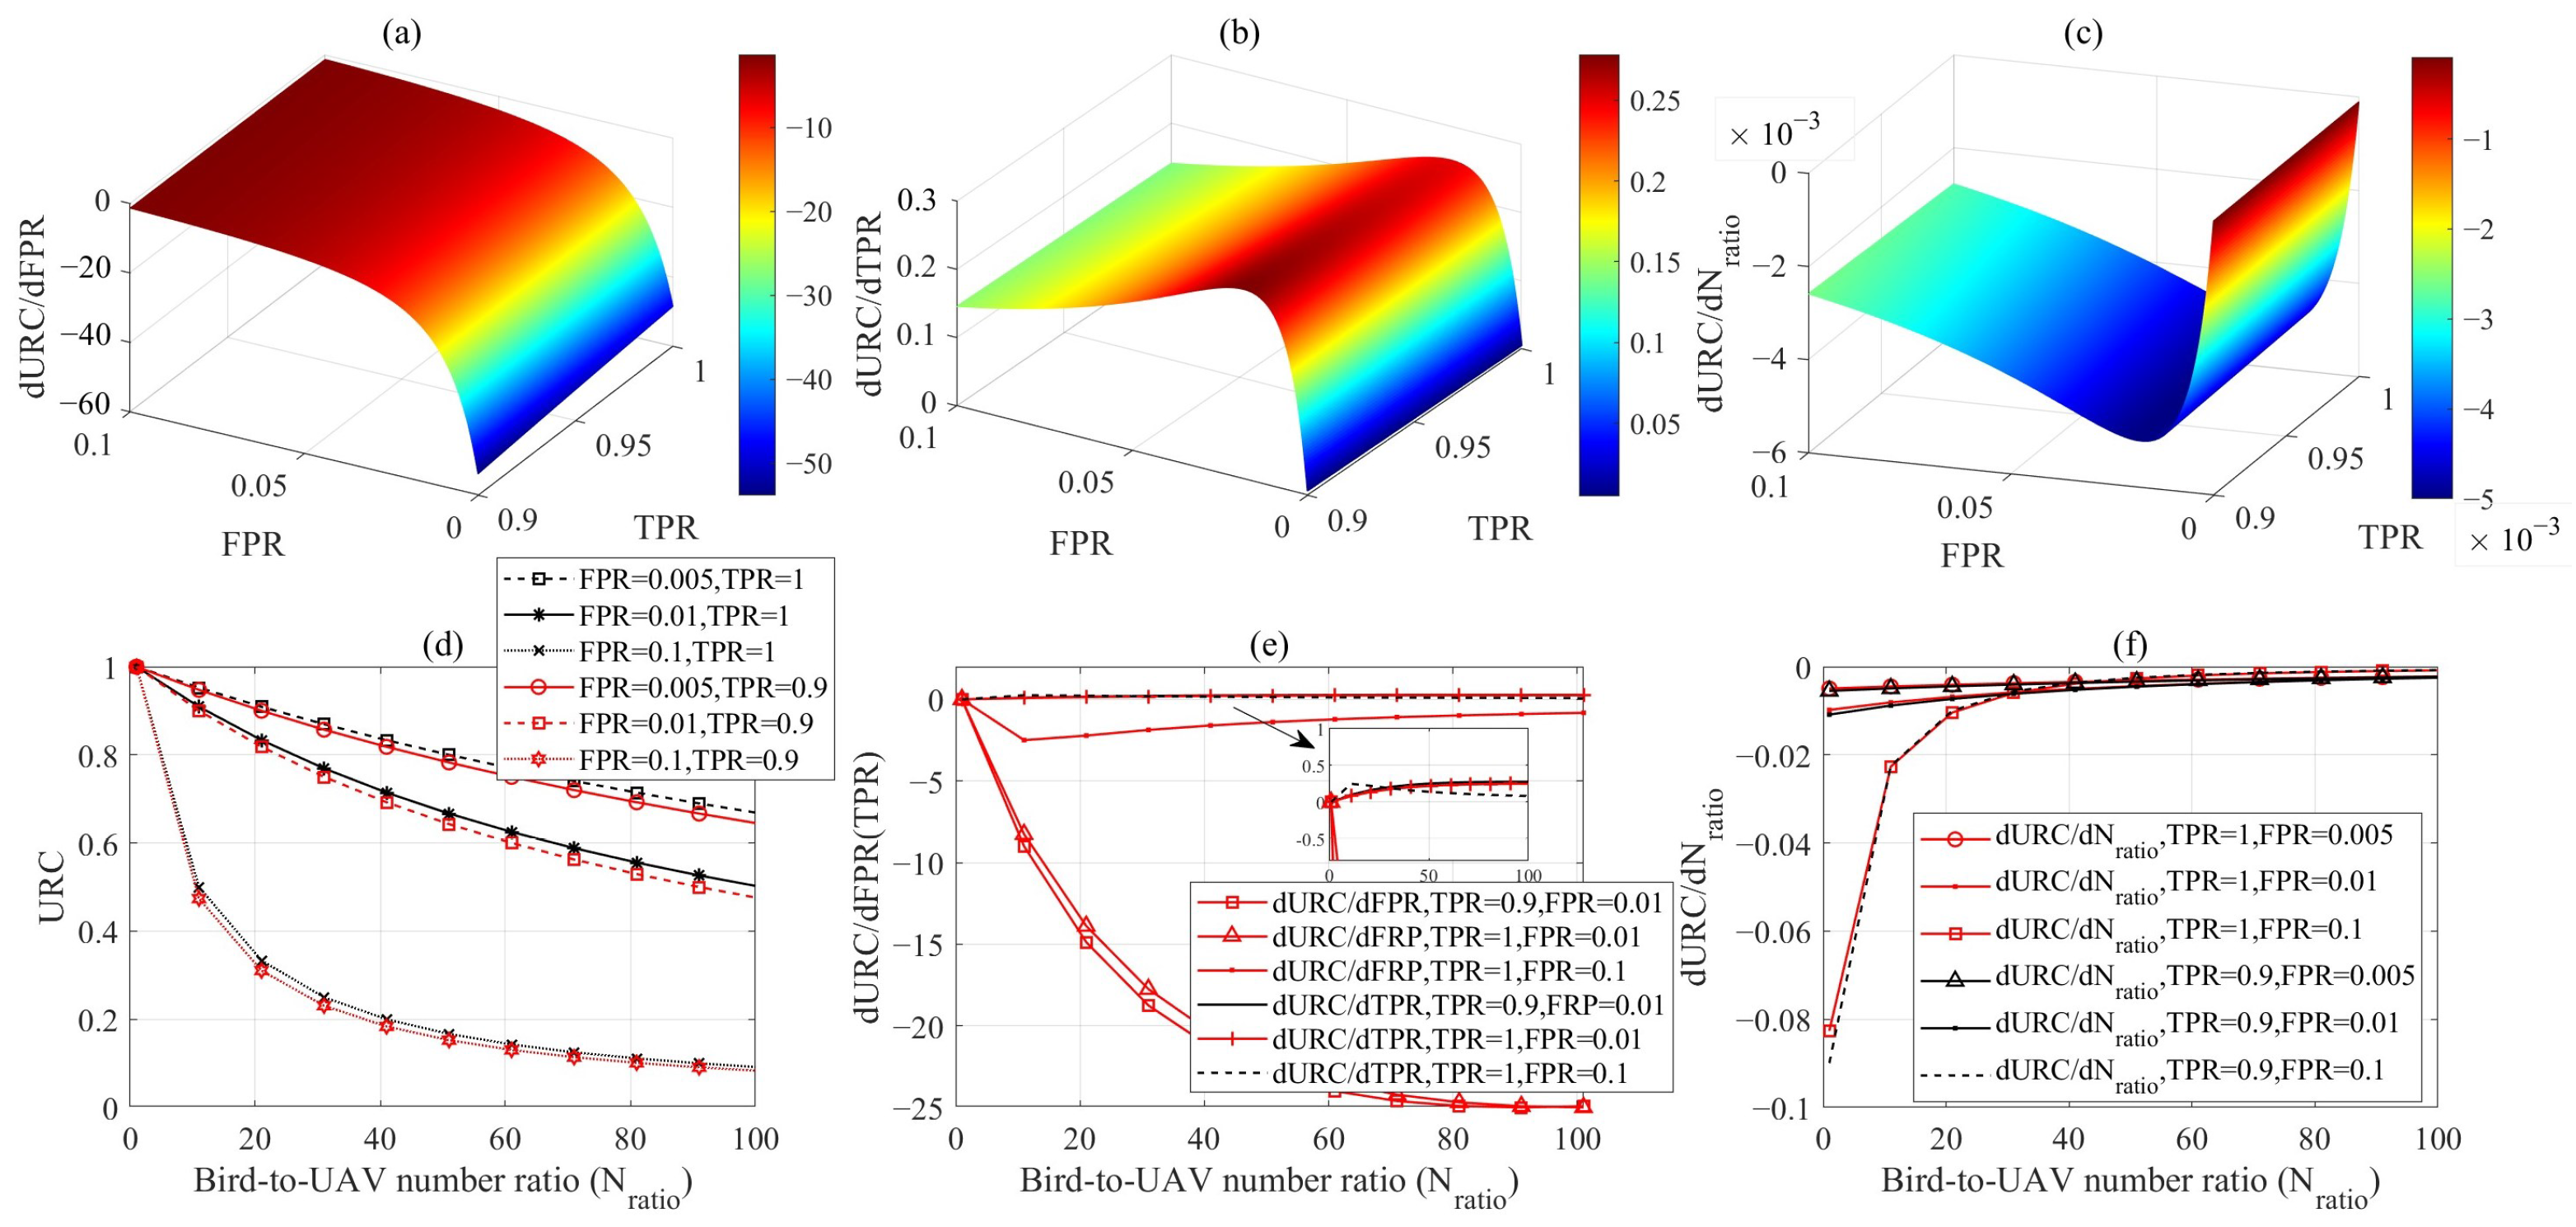
Figure 4a–c illustrate the influence of FPR and TPR on URC sensitivity under the conditions TPR > 0.9, FPR < 0.1, and . The results show that variations in FPR have a substantially larger impact on URC sensitivity than variations in TPR. Specifically, the URC sensitivity with respect to FPR is several orders of magnitude greater than that with respect to TPR and , indicating that even very small perturbations in FPR can cause significant changes in URC. This conclusion is further confirmed in Figure 4d, where an increase in FPR of less than leads to a pronounced degradation in URC, whereas a change in TPR produces only minor variations. Figure 4e presents the sensitivity with , showing that its absolute value first increases and then gradually converges to zero. A similar convergence trend is observed in Figure 4f. Moreover, small perturbations in FPR noticeably alter the convergence rate of sensitivity with respect to , while the influence of TPR on this convergence can be neglected. The above observations lead to the following conclusions:
Figure 4.
(a) The URC sensitivity relative to FPR with different FPR and TPR. (b) The URC sensitivity relative to TPR with different FPR and TPR. (c) The URC sensitivity relative to with different FPR and TPR. (d) The relationship between URC and under different TPR and FPR. (e) The relationship between the URC sensitivity relative to FPR (TPR) and under different TPR and FPR. (f) The relationship between the URC sensitivity relative to and under different TPR and FPR.
- FPR plays a dominant role in determining URC sensitivity. Consequently, estimation errors in FPR have a much larger impact on URC than comparable errors in TPR and . Thus, the FPR must be estimated with high precision.
- As shown in Figure 4b,c, the URC sensitivity exhibits an extremum under the conditionWhen FPR is below this critical value, a slight increase in FPR leads to a rapid amplification of the URC sensitivity with respect to TPR and .
- As increases, both URC and its sensitivity gradually stabilize, indicating that the influence of on URC sensitivity diminishes. Consequently, the same absolute estimation error in produces a smaller impact on URC with the increase of . Therefore, in environments with high bird activity, a wider tolerance in estimating can be accepted without significantly degrading URC.
(e) Robustness Analysis of URC With Respect to Parameter Perturbations
In practical radar recognition systems, the statistical parameters of the classifier may fluctuate due to environmental variations, dataset differences, and threshold adjustments. Therefore, it is necessary to analyze the robustness of the proposed URC metric with respect to parameter perturbations.
To ensure that the variation of URC remains bounded by a small tolerance when the FPR fluctuates within a certain range, the following condition must hold:
By direct algebraic manipulation, the perturbation of FPR must satisfy
Similarly, the admissible perturbation ranges for TPR and can be obtained as
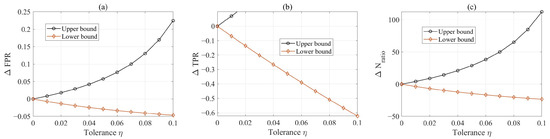
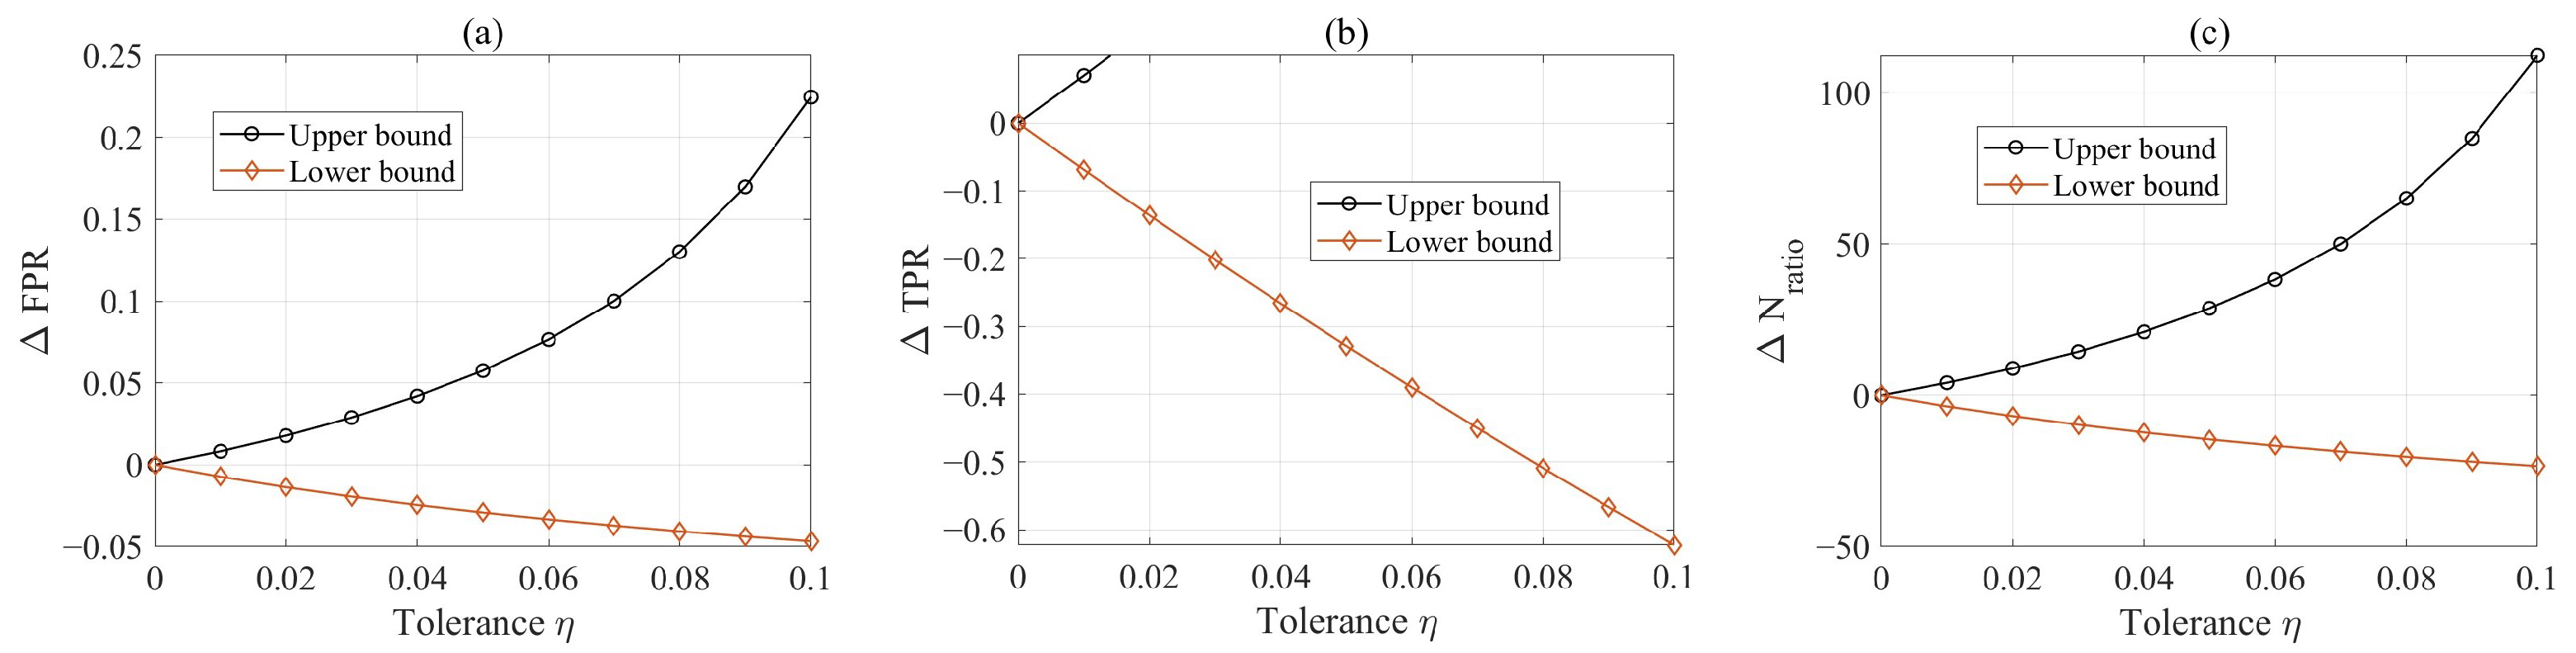
Figure 5 illustrates the variation range of URC under parameter perturbations. It can be observed that for the same magnitude of perturbation in FPR and , the positive perturbation results in a smaller change in URC compared with the negative perturbation. This indicates that the URC metric exhibits asymmetric sensitivity with respect to parameter deviations. Furthermore, the perturbation of FPR leads to more significant variations in URC than that of TPR. Overestimation of and FPR produces a smaller impact on URC than their underestimation. From a practical perspective, this implies that conservative (slightly larger) estimates of these parameters are preferable.
Figure 5.
The upper bound (black circle) and the lower bound (red rhombus) of (a) FPR Range with . (b) TPR Range with . (c) Range with .
(f) Sensitive Variation Range
The influence of FPR on URC sensitivity is significantly stronger than that of the other parameters. When FPR falls below a practical engineering threshold, the absolute sensitivity of URC with respect to FPR increases rapidly. Therefore, it is necessary to introduce a quantitative criterion to define the sensitive variation range of FPR. Within this range, an identical reduction in FPR produces a much larger improvement in URC than outside the range. Hence, engineering measures should be taken to maintain FPR within this region to ensure high URC performance.
By setting the absolute sensitivity to exceed a prescribed level , the sensitive variation range can be derived as
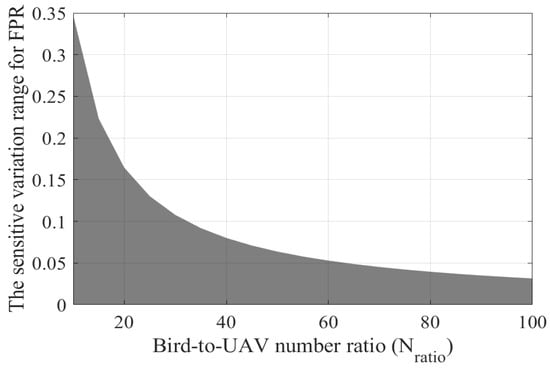
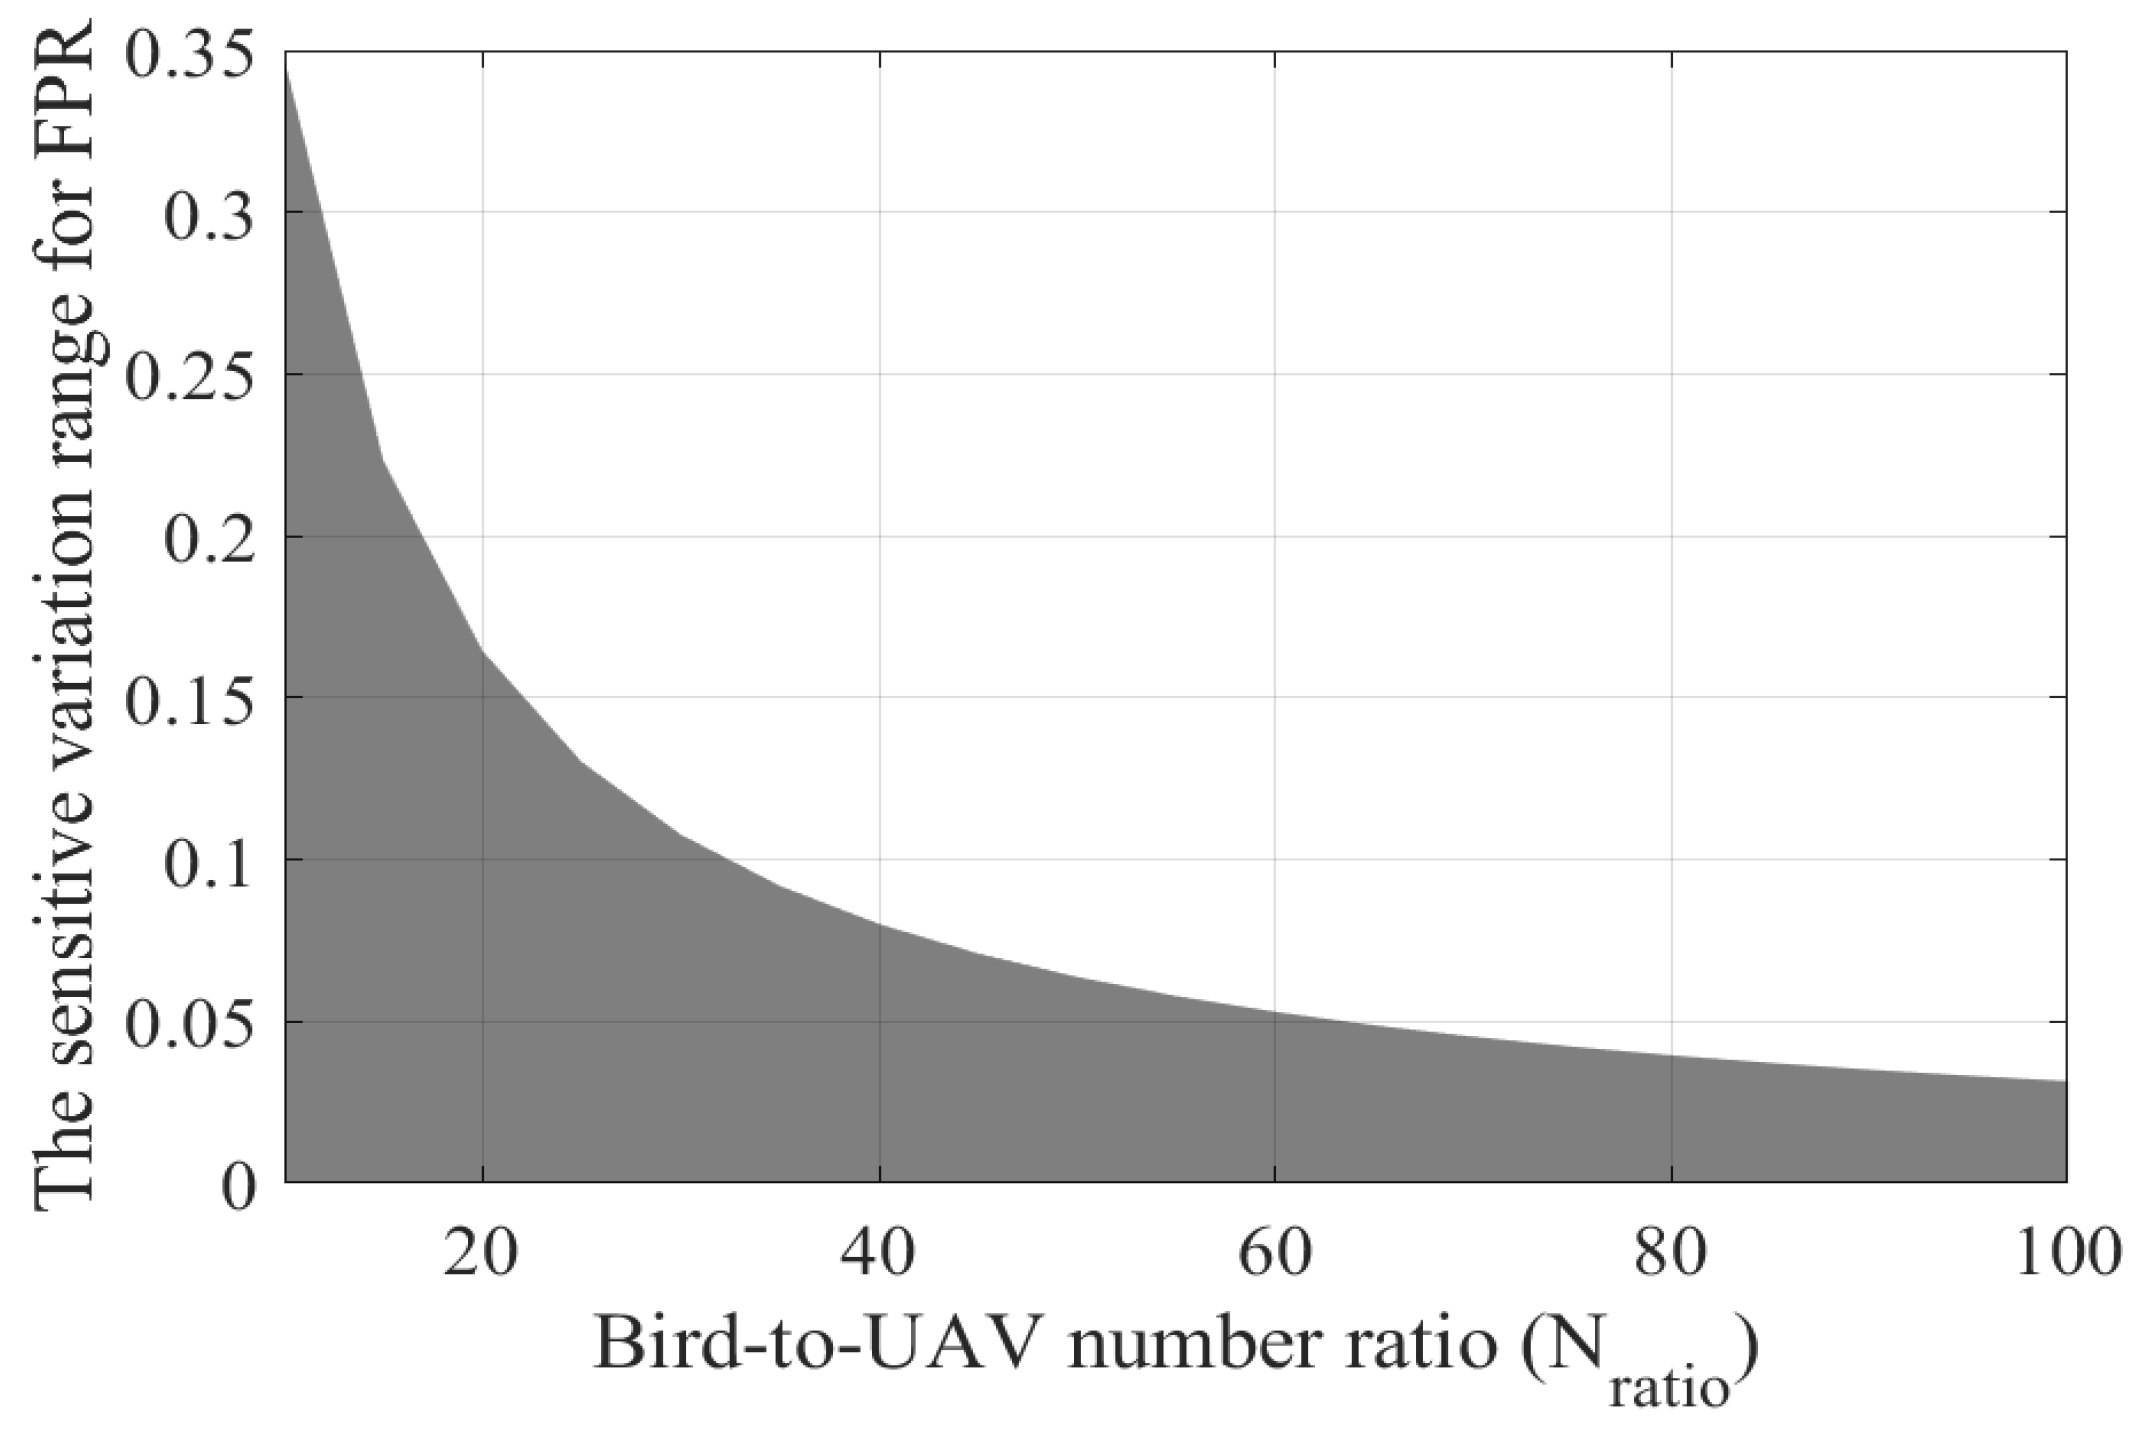
Considering the upper limit of is at , the sensitive variation range for is shown in Figure 6. The gray region represents the sensitive variation range, which contracts rapidly when is small. As further increases, the dependence of the sensitive variation range on bird-to-UAV occurrence ratio uncertainty gradually diminishes.
Figure 6.
The sensitive variation range for (gray region).
3. Cumulative URC: Modeling, Temporal Dependence, and Applicability
3.1. Cumulative URC Under Time-Varying Markov Modeling
In practical radar observations, recognition results obtained from consecutive scans are usually temporally correlated due to the persistence of target motion and scattering characteristics. Therefore, the commonly used assumption of statistical independence between frames may not always hold in realistic scenarios. To account for this temporal dependency, a time-varying Markov model is introduced to capture the temporal evolution of TPR, FPR, and URC, accounting for the dynamic behavior of the recognition process.
(a) Time-Varying Markov Modeling
Let denote the recognition result at frame k, where indicates correct recognition, and indicates misrecognition (). Define the time-varying transition probabilities
under the UAV hypothesis, with . Similarly, define
under the bird hypothesis.
Consider an n-frame recognition sequence , where .
Under the UAV hypothesis, the cumulative TPR and FPR are expressed, respectively, as
Let the total number of correct recognitions in the sequence be
Define the subset
and the total sample space:
(b) Derivation of Cumulative URC
Assuming that the occurrence frequency of birds remains approximately stationary within a short temporal window, this is justified by the relatively slow variation in environmental conditions and background activity. The cumulative URC quantifies the overall reliability of a recognition sequence, defined for sequence as
The expectation of the cumulative URC under the true UAV hypothesis serves as a statistical measure of the average posterior credibility assigned to UAV targets over all possible recognition sequences. Formally, conditioning on the event that the true target class is UAV, the expectation is defined as
Grouping sequences according to m gives
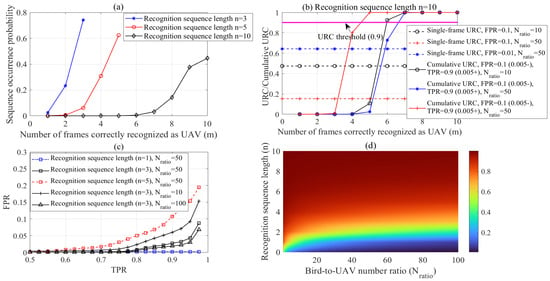
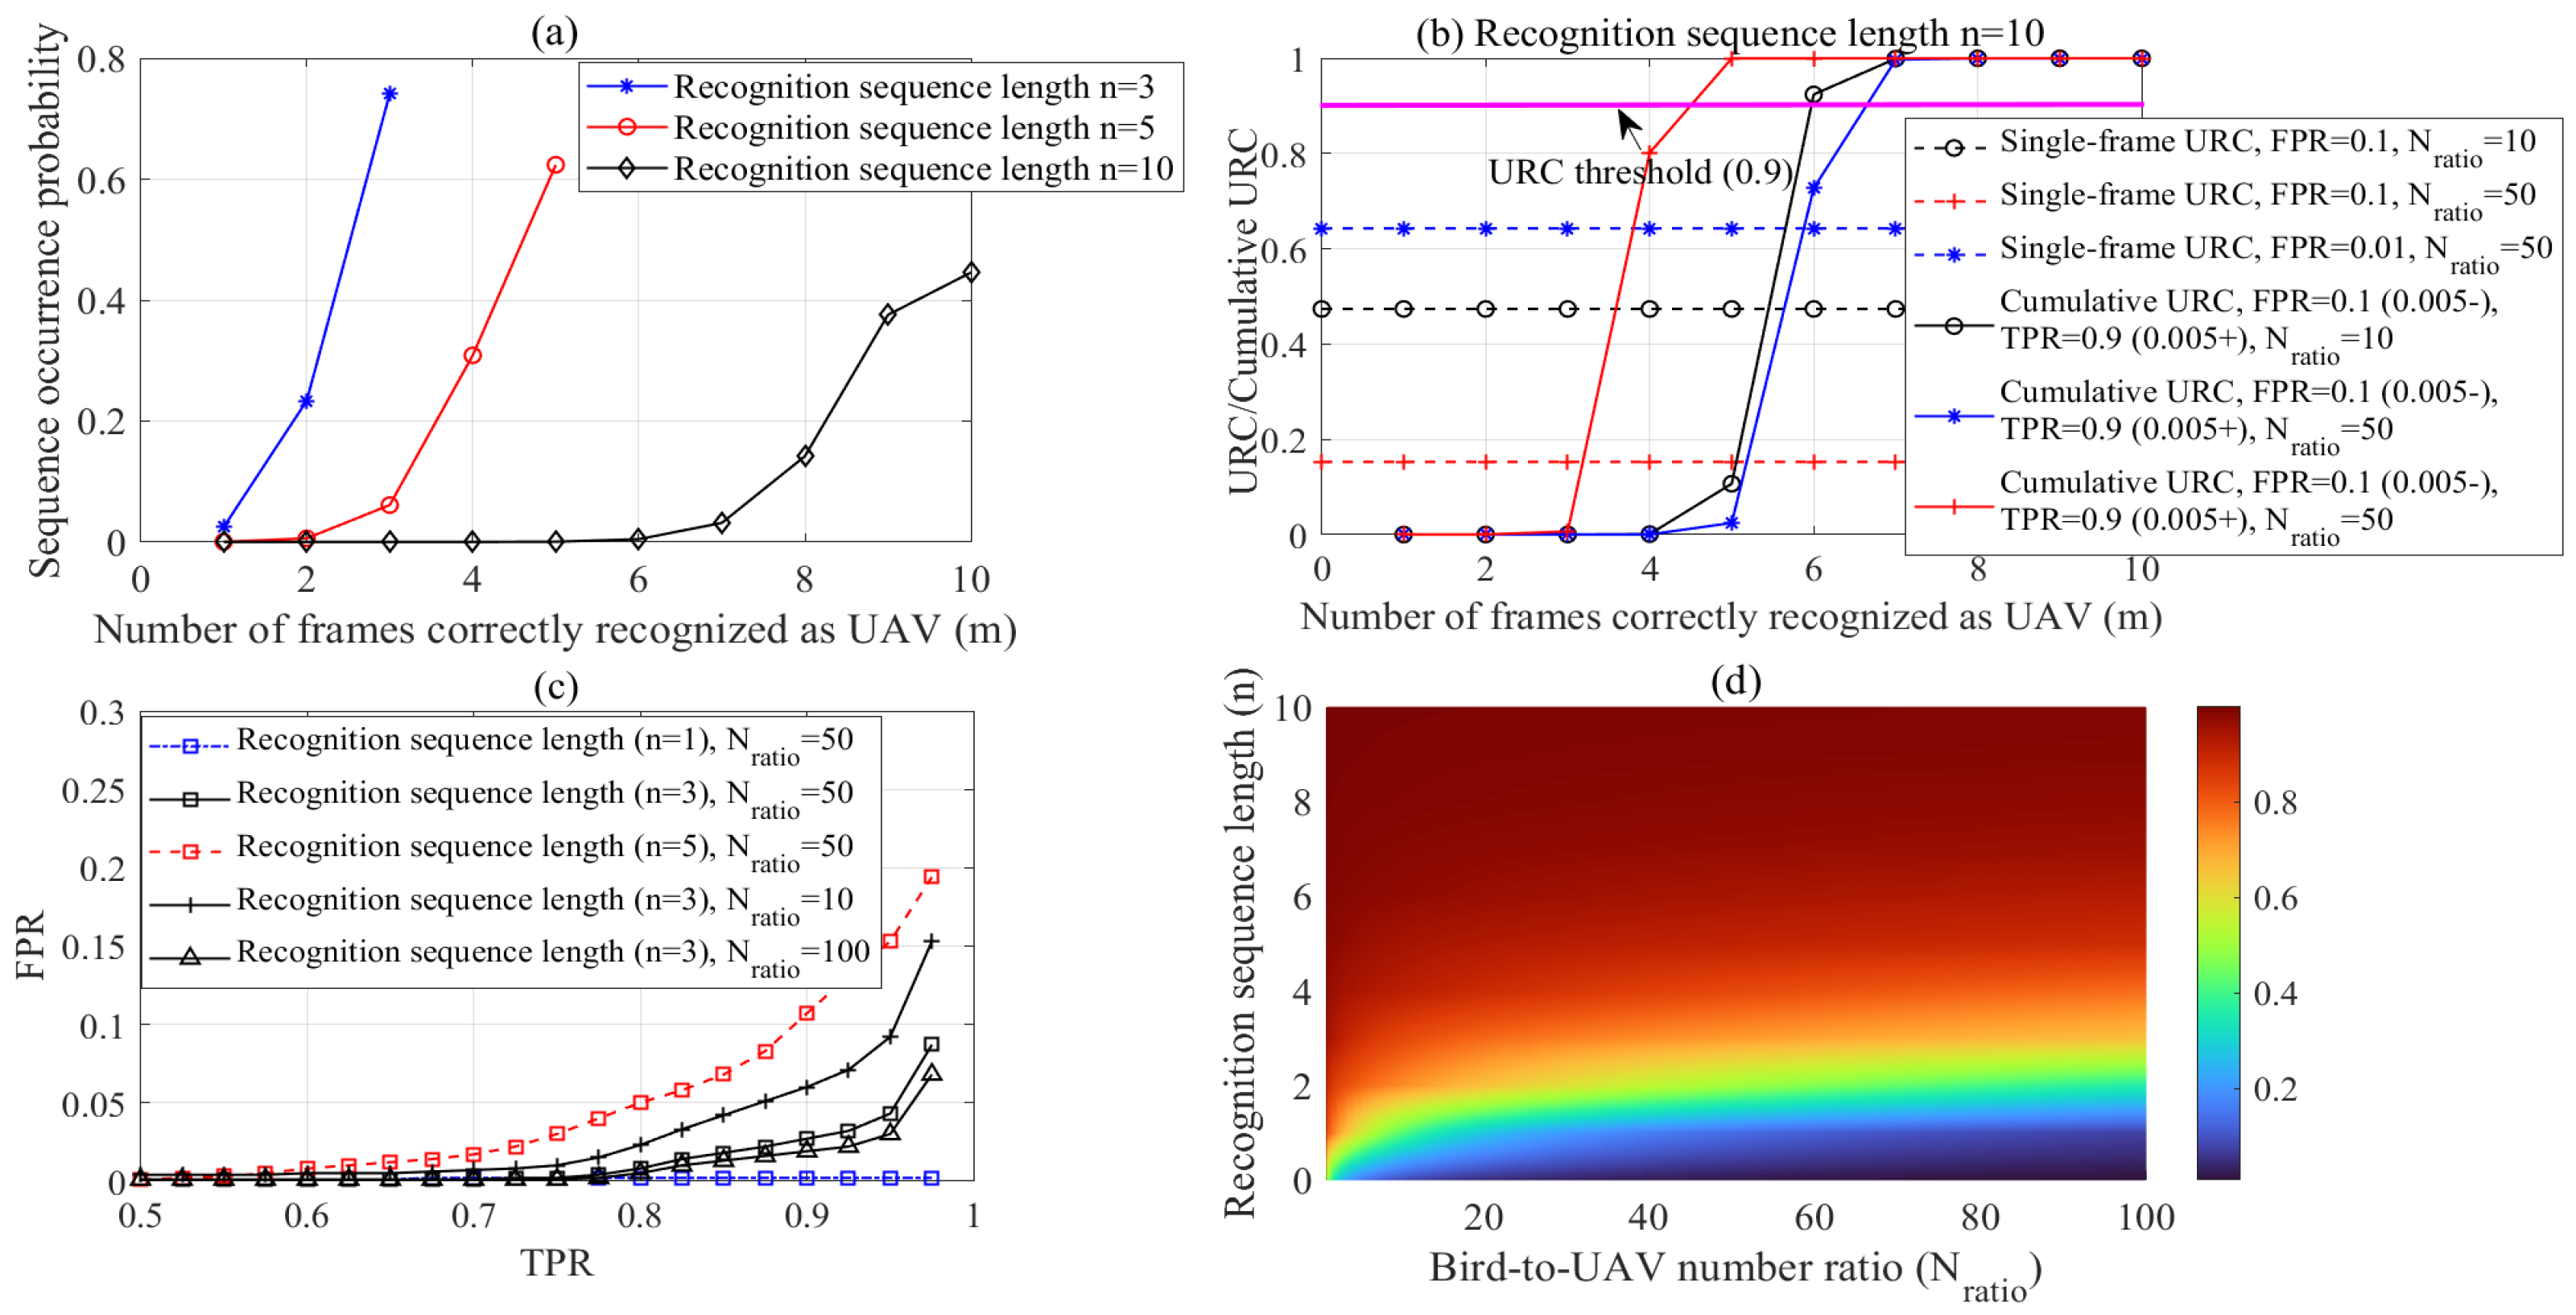
Temporal correlation induced by trajectory association is modeled by allowing the UAV recognition probabilities and to increase linearly from with an increment of per frame, while the false-recognition probabilities and decrease linearly from at the same rate. Figure 7a shows that, since is larger enough than , the probability mass concentrates on large values of correctly recognized frames m. Figure 7b depicts the average cumulative URC for . As m increases, the cumulative URC exhibits a sharp transition: after a short quick-growth region, it rapidly approaches saturation. Hence, even a small increase in m can drive the sequence into a high-confidence regime, yielding reliability substantially higher than that of the single-frame URC. The influence of bird occurrence probability on it is marginal, whereas a small can significantly reduce the number of correctly recognized frames required to ensure the credibility of recognition results. For , the single-frame URC is approximately . However, when , the overall identification becomes statistically reliable, and , indicating that recognition sequences with occur with near certainty. This clearly demonstrates that the UAV recognition sequence over any ten frames can robustly identify UAVs with high probability under heavy bird interference. Figure 7c illustrates the - constraint curves required to achieve . The area under the curve corresponds to . The feasible region expands significantly as the sequence length n increases, demonstrating that longer recognition sequences substantially relax the TPR and FPR requirements. Although is more critical for individual sequences, both and strongly affect the expected cumulative URC, since reshapes the entire sequence distribution. Therefore, statistically, to ensure the sequence demonstrates a reliable statistical trend, cannot be considered a secondary quantity. As shown in Figure 7d, as n increases, the expected cumulative URC rapidly approaches 1. Under the considered setting, five frames are sufficient for robust identification. The influence of on is significant only when n is small; for sufficiently long sequences, the impact becomes minimal.
Figure 7.
(a) The sequence occurrence probability with the number of correctly recognized frames (m) under different recognition sequence lengths (n). (b) The cumulative URC with different number of correctly recognized frames (n = 10). (c) The relationship between TPR and FPR under the premise that the expected value of URC/cumulative URC is 0.9. (d) The expectation of the cumulative URC with increasing recognition sequence length (n) and the ratio of bird-to-UAV quantity ().
(c) Temporal Dependency in Track-While-Scan (TWS) and Classify-While-Scan (CWS): Impact on Cumulative URC
TWS and CWS represent two distinct paradigms for multi-frame UAV recognition, differing in the extent to which recognition decisions rely on track continuity and temporal information. Understanding these differences is crucial for interpreting cumulative URC behavior and for designing recognition strategies that achieve high confidence under varying operational conditions.
- TWSIn the conventional TWS framework [18], UAV recognition is tightly coupled with recursive track updating and data association. Radar measurements and decision statistics evolve gradually with variations in SNR, clutter dynamics, and target maneuvering. Recognition at frame k depends not only on current measurements but also on prior frames due to the propagation of historical information—a memory effect. Formally, the strong temporal dependence can be modeled as a first-order non-homogeneous Markov chain:indicating that recognition outcomes are statistically dependent on previous frames.This multi-frame accumulation leverages kinematic continuity, energy-based signal integration, and feature-domain information, which collectively influence subsequent frames’ TPR and FPR. In practice, a correct recognition in a prior frame produces a positive feedback effect: once high confidence is established in previous frames, the current frame is more likely to accept consistent evidence, further accelerating cumulative URC growth. This self-reinforcing dynamic enables rapid URC saturation under favorable tracking conditions.However, this same temporal dependence introduces vulnerability. Track interruptions or incorrect associations can corrupt the accumulated memory, degrading the TPR and FPR of subsequent frames and causing cumulative URC to lose its monotonic growth guarantee—its robust increase with sequence length can no longer be ensured. This strong correlation between cumulative URC and track continuity underscores both the strength and the fragility of the TWS framework.
- CWSUnder the CWS paradigm [19], raw data within each radar resolution cell are processed independently to extract object features and assign an identification (ID) at each scan. While the ID may subsequently be used in a Track-After-Identification (TAI) module, the primary recognition decision relies on the current frame rather than on track continuity. As a result, inter-frame dependency is weak, and recognition outcomes from consecutive frames are approximately independent:Under this weak-correlation condition, the sequence likelihood can be approximated by a first-order model, equivalent to that of a non-homogeneous independent process. Consequently, cumulative URC can be computed using an independence-consistent formulation. This fast-mixing behavior implies that, under the CWS framework, cumulative URC growth does not depend on track stability, but rather on the single-frame TPR/FPR and recognition sequence length. Once the process reaches the recognition stage, CWS can calculate cumulative URC over multiple frames—even when stable tracks cannot be maintained. CWS renders the cumulative URC independent of tracking quality, instead relying on the inherent single-frame recognition performance. As a result, as the recognition sequence length increases, the cumulative URC always converges toward saturation.
3.2. Operational Scenarios for Single-Frame and Multi-Frame URC
The applicability of single-frame URC and multi-frame cumulative URC depends on radar detection conditions, system performance, and operational requirements.
Single-frame URC is applicable under the following scenarios:
- Low detection probability: This includes radars with short dwell times (i.e., fast scan cycles) that limit coherent integration gain, as well as complex clutter environments that reduce signal-to-clutter ratio—both of which lead to low signal-to-clutter-plus-noise ratio. Under such conditions, target tracks may not form reliably, and track association may fail, forcing the system to rely on instantaneous measurements for recognition.
- High-priority operational tasks: Rapid response and immediate decision-making are required, such as in airport security, border surveillance, and critical infrastructure protection. In such cases, even single-frame recognition must provide actionable threat assessment.
In these situations, radar processing may reach only the single-frame recognition stage. Single-frame URC thus provides an urgent yet conservative reliability estimate—quantifying the confidence of current decisions to guide immediate operations and rapid decision-making.
Multi-frame (cumulative) URC can be applicable under the following scenarios:
- High detection probability: Radars with long dwell times or advanced signal processing capabilities ensure reliable target detection across consecutive scans. This enables stable track establishment and continuous tracking, allowing multi-frame observations to be integrated.
- Sufficient observation time: When a target remains at a safe distance (e.g., loitering or slow-moving UAVs outside threat zones), the radar has the operational margin to integrate features from multiple scans before a decision is required.
As the recognition sequence length increases, the expected cumulative URC rises. Therefore, multi-frame recognition attenuates the influence of instantaneous misclassifications, thereby furnishing more robust confidence estimates and enhancing overall decision reliability.
A practical adaptive strategy combines both approaches: single-frame URC serves time-critical scenarios or when track continuity is poor, whereas cumulative URC is leveraged under favorable conditions to achieve higher robustness.
4. Simulation and Experimental Validation
Simulations and X-band radar experiments are conducted to validate the proposed URC metric under various bird-density scenarios.
4.1. URC Estimation Based on Different Observation Durations
4.1.1. URC Estimation for Short Observation Window
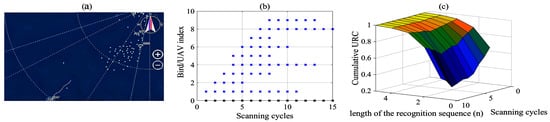
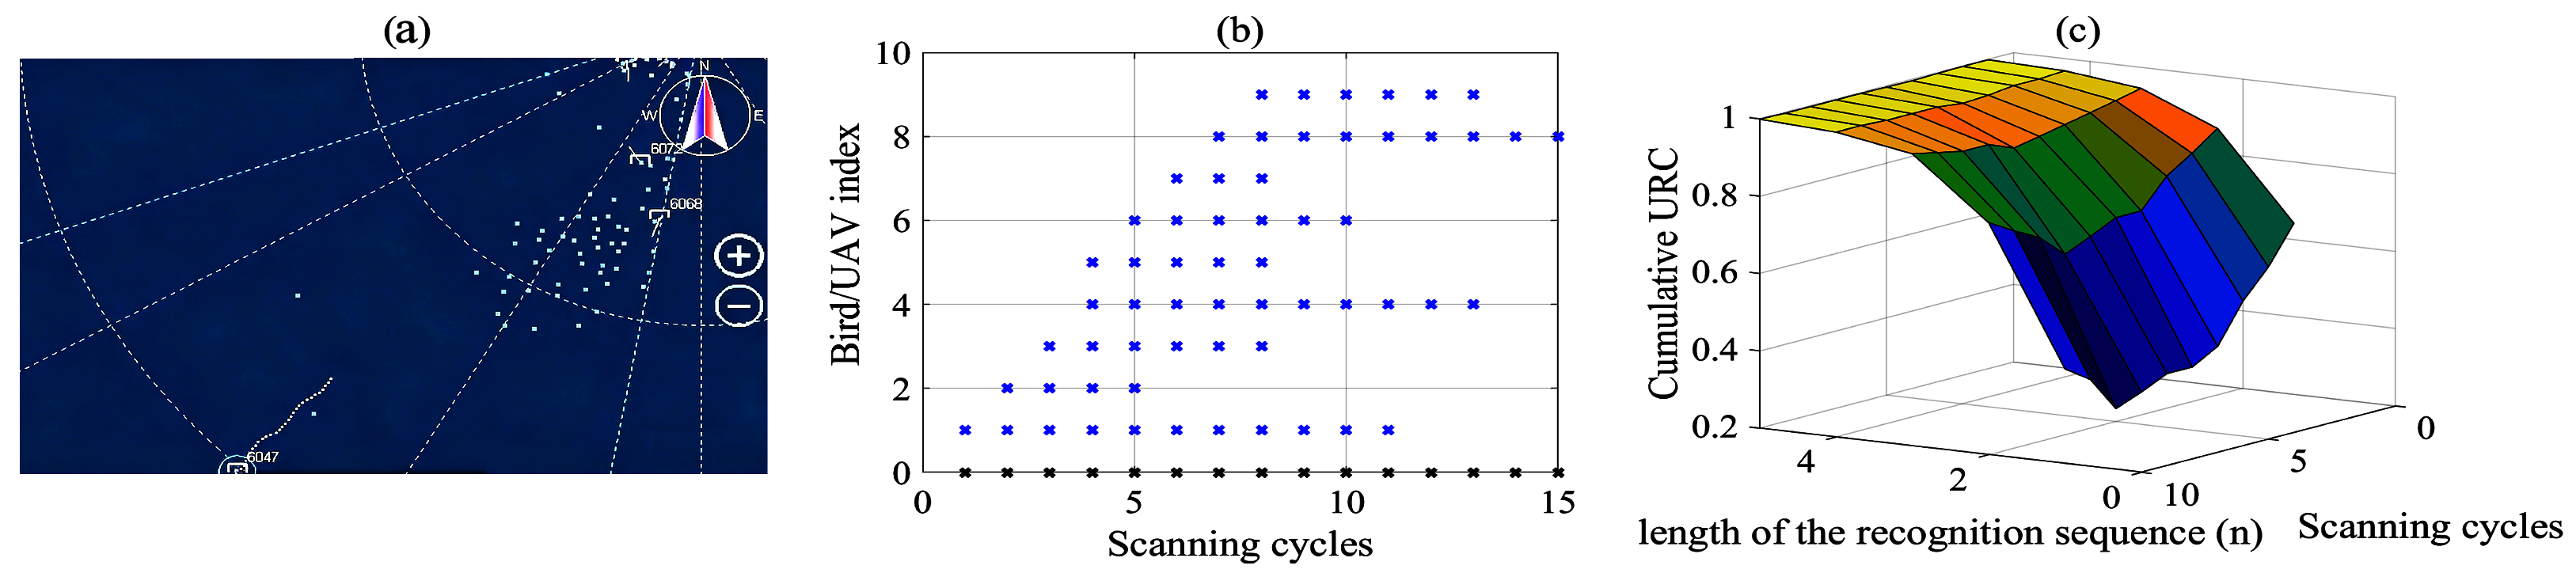
The actual Plan Position Indicator (PPI) is shown in Figure 8a, where the radar scan period is 2 s per rotation. Under the C-UAV operational scenario, the cooperative UAV (ID: 6047) maintains an approximately linear trajectory. A large number of bird-induced interferences are observed within the surveillance region. Figure 8b presents the statistical number of bird trajectories observed on the PPI over 15 radar scan periods. The results clearly indicate that frequent bird activities introduce significant interference to UAV recognition in a small-scale time window. In particular, the trajectory persistence of birds is highly unpredictable, and their occurrence frequency within the radar coverage is relatively high. This renders the recognition results of single-frame URC highly time-varying and unstable, as illustrated in Figure 8c. However, such instability tends to stabilize as the recognition length increases. Consequently, longer recognition sequences provide stronger robustness against bird-induced interference. Within the short time window for the scene, three consecutive valid recognition frames are sufficient to ensure reliable UAV identification.
Figure 8.
(a) Schematic of the radar PPI showing the trajectory of a UAV (ID: 6047) and trajectories of birds (IDs: 6068, 6072). (b) Statistics on the number of birds per scanning cycle. (Index 0 corresponds to the UAV (black ×), and indices 1–9 correspond to birds (blue ×).) (c) The variation of cumulative URC with scanning cycles and recognition sequence length.
4.1.2. URC Estimation for Long Observation Window
Bird populations can exhibit relatively stable daily activity patterns [20]. Typically, a peak in activity occurs in the morning when birds leave their resting areas to forage, followed by an evening peak when they return. These diurnal variations strongly modulate URC throughout the day.
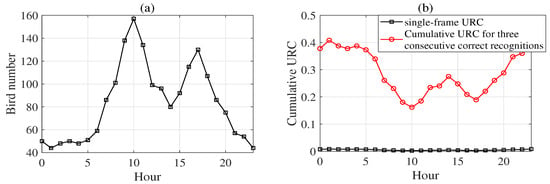
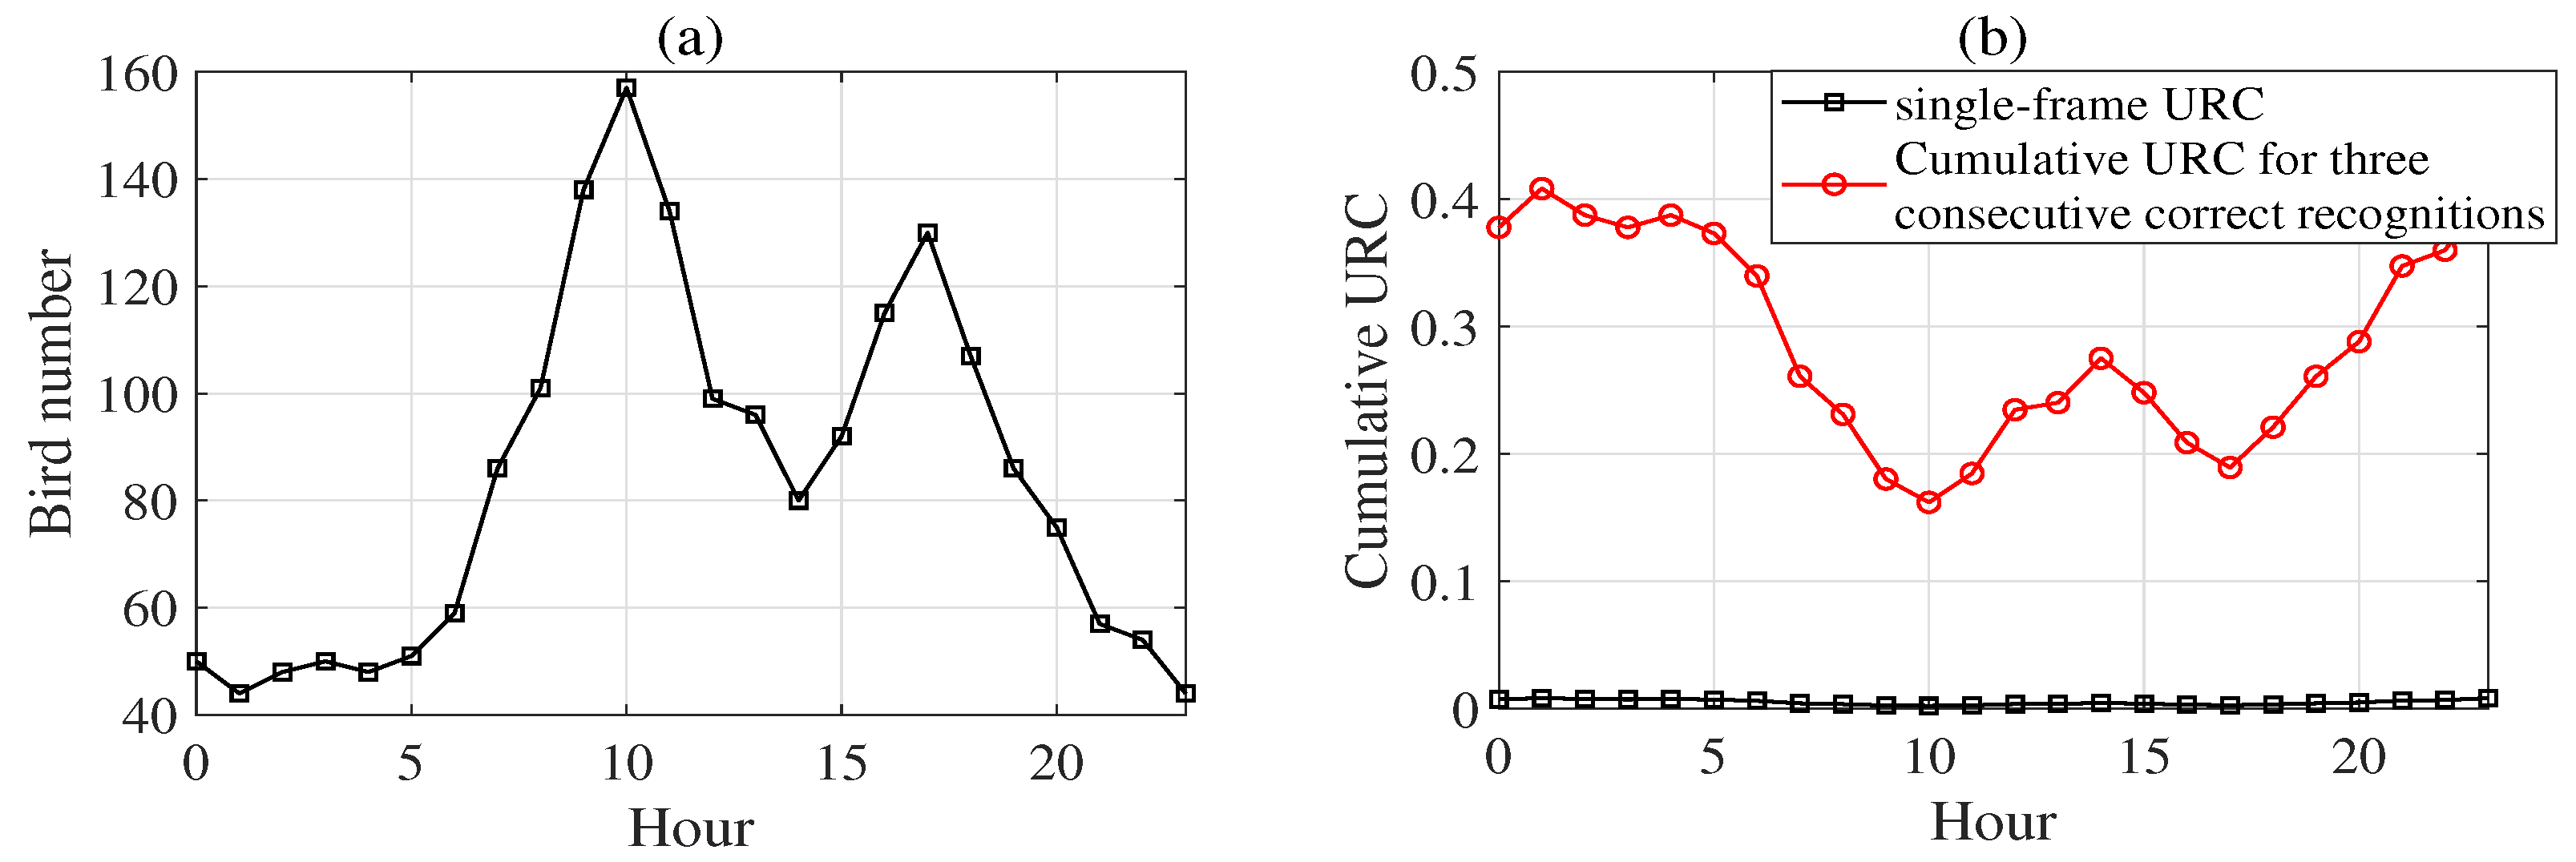
The 24 h bird occurrence profile is simulated in Figure 9a. The total number of bird tracks within the surveillance region is set to 2000 per day [20]. Assuming one UAV may appear per day with unpredictable arrival time, the hourly UAV prior is approximated as . The corresponding hourly URC is illustrated in Figure 9b. The URC is strongly modulated by the diurnal bird-activity pattern. During peak intervals (09:00–11:00 and 17:00–19:00) [20], elevated bird density significantly increases the normalization term in the Bayesian posterior, leading to a sharp degradation in recognition credibility. The single-frame URC falls below , despite high frame-level TPR. Meanwhile, the expected number of single-frame UAV declarations scales with bird density and may reach approximately 200, resulting in persistent false UAV alerts. Even if the target is recognized as a UAV for three consecutive frames, the cumulative URC still remains far below practical operational requirements, and residual false UAV alarms may still occur at a rate on the order of two per day. These results indicate that under low and uncertain UAV prior conditions, a more conservative recognition policy is mandatory. Extending the recognition sequence length is necessary to counteract the posterior dilution induced by high background activity. Moreover, the results highlight the critical role of local environmental statistics. Regional bird-activity patterns directly affect posterior credibility. Recognition parameters should therefore be adaptively scheduled according to environmental activity levels, with stricter temporal constraints applied during peak periods. From an operational perspective, periods of intensive bird activity may incidentally provide reduced recognition exposure for cooperative UAV missions, suggesting a potential concealment advantage.
Figure 9.
(a) The simulation of the bird number throughout the day. (b) The URC (black square) and the cumulative URC for three correctly recognized frames (red circle) throughout the day.
4.2. URC Estimation Based on Simulated PPI
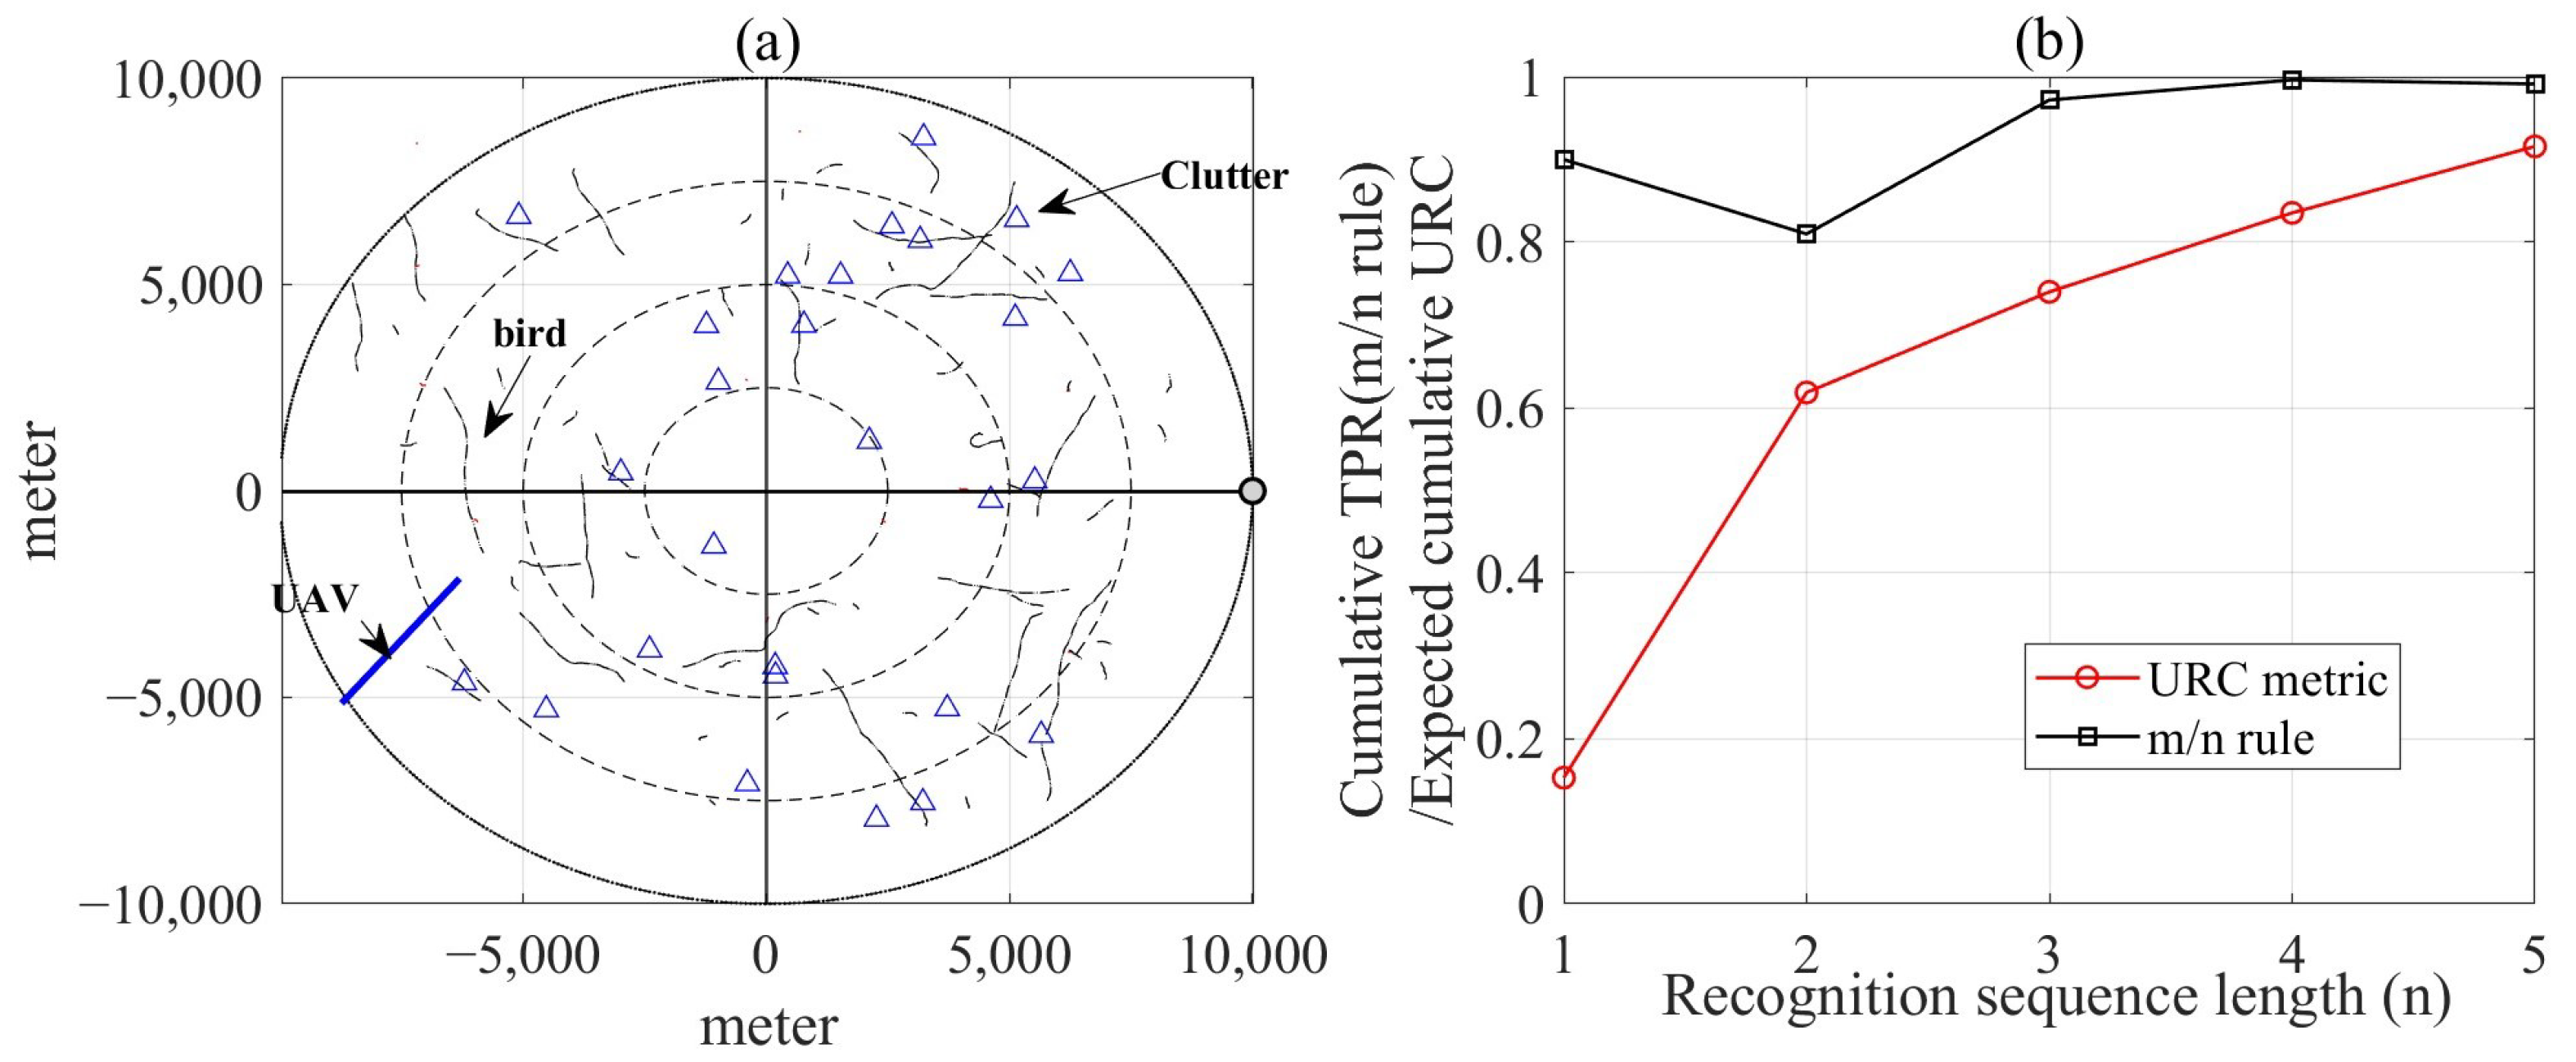
In environments with relatively abundant and homogeneous resources, the spatial distribution of birds is assumed to obey a uniform distribution for analytical simplicity. A representative radar system (Weibel XENTA-M1 X-band radar) is assumed for deployment, with the capability to identify and track UAVs (RCS = 0.01 m2) up to a maximum range of 10 km. Its beam scan cycle is 1 s/rev [21]. The UAV was detected at a distance of 10 km, and its trajectory is linear (shown in blue). Fifty birds (shown in black) are flying within the maximum detection range.
Due to their highly variable flight behavior, bird trajectories introduce significant uncertainty into UAV recognition. Flight patterns vary by species, environment, and behavioral state, with some birds remaining within relatively confined local regions and others traversing several kilometers in a single flight, and flight durations ranging from seconds to minutes [22]. To realistically capture these dynamics in simulation, we adopt a stochastic trajectory model [23], where each bird moves with a bounded velocity and a heading angle that evolves randomly over time:
and the two-dimensional position updates according to
where v is the instantaneous velocity magnitude, is the radar scan interval, and represents Gaussian perturbations in heading.
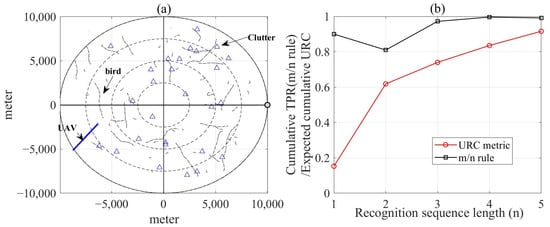
Figure 10 illustrates the simulated trajectory distribution. This simulation models the trajectories within a short PPI observation window, aiming to present all interfering trajectories. Given that the simulated trajectory distribution closely matches the pattern reported in [24], the similar trajectories of local targets in the region introduce significant interference. Due to the requirement for rapid real-time recognition of UAVs, any detected birds, regardless of flight duration, become important interference sources once the trajectories are established. Under a conventional confirmation rule, which primarily optimizes the frame-wise TPR, the system-level reliability may deteriorate in dense interference environments. Even when , the inability to discriminate UAVs from birds may result in a high false declaration rate at the track level. For instance, all birds are declared as UAVs. The rule may erroneously judge all recognition results as UAVs and a total of 51 UAV declarations would result in a full screen of UAV alarms. However, the corresponding single-frame URC is only URC , indicating extremely low recognition credibility. As emphasized in [25], a system that achieves perfect UAV detection accuracy but fails to distinguish UAVs from birds cannot be regarded as practically feasible. When the frame-level FPR is reduced to 0.2, approximately 10 false UAV alarms may still occur, which is still operationally unacceptable. Therefore, the reference value of single-frame recognition results is extremely limited. This highlights the necessity of lengthening the recognition sequence in real-world environments. Figure 10b presents a systematic comparison between cumulative URC and several rules, including , , , , and . When evaluation focuses solely on UAV recognition probability, rules exhibit seemingly excellent UAV recognition performance due to the already high TPR. In particular, under the commonly adopted rule, the probability of accepting a UAV hypothesis approaches unity. However, URC remains significantly lower, revealing that accumulated bird-induced false recognitions substantially degrade overall recognition credibility. Specifically, under the engineering-standard rule, although the criterion yields a near-certain UAV declaration, URC exposes that certain recognition sequence of birds can still satisfy the requirement, thereby undermining the posterior credibility of the recognition result. In other words, URC quantifies the risk that bird trajectories satisfy the decision criterion and reveals the potential system-level misclassification that may arise under conventional rules.
Figure 10.
(a) Simulated bird and UAV motion tajectories in radar PPI. (b) Performance comparison between URC metric and M-out-of-N Rule.
4.3. Measurement
The radar system deployed in the experiments is a narrow-band X-band pulsed Doppler phased-array radar providing full azimuth coverage. Digital beamforming enables the formation of multiple elevation beams during each antenna rotation. The rotation period is adjustable between 2 s and 20 s. The key system parameters are as follows: pulse repetition frequency (PRF) kHz, coherent processing interval (CPI) ms, and range resolution of 12 m. The automatic target recognition (ATR) module developed under the CWS framework [26] is capable of identifying multiple target categories, including ships, birds, UAVs, and other aerial objects. Field experiments were conducted in complex coastal environments along the Chinese coastline, including Qidong and Rizhao. The experiments covered diverse environmental conditions, including sea states ranging from below Sea State 3 up to Sea State 5 and varying meteorological conditions. The coastal radar environment contains multiple clutter sources, including land clutter generated by nearby mountains and buildings, sea clutter under different sea states, and atmospheric clutter caused by precipitation and fog. The radar was installed on top of a 12 m high coastal building and scanned horizontally over the sea surface. A fixed-wing UAV was employed as a cooperative target, flying along pre-planned trajectories defined by GPS waypoints. During each flight experiment, the radar operated in tracking mode and continuously recorded the target echo data. After each ATR decision, the recognition result was verified using radar-guided visible-light and infrared imaging systems to ensure consistency between the recognized class and the actual target. Examples of the verification results are shown in Figure 11. In Figure 11a, the ATR system correctly declares a UAV target. In contrast, Figure 11b presents a case where the ATR system declares a UAV target, while the optical verification reveals that the actual target is a flock of birds. A large number of experiments were conducted under these complex coastal clutter conditions. Experimental results verified that other types of targets contributed little interference to the UAV recognition. Therefore, the present study focuses primarily on the recognition performance between UAVs and birds. For each experimental scenario, the ATR classification results were recorded and verified to obtain the ground-truth target labels. Based on these verified observations, confusion statistics were constructed to evaluate the recognition performance of the ATR algorithm.
Figure 11.
Radar-guided image. (a) UAV visible-light image (left) and UAV mid-wave infrared image (right). (b) Bird flock visible-light image (left) and bird flock mid-wave infrared image (right).
The statistics reported in Table 1 provide the empirical recognition performance parameters required by the URC framework. In this table, each entry indicates the number of observed targets belonging to a specific ground-truth class that were classified into a particular category. The TPR under each scenario is calculated as
where represents the number of UAV targets correctly classified as UAVs, and denotes the total number of UAV observations.
Table 1.
Confusion statistics obtained from field experiments under four different coastal scenarios (–). Columns represent the ground-truth target categories, and rows correspond to the classification results. The UAV TPR under each scenario and the UAV FPR are derived from these statistics and reported in the last row.
Similarly, the FPR is calculated as
where denotes the number of birds misclassified as UAVs.
Across repeated experimental trials under scenarios –, the minimum TPR is 0.811, while the maximum FPR is 0.028. These conservative statistics are adopted in the subsequent analysis in order to evaluate the cumulative URC performance under worst case recognition conditions. Specifically, the experimentally observed TPR and FPR characterize the statistical behavior of the ATR algorithm under realistic coastal operating conditions. These parameters serve as prior inputs to the URC credibility evaluation model. Once the ATR system declares a UAV in a single recognition frame, the URC metric evaluates the credibility of this recognition result by combining the prior recognition statistics (TPR and FPR) with the environmental prior ratio .
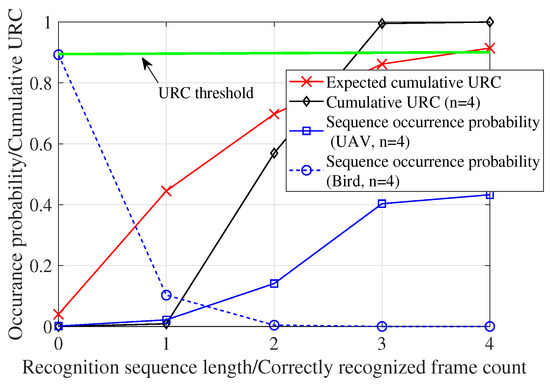
The occurrence probability of birds during a 200 s observation window is calculated as 0.96. Accordingly, the derived ATP is 0.0593, and the expected number of false UAV alarms is 0.48 for a single frame. The transient URC is 0.547. To evaluate the influence of recognition-sequence length on UAV credibility, Figure 12 shows that a four-frame sequence yields an expected cumulative URC of 0.9142, providing a statistically conservative guarantee of correct UAV identification. The decision rule confirms the target as a UAV with a cumulative URC exceeding 0.99 and the sequence occurrence probability is high enough. In contrast, for birds, the probability of is only 0.0045, indicating negligible posterior ambiguity. Therefore, a target is declared as a UAV if more than 2 out of 4 consecutive frames yield positive UAV recognition. The cumulative URC is evaluated using the four-frame recognition sequence strategy, which provides a reliable credibility guarantee in real-time measurements.
Figure 12.
The expected cumulative URC of different recognition sequence lengths (red) as well as the cumulative URC (black) and the occurrence probabilities of different correctly recognized frame counts at for the UAV (blue square) and the bird (blue circle).
5. Discussion
For low-observable (“black-flying”) UAVs, early recognition and early prevention are widely accepted principles. However, practical performance often falls short due to environmental interference, particularly birds, which can significantly increase false UAV alarms and reduce recognition reliability. Focusing solely on UAV TPR is therefore insufficient; mitigating avian-induced FPR is crucial.
The URC metric provides a more comprehensive recognition performance evaluation, accounting simultaneously for high detection capability, low false alarms, and high reliability. Cumulative URC effectively measures recognition reliability over multiple frames. Longer recognition sequences improve confidence and relax strict TPR/FPR requirements.
The knowledge of local bird populations and behavioral patterns is essential. Such information guides the constraints for recognition sequence length, TPR, and FPR, enabling context-aware mitigation strategies.
URC has limitations. Although TPR and FPR are a priori statistical values, bird counts are not always accurately known, introducing uncertainty that is amplified when is small or FPR is high. Nevertheless, larger avian populations reduce the relative impact of estimation errors (Figure 4d). To mitigate the degradation of URC induced by estimation errors through FPR reduction, the error must satisfy
to maintain a constant URC, where denotes the FPR after reduction—that is, the lower the FPR, the smaller the required FPR improvement margin. Furthermore, longer recognition sequences can further attenuate adverse effects (Figure 7d). Based on the robustness analysis of URC, a conservative approach is to use the maximum observed within a time window. This is because not only positive perturbations of have a minor impact on URC, but also overestimating ensures a lower bound on URC, thereby enabling the determination of the most conservative recognition sequence strategy.
From an algorithm design perspective, prioritizing FPR over TPR is often advantageous. Typically, relaxed decision thresholds are adopted to ensure a higher TPR, which concomitantly increases the FPR. For example, increasing TPR from 0.9 to 0.91 while FPR rises from 0.1 to 0.11 results in URC 0.1420, whereas lowering TPR to 0.75 but reducing FPR to 0.09 gives URC 0.1429. This demonstrates that minimizing FPR—even at some cost to TPR—enhances overall recognition confidence.
From an ecological perspective, the prior probability of birds is not constant and may vary significantly depending on bird population dynamics, flight behavior, and environmental conditions. Incorporating such ecological knowledge into the C-UAV radar framework could further improve the reliability of credibility evaluation. In future work, statistical models of bird population activity could be used to adaptively estimate the environmental prior probability within the observation window. Correspondingly, appropriate countermeasures could be introduced in the recognition process, such as adjusting the initial decision threshold of the recognition sequence or dynamically modifying the prior probability of birds used in the URC calculation. By incorporating these ecological priors, the effective bird-induced interference probability may be reduced, thereby improving the credibility of UAV recognition results in complex operational environments.
6. Conclusions
Birds constitute the dominant source of environmental interference in radar-based C-UAV scenarios, making the control of FPR a critical performance factor. To address the limitations of conventional TPR-oriented evaluation, this paper introduces the URC metric, which characterizes radar performance from three complementary perspectives: recognition capability, false UAV alarm quantity, and decision reliability. Considering the dynamic nature of bird populations, simulations are conducted to analyze the impact of time-varying interference conditions on recognition performance. Both simulation results and field measurements demonstrate the rationality and practical relevance of the proposed URC framework.
The URC complements traditional TPR-based evaluation and establishes a reliability-oriented performance assessment paradigm for future radar-based C-UAV systems.
Author Contributions
Conceptualization, Z.S. and J.Y.; methodology, Z.S. and J.Y.; validation, J.Y., D.K. and W.Z.; formal analysis, J.Y.; investigation, J.Y., J.G. and W.Z.; writing—original draft preparation, Z.S., J.Y. and D.K.; writing—review and editing, Z.S., J.Y., and D.K.; visualization, D.L. and D.K.; supervision, D.L., J.G. and W.Z.; project administration, J.Y., D.L. and J.G.; funding acquisition, J.G. All authors have read and agreed to the published version of the manuscript.
Funding
This work was supported by National Natural Science Foundation of China (Grant 42571429) and the National Key R&D Program of China (Grant 2024YFC3015403).
Data Availability Statement
The original contributions presented in this study are included in the article. Further inquiries can be directed to the corresponding author.
Conflicts of Interest
The authors declare no conflict of interest.
References
- Birch, G.C.; Griffin, J.C.; Erdman, M.K. Uas Detection Classification and Neutralization: Market Survey 2015; No. SAND2015-6365; Sandia National Lab. (SNL-NM): Albuquerque, NM, USA, 2015. [Google Scholar]
- Michel, A.H. Counter-drone Systems; Center for the Study of the Drone; Bard College: Annandale-on-Hudson, NY, USA, 2018. [Google Scholar]
- The Sun. Hunting Ground Watch as ‘Kabul Nine’ Crack Ukrainian Drone Unit ‘Tears Up’ Russian-Occupied Territory with Kamikaze Flying Bombs. 15 April 2025. Available online: https://www.thesun.co.uk/news/34483885/ukraine-drone-unit-attacks-russia/ (accessed on 1 March 2026).
- Richards, M.A. Fundamentals of Radar Signal Processing; McGraw-Hill: New York, NY, USA, 2005. [Google Scholar]
- Rahman, S.; Robertson, D.A. In-flight RCS measurements of drones and birds at K-band and W-band. IET Radar, Sonar Navig. 2019, 13, 300–309. [Google Scholar]
- SAAB. Giraffe Elss Uav Detection and Tracking. Available online: https://www.saab.com/products/giraffe-1x (accessed on 5 May 2023).
- Gong, J.; Yan, J.; Li, D.; Kong, D.; Hu, H. Interference of radar detection of drones by birds. Prog. Electromagn. Res. M 2019, 81, 1–11. [Google Scholar] [CrossRef] [Scilit]
- Gong, J.; Yan, J.; Kong, D.; Li, D. Exploring Short-Term Bird Behavior in a Local Area Using Phased-Array Avian Radar. In Proceedings of the 2024 International Radar Conference (RADAR); IEEE: Piscataway, NJ, USA, 2024; pp. 1–6. [Google Scholar]
- Gong, J.; Yan, J.; Li, D.; Chen, R. Comparison of radar signatures based on flight morphology for large birds and small birds. IET Radar Sonar Navig. 2020, 14, 1365–1369. [Google Scholar] [CrossRef] [Scilit]
- Liu, J.; Xu, Q.Y.; Chen, W.S. Classification of bird and drone targets based on motion characteristics and random forest model using surveillance radar data. IEEE Access 2021, 9, 160135–160144. [Google Scholar] [CrossRef] [Scilit]
- Molchanov, P.; Harmanny, R.I.; de Wit, J.J.; Egiazarian, K.; Astola, J. Classification of small UAVs and birds by micro-Doppler signatures. Int. J. Microw. Wirel. Technol. 2014, 6, 435–444. [Google Scholar] [CrossRef] [Scilit]
- Björklund, S. Target detection and classification of small drones by boosting on radar micro-Doppler. In Proceedings of the 2018 15th European Radar Conference (EuRAD); IEEE: Piscataway, NJ, USA, 2018; pp. 182–185. [Google Scholar]
- Kengeskanov, M.; Seghrouchni, A.E.F.; Zitar, R.A.; Barbaresco, F. Drone/Bird Classification Based on Features of Tracks Trajectories. In Proceedings of the 2023 IEEE Aerospace Conference; IEEE: Piscataway, NJ, USA, 2023; pp. 1–8. [Google Scholar] [CrossRef] [Scilit]
- Björklund, S.; Wadströmer, N. Target detection and classification of small drones by deep learning on radar micro-doppler. In Proceedings of the 2019 International Radar Conference (RADAR); IEEE: Piscataway, NJ, USA, 2019; pp. 1–6. [Google Scholar]
- Kruschke, J. Doing Bayesian Data Analysis: A Tutorial with R, JAGS, and Stan; Elsevier: Amsterdam, The Netherlands, 2014. [Google Scholar]
- Schleher, D.C. MTI and Pulsed Doppler Radar; Artech House: Boston, MA, USA, 1991. [Google Scholar]
- Nocedal, J.; Wright, S.J. Numerical Optimization; Springer Science & Business Media: Berlin/Heidelberg, Germany, 2006. [Google Scholar]
- Farina, A.; Pardini, S. Track-while-scan algorithm in a clutter environment. IEEE Trans. Aerosp. Electron. Syst. 2007, AES-14, 769–779. [Google Scholar]
- Gong, J.; Li, D.; Yan, J.; Hu, H.; Kong, D. Using Classify-While-Scan (CWS) Technology to Enhance Unmanned Air Traffic Management (UTM). Drones 2022, 6, 224. [Google Scholar] [CrossRef] [Scilit]
- Liu, J.; Xu, Q.; Su, M.; Chen, W. Activity modeling and characterization for airport bird situation awareness using avian radar datasets. Aerospace 2024, 11, 442. [Google Scholar] [CrossRef] [Scilit]
- Weibel Scientific. XENTA-M SHORAD Radars; Weibel Scientific: Lillerød, Denmark, 2024; Available online: https://www.weibelradars.com/wp-content/uploads/2024/05/XENTA-M-Brochure-2024.pdf (accessed on 4 March 2026).
- Curson, D.R.; Goguen, C.B.; Mathews, N.E. Long-distance commuting by Brown-headed Cowbirds in New Mexico. Auk 2000, 117, 795–799. [Google Scholar] [CrossRef]
- Urmy, S.S.; Warren, J.D. Evaluating the target-tracking performance of scanning avian radars by augmenting data with simulated echoes. Methods Ecol. Evol. 2020, 11, 559–569. [Google Scholar] [CrossRef] [Scilit]
- Chen, W.S.; Huang, Y.F.; Lu, X.F.; Zhang, J. Analysis of bird situation around airports using avian radar. Aeronaut. J. 2021, 125, 2149–2168. [Google Scholar] [CrossRef] [Scilit]
- Ritchie, M.; Peters, N.; Horne, C. Radar UAV and Bird Signature Comparisons with Micro-Doppler; Radar Countermeasures for Unmanned Aerial Vehicles; Clemente, C., Fioranelli, F., Colone, F., Li, G., Eds.; SciTech/IET: London, UK, 2021; pp. 279–314. [Google Scholar]
- Gong, J.; Yan, J.; Kong, D.; Li, D. Introduction to drone detection radar with emphasis on automatic target recognition (ATR) technology. arXiv 2023, arXiv:2307.10326. [Google Scholar] [CrossRef] [Scilit]



Disclaimer/Publisher’s Note: The statements, opinions and data contained in all publications are solely those of the individual author(s) and contributor(s) and not of MDPI and/or the editor(s). MDPI and/or the editor(s) disclaim responsibility for any injury to people or property resulting from any ideas, methods, instructions or products referred to in the content. |
© 2026 by the authors. Licensee MDPI, Basel, Switzerland. This article is an open access article distributed under the terms and conditions of the Creative Commons Attribution (CC BY) license.