


Highlights
What are the main findings?
- Drone operation mode significantly influenced spray performance under simulated canopy conditions. The spinning mode produced the highest spray coverage and droplet density, the standard mode provided the most uniform spatial distribution, and the fruit-tree mode resulted in more localized deposition patterns.
- The parameter combinations associated with the highest responses differed among operation modes, demonstrating that no single configuration maximizes deposition across all spraying strategies.
What are the implications of the main finding?
- Understanding how operational parameters interact provides evidence-based guidance for selecting drone configurations associated with improved spray deposition.
- The results offer practical, data-driven support for configuring spraying drones and can inform future validation under commercial orchard conditions.
Abstract
Unmanned aerial vehicles (UAVs) are an alternative to traditional pesticide applications in orchards. Particularly, drones are an example of UAVs that have increased in popularity in recent years; however, relatively few studies have evaluated how spraying operation modes interact with other drone parameters within a single experimental framework. This study evaluated the effects of operation mode, application volume, flight height, and droplet size on spray coverage, droplet density, droplet spectra, and droplet size uniformity using the spraying drone DJI Agras T40 under a simulated canopy structure. A four-factorial experimental design was used; treatments included three operation modes (i.e., standard mode, fruit-tree mode, and spinning mode), two application volumes (i.e., 37.4 L/ha and 74.8 L/ha), two flight heights (i.e., 3 m and 5 m), and two droplet sizes (i.e., 150 μm and 300 μm). Operation mode was among the most influential factors affecting spray deposition quality. The spinning mode achieved the highest overall spray coverage (20.81%) and droplet density (172.44 drops/cm2), while the standard mode provided the most uniform spatial distribution. Results from the interaction analyses indicated that the parameter combination that produced the highest spray coverage within the tested ranges was an application volume of 74.8 L/ha, a flight height of 3 m, and a droplet size of 150 μm in the standard mode. For the fruit-tree mode, the highest spray coverage was observed at an application volume of 74.8 L/ha, a flight height of 5 m, and a droplet size of 300 μm. For the spinning mode, the combination associated with the highest spray coverage was 74.8 L/ha, 3 m, and 300 μm. In conclusion, the results provide data-driven guidance on how drone operational parameters influence spray deposition and can support future validation under commercial orchard conditions.
1. Introduction
The fruit and vegetable industry is an important segment of the global agriculture, with production increasing steadily in response to rising demand driven by population growth, urbanization, and changing dietary habits [1]. In 2024, global production reached approximately 954 million tonnes of fruit and 1.2 billion tonnes of vegetables [2]. Production is geographically concentrated, with the largest fruit producers being China (29.0%), India (11.8%), the European Union (8.1%), and Brazil (4.4%), while the leading vegetable producers include China (51.1%), India (12.4%), and the European Union (7.1%) [2]. Despite this global expansion and economic importance, fruit and vegetable production continues to experience significant yield losses, particularly due to pests and diseases, which, in some situations, have been reported to reach up to 78% [3,4,5].
Pesticide application is an important component of any integrated pest management (IPM) program, and it is essential for protecting crops from insects, pathogens, and weeds while ensuring consistent yields [4]. However, the overuse and improper application of pesticides raise serious concerns about pest resistance, environmental pollution, production costs, and even human health [5,6,7,8]. Traditional pesticide application methods, such as spraying booms and air-blast sprayers, often result in excessive spray volumes and inconsistent applications commonly reported by growers [6,7]. In contrast, emerging technologies such as unmanned aerial vehicles (UAVs), including spraying drones, provide promising alternatives to conventional systems by enabling a more precise and efficient pesticide delivery [9].
Spraying drones are advanced aerial platforms that can apply pesticides based on pre-set flight routes [10,11]. They can reduce pesticide use through low-volume application, limit operator exposure, access areas difficult for ground sprayers to reach, and decrease water use and labor, ultimately lowering overall operational costs [11,12,13]. Studies have reported that drone-based applications can be as effective as, or sometimes more effective than, traditional methods. The highly efficient application of pesticides using spraying drones is mostly due to the equipment’s ability to enhance deposition in the upper and hard-to-reach areas [9,14]. Despite spraying drones being reported to have similar effectiveness in pesticide application to air-blast and high-pressure sprayers [9], research in almond orchards has indicated that spraying drones deliver better droplet deposition at the top of the canopy than ground sprayers. Particularly, spraying drones were reported to have the best overall spray coverage [14]. At the same time, a recent study evaluating drone spray applications for downy mildew management in grapevine canopies under simulated conditions highlighted both the potential and current limitations of drone spraying systems. The authors reported that drone-based applications can achieve disease control comparable to traditional sprayers during early growth stages, while delivering insufficient deposition in the lower canopy and bunch zones at later stages [15].
To better understand these variable outcomes, substantial progress has been made worldwide in evaluating drone spray applications in orchard systems [9,15,16]. Numerous studies have investigated canopy deposition characteristics, spray penetration, and parameter optimization in crops such as citrus [16], apple [17], and peach [18], expanding understanding of how operational settings influence spray distribution. Droplet deposition and spraying efficiency are affected by several drone operational parameters, including spray volume [19], droplet size [20], flight height [21], and flight speed [22]. For example, increasing application volume from 12 to 18 L/ha improved spray coverage, density, droplet distribution, and droplet diameter in the upper canopy layer of papaya when using a DJI T10 drone [23]. Similarly, Guo et al. [24] reported that increasing spray volume from 45 to 90 L/ha enhanced droplet deposition in Nanguo pear trees using a DJI T20. Tang et al. [25] demonstrated that a flight height of 1.2 m combined with a flight speed of 3.5 m/s improved droplet density and coverage in citrus orchards. Zhang et al. [26] identified optimal parameter combinations for sugarcane, including an application volume of 15 L/ha, a flight height of 3 m, and a flight speed of 4 m/s.
To improve spray application efficiency in fruit tree canopies, drone manufacturers have introduced spraying operation modes specifically designed for orchards [17,27]. These operation modes use image processing to identify each tree’s canopy and enable targeted spraying [28]. Instead of a continuous row-based application, the drone hovers over each fruit tree and applies the spray directly to the canopy, reducing off-target losses between trees and potentially improving penetration in dense foliage [24]. However, standardized experimental comparisons evaluating how manufacturer-defined spraying operation modes interact with key drone parameters under controlled conditions remain relatively limited [23,29]. Such systematic assessments are necessary to isolate how different operation modes influence deposition responses and spatial spray deposition patterns.
Thus, the objective of this study was to evaluate the effects of drone operational parameters (i.e., operation mode, application volume, flight height, and droplet size) on spray coverage, droplet density, droplet spectra, and droplet size uniformity using a DJI Agras T40 spraying drone. The goal was to identify parameter combinations associated with higher deposition responses and to analyze the spatial variability of spray deposition across positions within the simulated canopy. Ultimately, the study aimed to provide practical guidance for configuring orchard-spraying drones to enhance spray performance and support more precise, potentially more efficient pesticide applications.
2. Materials and Methods
2.1. Experimental Equipment
A DJI Agras T40 drone sprayer (SZ DJI Technology Co., Shenzhen, China) was used for all spraying experiments. The DJI Agras T40 is an eight-motor coaxial multi-rotor platform equipped with a dual-atomized spraying system and an omnidirectional radar coupled with a terrain-following system, allowing it to manage inclines of up to 30°. The drone measures 2800 mm × 3150 mm × 780 mm (L × W × H) and weighs 38 kg without a battery and 50 kg with a battery installed. It is powered by a 30,000 mAh battery and equipped with a 40 L spray tank. The system can operate at a maximum flight speed of 10 m/s and produce droplets ranging from 50 to 500 μm. The spraying system provides a maximum effective spray width of approximately 11 m at a flight altitude of 2.5 m and a forward speed of 7 m/s, with a maximum flow rate of 6 L/min per nozzle. The maximum hovering time without a payload is approximately 18 min, while hovering and spraying with a full tank allows approximately 7 min of operation. The maximum operational flight radius is 2000 m, and the platform is rated for wind resistance up to 6 m/s [30].
The DJI Agras T40 was operated with a GNSS mobile base station (Model D-RTK 2, SZ DJI Technology Co., Shenzhen, China), achieving horizontal and vertical accuracies within ±10 cm. Flight control and spray management were conducted using the DJI Agras intelligent remote controller, which is integrated with flight planning software. Additionally, orthomosaics of the test area were generated using DJI Terra software (version 4.3.0; SZ DJI Technology Co., Shenzhen, China) to facilitate flight planning.
2.2. Experimental Conditions
Experimental applications were conducted at the Auburn University Turfgrass Unit in Auburn, AL (32°34′41.58″ N, 85°30′3.73″ W) on 12 and 30 July 2024. Prior to the experimental applications, flight tests were conducted to verify route execution, spray release, and system functionality. These tests ensured that the programmed flight parameters, including operation mode, application volume, flight height, and droplet size, were correctly implemented before data collection began.
The experimental site was flat and open, measuring 120 m in length and 20 m in width, with a uniform synthetic grass surface to minimize surface roughness variability. Meteorological parameters, including wind speed (m/s), air temperature (°C), and relative humidity (%) during the period of the experiment, were recorded at 10 s intervals using a Kestrel 5500 weather meter (Kestrel Instruments, Boothwyn, PA, USA). The instrument was installed on a tripod at a height of 1.8 m above ground level and positioned 50 m away from the downwind end of the sampling area to minimize potential interference of rotor-induced airflow and to ensure measurement of ambient field conditions. Across application periods, wind speed remained below 2 m/s, and wind direction did not exceed ±15°. Air temperature ranged from 26.1 to 29.9 °C, and relative humidity ranged from 65.3 to 88.5%. Average meteorological values for each application day are presented in Table 1. All applications were performed in accordance with the DJI Agras T40 user guide [30] and ASAE S386.2 FEB1998 (R2018) [31].
Table 1.
Average of meteorological conditions during the application days.
2.3. Drone Operation Modes
Three manufacturer-defined spraying operation modes on the DJI Agras T40 platform were evaluated: standard, fruit-tree, and spinning modes.
In the standard mode, the treatment area was programmed directly through the DJI intelligent remote controller. The flight path was defined as a linear pass over the simulated canopy structures. The drone performed continuous forward flight at a constant speed of 4 m/s, and spray was released continuously during forward flight at a rate corresponding to the assigned application volume (37.4 or 74.8 L/ha). No hovering or rotational movement occurred in this operation mode.
For the fruit-tree and spinning modes, aerial images of the experimental area were acquired using a Mavic 3M drone (SZ DJI Technology Co., Shenzhen, China). The images were processed in DJI Terra software (version 4.3.0) to generate a three-dimensional model of the simulated canopy structures. The geometric center of each structure was identified within the software, and a hover-based flight path was generated. The programmed mission was uploaded to the cloud and transferred to the DJI Agras T40 remote controller. Before spraying, the mission plan was manually reviewed and field-verified to ensure accurate positioning over each structure.
In the fruit-tree mode, the drone autonomously navigated to predefined geographic coordinates located at the center of each simulated canopy structure and hovered at the assigned flight height (3 or 5 m above ground level). Spray release was continuous during hovering for approximately 10 s per target point. No rotational movement occurred during spray release. After completing the spray application at one location, the drone transitioned to the next programmed point until all target structures were treated.
In the spinning mode, the drone followed the same predefined hover-point configuration as used in fruit-tree mode but rotated about its vertical axis during spray release. Rotation was performed using the manufacturer’s default setting for orchard applications. Hover duration remained approximately 10 s per target point, and spray release was maintained according to the assigned flight height and application volume treatments. After completing rotational spraying at each location, the drone proceeded to the next programmed coordinate.
2.4. Experimental Design
A four-factorial experimental design was used to evaluate the effects of flight height (i.e., 3 and 5 m above ground level), droplet size (i.e., 150 and 300 µm), application volume (i.e., 37.4 and 74.8 L/ha), and operation mode (i.e., standard, fruit-tree, and spinning) on spray coverage, droplet density, droplet spectra, and droplet size uniformity.
The experimental unit was defined as one simulated canopy structure receiving a single treatment combination. A total of 24 treatment combinations were evaluated (Table 2). Each treatment was applied once to each of four spatially separated simulated canopy structures, resulting in four independent replicates per treatment (n = 4). Operational parameters were selected based on manufacturer recommendations for orchard applications and the ASABE S572.1 standard [32]. Droplet sizes used in this study (i.e., 150 and 300 µm) represent typical recommendations for insecticide and fungicide applications under aerial spraying [33,34].
Table 2.
Treatment combinations of operation mode (fruit-tree, spinning, and standard), application volume (37.4 and 74.8 L/ha), flight height (3 and 5 m), and droplet size (150 and 300 µm), evaluated during drone spraying applications, totaling 24 treatments.
2.5. Experimental Layout
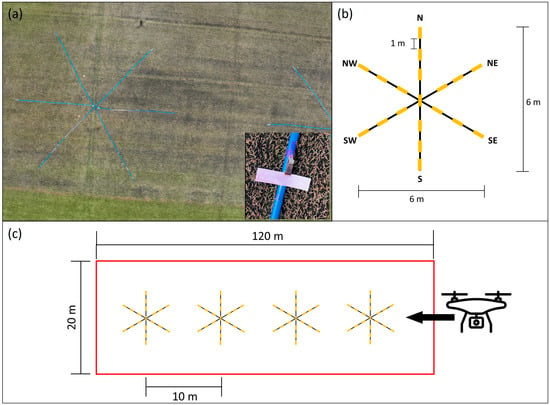
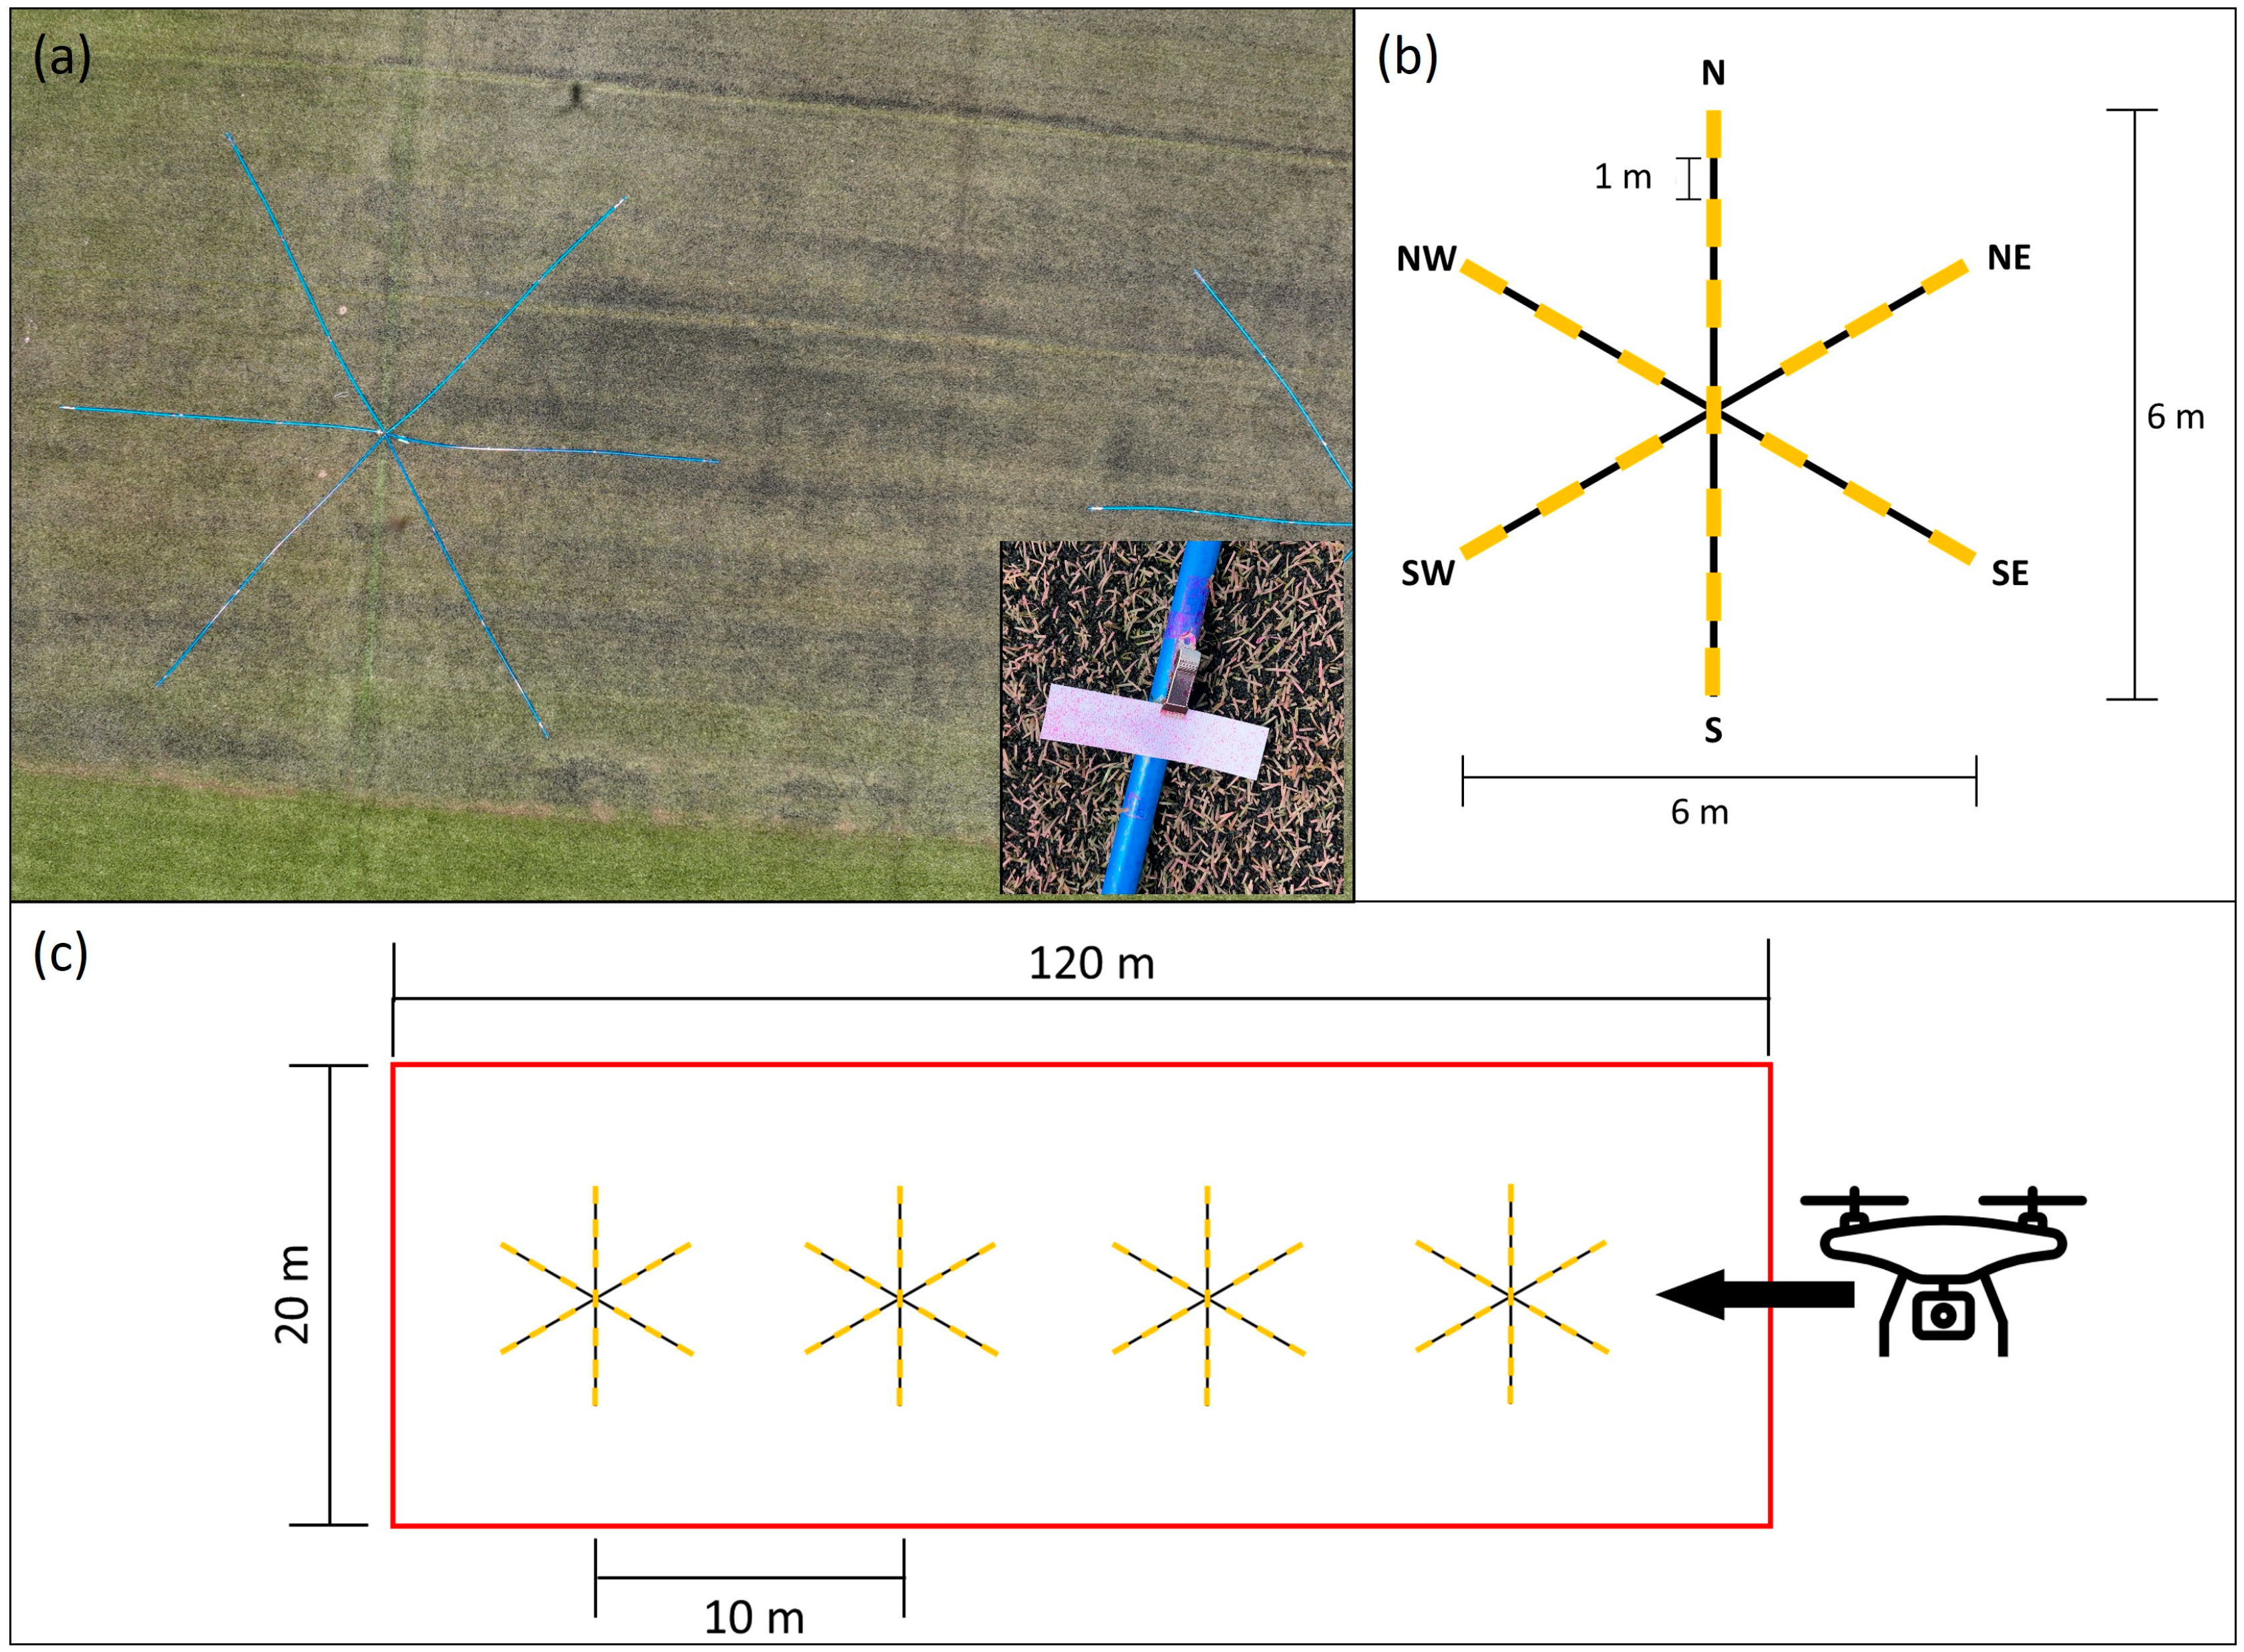
The experimental layout consisted of four spatially separated simulated canopy structures installed within the 120 m × 20 m experimental area. Each structure was constructed using three 6 m-long PVC tubes arranged radially at 60° intervals and secured to the ground with metal stakes to ensure structural stability (Figure 1a). The resulting configuration formed a circular sampling area with a diameter of 6 m.
Figure 1.
Experimental setup and spatial configuration of the simulated canopy structures used for spray deposition assessment. (a) Aerial view of one simulated canopy structure installed on the synthetic turf surface; the inset shows a close-up of a KWP card placed on the PVC framework. (b) Schematic top view of the 6 m diameter structure illustrating the radial arrangement of KWP cards at distances of 1 m, 2 m, and 3 m from the center along six compass directions (north, northeast, northwest, south, southeast, and southwest), in addition to one central card (nineteen cards per structure). (c) Field layout of the 120 m × 20 m experimental area showing four independent structures spaced 10 m apart (center-to-center) along the drone flight path; the arrow indicates the direction of drone movement during application.
Kromekote white paper (KWP) cards (101.6 × 25.4 mm; glossy C/1S, 8 pt cover, 170 g/m2, brightness 89; The Paper Mill Store, Neenah, WI, USA) were attached to the PVC tubes using alligator clips secured with double-sided adhesive tape. The coated surface of each card faced upward to capture spray deposition. Within each structure, cards were placed at predefined radial distances of 1 m, 2 m, and 3 m from the center along six compass directions (north, northeast, northwest, south, southeast, and southwest), in addition to one central card, resulting in 19 sampling positions per structure (Figure 1b). These cards were treated as subsampling units to characterize spatial variability in spray deposition within each experimental unit.
The four simulated canopy structures were spaced 10 m apart (center-to-center distance) along the drone flight path to serve as independent replications within the experimental area (Figure 1c). Preliminary tests were conducted prior to the experiment, and no cross-contamination among structures was visually observed under the experimental conditions. The KWP cards were selected due to their widespread use as standardized collectors for droplet deposition analysis and their documented suitability for estimating spray coverage and droplet density [35,36,37].
2.6. Data Collection and Processing
Prior to treatment applications, aerial images of the experimental area were captured to support flight planning using the DJI Agras intelligent remote controller. The programmed flight path was reviewed and manually adjusted to ensure precise alignment with the simulated canopy structures. The spray tank was filled to 20 L (50% of its 40 L capacity) with a water-based solution containing Vision Pink™ dye (GarrCo Products, Converse, IN, USA) at a concentration of 20 mL/L, which was used for all treatment applications. The drone flew perpendicular to the prevailing wind direction (±15° tolerance). In standard mode, spray release began 10 m before reaching the target structure and continued for 10 m beyond it to ensure steady-state flow conditions during deposition over the sampling area. In fruit-tree and spinning modes, the drone hovered for approximately 10 s at each target location before transitioning to the next programmed point. Following each treatment application, KWP cards were collected, placed in pre-labeled adhesive note blocks, sealed in plastic bags containing silica desiccant pouches, and transported to the laboratory to prevent moisture contamination.
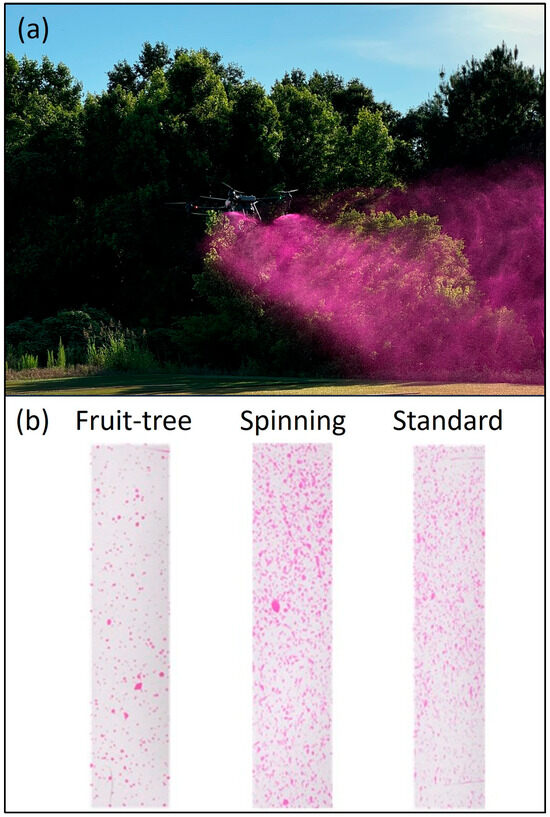
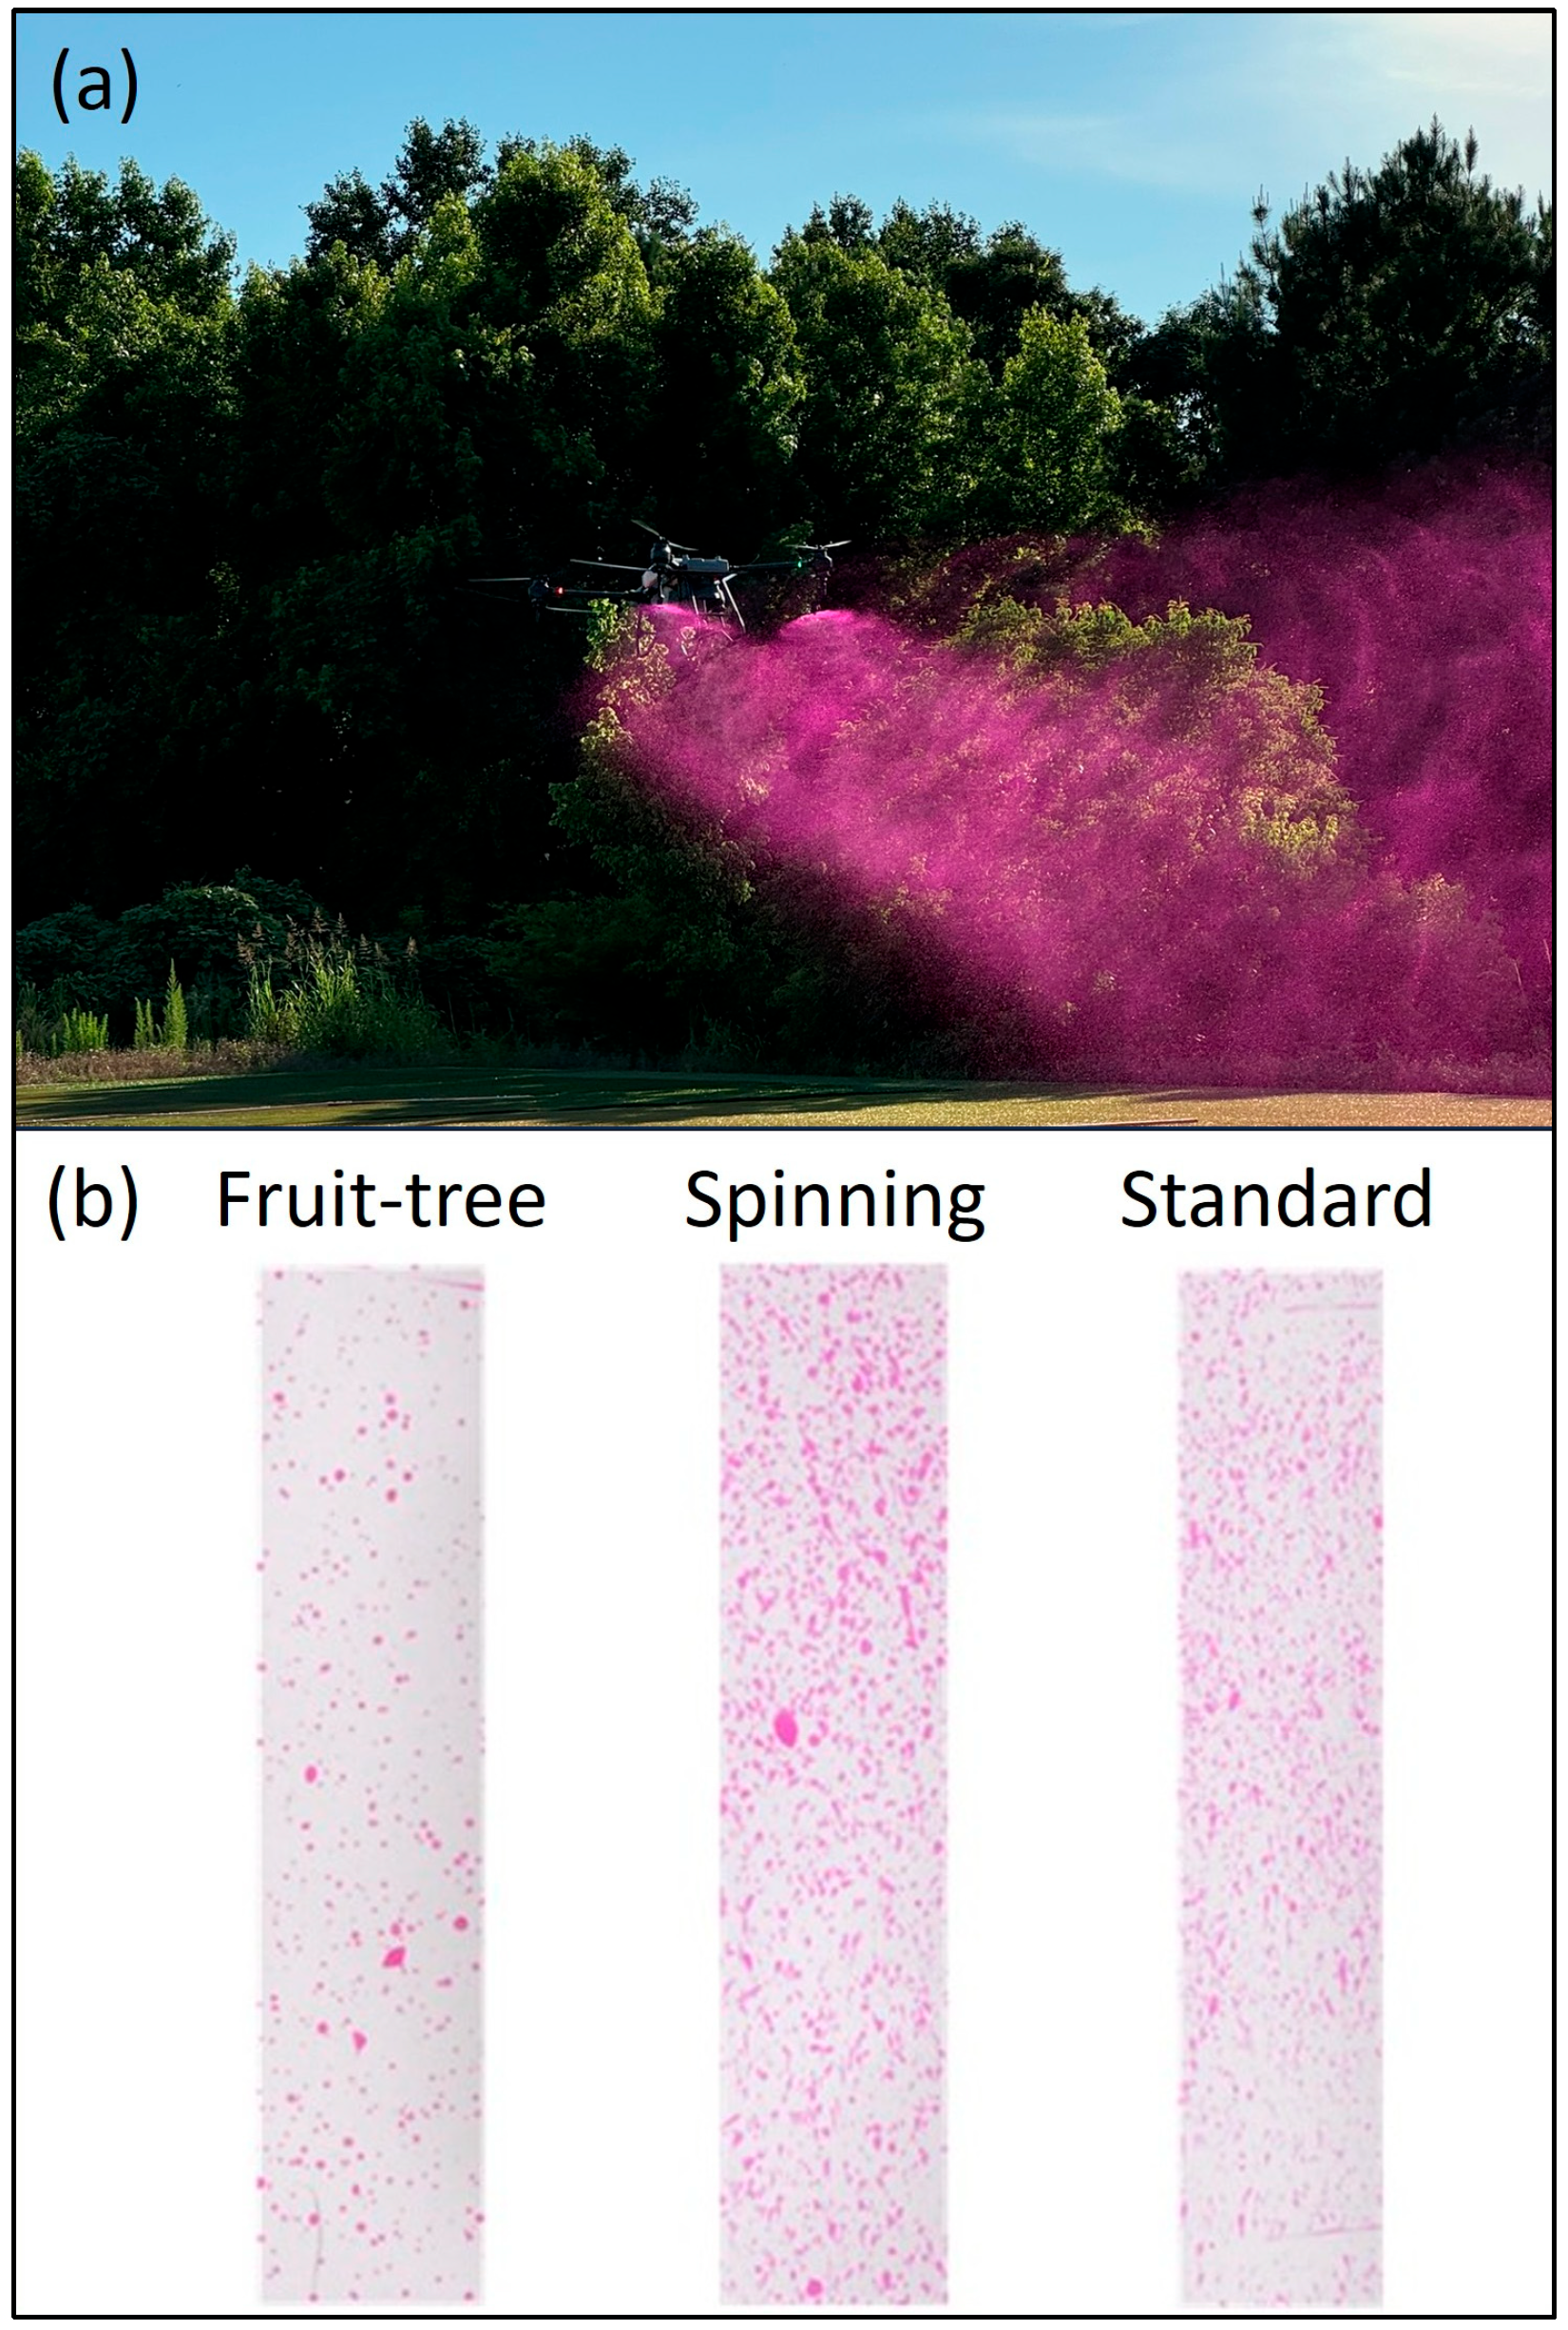
A representative image of the drone during applications is shown in Figure 2a.
Figure 2.
(a) Drone in flight during application of the water-based solution containing Vision Pink™ dye over the simulated canopy structures under field experimental conditions. (b) Examples of digitalized KWP cards demonstrating differences in droplet deposition patterns among spinning, standard, and fruit-tree drone operation modes.
The KWP cards were scanned using an Epson Perfection V39II flatbed scanner (Epson America Inc., Long Beach, CA, USA). All cards were scanned at 1200 dpi in color (8-bit RGB) and saved as uncompressed TIFF files to prevent loss of detail [33]. Before scanning, the scanner glass was cleaned, and each card was placed face down on the scanner bed in a consistent orientation, with the long axis of the card aligned parallel to the scanner’s short axis. Cards were carefully positioned and visually aligned against the scanner edges with sufficient spacing to ensure they did not touch each other or the scanner borders, minimizing potential rotation or translation during image acquisition. Automatic color correction and image enhancement functions were disabled to ensure uniform acquisition conditions across all samples. Scanned images were imported into AccuStain software (Version 0.32, developed by Matt Gill, University of Illinois Urbana-Champaign, Champaign, IL, USA) [38]. The “White Card” setting was selected for analysis, and the following parameters were applied: hue range 200–255; saturation range 50–255; brightness range 0–255; analysis area 60%; spread factors A: 0.0000, B: 0.0009, and C: 1.6333; watershed segmentation enabled; minimal pixels per stain set to 4; minimum circularity set to 0; and droplet diameter determined using the equivalent projected circle (EQPC) method. These parameters correspond to the default settings of the AccuStain “White Card” configuration and were applied without modification to ensure standardized and reproducible droplet detection across all samples. All images were processed using identical parameter settings to ensure analytical consistency.
The AccuStain software automatically generated spray deposition metrics, including spray coverage, droplet density, droplet spectra, and relative span factor (RSF) [33,38]. Representative digitized KWP cards are provided in Figure 2b.
Spray coverage (%) was calculated as the ratio of the spray deposit area to the total area analyzed on the KWP cards [38]. Droplet density (drops/cm2) was determined by counting the number of droplets deposited per unit area on the KWP cards [38]. The spray droplet spectrum (μm) parameters, including Dv0.1, Dv0.5 (also known as Volume Median Diameter or VMD), and Dv0.9, were also determined, in which Dv0.1 indicates that 10% of the spray volume consists of droplets smaller than Dv0.1. For example, if Dv0.1 is 200 μm, then 10% of the spray volume includes droplets with diameters of 200 μm or less. Dv0.9 indicates the droplet diameter where 90% of the spray volume consists of droplets smaller than Dv0.9. Dv0.5 is the midpoint of the droplet size distribution, meaning half of the spray volume comprises droplets smaller than Dv0.5, and the other half comprises larger droplets [38]. Droplet size uniformity was determined by the RSF, calculated according to Equation (1) [38].
2.7. Statistical Analysis
Data was analyzed using a generalized linear mixed model with the PROC GLIMMIX procedure in SAS (version 9.04; SAS Institute Inc., Cary, NC, USA). Flight height, droplet size, application volume, operation mode, and their interactions were used as fixed effects in the analysis of spray coverage, droplet density, droplet spectra (Dv0.1, Dv0.5, Dv0.9), and droplet uniformity (RSF). The four simulated canopy structures in the experimental area were included in the model as a random effect (block factor) because they represented spatial replicates within the experimental area rather than treatment levels of primary interest, allowing the model to account for variability among structures while focusing inference on the fixed treatment factors. Within each structure, 19 KWP cards were used to capture positional variability in deposition; these observations were treated as subsamples and contributed to estimating within-block variation rather than as independent experimental units. Before conducting the analysis of variance (ANOVA), the assumptions of normality and homogeneity of variance were evaluated using the Shapiro–Wilk test and Levene’s test, respectively. Variables that did not meet these assumptions were subjected to logarithmic transformation [log(x + 1) or log(x)], which was used to stabilize variance, reduce the influence of extreme values, and improve the symmetry of positively skewed distributions usually observed in spray deposition and droplet spectrum data [39]. After transformation, the same tests were repeated to confirm that the transformed variables satisfied the assumptions required for parametric analyses. Variables requiring transformation included droplet density [log(x + 1)] and droplet spectrum parameters [log(x)], whereas spray coverage and droplet uniformity (RSF) met the assumptions in their original scale. All analyses were conducted assuming a Gaussian distribution with an identity link function, using transformed or original variables as appropriate. An ANOVA was conducted to evaluate the significance of the fixed effects and their interactions. When the F-value from the ANOVA was significant, least-squares means comparisons were performed to identify differences among treatments, using Tukey’s test with a p-value of 0.05.
To further characterize spatial deposition patterns, spray distribution plots were generated to assess positional effects of operation mode on spray coverage within a representative simulated canopy structure. Sampling positions included the center and six compass directions: southeast (SE), southwest (SW), south (S), northeast (NE), northwest (NW), and north (N). Deposition responses were also summarized according to radial zones corresponding to inner (1 m), middle (2 m), and outer (3 m) distances from the center.
3. Results
3.1. Spray Coverage
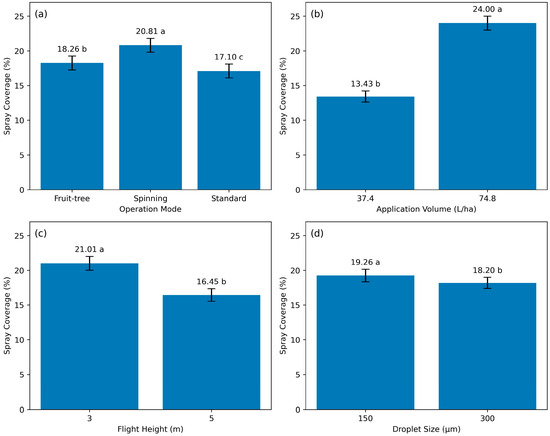
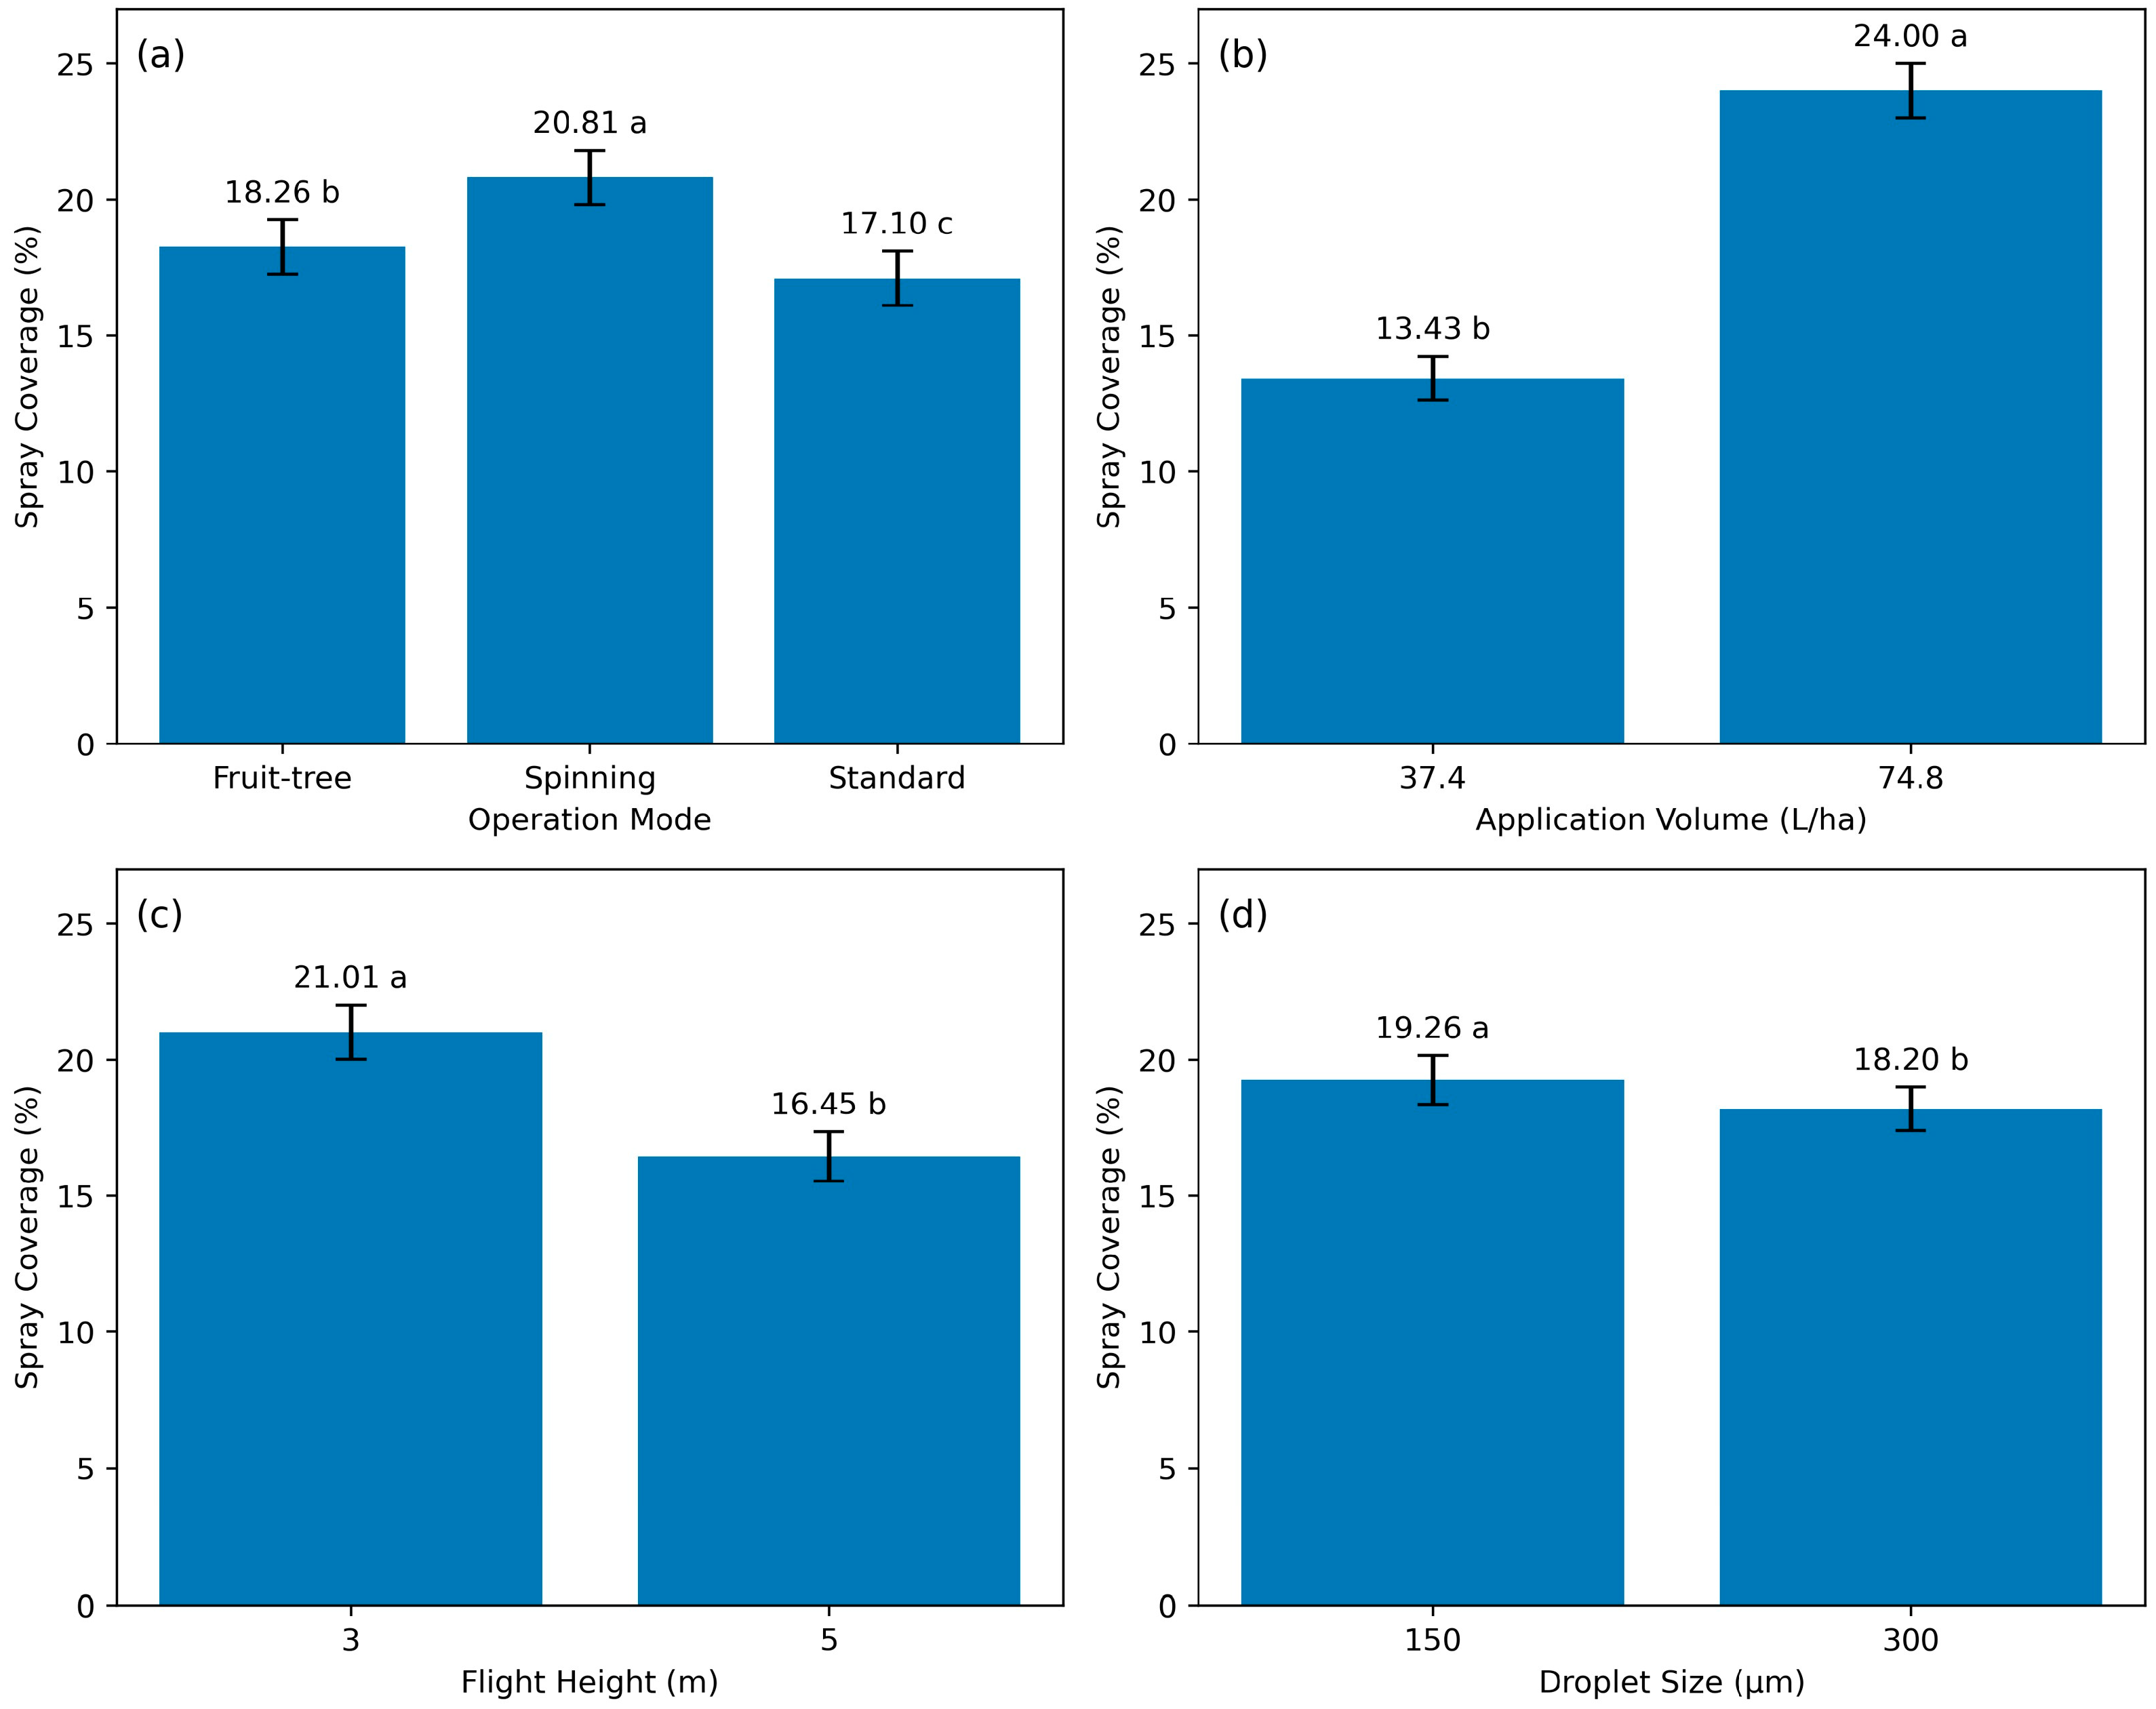
Initial analysis indicated that the main effects of operation mode (F = 22.49, p < 0.0001), application volume (F = 500.98, p < 0.0001), flight height (F = 96.12, p < 0.0001), and droplet size (F = 5.67, p ≤ 0.05) were all statistically significant for spray coverage (Figure 3). In general, operation mode is the most important factor influencing decision-making for spraying drones [23], and the results indicated that the spinning mode had the highest spray coverage (20.81%), followed by the fruit-tree mode (18.26%), with the standard mode resulting in the lowest spray coverage (17.10%).
Figure 3.
Main effects of (a) operation mode, (b) application volume, (c) flight height, and (d) droplet size on spray coverage. Similar lowercase letters indicate no significant differences among or between treatments, as determined by Tukey’s test (p > 0.05).
The main effect of application volume indicated that the high application volume (74.8 L/ha) resulted in greater spray coverage than the low application volume (37.4 L/ha). In contrast, the flight height of 3 m provided greater spray coverage than the flight height of 5 m. Droplet size treatments required small droplet sizes (150 µm) to increase spray coverage compared to large droplet sizes (300 µm).
Analysis of interaction effects on spray coverage showed no significant difference for the four-way interaction among operation mode, application volume, droplet size, and flight height (F = 2.00, p > 0.05). However, there were significant three-way interactions among operation mode, droplet size, and application volume (F = 98.70, p < 0.0001); operation mode, droplet size, and flight height (F = 36.16, p < 0.0001); and operation mode, application volume, and flight height (F = 64.66, p < 0.0001). Given the importance of operation mode on spraying programs, the three-way interactions were further analyzed within each operation mode to facilitate interpretation and support operational recommendations. Table 3 summarizes the interaction effects between droplet size and application volume, droplet size and flight height, and application volume and flight height within each operation mode (i.e., spinning, fruit-tree, and standard).
Table 3.
Effects of significant interactions between droplet size and application volume, between droplet size and flight height, and between application volume and flight height, each evaluated within operation mode, on spray coverage (%). Similar lowercase letters within the same column (application volume or flight height) indicate no significant differences among rows (droplet size or flight height) within each operation mode, as determined by Tukey’s test (p > 0.05). Similar uppercase letters within the same row (droplet size or flight height) indicate no significant differences among columns (application volume or flight height) within each operation mode, as determined by Tukey’s test (p > 0.05).
For the interaction of droplet size and application volume (Table 3), spray coverage with 150 µm droplet size in the fruit-tree mode increased significantly from 11.51% at 37.4 L/ha to 23.10% at 74.8 L/ha. Still, for the fruit-tree mode, spray coverage with a 300 µm droplet size increased from 18.48% at 37.4 L/ha to 19.96% at 74.8 L/ha. In the spinning mode, the droplet size of 150 µm had no significant difference in spray coverage for the application volumes of 37.4 L/ha and 74.8 L/ha; contrarily, the droplet size of 300 µm increased spray coverage from 13.10% at 37.4 L/ha to 28.22% at 74.8 L/ha. In the standard mode, the droplet size of 150 µm increased spray coverage from 6.43% at 37.4 L/ha to 32.41% at 74.8 L/ha. Spray coverage using a droplet size of 300 µm also increased significantly, from 11.70% to 17.64%, with increasing application volumes.
For the interaction between droplet size and flight height within each operation mode (Table 3), spray coverage with the 150 µm droplet size decreased significantly from 19.68% at 3 m to 14.91% at 5 m in the fruit-tree mode. When the droplet size increased to 300 µm, spray coverage was statistically similar between the two flight heights (19.05% at 3 m and 19.39% at 5 m). In the spinning mode, the droplet size of 150 µm had similar spray coverage at both flight heights (20.65% at 3 m and 21.28% at 5 m), while 300 µm droplets had a significant decrease in spray coverage from 27.16% at 3 m to 14.16% at 5 m. In the standard mode, spray coverage using 150 µm droplet size decreased from 22.40% at 3 m to 16.66% at 5 m, and declined from 17.12% at 3 m to 12.23% at 5 m using 300 µm droplet size.
The interaction between application volume and flight height led to different responses in spray coverage within operation mode treatments. In the fruit-tree mode, spray coverage using 37.4 L/ha decreased from 19.05% at 3 m to 10.95% at 5 m; however, using 74.8 L/ha, spray coverage had no significant differences between flight height treatments, with values of 19.68% at 3 m and 23.36% at 5 m. In the spinning mode, spray coverage using 37.4 L/ha was statistically the same for both flight heights (15.82% at 3 m and 16.55% at 5 m), but there was a significant reduction in spray coverage from 31.99% at 3 m to 18.89% at 5 m when 74.8 L/ha was used. In the standard mode, as flight height increased, spray coverage decreased within both application volume treatments. Spray coverage reductions ranged from 10.35% to 7.74 at 37.4 L/ha for the flight height of 3 m and from 28.95% to 21.10% at 74.8 L/ha for the flight height of 5 m.
3.2. Droplet Density
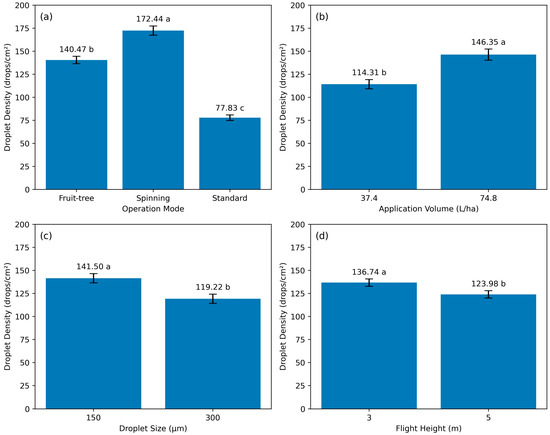
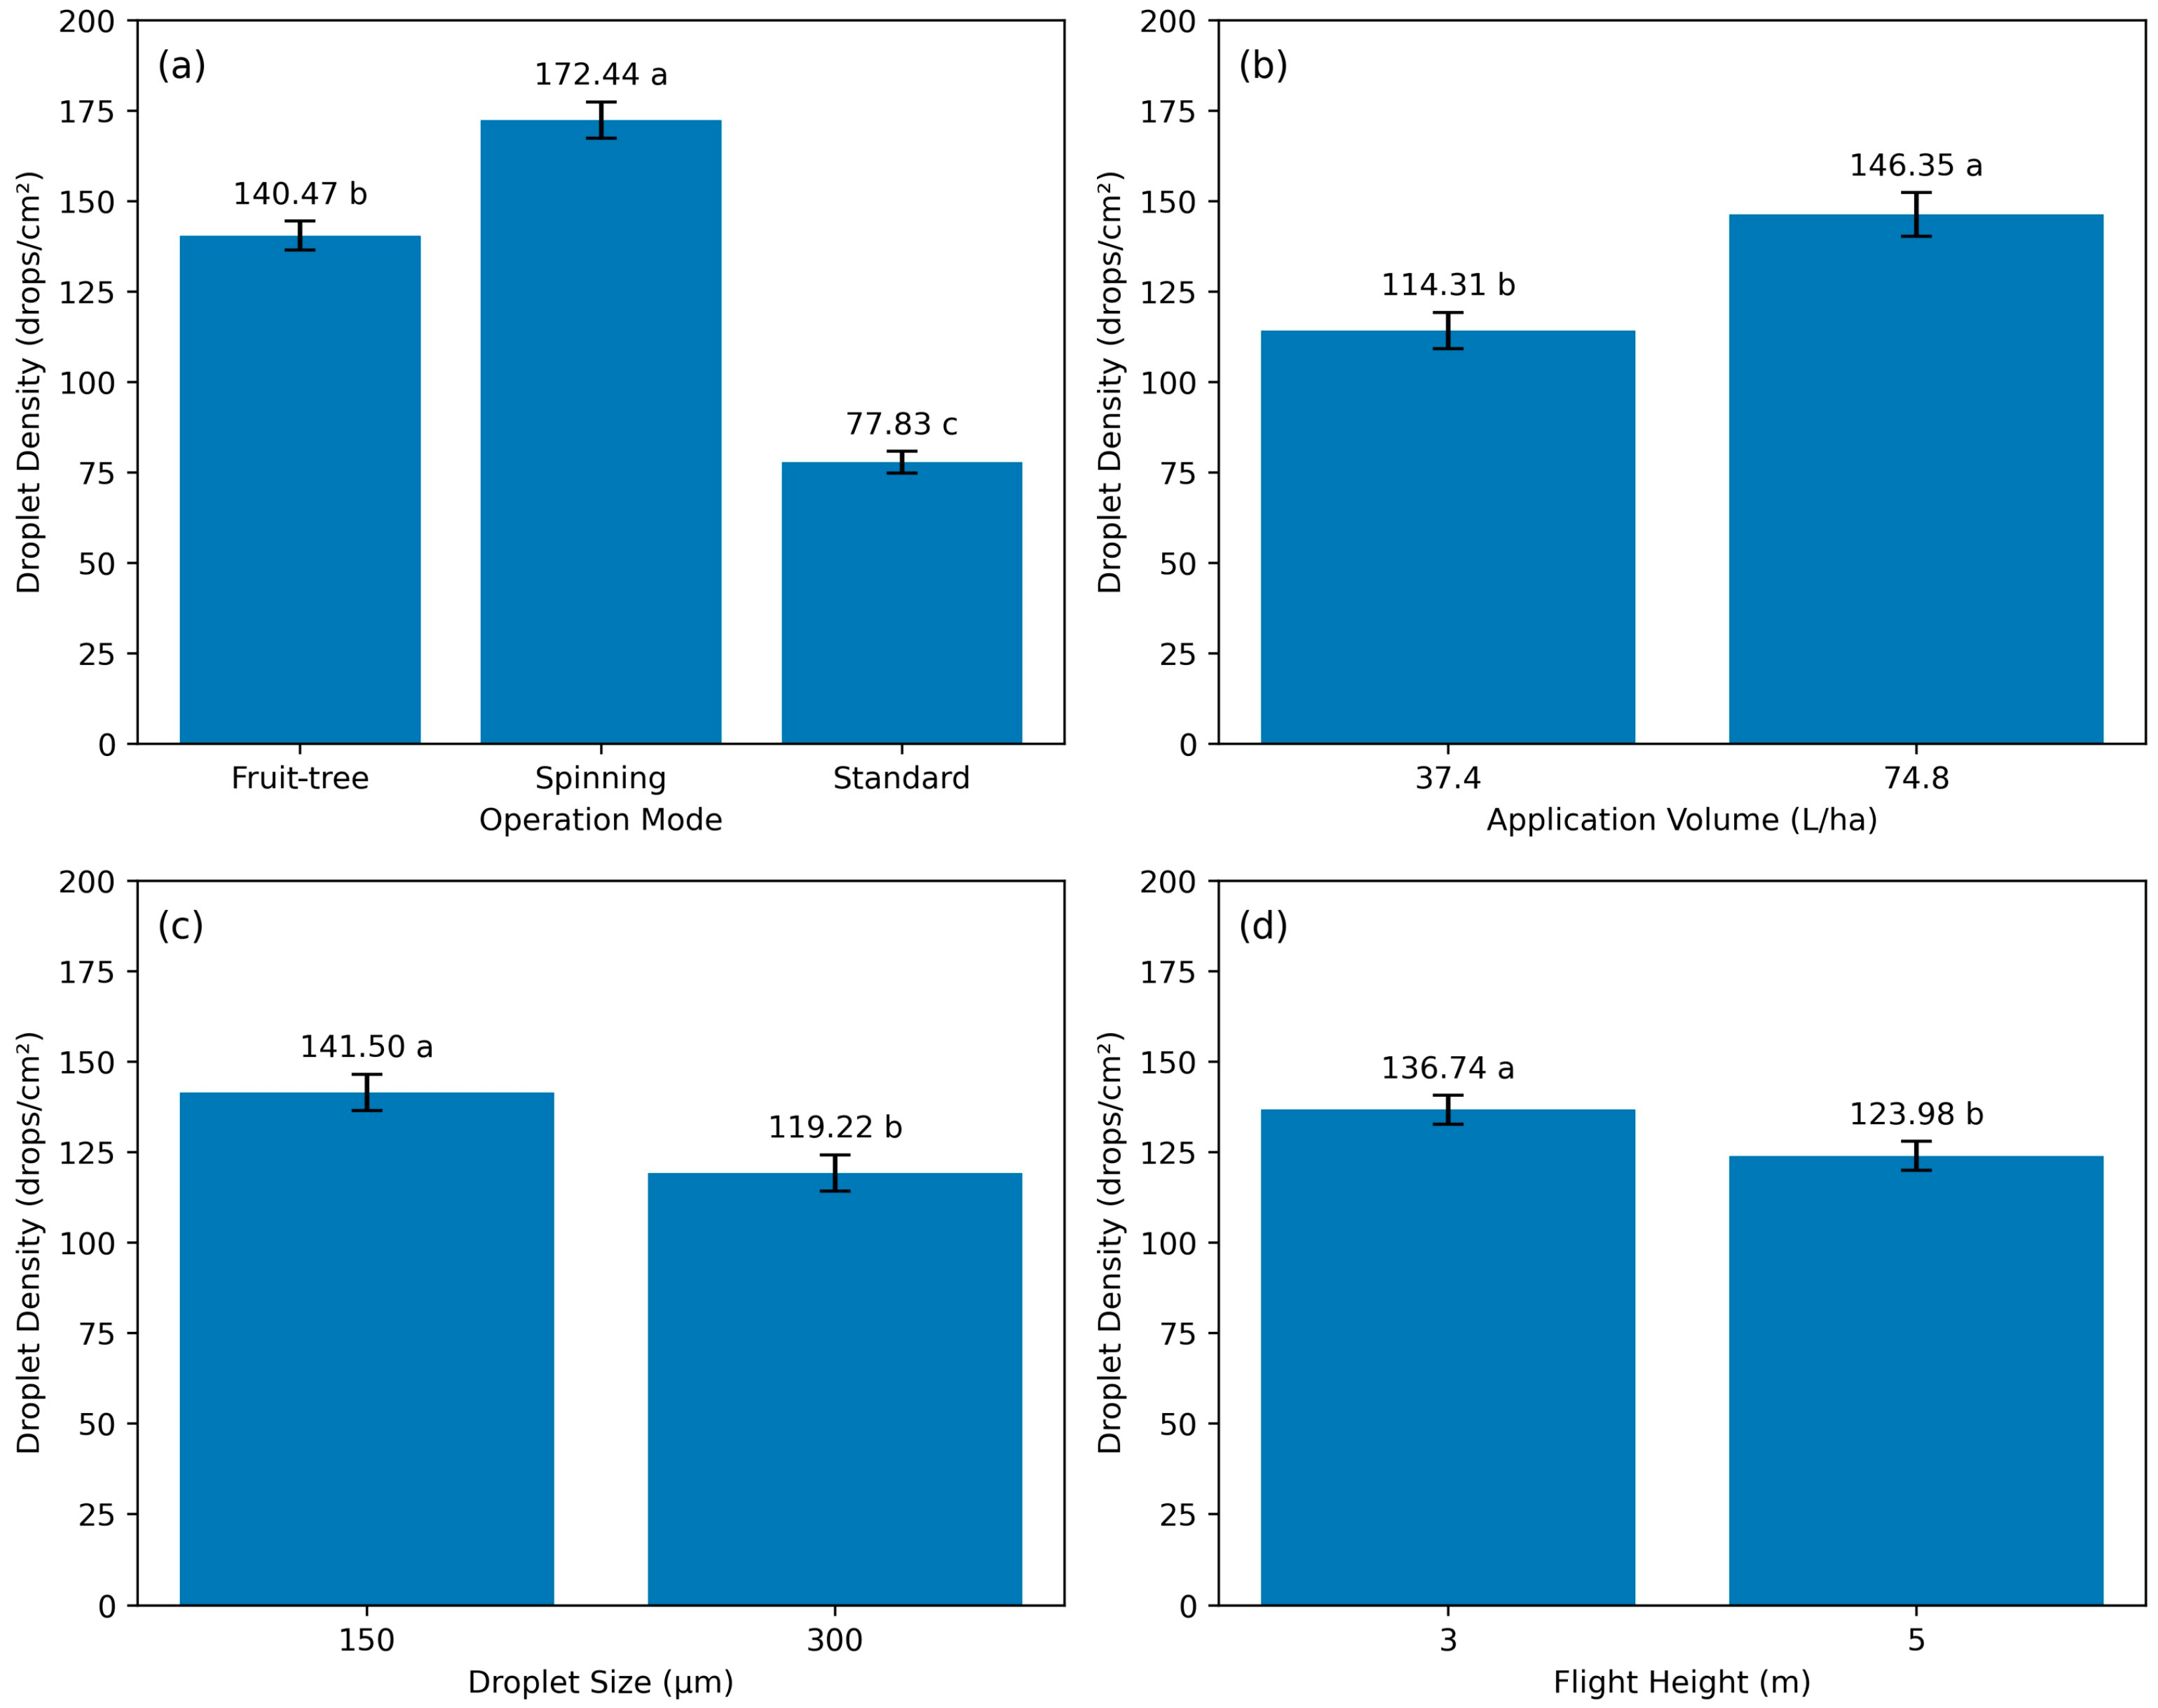
The main effects of operation mode (F = 131.36, p < 0.0001), application volume (F = 44.36, p < 0.0001), flight height (F = 6.86, p ≤ 0.01), and droplet size (F = 20.93, p < 0.0001) had statistically significant differences on droplet density (Figure 4).
Figure 4.
Main effects of (a) operation mode, (b) application volume, (c) droplet size, and (d) flight height on droplet density. Similar lowercase letters indicate no significant differences among or between treatments, as determined by Tukey’s test (p > 0.05).
For the main effect of operation mode, the spinning mode resulted in the highest droplet density (172.44 drops/cm2), followed by the fruit-tree mode (140.47 drops/cm2) and the standard mode (77.83 drops/cm2). For the main effect of application volume, the application volume of 74.8 L/ha led to a higher droplet density (146.35 drops/cm2) than the application volume of 37.4 L/ha, which resulted in 114.31 drops/cm2. For the main effect of droplet size, the droplet size of 150 µm had a higher droplet density (141.50 drops/cm2) than using a droplet size of 300 µm (119.22 drops/cm2). Ultimately, the flight height of 3 m resulted in a greater droplet density (136.74 drops/cm2) compared to the flight height of 5 m (123.98 drops/cm2), for the main effect of flight height.
Despite significant main effects on droplet density, the analysis of interaction effects indicated that droplet density had no significant difference on the four-way interaction among operation mode, application volume, droplet size, and flight height (F = 2.44, p > 0.05). However, significant three-way interactions on droplet density were measured among operation mode, droplet size, and application volume (F = 15.15, p < 0.0001), as well as operation mode, application volume, and flight height (F = 3.13, p ≤ 0.05). Given the consistent influence of operation mode on droplet density, the significant three-way interactions were further analyzed within each operation mode to improve the interpretation of results and guide operational recommendations.
Table 4 presents the interaction effects between application volume and droplet size and between application volume and flight height evaluated within each operation mode (i.e., spinning, fruit-tree, and standard). For the interaction between application volume and droplet size within the fruit-tree mode, an application volume of 37.4 L/ha resulted in a higher droplet density for 300 µm droplet size (143.65 drops/cm2) than for a droplet size of 150 µm (116.37 drops/cm2). Using an application volume of 74.8 L/ha, the droplet density for both droplet sizes showed no statistically significant difference. In the spinning mode, the application volume of 37.4 L/ha resulted in a significantly higher droplet density for the droplet size of 150 µm (183.08 drops/cm2) than for the droplet size of 300 µm (138.48 drops/cm2). When the application volume increased from 37.4 L/ha to 74.8 L/ha, droplet density increased to 193.05 drops/cm2 for 150 µm droplet size and 175.17 drops/cm2 for 300 µm droplet size, still within the spinning mode. Ultimately, droplet density had no significant difference among droplet sizes with the application volume of 37.4 L/ha, but it was the highest for the droplet size of 150 µm (154.29 drops/cm2) with the application volume of 74.8 L/ha, in the standard mode. When application volume was compared within droplet size for the standard mode, droplet density was highest at 74.8 L/ha for the 150 µm droplet size, but no significant difference in application volume was observed for the 300 µm droplet size.
Table 4.
Effects of the significant interactions between application volume and droplet size, and between application volume and flight height, each evaluated within operation mode, on droplet density (drops/cm2). Similar lowercase letters within the same column (droplet size or flight height) indicate no significant differences among rows (application volumes) within each operation mode, as determined by Tukey’s test (p > 0.05). Similar uppercase letters within the same row (application volume) indicate no significant differences among columns (droplet sizes or flight heights) within each operation mode, as determined by Tukey’s test (p > 0.05).
The interaction between application volume and flight height was also significantly different within operation modes (Table 4). For the fruit-tree mode, droplet density was higher with the application volume of 74.8 L/ha compared to the application volume of 37.4 L/ha, regardless of flight heights. When flight height was compared within application volume for the fruit-tree mode, droplet density was significantly higher with a flight height of 3 m (141.03 drops/cm2) compared to a flight height of 5 m (118.99 drops/cm2) within the application volume of 37.4 L/ha. In contrast, within the application volume of 74.8 L/ha, there was no significant difference in droplet density between the flight heights of 3 m (147.72 drops/cm2) and 5 m (154.14 drops/cm2). For the spinning mode, droplet density was consistently higher with the application volume of 74.8 L/ha compared to 37.4 L/ha, regardless of flight height (i.e., 193.90 drops/cm2 at 3 m and 174.32 drops/cm2 at 5 m). Also, droplet density was higher with the flight height of 3 m compared to the flight height of 5 m for both application volume treatments (i.e., 170.34 drops/cm2 at 37.4 L/ha and 193.90 drops/cm2 at 74.8 L/ha). For the standard mode, reducing flight height from 5 m to 3 m decreased droplet density from 53.51 drops/cm2 to 48.94 drops/cm2 with an application volume of 37.4 L/ha. In contrast, within the application volume of 74.8 L/ha, droplet density was significantly higher with a flight height of 3 m (117.28 drops/cm2) than with 5 m (90.74 drops/cm2). Droplet density was significantly higher with the application volume of 74.8 L/ha than with 37.4 L/ha at both flight heights.
3.3. Droplet Spectra (Dv0.1, Dv0.5, and Dv0.9)
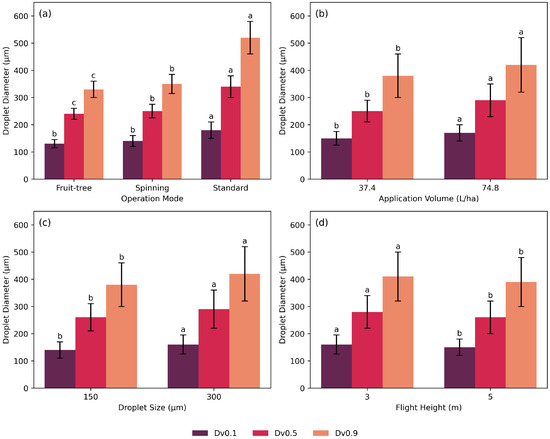
Dv0.1 was significantly affected by operation mode (F = 430.15, p < 0.0001), application volume (F = 91.53, p < 0.0001), flight height (F = 27.65, p < 0.0001), and droplet size (F = 76.14, p < 0.0001). Similarly, Dv0.5 was significantly influenced by operation mode (F = 772.64, p < 0.0001), application volume (F = 175.14, p < 0.0001), flight height (F = 40.95, p < 0.0001), and droplet size (F = 91.01, p < 0.0001). Dv0.9 followed the same pattern, with significant effects of operation mode (F = 1204.89, p < 0.0001), application volume (F = 169.45, p < 0.0001), flight height (F = 40.90, p < 0.0001), and droplet size (F = 132.03, p < 0.0001).
For the main effect of operation mode (Figure 5), the standard mode treatment had the largest Dv0.1 (196.65 µm), Dv0.5 (346.91 µm), and Dv0.9 (513.43 µm). The fruit-tree and spinning modes had the smallest droplets, with no statistically significant differences between them for Dv0.1. Dv0.5 and Dv0.9 were the largest for the spinning mode, measuring 238.32 µm and 347.99 µm, respectively. An increase in application volume from 37.4 L/ha to 74.8 L/ha resulted in larger Dv0.1, Dv0.5, and Dv0.9. Droplet size also significantly influenced droplet distribution, with 300 µm droplet size resulting in larger Dv0.1, Dv0.5, and Dv0.9 than 150 µm droplet size. Increasing the flight height from 3 m to 5 m reduced Dv0.1, Dv0.5, and Dv0.9. Specifically, Dv0.1 decreased from 162.20 µm to 152.10 µm, Dv0.5 from 263.18 µm to 180.48 µm, and Dv0.9 from 408.93 µm to 388.00 µm.
Figure 5.
Main effects of (a) operation mode, (b) application volume, (c) droplet size, and (d) flight height on droplet spectra (Dv0.1, Dv0.5, and Dv0.9). The legend indicates the droplet spectra: Dv0.1 (10% of volume is composed of droplets smaller than this size), Dv0.5 (median volume diameter), and Dv0.9 (90% of volume is below this size). Bars sharing the same lowercase letter within each droplet diameter (Dv0.1, Dv0.5, and Dv0.9) indicate no significant differences among treatment levels for each factor (i.e., operation mode, application volume, droplet size, or flight height) as determined by Tukey’s test (p > 0.05).
While the main effects were statistically significant for droplet spectra parameters, the analysis of interactions indicated that Dv0.1 (F = 2.95, p > 0.05), Dv0.5 (F = 1.37, p > 0.05), and Dv0.9 (F = 0.07, p > 0.05) were not impacted by the four-way interaction among operation mode, application volume, droplet size, and flight height. In contrast, a significant three-way interaction among operation mode, flight height, and application volume was observed for Dv0.1 (F = 22.00, p < 0.0001), Dv0.5 (F = 24.92, p < 0.0001), and Dv0.9 (F = 25.54, p < 0.0001).
Similar to the results presented for spray coverage and droplet density, the significant three-way interactions affecting droplet spectra were presented within each operation mode. Table 5 shows the effect of the interaction between application volume and flight height on Dv0.1, Dv0.5, and Dv0.9, each evaluated within operation mode. In general, Dv0.1, Dv0.5, and Dv0.9 were higher with an application volume of 74.8 L/ha than 37.4 L/ha across all operation modes. For instance, using the standard mode at a flight height of 3 m, Dv0.1 increased from 195.71 µm to 213.53 µm, Dv0.5 increased from 330.37 µm to 385.91 µm, and Dv0.9 increased from 487.90 to 557.56 µm. Similar trends were measured for the fruit-tree and the spinning modes when treatments were applied at a flight height of 3 m. When flight height increased from 3 m to 5 m, Dv0.1, Dv0.5, and Dv0.9 decreased across all operation modes. For example, using the spinning mode with an application volume of 74.8 L/ha at a flight height of 5 m, Dv0.1 decreased from 157.53 µm to 133.88 µm, Dv0.5 decreased from 268.36 µm to 226.50 µm, and Dv0.9 decreased from 386.16 µm to 329.61 µm. Similar trends were measured for the fruit-tree mode at 37.4 L/ha, where Dv0.1 decreased from 138.05 µm to 121.42 µm, Dv0.5 decreased from 235.55 µm to 204.11 µm, and Dv0.9 decreased from 342.02 µm to 299.65 µm.
Table 5.
Effects of the interaction between application volume and flight height, each evaluated within operation mode, on Dv0.1, Dv0.5, and Dv0.9 (µm). Similar lowercase letters within the same column (application volume) indicate no significant differences between flight heights within each operation mode, as determined by Tukey’s test (p > 0.05). Similar uppercase letters within the same row (flight height) indicate no significant differences between application volumes within each operation mode, as determined by Tukey’s test (p > 0.05).
3.4. Relative Span Factor (RSF)
The RSF is an indicator of droplet size uniformity that was significantly influenced by the main effects of operation mode (F = 9.65, p < 0.0001) and application volume (F = 9.19, p ≤ 0.01). For the main effect of operation mode, the standard mode had the highest RSF values, ranging from 0.88 to 1.01, indicating lower uniformity of droplet distribution. The lowest RSF within standard mode was observed for the combination of a flight height of 5 m, a droplet size of 150 µm, and an application volume of 37.4 L/ha. In contrast, RSF values in the fruit-tree mode ranged from 0.86 to 0.94, indicating a more uniform droplet size distribution compared to the standard mode, particularly at an application volume of 74.8 L/ha with a droplet size of 300 µm and a flight height of 5 m. Similarly, RSF values in the spinning mode varied between 0.86 and 0.94, also reflecting a more uniform droplet size distribution compared to the standard mode.
3.5. Spatial Variability in Spray Distribution
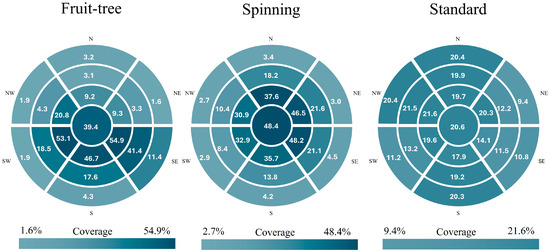
Spray distribution plots (Figure 6) show significant spatial variability across the seven predefined positions (center, SE, SW, S, NE, NW, and N), as well as within the inner, middle, and outer parts of the simulated canopy structure.
Figure 6.
Spray distribution across different sampling locations on the simulated canopy structure for three operation modes: standard mode, spinning mode, and fruit-tree mode. Sampling locations: SE: southeast, SW: southwest, S: south, NE: northeast, NW: northwest, and N: north. Darker shading indicates higher spray coverage.
The standard mode had the most uniform spray distribution across all sampling locations but provided lower overall spray coverage compared to other operation modes. The NW spraying position recorded the highest spray coverage in the inner (21.6%), middle (21.5%), and outer (20.4%) parts of the structure, followed closely by the center position (20.6%). The N and S positions achieved similar spray coverage levels, with the inner positions at 19.7% for N and 17.9% for S, middle positions at 19.9% for N and 19.2% for S, and outer positions at 20.4% for N and 20.3% for S. The peripheral positions (SE, SW, and NE) showed slightly lower spray coverage. The fruit-tree mode had the greatest spatial variability in spray coverage among the three operation modes. The inner southern positions of the simulated canopy structure had higher coverage than the inner northern positions. The inner SE, SW, and S positions recorded the highest spray coverage at 54.9%, 53.1%, and 46.7%, respectively. This was followed by the middle SE position (41.4%) and the center position (39.4%). Ultimately, the spinning mode achieved the highest overall spray coverage in the center position (48.4%), followed by the inner SE (48.2%), inner NE (46.5%), inner N (37.6%), inner S (35.7%), inner SW (32.9%), and inner NW (30.9%).
4. Discussion
Modern agriculture requires growers to use new technologies in the field to maintain crop production [9,10,11,12]. Spraying drones are an example of such technologies, as they have the potential to support more efficient IPM programs when properly configured [15,16]. Understanding how drone operational parameters influence droplet deposition is essential for interpreting how these systems may perform under field conditions. In orchard contexts, variables such as operation mode, application volume, droplet size, and flight height are among the primary flight parameters to be determined during drone spraying applications [18,19,20,21]. In the controlled, simulated canopy scenario used in this study, these factors significantly influenced spray coverage and droplet density.
Based on the main effect of operation mode, the spinning mode was the most effective, achieving the highest average spray coverage (20.81%) and droplet density (172.44 drops/cm2), with a relatively balanced deposition between the inner and middle portions of the simulated canopy structure. However, spray coverage decreased toward the outer canopy structure, reflecting the localized nature of this spraying strategy. This behavior is consistent with the mechanics of the spinning mode, in which the drone hovers and rotates around its vertical axis, releasing droplets from multiple directions and increasing droplet interception near the target area [17,30]. Among the tested parameter combinations, the configuration with the highest coverage had an application volume of 74.8 L/ha, a flight height of 3 m, and a droplet size of 300 μm.
The fruit-tree mode resulted in intermediate deposition levels (18.26% coverage and 140.47 drops/cm2) but showed a highly localized distribution pattern. In this operation mode, the combination that produced the greatest deposition response included an application volume of 74.8 L/ha, a flight height of 5 m, and a droplet size of 300 μm. Spray deposition was concentrated near central positions, including inner SE (54.9%), inner SW (53.1%), inner S (46.7%), and center (39.4%), while peripheral locations, such as NW (1.9%), SW (1.9%), and NE (1.6%) received limited spray. This pattern reflects the hovering, non-rotational movement of the drone, which delivers spray primarily to predefined target zones and reduces lateral dispersion [17,30].
In contrast, the standard mode produced the lowest overall spray coverage (17.10%) and droplet density (77.83 drops/cm2) but provided the most uniform spatial distribution. The continuous forward motion of the drone in standard mode promotes a more directional and stable airflow, enabling droplets to be transported across a broader area [17,30]. Among the tested combinations, the best-performing parameters in this mode included an application volume of 74.8 L/ha, a flight height of 3 m, and a droplet size of 150 μm, which enhanced horizontal dispersion and resulted in more homogeneous coverage.
Droplet spectra (Dv0.1, Dv0.5, and Dv0.9) and RSF also varied across different operation modes. The standard mode produced larger droplets overall (e.g., Dv0.9: 593.66 μm), resulting in higher RSF values and greater variability in droplet size distribution. In contrast, the spinning and fruit-tree modes generated smaller and more uniform droplets (e.g., RSF: 0.86–0.94), indicating more consistent deposition patterns [40,41,42].
Across all operation modes, a higher application volume (74.8 L/ha) significantly improved spray coverage and droplet density. For example, increasing the application volume from 37.4 L/ha to 74.8 L/ha raised the overall droplet density from 114.31 drops/cm2 to 146.35 drops/cm2. This increase reflects the greater volume of liquid available for deposition, enhancing both coverage and droplet density [16,43]. Similarly, a lower flight height (3 m) improved deposition by reducing drift and evaporation losses [44,45].
Although these general trends were consistent with previous studies [46,47], important differences emerged in the interaction between operation mode and droplet size. While the spinning mode achieved the highest overall deposition, it resulted in lower spatial uniformity than the standard mode, indicating that increased deposition does not necessarily correspond to a more homogeneous distribution. These differences can be explained by droplet transport dynamics and airflow structure. In spinning mode, rotational movement generates turbulent, multidirectional airflow that enhances droplet recirculation and interception near the simulated structure [17,30]. Under these conditions, larger droplets (300 μm), with greater inertia, are less susceptible to drift and more likely to deposit [20]. In contrast, the directional airflow in standard mode favors transport of smaller droplets (150 μm) due to their longer suspension time and greater surface area-to-volume ratio, although they are more susceptible to drift under unfavorable environmental conditions [48,49]. These results demonstrate that deposition efficiency depends on the interaction between flight pattern and droplet physical properties rather than on individual parameters alone.
These findings provide controlled experimental evidence of how manufacturer-defined operation modes influence droplet behavior and contribute to the growing literature on drone spray dynamics in precision agriculture [23,40]. However, this study was conducted under controlled conditions using simulated canopy structures and restricted meteorological conditions. Under less favorable environmental conditions, such as high temperatures, low relative humidity, or wind speeds exceeding recommended thresholds (>4.5 m/s), droplet evaporation and drift may increase, potentially reducing on-target deposition and altering spray distribution patterns [50,51,52].
Furthermore, the experimental configuration does not fully represent the structural complexity of mature orchard systems, including canopy heterogeneity, foliage density, terrain variation, and turbulent airflow conditions [51]. Therefore, the relationships observed in this study should be interpreted within the context of controlled conditions, and extrapolation to real orchard systems should be approached with caution. Field validation under diverse environmental and canopy conditions is needed [16,37,51].
It is also important to consider the technological context of the DJI Agras T40 drone used in this study. The T40 integrates RTK-enabled navigation and a perception suite based on active phased-array radar and binocular vision for obstacle sensing and terrain following, offering a 360° horizontal field of view, ±45° vertical field of view, a detection range of 1.5–50 m, and a maximum spray flow rate of 12 L/min [53]. Newer DJI models incorporate expanded sensing systems and higher flow capacities. For example, the DJI Agras T50 and T100 support increased maximum flow rates (up to 24 L/min and 40 L/min, respectively) and enhanced perception systems, including extended detection ranges and additional sensing technologies [54,55]. The T100, in particular, provides detection ranges up to 60 m and a 360° horizontal and 180° vertical field of view [55]. These generational advancements may improve operational robustness and spray delivery capacity under commercial orchard conditions. The mechanistic relationships identified in this study are directly applicable to the T40 drone; however, further investigation is needed to determine whether similar deposition responses occur in next-generation systems with enhanced sensing and flow control capabilities.
From an agronomic perspective, operation mode selection should be aligned with the intended application objective. More uniform deposition patterns, such as those observed in the standard mode, may be more suitable for applications requiring consistent coverage across the canopy, such as preventive fungicide or foliar treatments. In contrast, operation modes that promote localized deposition, such as spinning or fruit-tree modes, may be more appropriate when targeting specific canopy zones or when increased deposition in central areas is desired. However, these implications are based on controlled experimental conditions and should be validated under commercial orchard environments.
From an operational perspective, the findings of this study can help drone operators select parameter combinations that enhance canopy interception while minimizing unnecessary spray volume. Improving deposition efficiency under appropriate environmental conditions may reduce the likelihood of repeat applications and help limit off-target losses. Future research should evaluate drone spray performance under a wider range of environmental conditions, such as higher wind speeds, and validate these findings under commercial orchard conditions.
5. Conclusions
Operation mode, application volume, flight height, and droplet size significantly affected spray coverage, droplet density, droplet spectra, and droplet size uniformity when using the DJI Agras T40 drone in a simulated canopy structure. Among the evaluated operation modes, the spinning mode produced the highest overall spray coverage and droplet density under the evaluated conditions. The parameter combination associated with the strongest deposition response for this mode was an application volume of 74.8 L/ha, a flight height of 3 m, and a droplet size of 300 μm. The fruit-tree mode promoted more localized spray deposition, with the highest responses observed at an application volume of 74.8 L/ha, a flight height of 5 m, and a droplet size of 300 μm. In contrast, although the standard mode resulted in lower overall coverage, it provided the most homogeneous spatial distribution, indicating potential usefulness in scenarios that require uniform deposition across large areas. For this operation mode, the parameter combination associated with the highest spray deposition included an application volume of 74.8 L/ha, a flight height of 3 m, and a droplet size of 150 μm. In general, these findings provide data-based insight into how drone operational settings influence spray deposition patterns under simulated canopy conditions. Further validation in commercial orchards and in different environmental conditions will be necessary to determine how these deposition trends translate into field performance, environmental behavior, and management effectiveness.
Author Contributions
Conceptualization, L.B.d.O. and A.L.B.R.d.S.; methodology, L.B.d.O. and A.L.B.R.d.S.; software, L.B.d.O. and A.L.B.R.d.S.; validation, L.B.d.O., T.C. and A.L.B.R.d.S.; formal analysis, L.B.d.O. and T.C.; investigation, L.B.d.O. and T.C.; resources, A.L.B.R.d.S.; data curation, L.B.d.O., J.S.P. and A.L.B.R.d.S.; writing—original draft preparation, L.B.d.O., J.S.P. and A.L.B.R.d.S.; writing—review and editing, L.B.d.O., T.C., J.S.P. and A.L.B.R.d.S.; visualization, A.L.B.R.d.S.; supervision, A.L.B.R.d.S.; project administration, A.L.B.R.d.S.; funding acquisition, A.L.B.R.d.S. All authors have read and agreed to the published version of the manuscript.
Funding
This research received no external funding.
Data Availability Statement
The data presented in this study are available on request from the corresponding author.
Acknowledgments
The authors acknowledge João Vitor Gonçalves, Michell Gonçalves de Oliveira, Luan Wesley Aparecido Pereira Alves, and Thiago Rutz for their assistance during the experimental activities. In addition, the authors thank the staff of the Auburn University Turfgrass Research Unit for providing the facilities to conduct experimental trials.
Conflicts of Interest
The authors declare no conflicts of interest.
References
- Hamad, A.; Tayel, A. Food 2050 concept: Trends that shape the future of food. J. Future Foods 2026, 6, 1053–1066. [Google Scholar] [CrossRef] [Scilit]
- FAO. FAOSTAT: Production: Crops and Livestock Products. Available online: https://www.fao.org/faostat/en/#data/QCL (accessed on 17 March 2026).
- Luo, C.-X.; Schnabel, G.; Hu, M.; De Cal, A. Global distribution and management of peach diseases. Phytopathol. Res. 2022, 4, 30. [Google Scholar] [CrossRef] [Scilit]
- Sharma, A.; Kumar, V.; Shahzad, B.; Tanveer, M.; Sidhu, G.P.S.; Handa, N.; Kohli, S.K.; Yadav, P.; Bali, A.S.; Parihar, R.D.; et al. Worldwide pesticide usage and its impacts on ecosystem. SN Appl. Sci. 2019, 1, 1446. [Google Scholar] [CrossRef] [Scilit]
- Tudi, M.; Daniel Ruan, H.; Wang, L.; Lyu, J.; Sadler, R.; Connell, D.; Chu, C.; Phung, D.T. Agriculture development, pesticide application and its impact on the environment. Int. J. Environ. Res. Public Health 2021, 18, 1112. [Google Scholar] [CrossRef] [Scilit]
- Hüesker, F.; Lepenies, R. Why does pesticide pollution in water persist? Environ. Sci. Policy 2022, 128, 185–193. [Google Scholar] [CrossRef] [Scilit]
- Sookhtanlou, M.; Allahyari, M.S.; Surujlal, J. Health risk of potato farmers exposed to overuse of chemical pesticides in Iran. Saf. Health Work 2022, 13, 23–31. [Google Scholar] [CrossRef] [Scilit]
- Cai, J.; Xiong, J.; Hong, Y.; Hu, R. Pesticide overuse in apple production and its socioeconomic determinants: Evidence from Shaanxi and Shandong provinces, China. J. Clean. Prod. 2021, 315, 128179. [Google Scholar] [CrossRef] [Scilit]
- Arakawa, T.; Kamio, S. Control efficacy of UAV-based ultra-low-volume application of pesticide in chestnut orchards. Plants 2023, 12, 2597. [Google Scholar] [CrossRef] [Scilit]
- Mahmud, M.S.; Zahid, A.; He, L.; Martin, P. Opportunities and possibilities of developing an advanced precision spraying system for tree fruits. Sensors 2021, 21, 3262. [Google Scholar] [CrossRef] [Scilit] [PubMed]
- Sahni, R.K.; Kumar, S.P.; Thorat, D.; Rajwade, Y.; Jyoti, B.; Ranjan, J.; Anand, R. Drone spraying system for efficient agrochemical application in precision agriculture. In Applications of Computer Vision and Drone Technology in Agriculture 4.0; Springer: Berlin/Heidelberg, Germany, 2024; pp. 225–244. [Google Scholar]
- Wu, W.T.; Chen, J.M.; Chang, Y.Y.; Lin, S.D.; Chen, S.T.; Hung, Y.T. Assessing the effectiveness of mitigating pesticide-related disease risk among pesticide-spraying drone operators in Taiwan. Am. J. Ind. Med. 2024, 67, 110–118. [Google Scholar] [CrossRef] [Scilit]
- Wei, Z.; Li, R.; Xue, X.; Sun, Y.; Zhang, S.; Li, Q.; Chang, C.; Zhang, Z.; Sun, Y.; Dou, Q. Research status, methods and prospects of air-assisted spray technology. Agronomy 2023, 13, 1407. [Google Scholar] [CrossRef] [Scilit]
- Li, X.; Giles, D.K.; Niederholzer, F.J.; Andaloro, J.T.; Lang, E.B.; Watson, L.J. Evaluation of an unmanned aerial vehicle as a new method of pesticide application for almond crop protection. Pest Manag. Sci. 2021, 77, 527–537. [Google Scholar] [CrossRef] [Scilit]
- Furiosi, M.; Triachini, S.; Beone, G.M.; Fontanella, M.C.; Gaaied, S.; Arbi, G.; Lomadze, A.; Grella, M.; Mozzanini, E.; Dicembrini, E.; et al. Aerial Spray Application of Plant Protection Products for Grapevine Downy Mildew Control: Efficacy and Canopy Deposit Evaluation in Semi-Field Trials. Agronomy 2025, 15, 2703. [Google Scholar] [CrossRef] [Scilit]
- Yan, Y.; Lan, Y.; Wang, G.; Hussain, M.; Wang, H.; Yu, X.; Shan, C.; Wang, B.; Song, C. Evaluation of the deposition and distribution of spray droplets in citrus orchards by plant protection drones. Front. Plant Sci. 2023, 14, 1303669. [Google Scholar] [CrossRef] [Scilit] [PubMed]
- Shan, C.; Xue, C.; Zhang, L.; Song, C.; Kaousar, R.; Wang, G.; Lan, Y. Effects of different spray parameters of plant protection UAV on the deposition characteristics of droplets in apple trees. Crop Protect. 2024, 184, 106835. [Google Scholar] [CrossRef] [Scilit]
- Meng, Y.; Su, J.; Song, J.; Chen, W.-H.; Lan, Y. Experimental evaluation of UAV spraying for peach trees of different shapes: Effects of operational parameters on droplet distribution. Comput. Electron. Agric. 2020, 170, 105282. [Google Scholar] [CrossRef] [Scilit]
- Wang, G.; Lan, Y.; Qi, H.; Chen, P.; Hewitt, A.; Han, Y. Field evaluation of an unmanned aerial vehicle (UAV) sprayer: Effect of spray volume on deposition and the control of pests and disease in wheat. Pest Manag. Sci. 2019, 75, 1546–1555. [Google Scholar] [CrossRef] [Scilit]
- Chen, S.; Lan, Y.; Zhou, Z.; Ouyang, F.; Wang, G.; Huang, X.; Deng, X.; Cheng, S. Effect of droplet size parameters on droplet deposition and drift of aerial spraying by using plant protection UAV. Agronomy 2020, 10, 195. [Google Scholar] [CrossRef] [Scilit]
- Chen, S.D.; Lan, Y.B.; Zhou, Z.Y.; Liao, J.; Zhu, Q.Y. Effects of spraying parameters of small plant protection UAV on droplets deposition distribution in citrus canopy. J. South China Agric. Univ. 2017, 38, 97–102. [Google Scholar] [CrossRef]
- Qin, W.; Xue, X.; Zhang, S.; Gu, W.; Wang, B. Droplet deposition and efficiency of fungicides sprayed with small UAV against wheat powdery mildew. Int. J. Agric. Biol. Eng. 2018, 11, 27–32. [Google Scholar] [CrossRef] [Scilit]
- Ribeiro, L.F.O.; da Vitória, E.L.; Soprani Júnior, G.G.; Chen, P.; Lan, Y. Impact of operational parameters on droplet distribution using an unmanned aerial vehicle in a papaya orchard. Agronomy 2023, 13, 1138. [Google Scholar] [CrossRef] [Scilit]
- Guo, S.; Yao, W.; Xu, T.; Ma, H.; Sun, M.; Chen, C.; Lan, Y. Assessing the application of spot spray in Nanguo pear orchards: Effect of nozzle type, spray volume rate and adjuvant. Pest Manag. Sci. 2022, 78, 3564–3575. [Google Scholar] [CrossRef] [Scilit]
- Tang, Y.; Hou, C.; Luo, S.; Lin, J.; Yang, Z.; Huang, W. Effects of operation height and tree shape on droplet deposition in citrus trees using an unmanned aerial vehicle. Comput. Electron. Agric. 2018, 148, 1–7. [Google Scholar] [CrossRef] [Scilit]
- Zhang, X.-Q.; Song, X.-P.; Liang, Y.-J.; Qin, Z.-Q.; Zhang, B.-Q.; Wei, J.-J.; Li, Y.-R.; Wu, J.-M. Effects of spray parameters of drone on the droplet deposition in sugarcane canopy. Sugar Technol. 2020, 22, 583–588. [Google Scholar] [CrossRef] [Scilit]
- Wang, C.; Liu, Y.; Zhang, Z.; Han, L.; Li, Y.; Zhang, H.; Wongsuk, S.; Li, Y.; Wu, X.; He, X. Spray performance evaluation of a six-rotor unmanned aerial vehicle sprayer for pesticide application using an orchard operation mode in apple orchards. Pest Manag. Sci. 2022, 78, 2449–2466. [Google Scholar] [CrossRef] [Scilit]
- Calderone, G.; Ferro, M.V.; Catania, P. A systematic literature review on recent unmanned aerial spraying systems applications in orchards. Smart Agric. Technol. 2025, 10, 100708. [Google Scholar] [CrossRef] [Scilit]
- García-Munguía, A.; Guerra-Ávila, P.L.; Islas-Ojeda, E.; Flores-Sánchez, J.L.; Vázquez-Martínez, O.; García-Munguía, A.M.; García-Munguía, O. A review of drone technology and operation processes in agricultural crop spraying. Drones 2024, 8, 674. [Google Scholar] [CrossRef] [Scilit]
- DJI. Unmanned Aircraft Flight Manual. Available online: https://www.dji.com/t40/downloads (accessed on 10 December 2025).
- ASAE S386.2 FEB1988 (R2018); Calibration and Distribution Pattern Testing of Agricultural Aerial Application Equipment. American Society of Agricultural and Biological Engineers: St. Joseph, MI, USA, 2018.
- ASABE S572.1; Droplet Size Classification. American Society of Agricultural and Biological Engineers: St. Joseph, MI, USA, 2017.
- Caputti, T.; de Oliveira, L.P.; Rodrigues, C.; Cremonez, P.; Foshee, W.; Simmons, A.M.; da Silva, A.L.B.R. Flight Parameters for Spray Deposition Efficiency of Unmanned Aerial Application Systems (UAASs). Drones 2025, 9, 461. [Google Scholar] [CrossRef] [Scilit]
- Qi, P.; Zhang, L.; Wang, Z.; Han, H.; Müller, J.; Li, T.; Wang, C.; Huang, Z.; He, M.; Liu, Y.; et al. Effect of operational parameters of unmanned aerial vehicle (UAV) on droplet deposition in trellised pear orchard. Drones 2023, 7, 57. [Google Scholar] [CrossRef] [Scilit]
- Ferguson, J.C.; Hewitt, A.J.; O’Donnell, C.C.; Kruger, G.R. Comparison of water-sensitive paper, Kromekote and Mylar collectors for droplet deposition with a visible fluorescent dye solution. J. Plant Prot. Res. 2020, 60, 98–105. [Google Scholar] [CrossRef] [Scilit]
- Yuki, S.; Kobara, Y.; Nakashima, M.; Ozaki, Y.; Yoshiyama, H.; Yuasa, K.; Kubota, Y.; Fujii, Y.; Yamasaki, H. Comparison of Test Methods for Spray Deposition and Distribution by Unmanned Aerial Vehicle for Agricultural Chemical Spraying Application between Japanese Convention Protocol and ISO 24253 Protocol. Appl. Eng. Agric. 2025, 41, 11–21. [Google Scholar] [CrossRef] [Scilit]
- Ferguson, J.C.; Chechetto, R.G.; Hewitt, A.J.; Chauhan, B.S.; Adkins, S.W.; Kruger, G.R.; O’Donnell, C.C. Assessing the deposition and canopy penetration of nozzles with different spray qualities in an oat (Avena sativa L.) canopy. Crop Protect. 2016, 81, 14–19. [Google Scholar] [CrossRef] [Scilit]
- Gill, M. AccuStain Software User Guide; University of Illinois at Urbana-Champaign: Champaign, IL, USA, 2020. [Google Scholar]
- da Vitória, E.L.; Ribeiro, L.F.O.; Gontijo, I.; Pires, F.R.; Cotta, A.J.B.; Ferreira, F.d.A.; Ribeiro Furtado Júnior, M.; Barbosa, M.E.d.S.; Ribeiro, J.V.O.; Moreira, J.W.D.M. Spatial Variability in the Deposition of Herbicide Droplets Sprayed Using a Remotely Piloted Aircraft. AgriEngineering 2025, 7, 245. [Google Scholar] [CrossRef] [Scilit]
- Mohanty, S.P.; Raheman, H. Performance optimization of an air-assisted electrostatic spraying unit using response surface methodology. J. Electrost. 2024, 131, 103963. [Google Scholar] [CrossRef] [Scilit]
- Basílio, S.; Furtado Júnior, M.R.; de Alvarenga, C.B.; Vitória, E.L.d.; Vargas, B.C.; Privitera, S.; Caruso, L.; Cerruto, E.; Manetto, G. Effect of Adjuvants on Physical–Chemical Properties, Droplet Size, and Drift Reduction Potential. Agriculture 2024, 14, 2271. [Google Scholar] [CrossRef] [Scilit]
- Chen, J.; Hu, W.; Dong, X.; Lin, J.; Gao, Z.; Qiu, B. Experimental investigation on modes of spray formation, droplet size and size distribution in a spinning disc atomizer. Front. Plant Sci. 2024, 15, 1470745. [Google Scholar] [CrossRef] [Scilit]
- Paul, R.A.I.; Palanisamy, M.A.; Peramaiyan, P.; Kumar, V.; Bagavathiannan, M.; Gurjar, B.; Vijayakumar, S.; Djanaguiraman, M.; Pazhanivelan, S.; Ramasamy, K. Spray volume optimization with UAV-based herbicide application for effective droplet deposition and weed control in direct-seeded rice. Front. Agron. 2024, 6, 1491842. [Google Scholar] [CrossRef] [Scilit]
- Byers, C.; Virk, S.; Rains, G.; Li, S. Spray deposition and uniformity assessment of unmanned aerial application systems (UAAS) at varying operational parameters. Front. Agron. 2024, 6, 1418623. [Google Scholar] [CrossRef] [Scilit]
- Chen, P.; Ouyang, F.; Wang, G.; Qi, H.; Xu, W.; Yang, W.; Zhang, Y.; Lan, Y. Droplet distributions in cotton harvest aid applications vary with the interactions among the unmanned aerial vehicle spraying parameters. Ind. Crops Prod. 2021, 163, 113324. [Google Scholar] [CrossRef] [Scilit]
- Ranabhat, S.; Price, R. Effects of flight heights and nozzle types on spray characteristics of unmanned aerial vehicle (UAV) sprayer in common field crops. AgriEngineering 2025, 7, 22. [Google Scholar] [CrossRef] [Scilit]
- Manjunatha, K.; Savadi, S.; Adiga, J.; Venkatesh, E.; Sushilendra, S. Effects of flight height, flight speed and spray volume of a UAV based spraying system on droplet deposition in cashew trees. Results Eng. 2026, 29, 109786. [Google Scholar] [CrossRef] [Scilit]
- Chen, P.; Lan, Y.; Huang, X.; Qi, H.; Wang, G.; Wang, J.; Wang, L.; Xiao, H. Droplet deposition and control of planthoppers of different nozzles in two-stage rice with a quadrotor unmanned aerial vehicle. Agronomy 2020, 10, 303. [Google Scholar] [CrossRef] [Scilit]
- Shan, C.; Wang, G.; Wang, H.; Xie, Y.; Wang, H.; Wang, S.; Chen, S.; Lan, Y. Effects of droplet size and spray volume parameters on droplet deposition of wheat herbicide application by using UAV. Int. J. Agric. Biol. Eng. 2021, 14, 74–81. [Google Scholar] [CrossRef] [Scilit]
- Wang, C.; Herbst, A.; Zeng, A.; Wongsuk, S.; Qiao, B.; Qi, P.; Bonds, J.; Overbeck, V.; Yang, Y.; Gao, W.; et al. Assessment of spray deposition, drift and mass balance from unmanned aerial vehicle sprayer using an artificial vineyard. Sci. Total Environ. 2021, 777, 146181. [Google Scholar] [CrossRef] [Scilit] [PubMed]
- Biglia, A.; Mozzanini, E.; Gioelli, F.; Sopegno, A.; Alcatrão, L.E.; Suciu, N.A.; Furiosi, M.; Caffi, T.; Gay, P.; Grella, M. Assessing the potential efficacy and efficiency of UASS vine-targeted spray application across growth stages. Smart Agric. Technol. 2025, 12, 101532. [Google Scholar] [CrossRef] [Scilit]
- Portillo, H.; Barbosa, R.; Beckwith, M.; Gullen, T.; Haynie, R.; Hovinga, S.; Kesavaraju, B.; Lang, E.; Livingston, P.; Newton, N.; et al. Industry (UAPASTF) Response to Pesticide Regulators’ “State of the Knowledge” Review of Drone Use for Pesticide Application: Best Practices for Safe and Effective Application of Pesticides. Drones 2025, 9, 388. [Google Scholar] [CrossRef] [Scilit]
- DJI. DJI AGRAS T40. Available online: https://www.dji.com/t40 (accessed on 23 February 2026).
- DJI. DJI AGRAS T50. Available online: https://ag.dji.com/t50 (accessed on 23 February 2026).
- DJI. DJI AGRAS T100. Available online: https://ag.dji.com/t100 (accessed on 23 February 2026).

Disclaimer/Publisher’s Note: The statements, opinions and data contained in all publications are solely those of the individual author(s) and contributor(s) and not of MDPI and/or the editor(s). MDPI and/or the editor(s) disclaim responsibility for any injury to people or property resulting from any ideas, methods, instructions or products referred to in the content. |
© 2026 by the authors. Licensee MDPI, Basel, Switzerland. This article is an open access article distributed under the terms and conditions of the Creative Commons Attribution (CC BY) license.