


Highlights
What are the main findings?
- Superiority of Semantic-constraint Matching: Transforming noisy LiDAR intensity images into stabilized semantic representations (using YOLOv11) significantly outperforms traditional feature-based matching methods like SIFT + FLANN.
- Robustness of Complex Geometric Structures: Features with distinct and complex shapes, such as pedestrian crossings and directional arrows, offer the most stable control points and are highly effective at suppressing false matches between semantically distinct objects.
What are the implications of the main findings?
- Semantic-constraint Cross-Sensor Integration: This study demonstrates that leveraging semantic context effectively overcomes significant radiometric and structural discrepancies, offering an automated solution for high-precision geometric alignment of multi-modal datasets.
- Advancing Geometric Invariance in Deep Matching: The study demonstrates that integrating semantic constraints with graph neural networks provides a pathway to handle large sensor discrepancies, highlighting the potential for achieving universal registration without relying on highly optimized initial orientations.
Abstract
The integration of heterogeneous geospatial data, specifically low-cost unmanned aerial vehicle (UAV) imagery and mobile light detection and ranging (LiDAR) system point clouds, presents a significant challenge due to the significant radiometric and structural discrepancies between the two modalities. This study proposes a novel air-to-ground semantic feature matching framework to achieve precise geometric registration between these data sources by effectively incorporating semantic-constraint deep learning-based matching. The methodology transformed the cross-sensor alignment challenge into a robust two-dimensional image matching problem. This was achieved by first using YOLOv11 for semantic segmentation of common road markings in both the UAV orthoimage and the converted LiDAR intensity image to generate highly consistent feature references. Subsequently, the SuperPoint detector and a graph neural network matcher, SuperGlue, were applied to these semantic images to establish reliable geomatics information correspondence points. Experimental results confirmed that this semantic-guided strategy consistently outperformed traditional feature-based matching (i.e., scale-invariant feature transform + fast library for approximate nearest neighbors), particularly by converting the noisy LiDAR intensity image into a stabilized semantic representation. The explicit application of semantic constraints further proved effective in eliminating false matches between geometrically similar but semantically distinct objects. The final object-specific analysis demonstrated that features with clear, complex geometric structures (e.g., pedestrian crossings and directional arrows) provide the most robust matching control. In summary, the proposed framework successfully leverages semantic context to overcome cross-sensor heterogeneity, offering an automated and precise solution for the geometric alignment of mobile LiDAR data.
1. Introduction
1.1. Motivation
In recent years, rapid advancements in sensing technologies have accelerated the adoption of different platforms such as unmanned aerial vehicle (UAV) cameras and mobile light detection and ranging (LiDAR) systems across domains, including urban planning, three-dimensional modeling, and autonomous driving. UAVs provide a top-down viewpoint that can capture large-scale and detailed surface information (e.g., roof tops), whereas a mobile LiDAR system (MLS) offers comprehensive ground-level geometry (e.g., building façades). By integrating these complementary perspectives, more complete three-dimensional representations can be generated to improve the reliability of downstream analyses and applications. Building on this concept, image–LiDAR fusion has been widely investigated to enhance three-dimensional reconstruction and scene interpretation. Prior studies have integrated UAV imagery with terrestrial LiDAR system (TLS) data to produce detailed building models [1], combined UAV and mobile mapping system datasets for large-scale urban reconstruction [2], and fused UAV imagery with MLS point clouds to improve road crack detection in complex urban environments [3]. These works highlight the value of cross-sensor integration for creating richer and more dependable spatial information.
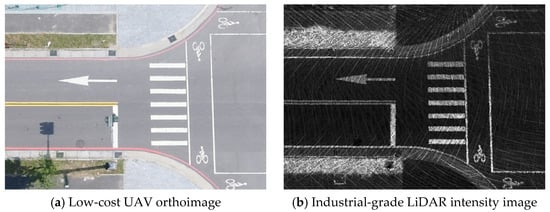
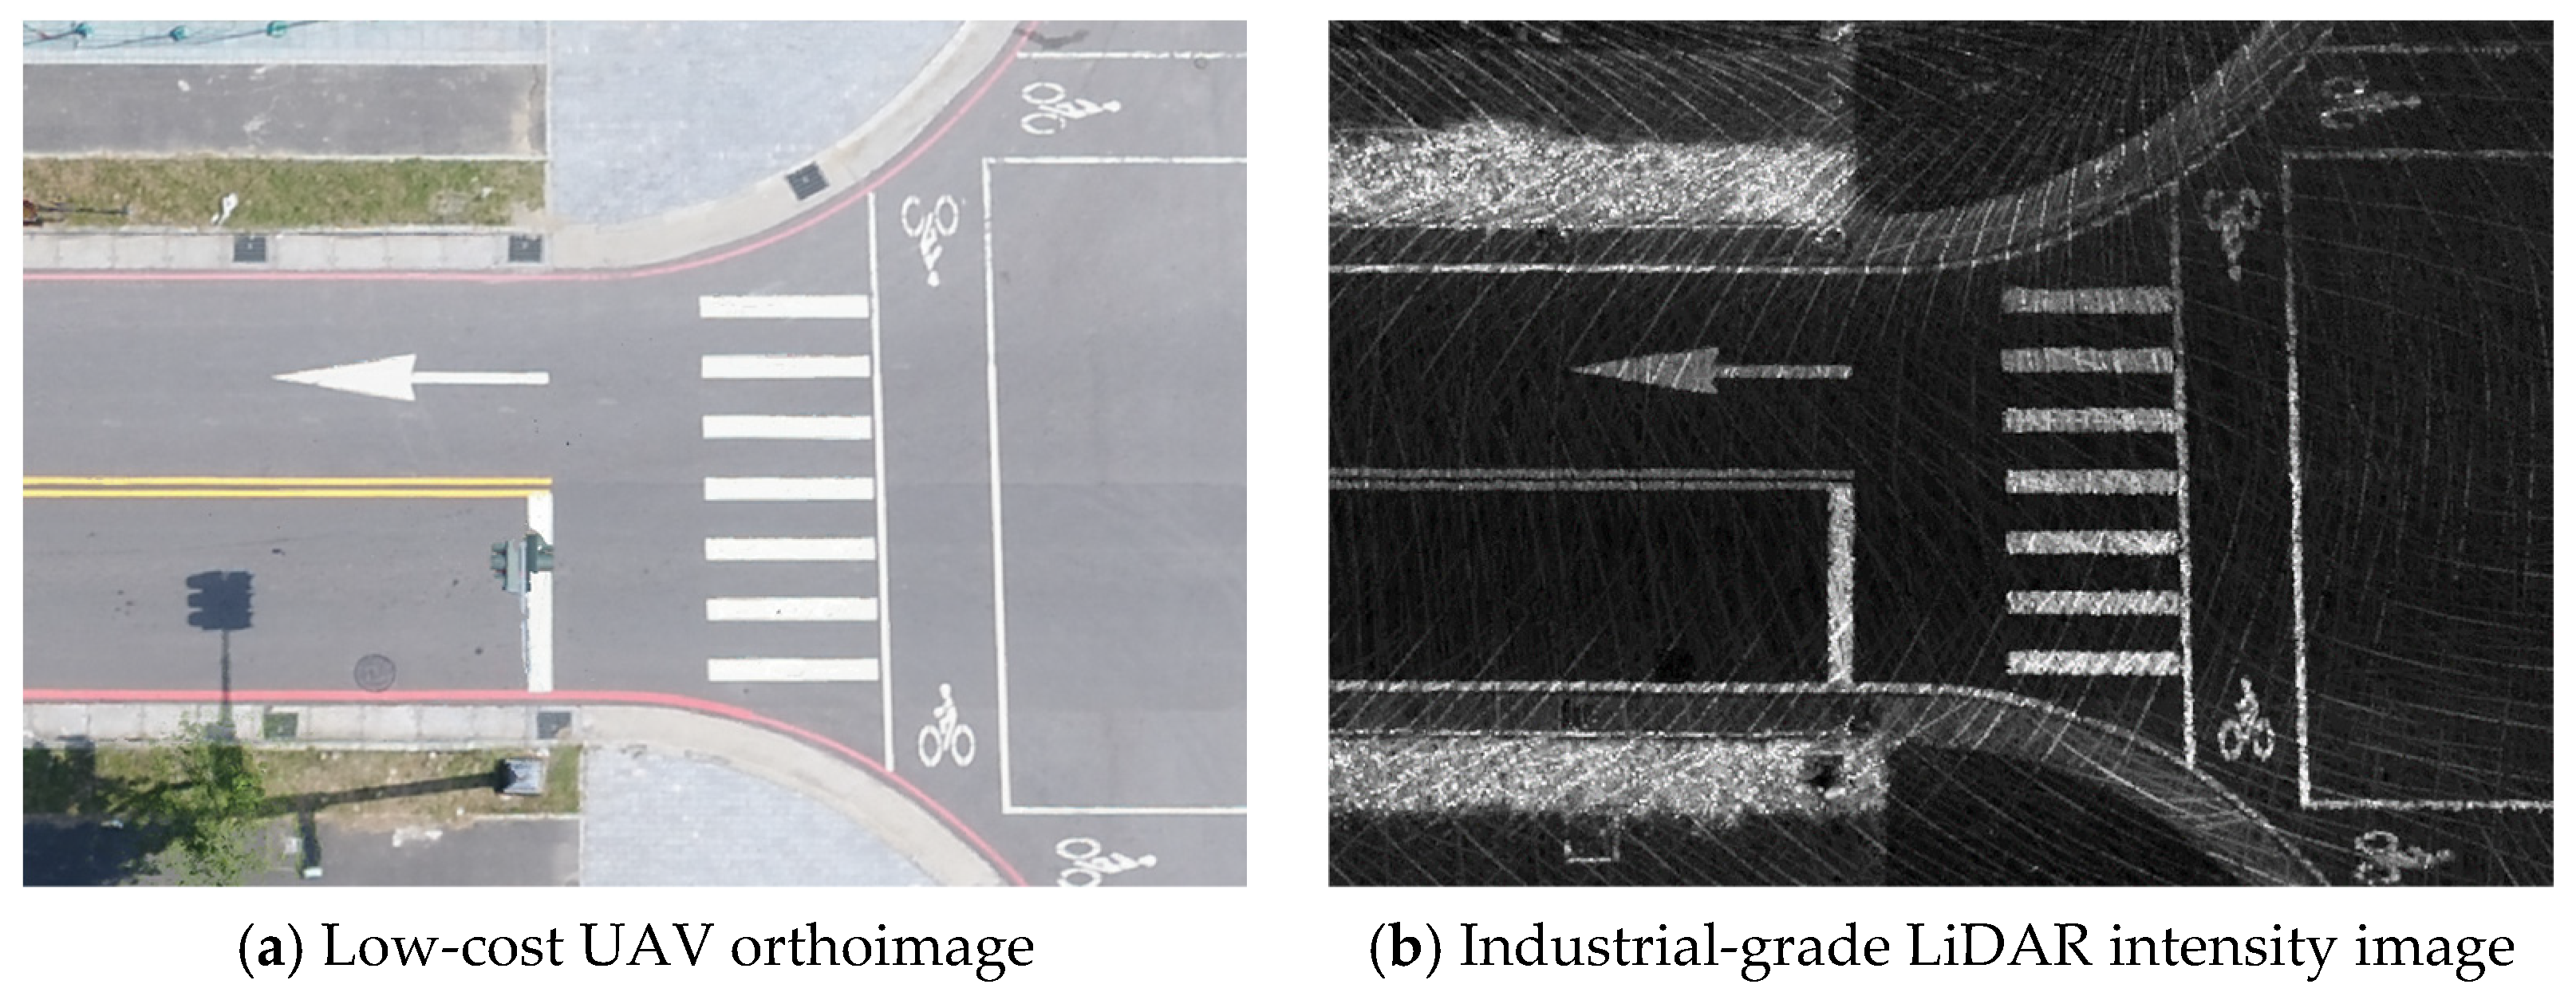
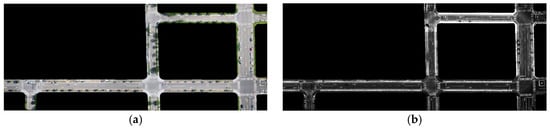
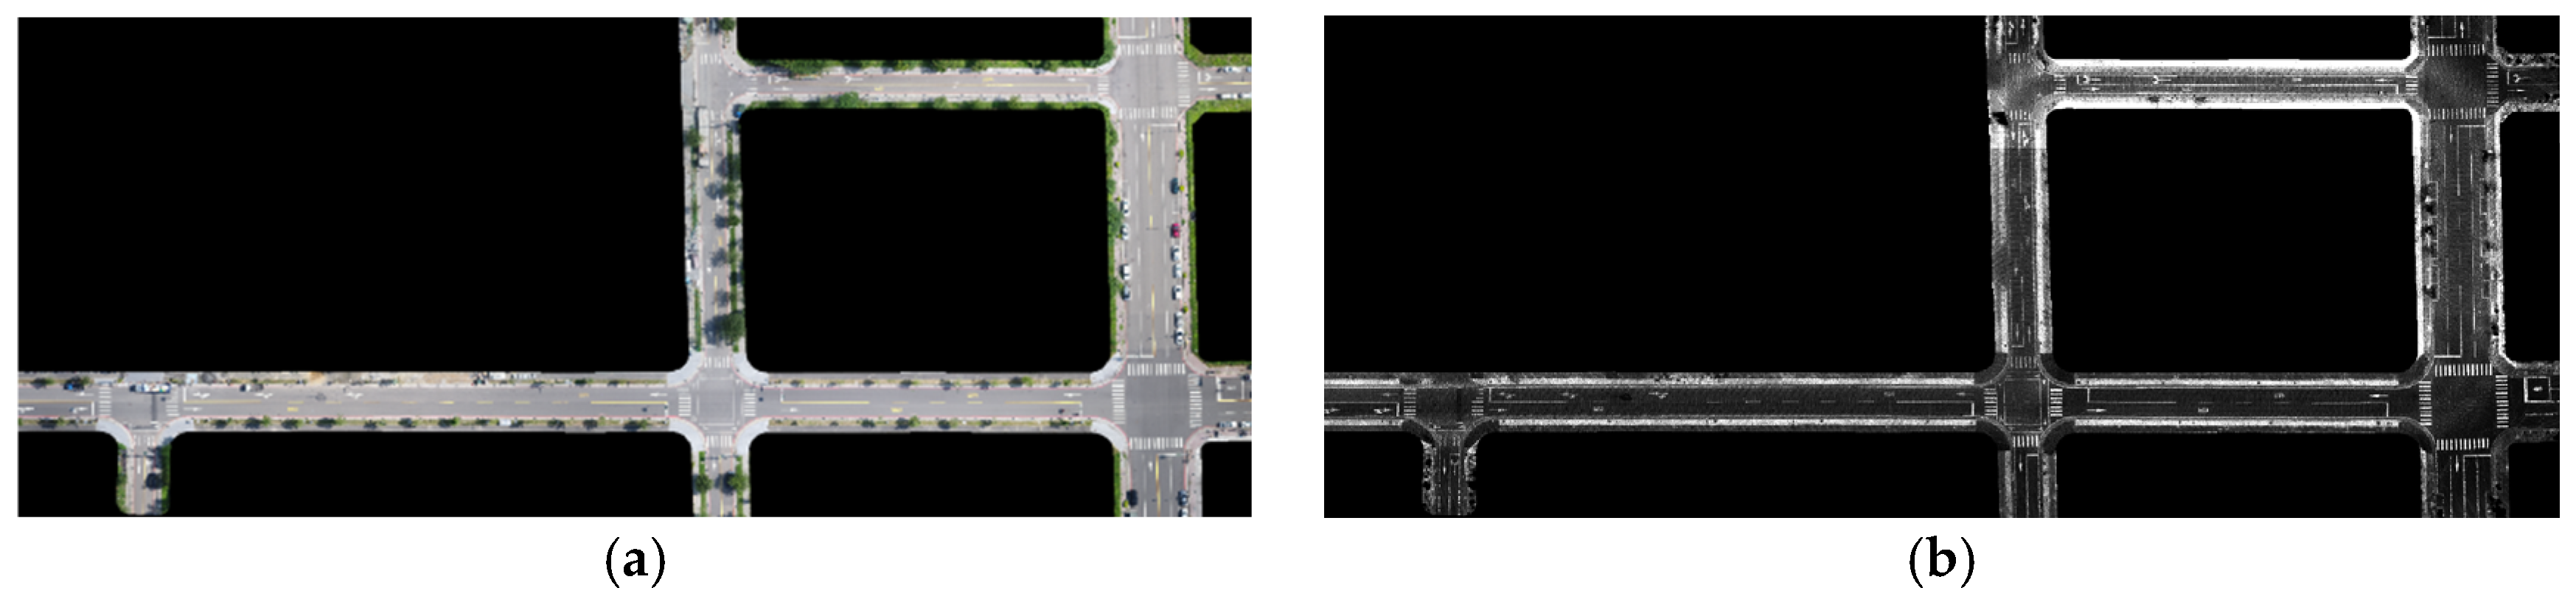
Despite these inherent benefits, effective integration of heterogeneous datasets remains a significant challenge. UAV imagery offers rich multispectral and textural information, whereas LiDAR point clouds primarily furnish geometric and radiometric attributes sampled from irregular points (as exemplified in Figure 1). These pronounced discrepancies in visual and quantitative characteristics significantly reduce the efficacy of conventional image-matching algorithms. Consequently, it is challenging to establish stable and reliable correspondences between the two distinct modalities, particularly when dealing with data derived from low-cost UAV photogrammetry platforms and industrial-grade LiDAR systems.
Figure 1.
Comparison between a UAV orthoimage and a LiDAR intensity image.
1.2. Previous Studies
To address the challenges of integrating data from different sensors, previous studies have mainly adopted registration techniques as the main processing approach. The core of registration lies in feature extraction and matching between two sensors, which can be categorized into three strategies according to the types of features used: feature-based, line-based, and surface-based methods [4].
Feature-based methods typically detect stable geometric keypoints, such as corners or edge points, for matching. In applications involving the integration of images and point clouds, UAV imagery with geographic reference information can be used to facilitate the alignment process and effectively improve the geolocation accuracy of mobile sensor data. Consequently, many studies have developed automatic extraction techniques for correspondence points based on image feature matching. For example, the study [5] converted mobile LiDAR point clouds into two-dimensional intensity images and combined traditional corner detection with the LATCH feature descriptor. This approach successfully achieved high-precision feature matching between UAV imagery and mobile LiDAR data, enhancing positioning accuracy through trajectory correction and demonstrating pixel-level registration potential. Similarly, Ref. [6] combined corner detection and template matching to effectively identify corresponding points between LiDAR intensity images and UAV imagery. These studies highlight the potential of image features for heterogeneous data integration, particularly in improving the positioning accuracy of MLS in urban environments.
In road environments, road objects themselves can also serve as robust geometric features. An example of [7] integrated TLS and MLS point clouds by selecting common man-made objects in road scenes—such as curbs, lamp posts, and guardrails—as reference features. Their method combined point-cloud eigenvalues and curvature to extract multi-scale feature points, followed by coarse-to-fine registration using the improved 4-points congruent sets and iterative closest point algorithms. This approach effectively mitigated data loss caused by occlusion, viewpoint limitations, and dynamic objects in MLS data, demonstrating the robustness and applicability of road features in point cloud matching.
Line-based methods focus on distinct structural lines, such as building outlines or road boundaries, offering good geometric stability and cross-scale matching capability. The research [8] simplified building boundaries into line segment features and used them to identify corresponding line features, thereby achieving integration between photogrammetric image data and MLS point clouds. This method is suitable for urban data alignment and cross-scale data fusion. In [9], an automatic registration method centered on building contour lines, establishing line-feature correspondences between airborne laser scanning and TLS data through geometric constraints and spectral graph theory. Their method demonstrated strong matching robustness and high registration accuracy in densely built urban environments.
Surface-based methods are particularly effective for areas with abundant planar, regular, or geometrically consistent surfaces. The experiment in [10] segmented point clouds into voxels and used principal component analysis to estimate principal directions and plane parameters. The subsequent least-squares plane fitting achieved seamless integration of airborne and mobile sensor data, reducing the alignment error from 84 cm to 4 cm. A study [11] also proposed an octree-based approach for rapid and parallelized extraction of planar features. The method performed cross-temporal plane matching using criteria such as connected-component labeling, surface normal vectors, and centroid distances, followed by least-squares rigid body transformation between point and plane correspondences. This achieved millimeter- to centimeter-level accuracy, successfully integrating airborne and mobile LiDAR data for earthquake deformation monitoring.
1.3. Need for Further Study and Research Purpose
Traditionally, image matching and registration have primarily relied on the application of radiometric and geometric constraints. Radiometric constraints quantify the consistency between the two data modalities, typically employing gray value comparison or intensity attributes. Established techniques within this category include statistical measures such as normalized cross-correlation and various frequency domain matching algorithms. Conversely, geometric constraints leverage the known intersection geometry of the acquisition systems, such as the epipolar geometric constraint, homography constraint, or RANSAC constraint, to predict the expected position of conjugate points and efficiently reject outliers or erroneous matches. In recent years, deep learning-based semantic segmentation has demonstrated exceptional performance in extracting highly reliable semantic information from visual data [12,13]. However, despite the potential of these powerful contextual insights, prior research has rarely explored the utility of semantic constraints in enhancing the robustness and accuracy of heterogeneous data matching, leaving a critical and underexplored avenue for future research.
In multi-sensor data integration for urban environments, existing studies commonly rely on distinctive geometric features, such as road markings, which can be treated as planar two-dimensional structures suitable for image-based correspondence extraction. These features are widely used to improve LiDAR-based vehicle localization and orientation. However, such approaches often assume spectral consistency and stable local geometric patterns between images—conditions that do not hold in cross-sensor scenarios. UAV RGB imagery and LiDAR intensity images differ markedly in grayscale distribution, texture, and background composition, and the presence of vehicles, vegetation, and shadows further complicates matching. These discrepancies make traditional local feature-based methods unreliable. Classical feature detectors and descriptors, such as scale-invariant feature transform (SIFT) and speeded-up robust features (SURF) [14,15], which depend on stable gradient or texture information, perform poorly when exposed to substantial spectral or grayscale differences, leading to sparse or inconsistent correspondences across heterogeneous sensor modalities.
Recent advances have introduced deep learning-based cross-sensor feature matching. For example, Ref. [16] employed a graph neural network (GNN) framework with inverse perspective mapping and road feature extraction to achieve more accurate point cloud alignment in complex urban scenes, demonstrating the potential of deep learning for heterogeneous sensor integration. Building on these developments, this study further incorporated semantic information to filter background noise and isolate consistent road marking structures. By leveraging semantic constraints, the proposed semantic-guided matching strategy aimed to overcome spectral discrepancies and enhance the stability and accuracy of UAV–LiDAR cross-sensor correspondence. A high-level architecture with post-classification fusion [17] was reviewed for an autonomous system, which makes classification on RGB images from cameras and depth images from LiDAR scanning.
1.4. Objectives
The objective of this study was to propose a novel semantic matching procedure designed for the precise registration of low-cost UAV imagery and mobile LiDAR data. This approach was rooted in transforming the challenging task of integrating different sensor observations, which has traditionally focused on image matching, by incorporating advanced semantic information. Although UAV imagery and mobile LiDAR point clouds differ significantly in their observation perspectives, the abundance and uniform distribution of specific semantic entities, such as road markings in urban environments, allow these features to be reliably captured by both sensors. Therefore, this study transformed the task of extracting correspondence points between sensors into a two-dimensional image matching problem, using the UAV imagery as the geometric reference. To achieve this, the mobile LiDAR point cloud was first converted into a high-resolution intensity image; subsequently, a semantic segmentation model was applied to extract the road marking features from both the UAV image and the rasterized LiDAR intensity image. When both datasets shared the same high-fidelity feature references, image matching techniques were applied efficiently and automatically to extract a sufficient number of correspondence points, which were then used for the geometric correction and registration of the mobile LiDAR data.
The remainder of the paper is structured as follows. Section 2 introduces the study area and datasets, including the data preprocessing steps. It then describes the semantic segmentation method and the semantic matching process. Section 3 evaluates the semantic segmentation results and the improvements achieved through semantic constraints using case studies. Finally, Section 4 presents the conclusions and future work.
2. Materials and Methods
2.1. Study Area and Dataset
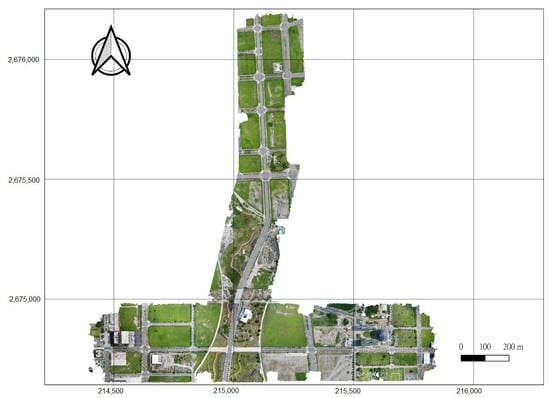
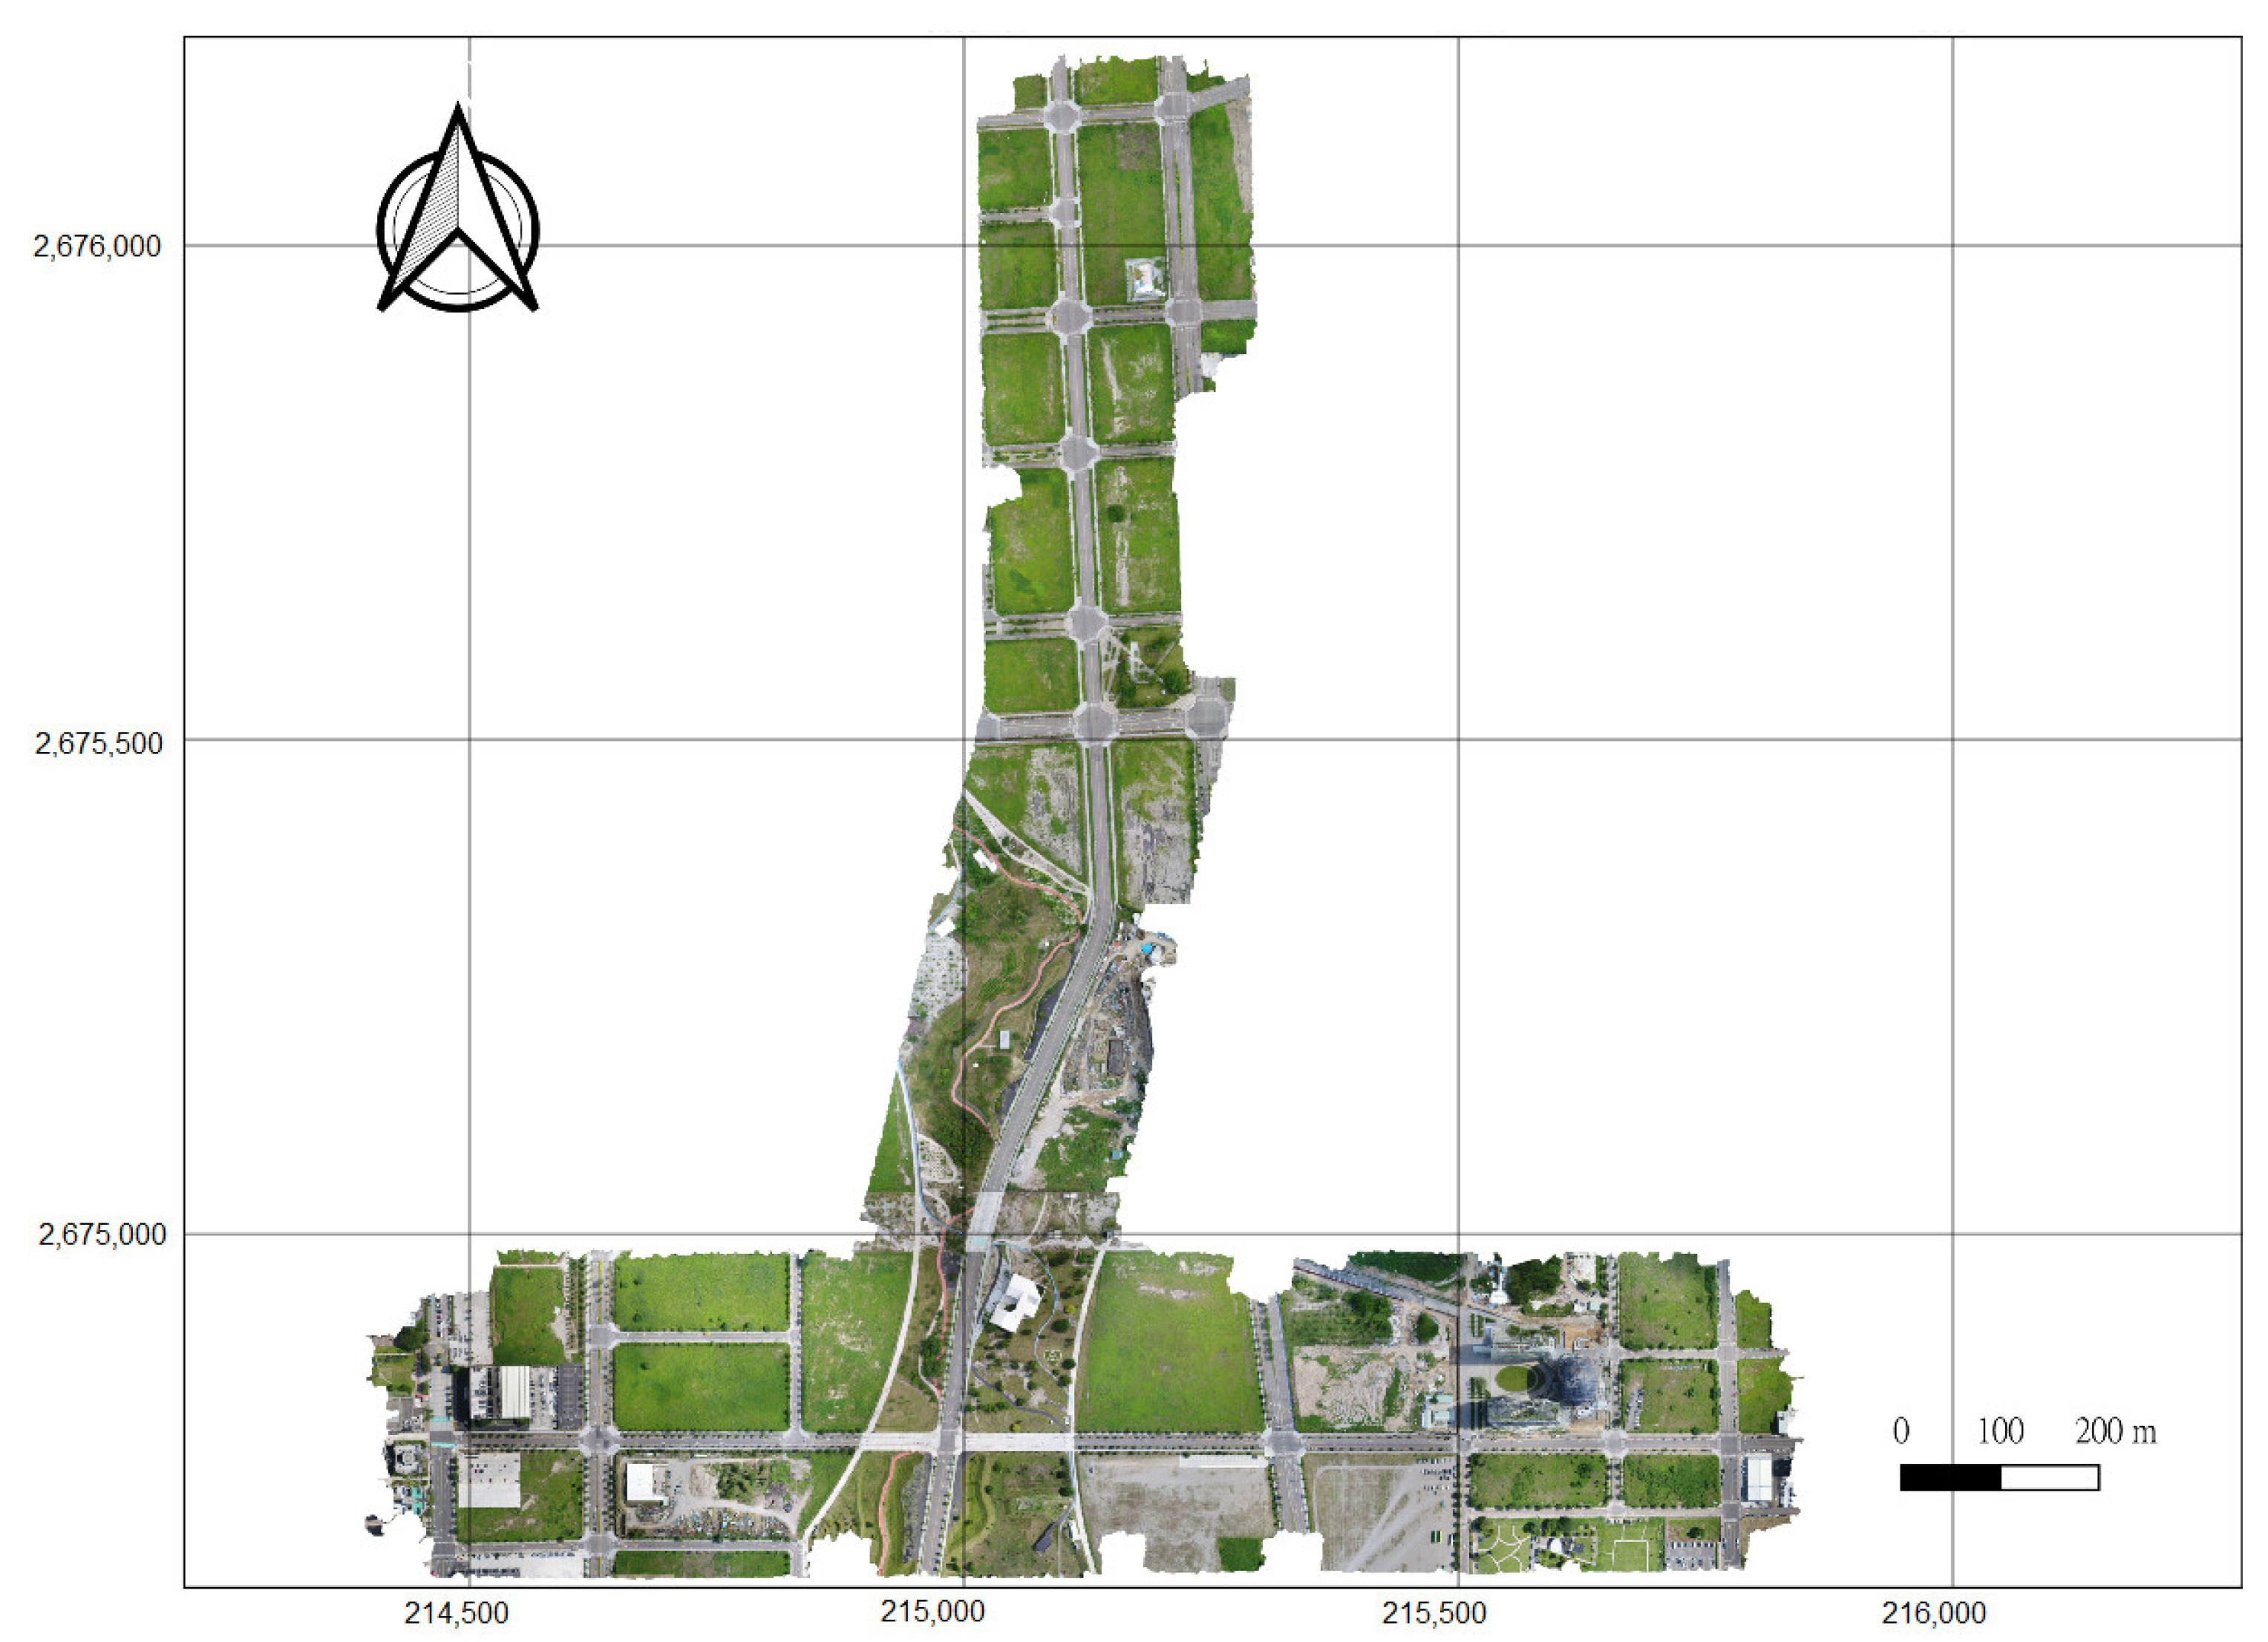
The study area is located in the Shui-Nan Trade and Economic Park of Xitun District, Taichung City, Taiwan, which serves as the main test site for the Shui-Nan Smart City autonomous vehicle pilot project (Figure 2). The area is equipped with a comprehensive intelligent transportation infrastructure, providing an optimal real-world environment for field testing. The site covers approximately 0.84 km2, extending about 1400 m east–west and 1500 m north–south.
Figure 2.
Study area: Shui-Nan trade and economic park of Xitun district, Taichung City.
The experimental dataset comprised point clouds acquired by a vehicle-mounted Velodyne HDL-32E LiDAR scanner and aerial images captured using a DJI Phantom 4 Pro UAV. The Velodyne HDL-32E is an industrial-grade sensor equipped with 32 laser beams, operating at a scanning rate of approximately 695,000 points per second and providing a vertical field of view of about 40°. Due to this relatively narrow vertical field of view, point density is highly dependent on the incidence angle and often results in occlusions and sparse data. Compared to survey-grade mobile LiDAR systems, such as the Riegl VMQ-1HA, the Velodyne HDL-32E produces point clouds with relatively lower density. Within the study area, the average point density of MLS data over road surfaces was approximately 4000 points/m2.
The aerial dataset was acquired using the DJI Phantom 4 Pro UAV. Each image had a resolution of 5472 × 3648 pixels, with flights conducted at an altitude of approximately 120 m. Both forward and side overlaps were set to 80%. A total of 746 images were collected, resulting in an average raw ground sampling distance of about 2 cm. Since UAV imagery primarily provides a nadir perspective, the reconstructed point cloud mainly covered surface features such as building rooftops and road surfaces. Statistical analysis showed that the average density of the UAV-derived point clouds within the study area was about 1600 points/m2, which was substantially lower than that of the vehicle-mounted LiDAR data. The sensor specifications are summarized in Table 1.
Table 1.
Details of the sensor specifications.
2.2. Data Preprocessing
The primary goal of the data preprocessing stage was to generate high-resolution two-dimensional raster products that were initially aligned by projecting all data into the same coordinate system. This initial alignment prepared the data for subsequent semantic feature extraction and matching stages. All data were processed and projected to the same map projection coordinate system (i.e., EPSG 3826).
2.2.1. UAV Orthoimage Pre-Processing
The raw UAV imagery, collected by a non-metric camera with global navigation satellite system (GNSS) support, required meticulous georeferencing and processing. Thirty-two ground control points, measured by e-GNSS (a virtual base station RTK service in Taiwan), were evenly distributed and used for aerial triangulation and computing precise interior and exterior orientation parameters. Image processing was performed in PIX4Dmatic, encompassing camera calibration, aerial triangulation, dense point cloud generation, digital surface model (DSM) construction, and orthophoto production. The geometric stability achieved was high, with the root mean square errors (RMSEs) after bundle adjustment in the east, north, and height directions measuring 2.1 cm, 2.2 cm, and 1.7 cm, respectively. The final orthophoto product was generated at a spatial resolution of 2 cm. Automated noise and artifact removal were applied to eliminate moving objects and non-ground features, ensuring that the orthophoto contained clear ground details suitable for subsequent road marking extraction.
2.2.2. MLS Lidar Intensity Pre-Processing
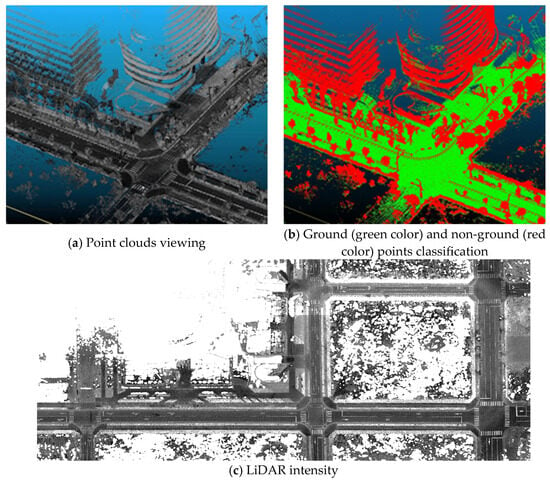
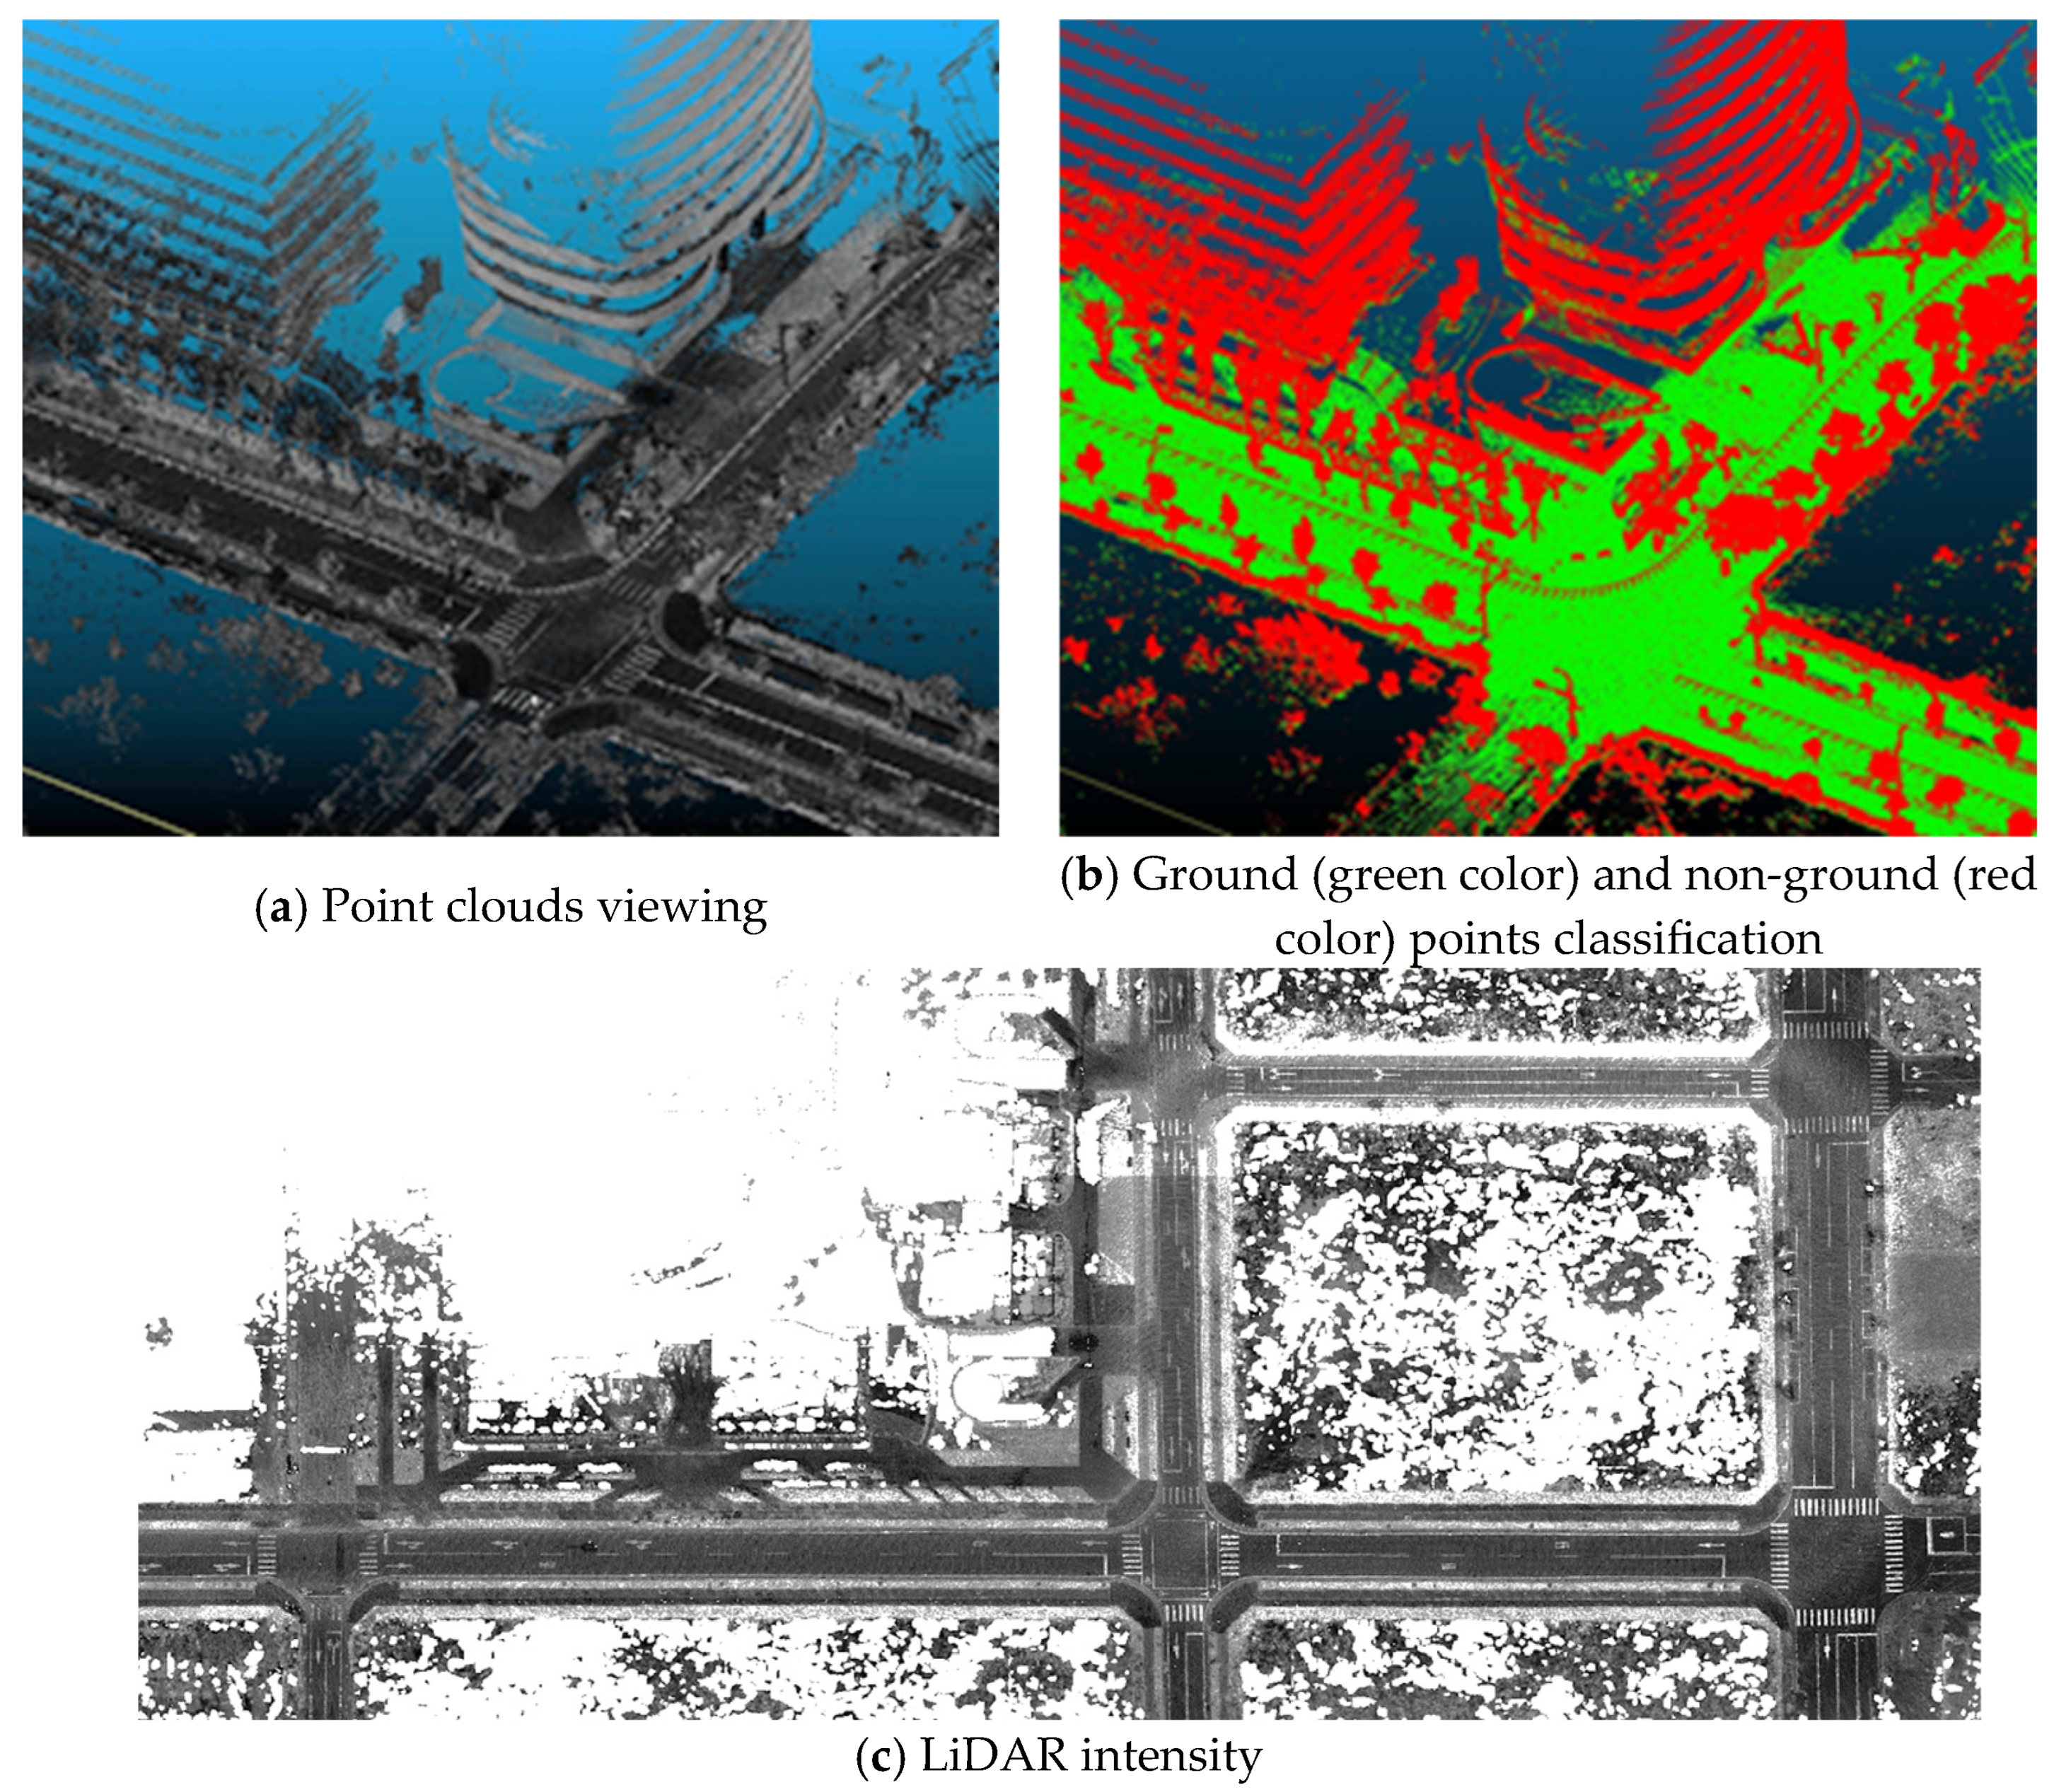
The preprocessing of the MLS point clouds aimed to generate a corresponding high-resolution intensity image. In this study, the LiDAR system used a position and orientation system (POS) for alignment without the assistance of ground control points (GCPs). Consequently, the trajectory was susceptible to GNSS signal quality, leading to sub-meter level positioning errors. To address the data characteristics and prepare for feature extraction, non-ground points (e.g., vehicles, trees) were first removed using the cloth simulation filter (CSF) [18] to isolate the ground surface. Based on the remaining ground points, a 2 cm grid resolution intensity image was generated using triangulated irregular network interpolation of the raw intensity values. To enhance the contrast of high-intensity features, such as road markings, and mitigate the impact of the aforementioned trajectory inaccuracies on local feature clarity, a maximum filter was subsequently applied (Figure 3).
Figure 3.
Preprocessing of MLS LiDAR data.
2.3. Methodologies
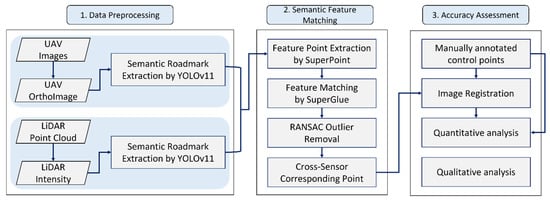
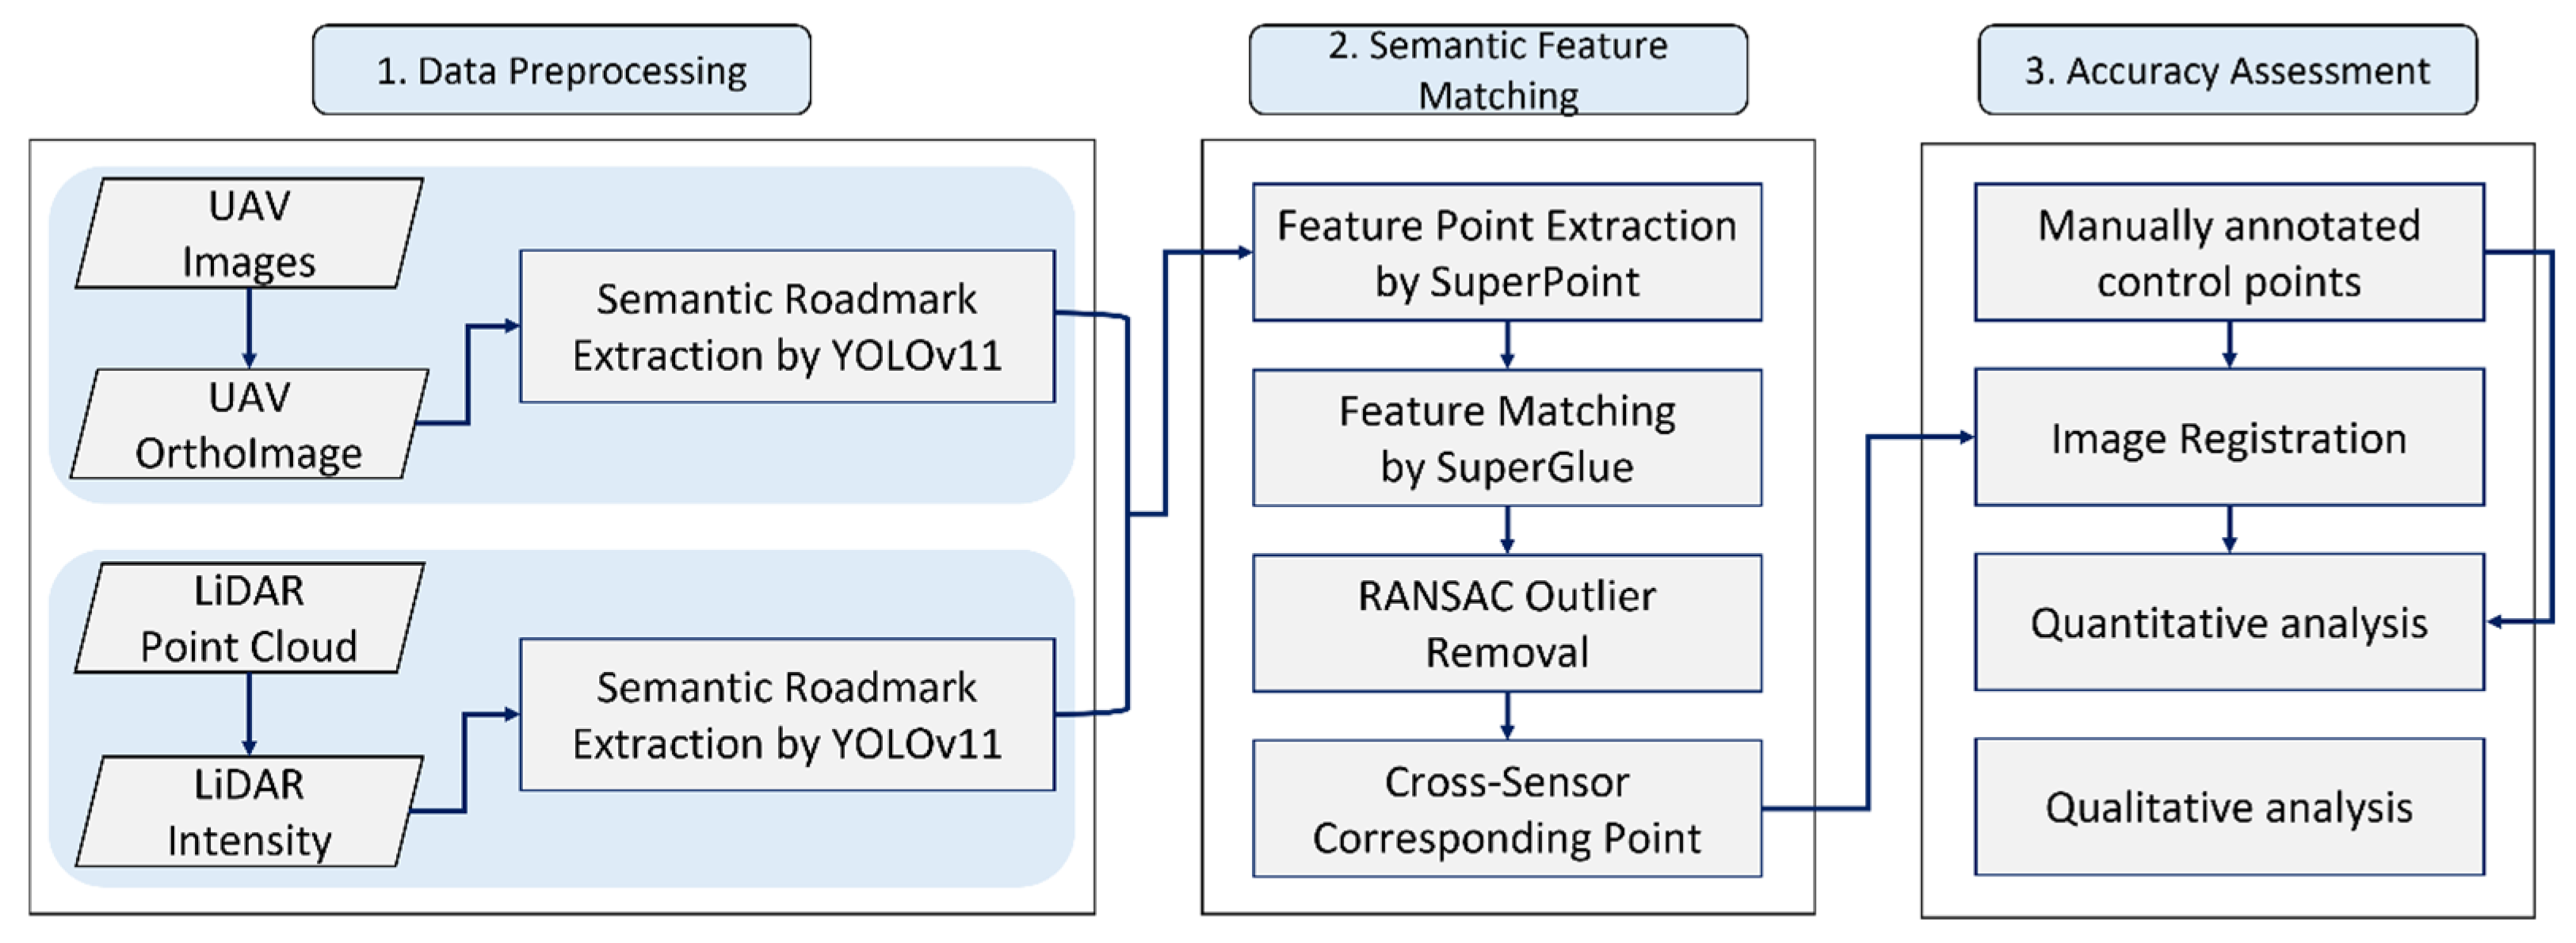
This research implemented a deep learning-based framework to extract consistent semantic features from multi-sensor data and subsequently employed a GNN structure for robust feature matching and correspondence establishment. The overall operational workflow comprises four main stages: (1) data preprocessing, (2) semantic feature extraction, (3) feature matching, and (4) accuracy assessment. The complete framework is conceptually illustrated in Figure 4.
Figure 4.
Workflow of the proposed method.
2.3.1. Semantic Feature Extraction
In this study, YOLOv11 [19] was adopted to perform semantic segmentation of road markings to unify UAV orthophotos and LiDAR intensity into consistent semantic representations for subsequent image matching. YOLOv11 integrates several optimized modules within its backbone and neck to enhance multi-scale feature extraction and improve robustness in complex urban scenes. Specifically, the backbone incorporates the C3k2 module for efficient feature extraction, the SPPF module for capturing spatial information across multiple receptive fields, and the C2PSA attention module for strengthening focus on fine-scale structures such as road markings. The neck maintains lightweight consistency with C3k2 while embedding C2PSA at key layers to improve detection under occlusions and cluttered backgrounds.
To support instance-level segmentation, YOLOv11 combines prototype masks with mask coefficients, allowing the end-to-end prediction of road marking regions. The model was trained using image tiles generated from the study area. In this study, both UAV orthoimages and LiDAR intensity were spatially constrained to the research boundary and then cropped into 640 × 640 pixel tiles, which served as the training dataset. Two training datasets were generated separately from the UAV RGB images and LiDAR intensity. Preprocessing ensured consistent input resolution and enabled the model to effectively learn road marking features under varying imagery conditions.
For training, the segmentation performance was optimized with a segmentation loss (Lseg) designed to enhance accuracy in challenging scenarios. This loss integrates cross-entropy loss (LCE) [20] and dice loss (LDice) [21]:
where Lseg is the total segmentation loss, defined by balancing the contributions of cross-entropy loss , which evaluates pixel-wise classification accuracy, and dice loss , which measures the spatial overlap between the predicted P and ground-truth T masks. and are the weighting hyperparameters used to control the influence of the two loss functions.
By balancing these two terms, the model achieved improved performance on small-scale markings, edge regions, and complex pavement backgrounds, ensuring precise semantic representation of road markings for subsequent feature matching.
2.3.2. Semantic Feature Matching
In urban environments, road markings are widely distributed and exhibit consistent geometric patterns; therefore, they can be easily detected by both UAV optical sensors and MLS LiDAR systems. Due to their uniform spatial distribution and cross-sensor visibility, previous studies have frequently adopted road markings as common geometric features to align data acquired from different sensing modalities.
In integrating UAV imagery and MLS point cloud data, these studies have primarily focused on using road markings as distinctive two-dimensional features. Since road markings lie on a planar surface, both datasets are commonly converted into two-dimensional grid images, allowing image-based matching techniques to extract tie points and enhance the accuracy of LiDAR-based positioning and orientation systems.
Traditional feature-matching algorithms, such as SIFT, rely mainly on the similarity of local feature descriptors. However, cross-sensor data exhibit strong heterogeneity in texture, grayscale, and scale, leading to significant appearance discrepancies between modalities. Consequently, conventional descriptor-based methods often fail to achieve stable and accurate correspondences, yielding unreliable matching performance across sensors. To overcome these limitations, this study adopted learning-based methods to extract semantically consistent and geometrically robust features across heterogeneous data sources.
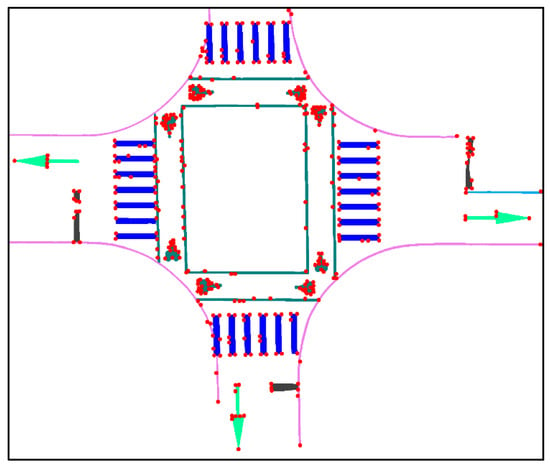
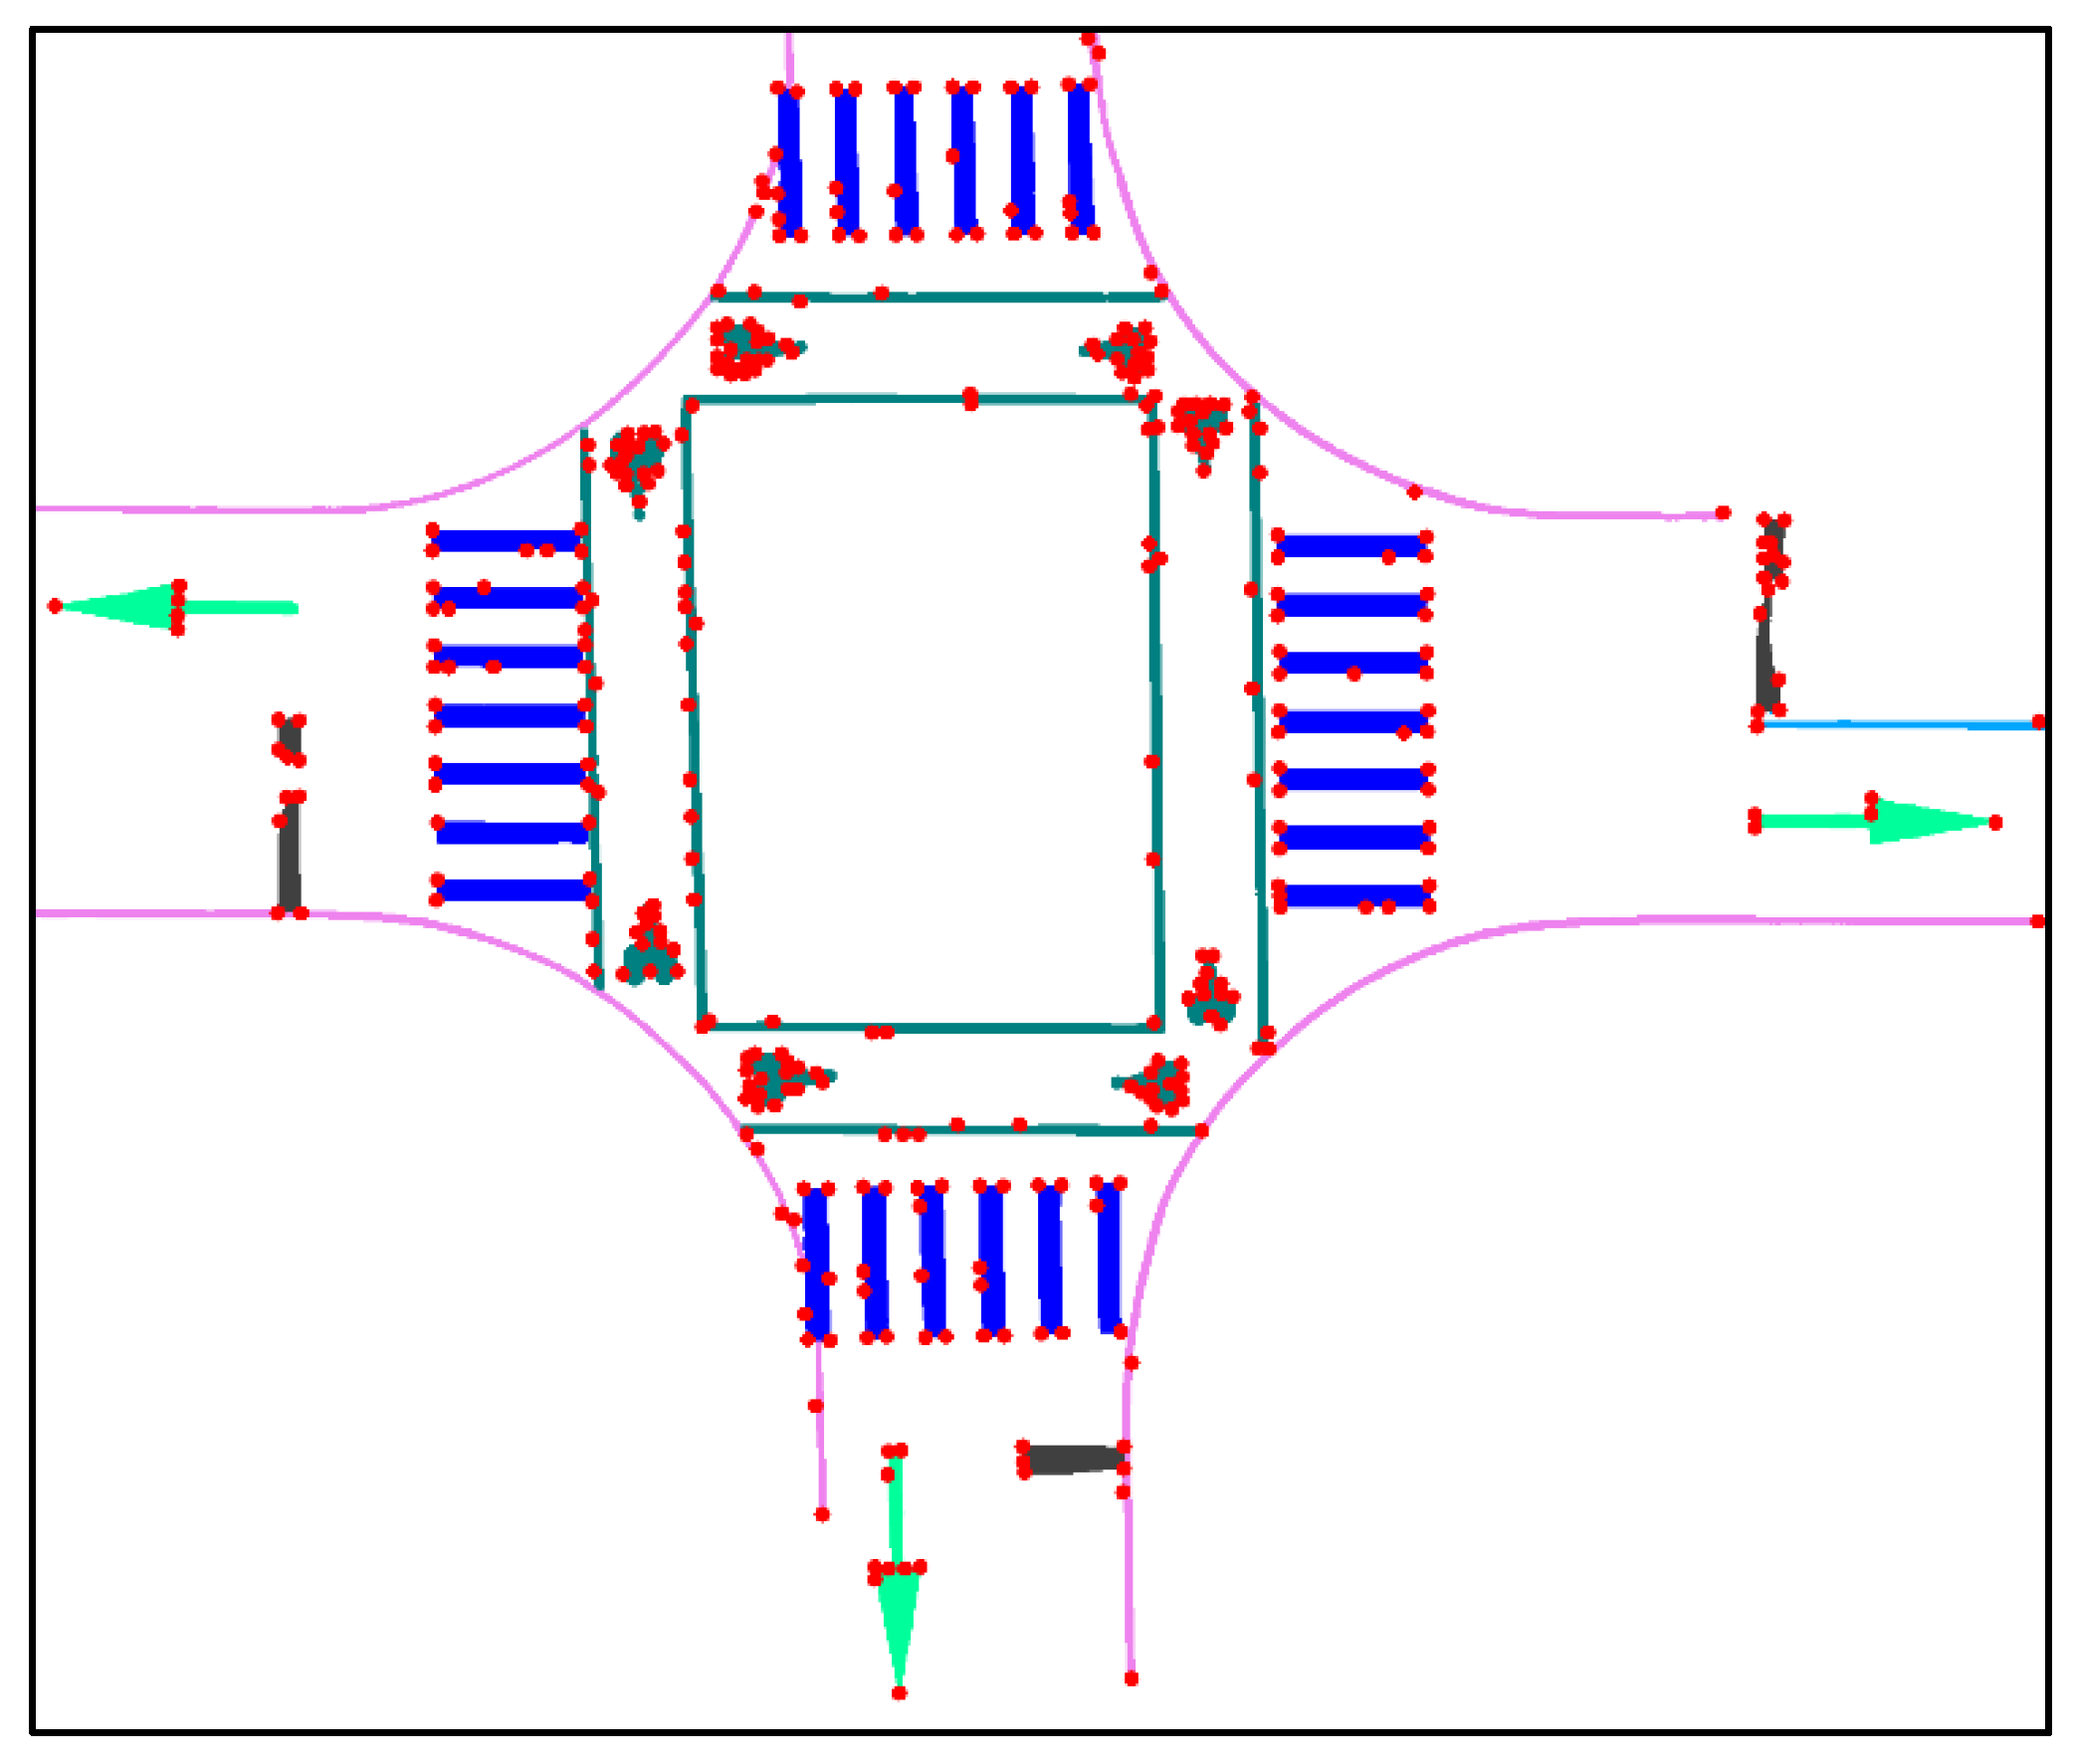
SuperPoint [22] was adopted to detect features and extract descriptors on semantically segmented road marking data (Figure 5). It is an end-to-end fully convolutional network (FCN) that outputs both two-dimensional feature locations and corresponding descriptors in a single forward pass. The training process comprises two stages: (1) pretraining on a synthetic dataset (Synthetic Shapes) to learn basic corner detection, which produces the MagicPoint model, and (2) applying homographic adaptation on large-scale unlabeled images to generate pseudo-labels, thereby enhancing feature stability and generalization in real-world scenes. The architecture comprises a shared encoder and two decoder branches, one of which generates an interest point heatmap and the other produces L2-normalized descriptors, enabling efficient joint detection and description.
Figure 5.
Illustration of SuperPoint feature points (red points) on semantic road marking imagery. Each color represents different type of road marking.
When SuperPoint is applied to semantically segmented road marking regions, rather than the entire image, irrelevant background textures and noise are effectively suppressed, allowing the network to focus on the geometric structures of markings. This enhances the reliability and distinctiveness of extracted features, which is crucial for subsequent cross-sensor matching tasks.
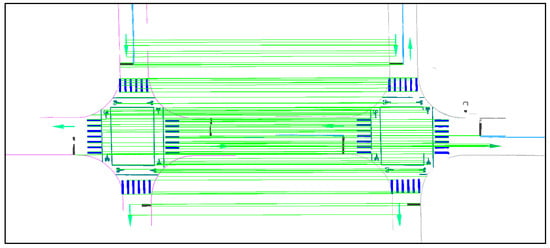
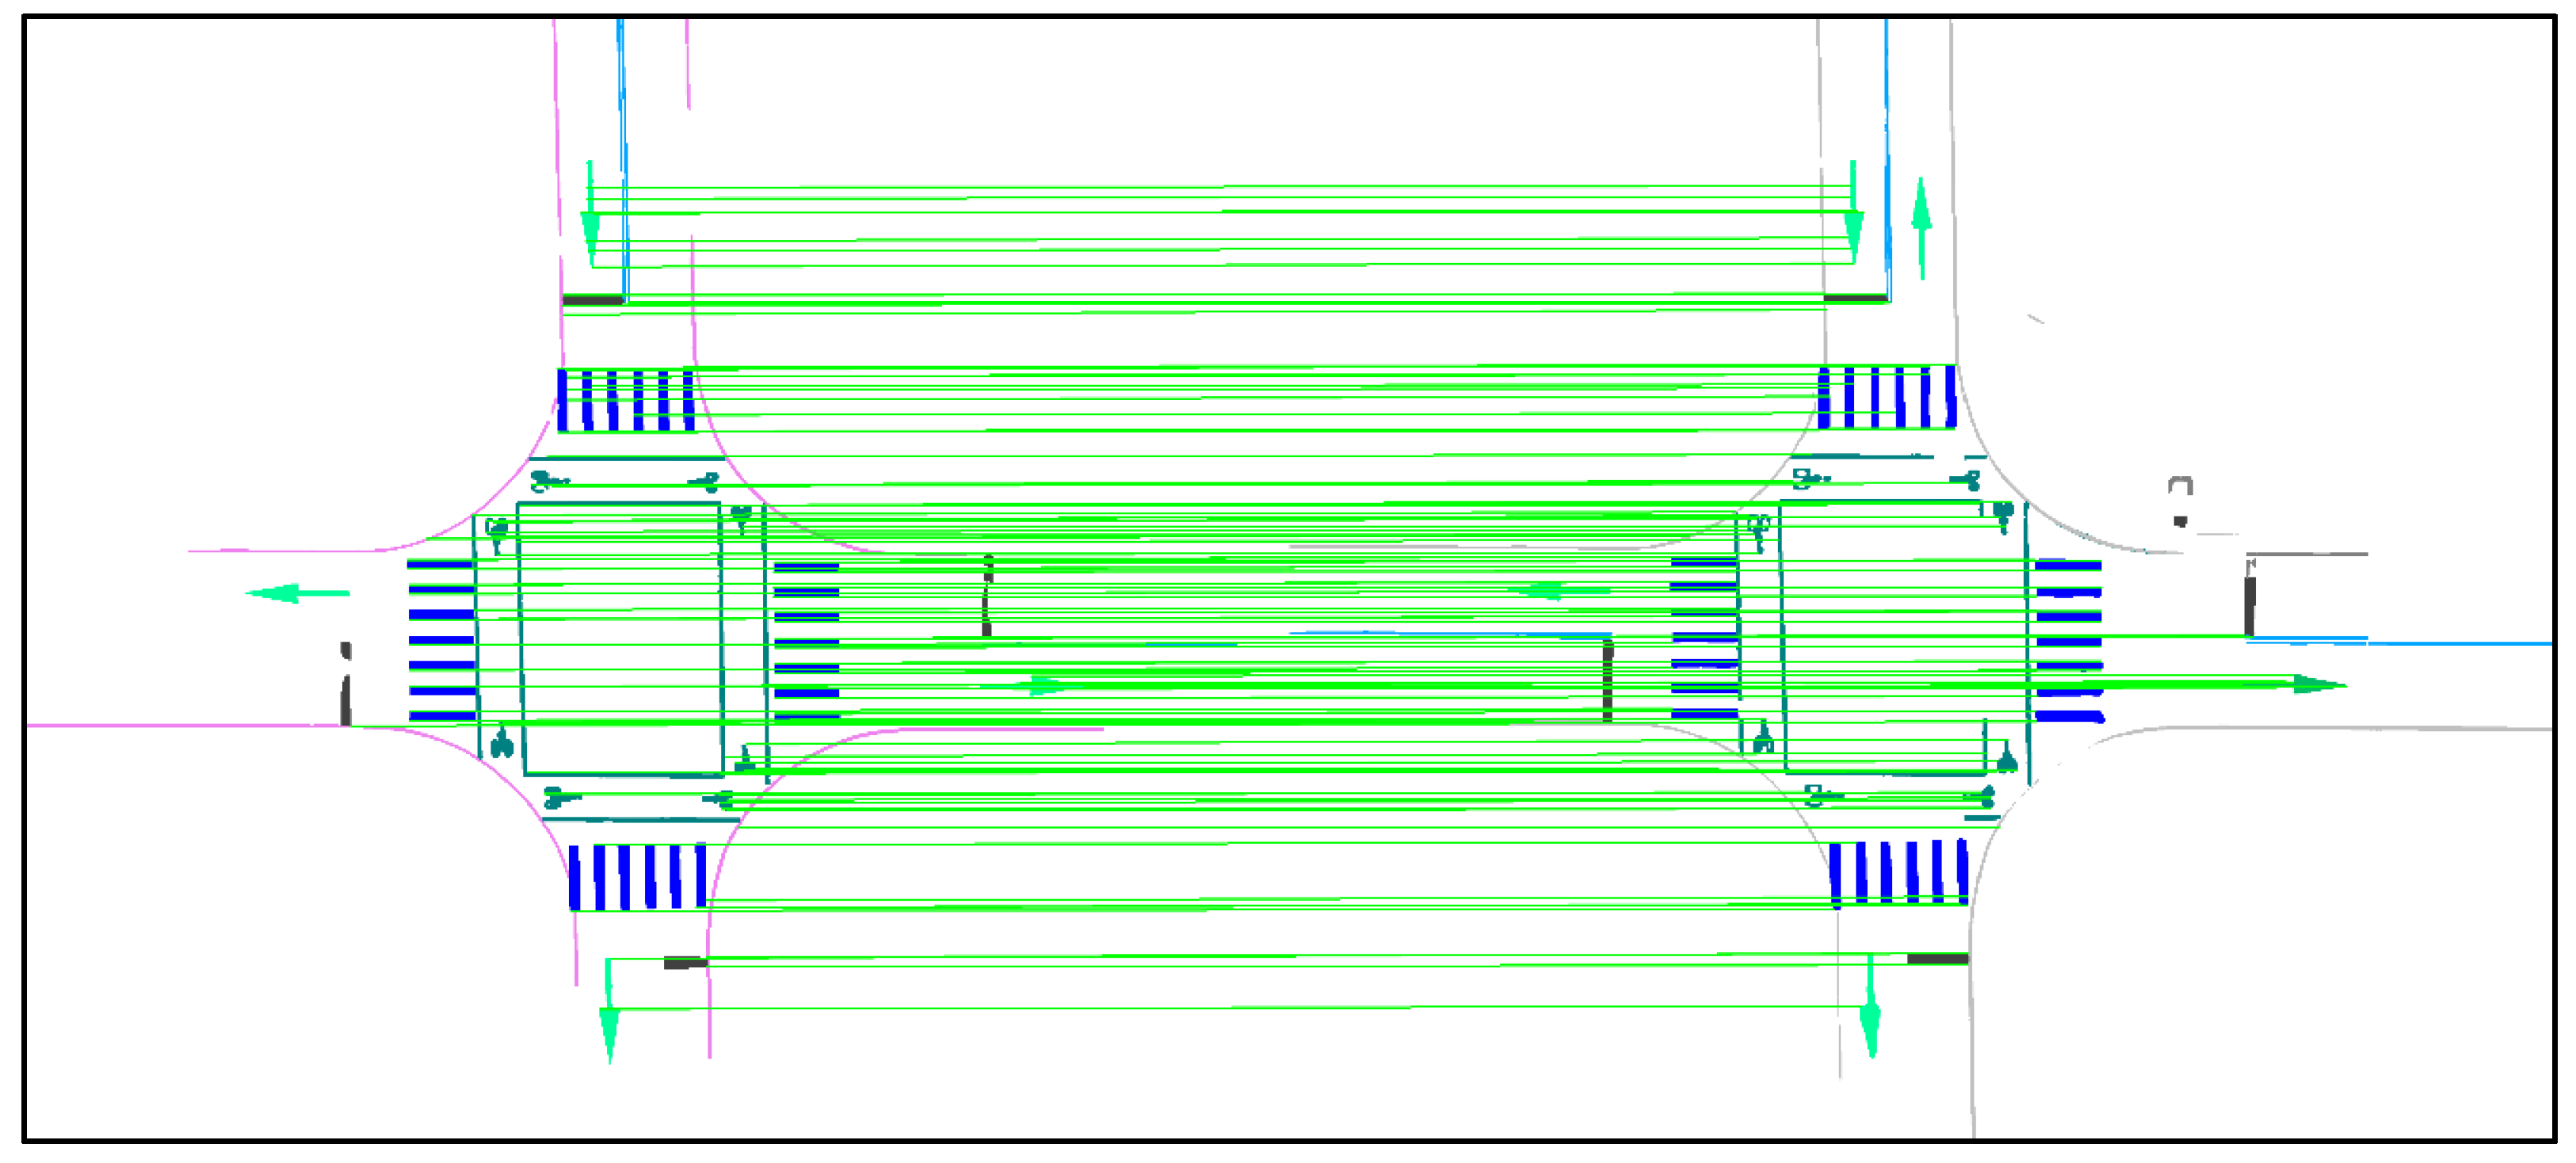
For feature matching, this study employed SuperGlue [23], a GNN-based framework that integrates descriptors from any detector (Figure 6). It comprises two modules: an attentional GNN, which propagates and aggregates information through self- and cross-attention layers, and an optimal matching layer, which estimates correspondences using a partial assignment matrix. A virtual “dustbin” node was introduced to handle unmatched points and reduce false matches. The matching process was formulated as a differentiable optimal transport problem and solved via the Sinkhorn algorithm, enabling end-to-end learning of geometric consistency. SuperGlue has demonstrated robustness across diverse conditions such as indoor/outdoor scenes, illumination changes, and wide baseline imagery.
Figure 6.
Illustration of SuperGlue feature matching (green lines) on semantic road marking imagery after RANSAC post-processing.
To further improve reliability, RANSAC [24] was applied as a post-processing step. By iteratively sampling minimal subsets of correspondences, RANSAC estimates geometric transformations and retains only inliers within a residual threshold, effectively eliminating outliers and mismatches.
2.3.3. Accuracy Assessment
The accuracy assessment is divided into two parts: the evaluation of matching quality and the evaluation of registration quality.
- Matching Quality Assessment
The quality of the matched correspondence points (e.g., tie points) was assessed using a reference transformation. The manually selected control point pairs were used to establish the parameters of an affine transformation, mapping the MLS intensity correspondences (x, y) into the UAV image coordinate system (X, Y) via the following equations:
where X and Y represent the coordinates of the conjugate points in the reference (UAV) coordinate system; x and y represent the coordinates of the conjugate points to be transformed (MLS); (a, b, c, d) include the factors of rotation, scaling, and shear; and (e, f) are the translation parameters. The selection of these manual control points ensured the accuracy of the transformation reference.
Based on this transformation, the spatial errors of the matched points were further assessed. Matches with errors less than 5 cm were classified as highly accurate, while those with errors between 5 cm and 10 cm were considered acceptable. The proportions of these categories were reported as quantitative indicators of the initial matching quality.
To quantify the overall matching performance, the correctness metric was defined as the ratio of correct matches (Mcorrect) to the total number of matched points (Mtotal):
- 2.
- Registration Quality Assessment
The final registration accuracy was evaluated by verifying the reliability of the filtered correspondences. The affine transformation was recomputed using the final set of filtered inliers (obtained after RANSAC). This transformation was then applied to the manually selected MLS control points, and the transformed coordinates were compared against the original UAV control points. This procedure allowed us to verify the reliability of the filtered correspondences. The final registration accuracy, based on the spatial discrepancies (e.g., RMSE) of the manually measured control points after transformation, was adopted as the ultimate quality indicator of the alignment between the two datasets.
3. Results and Discussions
The evaluation of the proposed semantic matching strategy and the subsequent registration accuracy were performed through five rigorous, comparative steps. First, we conducted a quantitative assessment of the efficiency and accuracy of the semantic feature extraction process (Section 3.1). Second, we performed a direct comparison between the proposed semantic-guided matching approach and conventional non-semantic-based matchings (Section 3.2). Third, we isolated the incremental value provided by the semantic segmentation constraint by analyzing the matching results with and without its application (Section 3.3). Fourth, an ablation study has been incorporated to quantitatively assess the efficacy of the proposed semantic-based matching process (Section 3.4). Fifth, the robustness of the semantic matching was analyzed against inherent geometrical noise and initial misalignments (Section 3.5). Finally, the applicability of the method was generalized by examining the influence of using different types of semantic objects (Section 3.6). The overall geometric accuracy of the final registered LiDAR data was quantitatively verified using manually selected GCPs via the mean error and RMSE.
3.1. Results of Semantic Feature Extraction
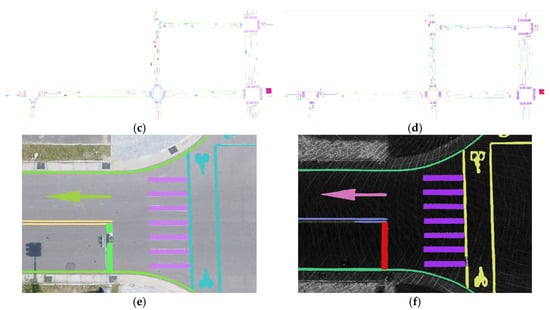
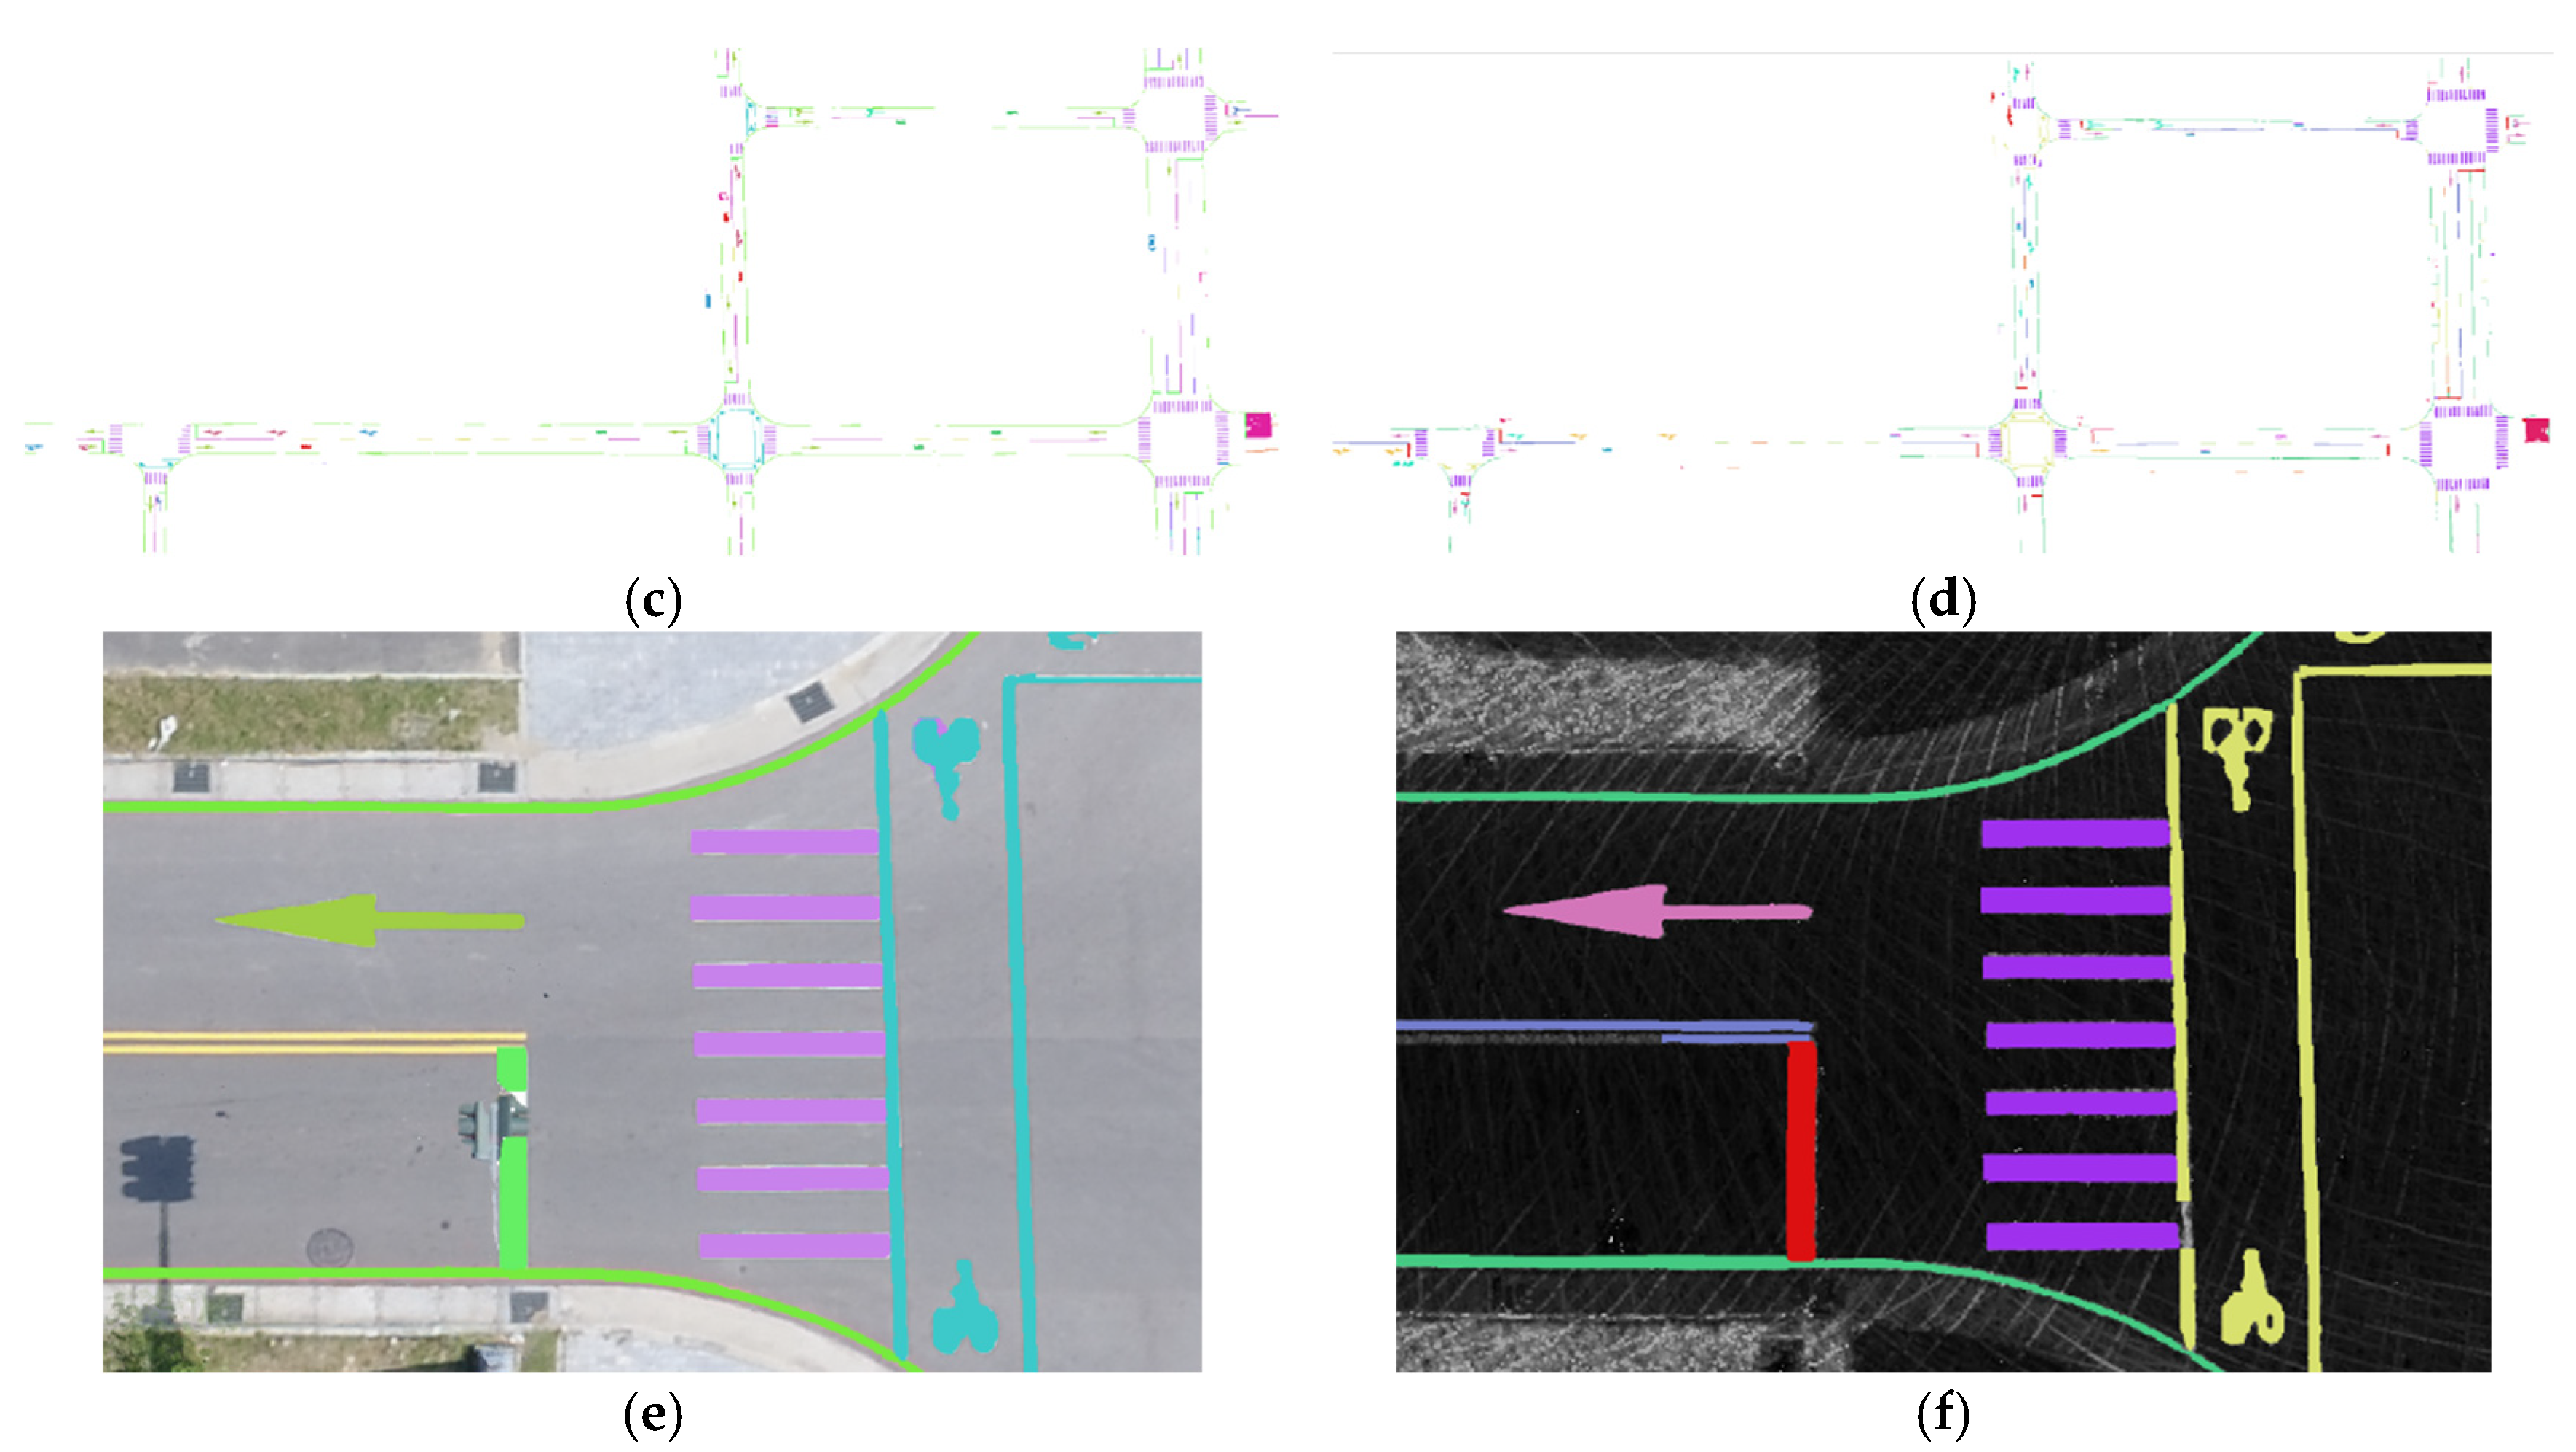
This section focuses on the performance comparison of semantic feature extraction between the UAV RGB orthoimage and the LiDAR intensity. To achieve consistent semantic representations, this study defined thirteen common road marking categories. Training data labels were manually digitized using the UAV orthoimage as the reference base for one model and the LiDAR intensity for a separate model. The labeled data were subsequently divided into an 80% training set and a 20% validation set. Following image tiling, the UAV training dataset comprised 1869 training tiles and 553 validation tiles, while the LiDAR intensity dataset included 1580 training tiles and 395 validation tiles. To validate the model’s performance on real-world data, an independent test image set, which was not used during training, was used for result visualization and quantitative analysis (Figure 7a,b).
Figure 7.
Semantic segmentation results of road markings (test regions). (a) UAV orthoimage; (b) MLS LiDAR intensity; (c) UAV orthoimage semantic segmentation results; (d) MLS LiDAR intensity semantic segmentation results; (e) UAV orthoimage semantic segmentation results (zoomed-in image); (f) MLS LiDAR intensity semantic segmentation results (zoomed-in image). Please note that the two semantic segmentation results use different colors for the same semantic objects. This is because LiDAR data does not contain color information, whereas the UAV orthophoto includes rich color information, and the classification labels between the two datasets are defined differently.
The segmentation performance for each class of road markings was quantitatively evaluated. The comparative results between the UAV orthoimage and the LiDAR intensity feature extraction outcomes are summarized in Table 2. Markings such as bicycle crossings, pedestrian crossings with regular shapes, and straight arrows were effectively captured, confirming the model’s robustness in identifying clear geometric structures across both sensor modalities. Overall, the model demonstrated notable accuracy for markings with stable geometric features and well-defined shapes. These markings were consistently recognized by both UAV and MLS datasets, indicating high cross-sensor reliability (Figure 7).
Table 2.
Accuracies for test data.
However, elongated and narrow markings, such as edge lines and directional restriction lines, posed significant challenges for the model; predictions often appeared broken or discontinuous, reflecting reduced segmentation quality. This challenge was further compounded by the inherent limitations of the respective image sources. UAV orthoimages, captured from a top-down nadir perspective, frequently contained markings partially occluded by objects (e.g., trees or traffic poles), resulting in missing or discontinuous predictions for the obscured segments. Conversely, the raw LiDAR data was sparser, especially toward the edges of the sensor’s field of view. The necessary interpolation applied to generate the LiDAR intensity image could distort or interrupt marking contours, thus affecting segmentation accuracy. Consequently, although the predicted markings visually approximated the actual markings in the images, their geometric positions could be deviated due to these systematic segmentation errors, further increasing the difficulty of subsequent feature matching. Therefore, the road markings, except for elongated and narrow markings, were the main features for semantic matching.
3.2. Comparison of Semantic-Based and Non-Semantic-Based Matchings
In this analysis, we focused on evaluating the applicability and robustness of the proposed semantic-based matching workflow against traditional and hybrid alternatives, specifically analyzing their performance under varying data quality conditions. The evaluation was structured around comparing matching combinations on both the original multi-sensor data and the semantically segmented data.
To ensure a fair comparison with traditional established methods, a robust version of SIFT, RootSIFT [25], was adopted. RootSIFT applies Hellinger normalization to SIFT descriptors, which significantly improves similarity measures and enhances matching reliability, particularly under varying illumination and grayscale conditions. Accordingly, SIFT and RootSIFT serve as the descriptors for both traditional matching (using FLANN) and the hybrid approach (using SuperGlue). The SuperPoint and SuperGlue combination represents the fully deep learning-based semantic matching strategy.
This fundamental difference highlights the advantage of the proposed semantic-based approach. By converting the inherently noisy LiDAR intensity into a consistent semantic image, the matching problem is effectively regularized. Traditional keypoint detectors, such as SIFT, rely heavily on stable gradient changes for corner detection (e.g., using the difference of Gaussians). However, the MLS LiDAR intensity, often being sparse and subject to interpolation noise, yields poor gradient stability, making the computation of robust keypoint descriptions challenging. Consequently, traditional SIFT-based matching is fundamentally ill-suited for the heterogeneous data registration between UAV orthoimages and LiDAR intensity. The semantic transformation provides a robust intermediate representation that overcomes this dependency on low-level gradient fidelity.
To provide a detailed performance comparison, two representative test scenarios were selected as local image patches. (1) Case 1 represents a high-quality area where road markings are clearly defined, complete, and exhibit stable geometric structures across both the UAV orthoimages and the MLS intensity. (2) Case 2 corresponds to a lower-quality section, typically found in degraded regions, such as turning areas or zones with sparse or distorted LiDAR data, resulting in incomplete markings or poorly defined markings.
3.2.1. Case 1: Matching Performance in High-Quality Areas (Semantic-Based and Non-Semantic-Based Matchings)
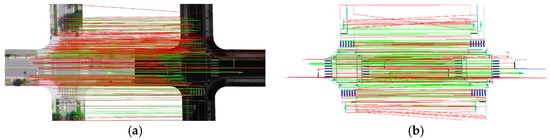
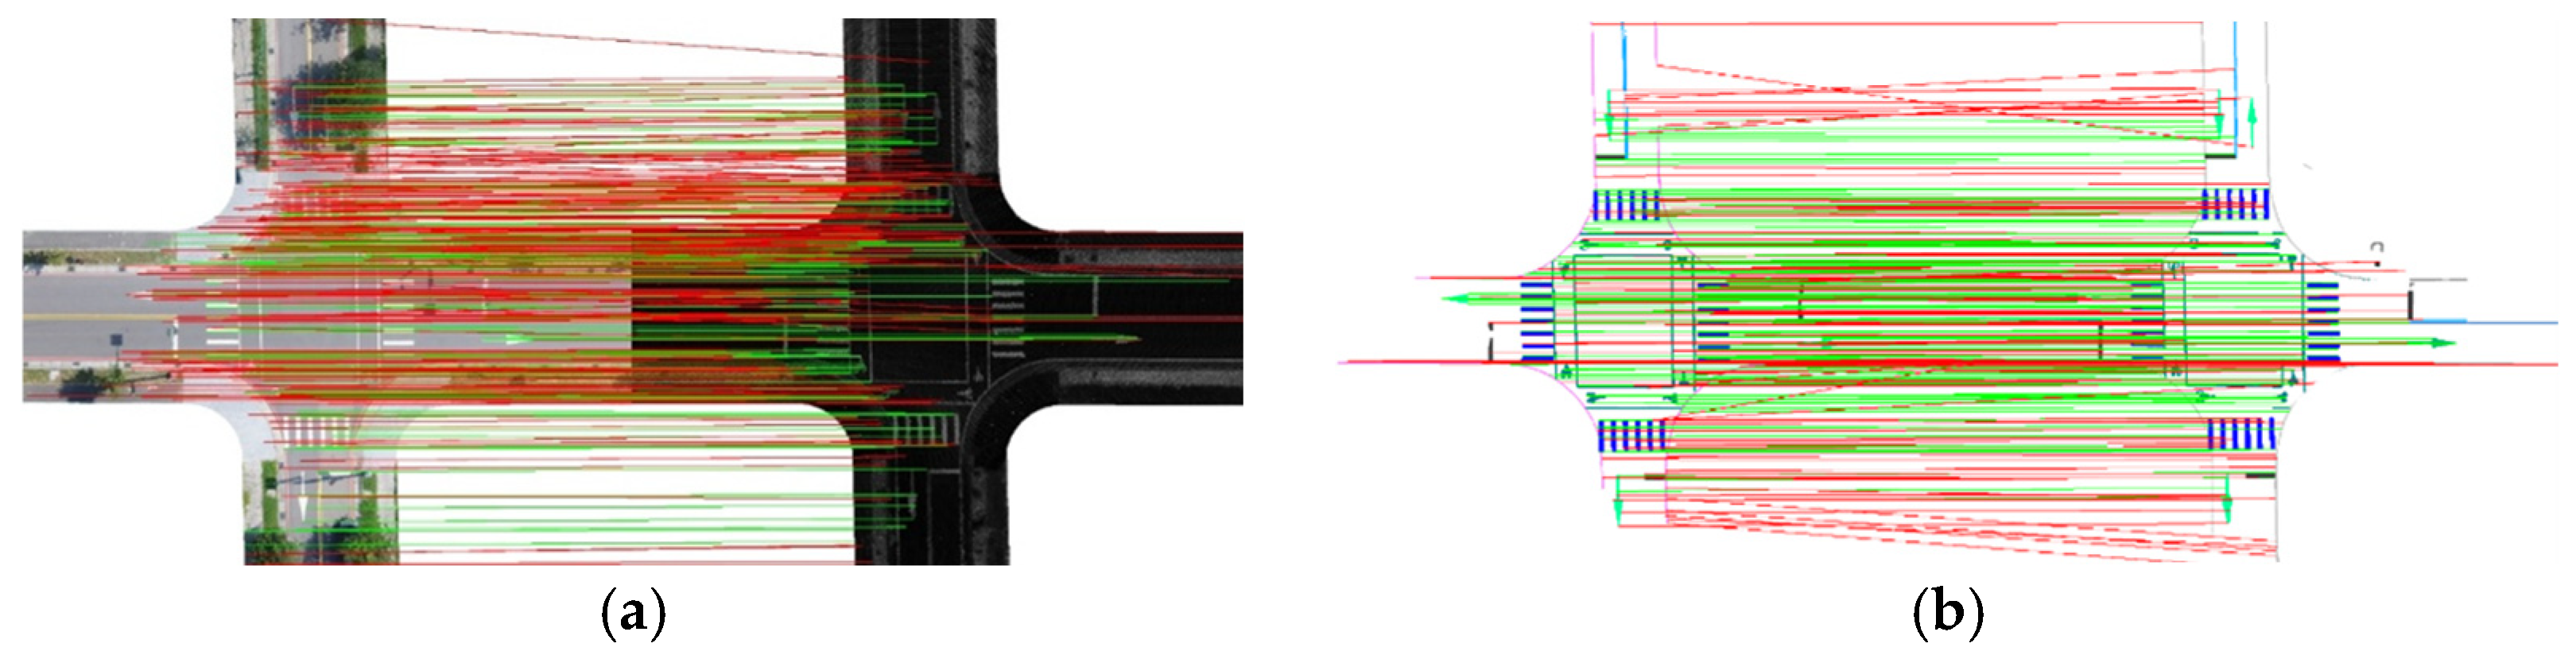
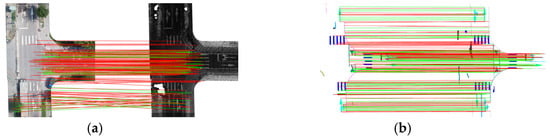
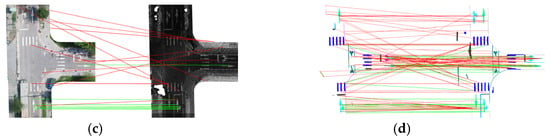
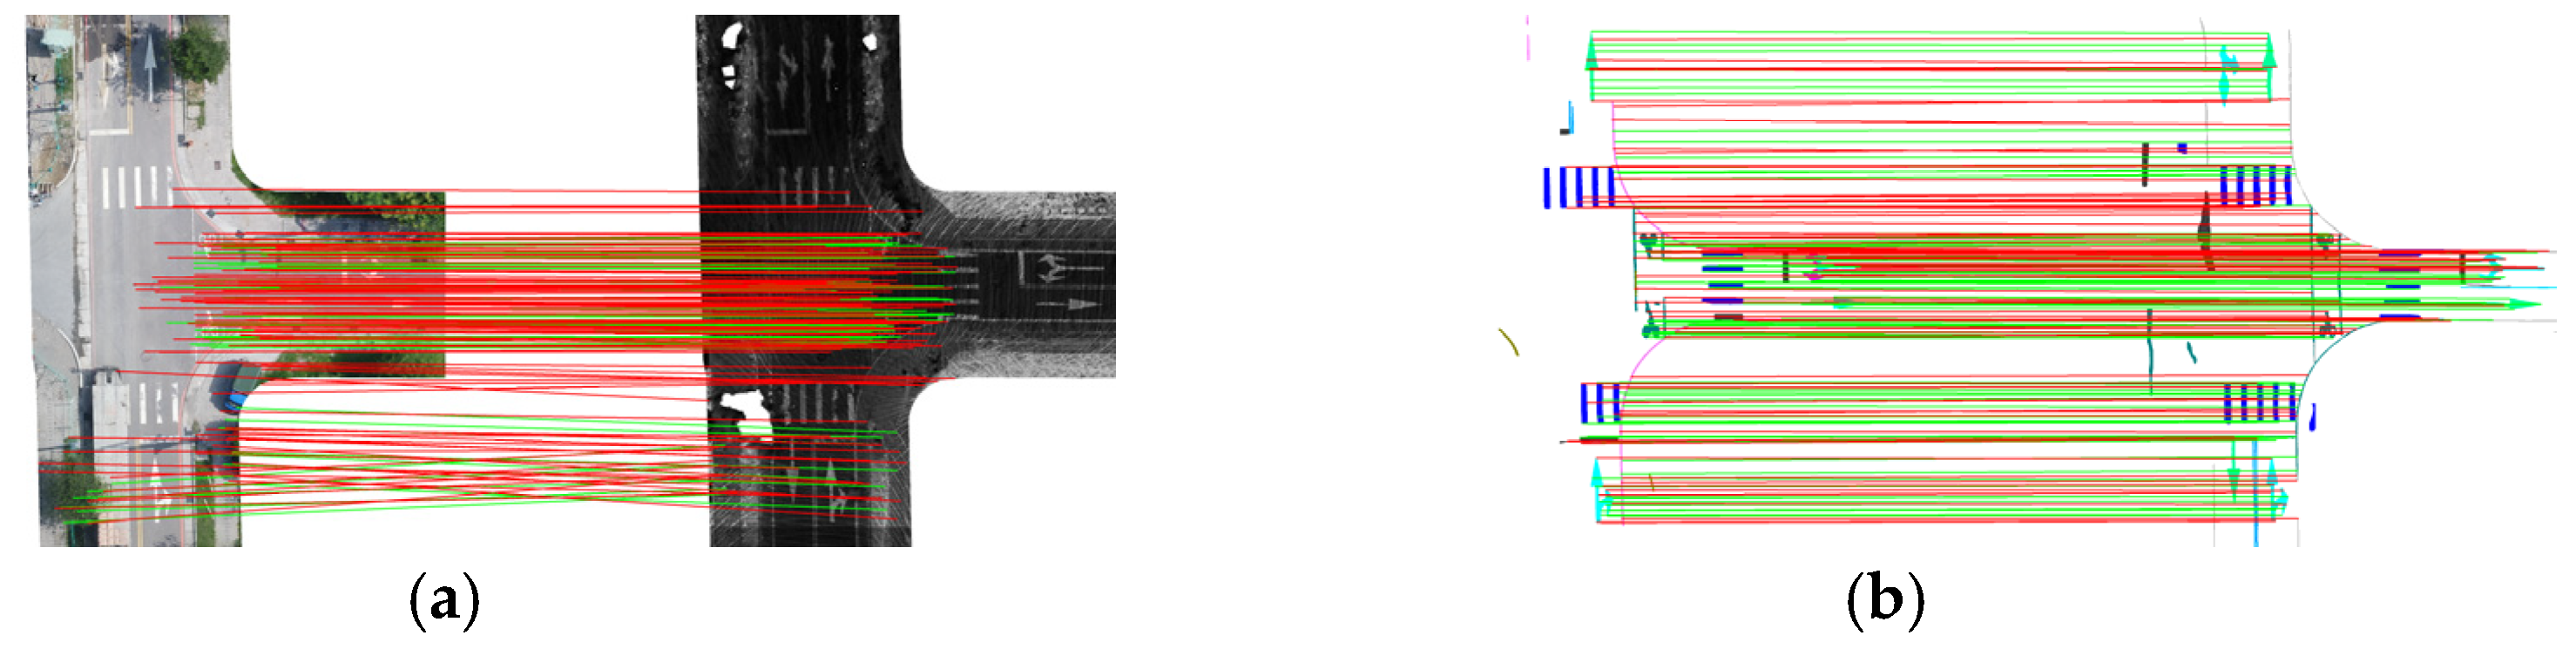
In the high-quality scene, both the UAV and MLS exhibited clear lane markings and stable geometric structures. The quantitative results are summarized in Table 3. Initial matching points denote the correspondences obtained by each method without applying any semantic constraints. Semantic-constrained matching points represent the refined correspondences after applying semantic constraints and post-RANSAC filtering. Across all matching methods, applying the workflow to semantic images consistently yielded a higher number of matches and superior precision compared to matching on original images. The SuperPoint + SuperGlue combination achieved the highest stability, evidenced by a markedly higher RANSAC inlier ratio when used on semantic images. This definitively confirms that isolating semantic cues dramatically enhances matching reliability by filtering irrelevant background noise and minimizing the effects of cross-sensor appearance discrepancies. In contrast, SIFT + FLANN performed poorly on the original, heterogeneous images due to inherent grayscale and texture differences, but its performance improved notably when applied to semantic images, demonstrating that semantic segmentation effectively normalizes the image appearance and mitigates illumination/radiometric effects (Figure 8). The use of RootSIFT further improved stability, an outcome consistent with prior findings on descriptor robustness. While FLANN-based methods were limited by descriptor similarity and grayscale sensitivity, SuperGlue, leveraging GNNs and contextual reasoning, maintained stable performance regardless of the underlying descriptors (SIFT/RootSIFT vs. SuperPoint). Overall, deep learning-based detectors (i.e., SuperPoint) exhibited clear advantages when road markings and semantic features were well defined.
Table 3.
Quantitative results of different image matching strategies (case 1).
Figure 8.
Matching results for case 1. Red lines for incorrect matching and green lines for constrained matching. (a) SuperPoint + SuperGlue using an original image; (b) SuperPoint + SuperGlue using a semantic image; (c) SIFT + FLANN using an original image; (d) SIFT + FLANN using a semantic image.
3.2.2. Case 2: Matching Performance in Low-Quality Areas (Semantic-Based and Non-Semantic-Based Matchings)
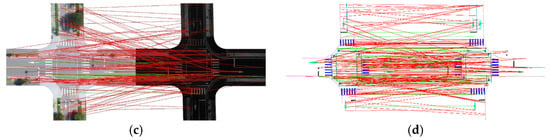
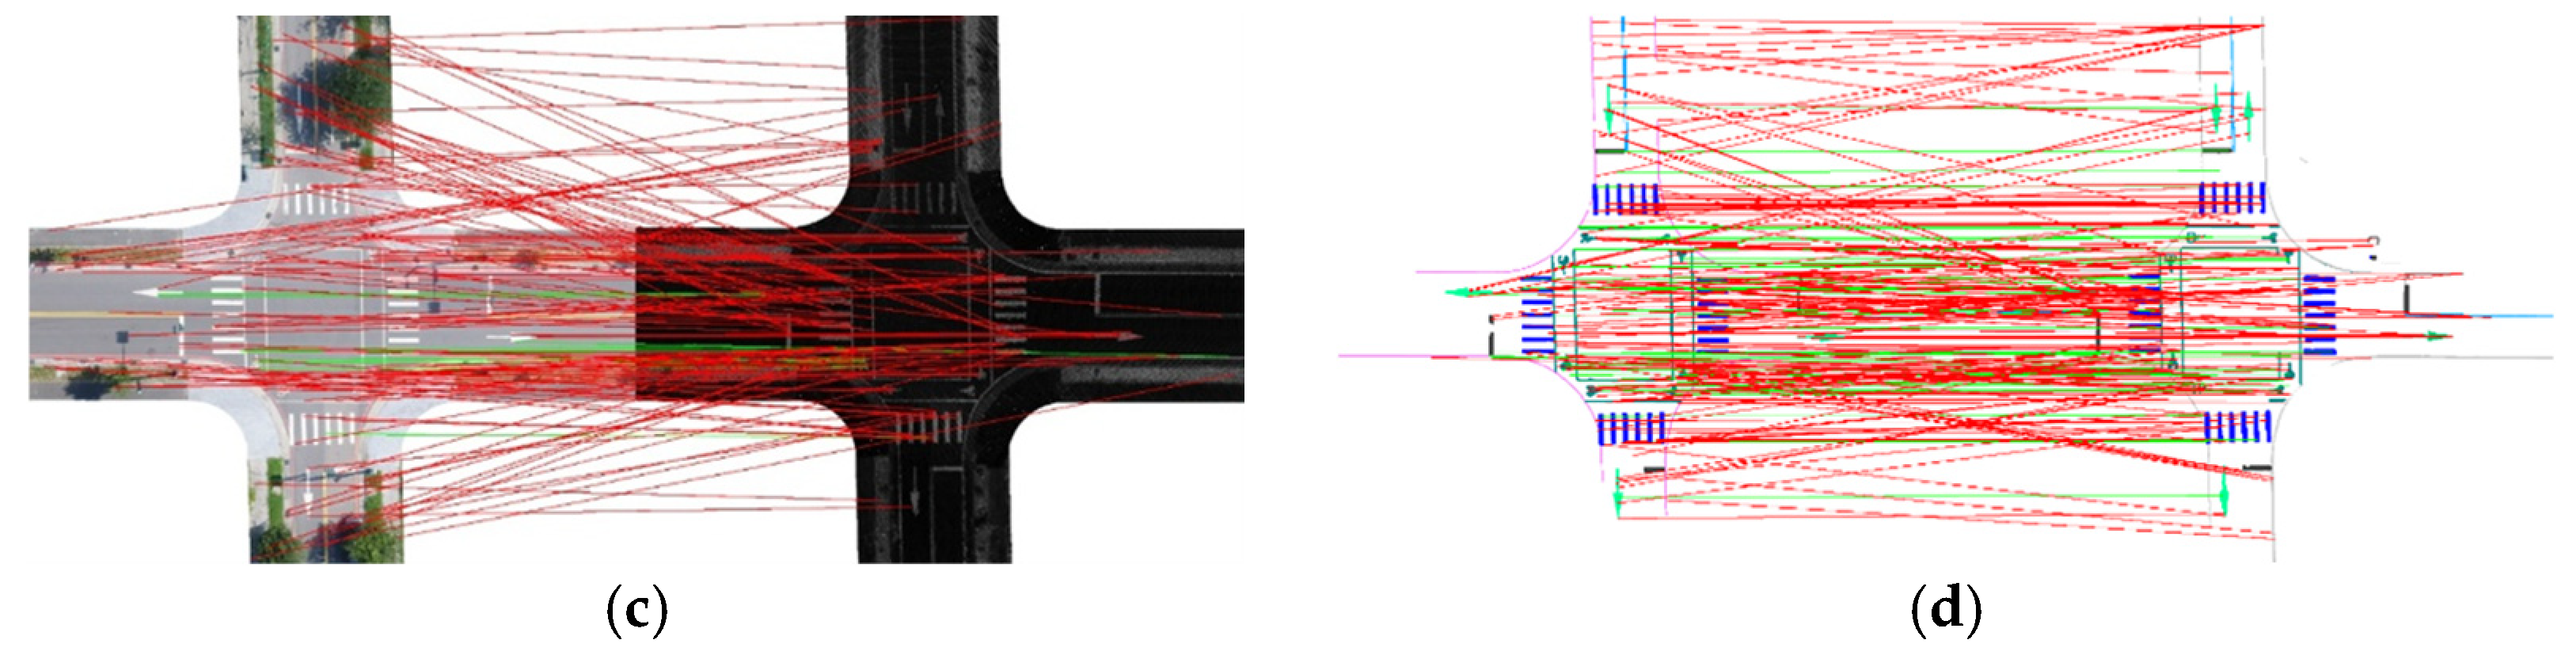
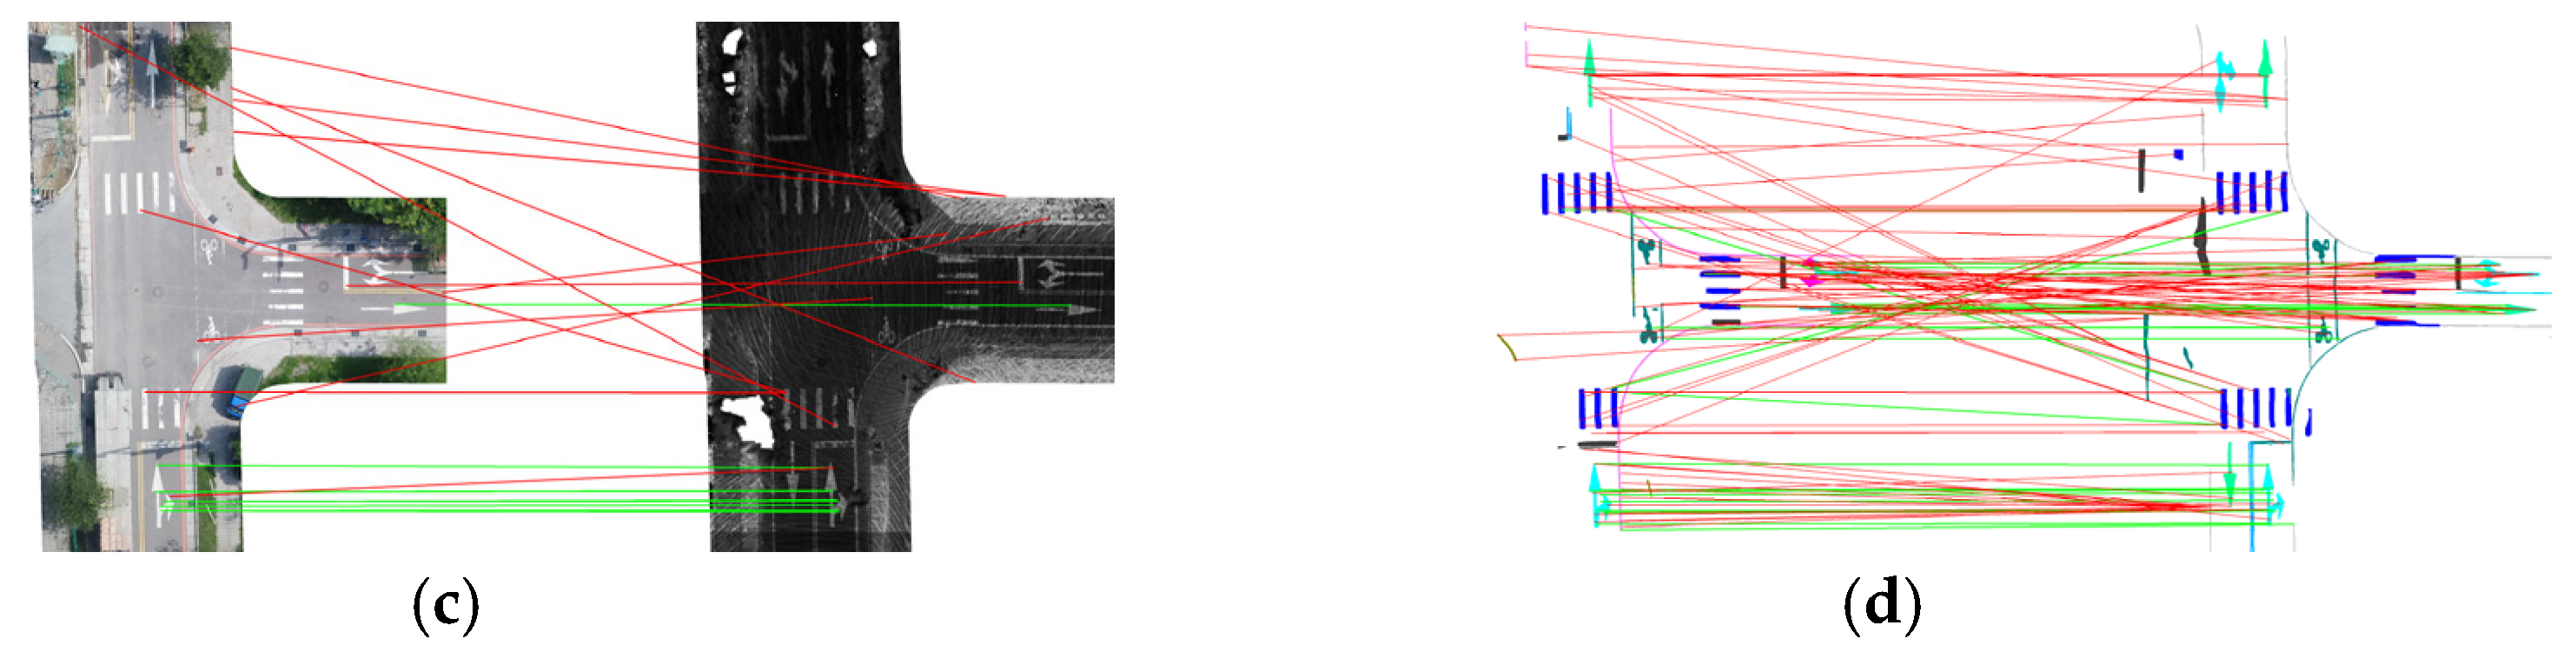
In degraded regions, where MLS intensity often suffered from sparse points and incomplete markings due to sensor limitations or unfavorable incidence angles, the difficulty of feature matching increased significantly. The quantitative evaluation for case 2 is presented in Table 4. Initial matching points denote the correspondences obtained by each method without applying any semantic constraints. Semantic-constrained matching points represent the refined correspondences after applying semantic constraints and post-RANSAC filtering. In this scenario, all combinations exhibited a reduced overall matching quality and a lower number of correspondences when applied to original images. However, when applied to semantic images, all methods still achieved more stable and accurate correspondences than they did on the original data. Among them, SuperPoint + SuperGlue consistently outperformed the others, demonstrating superior robustness and the highest correctness, even under poor semantic image conditions (e.g., incomplete or discontinuous markings). Figure 9 presents a visual comparison of the semantic matching results of SuperPoint + SuperGlue and SIFT + FLANN.
Table 4.
Quantitative results of different image matching strategies (case 2).
Figure 9.
Matching results for case 2. Red lines for incorrect matching and green lines for constrained matching. (a) SuperPoint + SuperGlue using an original image; (b) SuperPoint + SuperGlue using a semantic image; (c) SIFT + FLANN using an original image; (d) SIFT + FLANN using a semantic image.
Based on the detailed analysis of local image patches in the previous two cases, the combination of SuperPoint and SuperGlue achieved the highest number of stable correspondences on the semantic road marking images. When this method was subsequently scaled up and applied to the entire global test area, the results similarly showed that matching performance on semantic images was significantly better than on original images (Table 5), thus unequivocally demonstrating its effectiveness in addressing the challenging cross-sensor matching problem.
Table 5.
Results for a large area using SuperPoint and SuperGlue.
3.3. Comparison of Semantic Constraint Effectiveness
This section focuses on evaluating the incremental benefit of introducing the semantic constraint (i.e., restricting matches to features of the same road marking class) into the local image matching process. One crucial advantage of transforming the heterogeneous input images into consistent semantic representations (as detailed in Section 3.1) is the ability to leverage these discrete semantic categories as an additional constraint. In this analysis, the optimal feature detection and matching combination identified in Section 3.2 was used and tested using the same two scenarios: case 1 (high-quality area) and case 2 (low-quality area). The primary goal of applying the semantic constraint was to effectively prune potential mismatches that occurred between geometrically similar but semantically distinct road marking features (e.g., matching a pedestrian crossing line to a stop line), thus significantly enhancing the robustness and correctness of the correspondence set.
3.3.1. Case 1: Matching Performance in High-Quality Areas (Semantic Constraint)
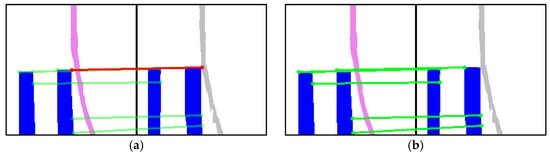
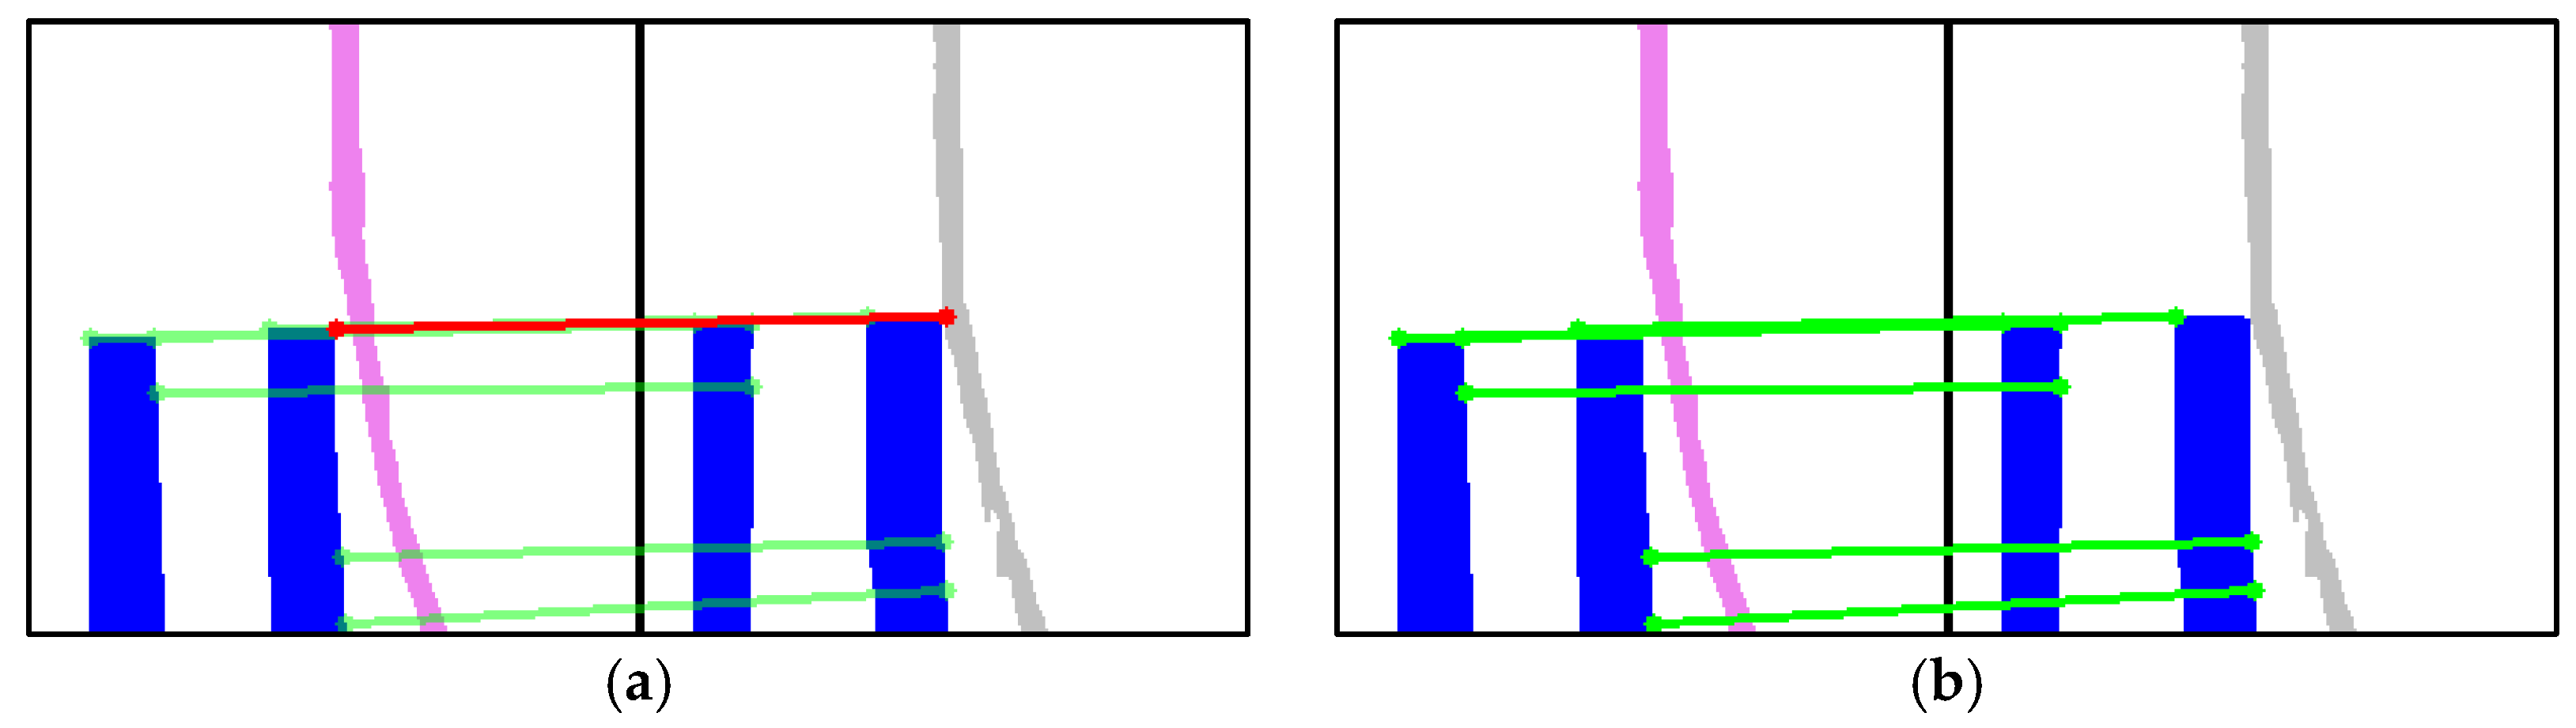
In the high-quality scene, where road markings were clear and accurately segmented, most initial correspondences established by SuperGlue already maintained high semantic consistency. The descriptions of different types are as follows:
- Directional arrows: The isolated nature and distinct shape of the directional arrows led to stable keypoints extraction, resulting in a high RANSAC inlier ratio. Even without explicit semantic filtering, the initial matches largely preserved semantic consistency.
- Pedestrian and bicycle crossings: These markings were often spatially adjacent to lines like bicycle crossings and no-parking lines. This spatial proximity introduced occasional ambiguity during matching (Figure 10). However, their regular, robust shapes and distinct corners, combined with the subsequent semantic constraint, ensured that the overall matching quality remained satisfactory, effectively suppressing most errors.Figure 10. Illustration of semantic constraints for case 1. (a) Pedestrian crossing with mismatched edge lines (red line); (b) Matching results after applying semantic constraints (only green lines).
- Elongated/continuous markings: Directional restriction lines and no-parking lines, due to their elongated and continuous geometry, hindered stable corner and keypoint extraction. Furthermore, the semantic segmentation model showed limited recognition and continuity for these narrow markings in both UAV and MLS, ultimately reducing the matching robustness for these specific classes.
Overall, the SuperPoint + SuperGlue combination achieved stable and reliable results, with most correspondences inherently meeting semantic consistency. The semantic constraint served mainly to confirm and enforce consistency by removing minor mismatches that occurred between closely neighboring markings.
3.3.2. Case 2: Matching Performance in Low-Quality Areas (Semantic Constraint)
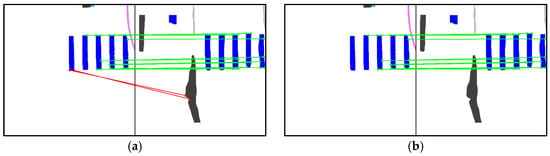
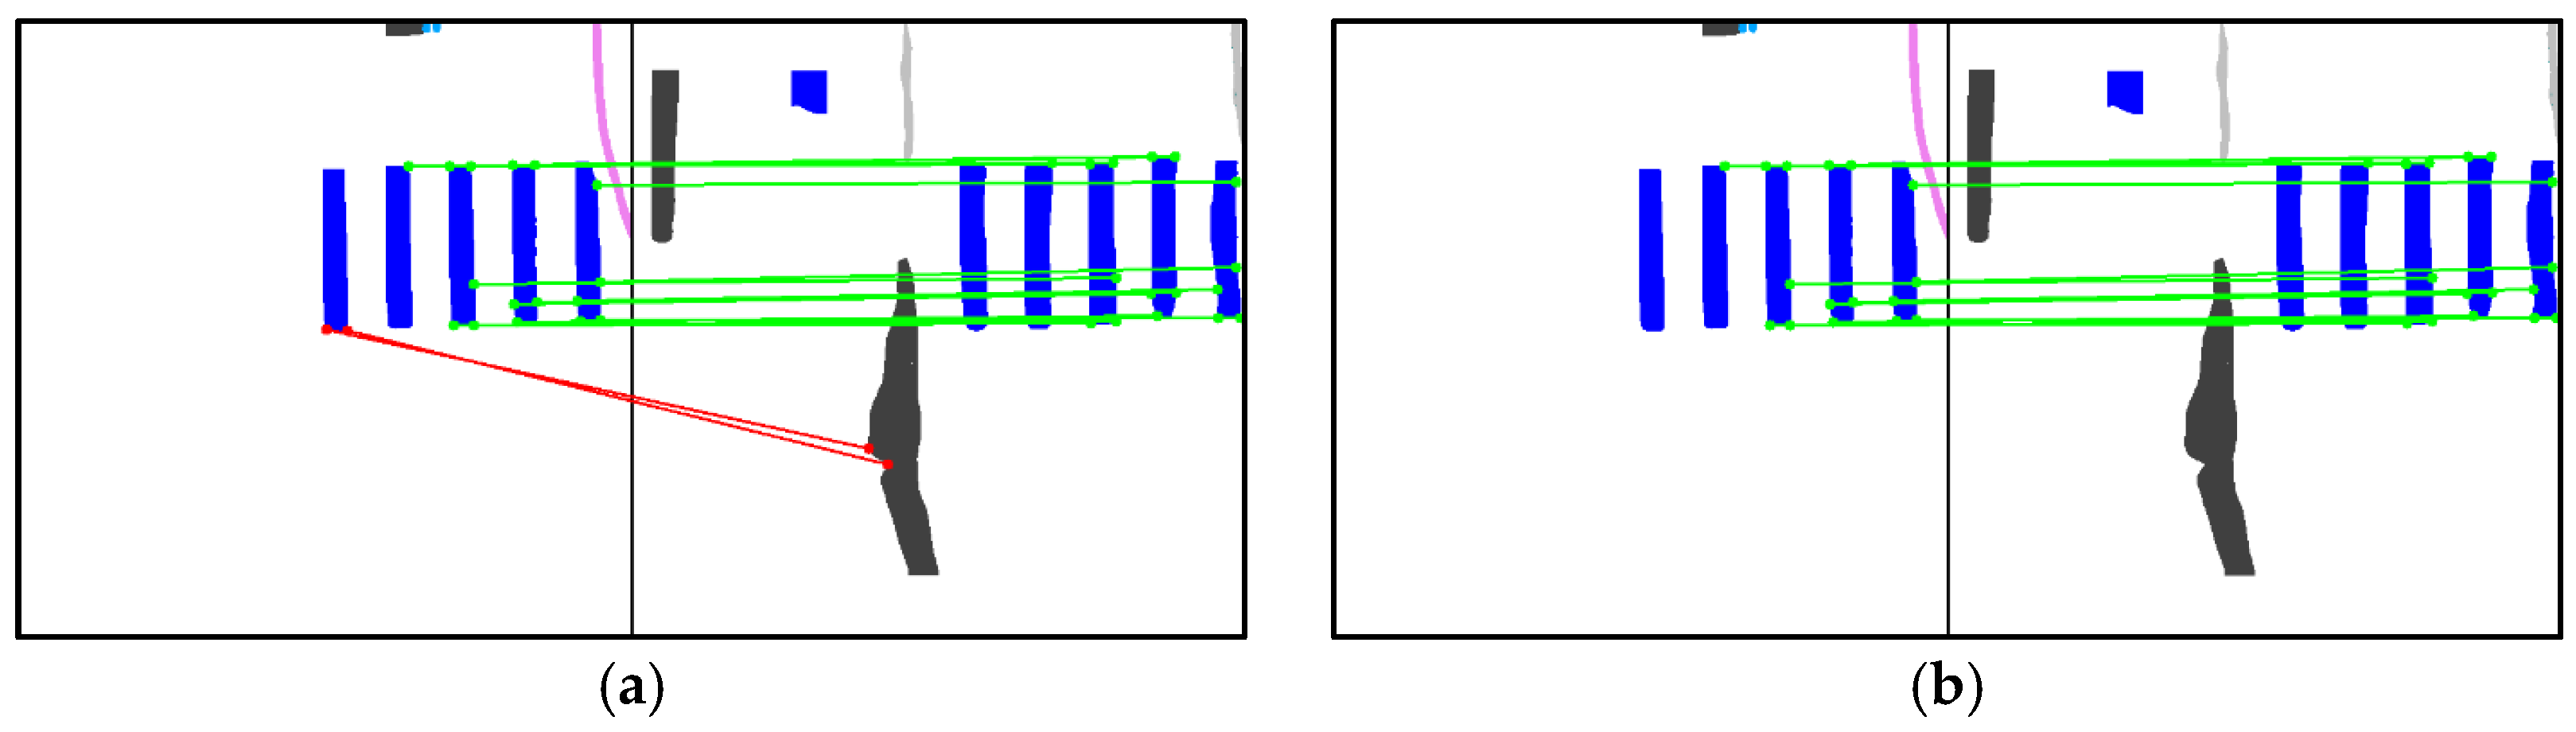
In the low-quality scenario, the degraded image quality often reduced the precision of the initial semantic segmentation, leading to occasional semantic misclassification and, subsequently, affecting the matching results.
- Directional arrows: Despite the low image quality, directional arrows maintained nearly complete semantic consistency in the initial matches, demonstrating their strong geometric recognizability and spatial stability across sensor modalities.
- Pedestrian crossings: Similar to case 1, pedestrian crossings adjacent to bicycle crossings and no-parking lines caused confusion during matching (Figure 11). In this low-quality case, some features were incorrectly matched to directional restriction lines. The semantic constraint overcame the incorrect matching, highlighting the constraint’s value in this scenario.Figure 11. Illustration of semantic constraints for case 2. (a) Pedestrian crossing with mismatched edge lines (red line); (b) Matching results after applying semantic constraints (only green lines).
- Stop lines: A critical issue was observed for stop lines. Mislabeling during the initial semantic segmentation process produced incorrect semantic assignments. This semantic error led to the rejection of keypoints that were geometrically correct during the matching process, thereby reducing the overall quality and reliability of the final correspondence set for this class.
In summary, the comparison of results with and without semantic constraints confirms that the constraint was highly effective in eliminating false matches between distinct road marking categories that were geometrically similar or in close proximity. However, the reliability of the semantic constraint was inherently dependent on the accuracy of the initial semantic segmentation. While directional arrows and pedestrian crossings showed stable performance, the presence of misclassification (as seen with stop lines in case 2) could introduce errors, causing the constraint to incorrectly reject geometrically valid correspondences, thus demonstrating the trade-off between semantic filtering and segmentation accuracy.
3.4. Ablation Study of RANSAC
To evaluate the effectiveness of RANSAC in the semantic matching process, we conducted an ablation study. The SuperPoint + SuperGlue method was selected for testing. First, keypoints were extracted from both RGB–intensity image pairs and semantic image pairs. Registration accuracy was then estimated using matched keypoints with and without RANSAC filtering. The results are presented in Table 6.
Table 6.
Quantitative evaluation with and without RANSAC filtering.
When RANSAC is applied, the registration accuracy is below 10 cm in all semantic-image scenarios. In terms of both accuracy and the number of valid matching points, semantic image matching combined with RANSAC provides the most reliable performance. Without RANSAC, only the SuperPoint + SuperGlue method is capable of achieving satisfactory registration accuracy on semantic images, while performance on RGB–intensity pairs remains unstable.
3.5. Influence of Geometrical Sensitivity for Semantic Matching
This section presents a systematic simulation analysis focused on evaluating the practical geometrical robustness and error tolerance of the proposed semantic feature matching framework under controlled geometric distortions. We aimed to characterize the limits of the proposed method’s applicability when faced with the intrinsic initial misalignment errors present in real-world heterogeneous datasets.
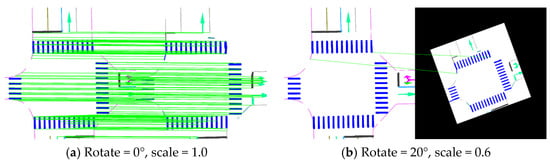
To simulate potential initial geometric variations (e.g., imperfect initial geo-registration due to instability of the POS), the semantic images derived from the MLS dataset were subjected to known rotations (0–20°) and rescaling (1.0–0.6) relative to the UAV reference image. The core matching algorithms were tested using three configurations: SuperPoint + SuperGlue (the proposed method), SIFT + FLANN, and SIFT + SuperGlue (serving as baselines).
The reference correspondences were established using the SuperPoint + SuperGlue combination under the baseline condition (rotation = 0°, scale = 1.0) after strict RANSAC filtering. For each simulated case, affine transformations were estimated using the matched points to derive the ground-truth geometric positions, and the matches were classified as correct if their spatial error was less than 5 pixels (≈10 cm @2 cm spatial resolution). The metrics reported (Table 7) include initial matching points count and semantic constrained matching points count (post-RANSAC), and correctness (Equation (3)).
Table 7.
Simulation error matching results.
Due to the significant difference between heterogeneous data, the results showed that SuperPoint + SuperGlue achieved a high baseline correctness (58%) and maintained moderate robustness under small transformations (e.g., rotation =5°, scale = 0.6). However, the performance degraded rapidly with larger geometric changes, with the correctness dropping below 28% at rotation ≥ 15°and nearly failing at rotation = 20°, scale = 0.6, as shown in Figure 12. In stark contrast, SIFT + FLANN exhibited stable performance across all simulated conditions, reflecting its inherent design for explicit scale and rotation invariance. Similarly, SIFT + SuperGlue exhibited relatively stable performance against geometric transformations, confirming that SIFT-based descriptors maintain superior scale invariance against large geometric variations, even when paired with a learning-based matcher.
Figure 12.
Image simulation error results. Green lines indicated the matching points.
From a methodological perspective, these findings highlight that SuperPoint’s underlying FCN-based detector and descriptor inherently lack explicit rotation and scale invariance, i.e., its robustness is highly dependent on the diversity of its training data. The pre-trained model used here was not explicitly optimized for large geometric misalignments in semantic imagery, leading to significant performance degradation under large geometric distortions. Conversely, SIFT explicitly incorporated scale-space extrema detection and orientation normalization, granting superior stability under large geometric variations, albeit with lower semantic consistency compared to learning-based methods.
In the simulation analysis, we applied synthetic distortions up to 15° rotation and 0.6 scale variation. These values are significantly larger than the trajectory errors reported in the previous studies [25,26] and therefore do not represent typical operational POS inaccuracies. Instead, they were intentionally selected to create a stress-test scenario, allowing us to evaluate the robustness and failure boundaries of the proposed semantic-constrained matching framework under extreme perturbations. In practice, such large angular deviations would be unlikely given the performance characteristics of modern GNSS/INS systems.
3.6. Influence of Different Semantic Objects
This section presents a detailed object-specific analysis to investigate the influence of different road marking categories on the robustness and correctness of the proposed semantic feature matching pipeline. The goal was to systematically quantify the effectiveness provided by each semantic class and identify the most reliable features for cross-sensor registration. Two representative areas were analyzed based on their inherent geometric complexity: (1) intersections and (2) mid-road segments. Each semantic category was independently extracted from the segmentation results and processed through the feature matching pipeline.
3.6.1. Case 1: Intersection
For intersections, where markings are geometrically complex and diverse, five major semantic classes of road markings were considered: (1) directional arrow, (2) pedestrian crossing, (3) bicycle crossing, (4) stop line, and (5) slim road markings such as directional restriction line and edge lines.
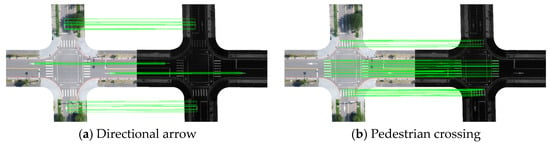
Semantic categories exhibited distinct matching behaviors. Pedestrian crossings achieved a correctness of 58%, while directional arrows reached 52%, both showing highly reliable matching performance (Figure 13). Their clear boundaries and well-defined geometric patterns contributed to stable correspondences across different modalities, indicating that markings with regular and structured shapes are more likely to yield accurate matches. Similarly, bicycle crossings also demonstrated high matching reliability for the same reason. In contrast, slim road markings, such as directional restriction lines, showed a correctness of only 6%, reflecting their unstable matching behavior. Their elongated and homogeneous structures lacked distinctive corners or junctions, making it difficult for the model to establish consistent correspondences. Stop lines, although geometrically simple, were occasionally affected by occlusion in UAV imagery, which reduced their effectiveness.
Figure 13.
Case 1—Different semantic object matching result. Green lines indicated the matching points.
These observations indicate that applying feature matching separately to each semantic category enables parameter tuning according to geometric characteristics, resulting in more accurate and robust correspondences in intersection environments.
3.6.2. Case 2: Mid-Road Segments
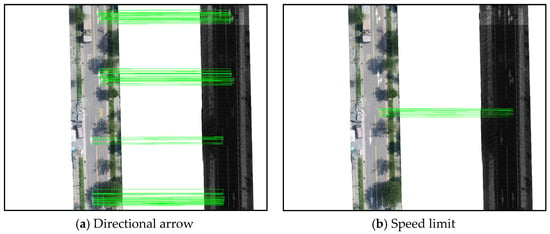
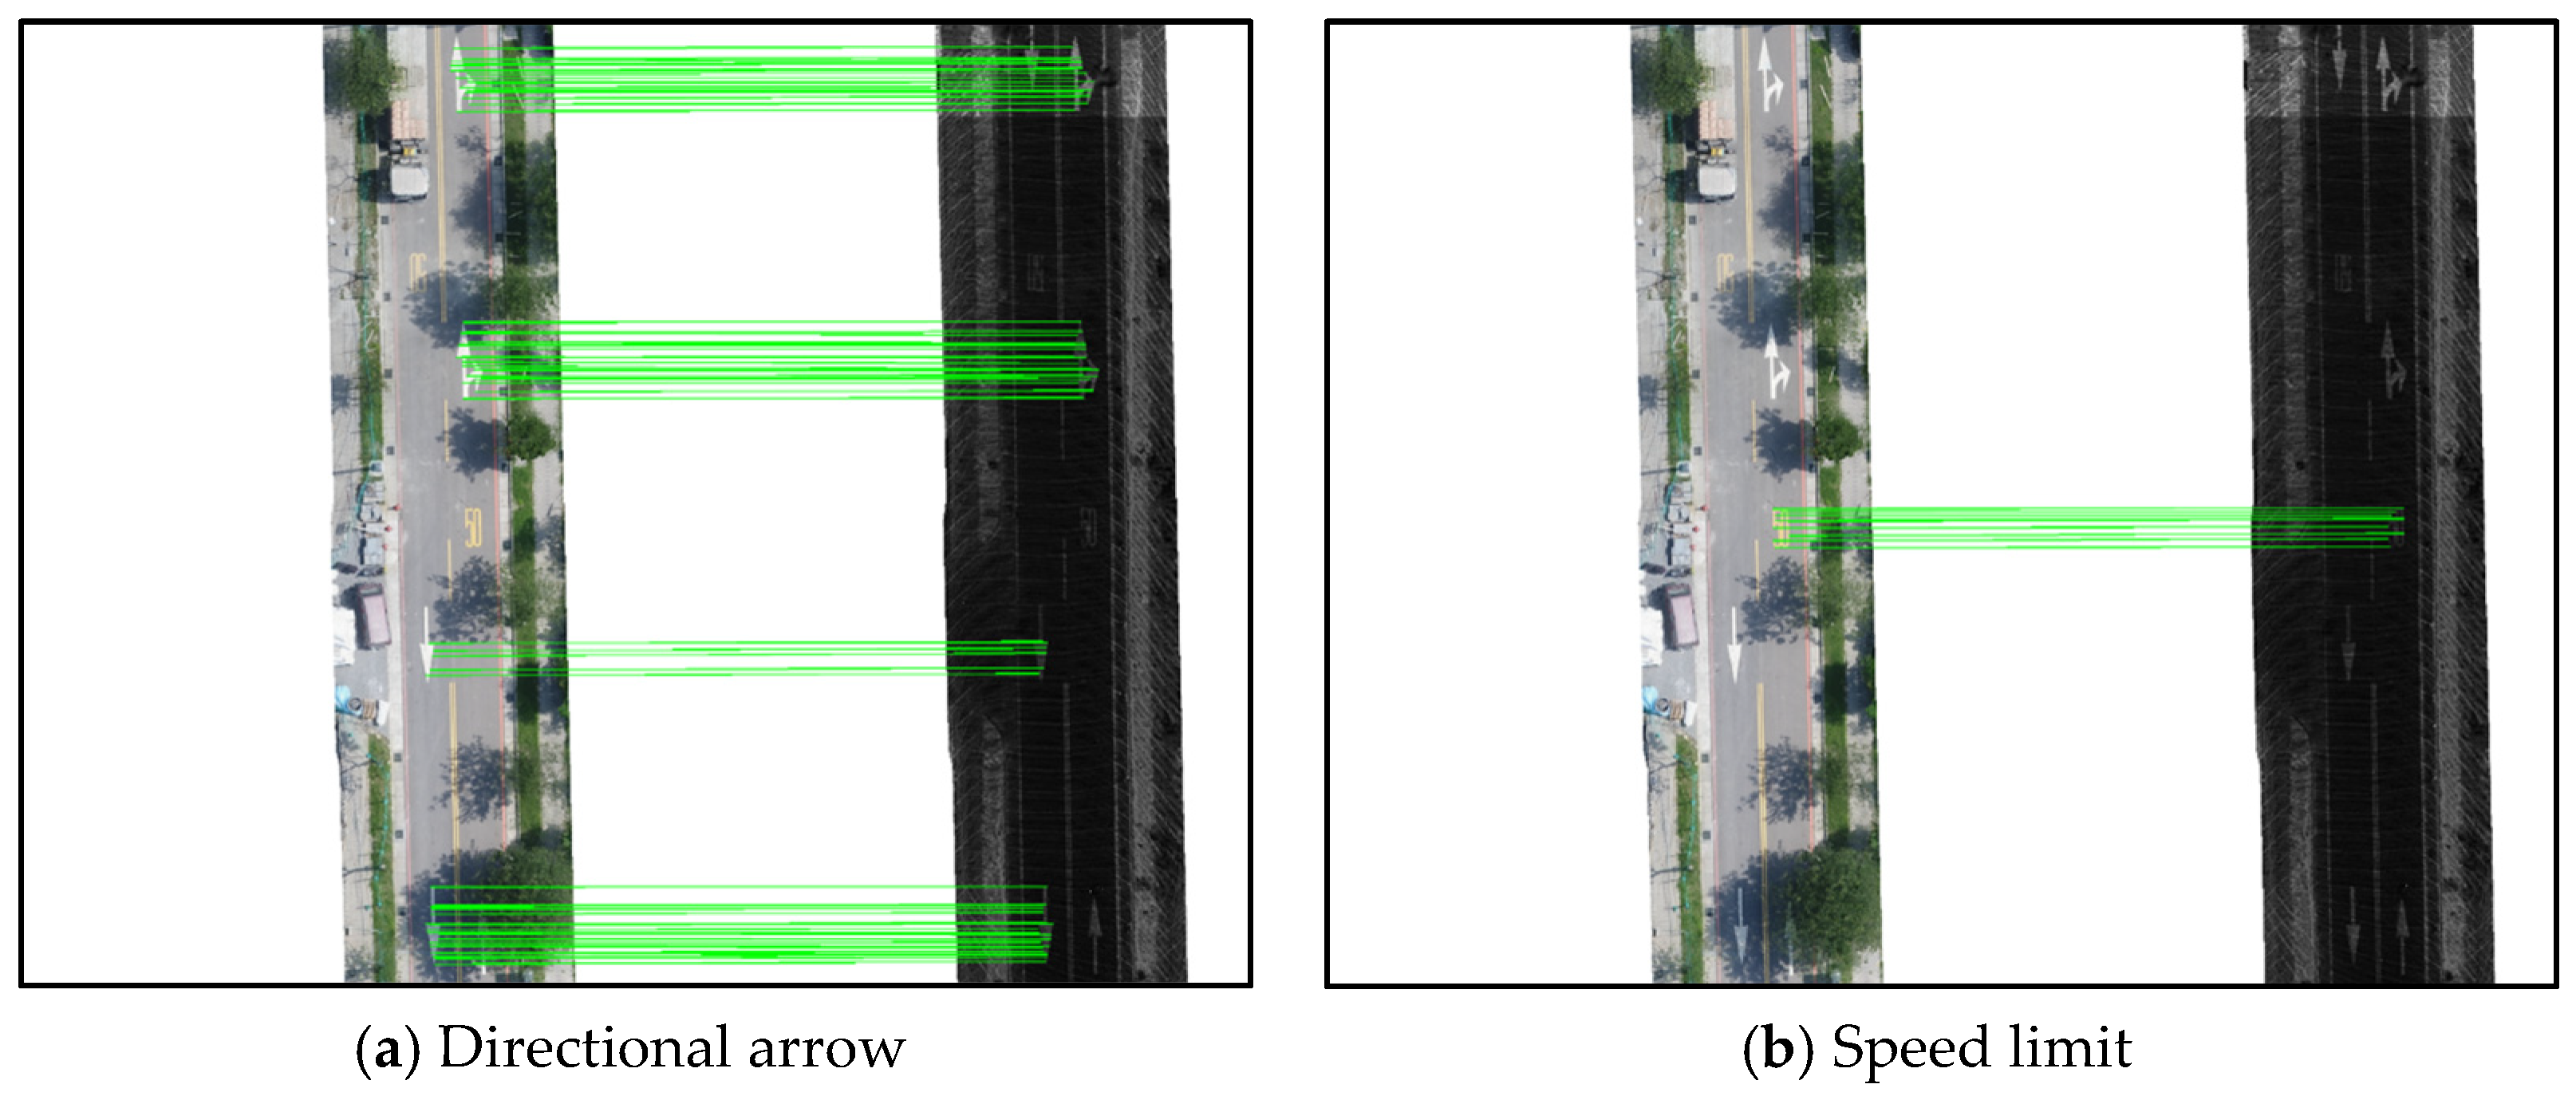
In mid-road scenes, where geometric diversity of markings is limited, cross-sensor matching proved more challenging. Three semantic categories were considered: (1) directional arrow, (2) speed limit, and (3) slim road marking.
Similar to intersection areas in case 1, semantic objects with distinct shapes, such as directional arrows or speed limit markings, provided more reliable and spatially consistent matches (Figure 14). Both categories achieved a correctness of approximately 50%, indicating stable matching performance across different sensing modalities. Directional arrows, in particular, remained the most effective features, maintaining stable correspondence even under reduced visual complexity. Overall, these results demonstrate that the geometric form and distinctiveness of semantic objects strongly influence feature matching quality and that object-specific matching enhances both stability and accuracy across heterogeneous sensor data.
Figure 14.
Case 2—Different semantic object matching result. Green lines indicated the matching points.
In summary, the experimental results clearly reveal that the geometric structure and semantic distinctiveness of road markings play a decisive role in cross-sensor feature matching quality. The ability of the proposed semantic matching pipeline to isolate these reliable features is key to its success. Features characterized by regular, complex geometry and clear boundaries (such as pedestrian crossings and directional arrows) are significantly more robust than linear, homogeneous features (such as elongated and narrow markings). Integrating an object-specific matching strategy that emphasizes these geometrically rich semantic features can significantly enhance the robustness and precision of the overall semantic correspondence framework, enabling high-accuracy registration between low-cost UAV and mobile LiDAR data.
4. Conclusions and Future Works
This study developed and validated a novel semantic feature matching framework for the challenging registration of heterogeneous low-cost UAV imagery and mobile LiDAR data. The core contribution lies in transforming the three-dimensional cross-sensor registration problem into a robust two-dimensional image matching task by using advanced deep learning-based semantic segmentation (i.e., YOLOv11) to isolate road markings. This process effectively transforms the noisy LiDAR intensity into a consistent semantic feature reference, thereby mitigating the severe radiometric and structural discrepancies inherent between the two sensor modalities. By employing semantically geometric correspondence establishment, the framework achieved correspondence extraction, fulfilling the research objective of an automated registration procedure.
The experimental results demonstrated the superior performance of the proposed semantic matching strategy, which consistently achieved higher correctness and stability compared to traditional feature-based methods (SIFT + FLANN) when tested on the heterogeneous data. The study reveals that features with clear, complex geometric structures (such as pedestrian crossings and directional arrows) provide the most reliable semantic anchors for cross-sensor matching. Furthermore, the explicit application of semantic constraints effectively eliminated false matches between distinct marking categories. However, the simulation analysis revealed a key limitation: The SuperPoint keypoint detector, lacking explicit rotation and scale invariance, showed performance degradation under extreme geometric misalignments (e.g., 15° rotation or 40% scale change). This underscores the necessity for the system to rely on high-quality initial geo-registration.
Future research directions should focus on enhancing the geometrical robustness and generalizing the applicability of the semantic matching framework:
- Geometric invariance enhancement: Integrate a geometrically invariant keypoint detector or a learning-based approach explicitly designed with rotation and scale invariance (e.g., by incorporating orientation normalization or scale-space sampling) to enhance robustness against large initial misalignments and reduce dependency on high-quality initial alignment.
- Generalization of semantic constraints: Expand the semantic constraint to include broader feature types (e.g., building boundaries, tree lines, curbstone semantics) to generalize the framework’s applicability beyond structured road environments to complex urban and natural landscapes.
- Integration of three-dimensional geometry: Explore the incorporation of three-dimensional point cloud geometry (e.g., normal vectors or depth information) directly into the GNN matching process to improve depth and scale awareness, moving beyond purely two-dimensional image matching.
- Semantic segmentation optimization: Optimize the YOLOv11 segmentation model specifically for challenging input conditions, focusing on improving the fidelity of predictions for highly occluded or fragmented road markings, which were identified as a primary source of error in the matching pipeline. Future work will assess the effectiveness of incorporating more recent AI models as they emerge.
- The image matching procedure was performed in the horizontal (E, N) plane. Since the semantic features consist of road markings on the pavement, the elevation (H) of the tie points was derived directly from the UAV Digital Surface Model (DSM) and MLS ground points. These 3D tie points provide the necessary spatial constraints for MLS trajectory adjustment, specifically for refining height accuracy. Future research will explore the integration of these 3D constraints into the MLS trajectory adjustment process.
Author Contributions
Conceptualization, T.-A.T.; Formal analysis, P.-C.C.; Investigation, T.-A.T.; Methodology, T.-A.T. and P.-C.C.; Software, H.Y. and P.-C.C.; Supervision, T.-A.T.; Validation, H.Y. and P.-C.C.; Writing—original draft, H.Y.; Writing—review & editing, T.-A.T. All authors have read and agreed to the published version of the manuscript.
Funding
This research was partially funded by the National Science and Technology Council, Taiwan, under grant number NSTC 112-2121-M-A49-003, and the Ministry of Interior, Taiwan, under grant number 114PC050201A.
Data Availability Statement
The data presented in this study are available upon request from the corresponding author. The data are not publicly available due to privacy concerns.
Acknowledgments
The authors would like to thank CECI, Taiwan, and ITRI, Taiwan, for providing test data for this study.
Conflicts of Interest
The authors declare no conflicts of interest.
Abbreviations
The following abbreviations are used in this manuscript:
| UAV | Unmanned aerial vehicle |
| LiDAR | Light detection and ranging |
| DSM | Digital surface model |
| MLS | Mobile LiDAR system |
| TLS | Terrestrial LiDAR system |
| SIFT | Scale-invariant feature transform |
| GNN | Graph neural network |
| GNSS | Global navigation satellite system |
| RMSE | Root mean square errors |
| POS | Position and orientation system |
| GCP | Ground control point |
| FCN | Fully convolutional network |
References
- Mat Adnan, A.; Darwin, N.; Ariff, M.F.M.; Majid, Z.; Idris, K.M. Integration Between Unmanned Aerial Vehicle and Terrestrial Laser Scanner in Producing 3D Model. Int. Arch. Photogramm. Remote Sens. Spat. Inf. Sci. 2019, 42, 391–398. [Google Scholar] [CrossRef] [Scilit]
- Gruen, A.; Huang, X.; Qin, R.; Du, T.; Fang, W.; Boavida, J.; Oliveira, A. Joint processing of UAV imagery and terrestrial mobile mapping system data for very high resolution city modeling. Int. Arch. Photogrammetry. Remote Sens. Spat. Inf. Sci. 2013, 40, 175–182. [Google Scholar] [CrossRef] [Scilit]
- Elamin, A.; El-Rabbany, A. UAV-Based Image and LiDAR Fusion for Pavement Crack Segmentation. Sensors 2023, 23, 9315. [Google Scholar] [CrossRef] [Scilit] [PubMed]
- Chuang, T.Y.; Jaw, J.J. Multi-feature registration of point clouds. Remote Sens. 2017, 9, 281. [Google Scholar] [CrossRef] [Scilit]
- Hussnain, Z.; Oude Elberink, S.; Vosselman, G. Automatic extraction of accurate 3D tie points for trajectory adjustment of mobile laser scanners using aerial imagery. ISPRS J. Photogramm. Remote Sens. 2019, 154, 41–58. [Google Scholar] [CrossRef] [Scilit]
- Gao, Y.; Huang, X.; Zhang, F.; Fu, Z.; Yang, C. Automatic geo-referencing mobile laser scanning data to UAV images. Int. Arch. Photogramm. Remote Sens. Spat. Inf. Sci. 2015, 40, 41–46. [Google Scholar] [CrossRef] [Scilit]
- Cong, B.; Li, Q.; Liu, R.; Wang, F.; Zhu, D.; Yang, J. Research on a point cloud registration method of mobile laser scanning and terrestrial laser scanning. KSCE J. Civ. Eng. 2022, 26, 5275–5290. [Google Scholar] [CrossRef] [Scilit]
- Li, S.; Ge, X.; Li, S.; Xu, B.; Wang, Z. Linear-based incremental co-registration of MLS and photogrammetric point clouds. Remote Sens. 2021, 13, 2195. [Google Scholar] [CrossRef] [Scilit]
- Yang, B.; Zang, Y.; Dong, Z.; Huang, R. An automated method to register airborne and terrestrial laser scanning point clouds. ISPRS J. Photogramm. Remote Sens. 2015, 109, 62–76. [Google Scholar] [CrossRef] [Scilit]
- Teo, T.A.; Huang, S.H. Surface-based registration of airborne and terrestrial mobile LiDAR point clouds. Remote Sens. 2014, 6, 12686–12707. [Google Scholar] [CrossRef] [Scilit]
- Kusari, A.; Glennie, C.L.; Brooks, B.A.; Ericksen, T. Precise registration of laser mapping data by planar feature extraction for deformation monitoring. IEEE Trans. Geosci. Remote Sens. 2019, 57, 3404–3422. [Google Scholar] [CrossRef]
- Ufer, N.; Ommer, B. Deep semantic feature matching. In Proceedings of the IEEE Conference on Computer Vision and Pattern Recognition, Honolulu, HI, USA, 22–25 July 2017; pp. 6914–6923. [Google Scholar]
- Ma, J.; Jiang, X.; Fan, A.; Jiang, J.; Yan, J. Image matching from handcrafted to deep features: A survey. Int. J. Comput. Vis. 2021, 129, 23–79. [Google Scholar] [CrossRef] [Scilit]
- Lowe, D.G. Distinctive image features from scale-invariant keypoints. Int. J. Comput. Vis. 2004, 60, 91–110. [Google Scholar] [CrossRef] [Scilit]
- Bay, H.; Tuytelaars, T.; Van Gool, L. Surf: Speeded up robust features. In European Conference on Computer Vision; Springer: Berlin/Heidelberg, Germany, 2006; pp. 404–417. [Google Scholar]
- Farkoushi, M.G.; Hong, S.; Sohn, H.G. Generating Seamless Three-Dimensional Maps by Integrating Low-Cost Unmanned Aerial Vehicle Imagery and Mobile Mapping System Data. Sensors 2025, 25, 822. [Google Scholar] [CrossRef] [Scilit] [PubMed]
- Kolar, P.; Benavidez, P.; Jamshidi, M. Survey of datafusion techniques for laser and vision based sensor integration for autonomous navigation. Sensors 2020, 20, 2180. [Google Scholar] [CrossRef] [Scilit]
- Zhang, W.; Qi, J.; Wan, P.; Wang, H.; Xie, D.; Wang, X.; Yan, G. An easy-to-use airborne LiDAR data filtering method based on cloth simulation. Remote Sens. 2016, 8, 501. [Google Scholar] [CrossRef] [Scilit]
- Khanam, R.; Hussain, M. YOLOv11: An overview of the key architectural enhancements. arXiv 2024, arXiv:2410.17725. [Google Scholar] [CrossRef] [Scilit]
- De Boer, P.T.; Kroese, D.P.; Mannor, S.; Rubinstein, R.Y. A tutorial on the cross-entropy method. Ann. Oper. Res. 2005, 134, 19–67. [Google Scholar] [CrossRef] [Scilit]
- Sudre, C.H.; Li, W.; Vercauteren, T.; Ourselin, S.; Jorge Cardoso, M. Generalised dice overlap as a deep learning loss function for highly unbalanced segmentations. In International Workshop on Deep Learning in Medical Image Analysis; Springer International Publishing: Cham, Switzerland, 2017; pp. 240–248. [Google Scholar]
- DeTone, D.; Malisiewicz, T.; Rabinovich, A. Superpoint: Self-supervised interest point detection and description. In Proceedings of the IEEE Conference on Computer Vision and Pattern Recognition Workshops, Salt Lake City, UT, USA, 18–22 June 2018; pp. 224–236. [Google Scholar]
- Sarlin, P.E.; DeTone, D.; Malisiewicz, T.; Rabinovich, A. Superglue: Learning feature matching with graph neural networks. In Proceedings of the IEEE/CVF Conference on Computer Vision and Pattern Recognition, Seattle, WA, USA, 14–19 June 2020; pp. 4938–4947. [Google Scholar]
- Fischler, M.A.; Bolles, R.C. Random sample consensus: A paradigm for model fitting with applications to image analysis and automated cartography. Commun. ACM 1981, 24, 381–395. [Google Scholar] [CrossRef] [Scilit]
- Hodaei, M. Mobile Mapping Systems Camera–LiDAR Data Registration for Mitigating GNSS/INS Trajectory Perturbations. Master’s Thesis, Purdue University, West Lafayette, IN, USA, 2025. [Google Scholar]
- Spore, N.J.; Brodie, K.L. Collection, Processing, and Accuracy of Mobile Terrestrial Lidar Survey Data in the Coastal Environment; U.S. Army Engineer Research and Development Center (ERDC), Coastal and Hydraulics Laboratory: Kitty Hawk, NC, USA, 2017. [Google Scholar]

Disclaimer/Publisher’s Note: The statements, opinions and data contained in all publications are solely those of the individual author(s) and contributor(s) and not of MDPI and/or the editor(s). MDPI and/or the editor(s) disclaim responsibility for any injury to people or property resulting from any ideas, methods, instructions or products referred to in the content. |
© 2026 by the authors. Licensee MDPI, Basel, Switzerland. This article is an open access article distributed under the terms and conditions of the Creative Commons Attribution (CC BY) license.