


Highlights
What are the main findings?
- A UAV-based SAR system powered by Edge-AI, integrating visual posture recognition and thermal assessment, has been developed and validated. Temperature values are directly embedded into detected boundary boxes, enabling real-time victim detection, tracking, and physiological assessment at 19–23 FPS on the NVIDIA Jetson AGX Xavier platform.
- Field maritime experiments demonstrate robust detection performance, achieving accuracy up to 84% for swimmers and over 50% for drowning-related postures, while supporting closed-loop autonomous UAV tracking and victim prioritization in multi-target scenarios via a secondary Ground Control Station (GCS) display.
What are the implications of the main findings?
- The quantitative combination of posture-based image signals and thermal information within the envelope allows for more reliable differentiation between living victims and potentially deceased individuals, thereby enhancing situational awareness in emergency maritime rescue operations.
- Real-time performance demonstrated on embedded hardware, combined with a preference for human involvement, significantly improves the feasibility and scalability of UAV-based autonomous SAR systems in real-world maritime environments.
Abstract
Maritime search and rescue (SAR) operations are challenged by vast search areas, poor visibility, and the time-critical nature of victim survival, particularly in dynamic coastal areas. This study presents an intelligent unmanned aerial vehicle (UAV) framework for real-time detection, tracking, and prioritization of people in distress at sea. Unlike existing UAV-based SAR systems that rely on visual sensing or offline human intervention, the proposed framework integrates RGB-thermal multimodal sensing and posture recognition to enhance victim prioritization and survivability estimation. Visual-thermal data support human posture detection, inference of physiological indicators, and autonomous UAV navigation. Metadata are transmitted to a ground control station to enable adaptive altitude control, trajectory rejoining, and multi-target prioritization. Field-inspired experiments in Quang Ninh Province, Vietnam demonstrated robust real-time performance, achieving 23 FPS with detection accuracy up to 84% for swimming subjects and over 50% for drowning postures. These findings demonstrate that Edge-AI-enabled UAVs can serve as a practical and efficient solution for maritime SAR, reducing response times and improving mission outcomes.
1. Introduction
Natural disasters and maritime accidents remain persistent threats to human safety, particularly in coastal regions where fishing, transportation, and tourism activities are concentrated. Climate change has intensified the frequency and severity of extreme weather events, including typhoons, flash floods, and storm surges, which frequently endanger lives at sea and along river basins [1,2,3]. In such emergency contexts, rapid detection and localization of drowning victims are critical to minimizing fatalities. Traditional rescue operations, relying on helicopters or specialized vessels, often face delays due to harsh environmental conditions, limited visibility, and human resource constraints. These limitations have motivated increasing interest in intelligent, autonomous systems capable of providing timely situational awareness and decision support for search and rescue (SAR) teams [4].
Unmanned aerial vehicles (UAVs) have emerged as a promising platform for SAR operations due to their rapid deployment, wide-area coverage, and reduced risk to human rescuers [5,6]. Early deployments, such as those during Hurricane Katrina in 2005, primarily relied on airborne cameras with human operators manually inspecting video feeds. While effective for reconnaissance, these systems lacked autonomy and placed a substantial cognitive burden on ground personnel. Advances in computer vision and deep learning have since enabled UAVs to transition from passive sensing platforms to active participants in SAR missions through real-time detection, tracking, and classification [7,8,9].
A wide range of UAV-based SAR perception systems has been proposed. RGB-based approaches are attractive due to their low cost and ease of deployment, but they are highly sensitive to illumination changes, wave-induced clutter, and adverse weather [2]. Thermal infrared sensing offers complementary advantages by highlighting warm bodies against cooler backgrounds, particularly in nighttime or low-visibility conditions [10]. However, thermal-only solutions often lack spatial detail, limiting their ability to infer posture or distinguish humans from other heat-emitting objects. Multimodal approaches combining RGB, thermal, LiDAR, or radar sensing have therefore been explored to improve robustness [11]. Despite their promise, many multimodal systems assume access to high-performance computing or offline processing, restricting their applicability to real-time, fully onboard UAV deployment [12].
Beyond sensing, a more fundamental limitation of existing work lies in the lack of integrated system autonomy. Many proposed solutions terminate at object detection and rely on human operators to interpret results and manually control the UAV, limiting operational scalability in time-critical SAR missions. In practical maritime rescue scenarios, UAVs must operate under strict edge-computing, power, and sensing constraints while autonomously adapting flight trajectories, prioritizing victims, and managing mission phases in real time. This disconnect between perception-centric research and deployable autonomous operation represents a critical gap in the current literature.
Three interrelated challenges remain unresolved. First, small-object detection in maritime environments is inherently difficult, as drowning victims often appear as partially submerged targets occupying only a few pixels in aerial imagery [13,14]. Second, edge-computing constraints limit model complexity and inference latency on embedded UAV platforms, making many state-of-the-art detectors impractical for onboard deployment [8,9,15,16]. Third, closed-loop integration between perception outputs and UAV flight control remains limited, with few systems directly translating detections into autonomous trajectory adaptation.
Recent efforts have addressed aspects of these challenges through lightweight architectures and model compression techniques [17,18]. While such approaches improve inference efficiency, their application to maritime SAR, particularly for drowning victim detection, remains underexplored. Moreover, although physiological cues such as thermal signatures can support victim prioritization, existing studies rarely integrate posture analysis and thermal information within a unified, onboard autonomous framework [10,11]. Validation is also frequently restricted to laboratory settings or simulated datasets, providing limited insight into real-world operational constraints [5,19].
To address these gaps, this paper presents an edge-AI enhanced autonomous UAV system for maritime SAR that emphasizes integrated autonomy under realistic deployment constraints. The proposed framework combines RGB and thermal sensing with onboard perception, tracking, and closed-loop flight control on an embedded platform. Detected targets are augmented with positional and thermal metadata, which are used not only for operator awareness but also to directly guide autonomous UAV maneuvers. Through field-inspired experiments conducted in a coastal maritime environment, this work demonstrates the feasibility of deploying fully onboard, autonomous UAV-SAR systems and provides insight into their operational capabilities and limitations.
The main contributions of this paper are summarized as follows:
- Development of a quantized AI model optimized for embedded deployment, enabling 19–23 FPS real-time performance.
- Design of a multimodal RGB–thermal fusion framework for posture-aware victim detection, prioritization, and physiological context inference.
- Closed-loop integration of perception outputs with a UAV flight controller, enabling tracking-by-ID, adaptive altitude control, and trajectory rejoining.
- Experimental validation through field-inspired maritime trials demonstrating robust detection performance and operational stability.
By bridging the gap between perception and autonomous navigation in SAR missions, this study provides a practical, scalable UAV framework that supports emergency response teams in time-critical maritime environments.
2. Methodology
This section presents the hardware–software stack, dataset curation and annotation, the training/deployment recipe on the edge platform, RGB–thermal calibration and fusion, and the tracking–control loop.
2.1. System Overview
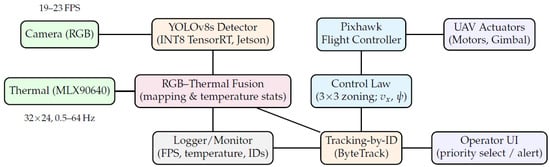
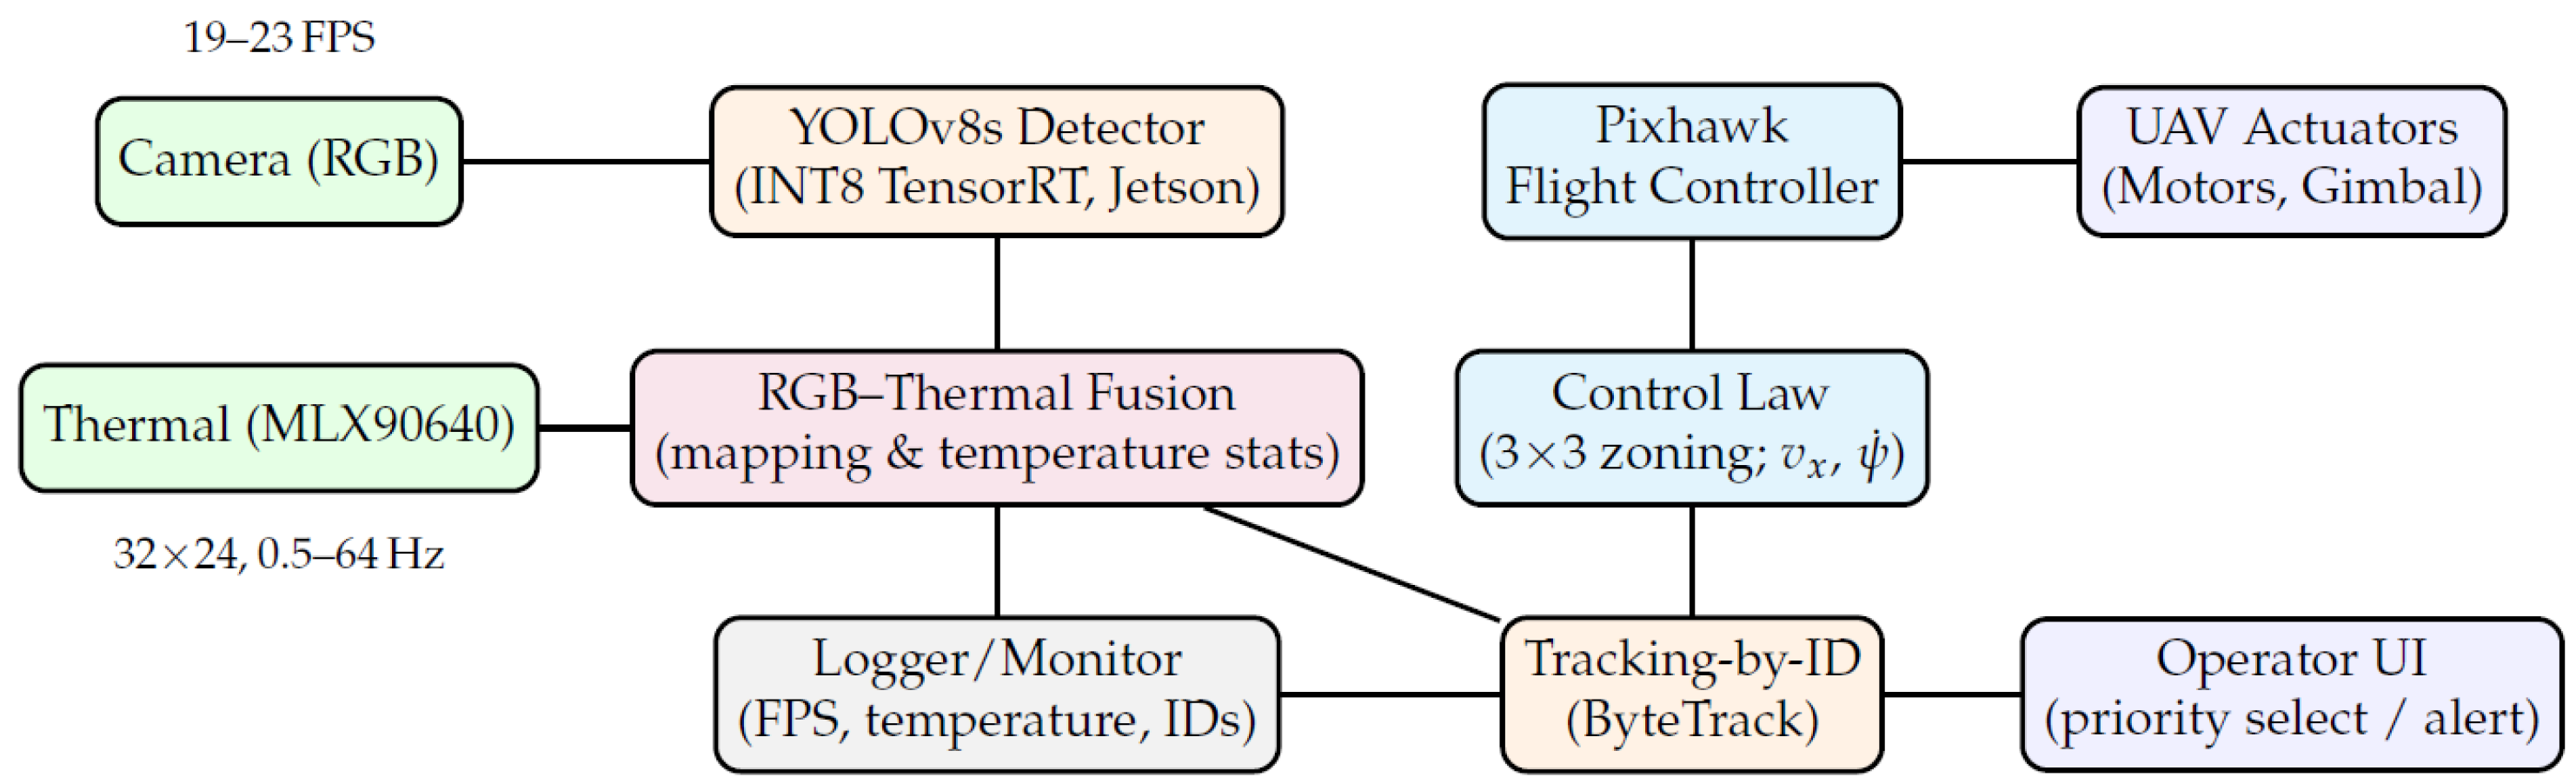
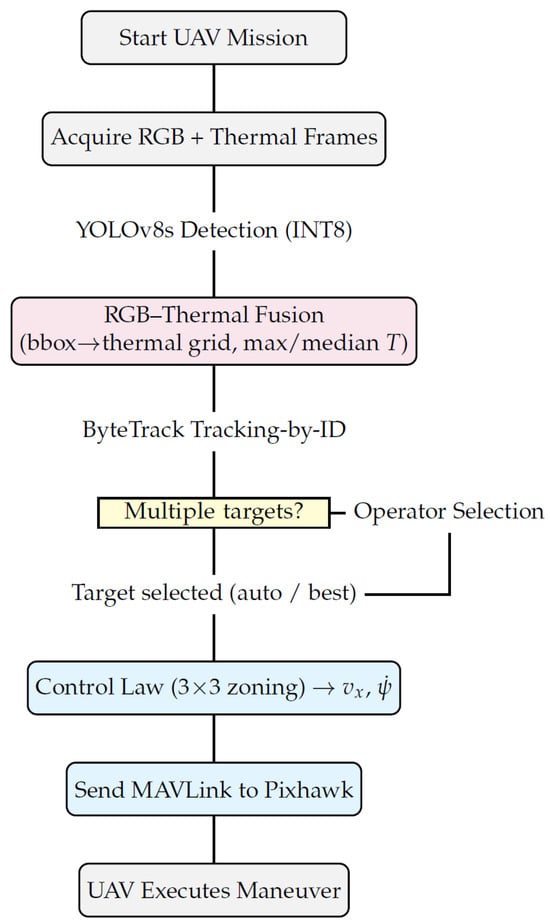
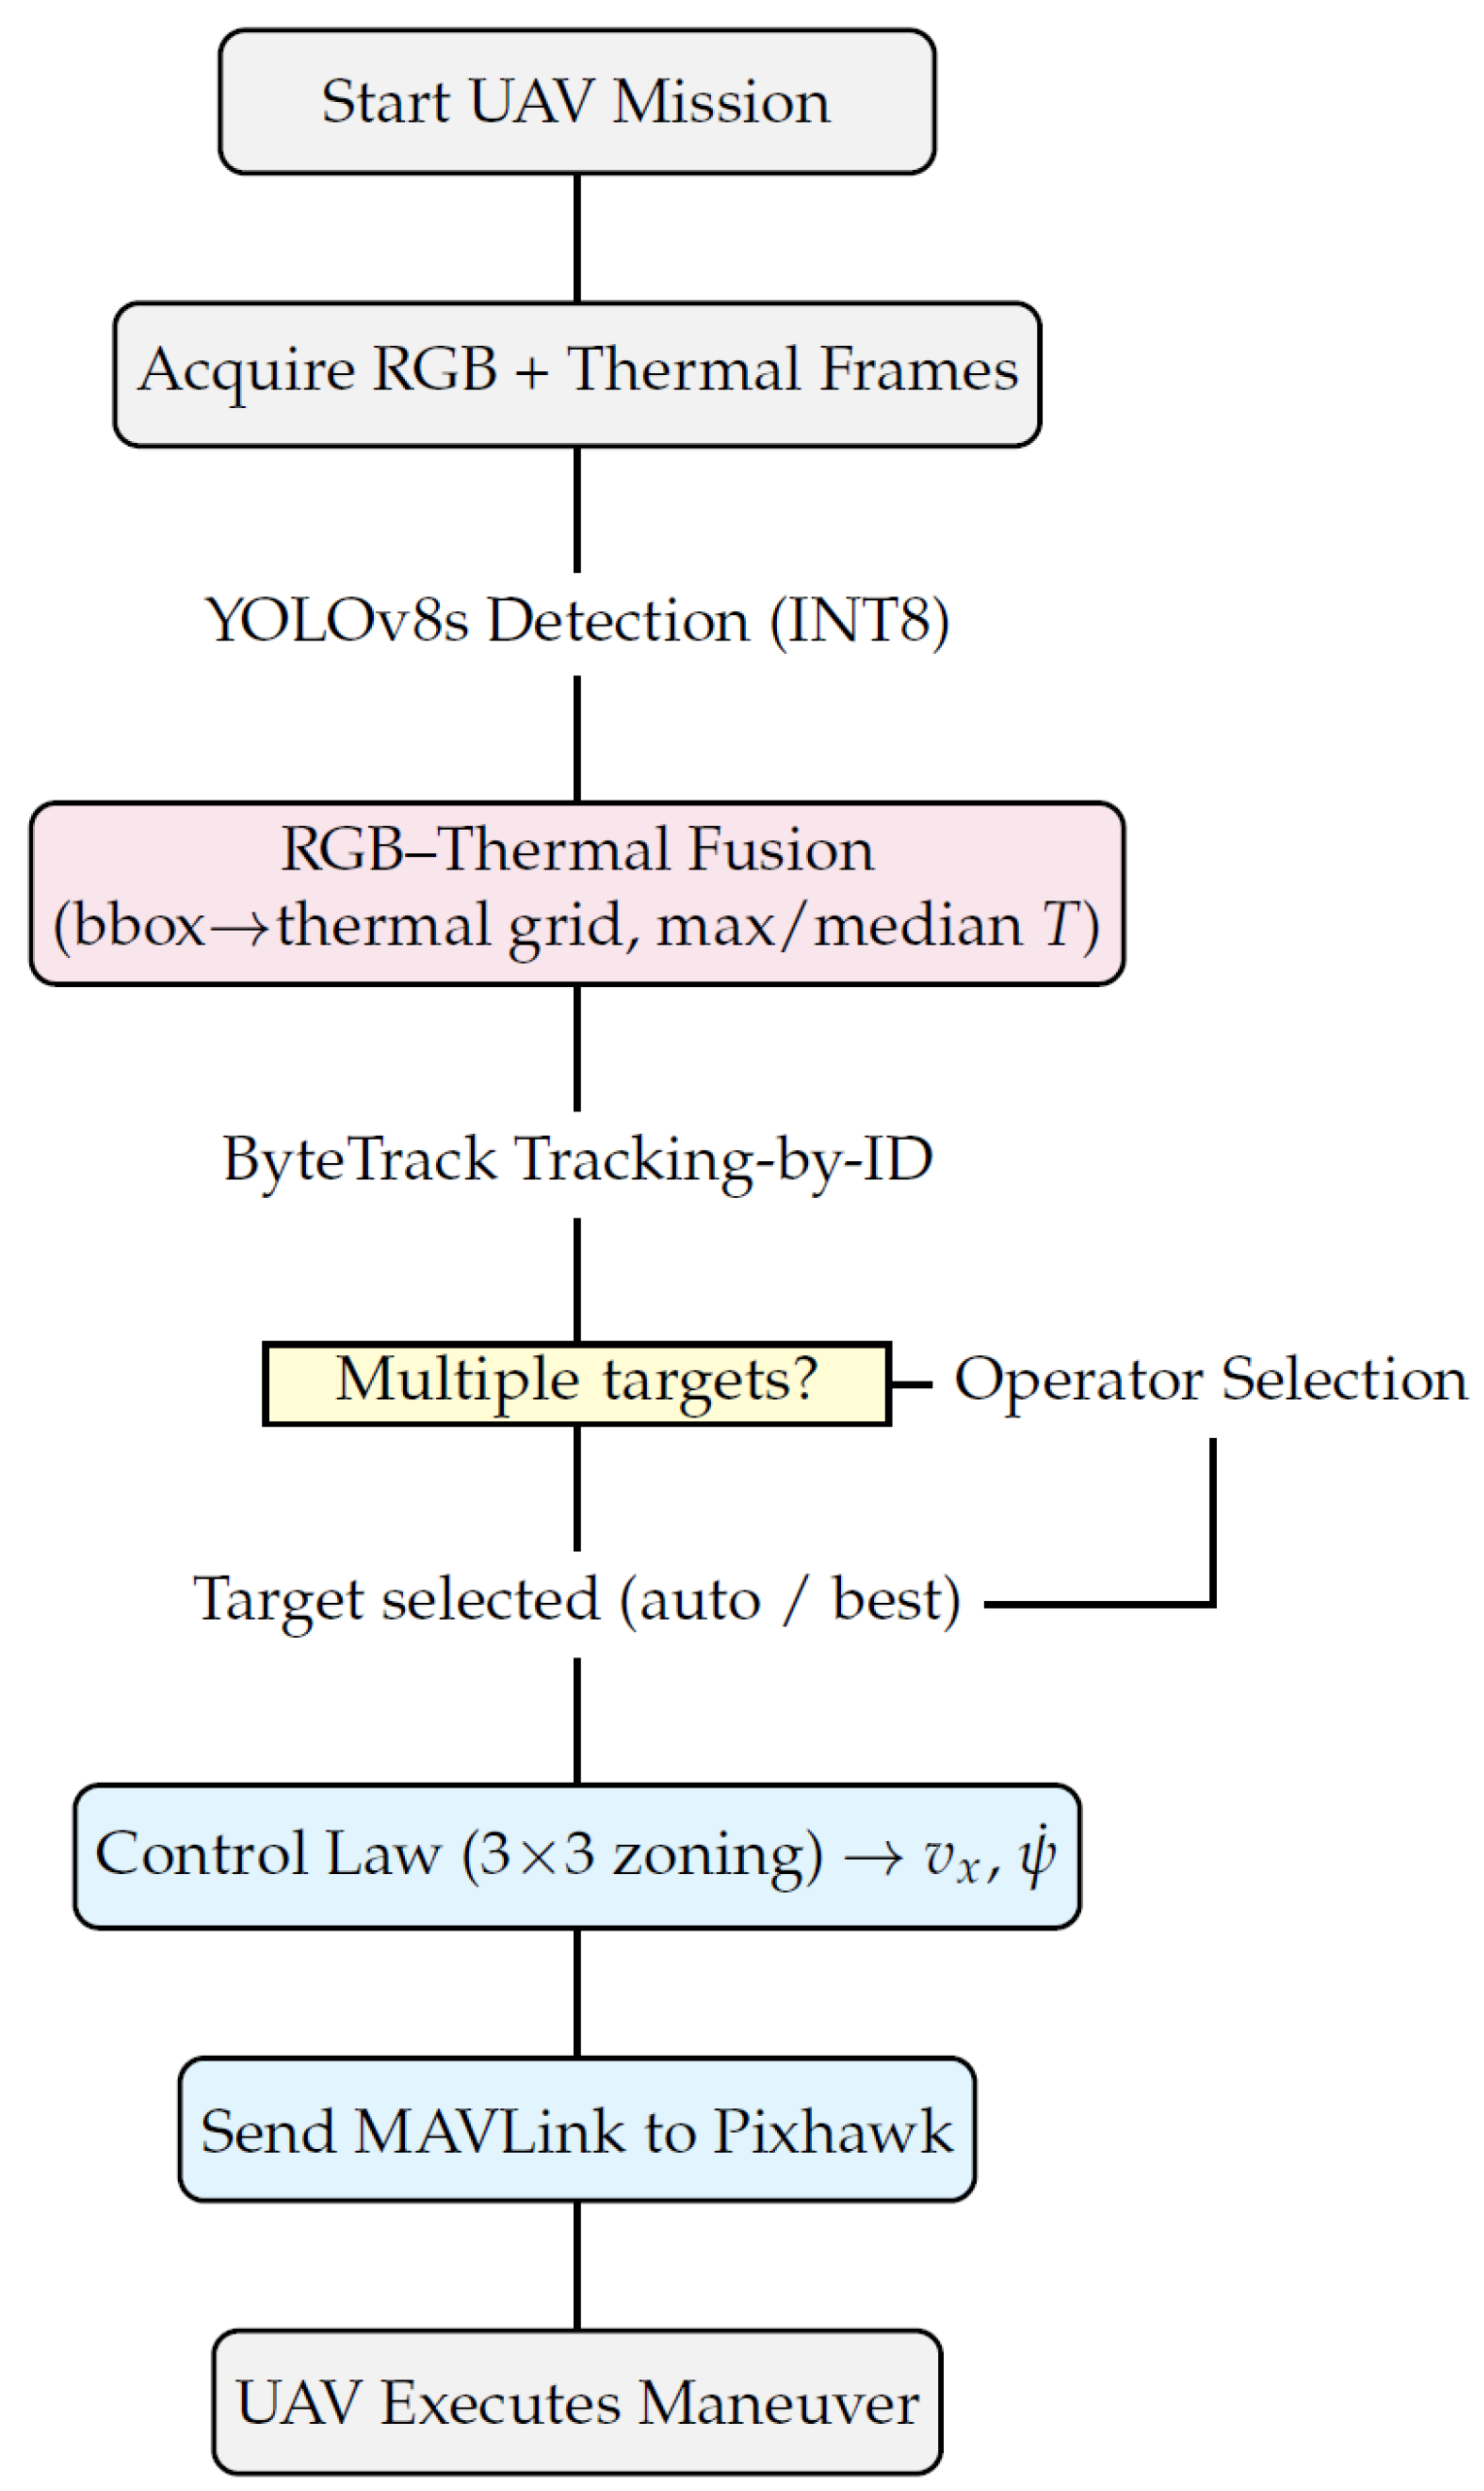
We deploy an edge-AI UAV platform for maritime search-and-rescue (SAR) that couples an NVIDIA Jetson AGX Xavier (on-board perception) with a Pixhawk-class flight controller (ArduPilot) to close the loop from sensing to actuation in real time. The sensing stack comprises an HD RGB camera and an MLX90640 32 × 24 thermal array; detections from a TensorRT-quantized YOLOv8s are stabilized with a lightweight tracker and augmented by RGB–thermal fusion for target prioritization. The controller streams velocity/yaw setpoints via MAVLink, with manual override and safety envelopes. Figure 1 shows the dataflow from sensing (RGB & thermal) through on-board perception (detection, RGB–thermal fusion, tracking) to control and actuation (Pixhawk → UAV actuators). Figure 2 presents the corresponding algorithmic pipeline, including the operator-selection branch for multi-target cases.
Figure 1.
System architecture. RGB and thermal streams are processed on Jetson (detection, fusion, tracking). The control module (3 × 3 zoning) and Pixhawk close the loop to the UAV actuators. The UI supports priority selection in multi-target scenes; the logger records FPS, temperature, and IDs.
Figure 2.
End-to-end pipeline of the proposed UAV-SAR system. When multiple targets are detected, the operator selects one; otherwise, the system selects the best candidate and sends MAVLink commands to Pixhawk for execution.
The payload integrates a high-definition RGB camera rigidly co-mounted with an MLX90640 (32 × 24) thermal array. We treat the thermal field-of-view (FOV) as inscribed within the RGB frame via a geometric scale derived from the two FOVs; this yields symmetric margins and a mapping from RGB detections to thermal grid regions used for temperature statistics (max/median) (see Section 2.5). This design emphasizes robustness to small targets and low-contrast scenes typical in near-shore environments such as Quang Ninh Province, Vietnam.
We adopt YOLOv8s as the primary detector for speed–accuracy balance on embedded hardware; the model is exported (ONNX) and compiled to INT8 TensorRT to meet real-time constraints on Jetson [7,20]. Tile-based inference is used in high-altitude or wide-FOV conditions to preserve small-object recall, followed by class-aware non-maximum suppression and confidence calibration from PR/F1 sweeps. RGB detections are then augmented with thermal metadata by projecting each bounding box to the aligned thermal grid; unreliable cues (e.g., cooling by waves) are down-weighted to avoid over-trusting thermal on water surfaces [10,11]. Finally, tracking-by-ID (ByteTrack-style association) stabilizes trajectories and IDs across frames, supporting downstream control.
When multiple candidates are present, an operator UI allows explicit target selection (priority override); otherwise, the system selects the best candidate automatically using a score that combines detector confidence, track stability, and thermal statistics. Telemetry (FPS, temperatures, track IDs) is logged continuously for post-hoc analysis and safety audits.
A lightweight image-based controller partitions the image plane into a 3 × 3 zoning grid. Horizontal pixel error drives yaw rate and vertical error drives forward velocity , with deadbands and gain scheduling to mitigate oscillations across altitudes. Commands are streamed to Pixhawk via MAVLink as velocity set-points and yaw set-angles; a command arbiter enforces priorities (manual override > emergency loiter/RTL > autonomous tracking > nominal waypoint following). This architecture yields an interpretable, low-latency loop compatible with standard autopilots while maintaining embedded compute budgets [2,5].
The platform is intended for low-altitude coastal operations approximately 7–20 m above ground level (AGL), with wind and spray exposure typical of near-shore environments. Geofencing, altitude envelopes, hysteresis on detection-confidence thresholds, and line-of-sight (LOS) loss timeouts are enforced in software; operator takeover and return-to-launch (RTL) can be triggered at any time [2,5].
2.2. Data Collection and Sample Synthesis
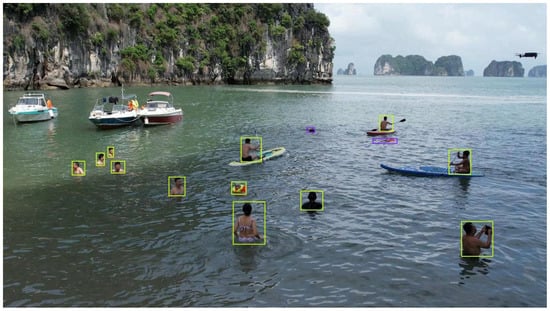
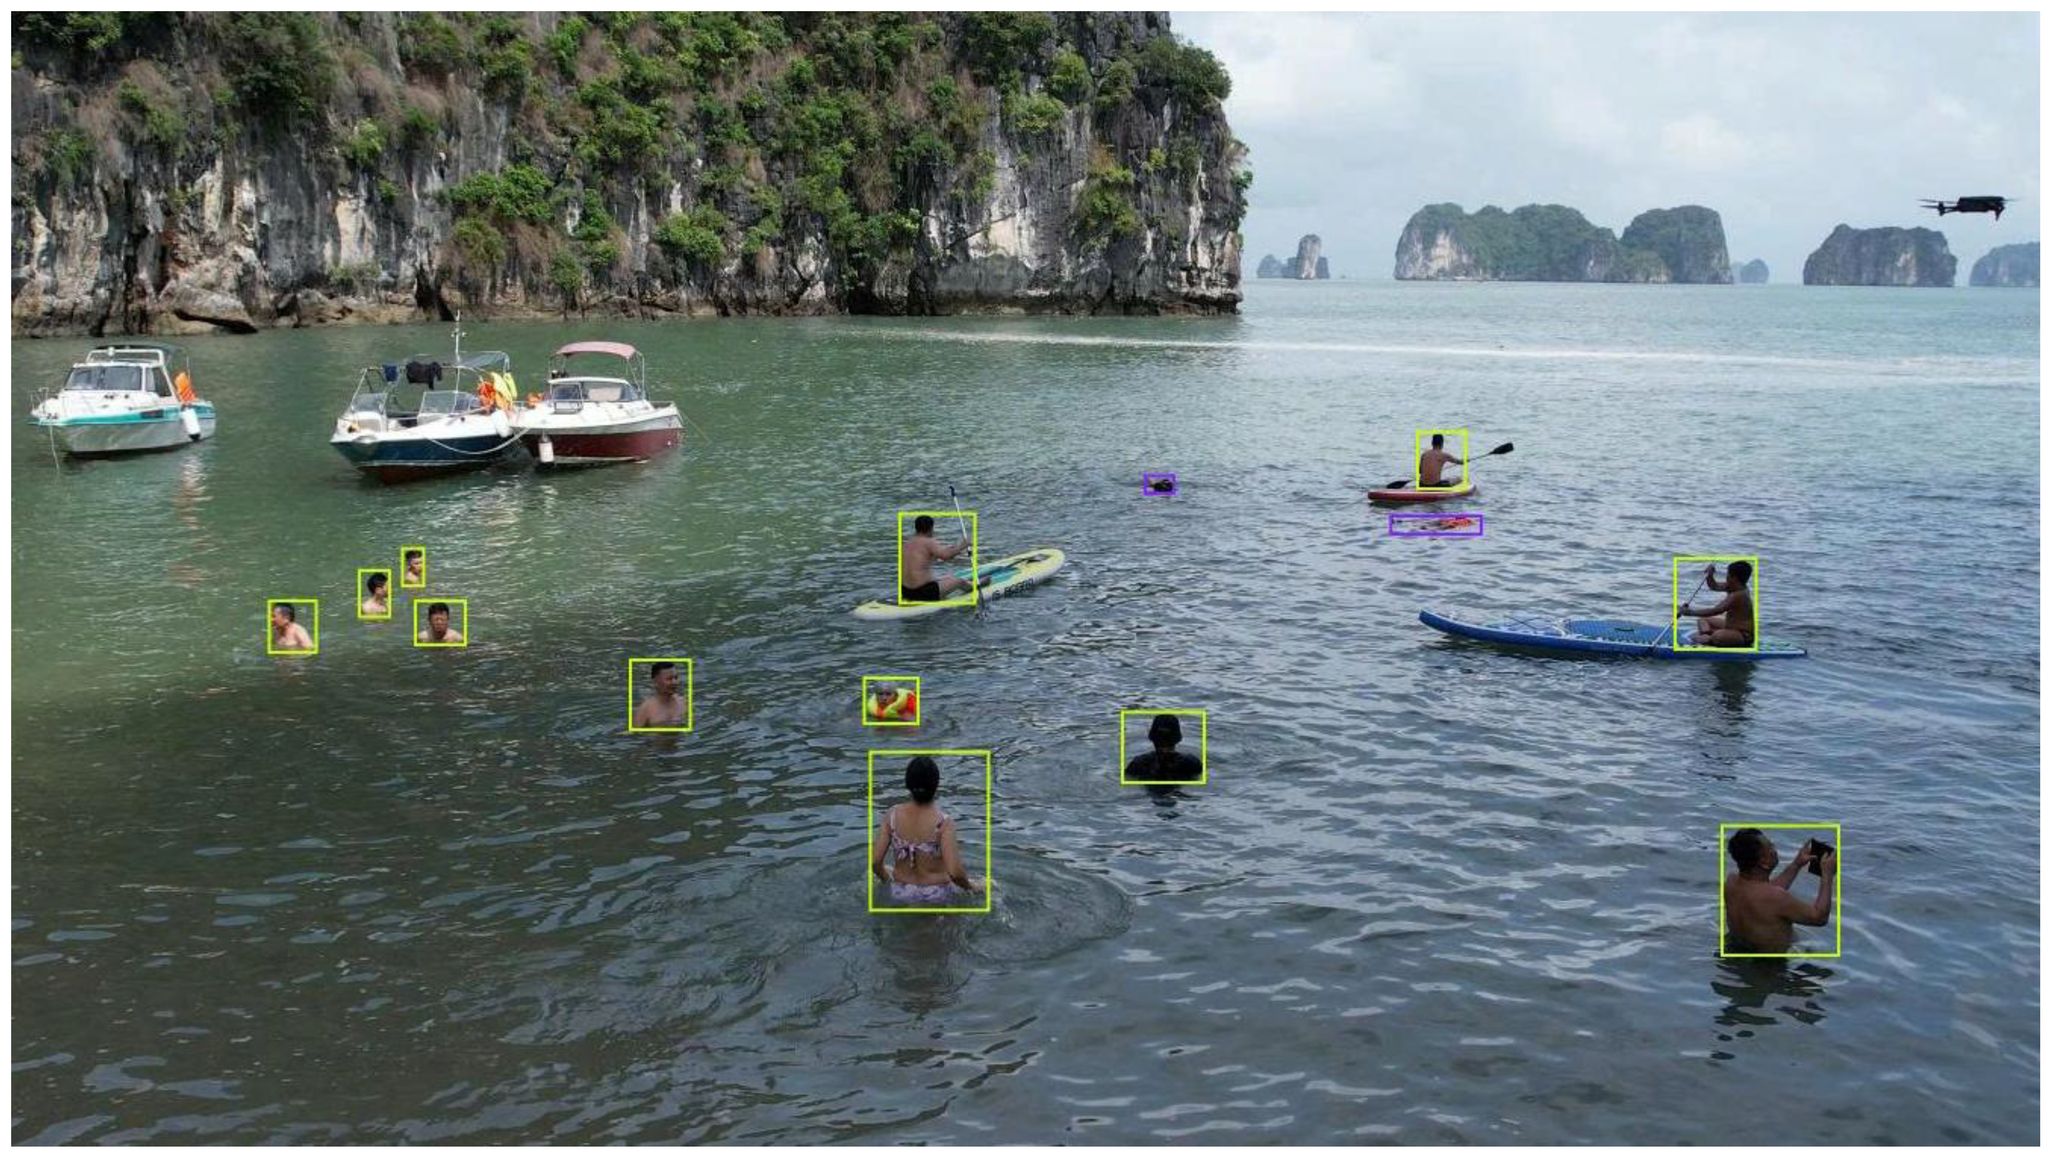
Our objective is to assemble a domain-specific dataset that captures the visual challenges of maritime SAR from small UAVs, including tiny, partially submerged humans in dynamic sea states, glare, and low-contrast illumination. While generic pre-trained detectors on large-scale datasets (e.g., COCO [21]) provide a strong initialization, they under-represent distressed, partially submerged targets and maritime backgrounds [1,2]. We therefore curated a custom corpus, complemented by publicly available maritime data, and designed synthesis/augmentation steps tailored to small-object detection. Images include (a) single swimmers, (b) small groups, (c) props (life buoys, boards), and (d) hard negatives such as waves and foam. A representative annotation example of them is shown in Figure 3.
Figure 3.
An annotated near-shore scene with small, partially submerged persons and props.
The corpus comprises approximately images: (i) field data collected along coastal areas of Quang Ninh Province (Vietnam), captured at multiple altitudes and sun angles to cover surf, glare, and backscatter; (ii) a curated set of drowning-related samples hosted on Roboflow (annotated for our classes); and (iii) additional maritime imagery from the SeaDronesSee benchmark family for SAR-like scenes [14]. Images include (a) single swimmers, (b) small groups, (c) props (life buoys, boards), and (d) hard negatives (waves, foam, rocky shore). To counteract sampling bias toward easy, large instances, we intentionally oversample sequences where the target occupies of image area or is partially occluded by waves [13].
To ensure a fair evaluation, we apply session-disjoint splits at the capture-session/video level (not at the frame level): 70% train, 15% validation, and 15% test. All frames from a given sortie, camera setup, or location/time block remain within a single split to prevent leakage through near-duplicate views and temporally adjacent frames. Validation is used exclusively for model/threshold selection (see Section 2.7).
Bounding boxes are labeled for the person class with optional sub-tags indicating posture cues (e.g., prone, vertical, arm-up). We use a human-in-the-loop pipeline: initial masks/regions are proposed by the Segment Anything Model (SAM) [22] and converted to candidate boxes; annotators verify/correct in CVAT [23] using a style guide that (i) excludes fully submerged silhouettes; (ii) clips boxes at the shoreline when appropriate; (iii) resolves ambiguous foam/spray. A second-pass audit checks inter-annotator consistency on a 10% stratified subset and flags borderline cases for adjudication.
Because glare, whitecaps, and floating debris often trigger false positives, we collect hard negatives from windier days and extreme sun azimuths. After the first training cycle, we run the detector on unlabeled video, select high-scoring false positives, and add them (with labels) back into the train/val set at a 3:1 ratio. This iterative mining reduces precision loss at high recall and stabilizes the PR knee (see Section 2.7).
To improve small-target recall and robustness to maritime artifacts, we apply a structured augmentation policy implemented with Albumentations [24]:
- Geometric: random long-side scaling with aspect-ratio preservation; small rotations () and perspective jitter to emulate camera attitude; random crops that keep targets near borders.
- Photometric: brightness/contrast gamma jitter, color temperature shifts (dawn/dusk), and specular highlights to mimic sun glitter on water.
- Degradations: motion blur (wind gusts), Gaussian noise (high ISO), low-pass blur (defocus at altitude), partial occlusion cutouts aligned with wave crests.
- Context mixing: Mosaic/multi-image composition to increase contextual diversity of tiny instances; copy–paste of person patches with careful boundary feathering to avoid label noise.
For high-resolution aerial frames, we further employ Slicing Aided Hyper Inference (SAHI) [25] during training to present the model with higher pixel density of small targets, and during inference to reduce miss rate at long range (Section 2.4). When using public imagery for pretraining/tuning, we restrict to class-compatible scenes and retain our session-disjoint policy.
The primary class is person (includes swimmers and potential victims). For analysis, we maintain auxiliary tags (behavioral cues) that are not used as training classes but support ablations in Section 2.7. Class balance is monitored per altitude bin (7–10 m, 10–15 m, >15 m) and sun-elevation bin to avoid overfitting to easy, bright, low-altitude views.
When thermal frames are available (MLX90640, 32 × 24), we log synchronized pairs with timestamps and extrinsics, but training of the detector remains RGB-only; thermal is used post-detection for fusion/prioritization (Section 2.5). For paired frames we store per-box thermal statistics (max/median) computed from the mapped region, enabling retrospective analyses without reprocessing raw thermal streams.
All coastal data were collected in compliance with local regulations; faces and personally identifying details are either absent due to altitude or not used for recognition. We make split indices (train/val/test session IDs), class definitions, and augmentation configuration available for reproducibility; raw imagery containing sensitive information can be shared upon reasonable request for academic purposes (Section Data Availability).
Generic datasets such as COCO provide diverse contexts but few instances of small, partially submerged humans. Prior SAR surveys emphasize the gap and the benefits of domain-specific corpora for deployment-grade performance [1,2]. Our collection, hard-negative policy, and small-object–oriented synthesis are designed to close that gap while remaining compatible with standard training pipelines.
2.3. Annotation Workflow and Label Quality Control
A human-in-the-loop annotation pipeline is used to obtain reliable labels for small, partially submerged humans in coastal UAV imagery. The process couples fast pre-annotation by a foundation model with rigorous human verification, COCO-style conventions [21], and explicit quality gates tailored to maritime scenes.
We annotate a single training class person (swimmers and potential victims). Optional, non-training behavior tags (e.g., vertical, arm-up, prone) are recorded for analysis but are not used as detector classes. Boxes follow COCO-style axis-aligned rectangles in pixel coordinates [21]. Fully submerged silhouettes are not labeled; severely ambiguous foam/spray is marked as ignore to avoid penalizing the detector during training.
2.4. Training and Deployment Pipeline
We train with momentum SGD and cosine learning-rate decay from an initial warm-up. Mixed-precision training (FP16) is used on the workstation only; batch normalization statistics are synchronized across devices when available. Validation mAP and F1 are monitored at fixed step intervals, and early stopping is applied based on a specified patience window. All experiments use fixed random seeds and three independent runs.
For each detector m, we select the operating confidence
Unless otherwise noted, all validation curves are drawn across and test-set summary numbers are reported at (frozen from validation).
The default YOLOv8 detection losses (box regression, classification, and distribution focal) are retained [20]. The validation set determines: (i) confidence threshold that maximizes F1; (ii) class-aware NMS IoU threshold (grid search in [0.45, 0.65]); and (iii) the tiling policy switch (enabled if AP-S improves without exceeding the latency budget. Thresholds are frozen before test-time reporting.
The best checkpoint is exported to ONNX and compiled into TensorRT engines (FP16 and INT8) [26]. INT8 post-training quantization uses a calibration subset that matches the deployment distribution (altitudes, sea states, sun angles) to minimize quantization bias on tiny targets. Engines are built with dynamic shapes (common input sizes) and serialized with an explicit batch. We verify parity on the validation split: FP16/INT8 mAP and AP-S must remain within a small tolerance of the FP32 baseline (e.g., ≤1–2% absolute). If parity fails, we (i) enlarge the calibration set; (ii) relax per-layer precision constraints; or (iii) fall back to FP16.
Onboard, frames are captured, undistorted if necessary, letterboxed to the selected input size, and optionally tiled (as specified in the policy above). Post-processing applies class-aware NMS in the frame coordinate system; tile predictions are de-duplicated at tile borders. Each detection record retains: bounding box, confidence, and the tile identifier (if any). The detector remains RGB-only; thermal fusion is applied after detection as in Section 2.5.
TensorRT engines are executed on the NVIDIA Jetson with pinned-memory I/O and asynchronous CUDA streams to overlap pre/post-processing with inference. Stage latencies () are logged per frame. The detector outputs feed the tracker and controller (Section 2.6 and Section 2.7). A watchdog enforces a soft budget (e.g., ms): if exceeded for N consecutive frames, the runtime (i) reduces tiling density and/or input size, then (ii) switches from INT8 to FP16 to mitigate thermal throttling.
We select (confidence) and NMS IoU on the validation PR curve to maximize F1 and minimize ID switches when combined with tracking (Section 2.6). The same operating point is used for field trials; any operator-visible threshold is read-only during experiments.
2.5. RGB–Thermal Calibration and Fusion
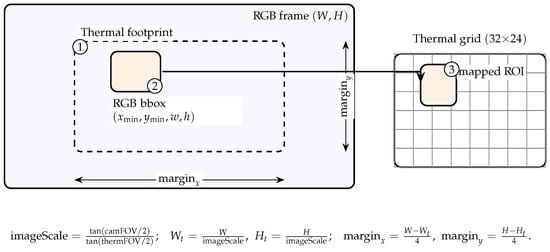
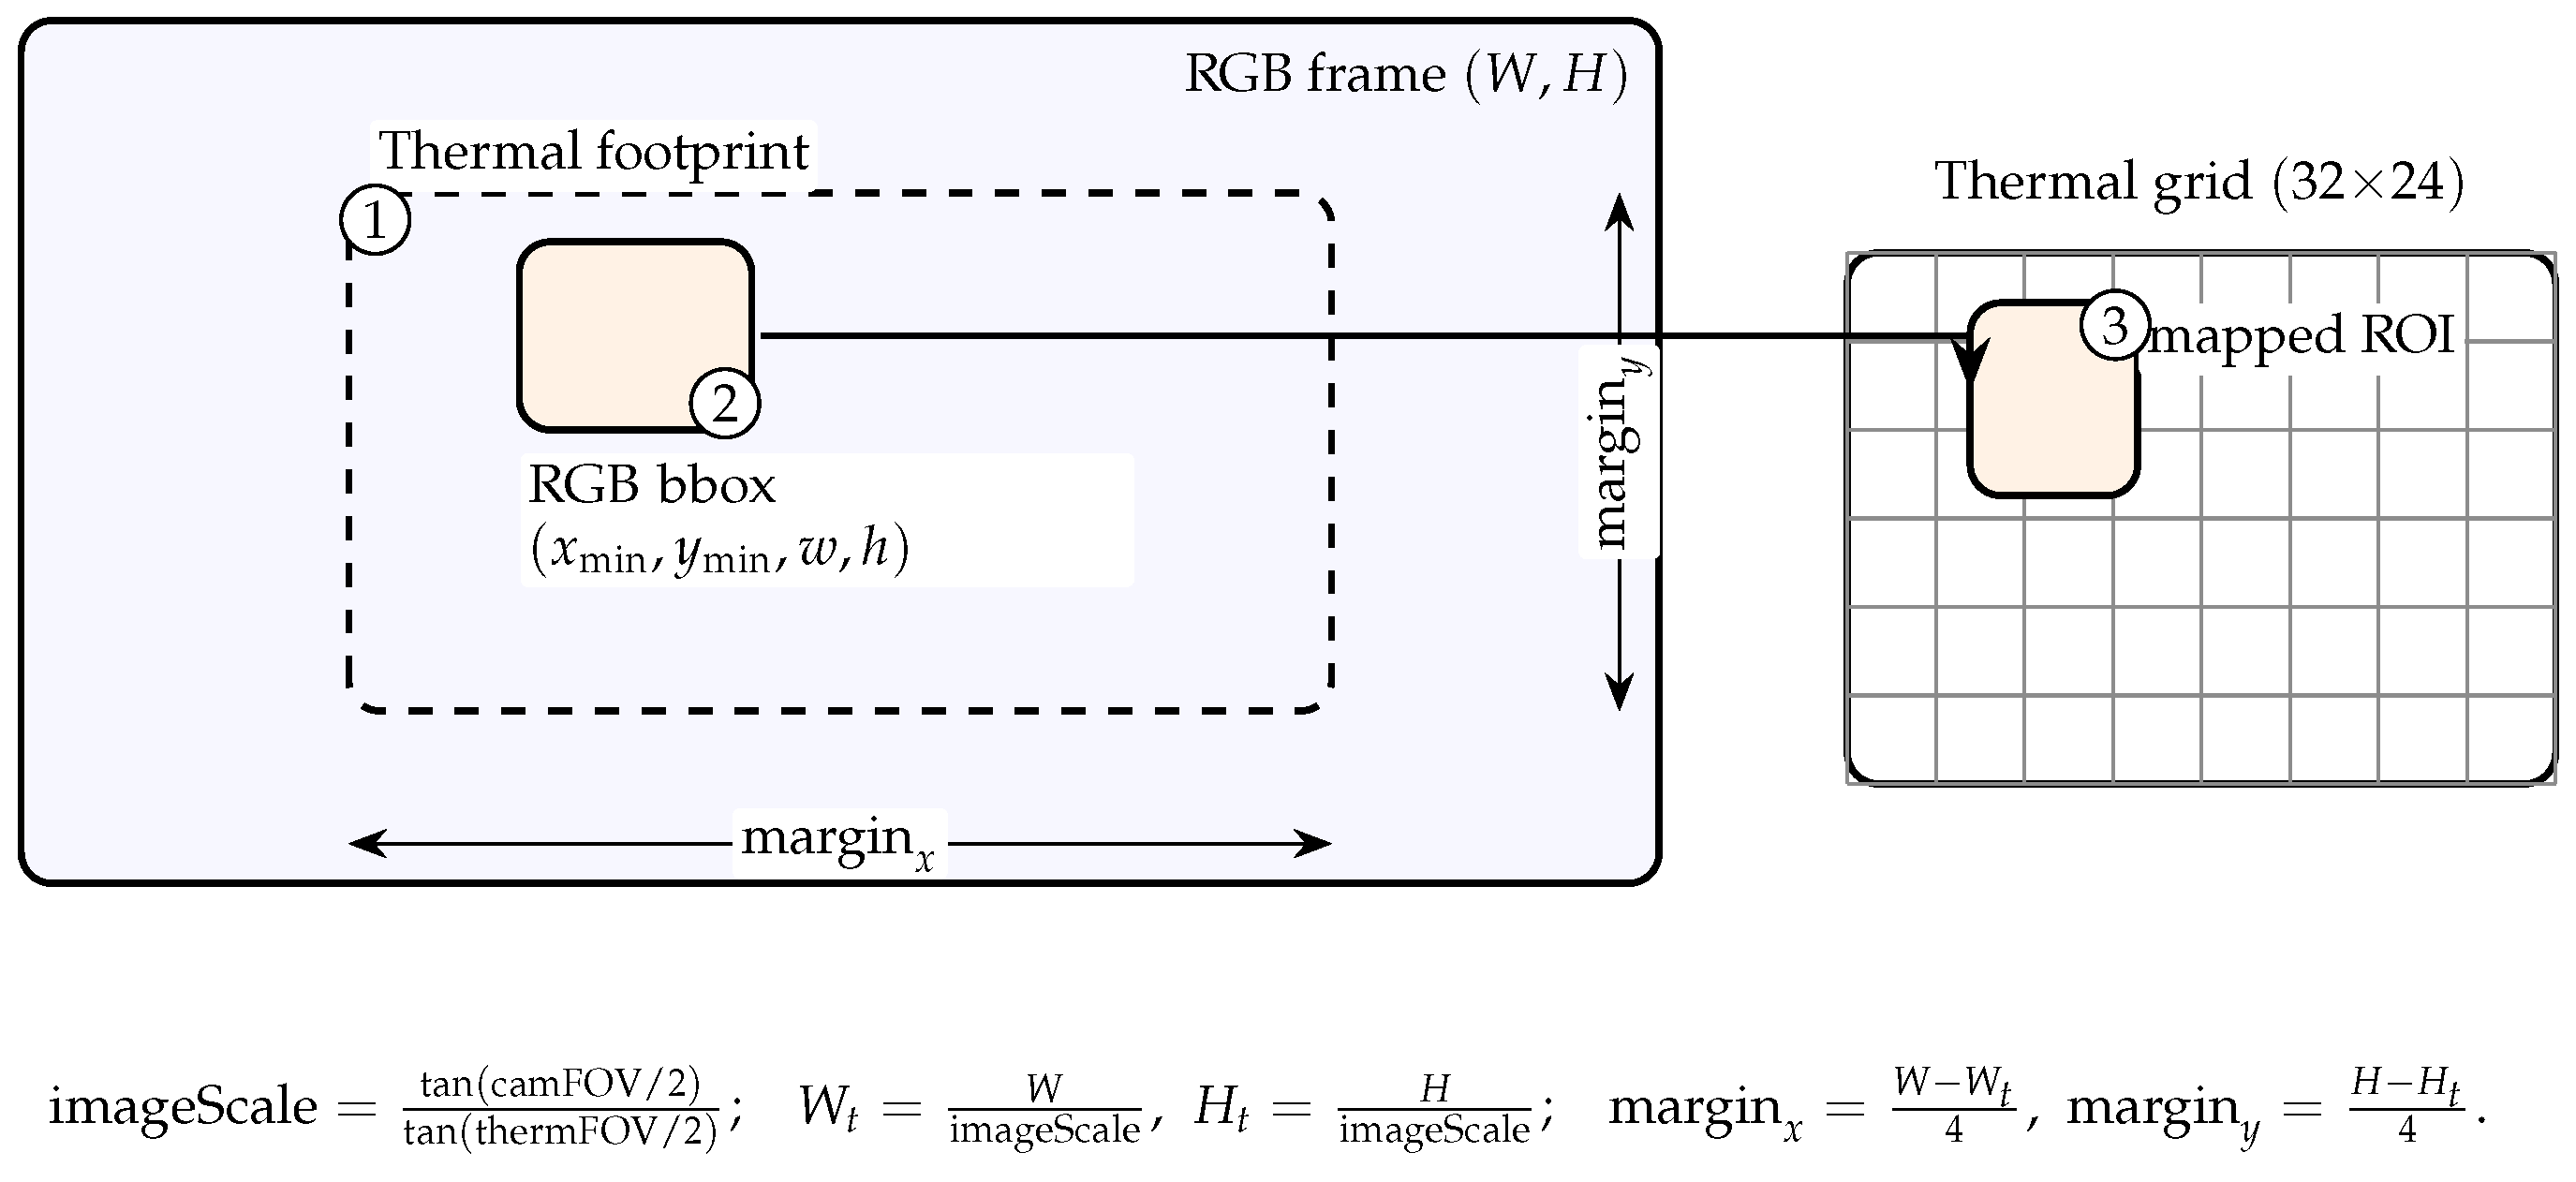
We align a low-resolution thermal array (MLX90640, 32 × 24) with the RGB camera rigidly co-mounted on the UAV and fuse thermal statistics with RGB detections to improve prioritization in maritime scenes [10,11,27]. RGB intrinsics are obtained by standard calibration [28]. Streams are time-synchronized by nearest timestamp (skew ≤ 50 ms). The detector runs on RGB only; fusion is applied post detection. Figure 4 illustrates the footprint and mapping.
Figure 4.
RGB–thermal calibration and mapping. (1) Inscribe the thermal footprint in the RGB frame. (2) Project an RGB detection box. (3) Use the mapped ROI on the 32 × 24 thermal grid to compute temperature statistics for prioritization.
2.5.1. FOV-Based Inscribed Footprint
Let the RGB frame have size and horizontal/vertical FOVs . The thermal module has . Define per-axis image scales (angles in radians):
The inscribed thermal footprint in RGB then has
2.5.2. Mapping an RGB Box to the Thermal Grid
Let the thermal array resolution be , where is the number of columns and is the number of rows. An RGB detection is the axis-aligned box in pixels, with origin at the top-left of the RGB frame. The inscribed thermal footprint inside the RGB image (see Figure 4, step 1) is the rectangle .
- Clamp the RGB box to the footprint: We first clamp the detection box so it does not extend outside the footprint:
- Project to thermal grid indices (Figure 4, step 3): Convert the clamped RGB edges to thermal edge indices (u for columns, v for rows). We use a half-open interval :Finally, saturate these indices to valid ranges:
- Clamp operator: For any scalar z and interval ,which returns z clamped to . Here, z is either an RGB pixel coordinate (e.g., ) or a thermal index (e.g., ); L and U are the lower/upper bounds, respectively. We use for left/bottom edges and for right/top edges to include all thermal cells touched by the RGB box.
- Axis conventions: If the thermal SDK uses a different row/column order or a rotation, swap/flip indices prior to applying (5). Optionally, bilinear upsampling of the grid by a factor of 2 can reduce aliasing for very small ROIs before pooling temperature statistics.
2.5.3. Thermal Statistics and Fusion
For the mapped ROI , we compute robust statistics:
A local background (dilated ring around ) provides normalization,
where is the fraction of the RGB box covered by the thermal footprint and is a logistic squashing. Each RGB detection with confidence s is augmented to a priority score
and used by the tracker/arbiter in Section 2.6. Thresholds and weights are set on the validation split and kept fixed for all evaluations.
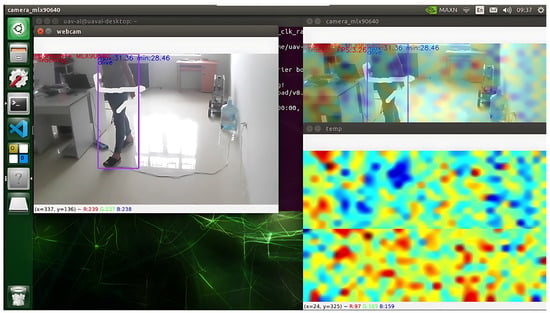
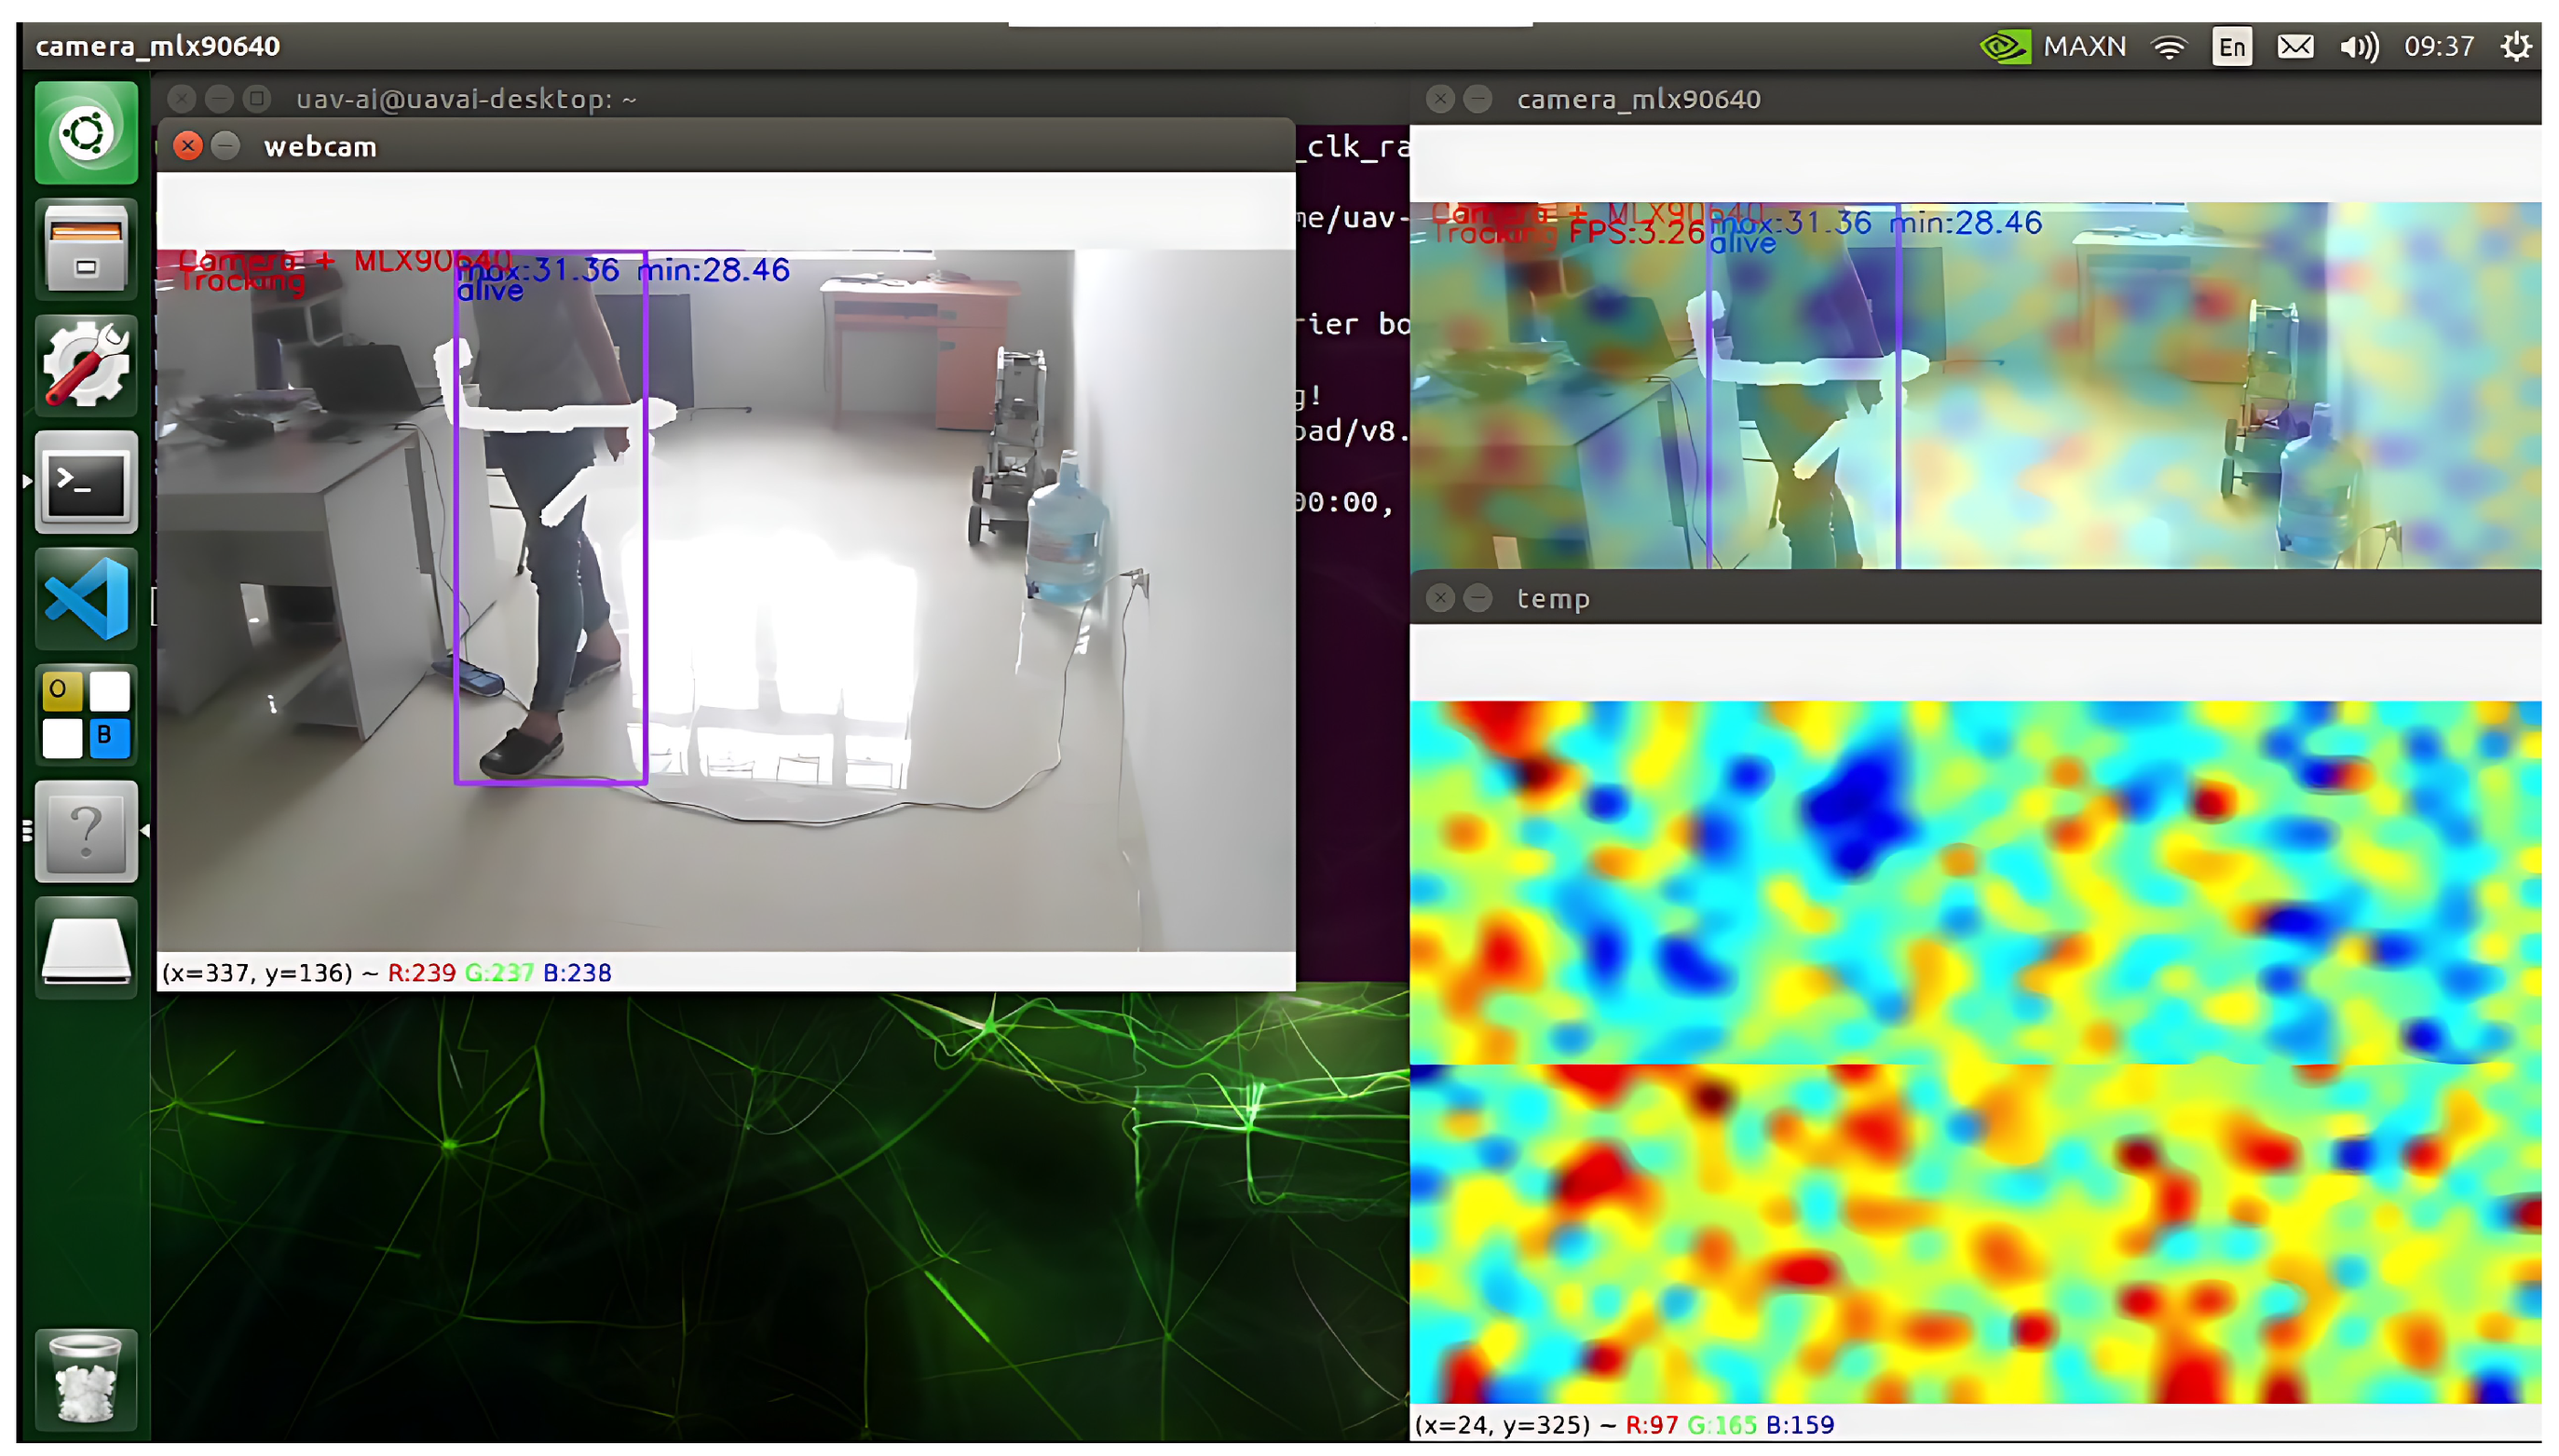
The alignment process is illustrated in Figure 5, where the inscribed thermal footprint is mapped to the RGB frame and per-box temperature statistics are computed for prioritization.
Figure 5.
Illustration of RGB–thermal fusion used for prioritization of drowning victims. Left: raw RGB frame with detected bounding boxes. Top-right: mapped thermal footprint aligned to the RGB field-of-view. Mid-right: corresponding thermal statistics (maximum). Bottom-right: Thermal statistics (median).
2.5.4. Thermal Statistics and Normalization
For the mapped ROI we compute robust statistics
and normalize against a scene baseline (ring outside all ROIs)
We discard ROIs smaller than 2 × 2 cells or with excessive variance, which often arises from splash/glare over water [10,11].
2.5.5. Fusion Score and Gating
Each detection receives a fused confidence
where is the RGB detector score, is a track-stability term (age/velocity smoothness), and are tuned on the validation set (fixed for test). Thermal contribution is disabled ( = 0) if the ROI touches the footprint border, if the thermal frame age exceeds a staleness threshold, or if Equation (5) collapses to a single cell at high altitude.
2.5.6. Operational Checks and Fallback
Before flights we verify: (i) symmetry of margins in Equation (2) by placing reference targets at RGB edges; (ii) correct grid orientation by a four-corner sweep. In operation, if the median IoU between consecutive mapped ROIs and their reprojected counterparts falls below a threshold for K frames, the system automatically falls back to RGB-only detection/tracking until re-synchronization.
2.5.7. Notes on Practicality
This FOV-inscription approach avoids per-pixel reprojection (unsuitable for 32 × 24 arrays) yet preserves the key thermal cue needed to prioritize likely humans on water [27]. It is robust to small misalignments and roll/pitch jitter typical of low-altitude coastal flights.
2.6. Tracking and Control Integration
The platform closes the loop from perception to actuation by coupling an on-board tracking-by-ID module with a light-weight image-based controller that streams velocity and yaw commands to the flight controller via MAVLink in GUIDED/offboard modes [1,19,20,29,30]. Figure 1 shows the hardware–software interfaces; the decision flow is depicted in Figure 2.
Table 1 summarizes the default tracking–control parameters used by the closed loop in Section 2.6. The gains and limits were tuned from Quang Ninh flight logs at 19–23 FPS to yield smooth target centering without overshoot, while the deadbands and smoothing/rate limits suppress detector jitter and ensure bumpless mode changes. These values are conservative starting points and may be scaled with altitude, wind, and frame rate during experiments; all changes are logged for reproducibility.
Table 1.
Default tracking–control parameters used in Section 2.6. Values were tuned from Quang Ninh flights and used unless otherwise noted.
2.6.1. Track State and Filtering
Each RGB detection (Section 2.5) provides a pixel centroid at video time . We maintain for the selected target a constant-velocity Kalman filter in the image plane with state :
with zero-mean process/measurement noises and covariances tuned from flight logs. The filter stabilizes the centroid used by the controller and supplies velocity estimates for gain scheduling.
2.6.2. Data Association and ID Management
New observations are matched to the current track with a cost that combines IoU and motion consistency (Mahalanobis gating):
where and . If exceeds a threshold or the detection confidence falls below , the track is marked tentative; after frames it is terminated and the controller reverts to nominal waypoint flight. In multi-target scenes, the operator may override selection; otherwise the target with maximal fused score S (Equation (11)) is chosen.
2.6.3. Normalized Image Errors
Let the RGB image have width W and height H. The controller uses normalized errors
so that (positive means the target is above center).
2.6.4. Velocity–Yaw Control Law
We adopt a first-order image-based guidance law compatible with Pixhawk velocity/yaw set-points in local NED [29,30]:
where is the forward velocity command (m/s), is the yaw-rate command (rad/s), are gains, and applies a deadband . The saturation limits commands before conversion to SI units:
To avoid oscillations, commands are rate-limited and low-pass filtered:
2.6.5. Zoning Policy and Corner Handling
For interpretability and to interact with the operator UI, the controller also implements a 3 × 3 zoning overlay (Figure 2). If and the UAV holds position (hover); otherwise the continuous law (15) is applied. When the centroid lies in a corner cell, yaw is prioritized for N frames before advancing forward, which reduces spiral trajectories in crosswind.
At = 20 Hz the Jetson publishes SET_POSITION_TARGET_LOCAL_NED with and MAV_CMD_CONDITION_YAW with [29]. A simple arbiter enforces priorities:
Loss of track ( for K frames), stale thermal data, or geofence warnings trigger an immediate drop to waypoint/loiter. These choices mirror best practices in SAR trials [1,19].
2.6.6. Timing and Compute
On AGX Xavier the tracker and controller add ms per frame (C++), negligible relative to detection/fusion (Section 2.5). End-to-end loop delay—detector to actuation—averages 75–95 ms at 19–23 FPS, which is sufficient for low-altitude coastal flights described in our experiments.
2.6.7. Safety and Logging
All commands, states , gains, saturations, and mode transitions are logged at for audit and parameter tuning. Failsafes include command time-out, minimum altitude, and velocity caps that depend on height AGL. These rules were validated in our Quang Ninh trials and are consistent with operator-in-the-loop SAR procedures [1].
2.7. Evaluation Protocol and Metrics
This section specifies how we partition data, avoid leakage, and compute offline and on-board performance. We report point estimates with 95% confidence intervals obtained by stratified bootstrap (1000 resamples) over scenes unless noted.
2.7.1. Dataset Partitions and Leakage Control
We follow the session-disjoint splitting defined in Section 2.2: all frames from a given flight session (location, date, altitude band) belong to a single split. Videos are not diced across train/val/test to prevent temporal leakage. The validation set is used only for model/threshold selection; the test set is held out until the final report.
2.7.2. Detection Metrics
Let be the set of ground-truth boxes and the set of predictions at confidence threshold . A prediction is a true positive if its IoU with an unused ground-truth box exceeds a threshold ; otherwise, it is a false positive. Ground-truth boxes not matched are false negatives [21]. We compute precision, recall, and F1 as
Average Precision is the area under the precision–recall curve; we report (IoU ), and AP@50:95 averaged over (COCO protocol) [21]. For small targets, we stratify by object area and also report AP for the smallest tertile. The operating confidence used at deployment is chosen on the validation set to maximize F1 at = 0.5 and is then fixed for all test-time reporting (see Section 2.4).
The ablation was conducted using tiling and fusion. To isolate the contributions of tiling (SAHI) and thermal fusion, we evaluate three detector variants on the same test frames: (i) RGB, no tiling; (ii) RGB + Tile; (iii) RGB + Tile + Thermal (full system). For each, we report and against the RGB baseline, and analyze gains versus altitude band and sun elevation (proxy for glare) following [10,11]. Thermal fusion thresholds (Section 2.5) remain fixed across variants.
2.7.3. Calibration Curves and Confusion Analysis
We assess confidence calibration by binning predictions and measuring acc-conf gap and Expected Calibration Error (ECE). A normalized confusion matrix (person vs. background) at complements PR curves to visualize residual failure modes (splash/glare, partial submergence).
2.7.4. Tracking Metrics
For the selected target per scene, detections are associated over time by the tracker (Section 2.6). We report ID switches (IDSW), track fragmentation (FRAG), and IDF1 (harmonic mean of ID precision/recall). Associations are built with IoU-based matching at = 0.5. In multi-target scenes, we additionally report the time-to-lock (seconds from first valid detection to a stable track of length ) and lock persistence (median uninterrupted track duration).
2.7.5. Control/Mission Metrics
Closed-loop quality is summarized with image-space errors and mission times:
where are centroid estimates (post-filtering) and match Section 2.6. From flight logs we also report overshoot and response times at mode changes, as in Table A1.
2.7.6. Latency and Throughput
On the embedded platform we decompose per-frame timing into pre-processing (), inference (), post-processing (), and control/IO (). The end-to-end loop delay and throughput are
We compare FP16 vs. INT8 TensorRT engines (same inputs, same thresholds) and require parity within 1–2 pp AP loss; otherwise calibration is expanded [20,26].
2.7.7. Statistical Reporting and Strata
All metrics are stratified by (i) altitude bands (7–12, 12–16, 16–20 m AGL), (ii) sea state (calm/choppy), and (iii) illumination (day/dusk/night surrogate). Scene-level means and bootstrap CIs are reported per stratum and aggregated via macro-averaging. Paired ablations (e.g., with/without fusion on the same scenes) use the Wilcoxon signed-rank test (two-sided, = 0.05).
2.7.8. Field-Trial Protocol
For each sortie in Quang Ninh, the UAV flies a predefined search route and enters the tracking mode only upon detection events. During trials the operating confidence , NMS IoU, and controller gains remain fixed (as tuned on validation); operator prompts are time-stamped. Thermal fusion is enabled by default, and automatically gated under the conditions in Section 2.5. Safety geofences and manual override priorities follow Section 2.6.
2.8. Baselines and Comparison Methods
We evaluate the proposed RGB–thermal fused pipeline against representative single-stage and two-stage detectors, a thermal-only heuristic, and internal ablations. All methods use the same session-disjoint splits (Section 2.2) and are scored with the metrics in Section 2.7. Unless noted otherwise, detectors are initialized from COCO pretraining [21], trained on our SAR dataset with identical augmentation and optimizer settings, and evaluated at a single operating confidence chosen on the validation set (F1-max at IoU 0.5). The IoU threshold for non-maximum suppression (NMS) is tuned on the validation set. For accuracy, we report PyTorch FP32 offline results; for deployability, we also report TensorRT INT8 runtime on Jetson AGX Xavier where applicable. A summary of all configurations is shown in Table 2.
Table 2.
Baselines and comparison methods. TRT: TensorRT.
We freeze the model-specific found on validation (FP32 , INT8 ) for test and on-board replay. More explanations on each raw of Table 2 are listed below.
- B0: YOLOv8s (RGB, no tiling) Single-stage RGB baseline. Threshold and NMS IoU are selected on validation.
- B1: Late fusion (RGB+Thermal) RGB detector as in B0; thermal ROI statistics (Section 2.5) are fused at score level with cross-modal NMS.
- B2: Full stack = B1 + ByteTrack. Adds ID-aware tracking for stable IDs; this is the closed-loop perception stack used on-board.
- B3: Faster R-CNN (R50-FPN, RGB) Two-stage accuracy baseline with multi-scale training.
- B4: RetinaNet (R50-FPN, RGB) One-stage anchor baseline with focal loss ( tuned).
- B5: Thermal thresholding (MLX90640). Heuristic baseline on the 32 × 24 thermal stream: normalization, thresholding, morphology, blob tracking.
Notes: (1) When tracking is applicable, we report IDF1 and ID switches using the same association backend across methods; only the detector varies. (2) All hyperparameters not listed in Table 2 follow the common training recipe above.
3. Experiments and Results
3.1. Offline Performance
We first quantify detector quality and training dynamics on the session-disjoint splits (train/val/test) using the protocol in Section 2.7. Unless noted, all curves are computed on the validation set; the held-out test set is used once to produce the summary metrics in Table 2. Baseline configurations are defined in Section 2.8. All detectors are evaluated at their validation-selected operating point (F1-max @ IoU 0.5). For reference in this study: FP32 , INT8 .
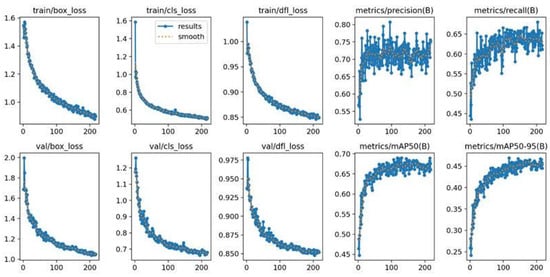
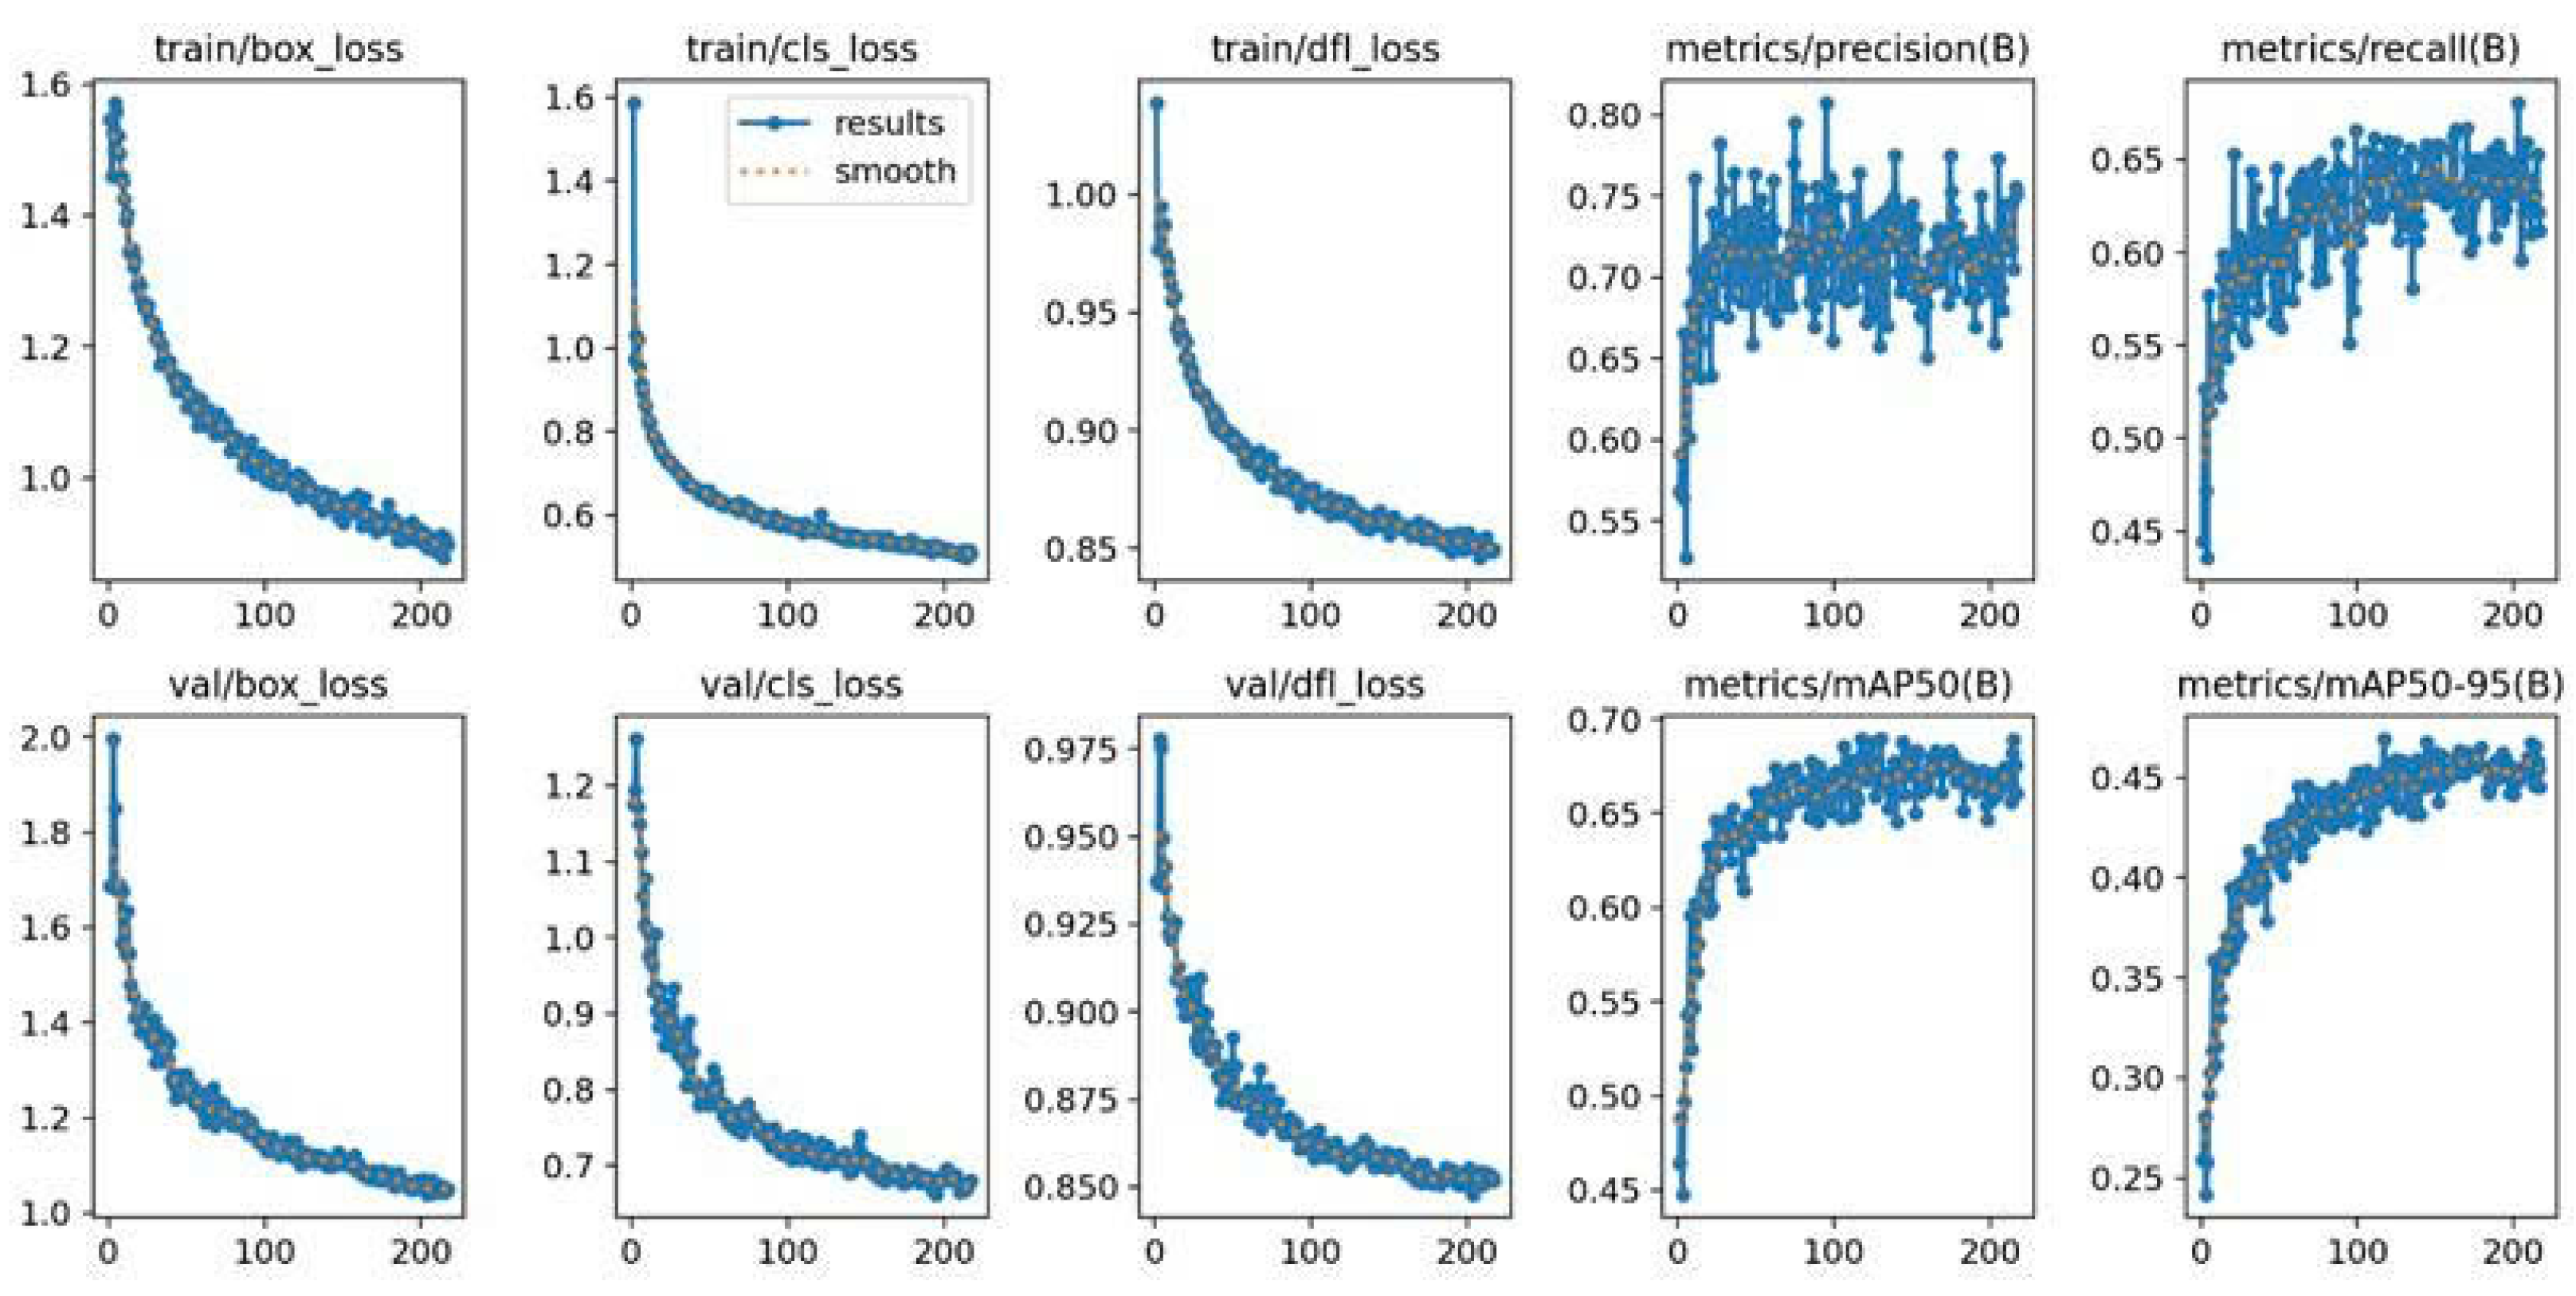
Figure 6 shows stable optimization: box regression loss drops from ∼1.6 to <1.0 (train) and from ∼1.8 to <1.2 (val); classification loss falls from 1.4→0.6 (train) and 1.2→0.8 (val). The distribution focal loss (DFL) steadily declines to ≈0.85, indicating sharper localization distributions. Precision fluctuates in the 0.55–0.80 range as recall grows from ∼0.45 to ∼0.65. Mean Average Precision improves throughout: from ∼0.45 to ∼0.65 and from ∼0.25 to ∼0.45, with no signs of divergence or overfitting.
Figure 6.
Training/validation dynamics. From top: (i) box and classification losses; (ii) distribution focal loss (DFL); (iii) precision/recall; (iv) mAP@50 and mAP@50–95. Curves indicate steady optimization and improved localization/recognition quality.
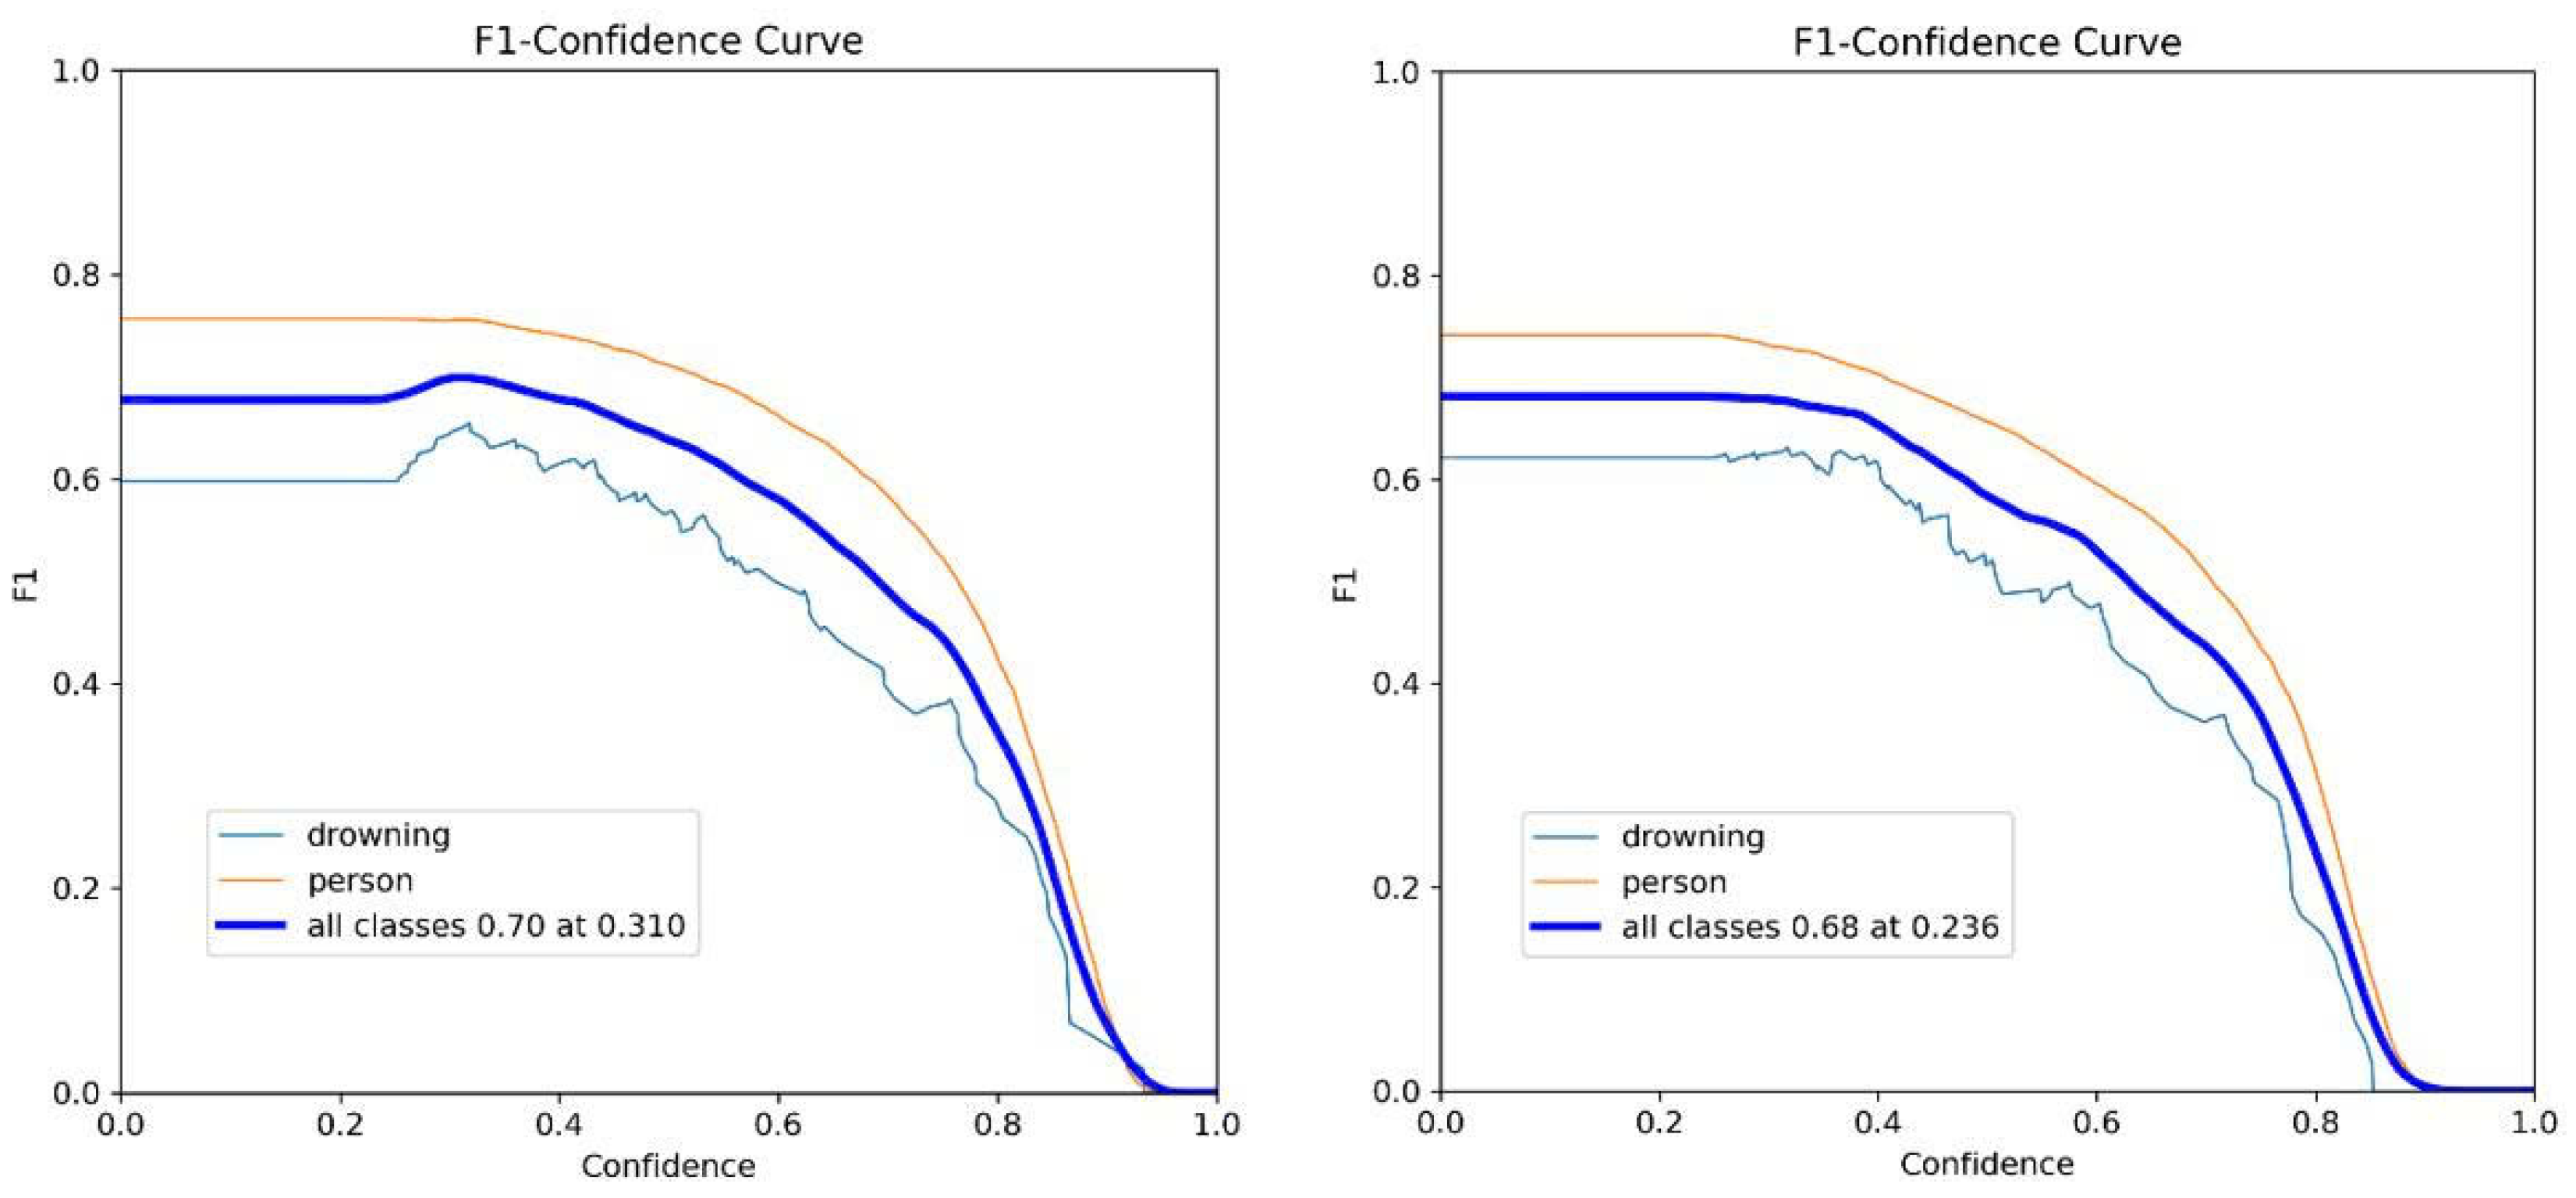
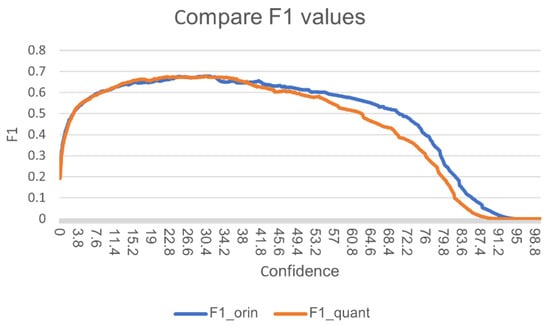
In Figure 7, F1 versus confidence threshold is plotted for the FP32 PyTorch model (“Original”) and the INT8 TensorRT engine (“Quantized”). Both curves exhibit the expected precision–recall trade-off: as confidence increases, recall falls faster than precision improves, hence F1 declines beyond the optimum. The FP32 model peaks at around = 0.31; the INT8 model peaks at near = 0.236, indicating a small (≈0.02) F1 drop after quantization while preserving the shape of the curve. For deployment, we freeze the model-specific found on validation (FP32 , INT8 ) for test and on-board replay.
Figure 7.
F1 vs. confidence threshold. Left: FP32 (.pt). Right: INT8 TensorRT (.engine). Quantization preserves overall calibration and the optimal region (small F1 gap). The dashed vertical line marks the validation-selected operating threshold used in on-board experiments.
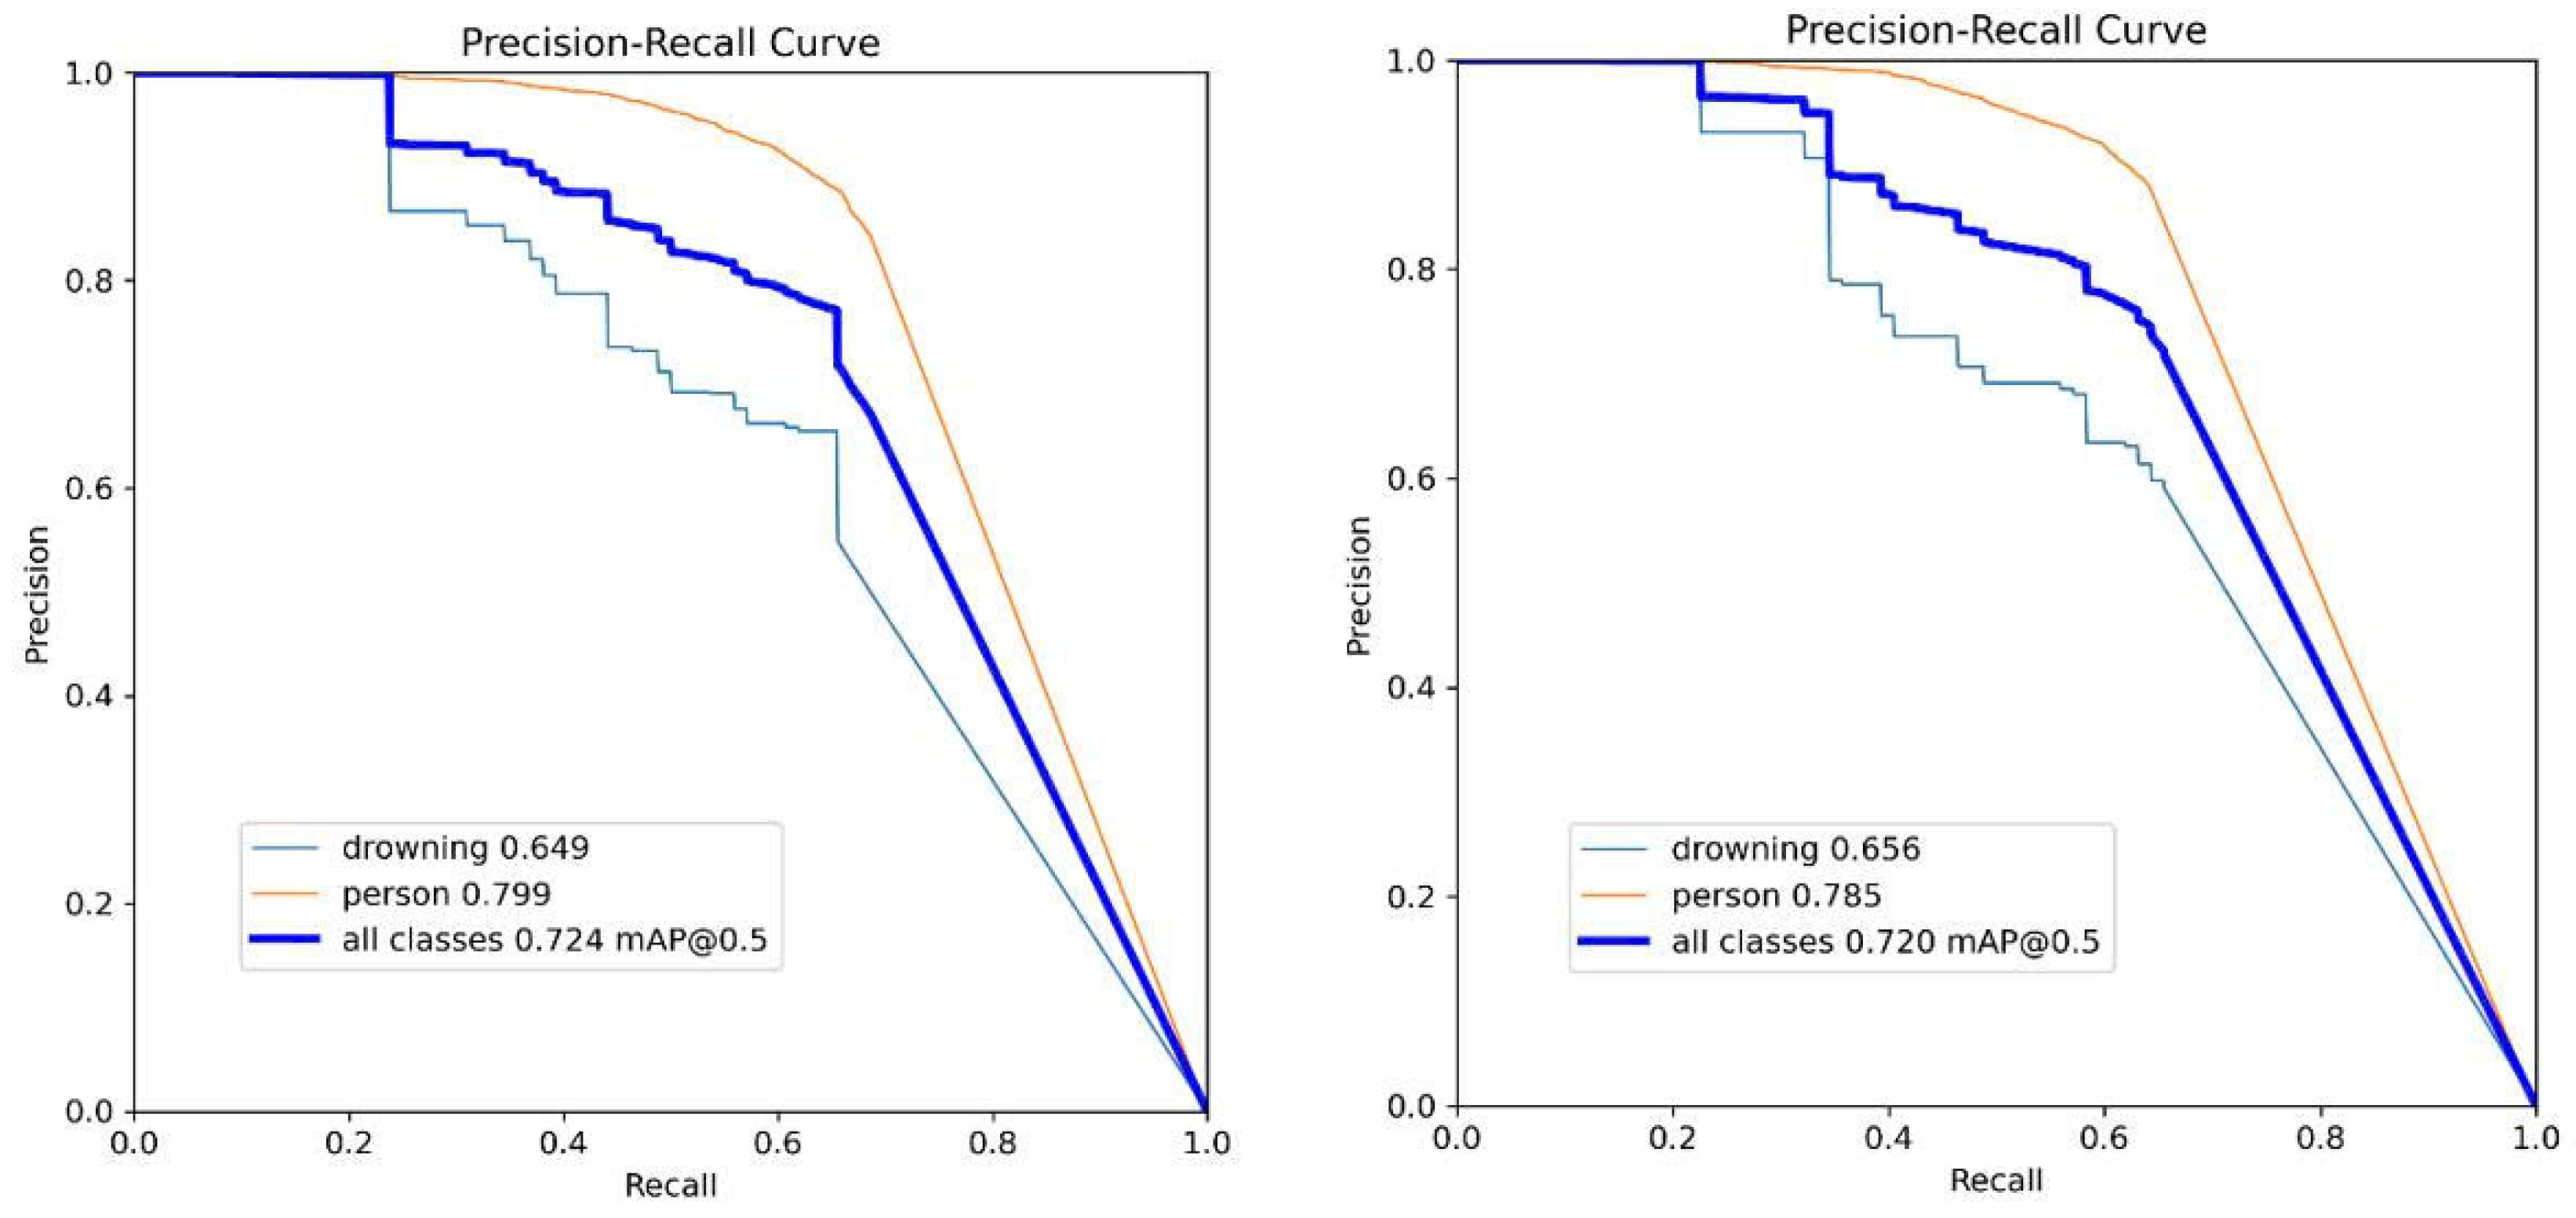
Figure 8 overlays Precision–Recall curves for original vs. quantized models. The integral metric changes only marginally (0.724→0.720), confirming negligible accuracy loss from INT8 conversion. Class-wise precision shifts are also small: drowning slightly improves (0.649→0.656), while person decreases marginally (0.799→0.785). These results support using the INT8 engine as the default for embedded inference without materially affecting ranking across IoU thresholds.
Figure 8.
Precision–Recall curves before (left) and after (right) quantization. Insets report mAP@0.5 and class-wise precision for person and drowning. Curves remain closely matched, indicating parity after INT8 conversion.
Across losses, PR/F1, and mAP, the detector shows consistent learning and robust generalization. INT8 quantization preserves offline performance within ≤2 pp of FP32 while enabling the embedded speedups analyzed later (Section 3.3). The validation-selected operating threshold from Figure 7 is used unchanged in subsequent tracking and field trials to avoid selection bias.
3.2. Impact of INT8 Quantization on Accuracy and Inference Speed
To justify the use of INT8 quantization for real-time deployment on the NVIDIA Jetson AGX Xavier, we conducted a detailed ablation comparing the original YOLOv8s model (FP16/FP32) with its TensorRT INT8-quantized counterpart. Both models were evaluated on the same session-disjoint test split described in Section 2.2.
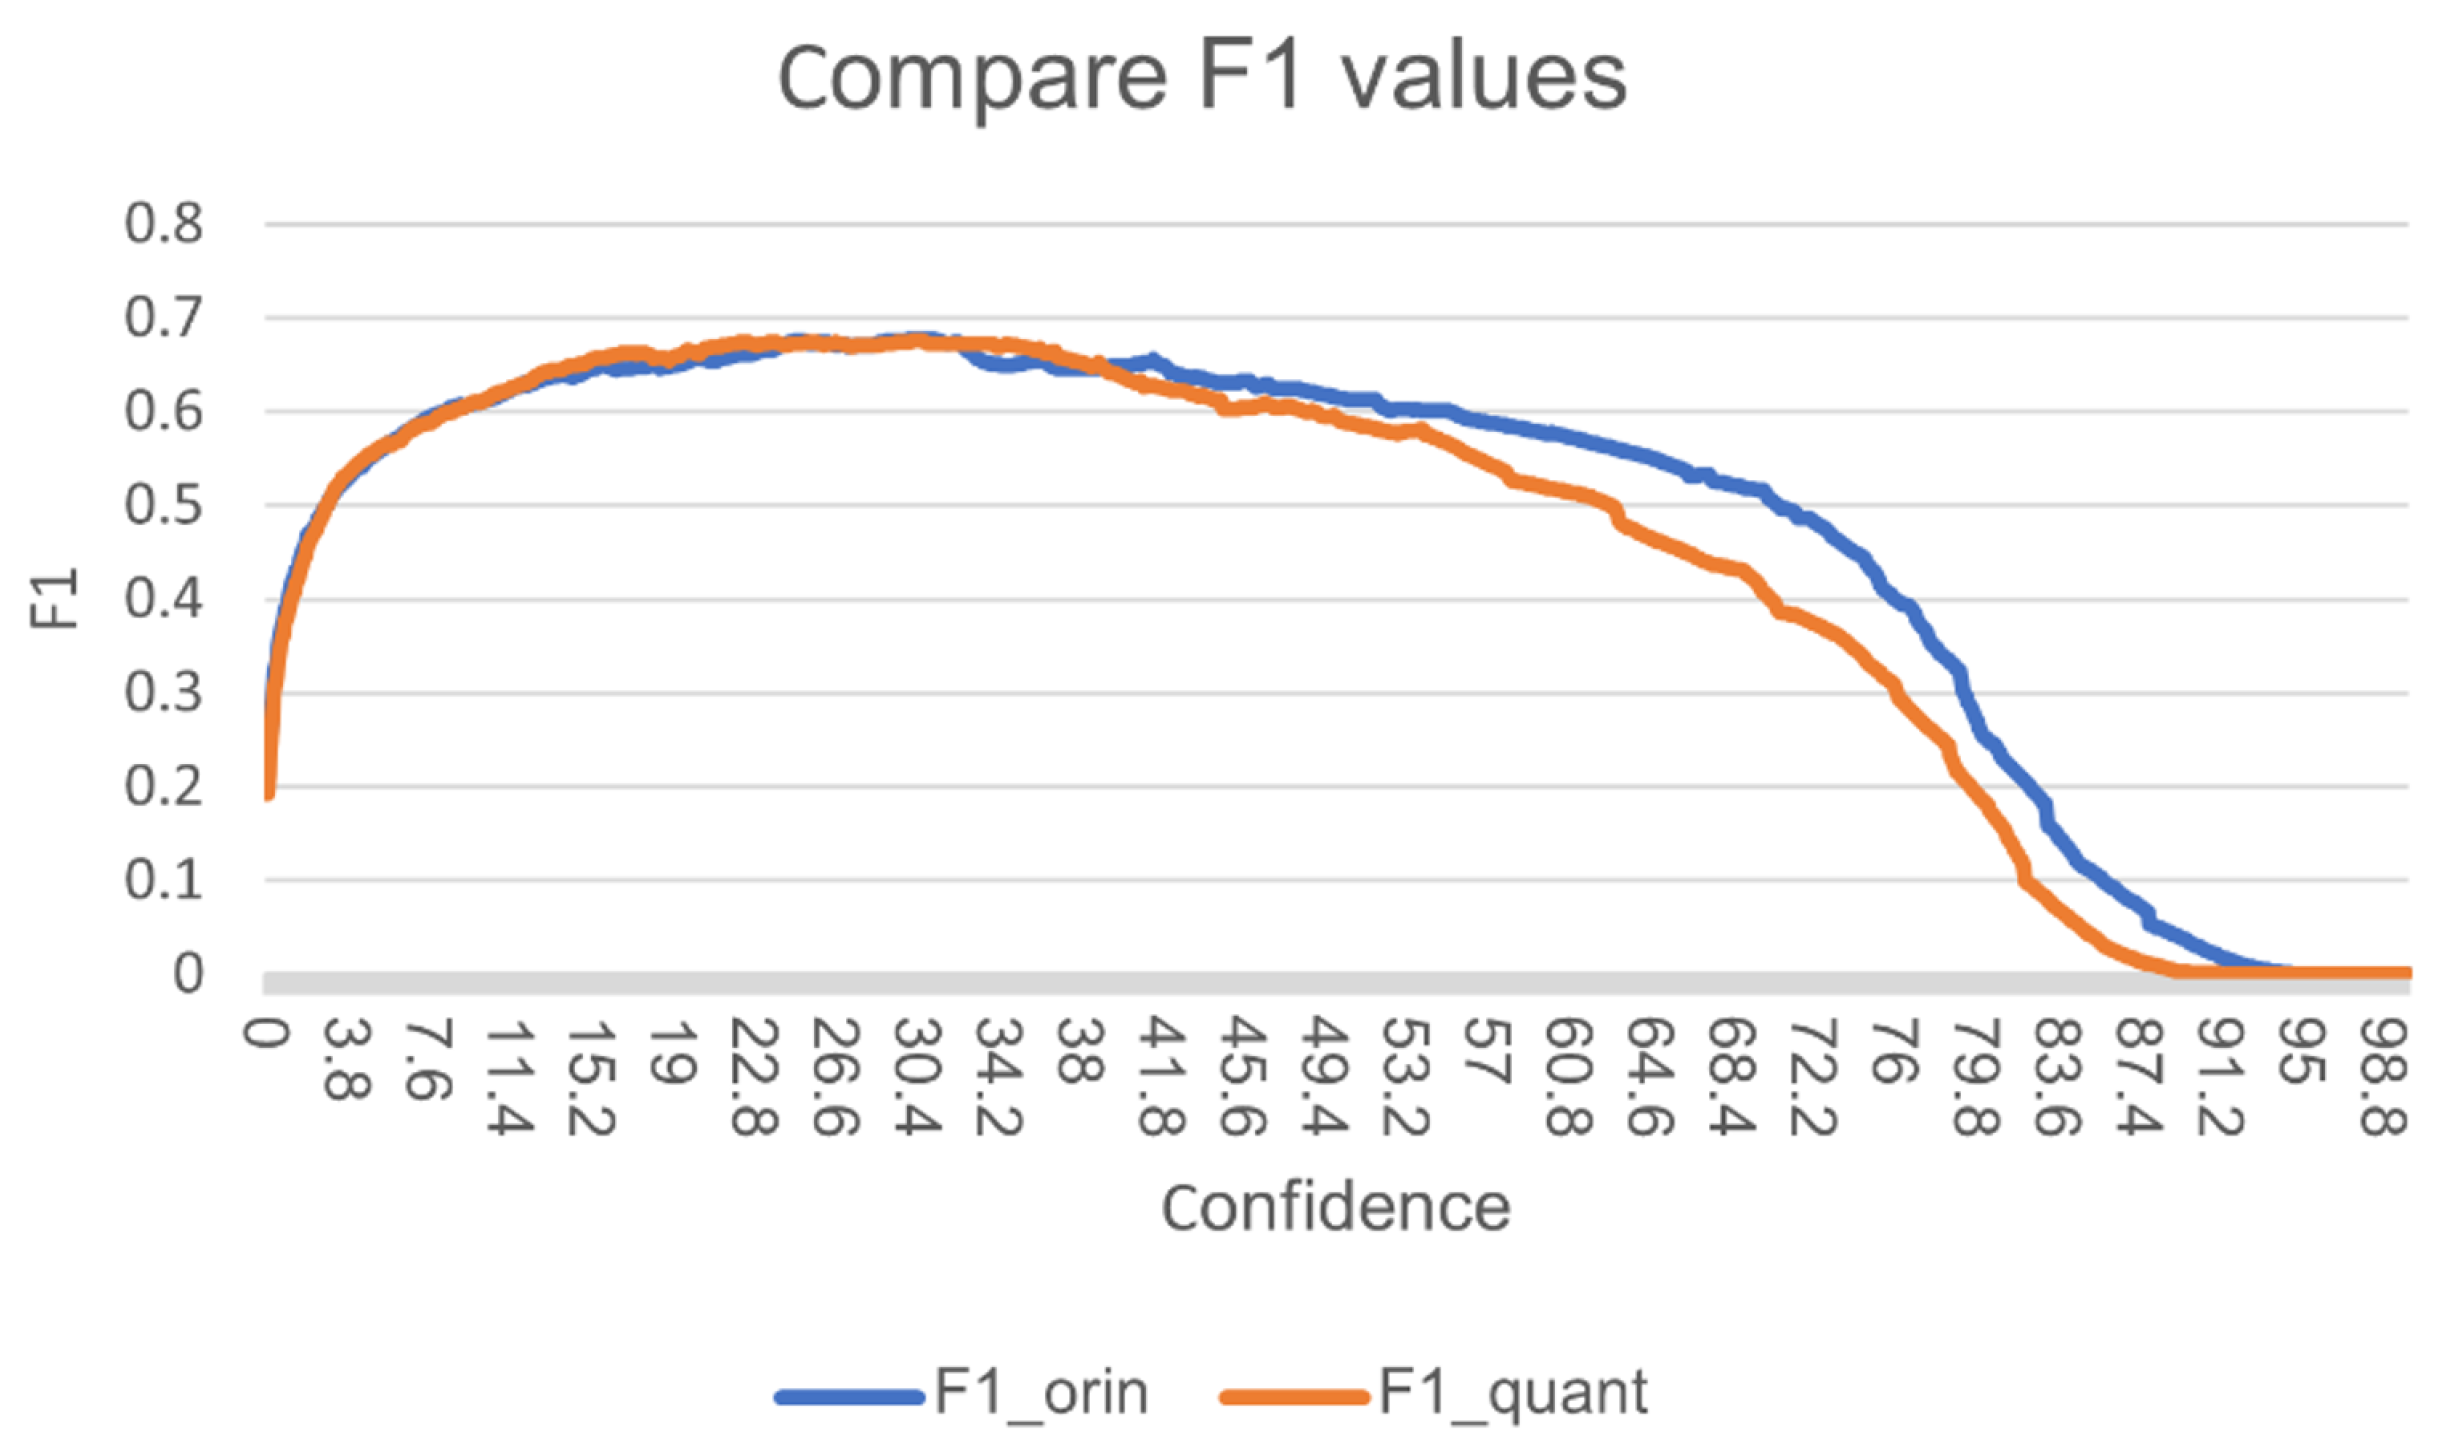
Figure 9 shows the F1-confidence curves for both models. At low confidence thresholds, the quantized model exhibits negligible degradation, preserving high recall for small and distant targets. Peak F1 scores differ by only 1.8–2.4 percentage points (original: 0.742, quantized: 0.718–0.724 at confidence 0.35–0.45). At high confidence thresholds, the quantized model shows a slightly steeper drop, reflecting minor calibration shifts typical of post-training quantization; however, the operating point chosen for deployment (confidence ≥ 0.25) lies well within the near-identical region.
Figure 9.
F1 score versus detection confidence threshold for the original and INT8-quantized YOLOv8 models.
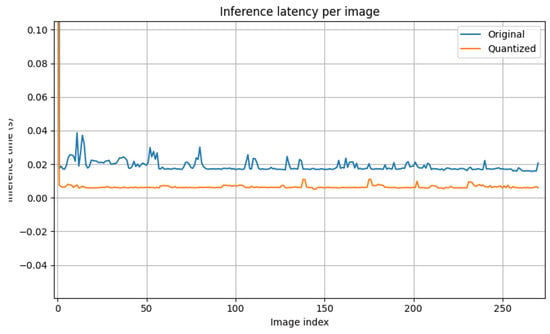
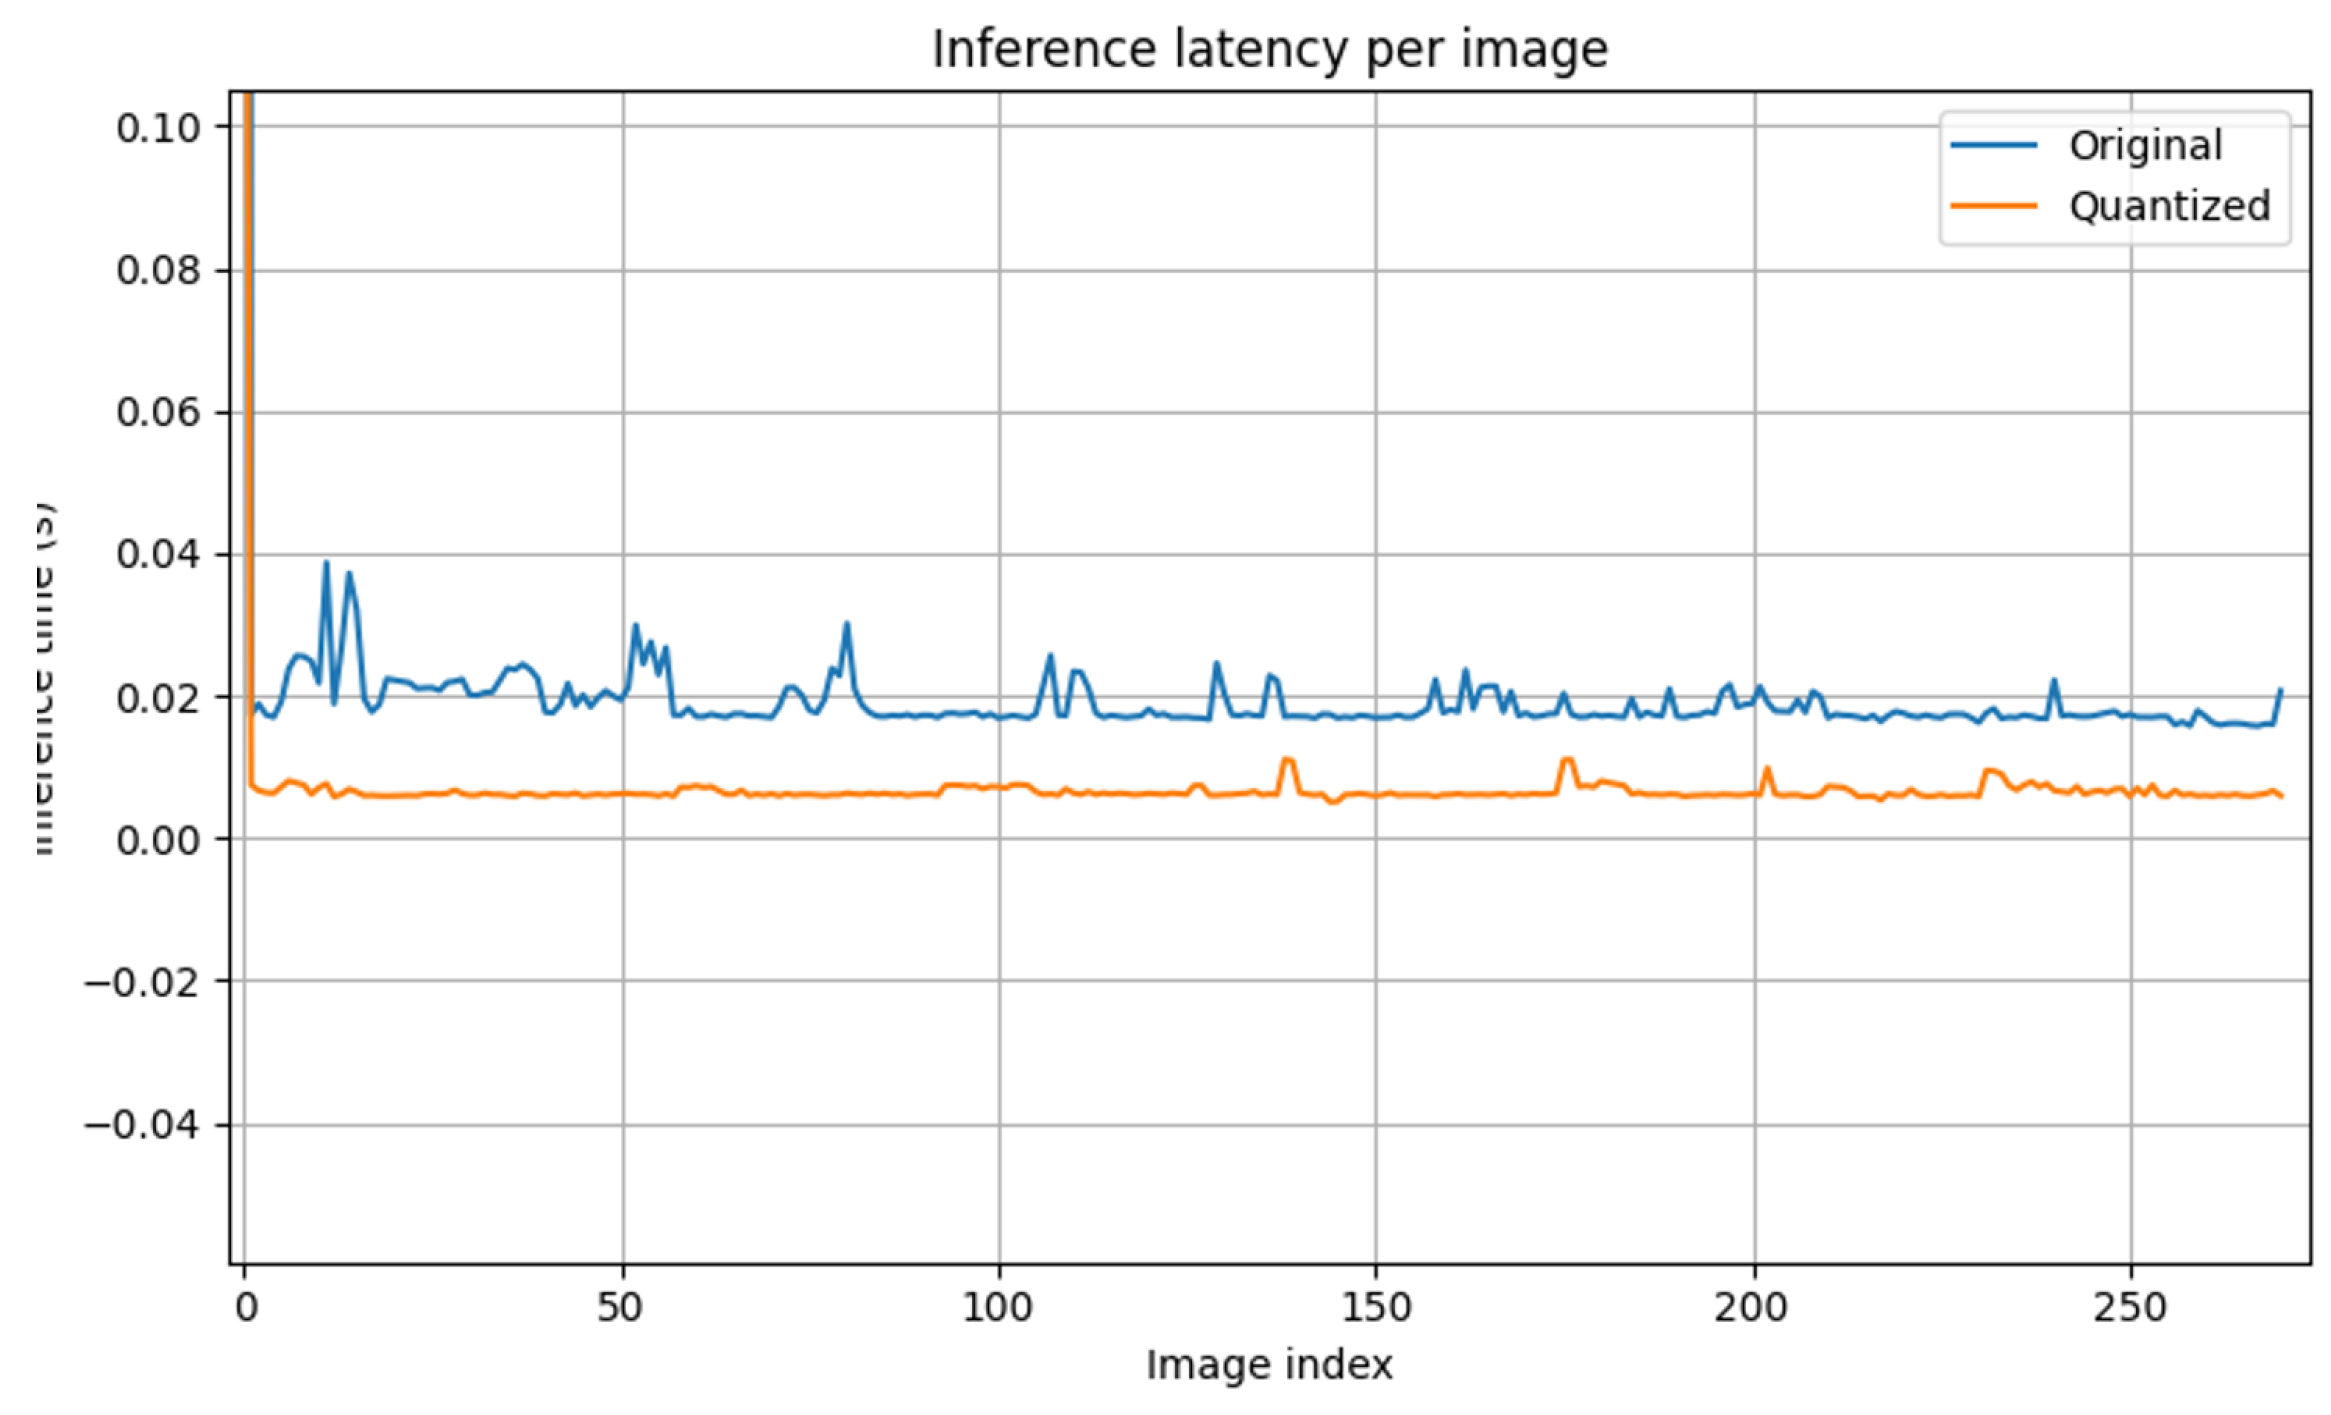
Figure 10 presents the inference latency per frame on the Jetson AGX Xavier (640 × 640 input, TensorRT engine, single stream). The original model exhibits a mean latency of 48.2 ms (20.8 FPS) with noticeable variance due to dynamic memory allocation and kernel launch overhead. The quantized model achieves a mean latency of 16.7 ms (59.9 FPS raw detection, 19–23 FPS end-to-end including tracking and fusion), representing a 2.9× speedup with significantly reduced jitter.
Figure 10.
Per-image inference latency comparison between the original and quantized models on the embedded platform.
Table 3 summarizes the trade-off. The minor accuracy reduction (1.8–2.4 pp in F1, 2.1 pp in mAP@0.5) is far outweighed by the latency improvement, enabling sustained 19–23 FPS end-to-end operation—including RGB-thermal fusion, ByteTrack association, and control commands—within the thermal limits and power envelope of the Jetson platform.
Table 3.
Quantization accuracy-latency trade-off on the maritime test set (Jetson AGX Xavier).
These results validate quantization as the critical enabler for closed-loop autonomy in resource-constrained maritime SAR missions, where even a 5–10 FPS deficit would prevent reliable tracking and victim prioritization.
3.3. On-Board Throughput (Jetson AGX Xavier)
We profile the end-to-end loop on the embedded platform following Equation (20), decomposing each frame into pre-processing (), network inference (), post-processing (; NMS, fusion, tracking), and I/O/control (; copies, MAVLink). Measurements are taken with batch size 1 on 1080p input, using CUDA events for GPU stages and wall-clock for CPU-bound stages. Unless stated otherwise, models are exported to TensorRT and executed with asynchronous pipelines and double buffering.
The original FP32 PyTorch model processes frames at s per frame (≈17.17 FPS), whereas the INT8 TensorRT engine achieves s per frame (≈41.73 FPS) on the same inputs and thresholds, preserving accuracy within the 1–2 pp target reported offline. In full field trials—where GUI rendering, logging, thermal fusion, tracking, and Pixhawk I/O are enabled—the sustained rate is 19–23 FPS, consistent with the extra CPU/GPU overhead beyond bare inference.
Figure 11 contrasts the per-frame loop delay for FP32 vs. INT8 exports. The stacked decomposition indicates that dominates in FP32, while in INT8 the residual overhead is shared by pre-/post-processing and I/O, explaining the gap between the 41.7 FPS “inference-only” bench and the 19–23 FPS sustained rate during full missions.
Figure 11.
Comparison of end-to-end loop delay on Jetson AGX Xavier across three settings. Bars correspond to mean times in Table 4; right-hand labels indicate FPS.
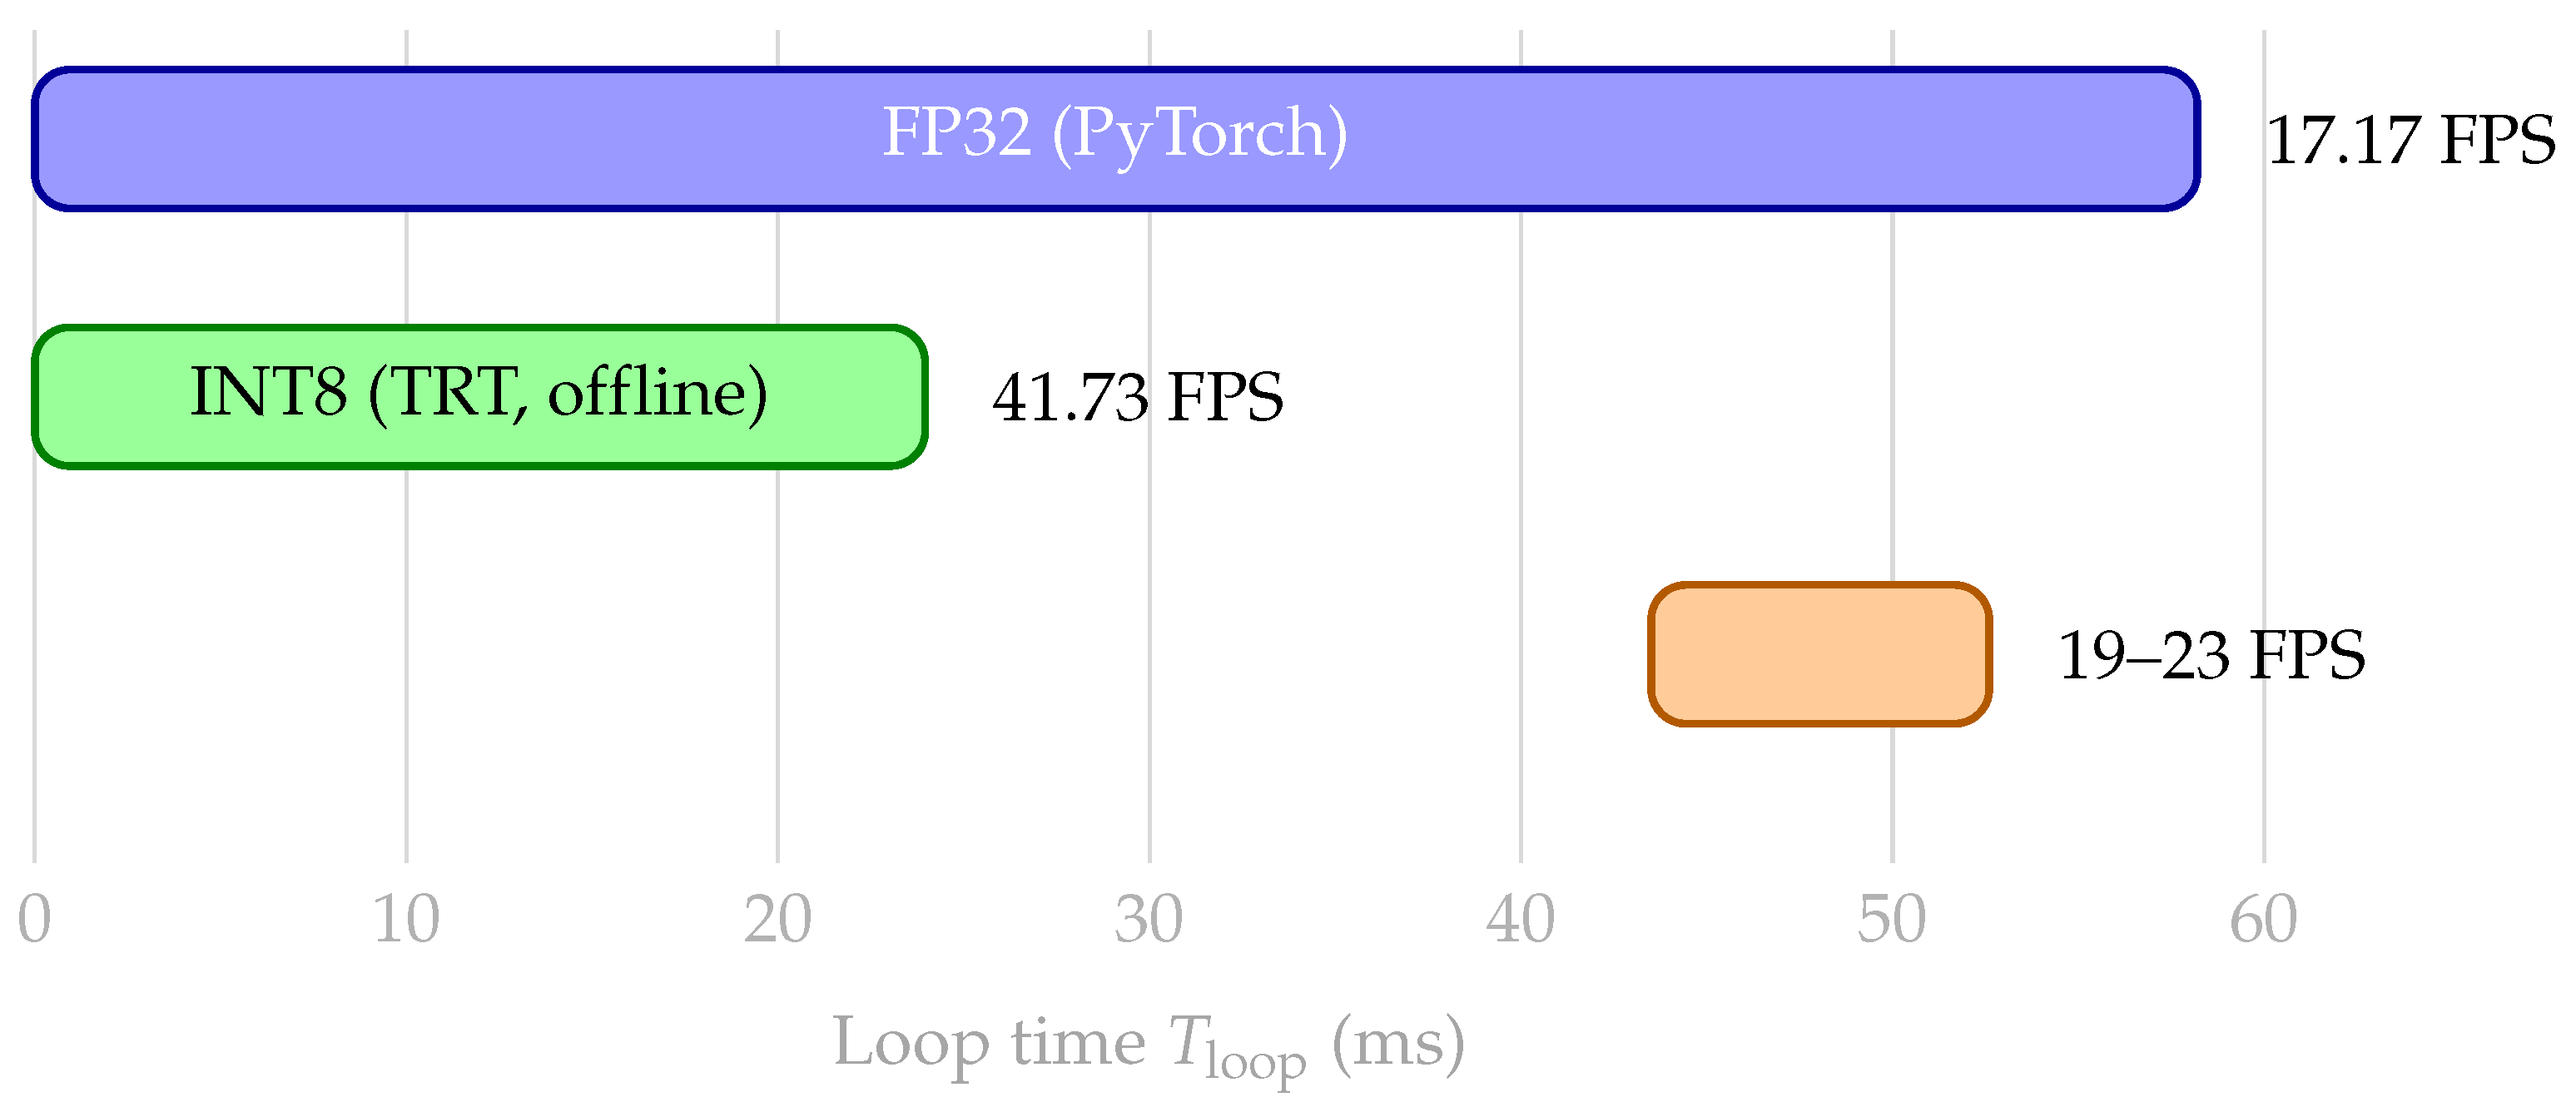
Table 4.
On-board throughput on Jetson AGX Xavier. Times are mean over 542 test frames; FPS computed as in Equation (20).
Ablation study reports (i) INT8 vs. FP32: INT8 reduces by ∼2.4× on this platform, with negligible AP loss (see Section 3.1), and (ii) Full pipeline overhead: GUI rendering, video encoding, thermal ROI statistics, and tracker association increase + , bringing sustained throughput to 19–23 FPS—still real-time for the controller in Section 2.6.
It is recommended to maintain batch size 1 and overlap host–device transfers with inference (asynchronous streams) to keep amortized. Pinned memory for camera frames and pre-allocated device buffers reduce jitter. For missions prioritizing battery life over peak FPS, FP16 TensorRT is a viable middle ground between FP32 and INT8.
3.4. Test and Results
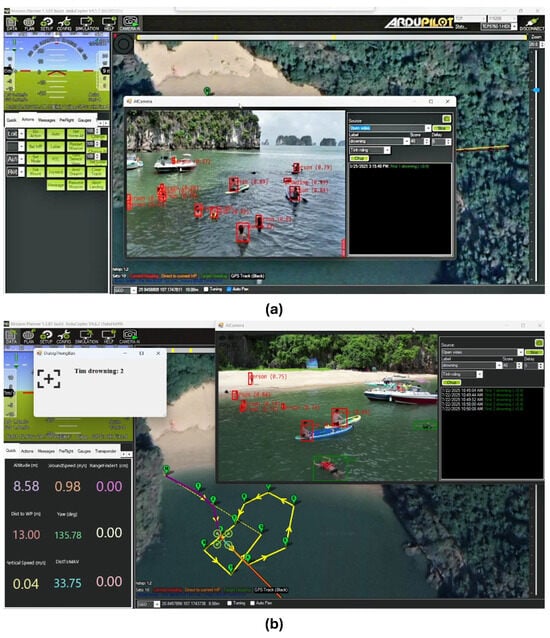
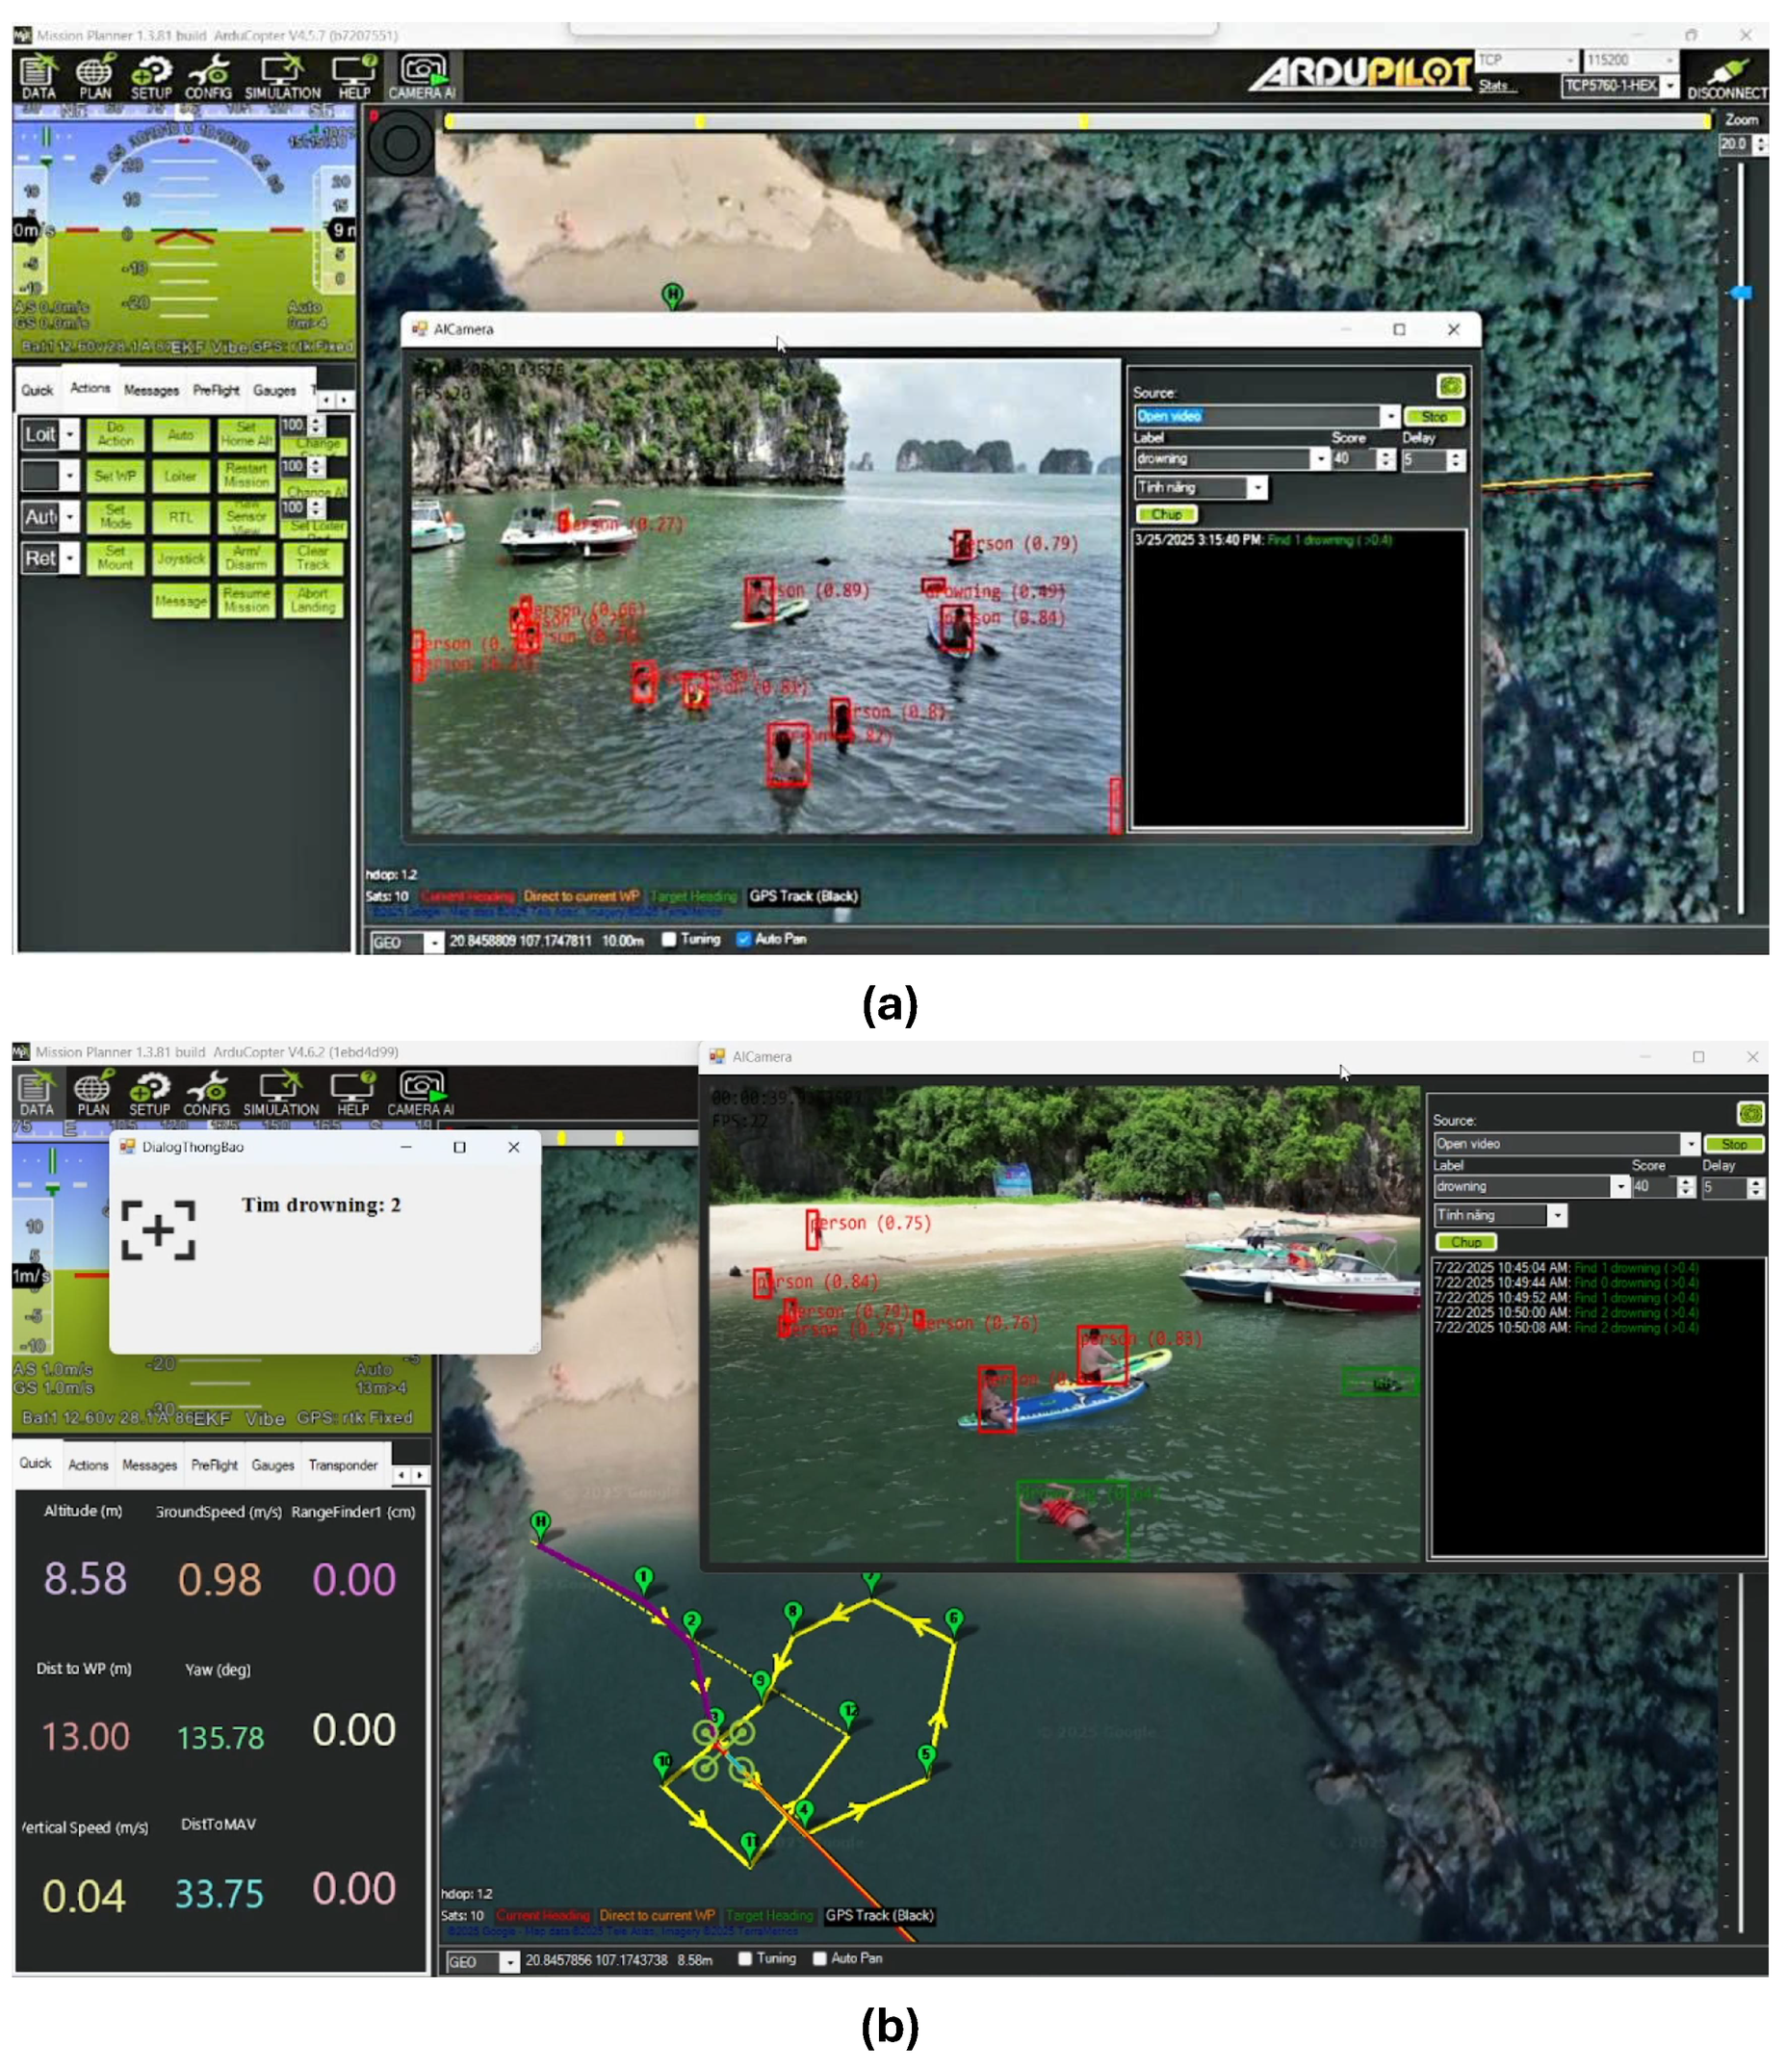
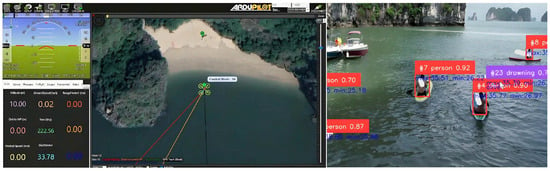
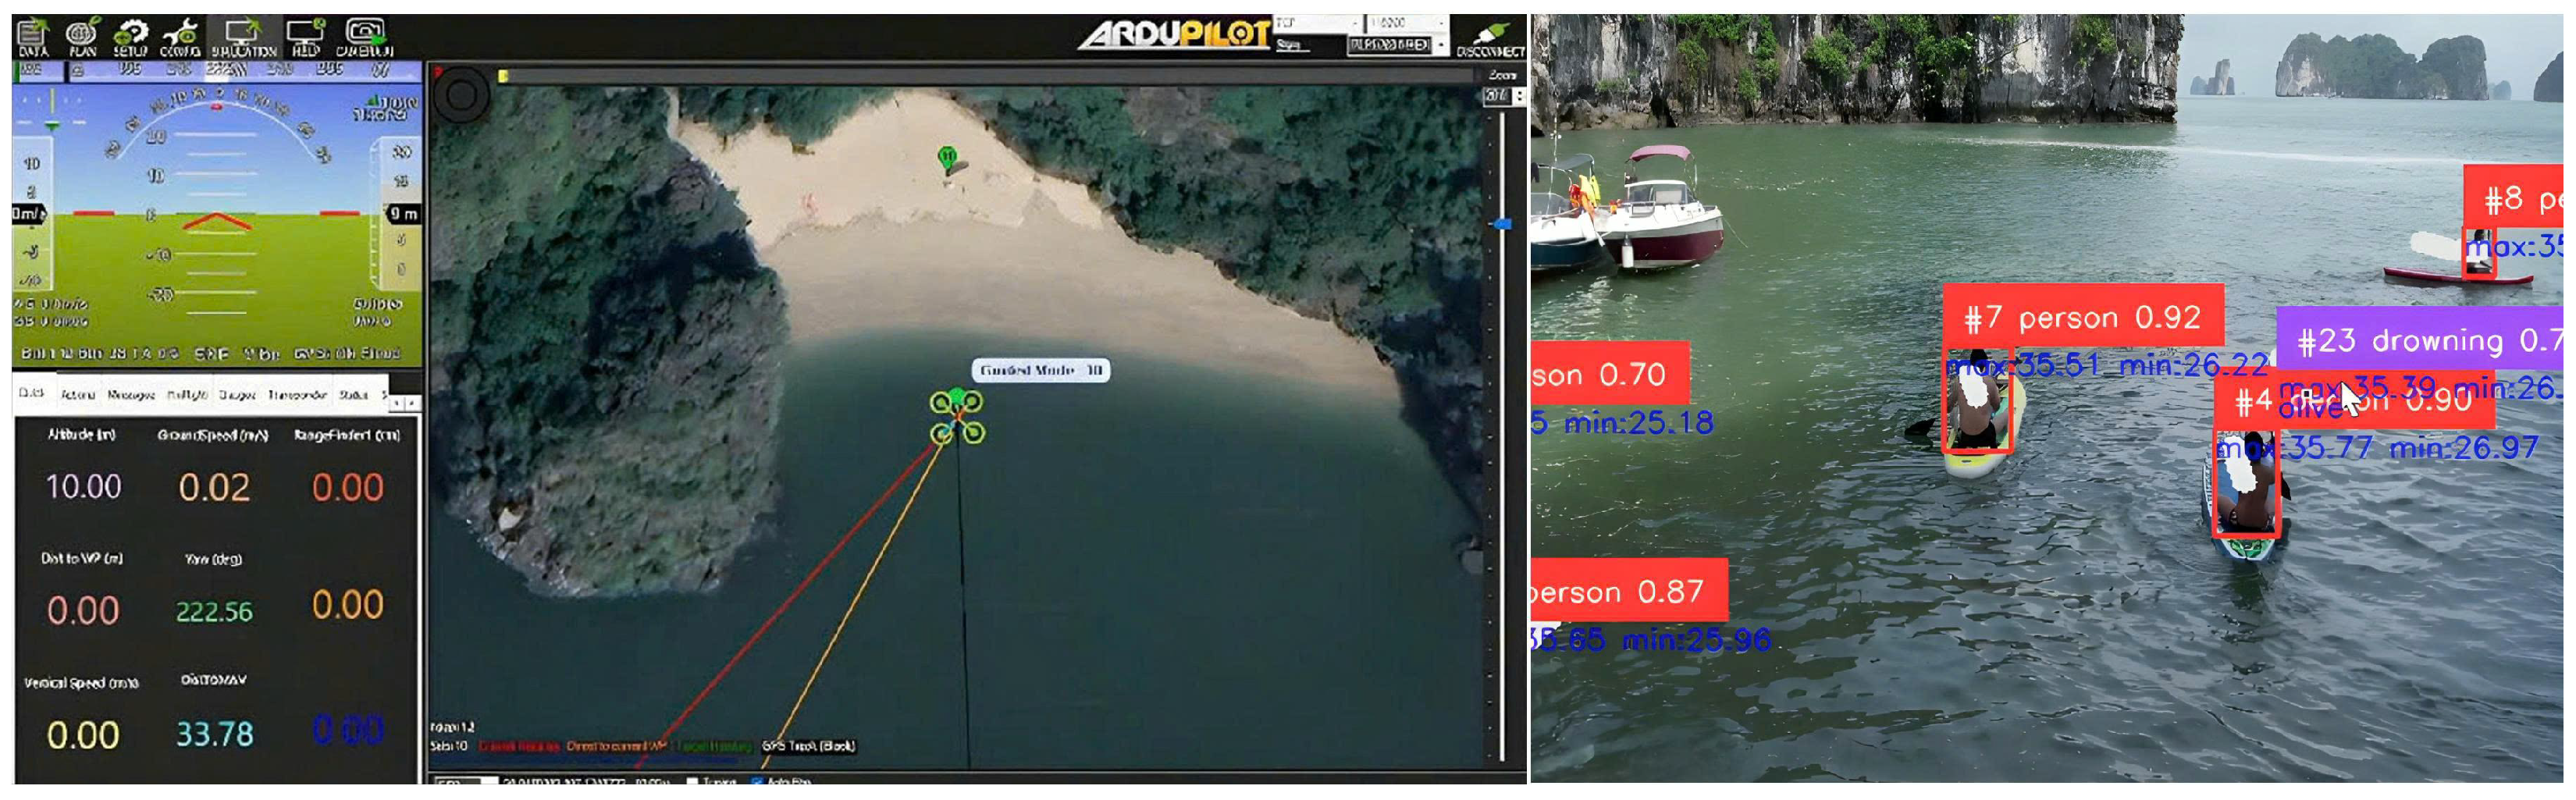
We validated the embedded pipeline in a coastal SAR scenario conducted in Quang Ninh Province, Viet Nam, using a session-disjoint route: (i) nominal search along preplanned waypoints, (ii) autonomous diversion for close inspection upon detection, and (iii) rejoin to the baseline route after resolution. Trials were run at low altitude (typically 7–20 m AGL) with moderate sea state and mixed illumination (late afternoon to dusk). The on-board stack corresponds to baseline B3 (Section 2.8): RGB detector with tiling as needed, RGB–thermal fusion, tracking-by-ID, and a 3 × 3 zoning controller streamed to Pixhawk via MAVLink. During mission-level trials, the UAV executed waypoint navigation while the onboard AI camera simultaneously detected swimmers and drowning events. Representative scenarios are shown in Figure 12, covering diverse backgrounds and subject densities.
Figure 12.
Representative mission-level trials integrating UAV waypoint navigation with real-time AI victim detection and warning. Subfigures illustrate: (a) Interface snapshot with object selection window. The result shows the object detected from the image transmitted from the UAV according to the object selection window. (b) Multiple swimmers and drowning detection and warning. The search result displays the notification window when detecting the object as a drowning victim, combined with recording the log on the right side of the AI module screen.
Figure 12 shows the results obtained during the testing process for identifying victims at sea. Figure 12a illustrates the detection result from the transmitted image, in which the detected object is a drowning victim that can be actively selected in the object selection window on the right. This module was developed and integrated into the Mission Planner software. Figure 12b presents the search results and displays a notification window upon detecting a drowning victim, together with logging information shown on the right side of the module interface.
The assumed search trajectory is visualized on the software screen as waypoints. Flight parameters are displayed on the left side of the screen, as shown in the figure. Information of interest includes altitude (up to 8.9 m), speed (up to 1.01 m/s), distance sensor value (0.00 m, indicating out-of-range operation when the UAV flies above the maximum configured sensor range), distance to the next waypoint (2 m), and yaw angle (244.32°). In addition, tilt angle, basic flight parameters, and other key status information are displayed by default on the HUB screen in the upper-left corner of Figure 12b.
3.4.1. Mission Execution and Flight States
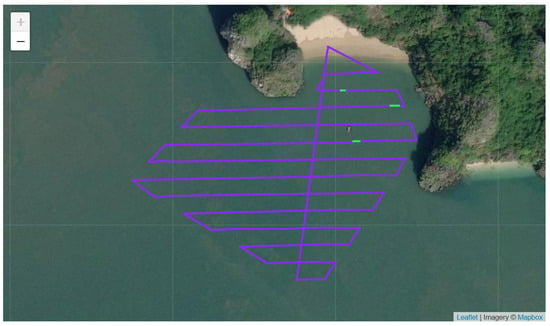
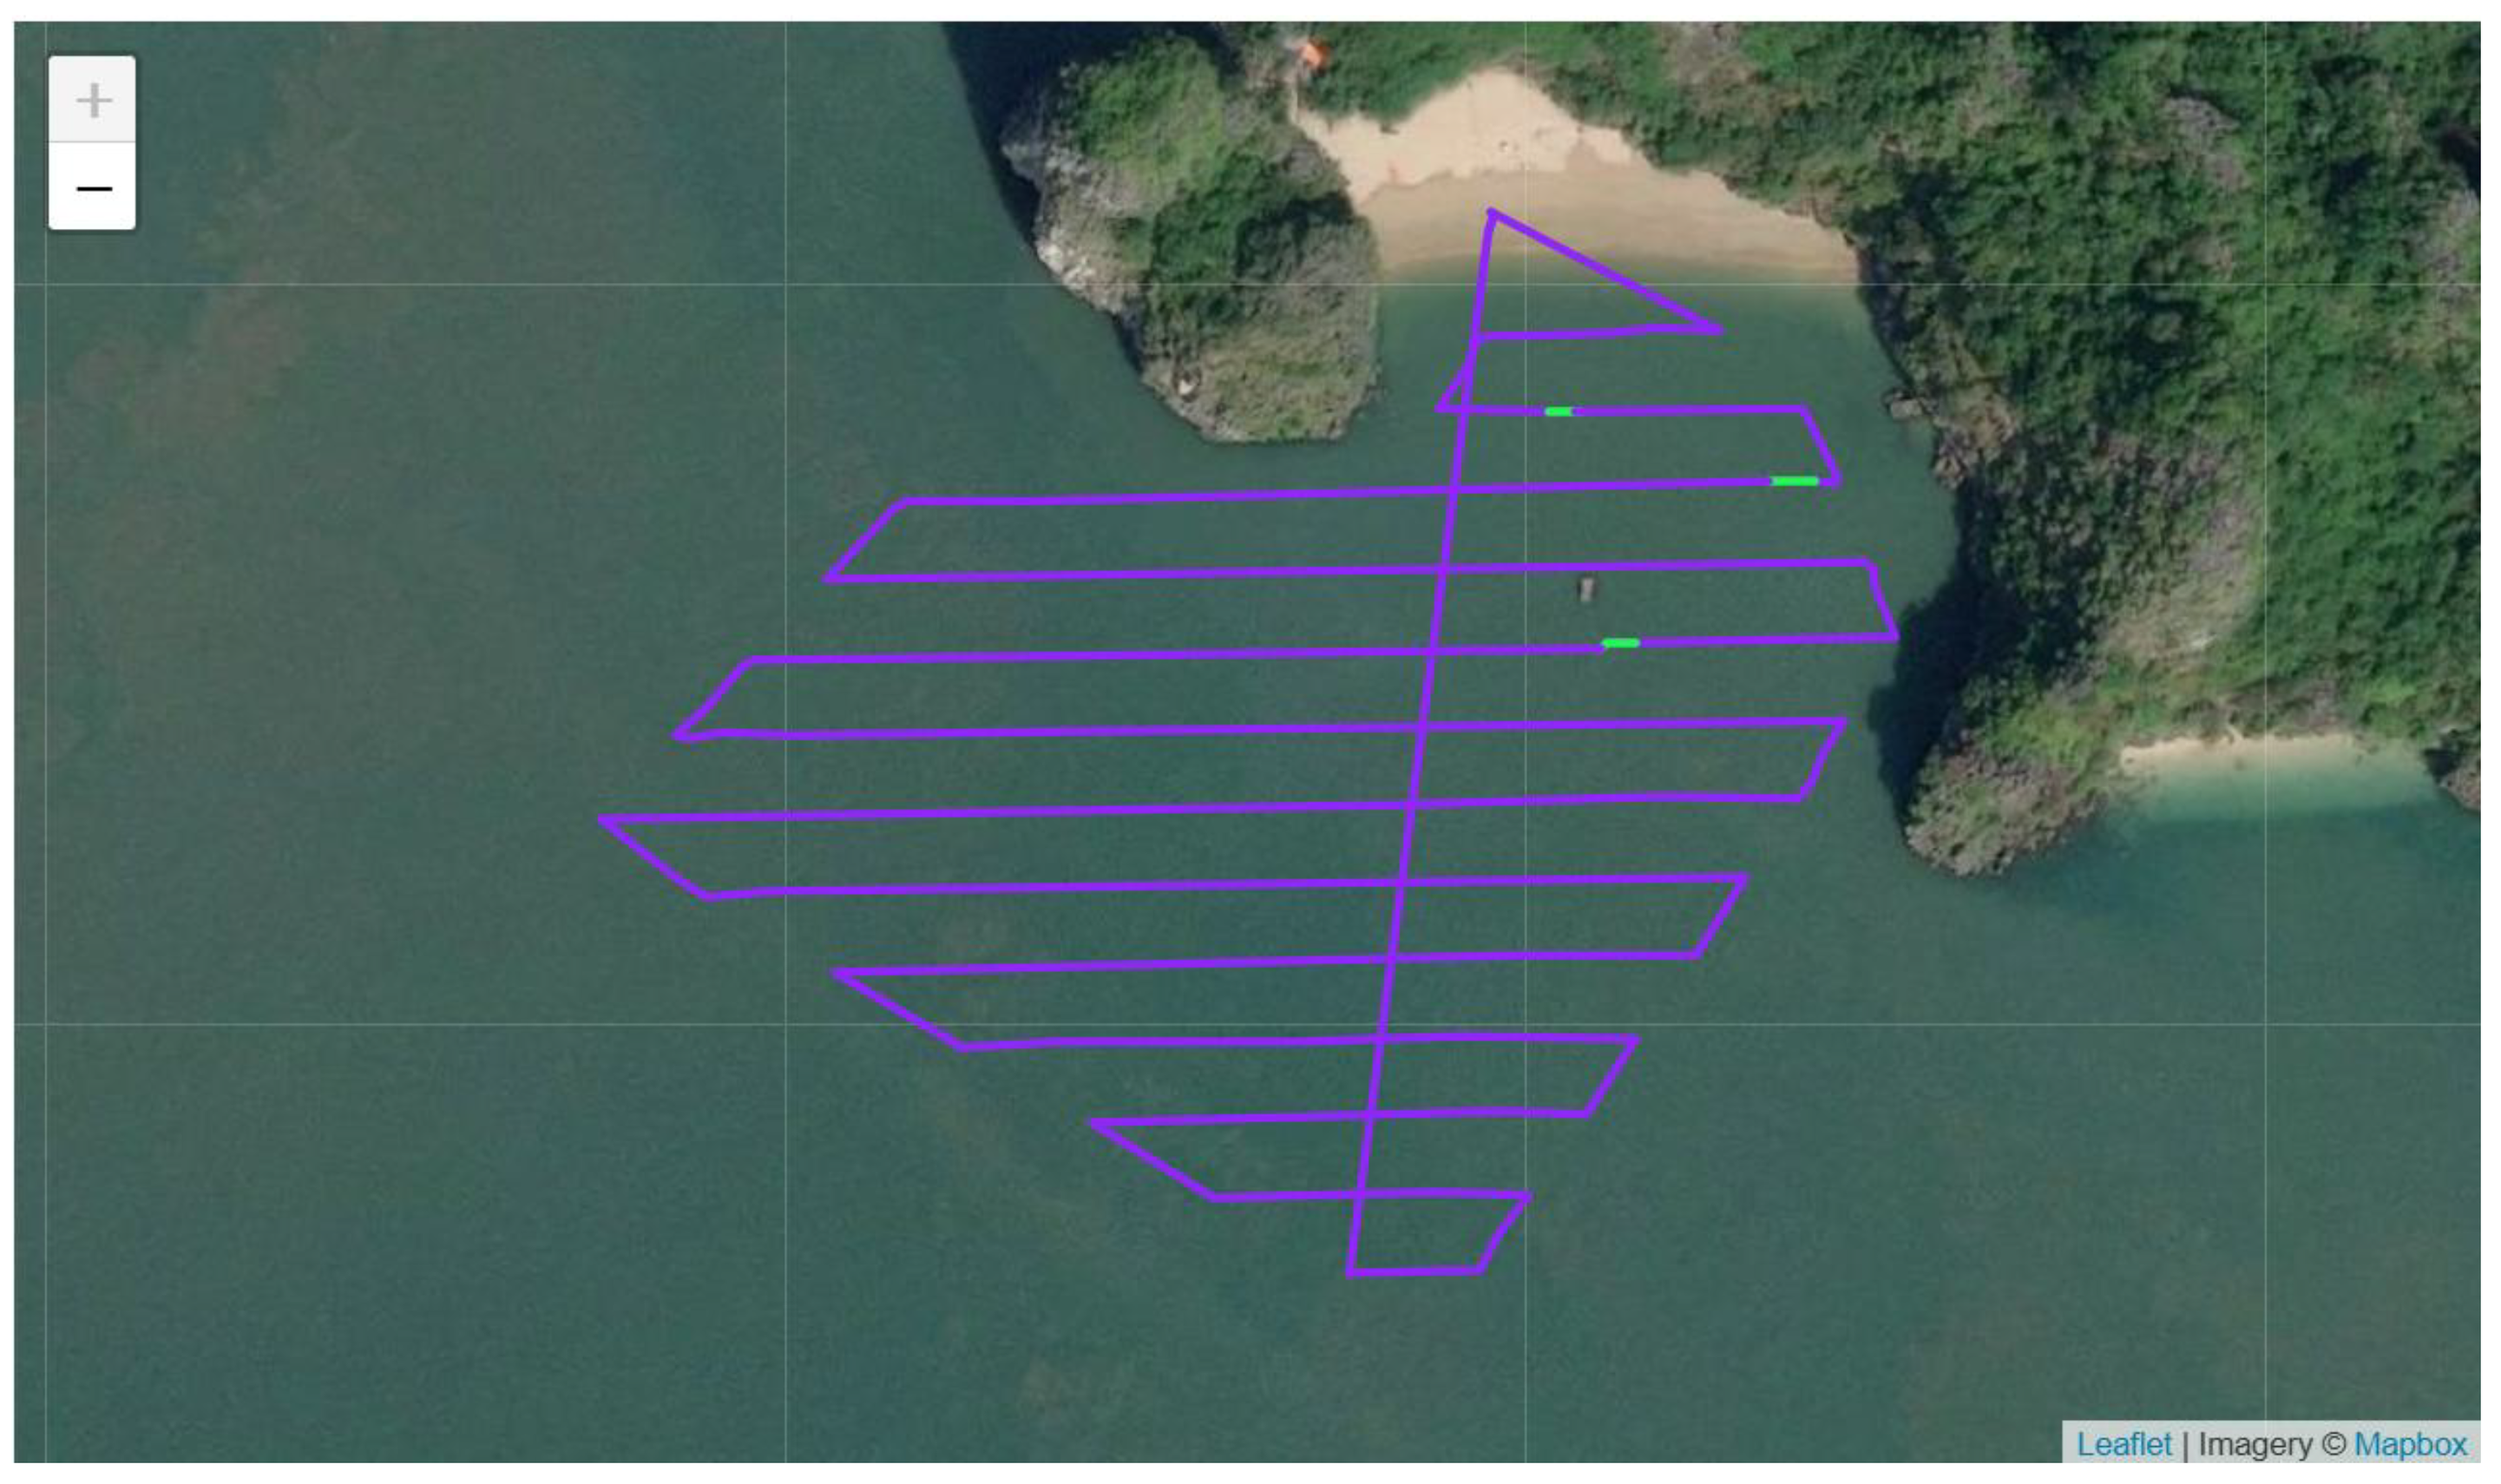
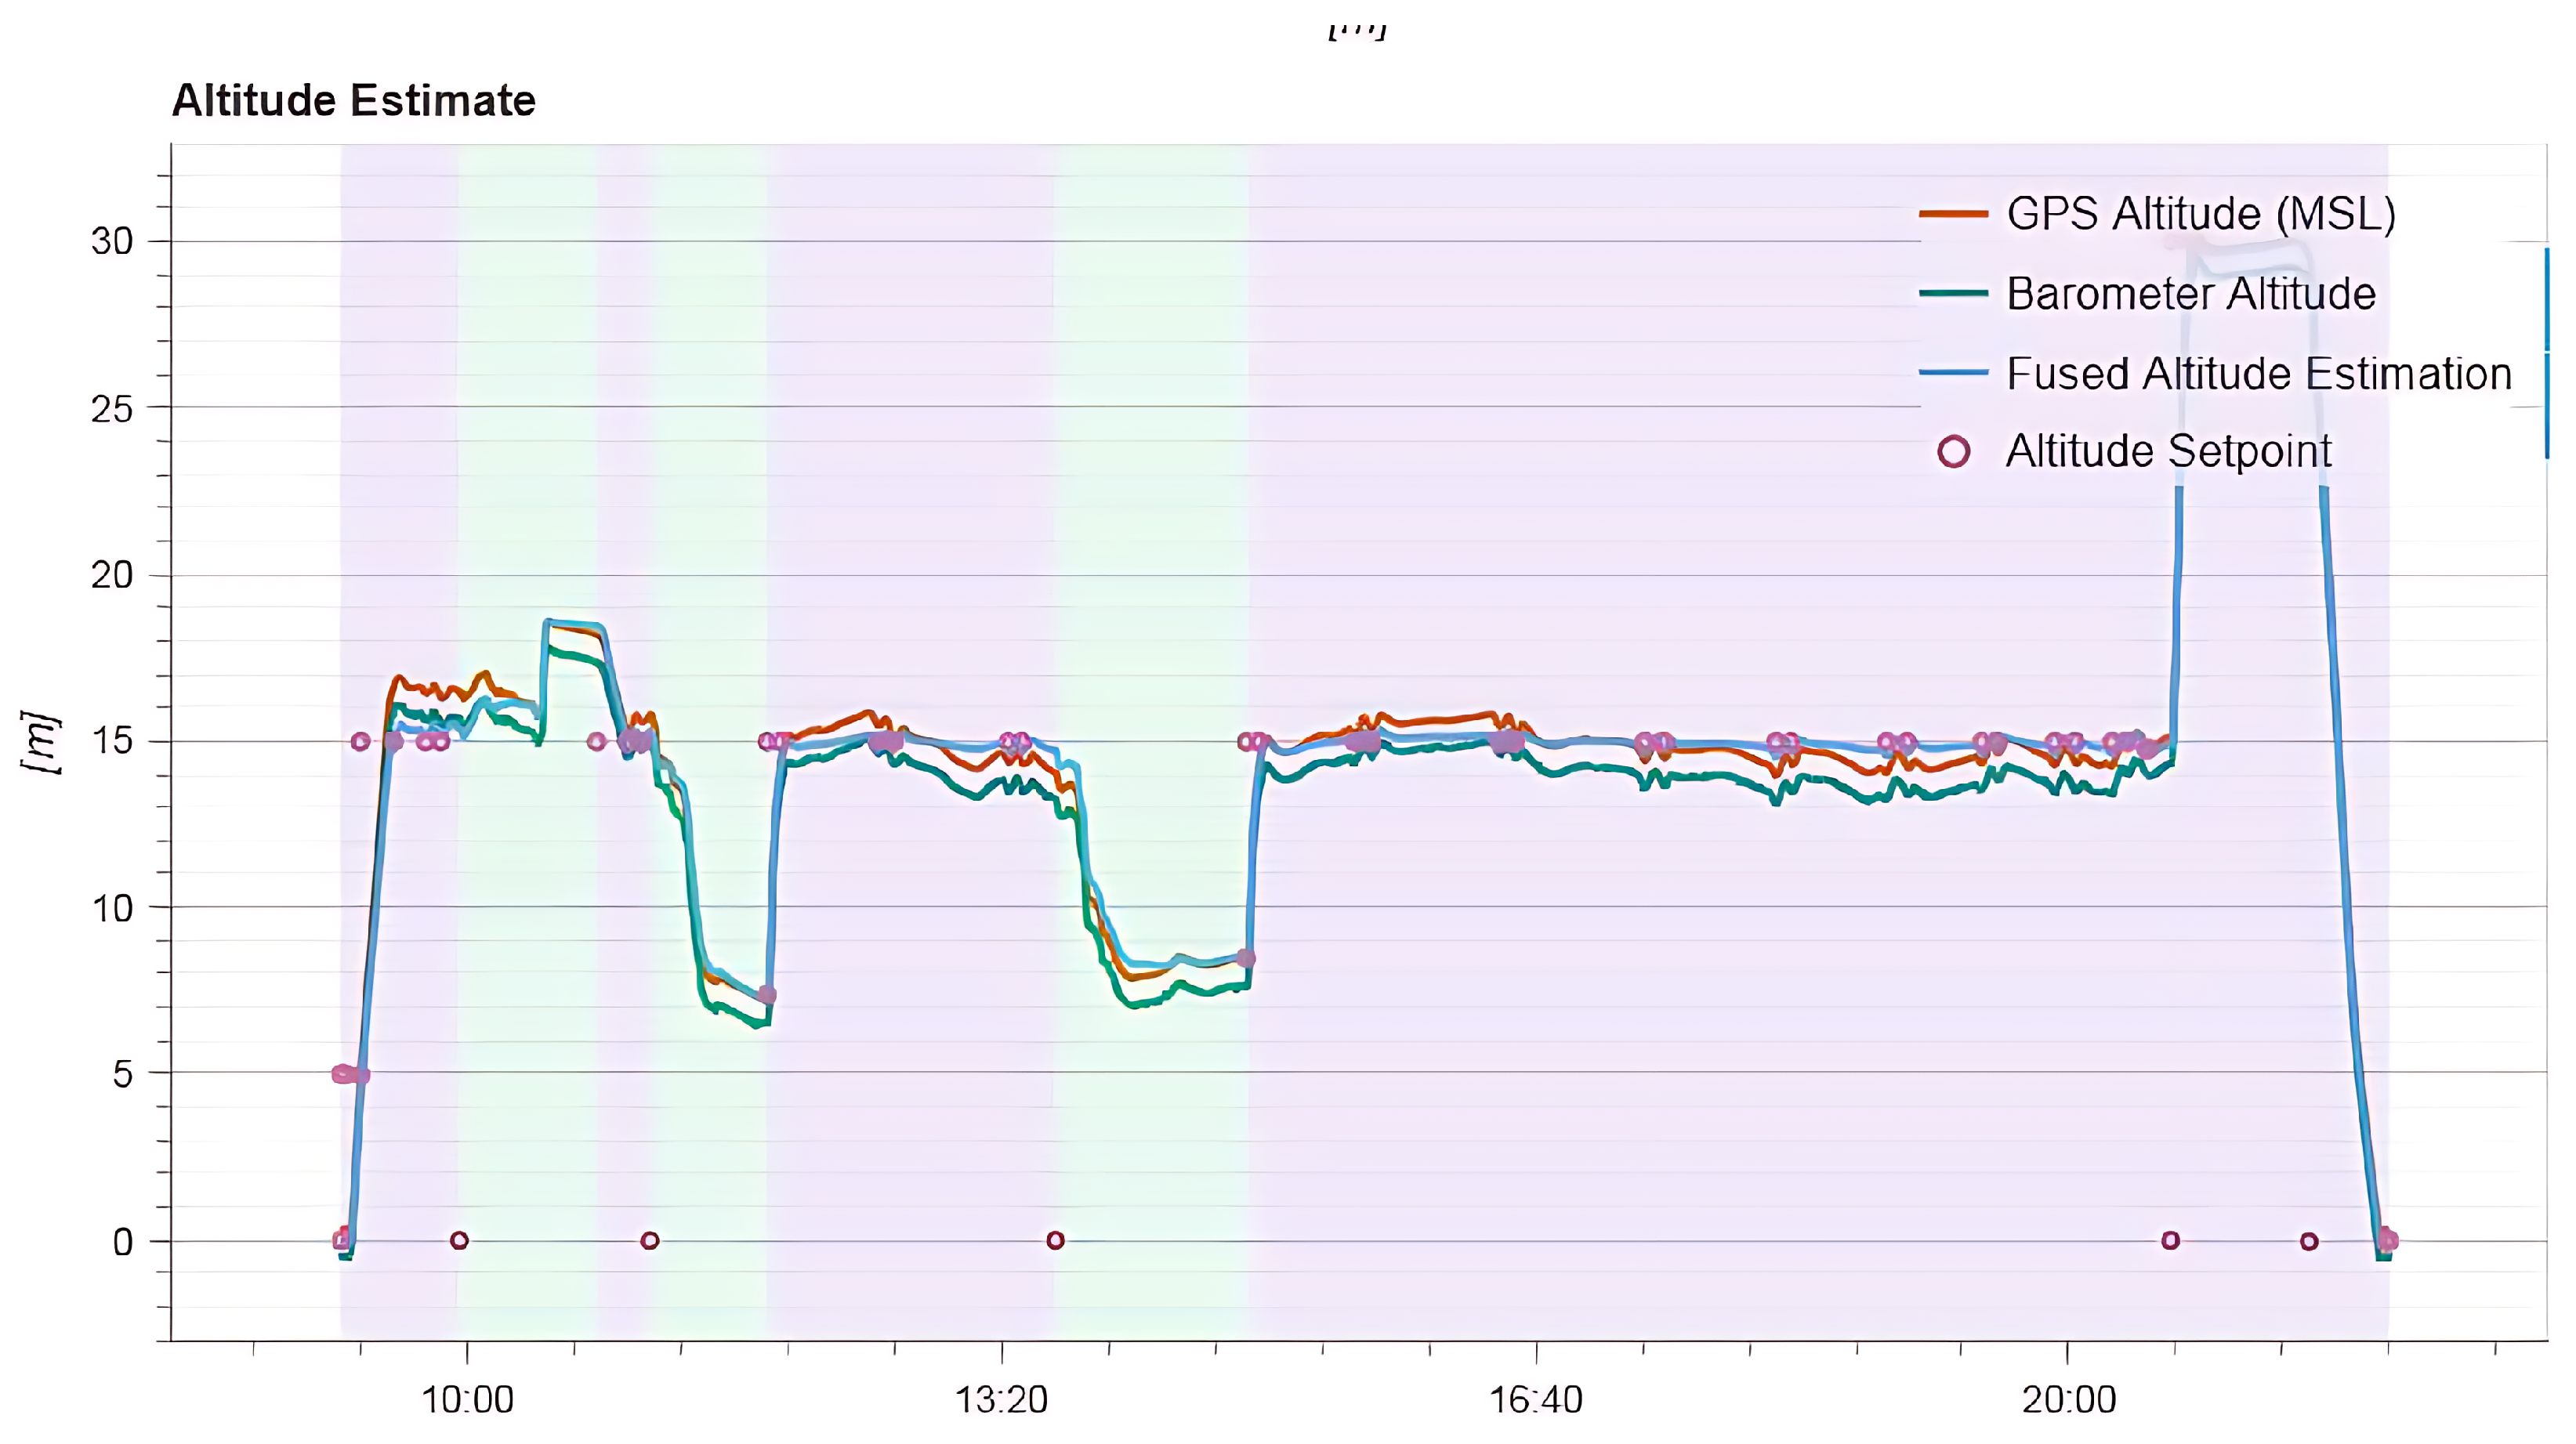
Figure 13 depicts the executed trajectory with separation and re-entry segments during rescue maneuvers, while Figure 14 shows the corresponding altitude profile. The controller followed the priority protocol (manual > emergency loiter/RTL > autonomous tracking > waypoint following), allowing smooth transitions between path following and victim-focused detours. Quantitative flight indicators derived from the on-board logfile are summarized in Table A1: nominal phases exhibit minor attitude errors (roll/pitch ), short response times (∼0.2–3.1 s), and low vibration (≤0.11 m/s2). Transient overshoot spikes during mode switches (e.g., 238–315%) were observed without loss of heading or altitude stability, consistent with step-like setpoint changes during mission state transitions.
Figure 13.
Executed SAR flight path in Quang Ninh: nominal search route with autonomous separation for inspection and re-entry to the baseline trajectory. Waypoints and geolocations were preloaded to the flight controller; deviations correspond to victim-focused detours.
Figure 14.
Altitude profile over time for the same mission. Automatic altitude adjustments occur during close-range assessments and obstacle/visibility management (green color); steady segments (purple color) correspond to nominal waypoint following.
3.4.2. Operator-in-the-Loop Selection and Tracking
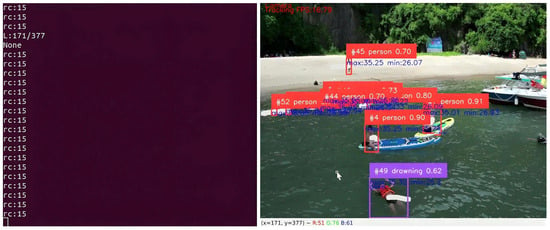
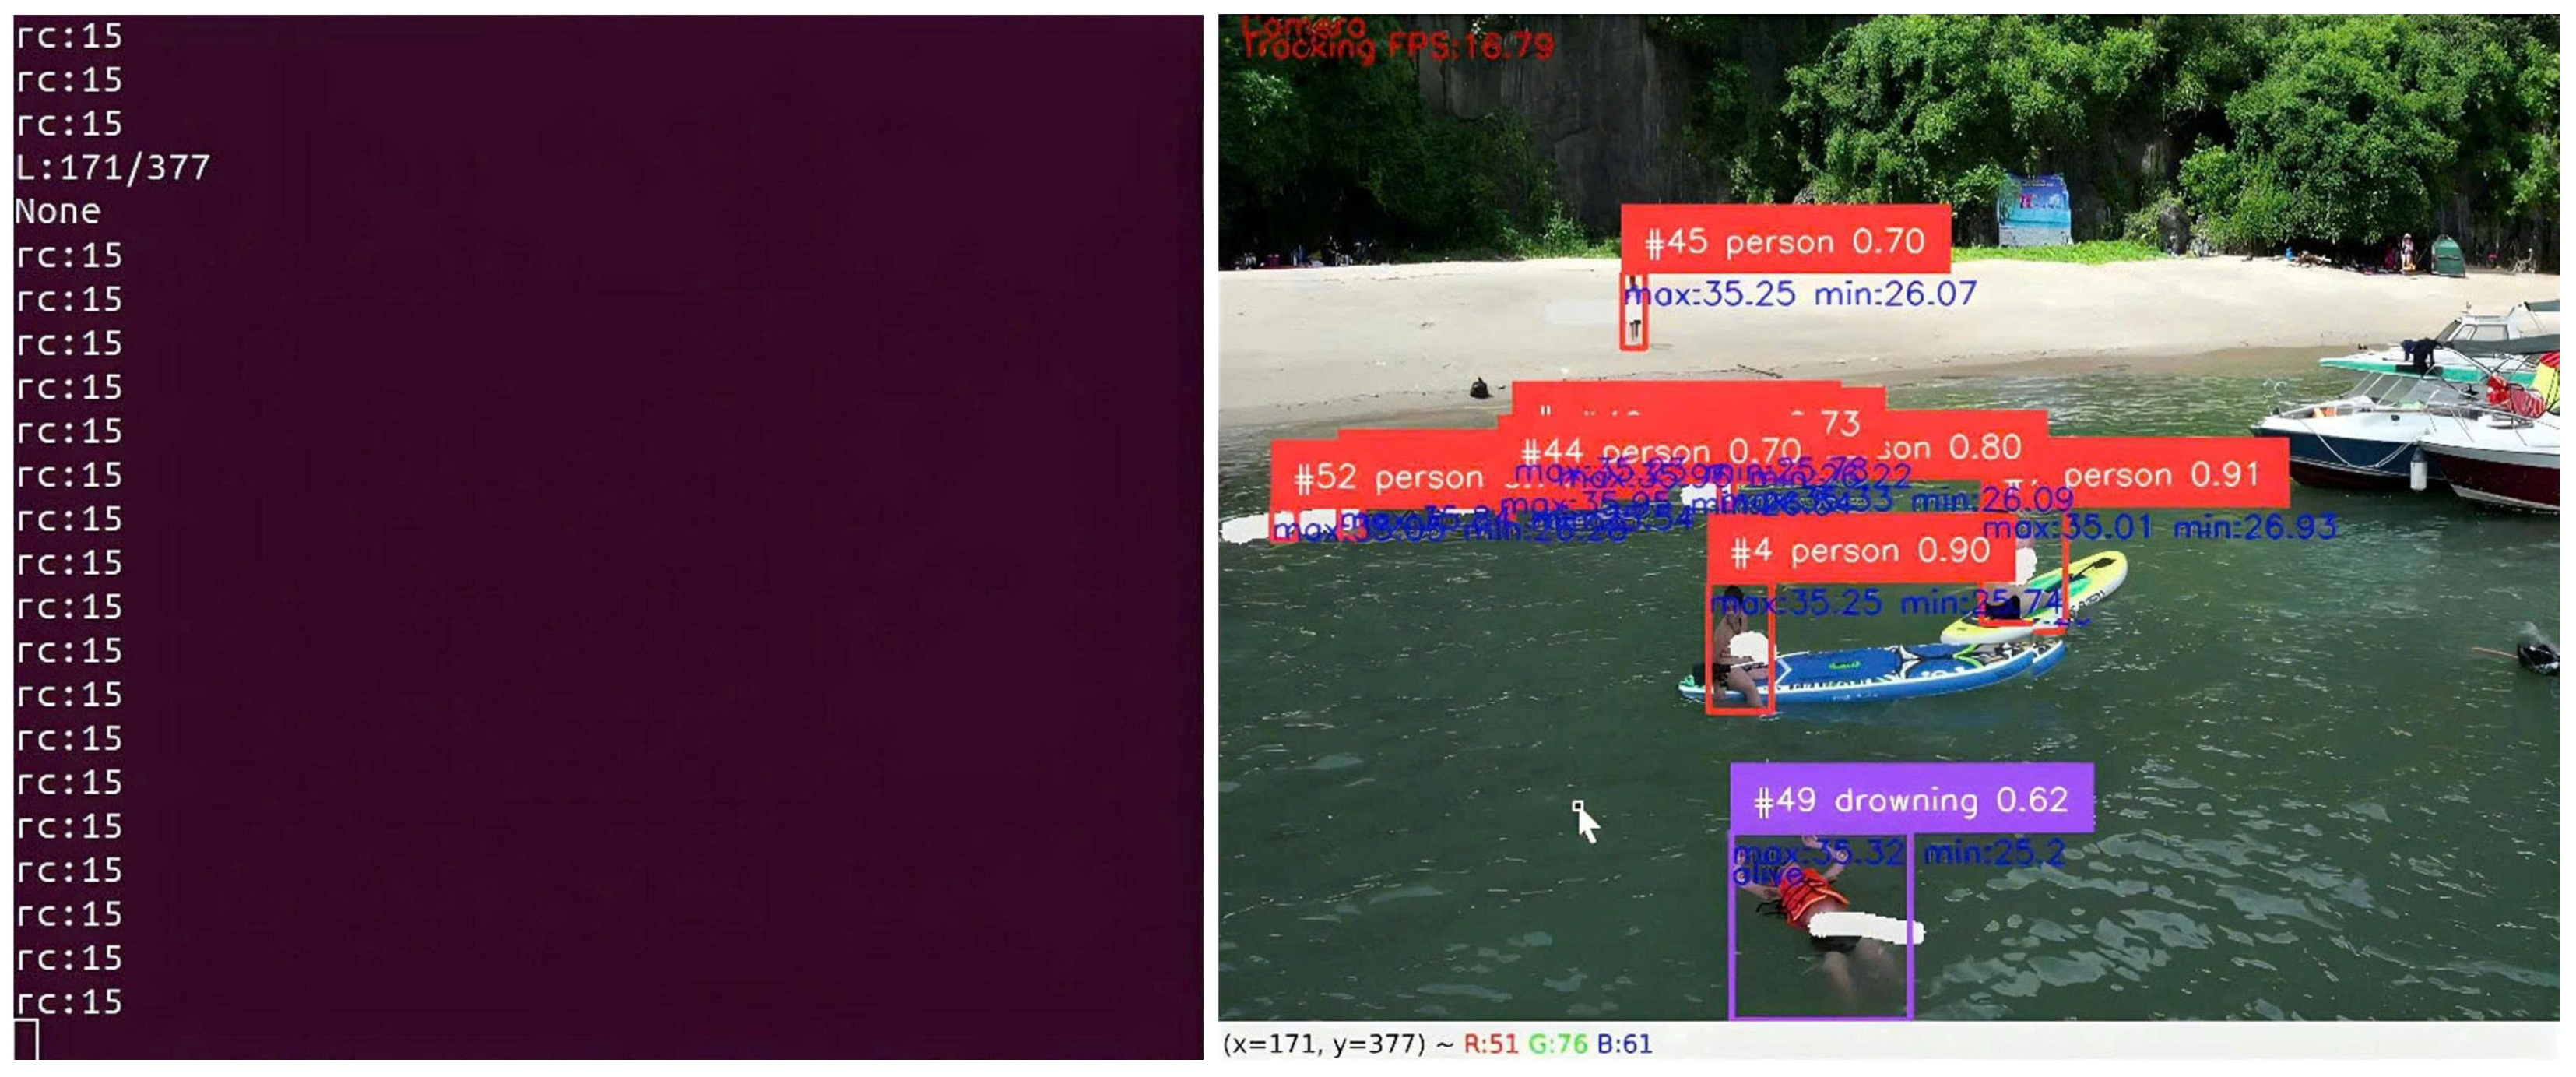
Figure 15 illustrates a representative frame with fused thermal cues and the target track history. Occasional ID switches occurred in multi-person scenes or during rapid motion, after which the operator reasserted the priority ID. When multiple candidates were present, the operator confirmed a priority target from the UI (Figure 16); single-target situations defaulted to automatic tracking. The 3 × 3 zoning controller used the target centroid to command the forward velocity and the yaw rate , resulting in rapid recentering and stable pursuit.
Figure 15.
Fused perception in the field: RGB detection with mapped thermal statistics, persistent track ID, and trajectory history. Thermal values embedded in the ROI support prioritization and live/person discrimination.
Figure 16.
Operator confirmation workflow on GCS/Jetson UI: the selected target (ID shown in the confirmation thumbnail) is locked for autonomous tracking; new candidates can be promoted as mission context evolves.
Figure 15 and Figure 16 illustrate the integrated perception-interaction workflow between the UAV and the Ground Control Station (GCS) during field SAR experiments. In Figure 15, RGB detections include calibrated thermal statistics (shown in blue), to ensure that the temperature values embedded in each ROI reflect actual surface temperatures. Drowning-risk candidates are highlighted in purple, while regular human detections are marked in red. The GCS interface allows filtering of non-essential metadata to maintain operator focus on high-priority targets. The two panels on the left provide information about the auxiliary system streamed from the UAV. The left panel shows the console output from the onboard embedded computer, mirrored for redundancy. The left panel also displays the GCS flight interface, which presents the UAV’s real-time position, heading, and flight mode.
In Figure 15, you can see the selected object and the result of the center position of the object on the image frame. From that result, the control signal is output. In Figure 16, it is the active state when connected to the flight controller. When connected, it reads the RC channel number information to know the connection status. The RC control signal is used to control the automatic flight through a separate channel. In this case, the RC8 channel is used to let the program know and not output the control signal without permission.
Figure 16 depicts the operator confirmation mechanism. Once a target is selected, its ID is locked for autonomous tracking. The drowning candidate is visualized in purple with a white trajectory trace to support situational awareness. The right-hand RC display (rc15) shows up to 16 active channels (0–15); RC8 is used for target-selection control. Operators toggle the corresponding switch without interpreting raw channel values. A reduced channel count and highlighting of the affected channel immediately indicate channel faults.
3.4.3. Task-Level Outcomes
Field outcomes by scenario are summarized in Table 5: (1) swimming person was detected earliest (50 s after takeoff) and achieved the highest correct detection rate (84%), with a long completion window (690 s) reflecting extended observation while maintaining route progress; (2) first suspected drowning triggered an alert and descent for inspection (120 s), with a 70% correct detection rate; (3) two suspected drowning victims required operator ID confirmation and showed a reduced correct detection rate (62%), attributable to inter-target confusion and partial occlusions; (4) upright/atypical posture tracking yielded the lowest rate (51%), highlighting the difficulty of low-motion or partially submerged targets typical for maritime SAR. These trends align with our offline findings: the detector is strongest on dynamic, well-resolved targets and benefits from fused thermal cues, while performance degrades with small apparent size, glare, and hypothermia-like signatures.
Table 5.
AI pipeline performance in field SAR tasks (onboard logs).
3.4.4. Throughput and Stability in the Field
With full UI, logging, fusion, tracking, and MAVLink enabled, sustained rates were 19–23 FPS, consistent with the on-board profiling in Section 3.3. The controller maintained low mean centering errors and short time-to-center under normal visibility; longer recentering events coincided with altitude changes or rapid lateral displacement during detours, as expected.
3.4.5. Failure Modes and Lessons
Specular reflections and wave cooling occasionally reduced the reliability of thermal maxima within ROIs, requiring down-weighting of thermal in the fused score. ID switches were most common in multi-person scenes when targets crossed or when long occlusions occurred near the frame boundary. Mitigations include confidence hysteresis, short-term motion priors in association, and adaptive thresholding conditioned on illumination/altitude. Expanding the dataset with additional partially submerged postures and adverse sea states is likely to improve recall of critical drowning-like behaviors.
The field/simulation trials demonstrate that the proposed embedded pipeline reliably closes the loop in real time, executes safe detours, and returns to the baseline route while maintaining controllability. Thermal integration aids prioritization but must be treated cautiously over water; the operator-in-the-loop branch resolves residual ambiguity in multi-target scenes. The observed limitations directly inform the next-stage data curation and controller tuning.
4. Discussion
This work presents an end-to-end embedded maritime SAR pipeline operating entirely onboard, integrating high-rate RGB detection, geometric RGB-to-thermal mapping, temperature-aware prioritization, tracking-by-ID, and a lightweight 3 × 3 zoning controller interfaced with a Pixhawk autopilot. Unlike many prior SAR systems that rely on offline processing or laptop-class compute, we evaluate both detection accuracy and full-loop real-time behavior under INT8 deployment on a Jetson AGX Xavier, and validate the system in a coastal field mission conducted in Quang Ninh Province. These design choices align with recent SAR literature emphasizing small-object robustness, interpretable control, and human-in-the-loop operation. We discuss the keypoints of the study below.
- Offline versus onboard performance. Offline training exhibits stable convergence and competitive mAP (Figure 6), while INT8 quantization preserves F1 and precision–recall characteristics within ≤2 pp relative to FP32 (Figure 7 and Figure 8). Onboard, the same engine achieves 41.7 FPS in inference-only benchmarks and sustains 19–23 FPS during full missions once UI rendering, logging, sensor fusion, tracking, and MAVLink communication are enabled (Section 3.3). This gap highlights the importance of reporting end-to-end loop rates rather than inference throughput alone when assessing SAR readiness. Overall, the results confirm that TensorRT INT8 provides a favorable accuracy–latency trade-off for embedded SAR, provided operating thresholds are fixed during validation to avoid deployment-time selection bias.
- Utility and limitations of thermal cues. Thermal statistics derived from RGB-derived ROIs improve victim prioritization and living/non-responsive discrimination, particularly under low-contrast or dusk conditions. However, maritime environments introduce confounding factors such as wave cooling, splashes, and specular reflections, making hard decisions based on temperature extrema unreliable. Accordingly, our late-fusion formulation (Section 2.5) treats thermal measurements as a soft feature, gated by ROI validity (Equations (5)–(10)), with operator override available in ambiguous multi-target scenes. The coarse spatial resolution of the MLX90640 (32 × 24) further necessitates careful geometric alignment and conservative margin handling.
- Multi-target prioritization and ID switching. During the search phase, when the UAV operates at high altitudes, low-resolution thermal sensors cannot reliably measure temperatures of small or distant targets. Reliable human temperature measurements are only achievable at close range (approximately 1–3 m), when the target occupies a sufficient number of pixels within the field of view. Beyond this distance, the sensor is limited to relative presence detection and lacks the accuracy required for absolute temperature estimation. Consequently, thermal information is intentionally excluded from the prioritization logic during this stage.Instead, potential targets are prioritized using RGB imagery, including posture-related visual cues indicative of hazard and tracking stability metrics (e.g., motion consistency), which are sufficient for initial target confirmation and ID management.The quantitative prioritization formula integrates detector reliability, tracking stability, and thermal statistics, with weighting determined from validated data, as described in Section 2.4. Experiments evaluating tracking stability and thermal alignment are presented in Section 2.5. Unlike traffic-monitoring scenarios, overlapping or multi-target occlusion for individual drowning victims in SAR missions is extremely rare. From the UAV’s aerial perspective, objects do not obstruct one another, and overlapping targets are effectively absent. At distances below approximately 3 m, thermal measurements are relatively reliable for quantitative assessment; beyond 3–4 m, thermal data are suitable only for hotspot detection and not for inferring survival.Once a target is selected, the UAV descends into a low-altitude hovering mode to support rescue operations. At this stage, temperature measurements become more reliable and are incorporated as an auxiliary information channel. During close-range operation, thermal signals assist in assessing the victim’s condition (e.g., distinguishing between living and non-living bodies), while posture and motion characteristics remain the primary criteria for identifying drowning victims. Owing to the limited spatial resolution of the MLX90640, reliable thermal measurements are therefore restricted to close-range hovering conditions, and thermal data are excluded from high-altitude prioritization and used only as auxiliary input during low-altitude rescue.
- Human-in-the-loop autonomy and control behavior. Operator confirmation plays a critical role in mitigating ID switches and resolving ambiguity when multiple candidates are present, consistent with established maritime SAR practice emphasizing human accountability and conservative autonomy [3]. Command arbitration (manual > loiter/RTL > autonomous tracking > waypoint following) enabled safe intervention, detours for close-range inspection, and stable re-entry to the nominal search trajectory without loss of control smoothness. Analysis of flight logs (Table A1) indicates that controller deadbands and gain scheduling preserved stable centering behavior across altitude changes and mode transitions.
- Data curation and generalization. Model generalization is ultimately constrained by data diversity. Our dataset combines in-house coastal flights with public benchmarks, such as SeaDronesSee [14], and employs session-disjoint splits to prevent leakage. Semi-automatic labeling with SAM accelerated annotation but required human verification to correct systematic mask errors. Error analysis (Section 3.4) identified adverse sea states, thermal drift at night, and rare victim poses (e.g., face-down or partially submerged) as dominant failure modes. Future dataset expansion should therefore prioritize maritime-specific phenomena such as glare, foam, and horizon clutter rather than relying on generic COCO-style augmentations.
- Calibration and RGB–thermal mapping robustness. The proposed inscribed-thermal mapping is simple and hardware-agnostic but assumes stable co-mounting and minimal boresight misalignment. In practice, gimbal motion and vibration introduce small parallax and scale errors that can destabilize thermal scoring near ROI boundaries. More robust alternatives include explicit extrinsic calibration with planar or AprilTag targets and pinhole models (e.g., Zhang’s method [28]), complemented by periodic online alignment updates via feature tracking.
- Threats to validity. Several factors may influence absolute performance: (i) Geographic scope–all flights were conducted near-shore in Quang Ninh, and different sea states or climates may affect thermal reliability; (ii) Hardware scope–results are specific to the AGX Xavier and the RGB/MLX90640 pairing; (iii) Mission structure–operator presence and predefined waypoints simplify arbitration relative to fully autonomous or multi-UAV deployments; and (iv) Metric selection–while standard detection, tracking, and latency metrics are reported, survivor-centric measures such as time-to-first-fix or area-based detection probability would further strengthen SAR relevance. These factors do not undermine the demonstrated feasibility of the proposed onboard SAR pipeline.
- Future directions. Promising extensions include temporal thermal filtering and water-surface modeling to stabilize temperature cues; small-object priors, super-resolution, and robust re-identification to reduce ID switches; and model-predictive control for tracking moving swimmers under wind and wave drift. On the data side, larger multi-site collections with standardized protocols and independent test ranges are needed, along with the targeted integration of publicly available SAR datasets [14]. Finally, deployment on newer SoCs (e.g., Orin) and exploration of quantization-aware training alongside INT8 inference could further reduce latency while preserving accuracy.
Our findings indicate that a carefully engineered late-fusion perception pipeline, combined with human-in-the-loop arbitration, can provide reliable real-time SAR assistance on embedded hardware. The remaining gaps, such as thermal ambiguity over water and detection of stationary or partially submerged victims, are addressable through improved data coverage and modest algorithmic refinements, and do not constitute fundamental barriers to safe, incremental field deployment.
5. Conclusions
This study demonstrates the feasibility and effectiveness of an autonomous UAV platform enhanced with edge AI for maritime search and rescue (SAR) operations, operating entirely onboard in real time. By integrating a quantized deep learning model on the NVIDIA Jetson AGX Xavier, the system can detect small human figures, identify drowning victims based on posture and behavior, and verify physiological state using thermal imaging data. These multimodal cues are embedded within bounding boxes to support victim prioritization, autonomous tracking, and geolocation reporting to rescue teams.
A dynamic command-priority protocol enables seamless integration between manual and autonomous modes, while real-time object tracking with operator confirmation ensures flexibility in multi-victim scenarios. The UAV can adjust its altitude and resume its original search trajectory after detours for close-range assessment, making the system well-suited to complex, evolving SAR missions.
The proposed framework was validated through a real-world-inspired field trial in Quang Ninh Province, where the UAV autonomously adapted its flight path, maintained stable tracking of prioritized targets, and operated reliably within onboard computational limits. These results confirm that integrated autonomy for maritime SAR is achievable without reliance on external computation or high-resolution sensing, provided that system design explicitly accounts for altitude-dependent observability and edge constraints. The findings highlight fundamental limitations imposed by thermal sensor resolution and viewing geometry, while also identifying concrete directions for future research, including adaptive altitude planning, confidence-aware sensor fusion, higher-resolution low-power thermal sensing, and coordinated multi-UAV operation.
Author Contributions
Conceptualization, L.N., T.B.N. and D.T.N.; methodology, L.N., T.B.N. and A.N.; resources, L.N., T.B.N. and A.N.; data curation, L.N., D.T.N., A.V.P. and T.B.N.; writing original draft preparation, L.N., A.V.P. and D.T.N.; writing review and editing, T.B.N., A.N. and A.P.; supervision, A.N. and T.B.N.; project administration, T.B.N. and A.N. All authors have read and agreed to the published version of the manuscript.
Funding
This work was funded by the Ministry of Science and Technology of Vietnam in the national project titled “Research on the design and fabrication of equipment and the development of intelligent UAV-based systems for maritime search and rescue, emergency response, and disaster management”, code: ĐTĐLCN.36/22.
Institutional Review Board Statement
Not applicable.
Informed Consent Statement
Not applicable.
Data Availability Statement
The data that support the findings of this study are available from the corresponding author upon reasonable request. Due to privacy and operational restrictions, the datasets are not publicly accessible, but may be shared for academic research purposes in compliance with institutional and ethical guidelines.
Acknowledgments
The authors would like to thank the Artificial Intelligence and Applications Laboratory (AIA Lab.), University of Transport and Communications (Vietnam) and the University of Southern Queensland (Australia) for allowing us to use devices and sensor data, and test the method at the University of Transport and Communications and Quang Ninh province areas.
Conflicts of Interest
Author Mr. Long Ngo was employed by the company Software and Service Development Department, Mobifone Digital Services, Hanoi 100000, Vietnam. The remaining authors declare that the research was conducted in the absence of any commercial or financial relationships that could be construed as a potential conflict of interest.
Correction Statement
This article has been republished with a minor correction to the Acknowledgments/Informed Consent Statement/Conflicts of Interest Statement. This change does not affect the scientific content of the article.
Abbreviations
The following abbreviations are used in this manuscript:
| AGL | Above Ground Level |
| CPU | Central Processing Unit |
| FPS | Frames Per Second |
| FP32 | 32-bit Floating Point |
| GCS | Ground Control Station |
| GPU | Graphics Processing Unit |
| INT8 | 8-bit Integer Quantization |
| IoU | Intersection over Union |
| MAVLink | Micro Air Vehicle Link (communication protocol) |
| NED | North-East-Down Co-ordinate frame |
| ONNX | Open Neural Network Exchange |
| ROI | Region of Interest |
| RTL | Return to Launch |
| SAR | Search and Rescue |
| SDK | Software Development Kit |
| TensorRT | NVIDIA Tensor Runtime |
| UAV | Unmanned Aerial Vehicle |
| YOLOv8 | You Only Look Once, version 8 (object detector) |
Appendix A
Table A1.
Control parameters and UAV state across operational phases (from real flight logs).
References
- Lyu, M.; Zhao, Y.; Huang, C.; Huang, H. Unmanned Aerial Vehicles for Search and Rescue: A Survey. Remote Sens. 2023, 15, 3266. [Google Scholar] [CrossRef] [Scilit]
- Osorio Quero, C.; Martinez-Carranza, J. Unmanned aerial systems in search and rescue: A global perspective on current challenges and future applications. Int. J. Disaster Risk Reduct. 2025, 118, 105199. [Google Scholar] [CrossRef] [Scilit]
- International Maritime Organization. Safety of Life at Sea: Annual Report. 2019. Available online: https://www.imo.org/en/OurWork/Safety/Pages/Default.aspx (accessed on 12 September 2025).
- Rattanaamporn, S.; Perera, A.; Nguyen, A.; Ngo, T.B.; Chahl, J. Drone Imaging and Sensors for Situational Awareness in Hazardous Environments: A Systematic Review. J. Sens. Actuator Netw. 2025, 14, 98. [Google Scholar] [CrossRef] [Scilit]
- Messmer, M.; Kiefer, B.; Varga, L.A.; Zell, A. UAV-Assisted Maritime Search and Rescue: A Holistic Approach. arXiv 2024, arXiv:2403.14281. [Google Scholar] [CrossRef] [Scilit]
- Erdelj, M.; Król, M.; Natalizio, E. UAV-assisted disaster management: Applications and open issues. In Proceedings of the 2016 International Conference on Computing, Networking and Communications (ICNC), Kauai, HI, USA, 15–18 February 2016. [Google Scholar] [CrossRef] [Scilit]
- Liu, L.; Ouyang, W.; Wang, X.; Fieguth, P.; Chen, J.; Liu, X.; Pietikäinen, M. Deep Learning for Generic Object Detection: A Survey. Int. J. Comput. Vis. 2020, 128, 261–318. [Google Scholar] [CrossRef] [Scilit]
- Redmon, J.; Divvala, S.; Girshick, R.; Farhadi, A. You Only Look Once: Unified, Real-Time Object Detection. In Proceedings of the IEEE Conference on Computer Vision and Pattern Recognition (CVPR), Las Vegas, NV, USA, 26 June–1 July 2016; pp. 779–788. [Google Scholar] [CrossRef] [Scilit]
- Ren, S.; He, K.; Girshick, R.; Sun, J. Faster R-CNN: Towards Real-Time Object Detection with Region Proposal Networks. IEEE Trans. Pattern Anal. Mach. Intell. 2017, 39, 1137–1149. [Google Scholar] [CrossRef] [Scilit] [PubMed]
- Cruz Ulloa, C.; Orbea, D.; del Cerro, J.; Barrientos, A. Thermal, multispectral, and RGB vision systems analysis for victim detection in SAR robotics. J. Appl. Sci. 2024, 14, 766. [Google Scholar] [CrossRef] [Scilit]
- Zhao, C.; Bao, M.; Liang, J.; Liang, M.; Liu, R.W.; Pang, G. Multi-sensor fusion-driven surface vessel identification and tracking using unmanned aerial vehicles for maritime surveillance. IEEE Tran. Cons. Elec. 2025, 71, 6280–6293. [Google Scholar] [CrossRef] [Scilit]
- Biswas, A.; Karnan, H.; Dhulipala, P.V.; Dufek, J.; Murphy, R. Visual Servoing of Unmanned Surface Vehicle from Small Tethered Unmanned Aerial Vehicle. arXiv 2017, arXiv:1710.02932. [Google Scholar] [CrossRef] [Scilit]
- Khan Mohammadi, M.; Schneidereit, T.; Mansouri Yarahmadi, A.; Breuß, M. Investigating training datasets of real and synthetic images for outdoor swimmer localisation with YOLO. AI 2024, 5, 576–593. [Google Scholar] [CrossRef] [Scilit]
- SeaDronesSee Dataset. Maritime Search and Rescue AI Dataset. 2024. Available online: https://seadronessee.cs.uni-tuebingen.de/dataset (accessed on 22 July 2025).
- He, K.; Gkioxari, G.; Dollár, P.; Girshick, R. Mask R-CNN. In Proceedings of the IEEE International Conference on Computer Vision (ICCV), Venice, Italy, 22–29 October 2017; pp. 2980–2988. [Google Scholar] [CrossRef] [Scilit]
- Lin, T.Y.; Goyal, P.; Girshick, R.; He, K.; Dollár, P. Focal Loss for Dense Object Detection. In Proceedings of the IEEE International Conference on Computer Vision (ICCV), Venice, Italy, 22–29 October 2017; pp. 2999–3007. [Google Scholar] [CrossRef] [Scilit]
- Fu, Z.; Xiao, Y.; Tao, F.; Si, P.; Zhu, L. DLSW-YOLOv8n: A Novel Small Maritime Search and Rescue Object Detection Framework for UAV Images with Deformable Large Kernel Net. Drones 2024, 8, 310. [Google Scholar] [CrossRef] [Scilit]
- Weng, A.; Wang, H.; Wang, J.; Xu, C.; Zhang, E. YOLO-SRMX: A Lightweight Real-time Detector for Real-Time Object Detection on Unmanned Aerial Vehicles. Remote Sens. 2025, 17, 2313. [Google Scholar] [CrossRef] [Scilit]
- Anastasiou, A.; Papaioannou, S.; Kolios, P.; Panayiotou, C.G. Model Predictive Control for Multiple Castaway Tracking with an Autonomous Aerial Agent. arXiv 2024, arXiv:2409.13305. [Google Scholar]
- Jocher, G. YOLOv8: Ultralytics Official Documentation. 2023. Available online: https://github.com/ultralytics/ultralytics (accessed on 12 September 2025).
- Lin, T.Y.; Maire, M.; Belongie, S.; Hays, J.; Perona, P.; Ramanan, D.; Dollár, P.; Zitnick, C.L. Microsoft COCO: Common Objects in Context. In Proceedings of the European Conference on Computer Vision (ECCV), Zurich, Switzerland, 6–12 September 2014; Springer: Cham, Switzerland, 2014; pp. 740–755. [Google Scholar] [CrossRef] [Scilit]
- Kirillov, A.; Mintun, E.; Ravi, N.; Mao, H.; Rolland, C.; Gustafson, L.; Xiao, T.; Whitehead, S.; Berg, A.C.; Lo, W.-Y.; et al. Segment Anything. arXiv 2023, arXiv:2304.02643. [Google Scholar] [PubMed]
- CVAT Contributors. Computer Vision Annotation Tool (CVAT). 2020. Available online: https://github.com/opencv/cvat (accessed on 12 September 2025).
- Buslaev, A.; Iglovikov, V.I.; Khvedchenya, E.; Parinov, A.; Druzhinin, M.; Kalinin, A.A. Albumentations: Fast and Flexible Image Augmentations. Information 2020, 11, 125. [Google Scholar] [CrossRef] [Scilit]
- Akyon, F.C.; Altinuc, S.O.; Temizel, A. Slicing Aided Hyper Inference for Small Object Detection. arXiv 2022, arXiv:2209.08729. [Google Scholar]
- NVIDIA Corporation. TensorRT Developer Guide. 2024. Available online: https://docs.nvidia.com/deeplearning/tensorrt/archives/tensorrt-861/developer-guide/index.html (accessed on 12 September 2025).
- Melexis. MLX90640 32 × 24 IR Array: Datasheet. 2018. Available online: https://www.melexis.com/en/documents/documentation/datasheets/datasheet-mlx90640 (accessed on 12 September 2025).
- Zhang, Z. A Flexible New Technique for Camera Calibration. IEEE Trans. Pattern Anal. Mach. Intell. 2000, 22, 1330–1334. [Google Scholar] [CrossRef] [Scilit]
- MAVLink Project. Offboard Control Interface. 2024. Available online: https://mavlink.io/en/services/offboard_control.html (accessed on 12 September 2025).
- ArduPilot Dev Team. Copter Commands in Guided Mode. 2024. Available online: https://ardupilot.org/dev/docs/copter-commands-in-guided-mode.html (accessed on 12 September 2025).

Disclaimer/Publisher’s Note: The statements, opinions and data contained in all publications are solely those of the individual author(s) and contributor(s) and not of MDPI and/or the editor(s). MDPI and/or the editor(s) disclaim responsibility for any injury to people or property resulting from any ideas, methods, instructions or products referred to in the content. |
© 2026 by the authors. Licensee MDPI, Basel, Switzerland. This article is an open access article distributed under the terms and conditions of the Creative Commons Attribution (CC BY) license.