


Highlights
What are the main findings?
- The MMLF late-fusion framework achieves significant, simultaneous performance gains for multi-class (Car, Pedestrian, Cyclist) object detection.
- Integrating uncertainty estimation directly into the fusion process substantially reduces predictive uncertainty, providing a clear, quantifiable measure of detection reliability.
What are the implications of the main findings?
- This work provides a practical and flexible fusion paradigm that enhances perception system performance without requiring architectural changes to existing, well-optimized 2D and 3D detectors.
- The model’s built-in uncertainty quantification makes multi-modal object detection more transparent and trustworthy, enhancing safety for autonomous driving applications.
Abstract
The advancement of autonomous driving technologies necessitates the development of sophisticated object detection systems capable of integrating heterogeneous sensor data to overcome the inherent limitations of unimodal approaches. While multi-modal fusion strategies offer promising solutions, they confront significant challenges such as data alignment complexities in early fusion and computational burdens coupled with overfitting risks in deep fusion methodologies. To address these issues, we propose a Multi-modal Multi-class Late Fusion (MMLF) framework that operates at the decision level. This late-fusion strategy preserves the architectural integrity of individual detectors and facilitates the flexible integration of diverse modalities. A key innovation of our approach is the incorporation of an evidence-theoretic uncertainty quantification mechanism, based on Dempster-Shafer theory, which provides a mathematically grounded confidence measure. Comprehensive offline evaluations on the KITTI benchmark dataset demonstrate the effectiveness of our framework, showing substantial performance improvements across multiple metrics (including 2D detection, 3D detection, and bird’s-eye view tasks) while simultaneously achieving significant reductions in uncertainty estimates—by approximately 77% for cars, 76% for pedestrians, and 67% for cyclists. These results collectively enhance both the reliability and interpretability of object detection outcomes. This work provides a versatile and scalable solution for multi-modal object detection that effectively addresses critical challenges in autonomous driving applications.
1. Introduction
Autonomous driving systems represent one of the most transformative technological developments of the past decade, with object detection serving as a fundamental component for environmental perception and navigation decision-making [1]. The operational demands of these systems require exceptionally robust and accurate detection capabilities across diverse and dynamic real-world scenarios. Traditional unimodal approaches, which predominantly rely on either visual data from cameras or point cloud information from LiDAR sensors, frequently encounter limitations due to their inherent sensor-specific constraints [2]. Cameras provide rich texture and color information but suffer from sensitivity to lighting conditions and limited depth perception, while LiDAR offers precise spatial measurements but lacks semantic context and struggles with adverse weather conditions [3]. Recently, a new paradigm for end-to-end autonomous driving, based on Vision-Language-Action (VLA) models, has emerged. Frameworks such as FSDrive proposed by [4] establish a unified visual reasoning pipeline, effectively bridging the modality gap between perception and planning inherent in traditional methods. This paradigm necessitates not only precise understanding of the current environment but also emphasizes the ability to predict physically plausible, fine-grained future scenes, thereby imposing more stringent demands for highly accurate scene perception and object detection.
The integration of complementary sensor modalities through multi-modal fusion has emerged as a promising paradigm to overcome these individual limitations. Multi-modal approaches leverage the synergistic advantages of heterogeneous sensors to achieve enhanced detection accuracy, improved robustness to environmental variations, and increased operational reliability [5]. However, the implementation of effective fusion strategies presents considerable challenges. Early fusion techniques, which combine raw sensor data at the input level, require precise spatial and temporal alignment while being vulnerable to sensor-specific noise characteristics [6]. Deep fusion methods, operating at the feature level within neural network architectures, often introduce substantial computational overhead and face challenges related to overfitting and model complexity [7]. Meanwhile, traditional late-fusion approaches, such as confidence-weighted fusion method [8] operates on a per-class basis and are inherently limited to single-category detection. This rigidity makes them unable to adapt to the complex, multi-class detection scenarios demanded by modern autonomous systems.
Beyond the fundamental challenges of multi-modal integration, the critical nature of autonomous driving applications demands rigorous uncertainty quantification to ensure operational safety. Conventional detection systems typically provide point estimates without conveying the reliability or confidence of these predictions [9]. This limitation becomes particularly concerning in safety-critical scenarios where understanding prediction uncertainty is essential for risk assessment and fallback strategy implementation [10]. Recent advancements in uncertainty-aware deep learning have highlighted the importance of quantifying both epistemic (model) and aleatoric (data) uncertainty to enhance the trustworthiness of automated systems [11].
The field has evolved beyond merely establishing the importance of uncertainty quantification. Current research is actively pursuing more sophisticated, efficient, and deeply integrated approaches. For instance, novel frameworks for trajectory prediction demonstrate that both aleatoric and epistemic uncertainties can be efficiently quantified through a single forward pass, significantly improving computational efficiency for resource-constrained platforms [12]. Furthermore, advances in cross-modal representation learning, such as hierarchical and monotonicity-aware alignment, underscore the ongoing effort to achieve more robust and semantically consistent fusion [13]. These works exemplify the field’s progression toward methods that are not only accurate but also computationally practical and semantically grounded.
Despite these advancements, a distinct gap persists. Many existing multi-modal fusion frameworks still treat uncertainty estimation as a separate or post-hoc module, rather than an integral component that actively guides the adaptive fusion process itself. There is a pronounced need for a unified framework that tightly couples dynamic, context-aware sensor fusion with real-time, interpretable uncertainty quantification—without incurring prohibitive computational cost. This work aims to address this gap by proposing a Multi-modal Multi-class Late Fusion (MMLF) framework that integrates evidence-theoretic uncertainty quantification within a flexible fusion architecture. Our approach makes several significant contributions:
- The proposal of a flexible late fusion architecture designed for multi-class detection scenarios. The proposed MMLF framework integrates various 2D and 3D detectors in a plug-and-play manner, preserving their original structures while enabling effective cross-modal fusion.
- The systematic integration of evidential deep learning for uncertainty-aware fusion. We leverage Dempster-Shafer theory and subjective logic to explicitly model and quantify classification uncertainty, moving beyond traditional softmax outputs to provide trustworthy confidence scores for autonomous driving.
- Extensive validation on the KITTI benchmark. We demonstrate that our framework achieves substantial performance gains in 2D, 3D, and BEV detection tasks while simultaneously reducing prediction uncertainty across all object categories.
The remainder of this paper is organized as follows: Section 2 provides a review of related work in multi-modal fusion and uncertainty estimation. Section 3 details the theoretical foundation and architectural design of our proposed framework. Section 4 presents experimental setup, results, and comparative analysis. Section 5 discusses implications, limitations, and future research directions, followed by concluding remarks in Section 6.
2. Related Work
2.1. Multi-Modal Fusion Strategies
The evolution of multi-modal fusion methodologies has progressed through several distinct paradigms, each addressing specific challenges in sensor data integration. The fundamental objective of multi-modal fusion is to combine information from diverse sensors to achieve performance superior to any single modality alone [5]. This integration can occur at various levels of abstraction, leading to the categorization of fusion approaches into early, deep, and late fusion strategies.
2.1.1. Early Fusion
Early fusion approaches, also referred to as data-level fusion, operate directly on raw sensor measurements before feature extraction. These methods aim to create a unified representation of the input data that captures complementary information from multiple sources. Vora et al. [6] proposed PointPainting, which projects LiDAR points onto semantic segmentation maps derived from images, augmenting each point with corresponding class probabilities. This approach demonstrated significant improvements in 3D object detection by leveraging the semantic richness of images and the spatial precision of LiDAR. Similarly, Wen et al. [14] introduced a point feature fusion module that extracts features from RGB images and fuses them with corresponding point cloud data without relying on complex backbone networks.
Despite their potential benefits, early fusion methods face substantial challenges. They require meticulous calibration and synchronization between sensors to ensure accurate spatial alignment. The fusion of raw data also makes these approaches susceptible to propagating sensor-specific noise and artifacts through the processing pipeline. Furthermore, early fusion architectures often lack flexibility, as they are typically designed for specific sensor configurations and may not generalize well to new modalities or changing operational conditions. However, late fusion mitigates these issues by processing sensor data independently and integrating information at the decision level, thereby eliminating the need for precise spatiotemporal alignment, preventing cross-sensor noise propagation, and improving adaptability to diverse modalities and dynamic conditions.
2.1.2. Deep Fusion
Deep fusion techniques emerged to address limitations of early fusion by operating at the intermediate feature levels within neural network architectures. These methods learn to combine abstract representations extracted from different modalities, potentially capturing more complex interactions and dependencies. Among recent advancements, FusionFormer [15] represents a notable example in this category, employing transformer architectures to fuse features from diverse views for accurate 3D pose estimation. The attention mechanisms in transformers enable the model to dynamically weight the importance of different features and modalities based on the context. Similarly, Zhao et al. [16] proposed SimpleBEV, a LiDAR-camera fusion framework that enhances the individual camera and LiDAR encoders. Their approach incorporates depth rectification using LiDAR cues and an auxiliary camera-only detection branch during training.
However, deep fusion approaches introduce their own set of challenges. The integration of features from multiple modalities often requires significant architectural modifications and additional parameters, leading to increased computational complexity and memory requirements. This complexity can result in overfitting, particularly when training data is limited. Additionally, the intertwined nature of feature extraction and fusion makes these models less interpretable and more difficult to optimize compared to simpler fusion strategies.
2.1.3. Late Fusion
Late fusion strategies, operating at the decision level, have gained prominence due to their flexibility and robustness to modality-specific characteristics. These approaches process each modality independently and combine the final predictions or decisions, offering several advantages for practical applications. Pang et al. [8] introduced CLOCs, which combines 2D and 3D detection results through a novel fusion network that operates on the geometric relationships between candidate detections.
Recent work by Li et al. [17] proposed the Fully Sparse Fusion framework, which aligns 2D and 3D instance segmentation results to generate multi-modal instances for bounding box prediction. This approach demonstrates the ongoing innovation in late fusion methodologies, particularly in addressing the challenges of heterogeneous data representation and alignment. Late fusion offers practical benefits including modularity, as individual modality processors can be updated or replaced independently, and robustness to missing or unreliable modalities. However, traditional late fusion approaches often struggle to capture the rich interactions between modalities that occur at earlier processing stages.
2.2. Uncertainty Estimation Methods
The integration of uncertainty estimation within deep learning frameworks has become increasingly important for safety-critical applications such as autonomous driving. Uncertainty quantification provides crucial information about the reliability of predictions, enabling more informed decision-making and risk assessment.
2.2.1. Bayesian Approaches
Bayesian methods provide a principled framework for uncertainty quantification by treating model parameters as probability distributions rather than fixed values. Blundell et al. [18] introduced Bayesian neural networks with variational inference, enabling practical uncertainty estimation in deep learning models. This approach captures both epistemic uncertainty (related to model parameters) and aleatoric uncertainty (related to data noise), providing a comprehensive view of prediction reliability. Kucukelbir et al. [19] advanced this field with automatic differentiation variational inference, making Bayesian methods more accessible and scalable to complex deep learning architectures. In related domains such as HDR imaging, similar uncertainty-aware frameworks have been developed to model one-to-many mappings and enhance high-frequency details [20], further demonstrating the broad applicability of probabilistic approaches in vision tasks.
2.2.2. Monte-Carlo Dropout (MC-Dropout)
Monte-Carlo Dropout, introduced by Gal and Ghahramani [21], provides a Bayesian approximation framework for posterior inference by treating dropout as a probabilistic sampling technique. This method enables effective uncertainty quantification in neural networks and has been widely adopted across various domains, including computer vision and natural language processing. For instance, Zhao et al. [22] applied MC-Dropout to estimate predictive uncertainty in semantic segmentation tasks, demonstrating its practical utility in vision-related applications. Recent advances continue to refine such uncertainty estimation techniques for safety-critical systems.Notably, Bethell et al. [23] introduced MC-CP, a hybrid method that combines an adaptive Monte Carlo dropout with conformal prediction. MC-CP addresses key limitations of prior uncertainty estimation methods—such as high computational cost or overly conservative prediction sets—by dynamically adjusting dropout at runtime to save resources while producing robust, statistically rigorous uncertainty intervals.
2.2.3. Ensemble Methods
Deep ensemble approaches have demonstrated remarkable effectiveness in uncertainty estimation while maintaining computational practicality. Lakshminarayanan et al. [24] showed that simple ensembles of neural networks could provide well-calibrated uncertainty estimates without the computational overhead of full Bayesian inference. Molchanov et al. [25] further enhanced this approach by combining ensembles with variational dropout, creating a hybrid method that leverages the strengths of both techniques. Peng et al. [26] applied deep ensemble methods to YOLOv3 object detection, analyzing the relationship between uncertainty and confidence measures in detection outputs. Similar principles have been successfully applied in remote sensing; for example, Sharma and Saharia [27] utilized a novel deep ensemble strategy for SAR-based flood mapping, generating explicit uncertainty layers to assess prediction reliability in critical real-world scenarios.
2.2.4. Evidential Deep Learning
Recent advances in evidence-based deep learning have provided novel approaches for uncertainty quantification using Dempster-Shafer theory. Sensoy et al. [11] introduced evidential deep learning, which models uncertainty by treating network outputs as evidence masses for Dirichlet distributions. This approach provides a theoretically grounded framework for uncertainty quantification that goes beyond traditional softmax outputs. Zou et al. [28] developed EvidenceCap for medical image segmentation, demonstrating the practical utility of evidence-based uncertainty estimation in critical applications. Han et al. [29] proposed trusted multi-view classification, which dynamically integrates multiple views at the evidence level using Dirichlet distributions and Dempster-Shafer theory. The key distinction between evidential fusion and a simple combination of Dirichlet parameters is that the latter often ignores the inherent conflicts between different evidence sources and lacks a principled mechanism to measure the resultant uncertainty. Simple operations, such as averaging the parameters, do not account for or resolve contradictions in the evidence. In contrast, evidential fusion strictly follows Dempster’s rule of combination, which explicitly identifies, quantifies, and redistributes the probability mass associated with conflicting evidence. This process not only integrates information but also yields a rigorous, well-calibrated measure of total uncertainty that incorporates both the strength of individual sources and the degree of disagreement among them.
Compared to Bayesian, MC-Dropout, and ensemble methods that estimate uncertainty through parameter distributions, multiple stochastic passes, or output variations, evidential theory explicitly models distributional uncertainty from a single deterministic output. This intrinsic uncertainty representation can be obtained without adding computational resources or modifying the model architecture, allowing it to seamlessly adapt to late fusion paradigms. This characteristic is particularly advantageous for late-fusion decision integration, enabling the coherent combination of evidence from different sources or views.
3. Methodology
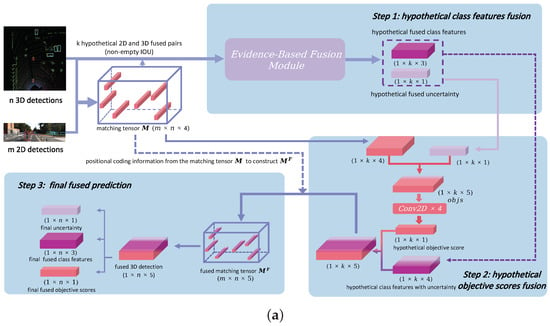
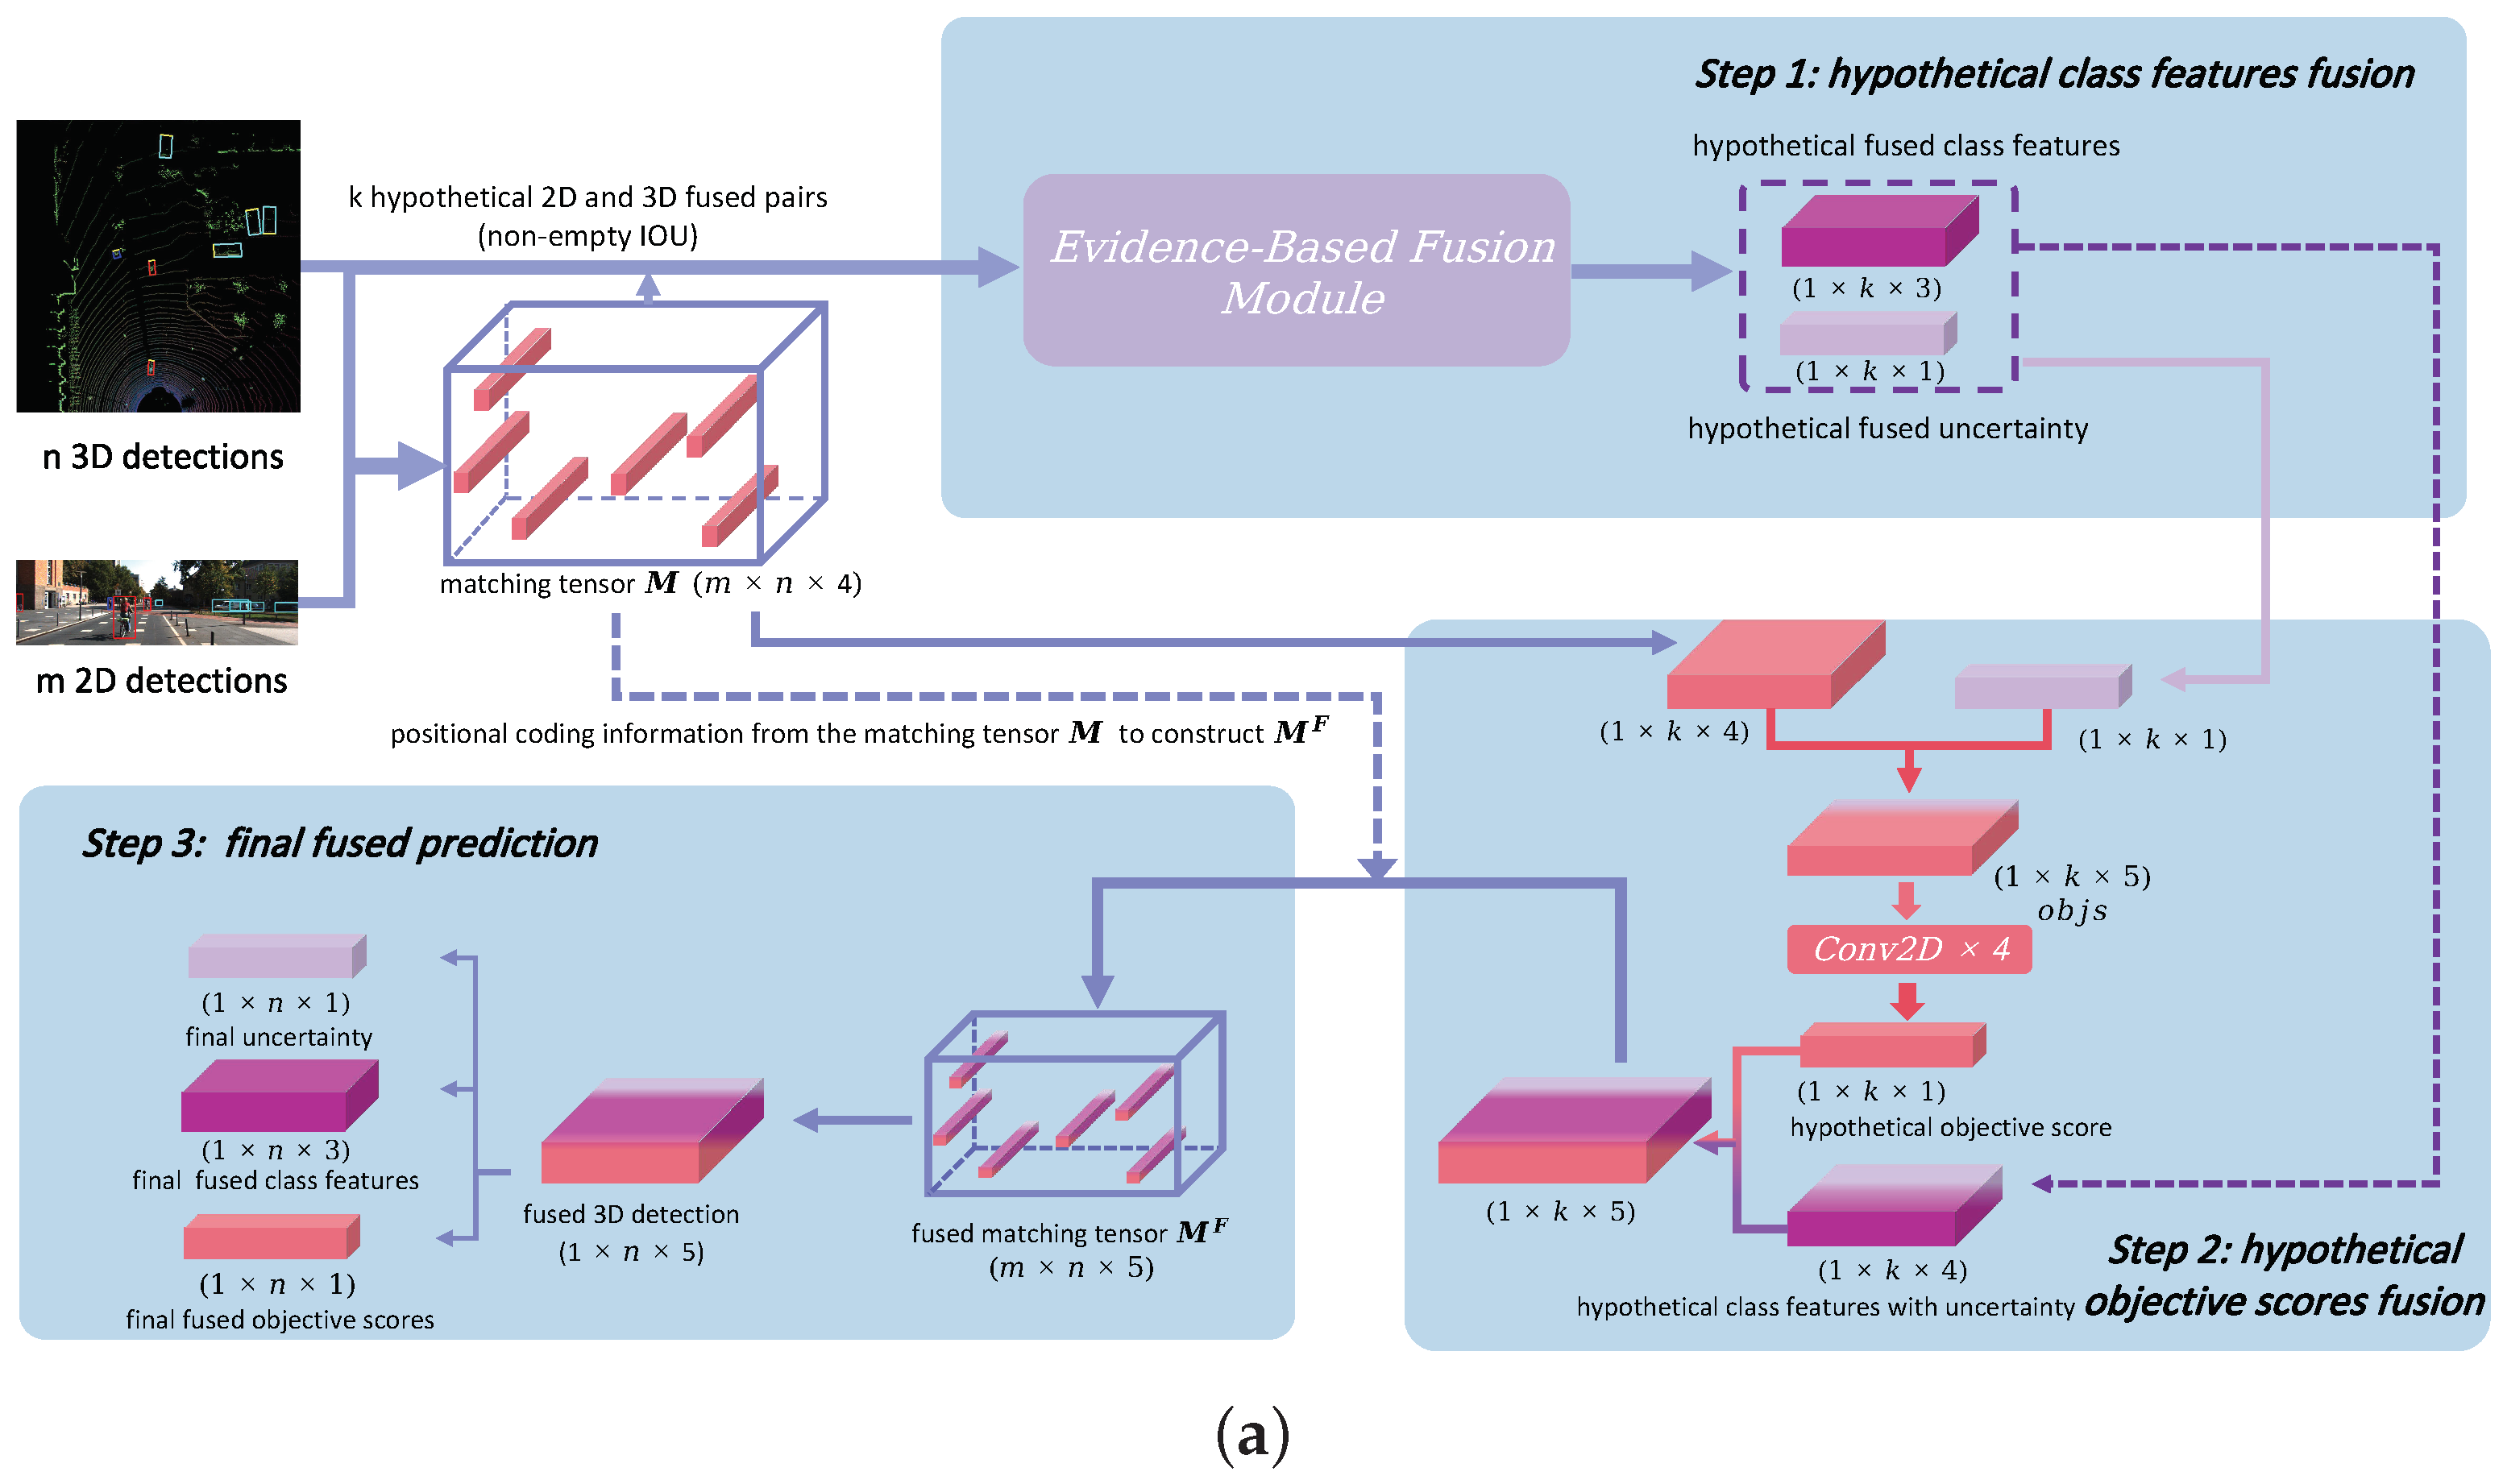
This section presents our trusted multi-modal fusion framework for object detection. The overall architecture of the proposed system is illustrated in Figure 1a.
Figure 1.
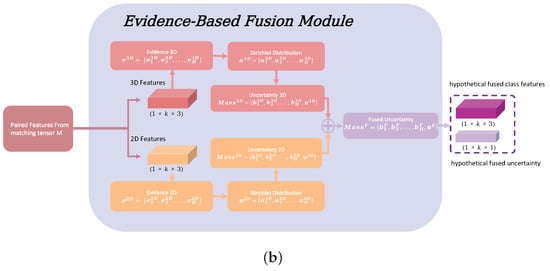
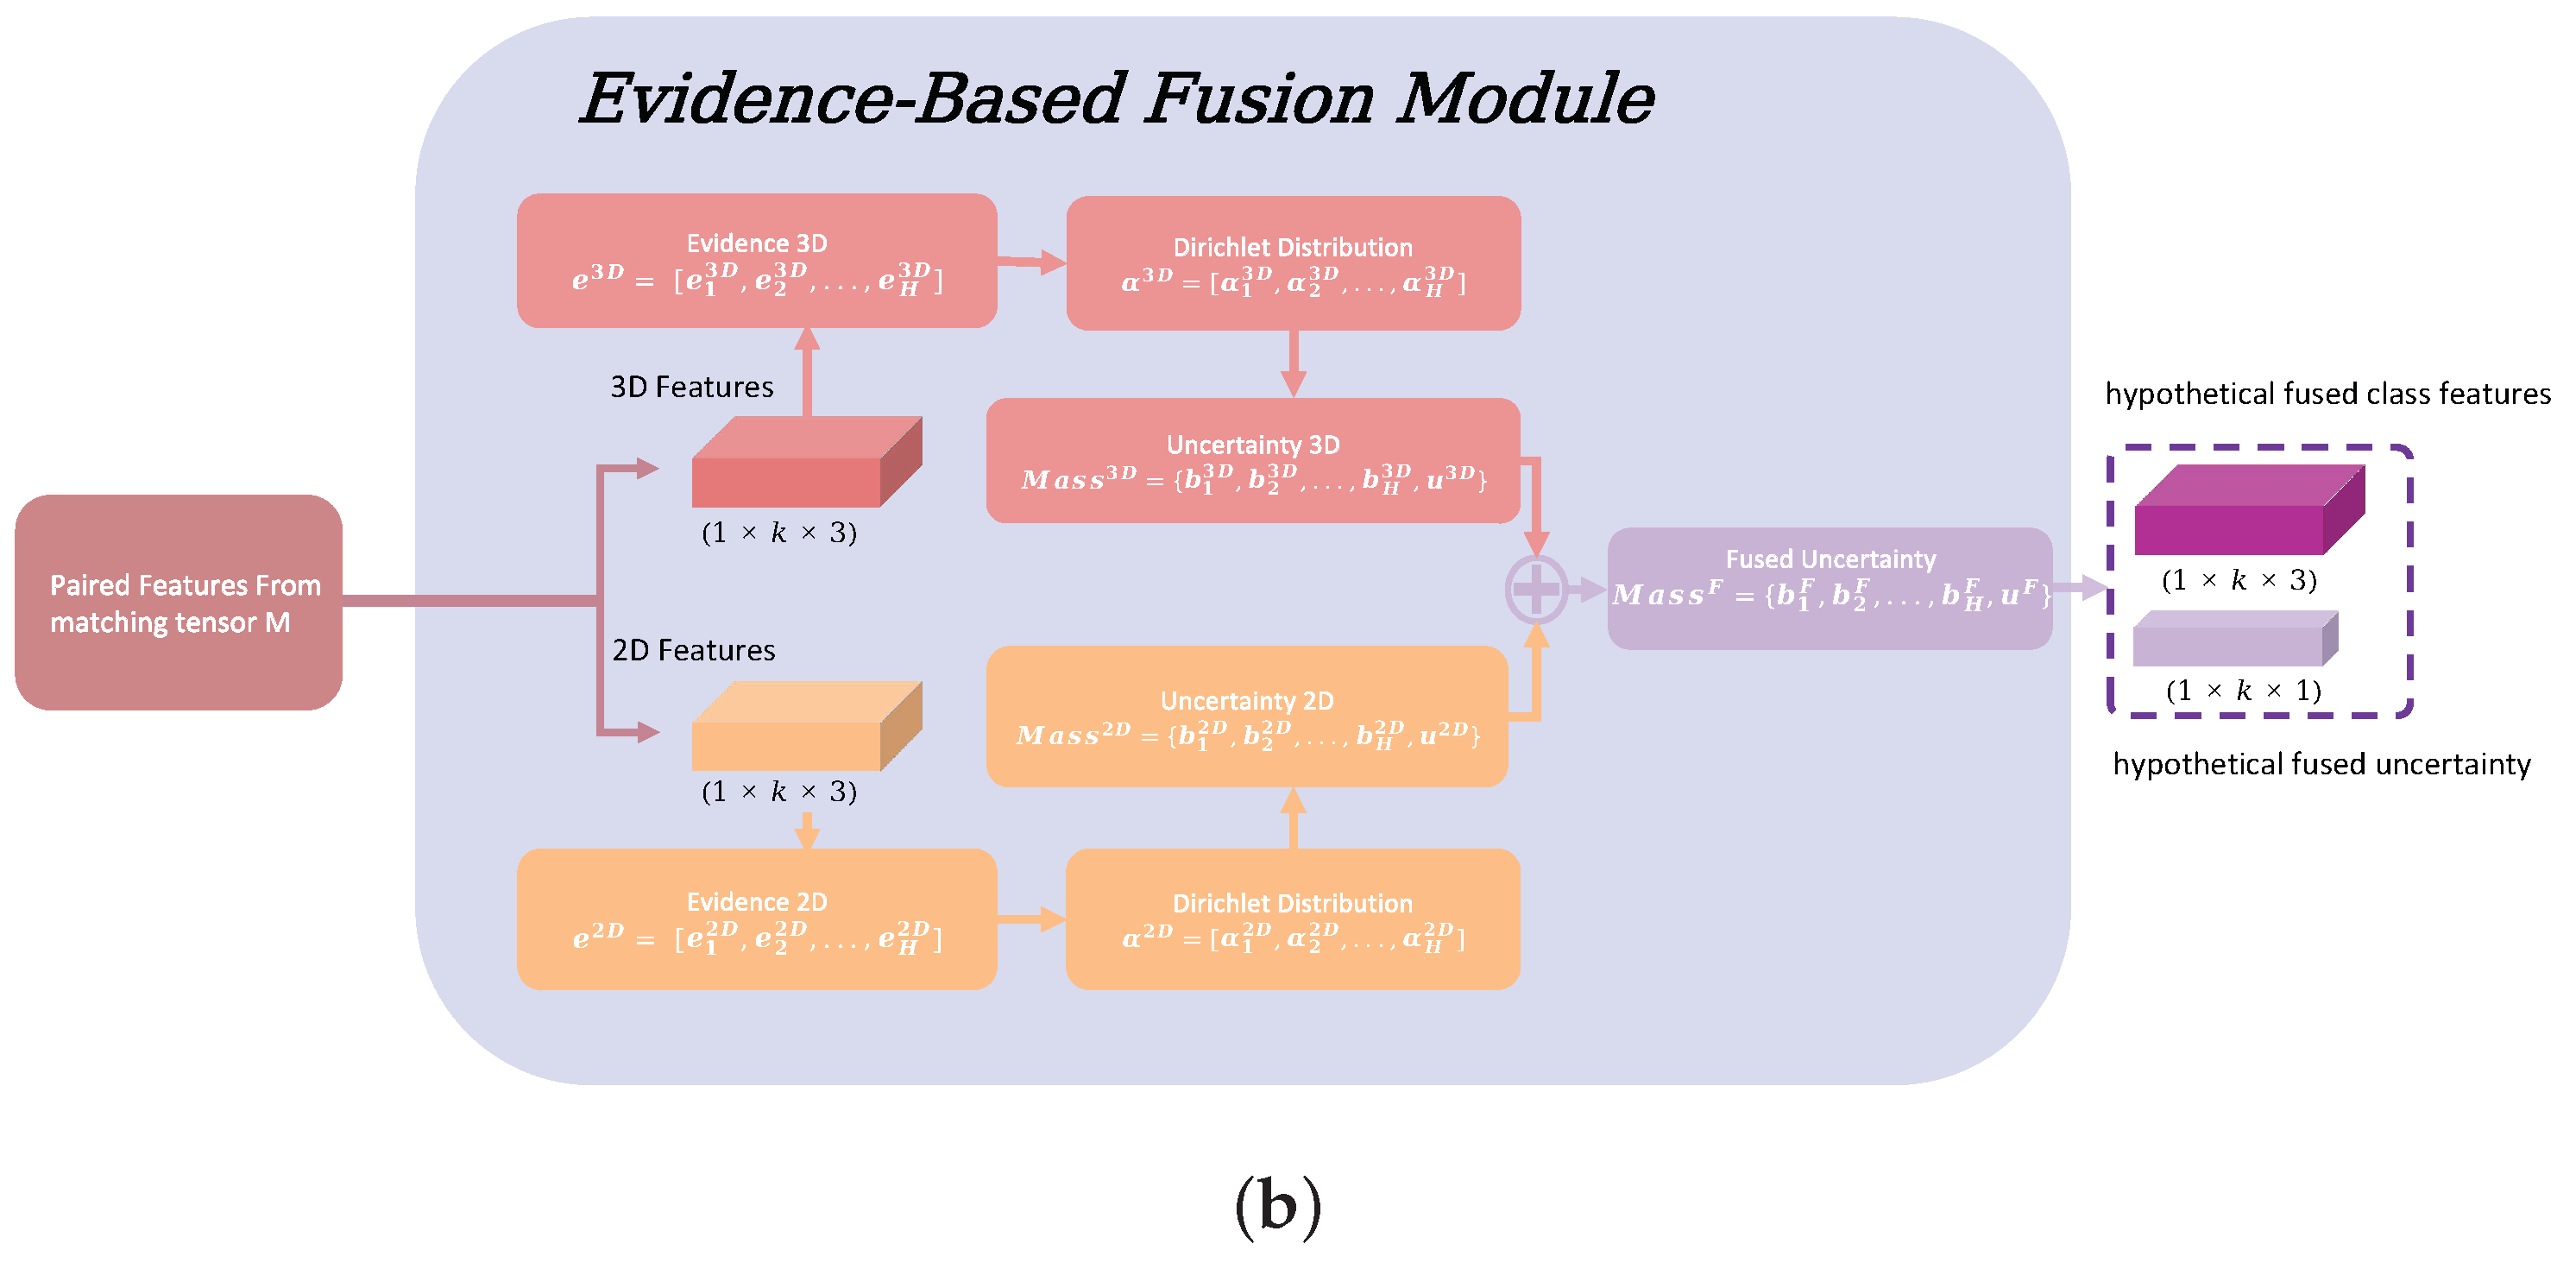
System architecture. (a) Flowchart of the proposed method: in step 1, each of the m 3D candidates is computed for IOU with each of the n 2D candidates to have k hypothetical fused pairs, and fused class features with uncertainty are obtained based on these pairs through Evidence-Based Fusion Module (detailed in (b)). In step 2, the hypothetical objective scores are computed by a 2D CNN and then concatenated with the fused class features with uncertainty which ultimately is used in step 3 to build fused matching tensor to get the final fused prediction. (b) Detailed structure of the Evidence-Based Fusion Module.
3.1. Multi-Modal Multi-Class Late Fusion (MMLF) Architecture
3.1.1. Hypothetical Class Features Fusion
The framework employed YOLOv8 [30] as the 2D detector, a choice further supported by the continued evolution of YOLO-based architectures—as seen in recent high-performance variants such as Succulent-YOLO [31] and Mussel-YOLO [32]. These developments highlight the adaptability and strength of YOLO-style detectors as plug-in components in fusion pipelines. For 3D detection, Complex-YOLO [33] was adopted. Both detectors are capable of the multi-class detection required for effective fusion.
Let m and n represent the number of 3D and 2D detection candidates, respectively. We project the m 3D candidates onto the image plane and compute their Intersection-over-Union (IOU) with the n 2D candidates. Based on the IOU information, a matching tensor with feature information is constructed, which has dimensions . Each element in is defined as:
Here, quantifies the spatial overlap between the i-th projected 3D candidate and j-th 2D candidate. and denote the objective scores of the respective candidates, while represents the normalized distance between the i-th 3D bounding box and the LiDAR sensor in the xy-plane.
From this process, k hypothetical 3D-2D pairs with non-zero IOU values are identified for fusion. The class features from these candidate pairs are treated as evidence [34], with 3D and 2D evidence vectors defined as and , where H denotes the number of classes (e.g., for KITTI Dataset).
Following subjective logic principles [35], these evidence vectors are transformed into Dirichlet distribution parameters and . The corresponding belief masses , and uncertainties , are computed using:
where represents the Dirichlet strength.
The fused mass is obtained through Dempster’s combination rule [36,37], with fused belief masses and uncertainty calculated as:
where quantifies the conflict between 2D and 3D class detections.
3.1.2. Hypothetical Objective Scores Fusion
For each of the k hypothetical pairs, the fused uncertainty —representing class conflict between modalities—is incorporated into the matching tensor to construct a objective score tensor:
A series of 2D convolutional layers with a kernel size and unit stride progressively transform the third channel of from to , then to , and finally to , producing the hypothetical objectness score vector. ReLU activation is applied between each consecutive layer to introduce nonlinearity, and no normalization layers are used in this processing stage. This layered expansion compresses basic features into increasingly abstract representations, enhancing the model’s ability to capture nonlinear interactions relevant to objectness. The use of convolutions—instead of fully connected layers—reduces the number of parameters, improves computational efficiency, and aligns with common image feature processing pipelines for easier integration and extension.
3.1.3. Final Fused Prediction
The hypothetical objective score vector () is concatenated with hypothetical class features and uncertainty information () to form the fused matching tensor . The entry with the highest objective score in the second dimension is selected using the Max function, providing the final fused 3D detection comprising objective scores, class features, and uncertainty. Application of Non-Maximum Suppression (NMS) yields more confident final predictions.
3.1.4. Illustrative Example
Here is a real and specific numerical example from the fusion process to illustrate the method, which helps readers better understand our approach.
Step 1: Pre-Fusion Mass Calculation
Here, and represent the initial evidence in 3D and 2D spaces, by adding one to each element of the initial vectors, we obtain the Dirichlet distribution parameters:
Then, we introduce the Dirichlet strength for both cases:
Based on Dirichlet strength, we calculate the belief masses:
The uncertainties and are computed as and , respectively:
Finally, the Masses for fuse are combined as:
Step 2: Fusion Calculation (Consensus Case)
Based on the belief masses calculated in Step 1, we first compute the conflict factor C:
Then, applying Dempster’s combination rule, we compute the fused belief masses and uncertainty:
Finally, the fused mass is:
After fusion, the fused mass supporting classification as Class 0 becomes more robust, accompanied by a reduced level of uncertainty.
Step 3: Conflict Fusion Cases Comparison
For comparison, we show conflict fusion cases where two views disagree significantly. In these cases, the conflict factor C is larger, leading to higher uncertainty after fusion:
Mild Conflict (Moderate Disagreement):
Severe Conflict (Strong Disagreement):
The comparison reveals that conflict fusion cases maintain significantly higher uncertainty ( for mild conflict, for severe conflict) compared to the consensus case (). In the mild conflict case, the two views show moderate disagreement on the primary classification (3D favors class 0 while 2D shows more balanced distribution), resulting in intermediate uncertainty. In the severe conflict case, the views strongly disagree: 3D strongly favors class 0 while 2D strongly favors class 2, leading to higher conflict factor and consequently higher residual uncertainty . This demonstrates DS evidence theory’s capability to appropriately quantify uncertainty when views conflict, with the conflict factor C directly correlating with the degree of disagreement between information sources, and the fused uncertainty reflecting the overall confidence in the combined decision.
3.2. Non-Matching Scenarios
To mitigate the over-reliance on 2D evidence and prevent the outright dismissal of valuable but unpaired 3D detections, a virtual pair mechanism is introduced for projected 3D candidates with no intersecting 2D candidate. In these non-matching scenarios, the 2D component is simulated by setting its confidence score to a low value (e.g., −10) and its evidence vector to zero. During fusion, this configuration ensures the combined belief masses and uncertainty are dominantly governed by the original, confident 3D modality, thereby preserving its informational value while appropriately reflecting the lack of 2D corroboration through a heightened uncertainty score. This approach aims to balance multi-modal integration against the risk of being constrained by the limitations of a single sensor stream.
3.3. Uncertainty Estimation
Our approach initially performs hypothetical fusion based on IOU information from matching tensor , deriving hypothetical fused uncertainty that captures inter-modal conflicts. This uncertainty is incorporated into the objective score tensor during hypothetical objective scores fusion to reduce selection of illogical fusions. In the final prediction stage, combining with fused objective scores enhances representational capacity and interpretability, enabling discrimination of the network’s confidence in both object localization and categorization.
3.4. Optimization and Training Strategy
We employ a multi-objective optimization approach that jointly minimizes detection errors and uncertainty estimates. The loss function combines several components to address different aspects of the fusion process:
The objective loss employs the binary cross-entropy loss to supervise the detection confidence, computed distinctly over the object mask (regions containing ground truth objects) and the no-object mask (background regions). In our late fusion framework, the ground-truth labels for positives and negatives are provided directly within the training annotations, and the loss is applied specifically to the subset of 3D proposals that have been successfully associated with corresponding 2D detections. This design ensures that the confidence learning is focused on regions where cross-modal correspondence has been established, thereby reinforcing the reliability of the fused detection outcomes, which is computed as follows:
The classification loss utilizes the sample-specific loss from [29].
For non-matching scenarios where no corresponding 2D detection exists, we preserve the original 3D detection and apply a modified loss:
The total loss is the weighted combination:
where the coefficients are set to , , and to balance the contribution of each loss component, a configuration that has been found to be effective in practice.
We utilize the Adam optimizer with learning rate 0.003 for evidence fusion components and Stochastic Gradient Descent with the same learning rate for objective score fusion. The training process emphasizes balanced learning across all components to ensure stable convergence and optimal performance.
4. Experimental Evaluation
4.1. Experimental Setup
All experiments were conducted on a workstation equipped with an Intel Core i5-12600KF CPU and an NVIDIA GeForce RTX 4080 GPU with 16 GB of VRAM. The system had 32 GB of RAM. During inference, our framework processed samples at an average speed of 0.512 s per sample, including the online inference time for both detectors. The training phase averaged 2.134 seconds per sample. During training, only the fusion and convolution modules were optimized, while both the base 2D and 3D detectors remained frozen with their pre-trained parameters. The model was trained for 5 epochs, with a peak GPU memory usage of approximately 3733 MB during the training process.
We conducted comprehensive experiments on the KITTI dataset [38], which represents a standard benchmark for autonomous driving perception tasks. The dataset provides synchronized data from LiDAR and camera sensors, with detailed annotations for 2D and 3D object detection tasks. In detail, we split the 7481 training samples into 6000 samples for training and 1481 for validation. Additionally, we evaluated our method on the official test set comprising 7518 samples, with results submitted to the KITTI evaluation server.
For 3D object detection, we employed Complex-YOLO v3 and v4 as baseline detector. These models process LiDAR point cloud data to generate 3D bounding boxes. For 2D detection, we utilized YOLOv8 [30]. This detector provides high-quality 2D bounding boxes and class predictions from image data. No additional data processing steps were introduced. That is, for point cloud data, we directly followed the processing pipeline of Complex-YOLO, and for image data, we adhered to the standard procedure of YOLOv8. Meanwhile, the projection of 3D bounding boxes for IoU-based matching was performed using the original 3D detector’s calibration module. This module employs the standard KITTI calibration parameters (such as, P2, R_rect, Tr_velo_to_cam), ensuring that our evaluation remains consistent with the benchmark protocol.
The evaluation metrics included Average Precision (AP) with the unit being percentage (%) for 2D detection, 2D orientation estimation, 3D detection, and bird’s-eye view (BEV) tasks. We report results for three difficulty levels (Easy, Moderate, Hard) across three object categories (Car, Pedestrian, Cyclist), following the standard KITTI evaluation protocol. Uncertainty metrics were evaluated using the uncertainty scores derived from our evidence-theoretic framework.
4.2. Comparative Analysis
A comprehensive performance comparison between the baseline 3D-only detection (Ori) and the proposed multi-modal fusion method (Fuse) is detailed in Table 1 (validation set) and Table 2 (test set). The analysis evaluates four key metrics—2D Detection, 2D Orientation, Bird’s-Eye-View (BEV) detection, and 3D detection—and categorizes the findings into significant improvements, minor improvements or parity, and notable regressions.
Table 1.
KITTI Validation Dataset Performance Comparison. Bold numbers indicate the best performance across methods. In the “improvement” row, bold values denote positive gains.
Table 2.
KITTI Test Dataset Performance Comparison.Bold numbers indicate the best performance across methods. In the “improvement” row, bold values denote positive gains.
4.2.1. Significant Improvements
The most substantial gains are observed in tasks where complementary 2D visual features provide critical information missing from LiDAR data alone.
2D Detection & Orientation Accuracy: The Fuse model achieves significant and consistent improvements in 2D performance across all object categories and difficulty levels. For example, on the test set, the 2D Detection AP for the Car class using Fuse-v4 increased by 16.86, 7.31, and 6.59 percentage points for Easy, Moderate, and Hard levels, respectively. Gains for the Pedestrian and Cyclist classes on the validation set are even more pronounced, frequently exceeding 10 percentage points. This demonstrates that integrating image features dramatically enhances object recognition and localization within the 2D plane.
3D Detection Accuracy: The advantage of our sensor fusion framework is most clearly demonstrated in 3D object detection, where it delivers substantial and consistent improvements across all object categories and difficulty levels. As shown in the evaluation results, our Fuse-v3 model achieves significant absolute gains over its baseline, with improvements reaching up to +16.18 percentage points for Pedestrian (Moderate) and +12.58 for Cyclist (Easy). Our fusion method maintains strong effectiveness when integrated with the v4 baseline, yielding improvements such as a +15.32 percentage point gain for Pedestrian (Easy) and sustained gains exceeding +10 points for Cyclist across multiple settings. These results underscore that integrating 2D semantic and contextual information is crucial for enhancing 3D pose estimation, particularly for smaller and more challenging objects that are often poorly represented in sparse LiDAR point clouds.
4.2.2. Minor Improvements or Parity
Metrics that rely heavily on precise 3D geometry show more modest gains, as the baseline LiDAR-based performance is already strong.
Bird’s-Eye-View (BEV) Detection: For the Car class, which exhibits very high baseline BEV AP (often >89%), the fusion approach yields only minor improvements, typically less than 1 percentage point. This indicates that for large objects with abundant LiDAR points, BEV detection is nearly saturated. Improvements for Pedestrian and Cyclist in BEV are consistent but generally smaller in magnitude than their corresponding 3D AP gains, suggesting that fusion helps but does not fully overcome the inherent challenge of precise BEV localization for small objects.
4.2.3. Minor Reductions
BEV AP for Car on Test Set (Fuse-v3): In contrast to the overall positive trend, Fuse-v3 exhibited a decrease in BEV AP for the Car class at Easy and Moderate difficulty levels on the test set, dropping by 2.78 and 1.48 percentage points, respectively. This regression was corrected in the Fuse-v4 model, which shows positive gains. The primary cause lies with the original 3D model (v3), which suffered from overfitting and generated a slightly excessive number of false bounding boxes for cars, thereby leading to erroneous fusion. When the base model was upgraded to v4, the overall quality of the output bounding boxes improved significantly.
In conclusion, the multi-modal fusion method delivers significant improvements in 2D and 3D detection, especially for smaller objects like pedestrians and cyclists, by effectively combining LiDAR and image data. Gains in BEV detection are more modest for larger objects, where LiDAR-only performance is already strong. An initial regression observed in early model version was addressed in the enhanced version, confirming the importance of a robust 3D detection backbone. Overall, the results affirm the potential of sensor fusion for accurate perception.
4.3. Uncertainty Analysis
The proposed framework achieves significant uncertainty reduction while maintaining detection accuracy, as summarized in Table 3. The evidence-theoretic uncertainty quantification provides mathematically grounded confidence measures that enhance the reliability of detection outcomes.
Table 3.
Average uncertainty score comparison. Bold numbers indicate the best performance across methods.
We calculate the per-class average uncertainty scores exclusively on samples where the detection is correct (i.e., the predicted class matches the ground truth). For Complex-YOLO v3, the fusion framework reduces these correct-prediction uncertainty scores from 0.11827 to 0.02692 for cars (77.3% reduction), from 0.24373 to 0.05354 for pedestrians (78.0% reduction), and from 0.23636 to 0.07354 for cyclists (68.9% reduction). Similar reductions are observed for the v4 variant, demonstrating the consistency of our uncertainty quantification approach.
The uncertainty reduction is particularly significant for challenging categories like pedestrians and cyclists, where single-modality detectors often exhibit high uncertainty due to limited sensor information. The multi-modal fusion effectively combines complementary information, leading to more confident and reliable predictions even when considering only correctly identified objects. This uncertainty reduction has important implications for safety-critical applications, where understanding prediction reliability is essential for risk assessment and decision-making.
4.4. Ablation Studies
To systematically verify the effectiveness of each component in our proposed fusion framework, we conducted a comprehensive ablation study on the KITTI dataset. The experimental results, detailed in Table 4, were obtained by incrementally integrating the hypothetical Class Fusion (CF) module and the hypothetical Objective Scores Fusion (OSF) module into the baseline Complex-YOLOv3 network.
Table 4.
Ablation study on different baseline models. ‘CF’ stands for hypothetical Class Fusion, and ‘OSF’ represents hypothetical objective scores fusion. A check mark () indicates that the corresponding feature is used. mAP (mean Average Precision) is the primary evaluation metric for detection performance. Best results for each baseline version are in bold. Results with are from Complex-YOLOv3, and with □ are from Complex-YOLOv4. Bold numbers indicate the best performance.
From the ablation study results, several key observations can be made regarding the performance improvements across different Complex-YOLO versions.
The incorporation of the CF module consistently enhanced detection performance in both versions. In Complex-YOLOv3, CF increased 2D detection mAP from 44.24% to 48.07% and boosted 3D detection mAP from 27.48% to 34.02%. Similarly, in Complex-YOLOv4, CF improved 2D detection from 51.33% to 54.59% and 3D detection from 36.92% to 43.21%, demonstrating the effectiveness of class fusion across different baseline architectures.
The OSF module alone provided even more substantial gains. For Complex-YOLOv3, OSF elevated 2D detection mAP to 51.54% and 3D detection to 37.01%, while in Complex-YOLOv4, it achieved 57.40% in 2D detection and 44.77% in 3D detection. This confirms that objective scores fusion significantly optimizes detection confidence across both versions.
The complete framework integrating both CF and OSF modules achieved the best performance in all evaluation metrics. For Complex-YOLOv3, the full model reached 52.26% in 2D detection, 51.46% in orientation estimation, 82.42% in bird’s-eye view, and 45.14% in 3D detection. Complex-YOLOv4 with both modules performed even better, achieving 60.23% in 2D detection, 59.78% in orientation, 83.63% in bird’s-eye view, and 46.80% in 3D detection.
Notably, the performance gap between versions highlights the architectural improvements in Complex-YOLOv4, which consistently outperformed Complex-YOLOv3 across all configurations. The most significant absolute improvements were observed in 3D detection, where the full Complex-YOLOv4 model achieved a 17.66% gain over the baseline Complex-YOLOv3, and the full Complex-YOLOv4 showed a 9.88% improvement over its own baseline.
These results collectively validate that our fusion framework effectively leverages complementary information and can be successfully integrated with different baseline architectures, with the combined CF and OSF modules providing the most robust performance across all detection tasks.
4.5. Discussion
4.5.1. Model Significance and Multi-Modal Fusion
The model’s significance in autonomous driving detection is multifaceted. Firstly, it significantly enhances detection and positioning accuracy by seamlessly fusing 2D and 3D information, thereby improving the overall performance of the sensing module. Notably, it excels in accurately predicting pedestrian directions, a critical capability for autonomous driving systems to anticipate pedestrian behavior and enhance safety in diverse traffic scenarios. Secondly, the model demonstrated strong generalization ability, showcasing robust performance not only on verification sets but also on test sets. This underscores its adaptability across various scenarios and conditions, providing a reliable solution for real-world deployment in autonomous driving systems. Moreover, the model seamlessly integrates information from a wider range of detection patterns, efficiently fusing object-level information from multiple modalities without altering its original structure. This adaptability enables the model to capture richer environmental representations in autonomous driving scenarios. Additionally, the model incorporates uncertainty estimation, enabling the evaluation of detection reliability based on uncertainty scores—a critical aspect for ensuring safe and efficient driving systems. This capability is further enhanced by the application of frameworks like Dempster-Shafer theory, whose key benefit is the ability to explicitly quantify cross-modal conflict, transforming sensor disagreement into actionable information. This capability lays the groundwork for adaptive fusion strategies in downstream systems. For example, a perception system could dynamically weigh LiDAR data more heavily for large objects like vehicles, while relying more on image data for smaller objects like pedestrians, particularly when conflicts between modalities are detected. Crucially, this approach also provides a principled way to handle scenarios where high-quality 2D support is unavailable. In such cases, if the fusion process reports a high uncertainty score due to insufficient 2D evidence, yet the 3D modality alone reports a high objectness score, downstream modules can be designed to retain the detection. They could then appropriately reduce the final objectness score while keeping its uncertainty flag elevated, thereby directing attention to potentially ambiguous detections. This mechanism could proactively prompt safer downstream decision-making—such as triggering more conservative driving maneuvers or requesting human oversight—without requiring the model itself to execute those actions. By explicitly modeling and outputting uncertainty in this principled manner, our model provides the necessary information for building more robust, context-aware, and ultimately safer autonomous systems.
4.5.2. Visual Results and Uncertainty-Relevant Driving Safety
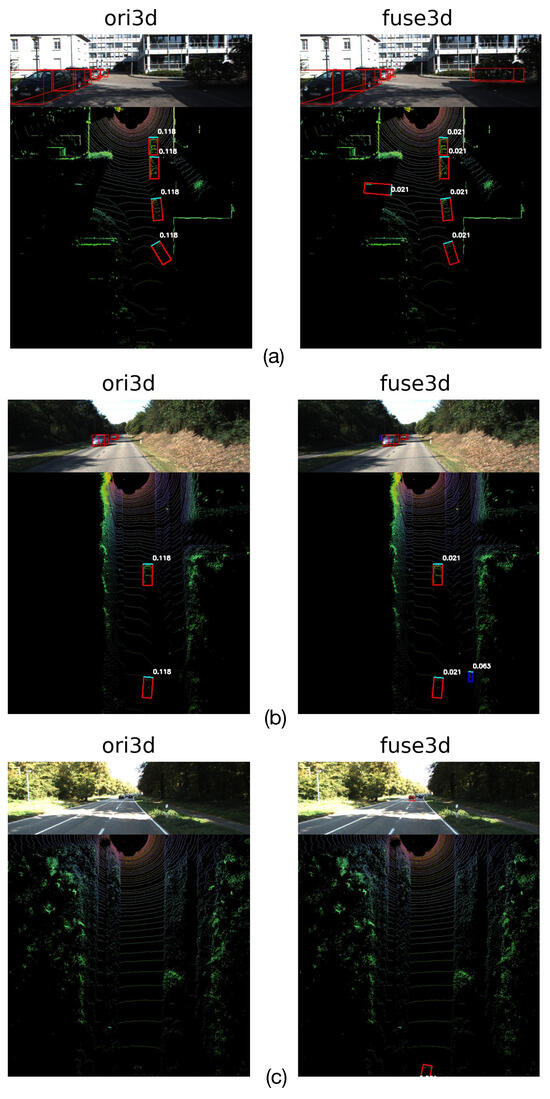
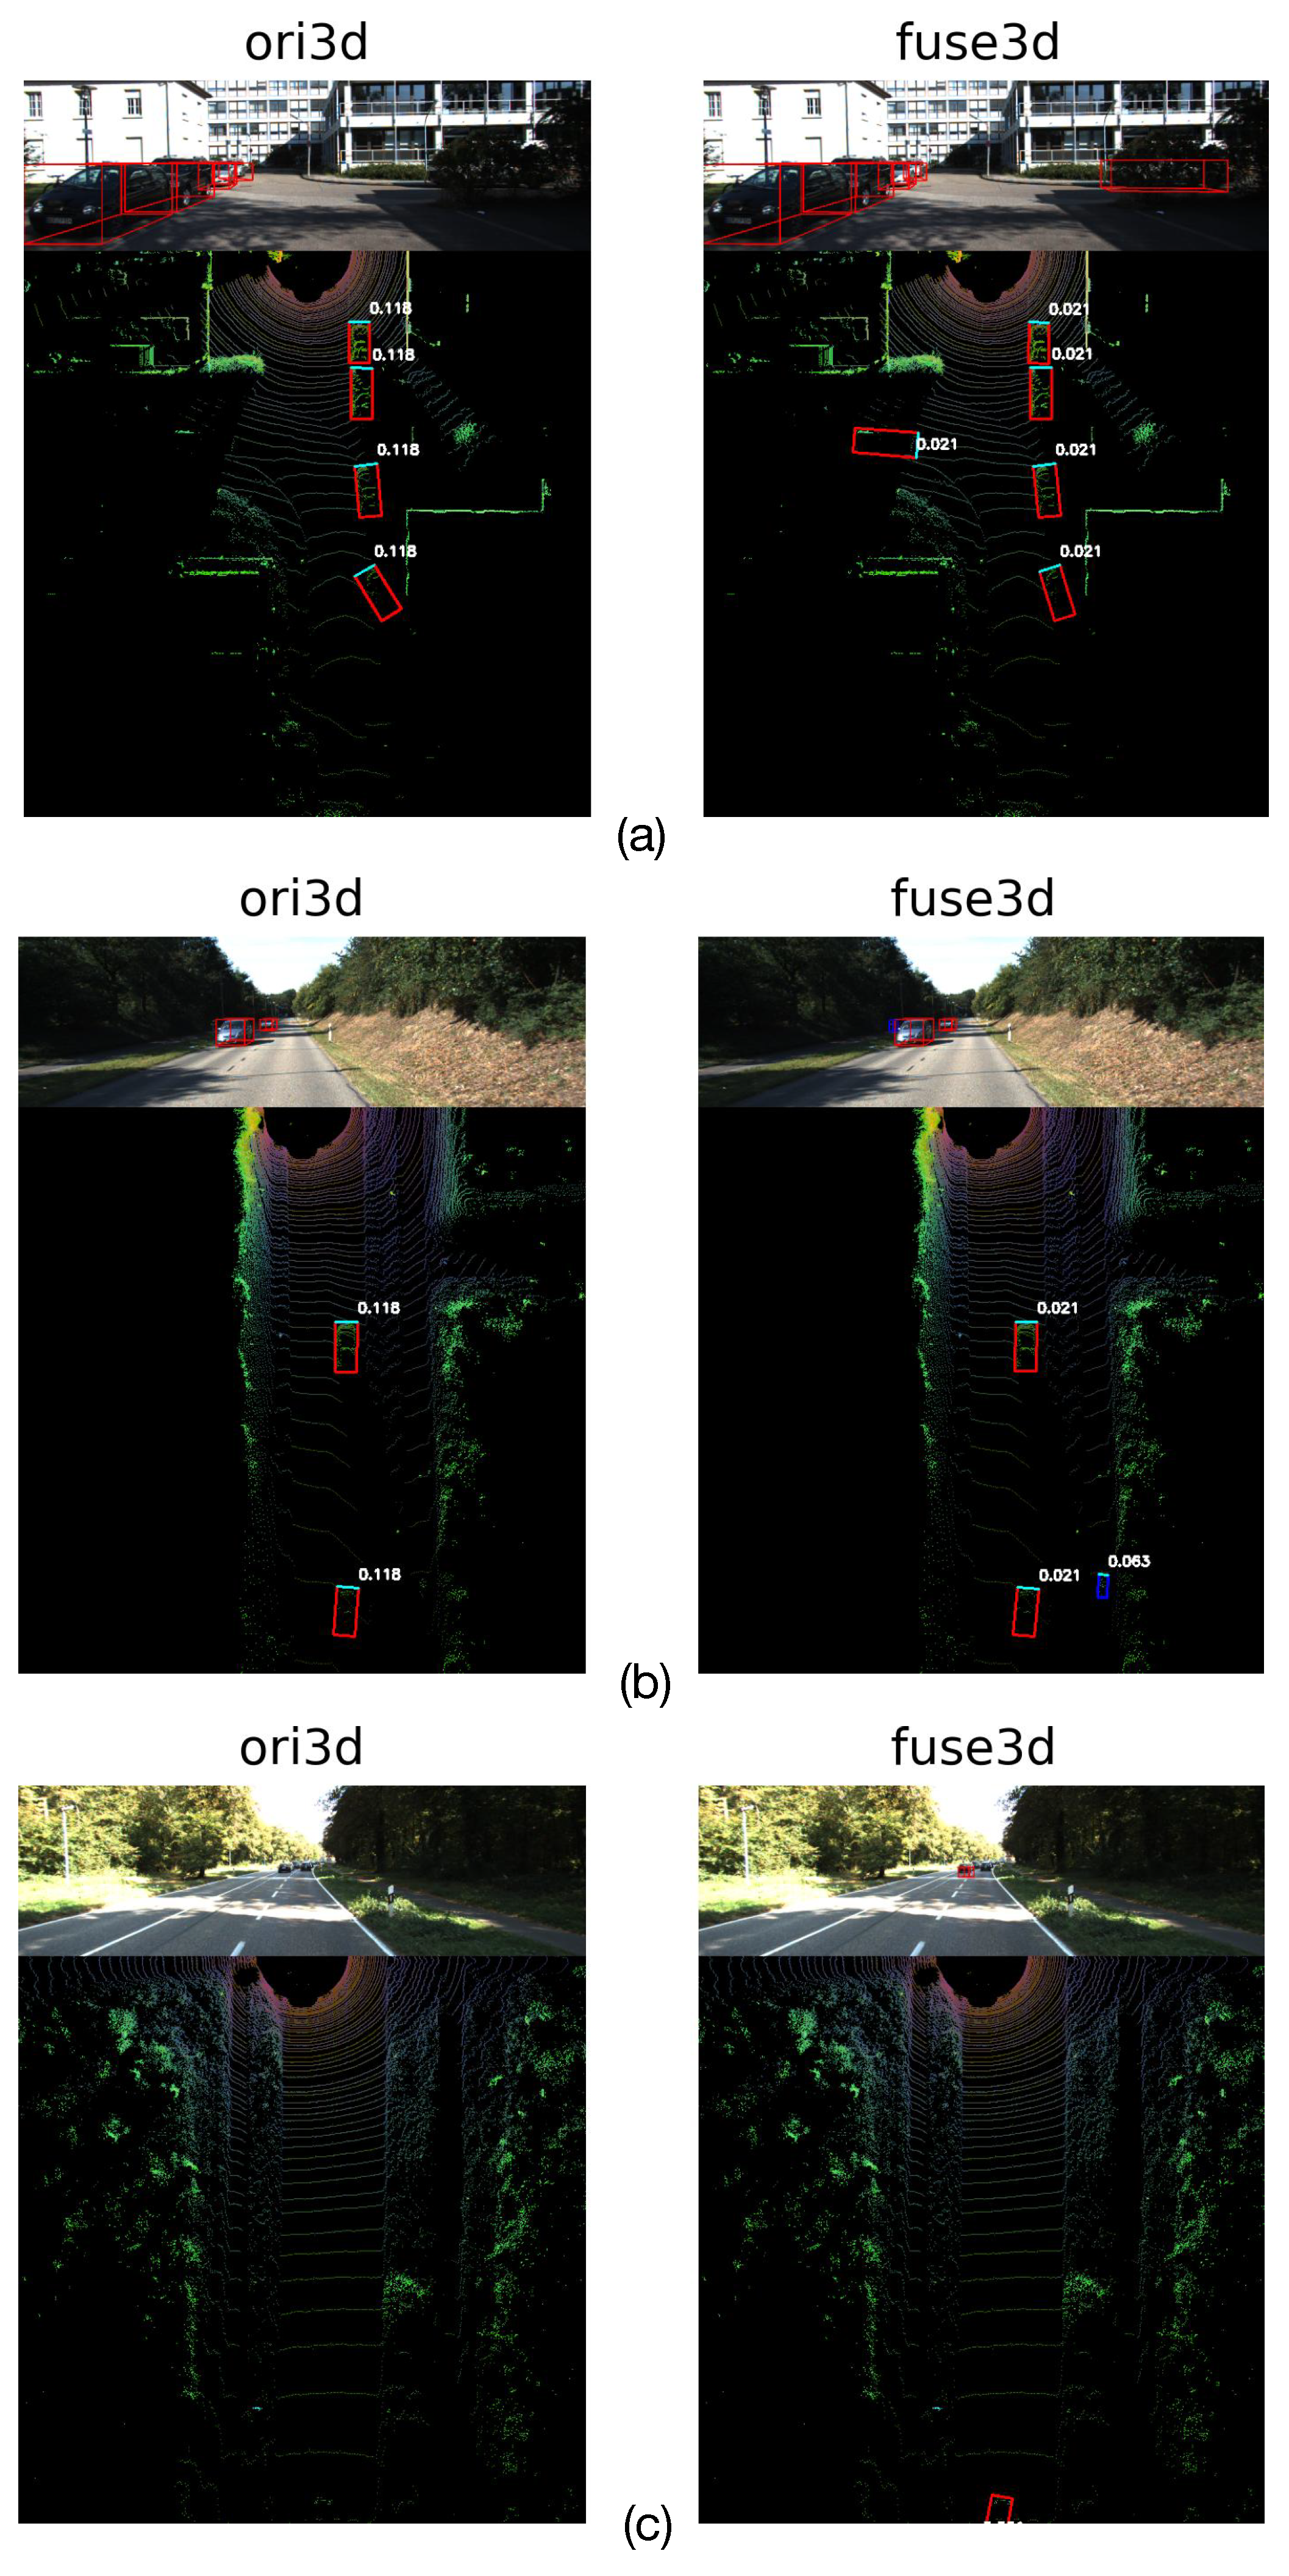
Furthermore, the effectiveness of our fusion framework is visually demonstrated in Figure 2, which presents comparative Bird’s Eye View results on the KITTI validation set. The visualized comparisons reveal three key advantages of our approach: (a) In handling occluded objects, the baseline model (ori3d) exhibits high uncertainty and missed detections for partially occluded vehicles, while our fused approach (fuse3d) successfully detects these occluded targets with considerably lower uncertainty, showcasing the framework’s robustness to occlusion challenges through effective multi-modal feature integration. (b) For small object detection, the baseline detector shows either complete miss-detections or high uncertainty values for distant and small-scale objects, whereas our MMLF framework demonstrates remarkable improvement in detecting these challenging small objects with confident low-uncertainty predictions, validating the effectiveness of our scale-aware fusion strategy. (c) In long-range scenarios, where traditional 3D detectors typically suffer from performance degradation, our model maintains reliable detection capability. This improvement stems from a targeted fusion strategy: rather than performing independent detection, the 2D stream is tasked specifically with augmenting the confidence of the initial 3D hypotheses. By supplying rich semantic context where LiDAR data is sparse, it refines these predictions, thereby enabling the 3D detector to operate more reliably.
Figure 2.
Visualized results of our MMLF on KITTI validation set. In the 3D BEV representation, the numbers adjacent to the predicted bounding boxes indicate the predicted classification uncertainty, which ranges from 0 to 1. This scale allows uncertainty to be directly compared across different scenes. Our model has significantly reduced the original detection uncertainty and demonstrated an improvement in detection capability. (a) Demonstrates the enhanced detection capability of our fused model in the presence of occluded objects. (b) Illustrates the improved detection ability of our model for small objects. (c) Indicates that our model partially addresses the issue of weak long-range object detection inherent in 3D detectors.
Beyond improved detection performance, our framework quantifies prediction reliability through calibrated uncertainty scores. Low uncertainty signifies consistent and mutually reinforcing evidence across sensor modalities, supporting confident and reliable detection. Conversely, high uncertainty indicates sensor conflict or insufficient information, which can trigger critical safety protocols—such as requesting human intervention or switching to a more cautious driving mode. For instance, reducing pedestrian-related uncertainty from 0.24 to 0.05 means the system now aggregates strong, consistent evidence from multiple sensors confirming a pedestrian’s presence. In practice, this high confidence enables timely and appropriate actions, such as smooth, early braking, while effectively avoiding two dangerous failure modes: missing a real pedestrian (a potential LiDAR-only blind spot) or braking for a non-existent one (a camera-only error common in poor lighting). Furthermore, the system can dynamically adjust its driving strategy based on the uncertainty and context. It will react most sensitively to uncertainty changes for a nearby pedestrian, potentially executing immediate braking, but respond more calmly to uncertainty variations for a distant vehicle, thereby ensuring both safety and driving efficiency. These visual results and uncertainty interpretations provide compelling evidence of our method’s practical applicability in autonomous driving contexts, addressing critical perception and reliability challenges essential for real-world deployment.
5. Conclusions
This research has presented a comprehensive Multi-modal Multi-class Late Fusion framework with integrated uncertainty estimation for robust 3D object detection. Our approach addresses critical challenges in autonomous driving perception by providing a flexible fusion architecture that preserves detector integrity while enabling effective multi-modal integration. The incorporation of evidence-theoretic uncertainty quantification enhances the reliability and transparency of detection outcomes, providing crucial confidence measures for safety-critical applications.
Experimental results demonstrate that our framework achieves performance on standard benchmarks while significantly reducing uncertainty estimates across all object categories. The method’s modular design facilitates integration with existing detection systems and provides a foundation for future advancements in multi-modal perception.
The evidence-theoretic foundation provides a mathematically rigorous framework for uncertainty-aware fusion, offering advantages over traditional probabilistic approaches. The practical implementation demonstrates real-time capability and compatibility with diverse detection architectures, enhancing its applicability in real-world autonomous driving systems.
6. Limitations and Future Work
Despite its compelling performance, our work has certain limitations. First, the fusion efficacy is contingent on the quality of the initial 2D and 3D proposals; poor performance from either upstream detector can propagate through our fusion network. Second, while the framework is designed for robustness, its performance under extreme sensor degradation (e.g., complete camera occlusion or LiDAR failure) has not been fully explored. Third, the current method is developed and validated in a constrained experimental setting and lacks real-world validation on a physical platform, which is necessary to assess its practical applicability and real-time capability. Fourth, the fusion performance is dependent on accurate sensor calibration and may vary under different sensor setups or environmental conditions not covered in the current experimental validation. Finally, the method operates on a single frame and currently does not model temporal information, limiting its use in dynamic scenarios. Our future work will focus on addressing these limitations by investigating robust fusion under sensor failure, incorporating temporal dynamics for more stable tracking, and extending the evidential framework to also quantify spatial localization uncertainty.
Author Contributions
Conceptualization, Q.Y. and Y.Z.; methodology, Q.Y.; software, Q.Y.; validation, Q.Y. and Y.Z.; formal analysis, Q.Y.; investigation, Q.Y.; resources, Y.Z. and H.C.; data curation, Q.Y.; writing—original draft preparation, Q.Y.; writing—review and editing, Y.Z. and H.C.; visualization, Q.Y.; supervision, Y.Z. and H.C.; project administration, Y.Z.; funding acquisition, Y.Z. All authors have read and agreed to the published version of the manuscript.
Funding
This research was funded by the National Key Research and Development Program of China (No. 2022YFB2503004), the Sichuan Regional Innovation Cooperation Project (No. 2025YFHZ0291), and the Opening Project of International Joint Research Center for Robotics and Intelligence System of Sichuan Province (Grant JQZN2023-005).
Data Availability Statement
The data and materials supporting the findings of this study are available within the article. For additional inquiries, please contact the corresponding author. This study utilizes the publicly available KITTI dataset, which can be accessed at: http://www.cvlibs.net/datasets/kitti/ (accessed on 5 January 2026). The code for this work is available at: https://github.com/Yang-Qihang11/MMLF (accessed on 5 January 2026).
Conflicts of Interest
The authors declare no conflict of interest.
References
- Liang, L.; Ma, H.; Zhao, L.; Xie, X.; Hua, C.; Zhang, M.; Zhang, Y. Vehicle detection algorithms for autonomous driving: A review. Sensors 2024, 24, 3088. [Google Scholar] [CrossRef] [Scilit] [PubMed]
- Xu, G.; Khan, A.S.; Moshayedi, A.J.; Zhang, X.; Shuxin, Y. The Object Detection, Perspective and Obstacles in Robotic: A Review. EAI Endorsed Trans. AI Robot. 2022, 1, e13. [Google Scholar] [CrossRef] [Scilit]
- Wang, H.; Liu, J.; Dong, H.; Shao, Z. A Survey of the Multi-Sensor Fusion Object Detection Task in Autonomous Driving. Sensors 2025, 25, 2794. [Google Scholar] [CrossRef] [Scilit]
- Zeng, S.; Chang, X.; Xie, M.; Liu, X.; Bai, Y.; Pan, Z.; Xu, M.; Wei, X.; Guo, N. Futuresightdrive: Thinking visually with spatio-temporal cot for autonomous driving. arXiv 2025, arXiv:2505.17685. [Google Scholar]
- Huang, K.; Shi, B.; Li, X.; Li, X.; Huang, S.; Li, Y. MultiModal Sensor Fusion for Auto Driving Perception: A Survey. arXiv 2022, arXiv:2202.02703. [Google Scholar] [CrossRef] [Scilit]
- Vora, S.; Lang, A.H.; Helou, B.; Beijbom, O. Pointpainting: Sequential fusion for 3d object detection. In Proceedings of the IEEE/CVF Conference on Computer Vision and Pattern Recognition, Seattle, WA, USA, 13–19 June 2020; pp. 4604–4612. [Google Scholar]
- Huang, T.; Liu, Z.; Chen, X.; Bai, X. Epnet: Enhancing point features with image semantics for 3d object detection. In Computer Vision—ECCV 2020: 16th European Conference, Glasgow, UK, 23–28 August 2020; Proceedings, Part XV 16; Springer: Berlin/Heidelberg, Germany, 2020; pp. 35–52. [Google Scholar]
- Pang, S.; Morris, D.; Radha, H. CLOCs: Camera-LiDAR object candidates fusion for 3D object detection. In 2020 IEEE/RSJ International Conference on Intelligent Robots and Systems (IROS); IEEE: Piscataway, NJ, USA, 2020; pp. 10386–10393. [Google Scholar]
- Kraus, F.; Dietmayer, K. Uncertainty estimation in one-stage object detection. In 2019 IEEE Intelligent Transportation Systems Conference (ITSC); IEEE: Piscataway, NJ, USA, 2019; pp. 53–60. [Google Scholar]
- He, Y.; Zhu, C.; Wang, J.; Savvides, M.; Zhang, X. Bounding box regression with uncertainty for accurate object detection. In Proceedings of the IEEE/CVF Conference on Computer Vision and Pattern Recognition, Long Beach, CA, USA, 15–20 June 2019; pp. 2888–2897. [Google Scholar]
- Sensoy, M.; Kaplan, L.; Kandemir, M. Evidential deep learning to quantify classification uncertainty. Adv. Neural Inf. Process. Syst. 2018, 31, 3179–3189. [Google Scholar]
- Suk, H.; Kim, S. Uncertainty-Aware Multi-modal Trajectory Prediction via a Single Inference from a Single Model. Sensors 2025, 25, 217. [Google Scholar] [CrossRef] [Scilit]
- Wu, R.; Chen, P.; Shen, F.; Zhao, S.; Hui, Q.; Gao, H.; Lu, T.; Liu, Z.; Zhao, F.; Wang, K.; et al. HiMo-CLIP: Modeling Semantic Hierarchy and Monotonicity in Vision-Language Alignment. arXiv 2025, arXiv:2511.06653. [Google Scholar]
- Wen, L.H.; Jo, K.H. Fast and accurate 3D object detection for lidar-camera-based autonomous vehicles using one shared voxel-based backbone. IEEE Access 2021, 9, 22080–22089. [Google Scholar] [CrossRef] [Scilit]
- Cai, Y.; Zhang, W.; Wu, Y.; Jin, C. Fusionformer: A concise unified feature fusion transformer for 3d pose estimation. In Proceedings of the AAAI Conference on Artificial Intelligence, Vancouver, BC, Canada, 26–27 February 2024; Volume 38, pp. 900–908. [Google Scholar]
- Zhao, Y.; Gong, Z.; Zheng, P.; Zhu, H.; Wu, S. Simplebev: Improved lidar-camera fusion architecture for 3d object detection. arXiv 2024, arXiv:2411.05292. [Google Scholar]
- Li, Y.; Fan, L.; Liu, Y.; Huang, Z.; Chen, Y.; Wang, N.; Zhang, Z. Fully sparse fusion for 3d object detection. IEEE Trans. Pattern Anal. Mach. Intell. 2024, 46, 7217–7231. [Google Scholar] [CrossRef] [Scilit]
- Blundell, C.; Cornebise, J.; Kavukcuoglu, K.; Wierstra, D. Weight uncertainty in neural network. In Proceedings of the International Conference on Machine Learning, PMLR, Lille, France, 7–9 July 2015; pp. 1613–1622. [Google Scholar]
- Kucukelbir, A.; Tran, D.; Ranganath, R.; Gelman, A.; Blei, D.M. Automatic differentiation variational inference. J. Mach. Learn. Res. 2017, 18, 1–45. [Google Scholar]
- Yan, Q.; Wang, H.; Ma, Y.; Liu, Y.; Dong, W.; Woźniak, M.; Zhang, Y. Uncertainty estimation in HDR imaging with Bayesian neural networks. Pattern Recognit. 2024, 156, 110802. [Google Scholar] [CrossRef] [Scilit]
- Gal, Y.; Ghahramani, Z. Dropout as a bayesian approximation: Representing model uncertainty in deep learning. In Proceedings of the International Conference on Machine Learning, PMLR, New York, NY, USA, 19–24 June 2016; pp. 1050–1059. [Google Scholar]
- Zhao, Y.; Tian, W.; Cheng, H. Pyramid Bayesian method for model uncertainty evaluation of semantic segmentation in autonomous driving. Automot. Innov. 2022, 5, 70–78. [Google Scholar] [CrossRef] [Scilit]
- Bethell, D.; Gerasimou, S.; Calinescu, R. Robust uncertainty quantification using conformalised Monte Carlo prediction. In Proceedings of the AAAI Conference on Artificial Intelligence, Vancouver, BC, Canada, 20–27 February 2024; Volume 38, pp. 20939–20948. [Google Scholar]
- Lakshminarayanan, B.; Pritzel, A.; Blundell, C. Simple and scalable predictive uncertainty estimation using deep ensembles. In NIPS’17: Proceedings of the 31st International Conference on Neural Information Processing Systems, Long Beach, CA, USA, 4–9 December 2017; Curran Associates Inc.: Red Hook, NY, USA, 2017; pp. 1–45. [Google Scholar] [CrossRef] [Scilit]
- Molchanov, D.; Ashukha, A.; Vetrov, D. Variational dropout sparsifies deep neural networks. In Proceedings of the International Conference on Machine Learning, PMLR, Sydney, NSW, Australia, 6–11 August 2017; pp. 2498–2507. [Google Scholar]
- Peng, L.; Wang, H.; Li, J. Uncertainty evaluation of object detection algorithms for autonomous vehicles. Automot. Innov. 2021, 4, 241–252. [Google Scholar] [CrossRef] [Scilit]
- Sharma, N.K.; Saharia, M. DeepSARFlood: Rapid and automated SAR-based flood inundation mapping using vision transformer-based deep ensembles with uncertainty estimates. Sci. Remote Sens. 2025, 11, 100203. [Google Scholar] [CrossRef] [Scilit]
- Zou, K.; Yuan, X.; Shen, X.; Chen, Y.; Wang, M.; Goh, R.S.M.; Liu, Y.; Fu, H. EvidenceCap: Towards trustworthy medical image segmentation via evidential identity cap. arXiv 2023, arXiv:2301.00349. [Google Scholar]
- Han, Z.; Zhang, C.; Fu, H.; Zhou, J.T. Trusted multi-view classification. arXiv 2021, arXiv:2102.02051. [Google Scholar] [CrossRef] [Scilit]
- Jocher, G.; Chaurasia, A.; Qiu, J. Ultralytics YOLOv8. 2023. Available online: https://github.com/ultralytics/ultralytics (accessed on 11 January 2025).
- Li, H.; Zhao, F.; Xue, F.; Wang, J.; Liu, Y.; Chen, Y.; Wu, Q.; Tao, J.; Zhang, G.; Xi, D.; et al. Succulent-YOLO: Smart UAV-Assisted Succulent Farmland Monitoring with CLIP-Based YOLOv10 and Mamba Computer Vision. Remote Sens. 2025, 17, 2219. [Google Scholar] [CrossRef] [Scilit]
- Zhao, F.; Xu, D.; Ren, Z.; Shao, X.; Wu, Q.; Liu, Y.; Wang, J.; Song, J.; Chen, Y.; Zhang, G.; et al. Mamba-based super-resolution and semi-supervised YOLOv10 for freshwater mussel detection using acoustic video camera: A case study at Lake Izunuma, Japan. Ecol. Inform. 2025, 90, 103324. [Google Scholar] [CrossRef] [Scilit]
- Simony, M.; Milzy, S.; Amendey, K.; Gross, H.M. Complex-yolo: An euler-region-proposal for real-time 3d object detection on point clouds. In Proceedings of the European conference on Computer Vision (ECCV) Workshops, Munich, Germany, 8–14 September 2018. [Google Scholar]
- Shafer, G. Dempster-shafer theory. Encycl. Artif. Intell. 1992, 1, 330–331. [Google Scholar]
- Jsang, A. Subjective Logic: A Formalism for Reasoning Under Uncertainty; Springer: Berlin/Heidelberg, Germany, 2018. [Google Scholar]
- Sentz, K.; Ferson, S. Combination of Evidence in Dempster-Shafer Theory; Sandia National Laboratories: Albuquerque, NM, USA, 2002. [Google Scholar]
- Jøsang, A.; Hankin, R. Interpretation and fusion of hyper opinions in subjective logic. In 2012 15th International Conference on Information Fusion; IEEE: Piscataway, NJ, USA, 2012; pp. 1225–1232. [Google Scholar]
- Geiger, A.; Lenz, P.; Urtasun, R. Are we ready for autonomous driving? the kitti vision benchmark suite. In 2012 IEEE Conference on Computer Vision and Pattern Recognition; IEEE: Piscataway, NJ, USA, 2012; pp. 3354–3361. [Google Scholar]

Disclaimer/Publisher’s Note: The statements, opinions and data contained in all publications are solely those of the individual author(s) and contributor(s) and not of MDPI and/or the editor(s). MDPI and/or the editor(s) disclaim responsibility for any injury to people or property resulting from any ideas, methods, instructions or products referred to in the content. |
© 2026 by the authors. Licensee MDPI, Basel, Switzerland. This article is an open access article distributed under the terms and conditions of the Creative Commons Attribution (CC BY) license.