


Abstract
Routine hospital records classify waste by hazard and rarely identify non-infectious medical plastics (NIMP) as a distinct material stream, leaving circularity opportunities unmeasured. This study developed a hospital-level circular economy (CE) indicator framework for NIMP and assessed its applicability at two Thai tertiary hospitals. A structured review of 24 source documents yielded 375 indicator records, which were consolidated into 53 candidates and screened to 36 indicators across Material Circularity (16), Operational Integration (11), and Policy and Governance (9). Each indicator was assessed at each site against available evidence, from routine records and documents to field sorting and weighing, and classified as Ready, Hospital-level proxy, or Data-limited. Of the 36 indicators, 27 at Site A and 24 at Site B were represented as a value or proxy; the remaining nine and 12 were data-limited, and the same nine indicators were data-limited at both sites. The pattern was consistent across the two sites despite their different record systems: field-measured material and document-based governance indicators could be measured directly, whereas indicators requiring NIMP-specific data could not. The framework provides a practical basis for assessing readiness for routine NIMP circularity reporting and identifying priority data gaps.
1. Introduction
Healthcare services rely on large volumes of short-lived plastic items to maintain sterility and support clinical care. The sector is also a recognized source of waste and greenhouse gas emissions [1,2,3]. Routine hospital waste records, however, are generally organized by hazard and treatment route rather than by material stream. Consequently, non-infectious medical plastics (NIMP) are commonly recorded within broader general-waste or recyclable categories, and NIMP-specific circularity measures cannot be derived reliably from routine records alone [4,5,6].
In this study, NIMP refers to non-infectious plastic waste generated during hospital operations and managed as general waste or within a recyclable stream under hospital standard operating procedures. Examples include uncontaminated device-related and non-device plastic items, such as intravenous bottles, sterile packaging film, instrument wraps, and rigid trays. The definition excludes items managed as infectious, pharmaceutical, radioactive, chemical, or otherwise hazardous waste under applicable hospital procedures.
Reliable measurement remains a key gap between circular economy (CE) principles and hospital practice. Existing CE indicator frameworks generally operate either at the macro level, using population-scale statistics, or at the product-design level, using manufacturer-held data, as in the Material Circularity Indicator [7]. Neither level matches the unit of analysis required by a hospital managing its own NIMP flow. Healthcare-waste indicator studies provide relevant hospital-level precedents [8], and a recent study ranked key performance indicators for the CE transition in healthcare supply chains [9]. However, no hospital-level indicator set specifically for NIMP was identified in the reviewed literature. Thailand has adopted circular economy and plastic-waste policy instruments, including the Plastic Waste Management Roadmap, but none provides a hospital-level framework for measuring NIMP circularity [10].
This study addressed this gap through two objectives: (1) to identify and adapt a CE indicator set for NIMP management in Thai hospitals and (2) to assess the applicability of the resulting set using data and operational records from two Thai case-study hospitals.
2. Materials and Methods
2.1. Indicator Development
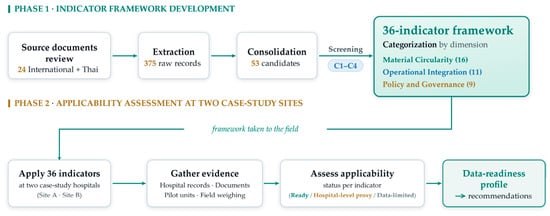
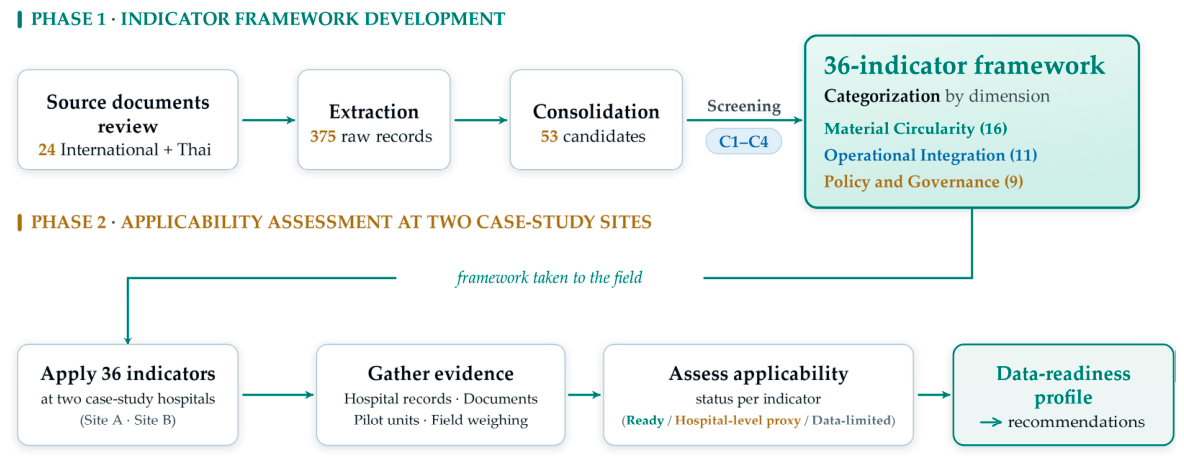
The study consisted of two phases (Figure 1). First, candidate indicators were developed through a structured review of source documents. The resulting set was then applied at two case-study hospitals to assess its applicability under existing data conditions, drawing on case-study logic [11], a prior Thai circular economy indicator study [12], and international indicator-classification practice [13,14]. The indicator-development phase followed a documented four-step funnel. The review covered 24 source documents in three groups: international CE frameworks and reporting standards; academic indicator typologies and healthcare or sector-specific guidance; and Thai policy and reporting instruments. Academic publications were retrieved from Scopus and ScienceDirect for the period 2014–2026, whereas the international frameworks, standards, sector guidance, and Thai documents, which are not indexed in these databases, were obtained in their current editions from the issuing organizations’ websites. The review yielded 375 initial indicator records. These were consolidated into 53 candidates through two procedures: scope filtering, which retained only records that could be measured and acted upon within a single hospital, and the merging of near-duplicates that measured the same construct for the same material flow.
Figure 1.
Two-phase research design: indicator development followed by applicability assessment at two case-study hospitals.
The 53 candidates were then screened against four criteria adapted from guidance on CE indicator selection provided by the United Nations Economic Commission for Europe and the Organisation for Economic Co-operation and Development (UNECE/OECD) and by Saidani et al. [15,16], together with the healthcare-waste indicator precedent of Barbosa and Mol [8]: C1, relevance to CE and NIMP management; C2, data feasibility in principle through routine hospital records; C3, alignment with Thai policy or a recognized international framework; and C4, usefulness for a hospital management decision. A candidate was retained only if it met all four criteria. The candidate indicators were adapted from published frameworks, standards, and peer-reviewed studies, and the screening decision for each candidate was recorded against these criteria. Of the 53 candidates, 36 were retained (Table S1), and 17 were excluded. Each retained indicator was then categorized into one of three framework dimensions: Material Circularity, Operational Integration, and Policy and Governance.
2.2. Case-Study Sites and Field Pilot
Two tertiary hospitals were purposively selected to assess the framework’s applicability in contrasting operational contexts: a large public tertiary hospital in Bangkok (Site A) and a regional tertiary hospital in a northern province of Thailand (Site B). The hospitals are referred to as Sites A and B to protect institutional confidentiality. Pilot wards were selected by intensity sampling [17], targeting ward types expected to generate relatively large NIMP flows: three wards at Site A (an operating room, a hemodialysis unit, and an inpatient ward) and eight units at Site B. Each site was observed twice, with at least one week between rounds, to capture more than one recycler collection opportunity [18,19]. The field protocol drew on healthcare-waste audit methods reported in the international literature [4,8,20]. Weighing was aligned with each hospital’s recycler collection cycle over a two-week field period. At Site B, mass was recorded on ten working or collection days within the 14-calendar-day field window. To maintain a common basis, pilot-scope masses at both sites were annualized from the same 14-day observation window by scaling the field mass to a 30-day month and then to a 12-month year.
All 36 indicators were applied at each site. Ready indicated that NIMP-specific evidence was available to calculate or score the indicator; Hospital-level proxy indicated that a verified hospital-level record was available but did not isolate NIMP; and Data-limited indicated that the evidence required by the indicator was unavailable to the study. These statuses follow the tier-classification logic of the Inter-agency and Expert Group on SDG Indicators (IAEG-SDGs) [13] and the indirect (proxy) indicator type of the United Nations Environment Programme (UNEP) [14]. Applicability status reflects measurement availability and should not be interpreted as a CE performance score or a ranking of the two hospitals. The study was non-interventional and used no patient-level data. All hospital evidence consisted of aggregated operational data, and infection-control rules took precedence whenever they restricted access to a waste stream.
3. Results and Discussion
3.1. The Proposed Indicator Set
Each of the 36 indicators is categorized into three dimensions: Material Circularity (MC, 16 indicators), Operational Integration (OI, 11), and Policy and Governance (PG, nine) (Table 1). The full list of the 36 indicators is given in Table S1. The framework is intended as a set of single measurements rather than a composite CE score or performance rating. Ranked CE performance indicators for healthcare supply chains using expert weighting have been proposed [9], whereas the present framework links each indicator to data fields that hospitals either already maintain or could develop.
Table 1.
Proposed NIMP circular economy indicator framework by dimension.
3.2. Indicator Applicability and Field Results at the Two Sites
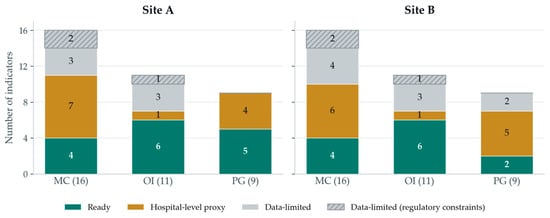
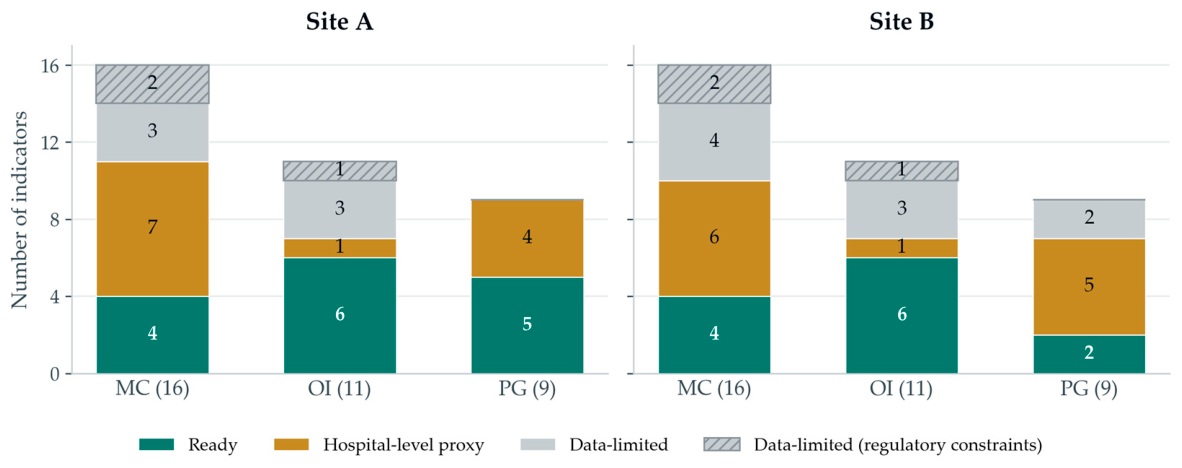
Figure 2 summarizes applicability status by dimension at the two sites. At Site A, 27 indicators were represented as a value or proxy (15 Ready and 12 Hospital-level proxy), while nine were Data-limited. At Site B, 24 indicators were represented as a value or proxy (12 Ready and 12 Hospital-level proxy), while 12 indicators were Data-limited. Across the two sites, 27 of the 36 indicators were represented as a value or proxy, and nine indicators were data-limited at both. Despite differences in record systems and recycler collection routines, the two sites showed largely similar applicability profiles.
Figure 2.
Indicator applicability profiles by dimension at Sites A and B. The profiles describe data readiness rather than CE performance. Data-limited (regulatory constraints) identifies indicators whose required observations could not be conducted within the approved study protocol and applicable infection-control requirements.
Three indicators (the NIMP misclassification loss rate, residual NIMP in infectious-waste bags, and segregation compliance in focal units) were data-limited at both sites because of regulatory constraints. For these indicators, the required observations could not be conducted within the approved study protocol and applicable infection-control requirements.
The similarities between the two sites mainly reflect the applicability at the hospital level. Both sites maintained a routine waste segregation system and recycling, procurement, and compliance records for operational control, financial transactions, and regulatory reporting, but these records are not designed as material-accounting systems for NIMP. Indicators requiring a NIMP-specific numerator, such as the share of NIMP in total healthcare waste or the NIMP recycling capture rate, therefore could not be calculated from these records. Several indicators were data-limited because the required records were unavailable or the relevant observations were restricted by the study protocol or applicable regulations.
A field pilot conducted at the two sites provided quantitative measurements for the proposed indicators. The pilots covered three wards at Site A and eight units at Site B. The results showed a total sorted NIMP weight of 2669.5 kg/year at Site A and 22,065.3 kg/year at Site B; of these totals, 1862.3 kg/year (70%) and 19,255.2 kg/year (87%), respectively, were sold to the contracted recycler, leaving 807.2 kg/year (30%) and 2810.1 kg/year (13%) unsold at each site.
3.3. Limitations
The study proposed and applied a set of indicators based on routine healthcare records. The set was applied at two hospitals that were ready to participate, and ward selection depended on the readiness of each hospital’s staff. The findings therefore support conclusions about measurement applicability and pilot-scope material flows, not comparative hospital performance. Such a comparison would require more hospitals and indicator values normalized to matched wards and functional boundaries. The indicators were derived from a structured review rather than a systematic review, and future studies could combine a systematic review with expert validation. Further application of these indicators across multiple levels of the healthcare sector is recommended.
4. Conclusions
This study developed a hospital-level circular economy indicator framework for NIMP and applied it at two Thai case-study hospitals. A 36-indicator framework is proposed for routine use, covering Material Circularity, Operational Integration, and Policy and Governance. Routine hospital information systems do not yet identify NIMP as a distinct material stream. Of the 36 indicators, 27 were represented as a value or proxy at Site A and 24 at Site B, whereas nine were data-limited at both sites. Despite their different record systems, the two sites showed a consistent applicability pattern, with field-measured material and document-based governance indicators measurable directly, whereas indicators requiring NIMP-specific data were limited to proxies or unavailable evidence. Further study should test the indicators across hospital types and sizes, improve routine NIMP coding, strengthen links between procurement and waste records, verify downstream destinations, and quantify environmental and economic benefits to healthcare sectors.
Supplementary Materials
The following supporting information can be downloaded at https://www.mdpi.com/article/10.3390/proceedings2026151003/s1. Table S1: The 36 proposed indicators.
Author Contributions
Conceptualization, P.C. and W.N.; methodology, P.C. and W.N.; investigation, P.C. and W.N.; formal analysis, P.C.; writing—original draft preparation, P.C.; writing—review and editing, W.N., A.D., and S.K.; supervision, W.N., A.D., and S.K. All authors have read and agreed to the published version of the manuscript.
Funding
This research was funded by the Thailand Science Research and Innovation Fund, Chulalongkorn University (BCG_FF_69_114_5400_005).
Institutional Review Board Statement
Not applicable. The study was non-interventional and used no patient-level data.
Informed Consent Statement
Not applicable.
Data Availability Statement
The data are not publicly available because of hospital confidentiality agreements and the de-identification requirements of the study.
Conflicts of Interest
The authors declare no conflicts of interest.
Abbreviations
The following abbreviations are used in this manuscript:
| CE | Circular economy |
| IAEG-SDGs | Inter-agency and Expert Group on SDG Indicators |
| MC | Material circularity |
| NIMP | Non-infectious medical plastics |
| OECD | Organisation for Economic Co-operation and Development |
| OI | Operational integration |
| PG | Policy and governance |
| SDG | Sustainable Development Goal |
| UNECE | United Nations Economic Commission for Europe |
| UNEP | United Nations Environment Programme |
References
- World Health Organization. Global Analysis of Health Care Waste in the Context of COVID-19: Status, Impacts and Recommendations; WHO: Geneva, Switzerland, 2022. [Google Scholar]
- Organisation for Economic Co-operation and Development. Global Plastics Outlook: Economic Drivers, Environmental Impacts and Policy Options; OECD Publishing: Paris, France, 2022. [Google Scholar] [CrossRef] [Scilit]
- Health Care Without Harm; Arup. Health Care’s Climate Footprint: How the Health Sector Contributes to the Global Climate Crisis and Opportunities for Action; Health Care Without Harm: Reston, VA, USA, 2019. [Google Scholar]
- Healthcare Plastics Recycling Council. Circularity for Healthcare Plastics: The Challenges and Opportunities (White Paper). Available online: https://www.hprc.org/circularity-for-healthcare-plastics/ (accessed on 4 June 2026).
- World Health Organization. Health-Care Waste (Fact Sheet); WHO: Geneva, Switzerland, 2024. [Google Scholar]
- Health Care Without Harm Europe. Measuring and Reducing Plastics in the Healthcare Sector; HCWH Europe: Brussels, Belgium, 2021. [Google Scholar]
- Ellen MacArthur Foundation. Circularity Indicators: An Approach to Measuring Circularity; Ellen MacArthur Foundation: Cowes, UK, 2015. [Google Scholar]
- Barbosa, F.C.L.; Mol, M.P.G. Proposal of indicators for healthcare waste management: Case of a Brazilian public institution. Waste Manag. Res. 2018, 36, 934–941. [Google Scholar] [CrossRef] [Scilit] [PubMed]
- Alfina, K.N.; Ratnayake, R.M.C.; Wibisono, D.; Basri, M.H.; Mulyono, N.B. Prioritizing performance indicators for the circular economy transition in healthcare supply chains. Circ. Econ. Sustain. 2025, 5, 231–276. [Google Scholar] [CrossRef] [Scilit]
- Pollution Control Department. Thailand’s Roadmap on Plastic Waste Management 2018–2030; Ministry of Natural Resources and Environment: Bangkok, Thailand, 2018.
- Yin, R.K. Case Study Research and Applications: Design and Methods, 6th ed.; SAGE Publications: Thousand Oaks, CA, USA, 2018. [Google Scholar]
- Niyommaneerat, W.; Suwanteep, K.; Chavalparit, O. Sustainability indicators to achieve a circular economy: A case study of renewable energy and plastic waste recycling corporate social responsibility (CSR) projects in Thailand. J. Clean. Prod. 2023, 391, 136203. [Google Scholar] [CrossRef] [Scilit]
- Inter-Agency and Expert Group on SDG Indicators. Tier Classification for Global SDG Indicators (4 December 2024 Version); United Nations Statistical Commission: New York, NY, USA, 2024. [Google Scholar]
- United Nations Environment Programme. Indicators for circular economy. In Asian Circular Economy for Tertiary Education; UNEP: Nairobi, Kenya, 2019; pp. 111–149. [Google Scholar]
- United Nations Economic Commission for Europe; Organisation for Economic Co-operation and Development. Guidelines for Measuring Circular Economy: Part A. Conceptual Framework, Indicators and Measurement Framework; (ECE/CES/STAT/2023/5); United Nations: Geneva, Switzerland, 2024. [Google Scholar]
- Saidani, M.; Yannou, B.; Leroy, Y.; Cluzel, F.; Kendall, A. A taxonomy of circular economy indicators. J. Clean. Prod. 2019, 207, 542–559. [Google Scholar] [CrossRef] [Scilit]
- Patton, M.Q. Qualitative Research and Evaluation Methods: Integrating Theory and Practice, 4th ed.; SAGE Publications: Thousand Oaks, CA, USA, 2015. [Google Scholar]
- ASTM D5231-92(2016); Standard Test Method for Determination of the Composition of Unprocessed Municipal Solid Waste. ASTM International: West Conshohocken, PA, USA, 2016.
- Slutzman, J.E.; Bockius, H.; Gordon, I.O.; Greene, H.C.; Hsu, S.; Huang, Y.; Lam, M.H.; Roberts, T.; Thiel, C.L. Waste audits in healthcare: A systematic review and description of best practices. Waste Manag. Res. 2023, 41, 3–17. [Google Scholar] [CrossRef] [Scilit] [PubMed]
- World Health Organization. Safe Management of Wastes from Health-Care Activities, 2nd ed.; WHO: Geneva, Switzerland, 2014. [Google Scholar]

Disclaimer/Publisher’s Note: The statements, opinions and data contained in all publications are solely those of the individual author(s) and contributor(s) and not of MDPI and/or the editor(s). MDPI and/or the editor(s) disclaim responsibility for any injury to people or property resulting from any ideas, methods, instructions or products referred to in the content. |
© 2026 by the authors. Licensee MDPI, Basel, Switzerland. This article is an open access article distributed under the terms and conditions of the Creative Commons Attribution (CC BY) license.