


Abstract
Code similarity tools are widely used in programming courses to support academic integrity, yet fixed percentage cut-offs are often applied without considering how score distributions vary across assignments, academic years, and detection tools. This study examines similarity patterns over three academic years (2023/2024–2025/2026) using two programming assignments and two detection tools. For each assignment-year-tool combination, we analysed empirical pairwise score distributions using central, dispersion, threshold-based, and upper-tail indicators. Because submissions occur in multiple pairs, we also performed a submission-level robustness analysis using per-submission mean, median, and maximum similarity. Assignment A1 showed descriptively higher central similarity in later academic years, and this pattern remained visible at the submission level, whereas Assignment A2 showed smaller year-to-year differences, particularly for JPlagJava. Maximum scores decreased across years for both tools, but broader upper-tail indicators decreased for JPlagJava and showed mixed patterns for SIMGruneJava. These differences are interpreted descriptively rather than as statistically established temporal changes. The findings support a context-aware, distribution-based interpretation of similarity scores rather than reliance on a single fixed threshold, accounting for assignment characteristics, year-to-year patterns, and tool-specific behaviour.
1. Introduction
Programming assignments are an important part of computing education because they provide direct evidence of students’ ability to design, implement, test, and reason about software solutions. At the same time, they create recurring challenges for teachers, especially in courses with a large number of students or complex assignments. In such cases, source-code similarity detection tools, often referred to as plagiarism detection tools, are commonly used to ensure academic integrity. Their role is not to prove plagiarism automatically, but to identify pairs or groups of submissions that require further inspection by the teacher.
Previous review papers [1,2] have established source-code similarity detection as a mature research area and have identified tools such as JPlag [3], MOSS [4], or SIM-Grune [5] among the commonly discussed systems in the academic environment. These reviews also note that these tools report similarity, while the final interpretation of plagiarism remains a human and contextual decision.
When such tools are used to generate reports, similarity thresholds are commonly applied as an initial screening mechanism. However, recent work [6] has emphasised that selecting an appropriate threshold is itself a non-trivial problem and should be informed by the distribution of similarity scores for a given assignment. This is important because assignments with constrained structures or expected solution patterns may naturally produce higher baseline similarity. In addition, different tools may produce different score distributions because of differences in their underlying detection mechanisms.
The problem of identifying suspicious cases has been approached from different perspectives. Cheers et al. [7] examine suspicious submissions through consensus across multiple detection tools, whereas Permatasari et al. [6] propose an assignment-specific threshold-selection method using Tukey’s IQR fences. Although such studies indicate that threshold use requires contextual interpretation, their focus remains primarily on identifying suspicious cases or selecting cut-offs for a given assignment.
In contrast, this study does not seek an optimal plagiarism threshold or evaluate detection accuracy against a labelled dataset. Instead, it examines how similarity-score distributions vary across academic years, assignments, and tools. Zuzarte-Reis et al. [8] recently used a related distribution-oriented approach across three introductory programming assignments. The present study extends this perspective to two advanced programming assignments, three academic years, and two detection tools. Accordingly, the study is framed as a three-year case study comparing successive student groups within one educational context. The observed year-to-year differences are therefore interpreted within this specific educational context rather than as evidence of a general temporal trend across programming education.
The need to interpret similarity scores in context is further reinforced by student access to generative AI tools, which represent one possible factor that may contribute to convergence in code patterns alongside other educational and collaborative influences. Recent work [8,9,10,11] has questioned whether syntactically correct and apparently original submitted code can always be interpreted as strong evidence of independent learning.
The goal of this study is therefore to compare similarity-score distributions across academic years and examine descriptive year-to-year differences that may affect how similarity results are interpreted. The study examines distributional indicators that capture typical similarity levels, variability, and upper-tail behaviour. This makes it possible to distinguish broader differences in similarity distributions from patterns concentrated mainly in a small number of extreme high-similarity cases.
2. Materials and Methods
This study analyses two Java programming assignments, A1 and A2, across three academic years (2023/2024–2025/2026) in an advanced graduate-level programming course. Students had completed several prior programming courses. The dataset contained 52, 59, and 55 A1 submissions and 52, 56, and 54 A2 submissions across the three years, yielding 1326–1711 pairwise comparisons per assignment-year group and tool.
Both assignments were complex Java command-line applications involving structured input processing, validation, internal object modelling, interactive command execution, and formatted textual output. They also imposed architectural and implementation constraints, including selected GoF design patterns, Maven-based executable packaging, restrictions on external libraries, and limits on method and line length. Assignment A2 extended A1 with additional data sources, time-dependent processing, a larger command set, and further design-pattern requirements, making it broader and more structurally constrained. Therefore, A1 and A2 were analysed separately before comparing broader patterns across assignments and tools.
The analysed data consisted of anonymised pairwise similarity scores exported from the two similarity detection tools, together with identifiers for the two submissions forming each unordered pair. These identifiers were used to reconstruct the pairwise structure, calculate submission-level summaries, match pairs across tools, and identify students appearing in more than one academic year. Each record contained the detection tool, assignment, academic year, the anonymised identifiers of the two submissions, and the similarity percentage. For each assignment-year-tool combination, the similarity scores were analysed as a separate empirical distribution. Pairs with 0% similarity in SIMGruneJava were also included in all analyses.
2.1. Similarity Detection Tools
The two similarity detection tools were JPlag (v 2.12.1) (URL https://github.com/jplag/jplag, accessed on 12 May 2026) for Java (referred to as JPlagJava) and SIM-Grune (v3.0.1) (URL https://dickgrune.com/Programs/similarity_tester/, accessed on 12 May 2026) for Java (referred to as SIMGruneJava). Both tools were applied to the same Java submissions. Their scores were not treated as directly interchangeable. The purpose of using two tools was to examine whether similar distributional patterns could be observed from different measurement perspectives, rather than to determine which tool was more accurate.
2.2. Distribution-Based Analysis
The analysis was descriptive and distribution-based. For each assignment-year-tool combination, we examined measures of central tendency, dispersion, and upper-tail behaviour. The median was used as the main indicator of typical similarity, while the mean was retained as a complementary measure sensitive to changes in the upper part of the distribution. The first and third quartiles were used to examine whether differences involved a broader part of the pairwise score distribution rather than only the highest-scoring pairs. The standard deviation and interquartile range were used to describe variability. Finally, the 99th percentile and maximum were used to examine extreme or near-extreme values.
In addition to the standard descriptive indicators, three supplementary distributional summaries were calculated. First, empirical cumulative distribution function (ECDF) analysis was used as a supplementary visual check to examine the cumulative structure of each score distribution and to assess whether year-to-year differences appeared across broader parts of the distribution or only near the upper tail. The ECDFs were used to support the interpretation of descriptive indicators and box-plots rather than as a separate primary result. The corresponding ECDFs are provided in Supplementary Figures S4–S7.
Second, threshold-based indicators were used to calculate the percentage of pairwise similarity scores at or above selected fixed cut-offs (20%, 30%, 40%, and 50%). These cut-offs were selected as evenly spaced practical reference points spanning moderate to higher similarity values and were used to summarise how different parts of the score distribution changed across assignment-year groups. They were not selected as empirically optimal cut-offs and should not be interpreted as formal plagiarism thresholds. To assess whether the interpretation depended on these particular values, a sensitivity analysis was additionally performed using thresholds from 15% to 50% in five-percentage-point increments; the results are reported in Supplementary Tables S3 and S4.
Third, the 100 highest similarity scores were extracted for each assignment-year-tool distribution and summarised using their mean, median, minimum, and maximum. This upper-tail analysis was used to distinguish isolated maximum values from broader concentration of high similarity scores. Detailed top-100 results are provided in Supplementary Table S5. Because group sizes differed, the top 100 pairs represented approximately 5.8–7.5% of each distribution; this analysis was therefore treated as a complementary descriptive examination of the upper tail rather than as a comparison of an identical percentile range across groups, and was interpreted alongside the fixed-percentile and threshold summaries.
This approach was chosen because maximum values, central indicators, and upper-tail measures can imply different practical responses. A high maximum may indicate isolated high-scoring pairs, whereas higher median and first-quartile values indicate that elevated similarity extends across a broader part of the distribution.
The analysis proceeded in three steps. First, each assignment was analysed across the three academic years separately for each tool. Second, the results of JPlagJava and SIMGruneJava were compared to identify whether the two tools supported the same general interpretation. Third, central indicators were compared with upper-tail indicators to determine whether year-to-year differences were visible across broader parts of the distribution or concentrated in isolated extreme cases.
2.3. Submission-Level Robustness Analysis
Because each submission appears in multiple pairs, the pairwise distributions were interpreted descriptively and supplemented with submission-level summaries. For each submission, the mean, median, and maximum similarity to the other submissions in the same assignment-year group were calculated. These summaries describe typical and strongest similarity involving each submission, but remain dependent because submissions share pairwise scores. They were therefore not used for conventional independent-sample inference. Complete statistics are reported in Supplementary Table S1.
A sensitivity analysis identified students appearing in more than one academic year separately for A1 and A2. For each assignment, these students and all pairs involving them were excluded before recalculating the submission-level metrics. The retained sample sizes were 48, 51, and 51 for A1 and 47, 49, and 52 for A2 across the three academic years, respectively. Results are reported in Supplementary Table S2.
2.4. Cross-Tool Association Analysis
Cross-tool correspondence was assessed separately for each assignment-year group using Spearman’s rank correlation between scores for matched unordered submission pairs, with average ranks assigned to ties. Statistical significance was assessed using a two-sided Quadratic Assignment Procedure (QAP) test with 9999 node-label permutations [12]. In each permutation, the same permutation was applied jointly to the rows and columns of one similarity matrix, leaving the other matrix fixed. Self-comparisons were excluded and each unordered pair was counted once. The permutation p-value was calculated as , where b is the number of permuted correlations at least as large in absolute value as the observed correlation. This analysis tests cross-tool rank association, not absolute agreement or differences between academic years. The six assignment-year-specific QAP tests were treated as exploratory analyses, and no formal adjustment for multiple testing was applied; the resulting p-values are therefore interpreted descriptively alongside the corresponding Spearman’s values. Results are reported in Supplementary Table S6 and Figure S8.
2.5. Limitations
The study should be interpreted within several constraints. Although the submission-level analysis reduces the dependence inherent in the pairwise score distributions, it does not eliminate it because submissions still share pairwise scores. It does not classify individual code pairs as plagiarism, acceptable similarity, AI-assisted work, or independent work, and the instructors’ observations are contextual rather than formal qualitative evidence. Therefore, the causes of the observed patterns cannot be established. The study covers one educational context, two related Java assignments, and three academic years. Because A2 extends A1 and includes additional structural constraints, the findings should be interpreted within this three-year case study rather than generalised to programming education as a whole. Finally, the two tools were used as complementary measurement perspectives rather than evaluated for detection accuracy.
3. Results
Table 1 and Table 2 summarise the descriptive similarity indicators. For Assignment A1, the observed central similarity values were higher in the later academic years, with the largest difference observed in 2025/2026. Assignment A2 showed higher central values from the first observed year and comparatively smaller year-to-year differences. In both assignments, lower maximum values were observed in the later academic years. These patterns are descriptive and are not interpreted as statistically established temporal changes. The corresponding pairwise similarity-score distributions are shown in Supplementary Figure S1, with ECDFs provided in Supplementary Figures S4–S7.
Table 1.
Descriptive similarity indicators for Assignment A1.
Table 2.
Descriptive similarity indicators for Assignment A2.
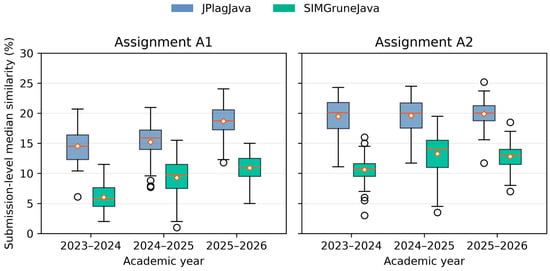
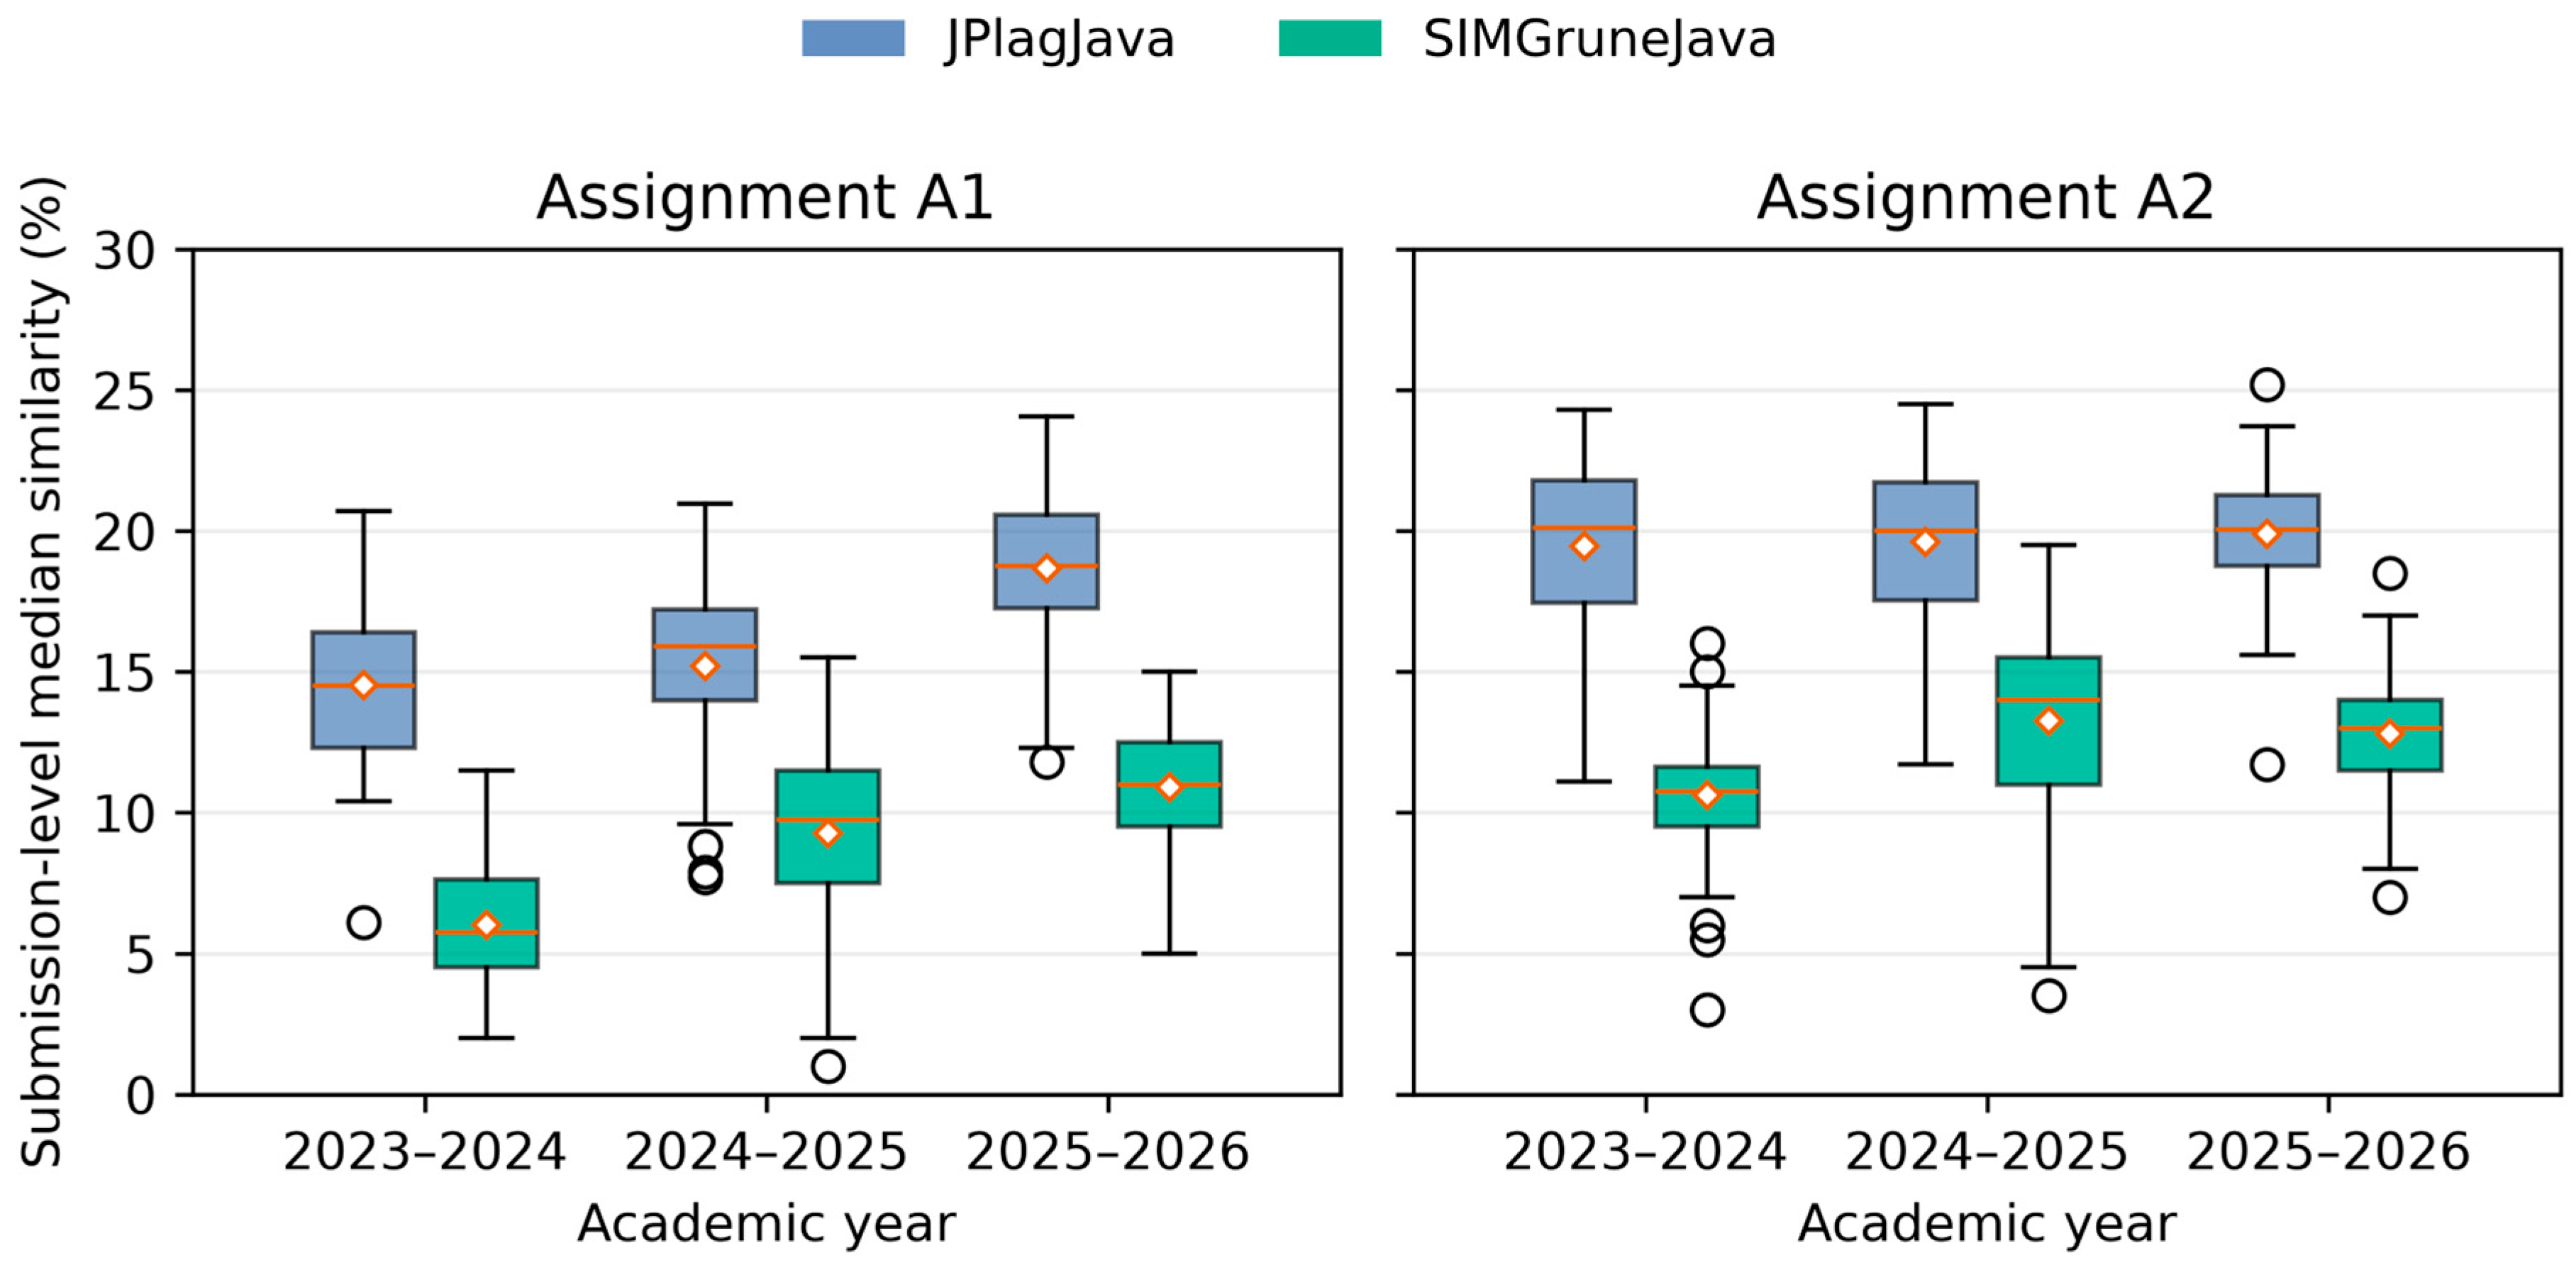
Figure 1 shows the distributions of per-submission median similarity across academic years for both assignments and detection tools. Complete submission-level statistics are provided in Supplementary Table S1. Supplementary Table S2 reports the sensitivity analysis excluding students who appeared in more than one academic year within the same assignment.
Figure 1.
Distribution of per-submission median similarity by assignment, tool, and academic year. Boxes show the interquartile range, horizontal lines indicate medians, and diamonds indicate means. Whiskers extend to the most extreme observations within 1.5 interquartile ranges of the box; circles indicate observations beyond the whiskers.
For A1, the median of the per-submission median similarities was 14.50%, 15.90%, and 18.75% for JPlagJava and 5.75%, 9.75%, and 11.00% for SIMGruneJava across the three academic years. For A2, JPlagJava showed little year-to-year difference (20.10%, 20.00%, and 20.05%), whereas SIMGruneJava showed higher values in the later years without a monotonic pattern (10.75%, 14.00%, and 13.00%). Excluding students who appeared in multiple years within each assignment preserved the descriptive increase for A1 and the absence of a monotonic increase for A2 (Supplementary Table S2). Per-submission maximum similarities decreased monotonically in their median for JPlagJava but not for SIMGruneJava. Distributions of per-submission means and maxima are presented in Supplementary Figures S2 and S3.
Table 3 shows the percentage of pairwise similarity scores at or above selected fixed thresholds. For Assignment A1, JPlagJava shows a higher share of scores at or above 20% in 2025/2026, while the shares at or above the higher thresholds were lower in the later academic years.
Table 3.
Percentage of pairwise similarity scores at or above selected fixed thresholds.
Across thresholds from 15% to 50%, JPlagJava showed increasing proportions of pairs at or above the 15% and 20% cut-offs across the three years for both assignments, alongside lower proportions at higher cut-offs. SIMGruneJava showed more mixed patterns, including higher proportions at several cut-offs in 2024/2025 (Supplementary Tables S3 and S4). The top-100 mean and median decreased across years for JPlagJava in both assignments, whereas SIMGruneJava showed an increase followed by a decrease. For A2/SIMGruneJava, both top-100 measures remained higher in 2025/2026 than in 2023/2024 despite the lower maximum (Supplementary Table S5). Thus, declining maxima did not imply a uniform reduction throughout the upper tail.
Cross-tool analysis showed positive rank association in all six assignment-year groups, with Spearman’s ranging from 0.517 to 0.689 and all two-sided QAP permutation tests yielding . Pairs receiving relatively higher scores from one tool therefore tended to receive relatively higher scores from the other, although their rankings were not identical. These associations do not establish absolute score agreement or the interchangeability of thresholds. Complete results are provided in Supplementary Table S6 and Figure S8.
4. Discussion
The results show two related but distinct descriptive patterns. Assignment A1 showed higher central similarity in the later academic years across both tools, whereas Assignment A2 started from higher values and showed smaller year-to-year differences, particularly for JPlagJava. The same broad distinction remained visible in the submission-level analysis, but these comparisons do not establish a temporal trend in a wider population. Maximum scores decreased across years for both assignments and tools. However, the upper tail behaved differently across tools: JPlagJava showed decreasing top-100 means and medians, whereas SIMGruneJava showed non-monotonic patterns. The results therefore distinguish changes in typical similarity, broader upper-tail behaviour, and isolated extreme values.
The comparison of JPlagJava and SIMGruneJava shows that similarity scores are tool-dependent, which is consistent with previous research on source-code similarity detection tools. JPlagJava generally produced higher central values than SIMGruneJava, so the same numerical threshold should not be transferred directly between tools. The matched-pair analysis nevertheless showed positive rank correspondence across all assignment-year groups, with Spearman’s ranging from 0.517 to 0.689 and all QAP permutation tests yielding . This indicates that the two tools tended to rank relatively high- and low-similarity pairs in a broadly consistent manner, despite producing different absolute score levels. Therefore, tool outputs can support comparative and contextual interpretation, but should not be treated as interchangeable absolute measures.
From an assessment perspective, the divergence between central similarity and maximum scores shows why neither indicator should be interpreted alone. Higher typical similarity and lower maxima describe different features of the submitted code and do not, by themselves, establish changes in plagiarism, student understanding, or code ownership. Similarity detection should therefore be integrated with assessment elements that check understanding and ownership, such as explaining design decisions, tracing program execution, modifying selected code, justifying libraries or design patterns, or repairing targeted defects.
The observed pattern is also relevant in the current context of AI-assisted programming. Generative AI represents only one possible contextual hypothesis: the study contains no direct evidence of AI use and cannot distinguish it from alternative explanations such as differences between student groups, teaching practices, available examples or repositories, collaboration, or changes in assignment approach [8,9].
Separate from the quantitative analysis, instructors noted contextual observations during manual assessment and oral defence, including similarities in programming style, naming, and code organisation, and cases in which students had difficulty explaining or modifying submitted code. These observations were not collected using a predefined qualitative protocol and are not used as confirmatory evidence or to explain the causes of the quantitative patterns.
5. Conclusions
This study analysed similarity-score distributions across three academic years, two Java programming assignments, and two detection tools. Assignment A1 showed descriptively higher typical similarity in the later academic years, a pattern also visible at the submission level, whereas Assignment A2 showed smaller year-to-year differences, particularly for JPlagJava. Maximum scores decreased across years for both assignments and tools, but broader upper-tail patterns differed: JPlagJava showed decreasing top-100 means and medians, whereas SIMGruneJava showed non-monotonic patterns. The supplementary analyses therefore support distinguishing typical similarity from isolated maxima and broader upper-tail behaviour. Comparisons between academic years remain descriptive rather than statistically established temporal changes.
The main conclusion is that similarity scores should be interpreted distributionally and contextually rather than through fixed thresholds alone. Cross-tool analysis showed positive rank correspondence, but differences in absolute score levels indicate that thresholds should not be transferred directly between tools. Within this three-year case study, the findings illustrate how similarity patterns differed across successive student groups, assignments, academic years, and detection tools and should not be generalised to programming education as a whole.
Similarity detection should therefore be combined with assessment practices that examine student understanding and ownership of submitted code. The observed patterns do not provide evidence that generative AI caused the year-to-year differences. Future research should examine other assignments, courses, institutions, and detection tools and combine similarity measures with direct evidence of student workflow and understanding.
Supplementary Materials
The following supporting information can be downloaded at https://www.mdpi.com/article/10.3390/proceedings2026145021/s1, Figure S1: Pairwise similarity score distributions across academic years, assignments, and tools; Table S1: Complete submission-level descriptive statistics; Table S2: Complete submission-level descriptive statistics excluding repeated students (sensitivity analysis); Figure S2: Submission-level mean similarity across academic years, assignments, and tools; Figure S3: Submission-level maximum similarity across academic years, assignments, and tools; Figure S4: Empirical cumulative distribution functions for Assignment A1 using JPlagJava; Figure S5: Empirical cumulative distribution functions for Assignment A1 using SIMGruneJava; Figure S6: Empirical cumulative distribution functions for Assignment A2 using JPlagJava; Figure S7: Empirical cumulative distribution functions for Assignment A2 using SIMGruneJava; Table S3: Threshold sensitivity analysis of pairwise similarity scores for A1; Table S4: Threshold sensitivity analysis of pairwise similarity scores for A2; Table S5: Top-100 similarity score analysis; Table S6: Cross-tool rank association between JPlagJava and SIMGruneJava; Figure S8: Association between JPlagJava and SIMGruneJava pairwise similarity scores across assignments and academic years.
Author Contributions
Conceptualization, M.N. and D.K.; methodology, M.N. and D.K.; software, M.N.; validation, M.N., D.K. and M.M.; formal analysis, M.N.; investigation, M.N., M.M. and D.K.; resources, M.N. and M.M.; data curation, M.N. and D.K.; writing-original draft preparation, M.N.; writing-review and editing, D.K. and M.M.; visualization, M.N.; supervision, D.K.; project administration, M.N.; funding acquisition, M.N. All authors have read and agreed to the published version of the manuscript.
Funding
This work was supported by the Croatian Science Foundation under the project number IP-2025-02-4117 and by the National Recovery and Resilience Plan 2021–2026, Institutional Research Projects under the project PiPi: Data infrastructure and augmented intelligence for sustainable development.
Institutional Review Board Statement
The study was conducted in accordance with the Declaration of Helsinki and approved by the Ethics Committee of the University of Zagreb Faculty of Organization and Informatics (registry number: 2186-62-14-26-21, approved on 28 May 2026). The analysis was based on anonymised and aggregated data derived from student programming assignments and source-code similarity detection reports.
Informed Consent Statement
Informed consent was waived by the Ethics Committee of the University of Zagreb Faculty of Organization and Informatics because the study was based on anonymised and aggregated data derived from student programming assignments and source-code similarity detection reports, and no personally identifiable information is reported in this paper.
Data Availability Statement
The data supporting the findings of this study are not publicly available due to privacy and ethical restrictions related to student programming assignments and academic integrity procedures. The results are reported only in anonymised and aggregated form.
Acknowledgments
During the preparation of this manuscript, the authors used OpenAI ChatGPT (v GPT 5.5 Thinking medium model) for grammar checking, language editing, and assistance with debugging the analysis scripts. The authors have reviewed and edited the output and take full responsibility for the content of this publication.
Conflicts of Interest
The authors declare no conflicts of interest.
References
- Novak, M.; Joy, M.; Kermek, D. Source-code Similarity Detection and Detection Tools Used in Academia: A Systematic Review. ACM Trans. Comput. Educ. 2019, 19, 1–37. [Google Scholar] [CrossRef] [Scilit]
- Aniceto, R.C.; Holanda, M.; Castanho, C.; Da Silva, D. Source Code Plagiarism Detection in an Educational Context: A Literature Mapping. In Proceedings of the 2021 IEEE Frontiers in Education Conference (FIE); IEEE: Piscataway, NJ, USA, 2021; pp. 1–9. [Google Scholar] [CrossRef] [Scilit]
- Prechelt, L.; Malpohl, G.; Philippsen, M. Finding Plagiarisms among a Set of Programs with JPlag. J. Univers. Comput. Sci. 2002, 8, 1016–1038. [Google Scholar] [CrossRef]
- Schleimer, S.; Wilkerson, D.S.; Aiken, A. Winnowing: Local Algorithms for Document Fingerprinting. In Proceedings of the 2003 ACM SIGMOD International Conference on Management of Data; ACM: New York, NY, USA, 2003; pp. 76–85. [Google Scholar] [CrossRef] [Scilit]
- Grune, D.; Huntjens, M. Detecting Copied Submissions in Computer Science Workshops; Technical Report; Vrije Universiteit, Vakgroep Informatica: Amsterdam, The Netherlands, 1989. [Google Scholar]
- Permatasari, P.A.D.; Mentari, M.; Kinari, S.A.; Aung, S.T.; Funabiki, N.; Kyaw, H.H.S.; Wai, K.H. A Threshold Selection Method in Code Plagiarism Checking Function for Code Writing Problem in Java Programming Learning Assistant System Considering AI-Generated Codes. Analytics 2026, 5, 2. [Google Scholar] [CrossRef] [Scilit]
- Cheers, H.; Lin, Y. Identifying Plagiarised Programming Assignments Based on Source Code Similarity Scores. Comput. Sci. Educ. 2023, 33, 621–645. [Google Scholar] [CrossRef] [Scilit]
- Zuzarte Reis Claver, J.M.; Tajdini, M.; Verano Merino, M. The Clash of Codes: From Peer-to-Peer Duplication to AI-Generation in Introductory Programming Assignments. In Proceedings of the IEEE/ACM 48th International Conference on Software Engineering; ACM: New York, NY, USA, 2026; pp. 59–69. [Google Scholar] [CrossRef] [Scilit]
- Novak, M.; Maček, M. AI Tools in Programming Education: Student Perspectives and Usage Trends. J. Inf. Organ. Sci. 2026, 50, 83–104. [Google Scholar] [CrossRef] [Scilit]
- Prather, J.; Denny, P.; Leinonen, J.; Becker, B.A.; Albluwi, I.; Craig, M.; Keuning, H.; Kiesler, N.; Kohn, T.; Luxton-Reilly, A.; et al. The Robots Are Here: Navigating the Generative AI Revolution in Computing Education. In Proceedings of the 2023 Working Group Reports on Innovation and Technology in Computer Science Education, New York, NY, USA, 2023; ITiCSE-WGR ’23; ACM: New York, NY, USA, 2023; pp. 108–159. [Google Scholar] [CrossRef] [Scilit]
- Ellis, M.E.; Casey, K.M.; Hill, G. ChatGPT and Python Programming Homework. Decis. Sci. J. Innov. Educ. 2024, 22, 74–87. [Google Scholar] [CrossRef] [Scilit]
- Krackhardt, D. Predicting with Networks: Nonparametric Multiple Regression Analysis of Dyadic Data. Soc. Netw. 1988, 10, 359–381. [Google Scholar] [CrossRef] [Scilit]

Disclaimer/Publisher’s Note: The statements, opinions and data contained in all publications are solely those of the individual author(s) and contributor(s) and not of MDPI and/or the editor(s). MDPI and/or the editor(s) disclaim responsibility for any injury to people or property resulting from any ideas, methods, instructions or products referred to in the content. |
© 2026 by the authors. Licensee MDPI, Basel, Switzerland. This article is an open access article distributed under the terms and conditions of the Creative Commons Attribution (CC BY) license.