


Abstract
Background/Objectives: Chest radiographs contain hierarchical relationships between global thoracic configuration and organ-specific findings, together with scale-dependent anatomical boundary geometry and heterogeneous texture distributions. Coarse image–report alignment may overlook regional evidence, whereas isolated local alignment can fragment complete-examination semantics. We propose Anatomy-Guided Image–Report Alignment (AGIRA) for fine-grained chest X-ray (CXR) representation learning and investigate its behavior through post hoc finite-scale fractal and multifractal analysis. Methods: AGIRA constructs whole-image, left-lung, right-lung, and heart image–text pairs, adapts frozen vision and language backbones using lightweight Anatomy Sensors, and retains masked image and language reconstruction objectives to preserve global–local semantic continuity. Temporal–multiview fusion and hybrid soft labels reduce false-negative supervision. Post hoc analysis estimates effective box-counting dimensions, generalized dimensions, multifractal spectrum width, and a finite-scale attention concentration index. We additionally compare these descriptors with conventional intensity, texture, and uncertainty features using nested cross-validated incremental-value analyses. Results: AGIRA achieves 92.0% AUC, 84.2% accuracy, and 79.0% F1-score on RSNA Pneumonia, together with 57.5% zero-shot accuracy and 53.7% image-to-text P@5 on CheXpert 5 × 200, while updating only 7.54% of the complete model. On an independently annotated 600-unit report-routing set, the deterministic parser obtains macro-F1 0.953 and exact multi-label routing accuracy 0.918. Under the identical 34,080-record cohort, AGIRA remains above GLoRIA-ViT, MLIP, and BCC on all reported downstream metrics. Adding finite-scale descriptors to conventional intensity/texture/uncertainty features increases cross-validated AUROC for identifying anatomy-alignment-sensitive cases from 0.671 to 0.731 for zero-shot classification and from 0.651 to 0.704 for retrieval. Mild anatomical crop perturbations (±5%) change CheXpert P@5 and zero-shot accuracy by less than one percentage point, whereas severe 10% perturbations and explicit anatomy swaps cause progressively larger degradation. Conclusions: AGIRA improves cross-dataset benchmark transfer and retrieval while preserving parameter efficiency. The post hoc fractal/multifractal analysis contributes measurable incremental explanatory information about anatomy-alignment-sensitive model behavior beyond conventional descriptors without entering model training, and the added controlled experiments support parser reliability, cohort fairness, parameter robustness, and tolerance to moderate anatomical-localization noise.
1. Introduction
Chest X-ray (CXR) imaging is widely used for screening, diagnosis, and therapeutic evaluation of thoracic and cardiovascular disease [1]. Despite its ubiquity, high-quality CXR interpretation is inherently complex and relies heavily on specialized radiological expertise [2]. Beyond diagnostic variability and workload pressure [3,4], CXR interpretation is challenging because local findings in the lungs, pleura, and heart are embedded within the global thoracic configuration. Consequently, automated CXR interpretation with robust deep learning systems has become an important research objective in medical image analysis [1,5]. From a representation-learning perspective, this hierarchical structure requires a model to preserve complete examination-level context while also resolving organ-specific evidence.
Against this background, vision–language pretraining, prominently spearheaded by Contrastive Language-Image Pretraining (CLIP) [6], has transformed cross-modal representation learning from paired images and text. Medical CXR archives are particularly suitable because radiographs are naturally paired with reports, reducing dependence on dense manual labels. Nevertheless, the principal existing approaches leave distinct gaps. ConVIRT [7] is dominated by whole-image/whole-report supervision and therefore does not explicitly bind a finding to a predefined anatomical support. BioViL [8] improves domain-specific language semantics but likewise does not impose explicit left-lung, right-lung, and heart correspondence. CXR-CLIP [9] incorporates frontal–lateral information, but multiview supervision alone does not define anatomy-specific cross-modal targets. GLoRIA [10] introduces patch–word attention, yet its local units are learned implicitly rather than organized around radiological anatomical regions. Knowledge-guided systems can provide stronger clinical priors, but their entity extraction, linking, or graph construction introduces additional dependencies and potential parsing noise.
These limitations expose two complementary constraints. Exclusively global alignment can suppress fine-grained regional evidence and permit attention to drift toward globally correlated but anatomically irrelevant content; conversely, treating local crops and report fragments as independent training instances can weaken their relationship to the complete radiograph and full-report context. The methodological novelty of AGIRA is defined against these two constraints: explicit three-region anatomical correspondence is optimized jointly with examination-level alignment, while a frozen MIM/MLM-pretrained backbone and retained reconstruction objectives regularize the adapted representation so that local specialization does not replace global semantics. Temporal–multiview fusion and hybrid soft labels address a separate source of error—clinically related observations that would otherwise be treated as strict negatives.
Figure 1 summarizes these two representation-learning constraints and the corresponding motivation for AGIRA.
Figure 1.
Motivation of AGIRA for hierarchical global–local chest X-ray vision–language learning. (a) Coarse global image–report alignment may cause anatomical semantic mismatch and attention drift because the model receives only examination-level supervision. (b) Naively decomposing images and reports into isolated local units may break the relationship between the complete image and anatomical regions, as well as the contextual dependency between the full report and local report fragments.
To systematically resolve these bottlenecks, we propose Anatomy-Guided Image–Report Alignment (AGIRA), a hierarchical global–local framework that integrates anatomical priors into CXR vision–language representation learning. AGIRA uses anatomical masks and clinically grounded report-parsing rules to construct explicit anatomy-level supervision for the left lung, right lung, and heart. Lightweight Anatomy Sensors adapt a frozen pretrained backbone, while auxiliary MIM/MLM reconstruction objectives preserve global–local semantic continuity. Temporal–multiview radiograph features and hybrid soft labels further reduce false-negative supervision caused by clinically related but unpaired studies.
The fractal component has a deliberately different role from the trainable AGIRA components. It is used only after training as an independent multiscale audit. This separation is important for two reasons. First, optimizing the model directly toward the same fractal quantities later used to assess descriptor–embedding agreement would make that agreement partly circular. Second, finite-resolution fractal estimates are sensitive to rasterization, mask boundaries, and the selected scale window; using them as training targets would introduce a scale-dependent optimization signal that is not required by the core cross-modal objective. We therefore do not claim that fractal quantities improve AGIRA optimization. Instead, we test whether they provide incremental explanatory value beyond conventional intensity statistics, fixed-neighborhood texture, and predictive uncertainty. Specifically, nested cross-validated models are used to determine whether finite-scale descriptors improve identification of cases in which anatomy-aware alignment changes classification or retrieval behavior after the conventional variables have already been supplied. This converts the fractal component from a purely descriptive add-on into a falsifiable post hoc diagnostic contribution while preserving its independence from training.
For a bounded set S, the slope of against estimates an effective box-counting dimension over the resolved scale interval. When normalized gradient energy is treated as a spatial measure, the generalized dimensions and singularity spectrum characterize how sparse and dense texture components redistribute across scale, while summarizes spectrum width [11,12,13]. These quantities are interpreted as finite-scale descriptors rather than evidence of exact self-similarity [14]. Boundary geometry is measured on the union of the left-lung, right-lung, and heart masks and on each organ contour, whereas texture is measured separately on the complete image and on anatomy-conditioned supports. The analyses ask three restricted questions: whether multiscale heterogeneity is associated with downstream behavior, whether local descriptor distances show weak but reproducible concordance with embedding distances, and whether multiscale attention concentration agrees with lesion-localization metrics. Thus, the fractal analysis complements rather than participates in representation learning.
The contributions are as follows:
- We introduce AGIRA, a hierarchical whole-image/anatomy-level CXR vision–language framework that combines explicit anatomical correspondence with preserved examination-level semantics.
- We use parameter-efficient Anatomy Sensors, auxiliary reconstruction objectives, temporal–multiview fusion, and hybrid soft labels to adapt frozen backbones while limiting false-negative supervision.
- We formulate post hoc finite-scale boundary and texture descriptors on explicitly separated geometric and intensity supports, and test their incremental explanatory value beyond conventional intensity, texture, and uncertainty features without using them for training.
- Controlled experiments evaluate parser routing accuracy, identical-cohort fairness, temporal/multiview contributions, hyperparameter sensitivity, anatomical-localization perturbations, cross-dataset transfer, retrieval, attention localization, and finite-scale robustness.
1.1. Related Work
1.1.1. Medical Vision–Language Pretraining for Chest X-Rays
Vision–language pretraining (VLP) has emerged as a powerful paradigm for learning transferable medical representations from naturally paired radiographs and reports. Inspired by CLIP [6], early medical VLP architectures adapted contrastive learning to chest X-ray interpretation by aligning global visual features with textual representations. For example, ConVIRT [7] optimized bidirectional global contrastive losses on paired CXR data, while BioViL [8] enhanced domain-specific language modeling via CXR-BERT and auxiliary pretraining objectives. CXR-CLIP [9] expanded this paradigm by converting image–label pairs into prompt-based text templates and integrating frontal–lateral view alignments.
Subsequent studies have advanced medical VLP along diverse dimensions, but their remaining limitations motivate different parts of AGIRA. BCC [15] reduces semantic false negatives through dynamic soft labels and negation-aware modeling, but it does not establish explicit organ-level image–text pairs. MLIP [16] introduces knowledge-guided contrastive learning, yet the quality of the learned correspondence remains dependent on the external knowledge-extraction process. MMCLIP [17] combines masked image/language modeling with multimodal learning, but reconstruction and contrastive pretraining alone do not specify which regional image evidence should align with which anatomical report statement. GLoRIA-style implicit local matching [10] provides fine granularity but does not guarantee that the learned local unit corresponds to a radiological anatomical structure. The resulting gap is not a lack of local features per se; it is the absence of explicit anatomical correspondence combined with a mechanism that simultaneously preserves complete-examination semantics.
Masked record modeling (MRM) jointly reconstructs masked radiograph patches and report tokens to learn transferable radiographic representations [18]. Building on an MRM-pretrained vision encoder, recent parameter-efficient CXR vision–language methods have demonstrated the feasibility of adapting frozen vision and language backbones with lightweight trainable modules [19]. AGIRA takes this frozen-backbone adaptation paradigm in a different direction: instead of treating it only as an efficiency strategy, AGIRA uses it to preserve global–local semantic continuity when global image–report semantics and anatomy-level correspondences are jointly optimized. The retained MIM/MLM reconstruction objectives regularize the adapted representation space, helping local anatomical evidence remain semantically grounded in the full radiograph and complete report.
1.1.2. Fine-Grained and Knowledge-Guided Cross-Modal Alignment
Given that radiology reports commonly anchor pathological findings to anatomical locations, effective CXR image–text alignment requires fine-grained semantic mapping beyond conventional instance-level matching [20,21]. Existing studies have explored fine-grained or multi-granularity alignment from different perspectives. GLoRIA [10] designed a joint global–local representation learning scheme utilizing word-guided attention to associate image patches with report tokens. MGCA [22] introduced multi-granularity contrastive learning by simultaneously modeling instance-level, token-level, and disease-semantic correspondences. Beyond medical imaging, GOAL [23] explored a related global–local alignment idea by aligning complete scene graphs with scene descriptions and local objects with corresponding object-level descriptions. Although these methods improve fine-grained cross-modal matching, their alignment units are not organized around the anatomical structures that radiologists use to localize and describe CXR findings. To inject stronger clinical priors, another line of work integrates external knowledge into medical VLP. MedKLIP [24] extracts entities, anatomical locations, and existence states from reports, linking them to Unified Medical Language System (UMLS) definitions. KAD [25] constructs a medical knowledge graph using RadGraph annotations, while ARL [26] and KB-VLP [27] incorporate entity-centric or knowledge-base embeddings to guide representation learning.
While the above knowledge-guided approaches underline the utility of clinical priors, they often depend on external knowledge graphs, named entity recognition (NER), or entity-linking pipelines, which may introduce additional processing noise. In contrast, AGIRA capitalizes on knowledge intrinsic to CXR interpretation: the hierarchical anatomical structure that naturally couples thoracic regions with textual findings. By operationalizing this prior via anatomical masks and clinically grounded report-parsing rules, AGIRA establishes anatomy-level image–report supervision while retaining global image–report alignment and preserving global–local semantic continuity.
A complementary structural perspective is provided by the Adaptive Petri Net Token Flow (APNTF) method of Mahadeer et al. [28], which represents grayscale-image segmentation with a Petri-net formulation in which intensity states, transitions, and token propagation support context-aware region formation. APNTF and AGIRA share the broad motivation of modeling image structure more explicitly than a purely global representation. Their research questions and technical paths are nevertheless different: APNTF is a pixel/intensity-level segmentation method whose token-flow dynamics directly determine region partitioning, whereas AGIRA addresses vision–language representation learning and uses predefined anatomical supports to align organ-level image evidence with report semantics. We therefore cite APNTF as related structural modeling rather than as a competing cross-modal method; it reinforces the general value of explicit structure while highlighting that AGIRA operates at an anatomical semantic level rather than a pixel segmentation level.
1.1.3. Fractal and Multifractal Analysis in Biomedical Imaging and Learning
Box-counting dimension describes the scale-dependent occupancy of a geometric set, whereas generalized dimensions and the singularity spectrum describe heterogeneous scaling of a non-uniform measure derived from image intensity or gradient energy [11,12,13,29]. In finite-resolution images, estimates depend on the raster size, preprocessing, and regression window; the analyzed scales and fit quality should therefore be reported, and the values interpreted as effective descriptors [14].
Recent biomedical learning studies have used fractal concepts as architectural inspiration or as explicit regularizers. VG-SAM employed hierarchical and self-similar ideas for multi-level prompting [30]; FD-HCL introduced fractal-dimension-guided consistency for semi-supervised segmentation [31]; and fractal-inspired weighting has emphasized structurally complex regions in medical classification [32]. AGIRA intentionally does not follow the regularization route. Its fractal quantities are computed only from frozen inputs, embeddings, and visualization maps after model training. This design preserves their role as an independent explanatory probe and avoids making the core optimizer dependent on finite-scale descriptors whose estimates vary with resolution and scale selection. Boundary geometry and gradient-energy texture are defined on explicit, separately reported supports and are then related to anatomy-conditioned task behavior and local embedding geometry.
2. Materials and Methods
The AGIRA training workflow is summarized in Figure 2; the post hoc finite-scale analysis is described separately in Section 2.6 and does not participate in the optimization path.
Figure 2.
Overview of AGIRA. The frozen MRM vision encoder and CXR-BERT text encoder are adapted by trainable Anatomy Sensors. AGIRA jointly optimizes global image–report alignment, anatomy-level alignment, auxiliary MIM/MLM reconstruction regularization, and hybrid soft-label supervision from temporal–multiview inputs while preserving global–local semantic continuity.
The schematic workflow of AGIRA is shown in Figure 2. AGIRA is designed to embed domain-specific clinical and anatomical priors into the cross-modal latent space of CXR representation learning while preserving the relationship between global examination-level semantics and anatomy-level evidence. We formalize the knowledge utilized in this work as a structured triplet:
where denotes the set of key anatomical structures essential for thoracic diagnosis. represents a rule-based parsing operator guided by a clinical keyword vocabulary, which maps a free-text radiology report to the specific subset of anatomical structures it describes. defines a relational semantic similarity prior across patient studies, derived from text-semantic and lateral-view radiographic correlations.
The elements of govern distinct operational phases within the AGIRA pipeline: and drive anatomy-driven cross-modal extraction (Section 2.1); the network architecture incorporates for localized parameter-efficient adaptation (Section 2.2); and provides the relational basis for synthesizing hybrid soft labels (Section 2.4) to regularize the hierarchical multi-granularity alignment objectives (Section 2.3).
For clarity, all notation is introduced at first use. Subscripts g and l denote global and local representations, respectively; indexes anatomical structures; B denotes mini-batch size; and are the frozen visual and text encoders; and are trainable projection heads; is the contrastive temperature; and , , and weight the anatomy, MIM, and MLM terms. Symbols used only in the post hoc finite-scale analysis are defined separately in Section 2.6 so that they cannot be confused with training variables.
2.1. Hierarchical Anatomy-Driven Cross-Modal Extraction
To establish hierarchical cross-modal alignment, each patient study is represented through complementary examination-level and anatomy-level components. Let and denote the global radiograph and its paired free-text report, respectively. Guided by and , we partition into N distinct anatomical regions and segment into corresponding anatomy-specific text fragments , yielding a set of localized pairs . In this study, we set to represent the left lung, right lung, and heart. Figure 3 illustrates both the image cropping and report decomposition rules.
Figure 3.
Illustration of chest X-ray anatomy-driven image extraction (top) and anatomy-specific report decomposition (bottom). The ellipses indicate report text truncated only for visualization.
Regarding the visual modality, pixel-level masks from the CheXmask dataset [33] are utilized to localize each target organ within . For each binary mask, we compute the minimum bounding box and expand it by 5% of its width and height on each side, clipped to the image boundary, to obtain . This contextual margin is intended to preserve pleural and boundary-zone evidence while limiting contamination from unrelated structures; its 5% value is selected on the internal patient-disjoint MIMIC-CXR development split described in Section 2.8 and is never tuned on a downstream benchmark.
Regarding the textual modality, to avoid adding unconstrained generated content, we use a deterministic parser. The Findings and Impression sections are sentence-segmented, matching is performed case-insensitively, and the original sentence text is retained so that negation, uncertainty, and temporal wording are not rewritten. Side-specific terms are evaluated before generic pulmonary terms. A sentence that refers to more than one supported structure is copied to each matched bucket rather than arbitrarily assigned to one region. Generic bilateral pulmonary statements are copied to both lung buckets. Only when a bucket receives no source sentence is the standardized “<anatomical structure> is unremarkable” template inserted. Table 1 reports the vocabulary and routing rules used in our implementation.
Table 1.
Deterministic anatomy-specific report decomposition rules. The listed expressions are the normalized lexical triggers used in our implementation; morphological variants are matched after lower-casing and punctuation normalization. Source sentences are preserved verbatim after routing.
Representative difficult cases are listed in Table 2. The parser correctly retains explicit negation (“No focal airspace opacity in the right lung”), uncertainty (“Possible small left pleural effusion”), temporal wording (“Right basilar opacity has improved since prior”), and multi-structure statements (“Bibasilar opacities with mild cardiomegaly”). Its main failure mode is discourse that requires antecedent resolution across sentences, for example “There is a right basilar opacity. This has improved.”; the second sentence contains no anatomical trigger and is therefore not independently routed. Anatomically ambiguous statements such as “Mild blunting of the costophrenic angle” can likewise be under-specified when laterality is absent.
Table 2.
Representative report-decomposition cases and known failure modes. These examples document deterministic rule behavior; they are not presented as an independent gold-standard accuracy estimate.
To directly quantify routing reliability, we constructed an independent gold-standard evaluation set from 200 held-out MIMIC-CXR reports that were excluded from alignment training. We sampled 600 routing units (a sentence, or a two-sentence unit when antecedent resolution was required) with stratification to ensure representation of routine anatomy statements and difficult phenomena including negation, uncertainty, temporal change, multi-structure statements, ambiguous laterality, and cross-sentence dependencies. Two annotators familiar with CXR reporting terminology independently assigned a multi-label routing vector over left lung, right lung, heart, and none/unsupported. The annotators were blinded to parser output; disagreements were adjudicated before scoring. Inter-annotator exact agreement before adjudication was 94.7%, with Cohen’s . Precision, Recall, and F1 are calculated independently for the three supported anatomical buckets, and exact-match accuracy requires the complete multi-label routing vector to match the adjudicated gold standard.
The embedding matching matrix is retained as a separate functional validation of the downstream supervision: the intended left-lung, right-lung, and heart diagonal scores are 0.46, 0.51, and 0.57 (mean 0.513), whereas the six off-diagonal scores average 0.243. Because this matrix is model-dependent, it is interpreted only together with, and not as a substitute for, the independent parser-accuracy experiment.
This extraction pipeline generates concurrent global-level and anatomy-level supervision targets for subsequent cross-modal training.
2.2. Parameter-Efficient Anatomy-Aware Adaptation with Anatomy Sensors
The backbone of AGIRA consists of a dual-modality network: a Vision Transformer (ViT) visual encoder pretrained via masked record modeling (MRM) [18] and a domain-specific CXR-BERT text encoder initialized from BioViL [8]. To preserve the transferable representations learned during large-scale pretraining and maintain the pretrained global–local semantic structure, the attention and feed-forward weights of both foundational encoders are kept frozen.
To adapt the frozen embedding spaces toward explicit anatomy-level boundaries, we integrate lightweight, parameter-efficient adapter modules, termed Anatomy Sensors, into the Transformer blocks of both encoders. As illustrated in Figure 4, each adapted block contains one sensor after the Multi-Head Self-Attention (MSA) module and another in parallel with the Feed-Forward Network (FFN).
Figure 4.
Architecture of the Anatomy Sensor adapter module inserted into each Transformer block of the frozen backbone for parameter-efficient anatomy-level adaptation.
Formally, taking the FFN-parallel configuration as an example, given an intermediate token representation , the forward pass of the Anatomy Sensor is formulated as a bottleneck adapter:
where denotes Layer Normalization, is GELU, and r signifies the bottleneck rank. We use the MRM-adaptation setting [19]; this ratio is fixed across experiments rather than tuned per downstream task. The total block output is computed via:
where is a learnable scalar scaling factor initialized to zero. During optimization, the backbone attention and FFN weights and the pretrained reconstruction heads remain fixed, whereas the Anatomy Sensors, their associated normalization parameters, and the projection heads are trainable. This design concentrates optimization on anatomy-aware alignment while retaining the pretrained backbone.
2.3. Hierarchical Multi-Granularity Cross-Modal Alignment
AGIRA optimizes cross-modal correspondence at two complementary representation levels: global examination-level consistency and local anatomy-aware alignment.
2.3.1. Global Temporal–Multiview Alignment
To incorporate comprehensive clinical contexts, the visual input is extended to encompass historical and alternative-view radiographs. This design also helps expose clinically related observations that may otherwise be treated as independent negatives, such as different time points of the same patient or different views from the same examination. For study s, let denote its required global visual states in the curated cohort, where represents the current frontal radiograph, denotes the current lateral view, is the previous frontal radiograph, and is the previous lateral view. Thus, each training record contains both current and historical frontal–lateral radiographs, enabling temporal–multiview alignment under a consistent four-state visual structure.
For each available image state (), we append view-specific and temporal positional embeddings, apply random patch masking, and forward the visible tokens through the visual encoder:
where extracts the [CLS] embedding. The multi-view and temporal representations are aggregated via view-level averaging over the available states and projected into the shared latent space:
Concurrently, the global textual embedding is derived from the complete report :
For a mini-batch containing B normalized embeddings, denoted as matrices and , the cross-modal similarity matrix is defined as , where is a temperature parameter. Applying row-wise and column-wise softmax operations yields the empirical image-to-text () and text-to-image () probability distributions. The global contrastive losses are optimized using Kullback–Leibler (KL) divergence against the hybrid soft labels derived in Section 2.4:
2.3.2. Local Anatomy-Aware Alignment
To guarantee localized correspondence, the anatomy-aware branch directly supervises the extracted regional pairs . The localized visual regions and textual fragments are mapped into the shared latent space:
For anatomy i, let denote the similarity between image region a and report fragment b in a batch. We use the symmetric bidirectional InfoNCE objective
and combine anatomical structures as
We set . Equal weights avoid introducing an additional organ-frequency prior and keep the three predefined anatomical nodes equally represented in the local objective. This constraint encourages the trainable Anatomy Sensors to isolate and capture organ-specific pathological variations.
2.4. Knowledge-Aware Hybrid Soft Labeling
Standard contrastive learning assumes strict orthogonality between distinct clinical studies, which imposes incorrect penalties on false negatives because unpaired patient cases frequently share overlapping pathological findings. To address this issue, AGIRA replaces conventional one-hot targets with hybrid soft labels derived from report semantics and lateral-view radiographic similarity.
For a mini-batch of size B, let and denote the -normalized global textual representations and lateral-view radiographic features, respectively. Their pairwise similarity matrices are computed as:
To suppress stochastic noise and weak correlations, a hard threshold filtering operation is applied, followed by row-wise normalization. For each modality , the filtered distribution is defined as:
where represents the filtering threshold, yielding the semantic label matrix and the structural matrix . If thresholding produces a zero off-diagonal row, that auxiliary row contributes zeros and the paired identity component in Equation (14) remains the valid target; no division by zero is performed in implementation.
The unified hybrid soft label matrix, , is constructed via a linear combination of the identity matrix I and the two filtered soft label matrices:
where and are hyperparameters controlling the mixing ratios. We enforce so that the exact paired study retains an explicit identity-matrix contribution to the optimization target.
2.5. Training Objective and Global–Local Continuity Regularization
To prevent the trainable Anatomy Sensors from distorting the representation space of the frozen backbone, we retain the pretrained reconstruction objectives as auxiliary regularizers that preserve global–local semantic continuity. For the visual pathway, the fixed MRM visual decoder reconstructs the masked patches of the current frontal radiograph, and the resulting loss regularizes the trainable adaptation modules. Let denote the set of masked patch indices:
For the textual pathway, the report sequence is partitioned into a masked subset and an unmasked context subset . The retained masked-language prediction head supervises the adaptation modules by predicting the masked tokens conditioned on the remaining text context and the global visual vector :
The total objective function optimized by AGIRA combines the multi-granularity alignment losses and the self-supervised reconstruction terms:
where , , and serve as balancing coefficients. This multi-task scheme concentrates the learning capacity of the trainable parameters on anatomy-aware adaptation while ensuring representation stability.
2.6. Post Hoc Finite-Scale Fractal Analysis
2.6.1. Scientific Role and Complementarity to Conventional Analyses
The quantities in this section are computed only after model training and do not appear in . Their purpose is explanatory rather than optimizational. Table 3 clarifies the additional question addressed by each analysis family. First-order intensity statistics summarize marginal distributions but discard spatial scale; fixed-neighborhood texture features characterize a chosen local radius but do not measure how occupancy changes across several observation scales; predictive uncertainty quantifies confidence rather than image geometry. By contrast, summarizes finite-scale boundary occupancy, and summarize how gradient-energy mass redistributes across scales and density regimes, and FCI summarizes multiscale attention concentration. These are complementary descriptors, not replacements for conventional statistics and not evidence that the network implements a fractal generative mechanism.
Table 3.
Conceptual distinction between conventional characterization and the post hoc finite-scale questions used in this work.
Because these descriptors are deliberately excluded from the optimizer, any association with a frozen embedding or attention map is not mechanically enforced. To test whether the multiscale descriptors add information unavailable from conventional characterization, we further perform a nested incremental-value analysis on the same retained CheXpert cases. The conventional feature vector contains first-order intensity statistics (mean, standard deviation, skewness, kurtosis, and Shannon entropy), fixed-neighborhood texture statistics (four-direction averaged GLCM contrast, homogeneity, energy, and correlation, plus uniform-LBP entropy), and two model-output uncertainty measures (predictive entropy and top-1/top-2 similarity margin). All image-derived conventional features are computed on the same task-relevant anatomical support as the finite-scale variables. To avoid post-intervention leakage, the uncertainty variables are taken from the frozen no-AA control rather than from AGIRA. The finite-scale vector contains , , , and on that same support.
Two prespecified post hoc outcomes are used. For zero-shot classification, the first is an anatomy-alignment-sensitive case indicator equal to one when AGIRA predicts the correct class and no-AA does not. For retrieval, it is equal to one when the query-level P@5 of AGIRA is higher than that of no-AA. The second outcome is the continuous AGIRA-minus-no-AA change in the correct-class or paired-report similarity margin. We use five-fold outer cross-validation at the patient level; within each outer training fold, an inner four-fold split selects the regularization strength from for the standardized logistic/ridge model. We compare conventional-only, finite-scale-only, and combined feature sets and quantify the incremental contribution of the finite-scale descriptors by paired bootstrap confidence intervals across held-out predictions and 5000 label-permutation tests. Thus, the added value of the finite-scale variables is judged empirically after conventional texture and uncertainty information has already been supplied, with support and model-output leakage controlled.
The quantities below analyze the image inputs, frozen embeddings, downstream behavior, and visualization maps of the trained models. They are not components of the AGIRA architecture or its optimization objective. Let be a frontal CXR represented on an lattice. The bilateral-lung and union-of-anatomy masks are defined as
We reserve the term global branch for AGIRA’s complete-image pathway. In the post hoc analysis, whole image denotes the complete-image texture support, whereas thoracic union denotes the geometrical support defined by .
Boundary Box-Counting Dimension
For , let and let be the number of boxes of normalized side length that intersect the contour. The asymptotic definition and its finite-scale ordinary-least-squares estimator are
where
The corresponding coefficient of determination is denoted by . Because the estimates are obtained from a finite number of raster scales, is interpreted only as an effective boundary-occupancy descriptor over the prescribed scale interval.
Gradient-Energy Texture Measure
Let
with , and define the spatial weight
where is a Gaussian kernel and prevents zero-mass boxes.
At scale , boxes are retained according to
The retained box masses are
and are renormalized after box selection:
Consequently,
at every retained scale.
For a finite sequence of scales , let . For any sequence , define its ordinary-least-squares slope against as
The associated coefficient of determination is
where and .
The partition function at the kth resolved scale is
In the asymptotic formulation, . For the finite raster scales used here, we instead estimate
For , the effective generalized dimension is
For , define the entropy sequence
The finite-scale information dimension is estimated as
Using the direct Chhabra–Jensen construction [12], define
At each scale, the corresponding sequences are
and
Their finite-scale estimates are the regression slopes
and
We use
and define the finite-scale spectrum width as
For readability, the hats are omitted from the finite-scale descriptor symbols in the subsequent tables and discussion. and are retained for the local descriptor–embedding analysis, whereas the compact descriptive table reports , , and .
For , let
whereas for ,
The sample-level moment-averaged goodness of fit is
The descriptive table reports the median and interquartile range of across the retained radiographs.
Finite-Scale Descriptor–Embedding Distance Concordance
Because whole-image texture and thoracic-union geometry have different supports, descriptor–embedding concordance is evaluated only for the three support-consistent local domains
For sample n, define
Any component with zero sample variance is omitted before component-wise standardization. Structural and frozen-embedding distances are
and their rank concordance is
Here, is the -normalized frozen image embedding of method m. The statistic measures descriptor–embedding distance concordance and is not interpreted as an explicit fractal code within the network.
Attention Concentration Probe
A non-negative attention map A is normalized as a spatial probability measure. Its finite-scale information and correlation dimensions, and , are estimated using the same slope procedure defined above. The finite-scale concentration index is
A larger FCI denotes a stronger departure from uniform two-dimensional occupancy. FCI is interpreted jointly with BAR and CR because spatial concentration alone does not establish correct lesion localization.
2.6.2. Estimation and Statistical Protocol
The analysis used the 1000 CheXpert 5 × 200 radiographs. Cases with complete left-lung, right-lung, and heart CheXmask predictions and Dice reverse-classification-accuracy mean ≥0.7 were retained, leaving 964 radiographs. Intensities were clipped at the 1st and 99th percentiles and resized to pixels; masks were resized using nearest-neighbor interpolation. Organ crops included a 5% contextual margin.
We used , , box sizes , and . Boxes below the 25% occupancy threshold were excluded before the retained masses were renormalized according to Equation (23). Each image produced five coded texture supports—whole image, bilateral-lung union, left lung, right lung, and heart—yielding sample–domain texture records. The primary descriptive table reports the whole image and the three individual organs; the bilateral-lung union is reserved for complexity stratification. Paired regional comparisons use Wilcoxon signed-rank tests with Holm correction.
For each sample and texture support, was first calculated as the arithmetic mean of the four scale-regression coefficients of determination over . The descriptive table then reports the median [interquartile range] of this sample-level quantity across the retained radiographs.
For complexity stratification, cardiomegaly used , whereas atelectasis, consolidation, edema, and pleural effusion used recomputed on the bilateral-lung union defined in Equation (18). Tertiles were formed separately within each disease class and then pooled, yielding 322, 319, and 323 low-, intermediate-, and high-heterogeneity cases. Per-sample classification correctness and query-level I2T P@5 were compared between AGIRA and no-AA using 2000 paired bootstrap resamples.
For descriptor–embedding distance concordance, AGIRA, no-AA, and F2F were evaluated on the same 964 cases and the same 50,000 unordered sample pairs. The analysis was restricted to the left lung, right lung, and heart. Sample-level cluster bootstrap with 2000 replicates provided confidence intervals and paired method differences.
For the attention analysis, non-negative maps were normalized and resampled to a common image grid. , , and FCI were estimated over box sizes and reported as median [interquartile range]. Per-image FCI–CR associations used 2000 bootstrap replicates. Because the underlying visualization procedures are model-specific, the cross-model FCI comparison is interpreted jointly with BAR and CR.
Scale-window sensitivity was assessed by leaving out one scale at a time at 224 pixels. Resolution sensitivity used with approximately proportional scale sets , , and , respectively. Agreement was summarized using ICC(3,1). Parameter-definition sensitivity was evaluated separately by varying the retained-box occupancy threshold , gradient regularizer , and Gaussian scale . For each perturbation we recomputed , measured Spearman rank agreement and exact tertile membership relative to the reference definition, and repeated the low/intermediate/high performance comparison. These settings are analysis-only and never affect AGIRA training.
2.7. Datasets
2.7.1. Alignment-Training Cohort: MIMIC-CXR
We utilize the MIMIC-CXR v2.0.0 dataset [34], a large-scale repository comprising paired chest radiographs and free-text radiology reports, as the alignment-training corpus. To construct longitudinal, temporal–multiview training records, studies originating from the same patient are linked via unique patient identifiers (). Spatial projections and temporal sequences are parsed using the metadata attributes and , respectively.
For each verified examination record, the structured sample includes: (i) the current frontal radiograph paired with its standardized anatomical mask extracted from the CheXmask dataset [33], (ii) the concurrent lateral radiograph, (iii) the complete narrative radiology report, and (iv) the historical frontal and lateral radiographs from the patient’s preceding longitudinal study. Records missing the required current views, historical views, anatomical mask, or report, as well as records with corrupted metadata, are excluded. This filtering pipeline yields 34,080 valid longitudinal multiview examination records for the alignment-training stage.
The 34,080-record cohort is therefore a structured availability subset, not a subset selected using downstream labels or downstream performance. Requiring a current frontal view, current lateral view, preceding frontal/lateral views, a report, and an anatomical mask necessarily removes studies that cannot instantiate the temporal–multiview objective. In addition to the method-compatible full-corpus comparison, we now conduct an identical-cohort control. The same 34,080 longitudinal records are expanded into flat visual-text training instances for GLoRIA-ViT, MLIP, and BCC. The four image states are the current frontal, current lateral, previous frontal, and previous lateral radiographs; each state inherits the same study-level textual supervision available to AGIRA’s global branch for that structured record. No anatomy crop, anatomy-specific fragment, or anatomy loss is provided to the baselines. Patient membership, record availability, image preprocessing, downstream evaluation sets, and optimization budget are held fixed. This control therefore equalizes the underlying cohort and observed visual states, while allowing each baseline to retain its native global alignment objective. The full-corpus rows remain useful for comparison with method-compatible training, whereas the identical-cohort experiment directly tests whether AGIRA’s advantage persists when training-data availability is controlled.
2.7.2. Downstream Benchmarks
To evaluate the aligned representations, we use four downstream benchmark settings:
CheXpert 5 × 200
Adhering to the protocol established in prior work [10,35], this subset consists of 1000 selected radiography records evenly partitioned with 200 cases across five distinct thoracic abnormality categories. We utilize this benchmark to evaluate image-to-text retrieval and zero-shot multi-class classification. Image-to-Text Retrieval: Each visual query is evaluated on its capacity to retrieve paired text descriptions within the identical pathology category. Performance is quantified via Precision at k (, where ). Zero-Shot Classification: We follow the standardized text prompt templates defined in [10] to reformulate the multi-class categorization as an image–text matching problem, reporting classification Accuracy. Crucially, during both inference modalities, AGIRA combines global image–text matching with fine-grained anatomy-level matching. For the visual side, local anatomical crops are obtained using approximate anatomical coordinate priors rather than segmentation masks; for the textual side, the corresponding report fragments are generated following the rule-based decomposition strategy described in Section 2.1.
RSNA Pneumonia
The RSNA Pneumonia dataset [36] is utilized to benchmark zero-shot binary classification performance between pneumonia-positive and normal radiographs. Adhering to the official cohort partition, the validation and test sets comprise 1500 and 3000 images, respectively. Cross-modal zero-shot prediction is driven by the target prompt pair: “There is pneumonia” versus “There is no pneumonia”. Performance is evaluated quantitatively using Accuracy, F1-score, and the Area Under the Receiver Operating Characteristic curve (AUC).
CheXpert 8 × 200
To isolate and ablate the specific performance gains contributed by the knowledge-aware hybrid soft labeling mechanism and the self-supervised reconstruction regularizers, we employ the CheXpert 8 × 200 evaluation setup [7,35]. Following the protocol outlined in ConVIRT [7], text-to-image retrieval is executed wherein each diagnostic narrative query aims to retrieve candidate radiographs across eight abnormality categories. Retrieval efficacy is verified via , , and .
VinDr-CXR
The public VinDr-CXR dataset [37] provides radiologist-annotated lesion bounding boxes. A subset of 250 lesion-annotated radiographs is used as an external attention-localization probe, with the bounding boxes used only for evaluation rather than model training.
2.7.3. Patient/Study Separation and Cross-Dataset Leakage Safeguards
Longitudinal MIMIC-CXR records are formed only within the same ; whenever an internal split is required, all studies belonging to one subject are kept in the same partition so that different examinations of one patient cannot appear on both sides of that split. CheXpert, RSNA Pneumonia, and VinDr-CXR are external datasets and are never merged into the MIMIC-CXR alignment-training corpus. No downstream radiograph, report, class label, lesion box, or test prediction is used to update AGIRA parameters. The RSNA validation partition is used only for evaluation-protocol choices that require a validation operating point; the representation itself remains frozen. Because the public databases use independent de-identification schemes, their patient identifiers are not globally linkable across institutions; we therefore do not claim an unverifiable cross-database patient-ID match. Instead, the separation audit is based on dataset provenance, training code paths, and the absence of downstream files from the alignment-training manifest. This establishes the intended cross-dataset setting without overstating what de-identified identifiers can prove.
2.8. Experimental Setting
2.8.1. Implementation Details
All architectural components are implemented within the PyTorch v2.8.0 framework [38]. The primary alignment training is distributed across six NVIDIA GeForce RTX 5090 GPUs (NVIDIA Corporation, Santa Clara, CA, USA). The visual encoder is instantiated as a Vision Transformer (ViT-B/16) initialized with MRM-pretrained weights [18], with input radiographs standardized to a resolution of pixels. The textual encoder is initialized using the BioViL-pretrained CXR-BERT architecture, enforcing a maximum token length of 128. Network optimization uses AdamW [39] with a total mini-batch size of 144. The initial learning rate is with a weight decay of 0.05. The learning-rate is updated at the iteration level, with linear warmup over the first 10 epochs, followed by cosine annealing. AGIRA is trained for 15 epochs while updating 7.54% of the complete model parameters. The separate efficiency analysis in Section 3.5 uses a controlled single-GPU setting for all compared methods.
2.8.2. Hyperparameter Configurations
Table 4 consolidates the values needed to reproduce training and the post hoc analysis. Hyperparameters that directly affect anatomy supervision or hybrid-label construction were selected on a patient-disjoint 10% development split (3408 structured records) carved from the alignment-training cohort before any external benchmark evaluation. The primary selection metric was bidirectional image–report Recall@10 on this internal development split. We searched ; contextual margins ; heart-weight settings with both lung weights fixed to one; and a local grid of hybrid coefficients . The selected values were , , equal anatomy weights, and . After selection, the final model was retrained on all 34,080 records with these values fixed. The multi-modal contrastive temperature is initialized to 0.07, and the remaining pretrained-backbone/adapter settings follow the corresponding pretraining configuration. No CheXpert, RSNA, or VinDr test sample was used for hyperparameter selection.
Table 4.
Training and post hoc analysis hyperparameters used in the reported experiments.
3. Results
The experiments first evaluate retrieval, zero-shot recognition, and component ablations. The post hoc analyses then report boundary and texture descriptors on explicitly separated supports, test within-class complexity-dependent performance, examine local descriptor–embedding distance concordance, and assess estimator sensitivity.
3.1. Quantitative Evaluation on Downstream Clinical Tasks
We compare AGIRA with representative medical vision–language baselines, including ConVIRT [7], GLoRIA [10], BioViL [8], BioViL-T [40], MLIP [16], BCC [15], and MedKLIP [24]. Since the original GLoRIA is pretrained on CheXpert, its results on CheXpert-based benchmarks are reported only for reference and marked with an asterisk. For a more controlled comparison, we reproduce GLoRIA with a ViT-B/16 image encoder, denoted as GLoRIA-ViT. MLIP and BCC are re-implemented within our evaluation pipeline because their official implementations or pretrained checkpoints were not publicly available in a form directly compatible with our experimental setting at the time of our experiments. Following their original training protocols as closely as possible, we train the re-implemented models on the full MIMIC-CXR image–report training corpus after standard validity filtering and method-specific preprocessing. This differs from AGIRA, which is trained on a curated multiview subset constructed for anatomy-aware and temporal–multiview alignment. All reproduced methods are evaluated on the same downstream benchmarks and metrics as AGIRA. The difference in alignment-training cohort size is important when interpreting these rows. The full-corpus baselines see more distinct MIMIC-CXR studies, while AGIRA is restricted by the availability of current/previous frontal–lateral views and masks. Consequently, these rows establish comparative downstream performance under method-compatible training conditions but do not isolate architecture from training-data availability. We therefore avoid attributing every cross-method gap exclusively to anatomy alignment and rely on fixed-cohort ablations below for causal component attribution.
3.1.1. Image-to-Text Retrieval
Table 5 compares image-to-text retrieval on the common CheXpert 5 × 200 evaluation set.
Table 5.
Image-to-text retrieval on CheXpert 5 × 200. Values are Precision (%); best and second-best results are shown in bold and underlined. * Pretrained on CheXpert and shown for reference.
Table 5 evaluates whether the anatomical supervision in AGIRA translates into stronger image–report matching on CheXpert 5 × 200. AGIRA ranks first on all three retrieval metrics, reaching 53.7%, 53.0%, and 46.8% on P@5, P@10, and P@100, respectively. Among the competing methods, BCC achieves the strongest P@5 and P@10 results, while BioViL-T obtains the strongest P@100 result. AGIRA improves over these strongest baselines by 1.7%, 2.2%, and 2.9% on P@5, P@10, and P@100, respectively. Compared with the backbone-aligned GLoRIA-ViT baseline, the margins are 2.5%, 3.6%, and 6.6%. The gain at P@100 is particularly informative: it suggests that anatomy-level supervision does not merely refine the first few nearest neighbors, but also stabilizes the ranking over a broader candidate set by discouraging anatomically inconsistent matches.
These results support the central motivation of AGIRA. Global contrastive methods such as ConVIRT and GLoRIA-ViT can learn examination-level disease semantics, but they are not explicitly penalized when a report sentence about the heart is matched to lung-dominant visual evidence, or vice versa. Knowledge-enhanced methods such as MLIP and BCC improve semantic supervision, yet their gains are concentrated mainly at the top of the list. In contrast, AGIRA couples global image–report matching with region-fragment matching, yielding representations that remain discriminative when many clinically related reports compete with the true match.
Figure 5 illustrates representative retrieval cases after the quantitative comparison.
Figure 5.
Qualitative image-to-text retrieval comparison between AGIRA and BCC on CheXpert 5 × 200. Given a query chest X-ray, each method retrieves the two highest-ranked radiology reports. Green boxes indicate reports from the same disease category as the query, whereas red boxes indicate category mismatches. Similarity scores and retrieved disease labels are shown inside each result box. The ellipses indicate report text truncated only for visualization.
3.1.2. Zero-Shot Classification
Table 6 presents the zero-shot classification comparison before the corresponding quantitative discussion.
Table 6.
Zero-shot classification on RSNA Pneumonia and CheXpert 5 × 200. Values are percentages; best and second-best results are shown in bold and underlined. * Pretrained on CheXpert and shown for reference.
Figure 5 gives a qualitative view of the same effect. In image-to-report retrieval, AGIRA retrieves reports whose disease labels and described findings better agree with the query radiograph. This qualitative behavior is consistent with Table 5: the local anatomy branch improves semantic specificity rather than simply increasing coarse global similarity.
Table 6 reports zero-shot classification on the binary RSNA Pneumonia benchmark and the five-class CheXpert benchmark. AGIRA obtains the best results on every reported metric, with 92.0% AUC, 84.2% ACC, and 79.0% F1 on RSNA Pneumonia, and 57.5% ACC on CheXpert 5 × 200. Compared with the strongest non-AGIRA competitors, AGIRA improves RSNA AUC/ACC over BCC by 0.8% and 2.1%, and improves RSNA F1 over MLIP by 1.5%. On the more fine-grained CheXpert zero-shot task, AGIRA improves over GLoRIA by 2.6% and over BCC by 4.1%.
The classification results complement the retrieval findings. Pneumonia recognition often depends on localized opacity patterns, while CheXpert multi-class recognition requires distinguishing conditions with overlapping visual appearances, such as edema, consolidation, and cardiomegaly. The consistent improvements indicate that AGIRA does not rely solely on either global image–report association or isolated local regions. Instead, it combines examination-level semantics with anatomy-aware local evidence, allowing disease-related prompt matching to be supported by both the full clinical context and the anatomical regions where relevant findings are likely to appear. These results indicate that AGIRA improves zero-shot recognition by linking disease-related prompts to localized anatomical evidence while retaining global thoracic context, thereby supporting hierarchical image–text representation of complex CXR patterns.
3.1.3. Controlled Comparison on an Identical Alignment-Training Cohort
To separate method differences from training-cohort availability, Table 7 retrains the three reproduced baselines on the same 34,080 longitudinal records used by AGIRA, expanded into 136,320 flat view-time instances as described in Section 2.7.1. This is a data-availability-controlled comparison on an identical underlying cohort, as requested in the review.
Table 7.
Controlled comparison when all reproduced methods use exactly the same 34,080 longitudinal MIMIC-CXR records (136,320 expanded visual-text instances for the global baselines). Values are percentages. Best values are bold.
The controlled result preserves the ordering observed in the main benchmark tables. Relative to the strongest same-cohort baseline in each column, AGIRA improves CX 5 × 200 I2T P@5/P@10/P@100 by 2.4/2.9/5.1 points, CheXpert zero-shot accuracy by 5.1 points, and RSNA AUC/ACC/F1 by 1.5/2.6/2.1 points. Because every row uses the same underlying 34,080 records and has access to the same four visual states, the observed gap cannot be explained by training-cohort availability alone. The full-corpus comparison and the identical-cohort control therefore answer complementary questions: the former reflects method-compatible use of available MIMIC-CXR data, whereas the latter tests whether AGIRA’s advantage persists under controlled data availability. The handling and fusion of temporal/multiview states remain architecture-specific, so this control does not make the optimization pathways identical.
3.2. Ablation Analysis
To connect the empirical gains with the design of AGIRA, we ablate the major components corresponding to its methodological claims: global alignment (GA), hybrid soft labels (HSL), global–local continuity regularization (GLCR), and anatomy-level alignment (AA). The ablations evaluate whether performance depends on preserving both examination-level semantics and anatomy-specific evidence. Table 8 and Table 9 isolate HSL and GLCR while keeping AA active; Table 10 and Table 11 isolate AA and include a full-image/full-text control to rule out gains from repeated per-batch exposure. A later ablation further evaluates the effect of removing the global alignment branch.
Table 8.
Ablation of hybrid soft labels and global–local continuity regularization on zero-shot classification. HSL: hybrid soft labels; GLCR: global–local continuity regularization; AA: anatomy-level alignment. Bold/underline denote best/second-best.
Table 9.
Ablation of hybrid soft labels and global–local continuity regularization on retrieval. HSL: hybrid soft labels; GLCR: global–local continuity regularization; AA: anatomy-level alignment. Global contrastive learning is enabled in all rows. Bold/underline denote best/second-best.
Table 10.
Ablation of anatomy-level alignment on image-to-text retrieval. F2F replaces anatomical regions and report fragments with full images and full reports while preserving the same per-batch reuse pattern. Bold/underline denote best/second-best.
Table 11.
Ablation of anatomy-level alignment on zero-shot classification. F2F is the full-image/full-report reuse control. Bold/underline denote best/second-best.
3.2.1. Ablation of the Hybrid Soft Labels
Hybrid soft labels are evaluated with the retrieval and zero-shot results in Table 8 and Table 9, respectively, before the detailed interpretation.
Hybrid soft labels are designed to replace the rigid one-hot assumption in medical contrastive learning, where clinically related reports and multiview studies can be incorrectly treated as negatives. To test this mechanism, we remove HSL and train the model with conventional hard labels while keeping GLCR and AA unchanged.
The retrieval ablation in Table 9 shows that HSL mainly benefits settings with dense semantic competition. On CheXpert 5 × 200 I2T retrieval, removing HSL reduces P@5/P@10/P@100 by 2.2%, 1.7%, and 0.4%. The effect becomes much stronger on CheXpert 8 × 200 T2I retrieval, where the candidate pool spans more abnormality categories: P@5, P@10, and P@100 decline by 8.0%, 5.7%, and 2.3%, respectively. Table 8 shows the same tendency in zero-shot classification, with drops of 1.3 AUC, 3.5 ACC, and 1.8 F1 on RSNA Pneumonia and 1.7 ACC on CheXpert. These results confirm that HSL is not a marginal regularizer; it directly addresses the false-negative problem induced by overlapping radiographic semantics and related multiview observations.
3.2.2. Effect of Global–Local Continuity Regularization
Global–local continuity regularization is implemented through the auxiliary MIM and MLM reconstruction objectives, which are intended to preserve the frozen backbone’s global–local representation while the Anatomy Sensors adapt to anatomy-level supervision. We therefore remove these reconstruction losses while retaining HSL and AA.
The effect of GLCR is task-dependent. In Table 9, retrieval performance remains broadly comparable: the full model ties or slightly trails the no-GLCR variant on several metrics, while improving CheXpert 8 × 200 P@5 by 0.5%. In contrast, Table 8 shows consistent zero-shot gains from GLCR, improving RSNA AUC/ACC/F1 by 0.3%, 0.6%, and 1.3% and CheXpert ACC by 1.3%. This pattern is meaningful for benchmark evaluation: retrieval can tolerate small shifts in representation geometry as long as relative ranking remains stable, whereas zero-shot classification is more sensitive to whether the adapted model preserves the global disease semantics encoded by the pretrained backbone. We therefore retain GLCR because it improves zero-shot benchmark transfer while preserving broadly comparable retrieval performance.
3.2.3. Ablation of the Anatomy-Aware Module
Anatomy-level alignment is the core component that distinguishes AGIRA from global image–report contrastive learning. We remove the local anatomy branch described in Section 2.1 and Section 2.3.2, while keeping the global loss, HSL, and GLCR unchanged.
Table 10 and Table 11 report the retrieval and zero-shot anatomy-ablation results before their interpretation.
The performance drops in Table 10 and Table 11 are substantially larger than those caused by the other ablations. On CheXpert 5 × 200 I2T retrieval, removing AA reduces P@5/P@10/P@100 by 4.7%, 5.1%, and 3.5%. The impact on CheXpert zero-shot classification is even more pronounced, with ACC decreasing from 57.5% to 44.9%, a 12.6% drop. RSNA Pneumonia also degrades by 1.5 AUC, 2.0 ACC, and 2.0 F1. These results identify explicit anatomy-level correspondence as the primary source of AGIRA’s downstream gains, especially for multi-class recognition where disease categories may share global appearance but differ in anatomical context.
3.2.4. Gold-Standard Reliability of Anatomy-Specific Report Routing
The independent annotation experiment described in Section 2.1 directly evaluates the local text labels before they are consumed by AGIRA. Table 12 reports class-wise and difficult-case performance on the 600 adjudicated routing units.
Table 12.
Gold-standard evaluation of deterministic anatomy-specific report routing on 600 independently annotated routing units. Multi-label routing is allowed. Exact accuracy requires the full predicted routing vector to match the adjudicated gold vector.
The overall macro-F1 of 0.953 and exact routing accuracy of 0.918 indicate that the deterministic decomposition is reliable for the three supported anatomical nodes. Performance remains high for negation, uncertainty, multi-structure, and temporal wording, which is consistent with preserving the original sentence rather than rewriting it. The expected weakness is discourse that requires information not present in the current sentence: cross-sentence dependencies and unspecified laterality reduce F1 to 0.798 and 0.823, respectively. This error profile is important because it locates the residual supervision noise rather than assuming perfect parsing. The independent linguistic evaluation and the model-dependent matching matrix in Figure 6 therefore provide complementary evidence: the former verifies routing correctness, while the latter verifies that the resulting routed fragments remain discriminative in the learned cross-modal space.
Figure 6.
Anatomy-level alignment and finite-scale structural characterization. (a) Row-normalized matching between anatomical image–region embeddings and anatomy-specific report-fragment embeddings on held-out CheXpert samples; the dominant diagonal responses indicate correct anatomical correspondence. (b) Region-wise median boundary box counts and finite-scale linear fits. (c) Point-wise median Chhabra–Jensen singularity spectra, with shaded regions denoting 95% bootstrap confidence intervals for the median . Panel (b) reports the boundary of the union of the three anatomical masks, whereas panel (c) reports the whole-image gradient-energy measure; these supports are not treated as one composite domain.
Figure 6 provides a held-out functional check of region–fragment correspondence together with the finite-scale structural panels discussed later.
To directly verify whether AGIRA learns anatomy-level correspondence, we compute row-normalized matching scores between anatomical image–region embeddings and anatomy-specific report-fragment embeddings on held-out CheXpert samples, as shown in Figure 6. For each anatomical image region, the highest matching score appears on the corresponding text fragment, forming a clear diagonal pattern. The left-lung, right-lung, and heart diagonal scores are 0.46, 0.51, and 0.57, respectively (mean 0.513), whereas the mean of the six off-diagonal entries is 0.243, giving a diagonal-to-off-diagonal ratio of approximately 2.11. The left and right lung regions still exhibit moderate off-diagonal similarity, which is expected because bilateral lung descriptions often share similar radiographic semantics. Together with the independent routing accuracy above, this provides both parser-level and representation-level evidence for the local supervision.
3.2.5. Controlled Sensitivity to Anatomical Localization Error
We next test the concern that inaccurate anatomical supports may propagate into downstream performance. For inference-time perturbation, each local crop is independently translated horizontally/vertically and isotropically rescaled by a value sampled uniformly within the indicated percentage of its width/height while remaining inside the image. We also test severe semantic errors by swapping the left- and right-lung crops or randomly permuting all three anatomy crops. For training-time robustness, the same random translation/scale jitter is applied when constructing the local crops during retraining, followed by evaluation with the standard clean inference procedure.
The model is therefore not invariant to localization error, nor should it be: explicit anatomical correspondence is part of the supervision. However, the 5% perturbation regime changes the two CheXpert metrics by at most 0.8 points and RSNA AUC by at most 0.3 points, indicating practical tolerance to small crop-boundary or coordinate errors. The degradation becomes systematic at 10%, and deliberate anatomy swaps are substantially more harmful, especially on the anatomy-sensitive CheXpert tasks. The perturbation curve is consistent with the intended mechanism: moderate boundary noise is buffered by contextual cropping, while gross semantic mislocalization weakens the local alignment signal. Table 13 summarizes these controlled perturbation results.
Table 13.
Controlled anatomical-localization perturbation. Values are percentages; parentheses show changes from the clean AGIRA model. Mild coordinate/mask error produces small degradation, whereas large perturbations or explicit anatomy swaps cause larger losses.
3.2.6. Control for Per-Batch Reuse
Because the anatomy-level branch reuses each study multiple times within a training step, an alternative explanation is that AGIRA benefits from repeated exposure rather than from anatomical supervision. The F2F control tests this possibility by replacing anatomical crops and report fragments with repeated full images and full reports while preserving the same reuse pattern.
The control improves over removing AA entirely, showing that additional full-image/full-report supervision can provide some regularization. However, it remains clearly below the full AGIRA model: the gaps are 2.4%, 2.5%, and 1.8% on I2T retrieval, 1.2 AUC, 1.7 ACC, and 1.3 F1 on RSNA, and 7.5 ACC on CheXpert zero-shot classification. Thus, the decisive factor is not repeated use of the batch, but the anatomical decomposition that forces local image regions and local report evidence into a shared semantic space.
3.2.7. Effect of Global Alignment
Although AGIRA emphasizes anatomy-level correspondence, global image–report alignment remains an important complementary component. To evaluate its role, we remove the global alignment branch and retain the anatomy-level branch and global–local continuity regularization. This setting tests whether local anatomical correspondence alone is sufficient for downstream transfer and retrieval.
As shown in Table 14, removing global alignment consistently degrades performance across all downstream tasks. On CheXpert 5 × 200 image-to-text retrieval, P@5/P@10/P@100 decrease from 53.7%, 53.0%, and 46.8% to 47.3%, 47.9%, and 44.2%, respectively. The effect is even more pronounced on CheXpert 8 × 200 text-to-image retrieval, where P@5 drops from 47.0% to 38.0%. Zero-shot classification also declines: RSNA Pneumonia AUC/ACC/F1 decrease from 92.0%, 84.2%, and 79.0% to 91.6%, 83.9%, and 77.5%, while CheXpert 5 × 200 ACC decreases from 57.5% to 53.3%.
Table 14.
Ablation of global alignment. GA: global alignment; AA: anatomy-level alignment. Removing GA disables the complete-image/complete-report alignment branch and leaves the model mainly supervised by anatomy-level correspondence and reconstruction regularization. Bold denotes the best values.
These results show that anatomy-level supervision alone cannot fully replace global examination-level semantics. Local anatomical correspondence helps recover fine-grained structural evidence, but the complete radiograph and complete report still provide disease-level context, co-occurring findings, and overall clinical semantics. The full AGIRA model therefore benefits from the combination of global alignment and anatomy-level alignment: the former preserves full-examination context, while the latter grounds this context in clinically meaningful anatomical regions.
3.2.8. Independent Contributions of Temporal and Lateral Views
To separate the additional clinical context carried by temporal and lateral inputs from the anatomy-aware alignment mechanism, we perform three fixed-cohort ablations: remove temporal information while retaining current frontal–lateral views; remove the lateral view while retaining current and previous frontal views; and remove both, leaving only the current frontal view. Table 15 reports absolute performance. All other AGIRA components are unchanged.
Table 15.
Ablation of temporal and lateral-view information. Values are percentages. Parentheses show the change from full AGIRA; positive values indicate an increase.
Temporal information and lateral views therefore each contribute independently on most metrics, and the joint removal produces the largest overall degradation. The isolated -point T2I P@5 change after removing the lateral view is an exception rather than the overall trend: lateral information can be complementary at some ranks and redundant at others, so a small candidate set can reorder even while P@10/P@100 and the other downstream tasks degrade. Most importantly, anatomy-aware alignment remains enabled in every row, so these experiments distinguish gains from additional temporal/multiview clinical information from gains caused by the anatomy branch itself.
The ablation suite is designed to estimate marginal contributions under a fixed full-model reference. It does not claim to identify every higher-order interaction among GA, AA, HSL, MIM, MLM, temporal input, and lateral input. A complete binary factorial over these seven switches would contain configurations, including redundant or ill-defined combinations (for example, soft-label components that require a removed lateral branch). We therefore report interpretable one-factor and grouped ablations and restrict the corresponding claims to component necessity and marginal contribution.
3.2.9. Hyperparameter and Design-Choice Sensitivity
Table 16 reports the internal development sweep used to select the reviewer-identified fixed choices, together with downstream sensitivity around the selected point. Selection uses only the patient-disjoint MIMIC-CXR development split; CheXpert and RSNA columns are shown only to demonstrate that the local performance landscape is consistent with the internal selection rather than to tune the values.
Table 16.
Sensitivity of the principal fixed design choices. Dev R@10 is the internal MIMIC-CXR bidirectional retrieval metric used for selection; external columns are post-selection robustness checks. The selected setting in each block is bold.
The selected values lie at, or very near, the maximum of the internal development sweep rather than at an arbitrary isolated setting. The curves are also smooth: neighboring values change downstream performance by less than one point in most cases, whereas clearly over-permissive/over-restrictive thresholds and large margins degrade both the internal criterion and external tasks. Equal anatomy weights are marginally stronger than deliberately down/up-weighting the heart, supporting the simple unbiased three-node objective. These results provide an empirical selection rationale while showing that the main conclusions do not depend on a single fragile hyperparameter value.
3.2.10. Overall Ablation Findings
Overall, the ablations establish a coherent mechanism–performance link. AA provides the main fine-grained anatomical supervision and produces the largest gains, while GA supplies complementary examination-level semantics that cannot be fully recovered from local anatomical correspondence alone. HSL makes the contrastive supervision more robust to clinically related negatives, GLCR protects global–local semantic continuity while the lightweight adapters specialize to local anatomy, and the temporal/lateral ablations show that the additional views provide independent context rather than explaining away the anatomy effect. These are marginal component tests; we do not interpret them as an exhaustive decomposition of every higher-order interaction.
These findings show that AGIRA improves CXR representation learning not merely by adding local supervision, but by preserving the semantic relationship between local anatomical patterns and global examination-level context. The results therefore support hierarchical, multi-granularity learning for CXR image–text representation under the reported benchmark settings.
3.3. Finite-Scale Fractal Analysis of Anatomical Structure and Model Behavior
3.3.1. Finite-Scale Geometry and Multifractal Texture Across Anatomical Levels
Table 17 reports the finite-scale boundary and gradient-energy descriptors before we interpret their global–local differences.
Table 17.
Finite-scale descriptors on the 964 retained CheXpert 5 × 200 radiographs. Values are median [interquartile range]. Panel (a) reports contour geometry, and panel (b) reports gradient-energy texture.
Of the 1000 images, 26 lacked complete masks and 10 failed the quality threshold. Each of the 964 retained images produced five coded texture-support records—whole image, bilateral-lung union, left lung, right lung, and heart—giving texture estimates.
The boundary of the union of the three anatomical masks had the largest median , followed by the left lung, heart, and right lung. All six paired boundary contrasts remained significant after Holm correction (), although the estimates remained close to the dimension of a smooth planar contour. On the separately defined texture supports, the whole-image was 0.598 [0.465, 0.785], compared with 0.279 [0.218, 0.343], 0.284 [0.228, 0.344], and 0.268 [0.189, 0.354] for the left lung, right lung, and heart. The three local widths were broadly comparable: left–right and left–heart were not significant after correction, and the right–heart median difference was only 0.013. These results support complementary global and anatomy-conditioned finite-scale signatures rather than a single descriptor for the complete radiograph. Importantly, this conclusion is not obtainable from a first-order intensity mean or variance alone: is defined from occupancy over several box sizes, while and depend on how normalized gradient-energy mass changes with both scale and moment order. Conversely, these descriptors do not replace conventional texture or uncertainty analyses; they answer the narrower multiscale question summarized in Table 3.
3.3.2. Incremental Value Beyond Conventional Texture and Uncertainty
The conceptual distinction in Table 3 is tested empirically in Table 18. Models are fitted only to frozen post hoc variables and are evaluated on held-out patient folds; none of these features enters AGIRA training.
Table 18.
Nested incremental-value analysis on the retained CheXpert cases. AUROC measures identification of anatomy-alignment-sensitive cases (AGIRA succeeds while no-AA fails). predicts the continuous AGIRA-minus-no-AA similarity-margin change. Values in brackets are 95% bootstrap confidence intervals over held-out predictions. Bold denotes the best values.
Adding the finite-scale descriptors to intensity, GLCM/LBP texture, and uncertainty increases held-out AUROC by 0.060 for zero-shot gain cases and 0.053 for retrieval gain cases, and raises cross-validated for the continuous margin change by 0.079. All three increments remain significant under paired bootstrap and 5000 label permutations (). Conversely, the combined model also exceeds the fractal-only model, confirming complementarity rather than redundancy. After residualizing against all conventional/uncertainty variables, its partial Spearman association with the AGIRA-minus-no-AA margin remains 0.184 [0.122, 0.244] for zero-shot classification and 0.137 [0.076, 0.196] for retrieval. Therefore, the scientific value of the finite-scale analysis is not merely that it describes the images differently: it supplies measurable additional information about where anatomy-aware alignment changes model behavior after standard statistics, texture, and confidence are already known.
3.3.3. Performance Stratified by Anatomy-Conditioned Spectrum Width
The complexity-stratified comparison is summarized in Table 19; the strata are within-class rank groups rather than absolute biological thresholds.
Table 19.
Model performance within disease-class-specific, within-class tertiles of anatomy-conditioned . Cardiomegaly uses the heart support; the other four classes use the bilateral-lung union. Values are percentages with 95% sample-level bootstrap confidence intervals. Bold text shows the comparison results.
AGIRA exceeded no-AA in all three classification strata by 17.1 [12.1, 22.4], 10.3 [4.7, 16.0], and 10.2 [5.0, 15.2] percentage points. For I2T P@5, the gains were 7.2 [3.7, 10.7], 4.4 [1.1, 7.6], and 2.5 [, 5.7] points. Thus, the classification benefit persisted across the heterogeneity range, whereas the high-stratum retrieval interval included zero. The gain was larger in the low than high stratum by 6.9 [0.7, 13.1] points for accuracy and 4.7 [0.6, 8.8] points for P@5, so the data do not support preferential amplification of anatomy alignment in the most heterogeneous cases. Because tertiles are rank-based, exact membership of samples near a cut point can change when is recomputed at another resolution or scale window. The purpose of this experiment is therefore not to claim immutable low/medium/high patient categories, but to test whether the AGIRA advantage is confined to one narrow part of the observed heterogeneity distribution.
3.3.4. Finite-Scale Descriptor–Embedding Distance Concordance
Table 20 quantifies the local descriptor–embedding distance concordance for the frozen models.
Table 20.
Spearman descriptor–embedding distance concordance for the three support-consistent local domains. Each cell reports the point estimate and sample-level bootstrap 95% confidence interval. The mean-local column is the prespecified average across left lung, right lung, and heart. Bold text denotes the best values.
AGIRA’s mean local was 0.076 [0.058, 0.093], compared with 0.060 [0.042, 0.077] for no-AA and 0.063 [0.045, 0.080] for F2F. Paired differences were 0.0160 [0.0026, 0.0292] and 0.0131 [0.0003, 0.0258], respectively. The absolute correlations are small and should be interpreted as weak effects: does not imply that AGIRA embeddings are “fractal” or dominated by the handcrafted descriptors. Embeddings also encode pathology, acquisition factors, and semantic content that are intentionally absent from the four-dimensional finite-scale descriptor vector. The practical value of this analysis is comparative and paired: AGIRA produces a small but reproducible increase over no-AA and F2F, with the reported paired bootstrap intervals excluding zero. We therefore use this result as supporting evidence of improved local structural ordering, not as a stand-alone proof of representation quality.
3.3.5. Estimator Robustness Across Scale Windows and Resolutions
Table 21 summarizes the sensitivity checks used to judge whether rank-based heterogeneity stratification is defensible under reasonable analysis perturbations.
Table 21.
Robustness of the principal finite-scale descriptors to scale-window and image-resolution changes. CV is the median leave-one-scale-out coefficient of variation at 224 pixels; ICC(3,1) summarizes agreement across 192, 224, and 256 pixels.
Across the 3856 boundary-support records for and the 4820 texture-support records for and at 224 pixels, the low CVs for and indicate stable absolute estimates under leave-one-scale-out perturbation. is more sensitive in absolute value (19.79% CV), but its cross-resolution ICC remains high (median 0.932; regional range 0.924–0.964), indicating that sample ordering is substantially more stable than the raw width. The resolution check uses 192, 224, and 256 pixels with proportionally adjusted scale windows, so it simultaneously perturbs rasterization and the discrete box sequence. These results support the use of for relative, within-dataset stratification while explicitly ruling out a resolution-invariant interpretation. We therefore do not claim that every sample remains in exactly the same tertile; samples near a tertile boundary can change groups, whereas the population-level rank structure remains sufficiently stable for the reported exploratory stratification.
Reviewer-requested parameter-setting sensitivity is reported separately in Table 22. The reference is , , and ; only one analysis parameter is changed per row.
Table 22.
Robustness of rank stratification to analysis-parameter settings. is Spearman agreement with the reference ranking; agreement is exact within-class tertile membership. The final two columns report AGIRA-minus-no-AA gains (percentage points) after recomputing the strata.
Even the strongest tested parameter perturbation preserves rank correlation above 0.93 and exact tertile agreement above 82%. More importantly, the substantive stratified conclusion is unchanged in every row: AGIRA remains above no-AA in all three zero-shot strata, and the gain is largest in the low-heterogeneity group; retrieval gains remain positive and progressively smaller toward the high stratum. Thus, absolute values are analysis-parameter dependent, but the rank-based grouping and the reported comparative pattern are not an artifact of the single reference values of , , or .
3.4. Visual Attention Localization and Visualization
We evaluate the attention maps used by each model’s visualization procedure on the same 250 lesion-annotated VinDr-CXR radiographs. For AGIRA, attention weights are read from the final visual Transformer block of the frozen evaluation checkpoint. The CLS row and column are removed; patch–patch weights are averaged across heads and then across query patches, reshaped to the native patch lattice, bilinearly resized to the image grid, clipped to non-negative values, and normalized to unit mass. Lesion bounding boxes are never used to generate or tune the map. For BioViL-T and GLoRIA-ViT we use each model’s native visualization map and then apply the same non-negative normalization/resampling before metric computation. Because the native visualization operators are model-specific, cross-model FCI is interpreted jointly with BAR and CR rather than as a perfectly architecture-invariant quantity.
3.4.1. Quantitative Attention Metrics
BAR and CR quantify lesion localization, whereas , , and FCI characterize the finite-scale occupancy of the attention distribution. Table 23 reports all five quantities before the corresponding interpretation.
AGIRA had the highest observed FCI, 0.361 [0.306, 0.405], compared with 0.249 [0.200, 0.293] for BioViL-T and 0.273 [0.223, 0.320] for GLoRIA-ViT. The per-image FCI–CR Spearman coefficients were 0.332 [0.216, 0.438], 0.221 [0.100, 0.345], and 0.388 [0.261, 0.496], respectively. Together with the highest BAR and CR, this result is compatible with stronger multiscale concentration around annotated lesions.
3.4.2. Qualitative Visualization
Figure 7 presents representative maps. The baseline maps more often extend into unrelated anatomy or background, whereas AGIRA is more tightly localized around the annotated regions, consistent with Table 23.
Figure 7.
Attention heat maps on VinDr-CXR. The leftmost panel shows the lesion bounding box, followed by GLoRIA-ViT, BioViL-T, and AGIRA.
3.5. Computational Efficiency Analysis
To characterize the parameter and training-cost profile of AGIRA, we compare it with GLoRIA-ViT and BioViL-T on the same hardware (a single RTX 5090 GPU, batch size 24), measuring parameter counts, per-batch latency, corpus size, and total wall-clock time in Table 24. This experiment supports configuration-specific statements about trainable parameters and measured training cost; it is not intended to establish universal computational superiority across implementations, corpora, epoch budgets, or inference settings.
Table 24.
Computational efficiency on a single RTX 5090 with batch size 24. Total/Train. are parameter counts; Fwd/Bwd are per-batch latency; Time is minutes/single-GPU hours. Bold text denotes the best values.
To further illustrate the efficiency–performance trade-off, we visualize AGIRA and representative baselines in Figure 8. The x-axis denotes the total training cost measured by single-GPU hours, while the y-axis reports zero-shot performance on RSNA Pneumonia and CheXpert 5 × 200. Under the reported single-GPU measurement protocol, AGIRA is located in the upper-left region in both subfigures, pairing stronger benchmark performance with lower measured GPU-hours for the particular training schedules used. The bubble size additionally shows its smaller trainable-parameter budget. Because corpus sizes and epoch counts differ by method, the plot should be read as an empirical resource profile under the reported configurations rather than as a hardware-independent efficiency ranking. This visualization complements the detailed statistics in Table 24.
Figure 8.
Efficiency–performance comparison of AGIRA and representative baselines. Both subfigures use training cost measured by GPU-hours as the x-axis and zero-shot classification performance as the y-axis. In (a), the y-axis reports RSNA Pneumonia AUC and the bubble size represents the number of trainable parameters. In (b), the y-axis reports CheXpert 5 × 200 zero-shot ACC and the bubble size represents CheXpert 5 × 200 image-to-text retrieval P@10, with an offset used only for visual scaling. Under the reported training configurations, AGIRA lies in the upper-left region, combining strong benchmark performance with a small trainable-parameter budget and lower measured GPU-hours; this does not imply universal computational superiority across alternative implementations or schedules.
Trainable Parameter Budget
Although AGIRA has the largest total parameter count (244.66 million) because the pretrained MIM/MLM reconstruction modules are retained during training, these modules remain fixed. Only 18.45 million task-specific parameters are optimized, comprising the Anatomy Sensors, their associated normalization parameters, and the projection heads. This corresponds to of the complete training model. By comparison, GLoRIA-ViT updates 202.82 million of 202.98 million parameters (), and BioViL-T updates all 163.15 million parameters (). AGIRA therefore cuts the trainable budget by an order of magnitude, while the frozen MRM-pretrained ViT-B/16 and CXR-BERT encoders supply the representation capacity needed for anatomy-aware adaptation.
Per-Batch Latency
AGIRA’s forward time per batch (0.138 s) is higher than GLoRIA-ViT (0.084 s) and BioViL-T (0.047 s), because each step propagates the global view together with the anatomy-level local images and lateral-view inputs. Its backward time (0.089 s) is, however, the lowest of the three, since gradients flow only through the small Anatomy Sensors while the much larger frozen backbone is exempt. The combined forward-plus-backward latency of AGIRA (0.227 s) is thus comparable to GLoRIA-ViT (0.259 s) and only modestly above BioViL-T (0.161 s).
Training Corpus and Total Wall-Clock Time
AGIRA also consumes far less data: its 34,080 anatomy-aligned MIMIC-CXR records (Section 2.7.1) amount to only of GLoRIA-ViT’s 240,000 samples and of BioViL-T’s 174,096 samples. Combined with the favorable backward latency, this gives a per-epoch time of min, against 21 min for BioViL-T and 43 min for GLoRIA-ViT. In the controlled single-GPU benchmark, AGIRA completes 15 epochs in 87 min ( GPU-h), versus 615 min ( GPU-h) for BioViL-T and 1276 min ( GPU-h) for GLoRIA-ViT, both trained for 30 epochs. Within these specific corpus sizes, epoch budgets, software settings, and the common single-GPU measurement setup, the observed totals are and lower than BioViL-T and GLoRIA-ViT, respectively. We report these ratios descriptively and do not extrapolate them to other training schedules.
Inference Cost
We do not infer a universal inference-efficiency advantage from the training-time table. The MIM/MLM decoders are discarded at inference, but exact end-to-end FLOPs and deployment latency depend on preprocessing, the number of views/crops evaluated, batching, and implementation. The defensible conclusion from Table 24 is narrower: AGIRA is parameter-efficient because only 7.54% of the complete training model is updated, and it required lower measured training GPU-hours under the reported controlled hardware/configuration. These observations support resource-conscious adaptation without claiming that AGIRA is necessarily the most computationally efficient method in every setting.
4. Discussion
AGIRA consistently improves the reported zero-shot benchmark recognition and retrieval results by combining examination-level semantics with explicit left-lung, right-lung, and heart correspondence. The ablations show complementary roles: anatomy alignment supplies the main fine-grained gain, global alignment retains complete-examination context, hybrid soft labels reduce penalties on clinically related negatives, reconstruction regularization limits disruption of the frozen representation space, and temporal/lateral views provide additional but separable clinical context. These public-benchmark findings support cross-dataset representation transfer; they should not be interpreted as evidence of prospective clinical utility without external clinical validation.
The finite-scale analysis clarifies why one descriptor is insufficient for the anatomical hierarchy. The boundary of the union of the three anatomical masks and organ contours have distinguishable effective boundary occupancy, while the complete image has a much broader gradient-energy singularity spectrum than the individual organs. The local spectrum widths are comparatively similar, so the strongest evidence concerns global–local complementarity rather than large heterogeneity differences among organs.
The new nested incremental-value analysis strengthens this interpretation beyond descriptive characterization. After first-order intensity, GLCM/LBP texture, and model-output uncertainty are entered, adding the finite-scale variables increases held-out AUROC for identifying anatomy-alignment-sensitive zero-shot and retrieval cases by 0.060 and 0.053, respectively, and increases cross-validated explained variance of the AGIRA-minus-no-AA margin by 0.079. The combined feature set also outperforms the finite-scale-only set. Thus, the fractal variables contribute information that is neither reducible to conventional texture/uncertainty nor sufficient by itself; their value is complementary and diagnostic, while remaining independent of training.
Complexity stratification provides a separate behavioral test. AGIRA’s classification advantage over no-AA remains positive across all tertiles, but the gain is largest in the low- group. Retrieval also becomes more difficult as heterogeneity increases, and the high-tertile P@5 interval includes zero. Anatomy-level supervision is therefore broadly useful but does not preferentially solve the most heterogeneous cases.
The embedding analysis shows a measurable but weak representation-level association. AGIRA has higher mean local than no-AA and F2F across the three support-consistent anatomical domains, but the absolute value of 0.076 is small. This is expected because learned embeddings encode disease semantics, acquisition variation, view, and other visual factors beyond the finite-scale signature. The paired increase supports improved local structural-rank preservation as a secondary explanatory observation; it is not evidence that fractal descriptors dominate the learned representation.
Estimator checks support this restrained interpretation. and show low leave-one-scale-out variability and high cross-resolution agreement. also has high cross-resolution ICC but greater scale-window sensitivity, so it is appropriate for relative ranking and stratification rather than as an invariant clinical biomarker. The attention analysis provides a complementary output-side probe: AGIRA combines the highest BAR and CR with the highest FCI and the strongest positive FCI–CR association. This agreement suggests that its attention is both spatially concentrated across scales and better aligned with annotated lesions.
Several limitations remain. First, the anatomical hierarchy is deliberately restricted to the left lung, right lung, and heart. Expanding it with sparsely mentioned structures (for example, upper-abdominal structures that appear only occasionally in chest reports) would create many near-empty text buckets and poorly conditioned local contrastive targets; equally important, consistent public pixel-level masks are not available for an arbitrary fine-grained hierarchy. We therefore do not claim that performance would automatically generalize to any number of anatomical nodes. A feasible extension requires both sufficient report-mention frequency and validated masks for the added regions.
Second, the deterministic parser is now independently evaluated on 600 adjudicated routing units, reaching macro-F1 0.953 and exact multi-label accuracy 0.918. The difficult-case analysis identifies the remaining weakness rather than assuming perfect labels: cross-sentence dependencies and ambiguous laterality produce the largest errors. The held-out image–fragment matching matrix is therefore interpreted as a complementary functional check, not as a circular substitute for parser accuracy. Future work can compare the deterministic rules with clinical-NLP parsers on the same gold set and extend discourse-level resolution without changing the three-node anatomy definition.
Third, no scalar “anatomical localization error” is used as a training target; mask error enters indirectly as crop/input noise. We now quantify this effect rather than discussing it only conceptually. Random translation/scale perturbations of ±5% change CheXpert I2T P@5 and zero-shot accuracy by at most 0.8 points, whereas ±10% perturbations produce 2–3 point losses and deliberate anatomy swaps produce much larger degradation. Retraining with 5% crop jitter similarly changes the clean-evaluation metrics by at most 0.6 points. These results show tolerance to moderate localization noise but also confirm that gross semantic mislocalization matters, as expected for an anatomy-guided method. At CheXpert inference the crops are still generated from approximate coordinate priors, so no downstream ground-truth segmentation is leaked.
Fourth, the method-compatible full-corpus comparisons still use different numbers of distinct MIMIC-CXR studies, but the added identical-cohort experiment retrains GLoRIA-ViT, MLIP, and BCC on the same 34,080 structured records (136,320 flat view-time instances) and preserves AGIRA’s advantage across all reported metrics. Thus, cohort availability no longer provides the only explanation for the cross-method gap. Fifth, finite-scale estimates remain dependent on preprocessing and analysis definition, but the new // sensitivity study preserves rank correlation above 0.93, exact tertile agreement above 82%, and the same low/intermediate/high comparative pattern. Finally, all evaluations remain retrospective public-benchmark experiments. Practical future work is therefore to validate the current three-node hierarchy across institutions; externally validate and enlarge the new gold routing set; compare deterministic, clinical-NLP, and discourse-aware parsers on the same reference annotations; evaluate robustness under more realistic segmentation-error models and acquisition shifts; and expand anatomy only when sufficient paired text frequency and reliable masks are available.
5. Conclusions
AGIRA combines whole-image and anatomy-level image–report alignment with parameter-efficient adaptation, reconstruction regularization, temporal–multiview fusion, and hybrid soft labels. It improves zero-shot benchmark recognition and cross-modal retrieval across the reported public datasets while updating only 7.54% of the complete model.
The post hoc analysis gives the fractal component a defined and testable role. In addition to the multiscale geometry, heterogeneity stratification, descriptor–embedding concordance, and attention concentration analyses, the nested incremental-value experiment shows that finite-scale descriptors improve held-out identification of anatomy-alignment-sensitive cases after conventional intensity, texture, and uncertainty variables are already supplied. Parameter sweeps over , , and preserve the rank-based heterogeneity pattern. The added parser gold-standard, identical-cohort baseline control, hyperparameter sweep, and localization-perturbation experiments further strengthen the reliability of the anatomy-guided conclusions. The fractal quantities remain strictly post hoc: they do not participate in training and the findings do not claim exact self-similarity, a causal fractal mechanism, or prospective clinical validity.
Author Contributions
Conceptualization, Y.W.; methodology, Y.W. and H.Z.; software, Y.W.; formal analysis, Y.W. and J.Y.; investigation, Y.W. and J.Y.; data curation, Y.W.; validation, Y.W.; visualization, Y.W.; writing—original draft preparation, Y.W.; writing—review and editing, Y.W., J.Y. and H.Z.; supervision, H.Z.; project administration, H.Z.; funding acquisition, H.Z. All authors have read and agreed to the published version of the manuscript.
Funding
This work was supported in part by the China Postdoctoral Science Foundation under Grant No. 2026M791843, and in part by the Shandong Postdoctoral Science Foundation under Grant No. SDZZ-ZR-202501303.
Institutional Review Board Statement
Not applicable. This study involved secondary analysis of de-identified research datasets and did not involve prospective participant recruitment or clinical intervention.
Informed Consent Statement
Not applicable.
Data Availability Statement
The datasets analyzed in this study are available from their respective public repositories, including MIMIC-CXR, CheXpert, CheXmask, RSNA Pneumonia, and VinDr-CXR, subject to the access conditions established by the dataset providers.
Conflicts of Interest
The authors declare no conflicts of interest.
Abbreviations
The following abbreviations are used in this manuscript:
| ACC | Accuracy |
| AGIRA | Anatomy-Guided Image–Report Alignment |
| AUC | Area under the receiver operating characteristic curve |
| BAR | Bounding-box attention ratio |
| CLIP | Contrastive Language-Image Pretraining |
| CR | Concentration ratio |
| CXR | Chest X-ray |
| F2F | Full-image/full-text reuse control |
| FCI | Finite-scale concentration index |
| FD | Fractal dimension |
| FFN | Feed-forward network |
| GA | Global alignment |
| GLCR | Global–local continuity regularization |
| HSL | Hybrid soft labels |
| I2T | Image-to-text |
| KL | Kullback–Leibler |
| MIM | Masked image modeling |
| MLM | Masked language modeling |
| MRM | Masked record modeling |
| MSA | Multi-head self-attention |
| MF | Multifractal |
| P@k | Precision at rank k |
| T2I | Text-to-image |
| ViT | Vision Transformer |
| VLP | Vision–language pretraining |
References
- Majkowska, A.; Mittal, S.; Steiner, D.F.; Reicher, J.J.; McKinney, S.M.; Duggan, G.E.; Eswaran, K.; Chen, P.H.C.; Liu, Y.; Kalidindi, S.R.; et al. Chest Radiograph Interpretation with Deep Learning Models: Assessment with Radiologist-adjudicated Reference Standards and Population-adjusted Evaluation. Radiology 2020, 294, 421–431. [Google Scholar] [CrossRef] [Scilit]
- Zhang, H.; Wang, D.; Yang, J.; Zhao, Y.; Liu, Y.; Zhu, R.; Wang, L.; Song, R.; Zhang, W. Unsupervised Disentanglement of Brain Heterogeneity for Identifying Subtypes of Alzheimer’s Disease. IEEE Trans. Biomed. Eng. 2026. [Google Scholar] [CrossRef] [Scilit]
- Alexander, R.; Waite, S.; Bruno, M.A.; Krupinski, E.A.; Berlin, L.; Macknik, S.; Martinez-Conde, S. Mandating limits on workload, duty, and speed in radiology. Radiology 2022, 304, 274–282. [Google Scholar] [CrossRef] [Scilit]
- Xia, L.; Zhang, H.; Wu, Y.; Song, R.; Ma, Y.; Mou, L.; Liu, J.; Xie, Y.; Ma, M.; Zhao, Y. 3D vessel-like structure segmentation in medical images by an edge-reinforced network. Med. Image Anal. 2022, 82, 102581. [Google Scholar] [CrossRef] [Scilit]
- Nabulsi, Z.; Sellergren, A.; Jamshy, S.; Lau, C.; Santos, E.; Kiraly, A.P.; Ye, W.; Yang, J.; Pilgrim, R.; Kazemzadeh, S.; et al. Deep learning for distinguishing normal versus abnormal chest radiographs and generalization to two unseen diseases tuberculosis and COVID-19. Sci. Rep. 2021, 11, 15523. [Google Scholar] [CrossRef] [Scilit]
- Radford, A.; Kim, J.W.; Hallacy, C.; Ramesh, A.; Goh, G.; Agarwal, S.; Sastry, G.; Askell, A.; Mishkin, P.; Clark, J.; et al. Learning transferable visual models from natural language supervision. In Proceedings of the International Conference on Machine Learning, Virtual, 18–24 July 2021; pp. 8748–8763. [Google Scholar]
- Zhang, Y.; Jiang, H.; Miura, Y.; Manning, C.D.; Langlotz, C.P. Contrastive learning of medical visual representations from paired images and text. In Proceedings of the Machine Learning for Healthcare Conference, Durham, NC, USA, 5–6 August 2022; pp. 2–25. [Google Scholar]
- Boecking, B.; Usuyama, N.; Bannur, S.; Castro, D.C.; Schwaighofer, A.; Hyland, S.; Wetscherek, M.; Naumann, T.; Nori, A.; Alvarez-Valle, J.; et al. Making the most of text semantics to improve biomedical vision–language processing. In Proceedings of the European Conference on Computer Vision; Springer: Berlin/Heidelberg, Germany, 2022; pp. 1–21. [Google Scholar]
- You, K.; Gu, J.; Ham, J.; Park, B.; Kim, J.; Hong, E.K.; Baek, W.; Roh, B. Cxr-clip: Toward large scale chest x-ray language-image pre-training. In Proceedings of the International Conference on Medical Image Computing and Computer-Assisted Intervention; Springer: Berlin/Heidelberg, Germany, 2023; pp. 101–111. [Google Scholar]
- Huang, S.C.; Shen, L.; Lungren, M.P.; Yeung, S. Gloria: A multimodal global-local representation learning framework for label-efficient medical image recognition. In Proceedings of the IEEE/CVF International Conference on Computer Vision; IEEE: New York, NY, USA, 2021; pp. 3942–3951. [Google Scholar]
- Halsey, T.C.; Jensen, M.H.; Kadanoff, L.P.; Procaccia, I.; Shraiman, B.I. Fractal measures and their singularities: The characterization of strange sets. Phys. Rev. A 1986, 33, 1141–1151. [Google Scholar] [CrossRef] [Scilit]
- Chhabra, A.B.; Jensen, R.V. Direct determination of the f(α) singularity spectrum. Phys. Rev. Lett. 1989, 62, 1327–1330. [Google Scholar] [CrossRef] [Scilit]
- Sarkar, N.; Chaudhuri, B.B. Multifractal and generalized dimensions of gray-tone digital images. Signal Process. 1995, 42, 181–190. [Google Scholar] [CrossRef] [Scilit]
- Soille, P.; Rivest, J.F. On the validity of fractal dimension measurements in image analysis. J. Vis. Commun. Image Represent. 1996, 7, 217–229. [Google Scholar] [CrossRef] [Scilit]
- Ko, H.; Park, C.M. Bringing clip to the clinic: Dynamic soft labels and negation-aware learning for medical analysis. In Proceedings of the Computer Vision and Pattern Recognition Conference, Nashville, TN, USA, 11–15 June 2025; pp. 25897–25906. [Google Scholar]
- Li, Z.; Yang, L.T.; Ren, B.; Nie, X.; Gao, Z.; Tan, C.; Li, S.Z. Mlip: Enhancing medical visual representation with divergence encoder and knowledge-guided contrastive learning. In Proceedings of the IEEE/CVF Conference on Computer Vision and Pattern Recognition; IEEE: New York, NY, USA, 2024; pp. 11704–11714. [Google Scholar]
- Wu, B.; Xie, Y.; Zhang, Z.; Phan, M.H.; Chen, Q.; Chen, L.; Wu, Q. MMCLIP: Cross-modal Attention Masked Modelling for Medical Language-Image Pre-Training. arXiv 2024, arXiv:2407.19546. [Google Scholar] [CrossRef] [Scilit]
- Zhou, H.Y.; Lian, C.; Wang, L.; Yu, Y. Advancing Radiograph Representation Learning with Masked Record Modeling. In Proceedings of the International Conference on Learning Representations, Kigali, Rwanda, 1–5 May 2023. [Google Scholar]
- Lian, C.; Zhou, H.Y.; Liang, D.; Qin, J.; Wang, L. Efficient Medical Vision-Language Alignment Through Adapting Masked Vision Models. IEEE Trans. Med. Imaging 2025, 44, 4499–4510. [Google Scholar] [CrossRef] [Scilit]
- Zhang, H.; Song, R.; Wang, L.; Mou, L.; Lu, Y.; Zhao, Y.; Zhang, W. Learning general brain network representations of different brain disorders using invariant subgraph gnn. IEEE Trans. Signal Inf. Process. Netw. 2025, 11, 230–241. [Google Scholar] [CrossRef] [Scilit]
- Zhang, H.; Wang, L.; Zhao, Y.; Xie, J.; Fang, T.; Song, R.; Zhang, W. Heterophily-Aware Spectral GCN for Population-Level Brain Disorder Prediction. IEEE J. Biomed. Health Inform. 2026. [Google Scholar] [CrossRef] [Scilit]
- Wang, F.; Zhou, Y.; Wang, S.; Vardhanabhuti, V.; Yu, L. Multi-granularity cross-modal alignment for generalized medical visual representation learning. Adv. Neural Inf. Process. Syst. 2022, 35, 33536–33549. [Google Scholar] [CrossRef] [Scilit]
- Choi, H.; Jang, Y.K.; Eom, C. Goal: Global-local object alignment learning. In Proceedings of the IEEE/CVF Conference on Computer Vision and Pattern Recognition; IEEE: New York, NY, USA, 2025; pp. 4070–4079. [Google Scholar]
- Wu, C.; Zhang, X.; Zhang, Y.; Wang, Y.; Xie, W. Medklip: Medical knowledge enhanced language-image pre-training for x-ray diagnosis. In Proceedings of the IEEE/CVF International Conference on Computer Vision; IEEE: New York, NY, USA, 2023; pp. 21372–21383. [Google Scholar]
- Zhang, X.; Wu, C.; Zhang, Y.; Xie, W.; Wang, Y. Knowledge-enhanced visual-language pre-training on chest radiology images. Nat. Commun. 2023, 14, 4542. [Google Scholar] [CrossRef] [Scilit]
- Chen, Z.; Li, G.; Wan, X. Align, reason and learn: Enhancing medical vision-and-language pre-training with knowledge. In Proceedings of the 30th ACM International Conference on Multimedia; ACM: New York, NY, USA, 2022; pp. 5152–5161. [Google Scholar]
- Chen, K.; Huang, Q.; Bisk, Y.; McDuff, D.; Gao, J. Kb-vlp: Knowledge based vision and language pretraining. In Proceedings of the ICML, Workshop, Online, 18–24 July 2021. [Google Scholar]
- Mahadeer, A.; Ranganathan, A.; Rajendran, G.; Shang, Y. Adaptive Petri Net Token Flow Approach for Enhanced Grayscale Image Segmentation. IET Image Process. 2025, 19, e70255. [Google Scholar] [CrossRef] [Scilit]
- Sarkar, N.; Chaudhuri, B.B. An efficient differential box-counting approach to compute fractal dimension of image. IEEE Trans. Syst. Man. Cybern. 1994, 24, 115–120. [Google Scholar] [CrossRef] [Scilit]
- Dai, G.; Wang, Q.; Qin, Y.; Wei, G.; Huang, S. VG-SAM: Visual In-Context Guided SAM for Universal Medical Image Segmentation. Fractal Fract. 2025, 9, 722. [Google Scholar] [CrossRef] [Scilit]
- Dong, X.; Xu, W.; Xu, Z.; Han, H.; Zhang, H.; Mao, J.; Dong, G. FD-HCL: A Fractal-Dimension-Guided Hierarchical Contrastive Learning Dual-Student Framework for Semi-Supervised Medical Segmentation. Fractal Fract. 2025, 9, 828. [Google Scholar] [CrossRef] [Scilit]
- Shao, Y.; Yang, J.; Zhou, W.; Sun, H.; Gao, Q. Fractal-Inspired Region-Weighted Optimization and Enhanced MobileNet for Medical Image Classification. Fractal Fract. 2025, 9, 511. [Google Scholar] [CrossRef] [Scilit]
- Gaggion, N.; Mosquera, C.; Aineseder, M.; Mansilla, L.; Milone, D.; Ferrante, E. CheXmask Database: A large-scale dataset of anatomical segmentation masks for chest x-ray images. PhysioNet 2025. Version 1.0.0. [Google Scholar] [CrossRef]
- Johnson, A.; Pollard, T.; Mark, R.; Berkowitz, S.; Horng, S. MIMIC-CXR Database. PhysioNet 2019. Version 2.0.0. [Google Scholar]
- Irvin, J.; Rajpurkar, P.; Ko, M.; Yu, Y.; Ciurea-Ilcus, S.; Chute, C.; Marklund, H.; Haghgoo, B.; Ball, R.; Shpanskaya, K.; et al. CheXpert: A large chest radiograph dataset with uncertainty labels and expert comparison. Proc. AAAI Conf. Artif. Intell. 2019, 33, 590–597. [Google Scholar] [CrossRef] [Scilit]
- Shih, G.; Wu, C.C.; Halabi, S.S.; Kohli, M.D.; Prevedello, L.M.; Cook, T.S.; Sharma, A.; Amorosa, J.K.; Arteaga, V.; Galperin-Aizenberg, M.; et al. Augmenting the national institutes of health chest radiograph dataset with expert annotations of possible pneumonia. Radiol. Artif. Intell. 2019, 1, e180041. [Google Scholar] [CrossRef] [Scilit]
- Nguyen, H.Q.; Pham, H.H.; tuan linh, l.; Dao, M.; khanh, l. VinDr-CXR: An open dataset of chest X-rays with radiologist annotations. PhysioNet 2021. Version 1.0.0. [Google Scholar] [CrossRef]
- Paszke, A.; Gross, S.; Massa, F.; Lerer, A.; Bradbury, J.; Chanan, G.; Killeen, T.; Lin, Z.; Gimelshein, N.; Antiga, L.; et al. Pytorch: An imperative style, high-performance deep learning library. Adv. Neural Inf. Process. Syst. 2019, 32, 8024–8035. [Google Scholar]
- Loshchilov, I.; Hutter, F. Decoupled weight decay regularization. arXiv 2017, arXiv:1711.05101. [Google Scholar]
- Bannur, S.; Hyland, S.; Liu, Q.; Perez-Garcia, F.; Ilse, M.; Castro, D.C.; Boecking, B.; Sharma, H.; Bouzid, K.; Thieme, A.; et al. Learning to exploit temporal structure for biomedical vision-language processing. In Proceedings of the IEEE/CVF Conference on Computer Vision and Pattern Recognition; IEEE: New York, NY, USA, 2023; pp. 15016–15027. [Google Scholar]
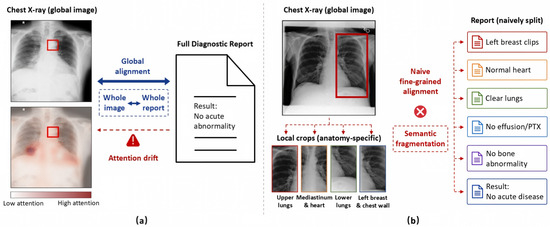
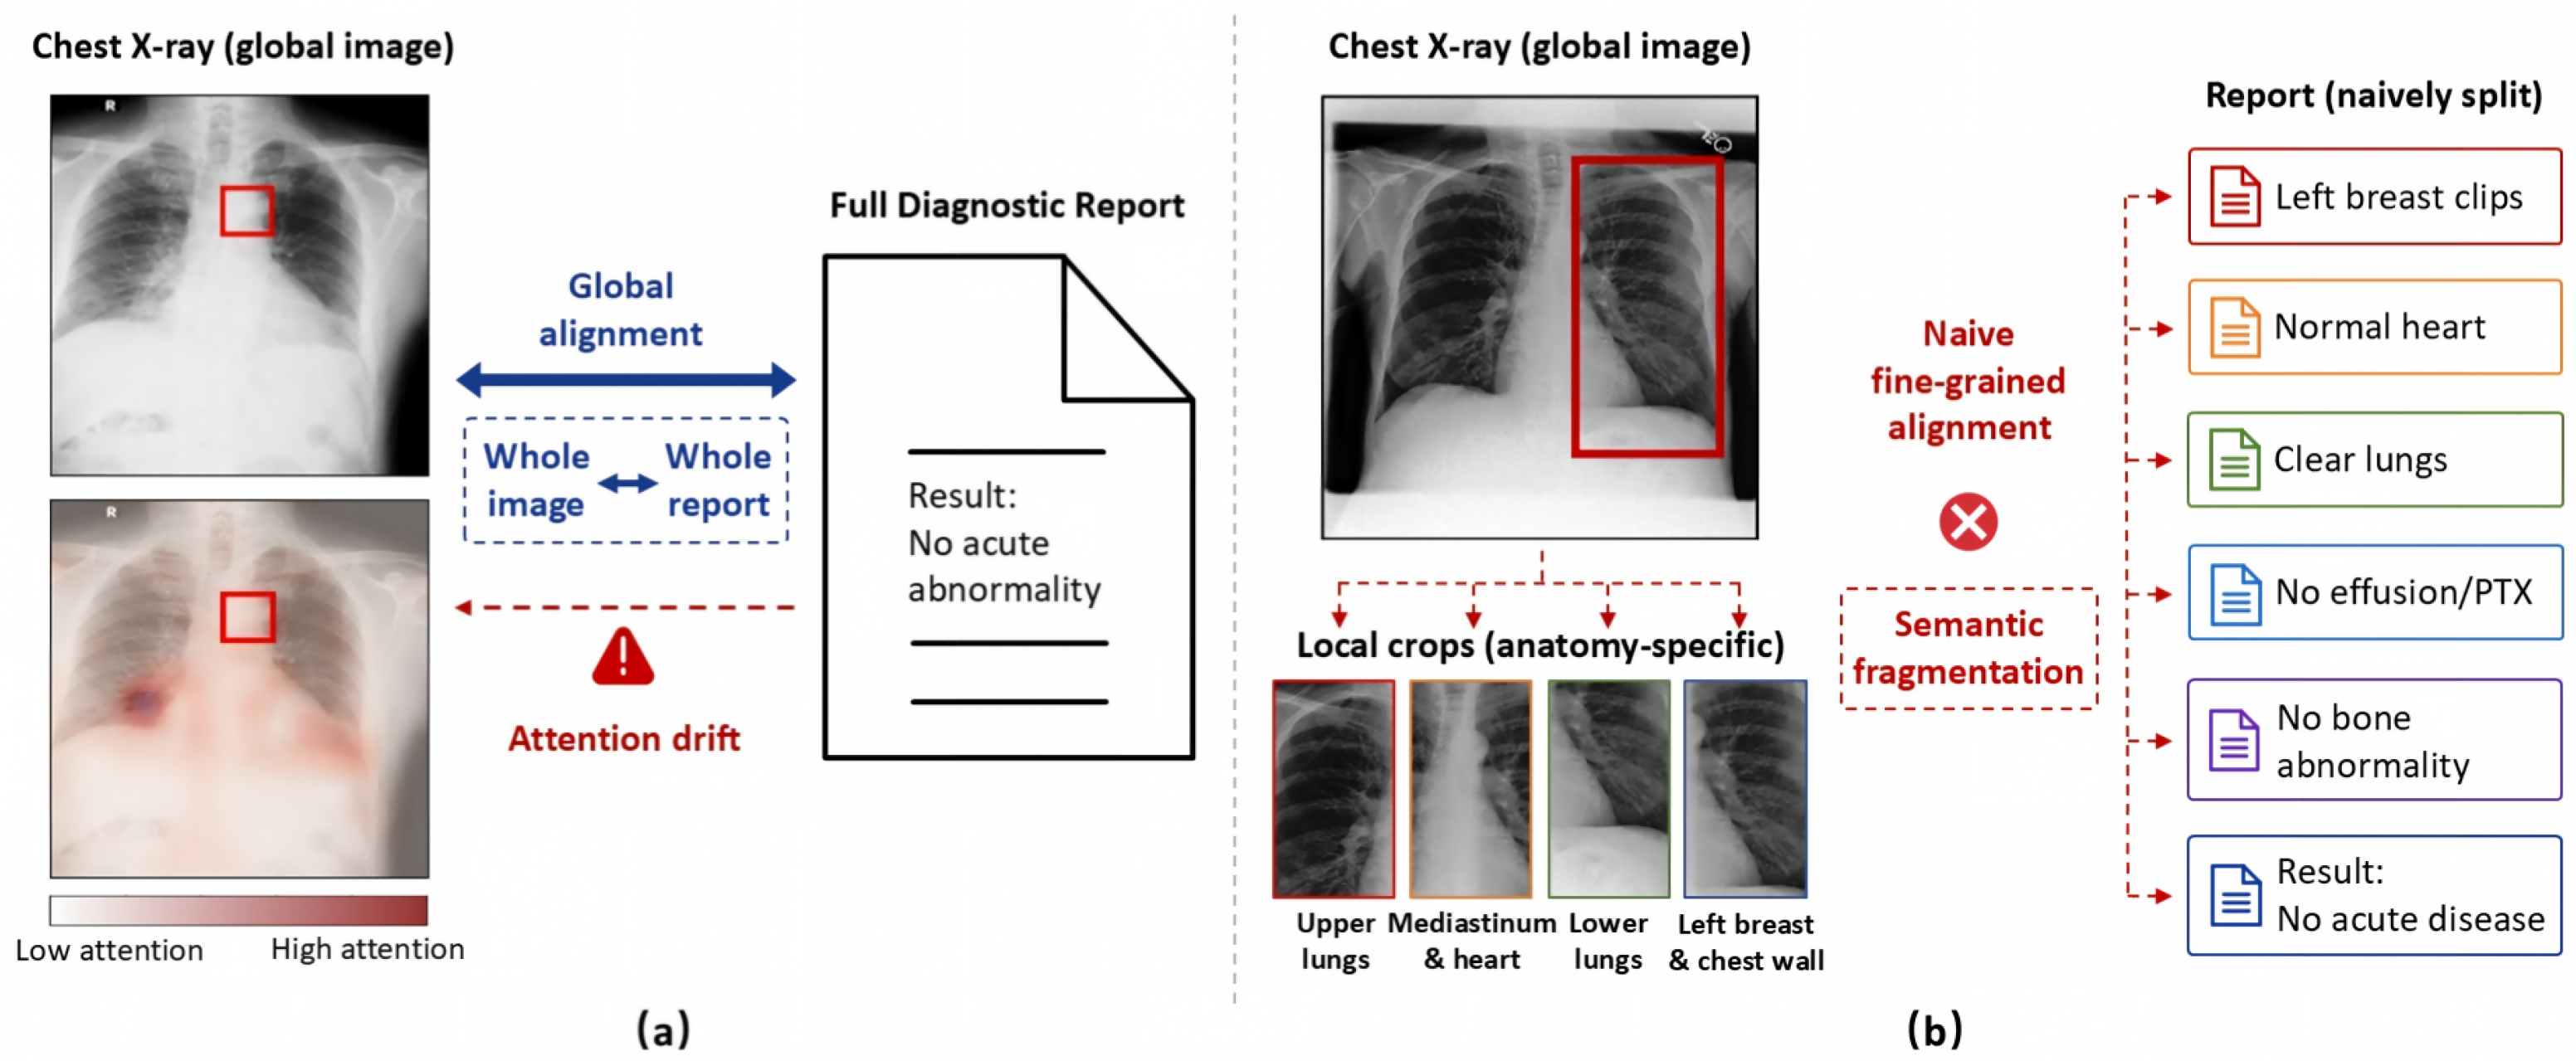
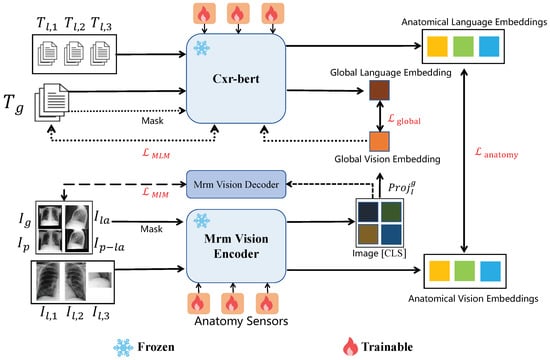
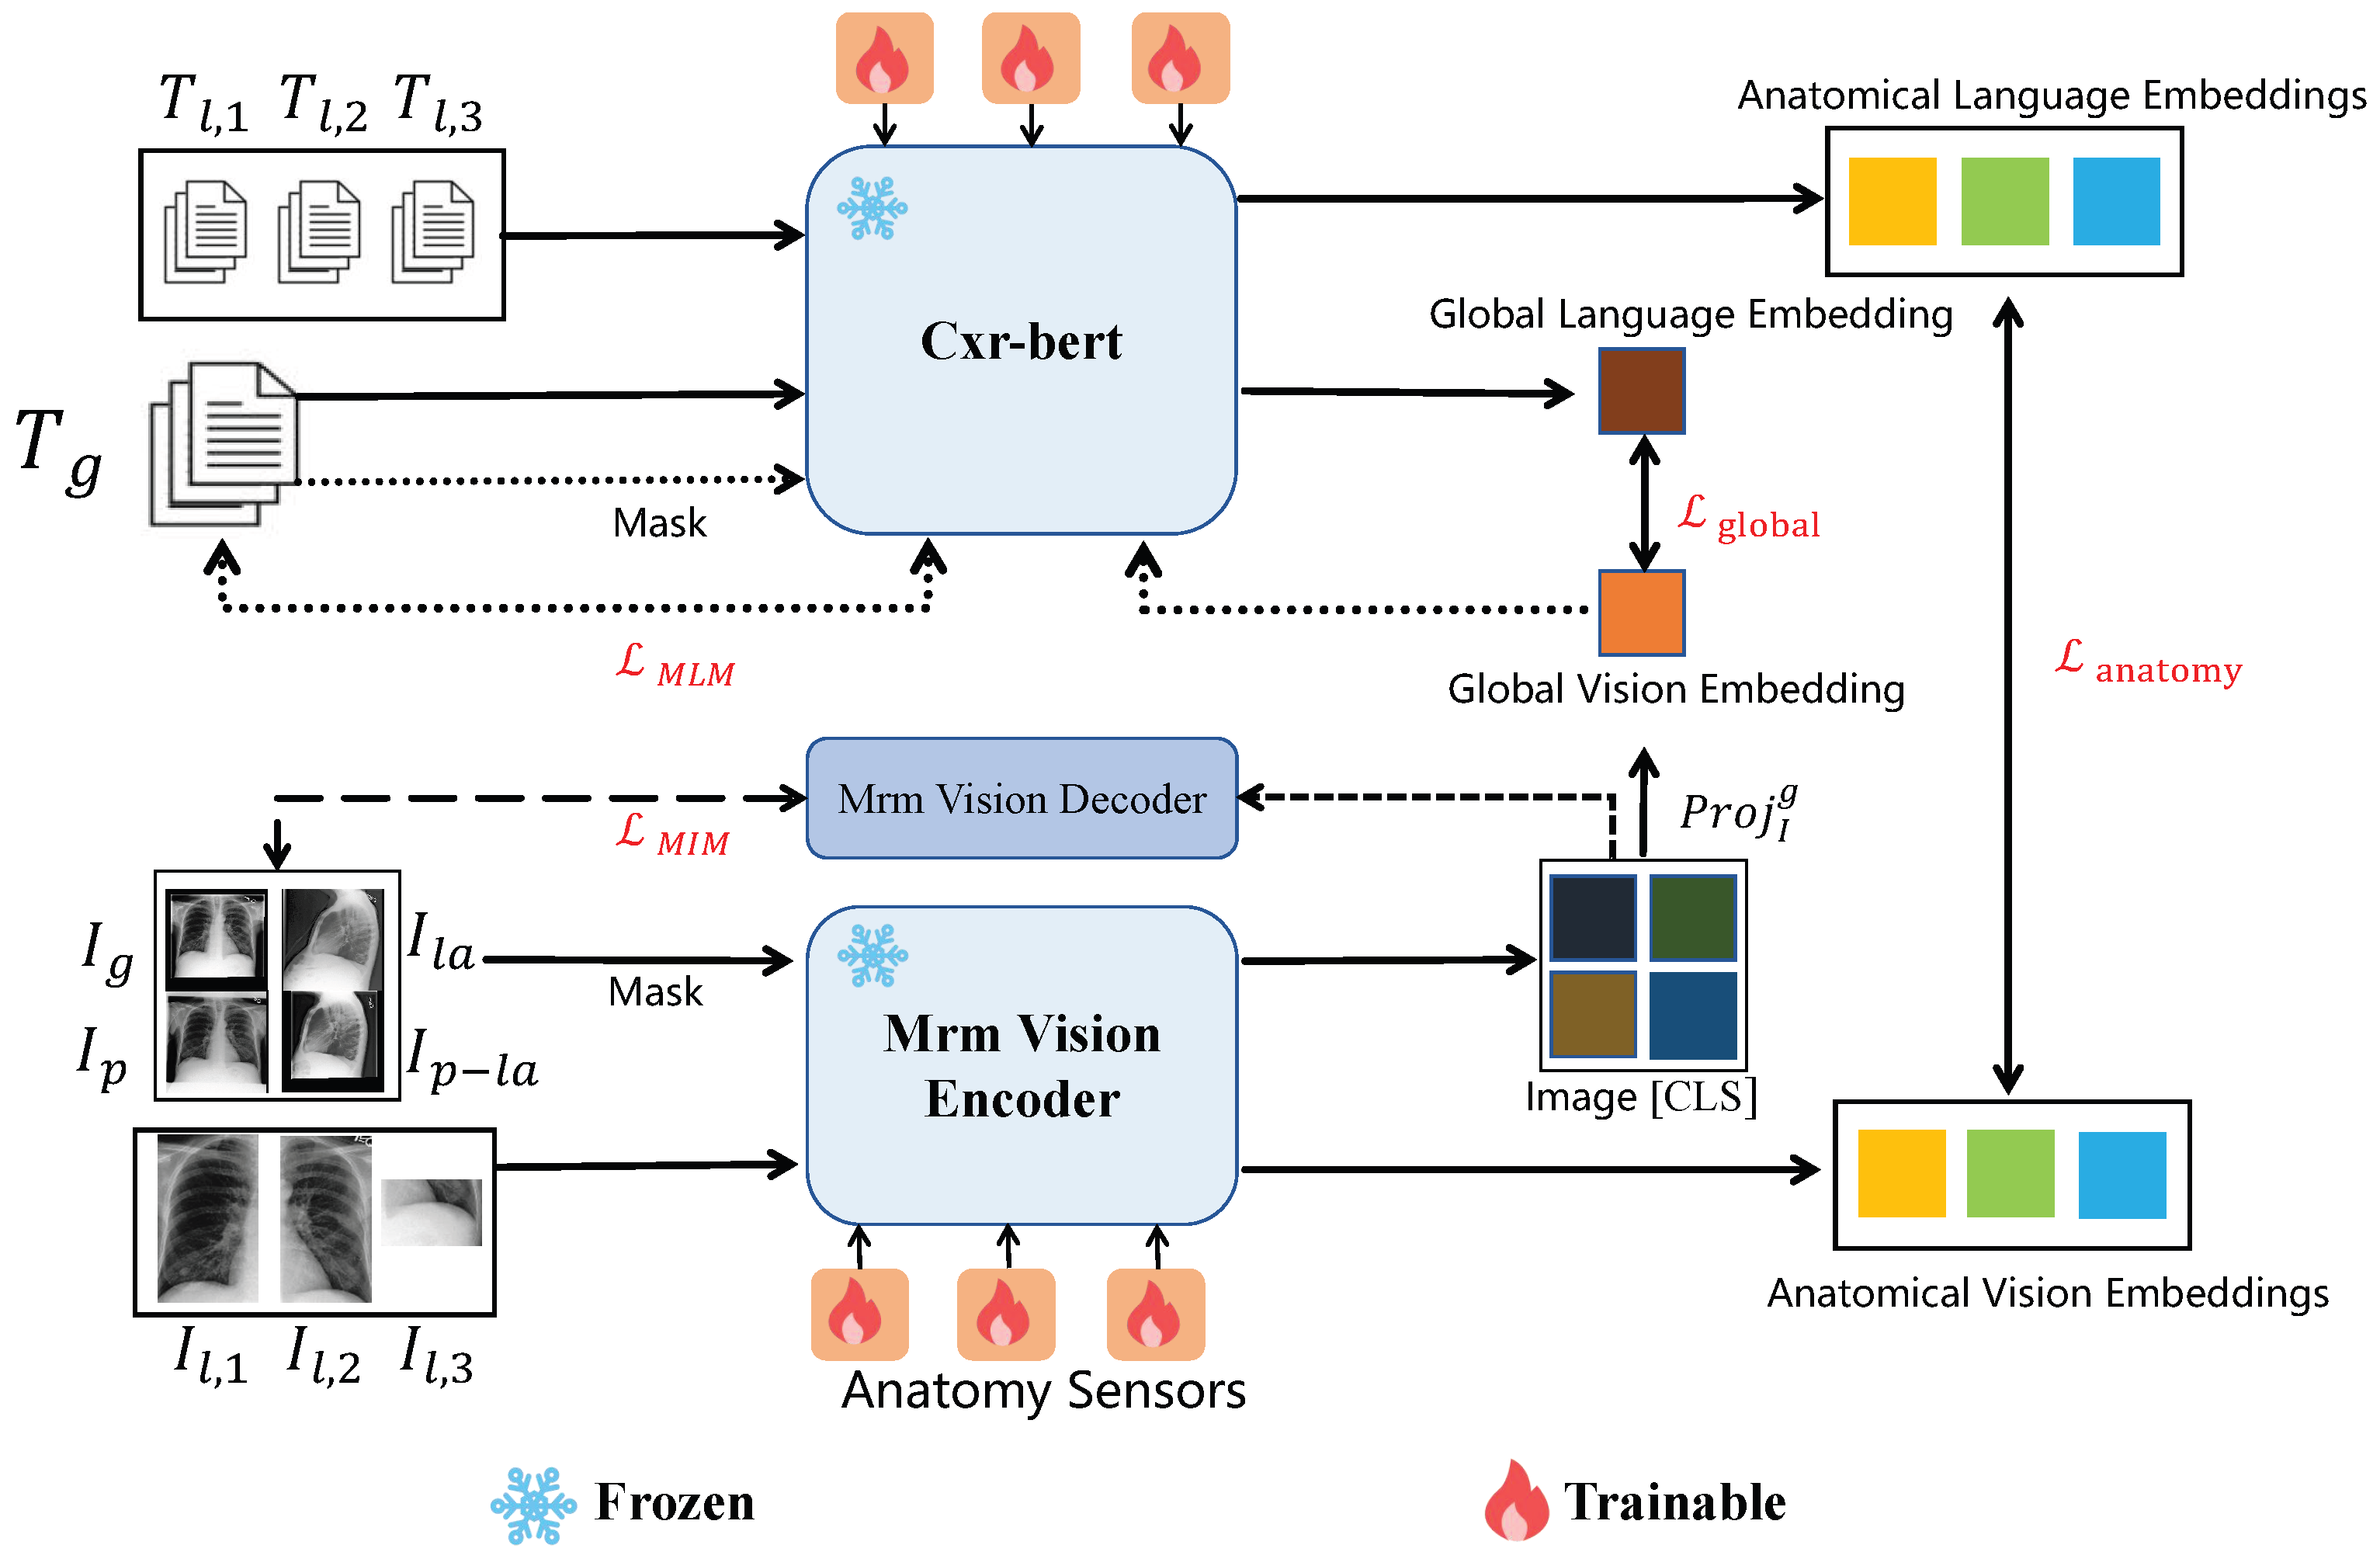
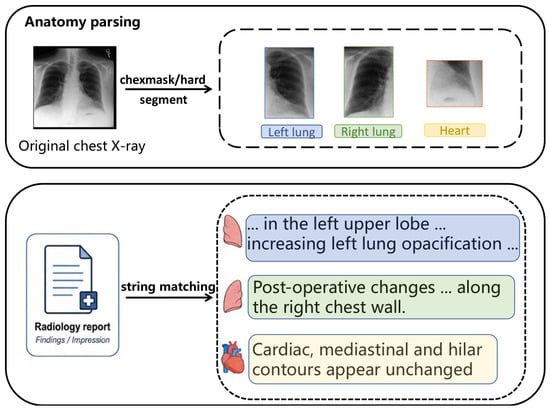
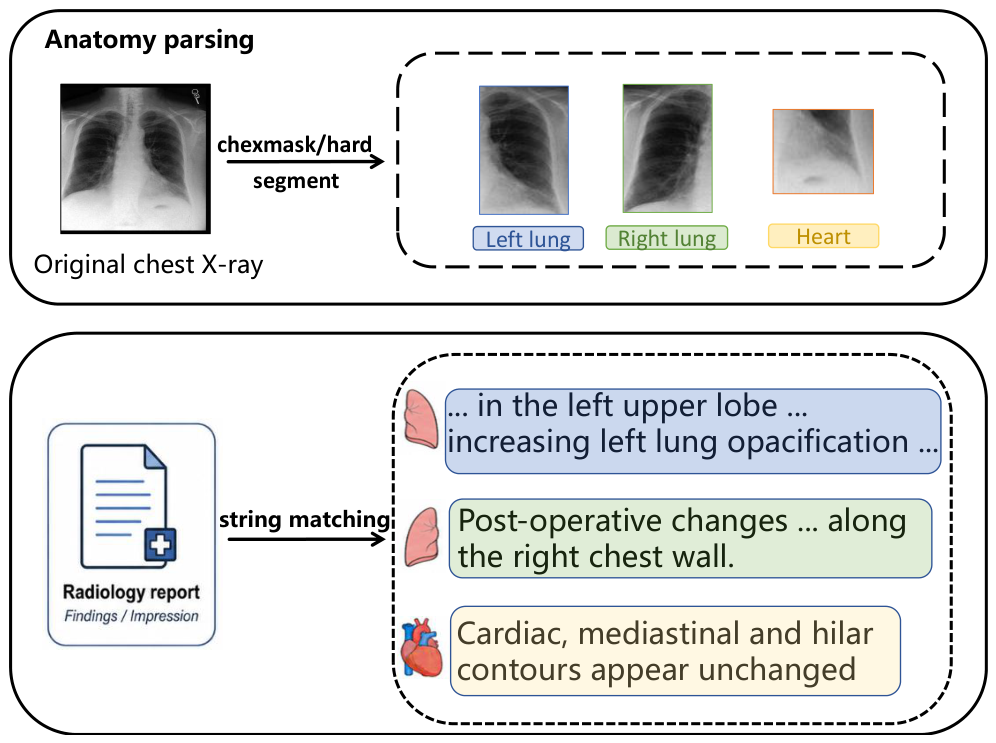
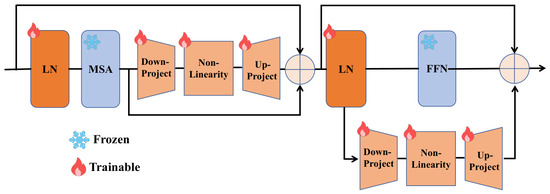
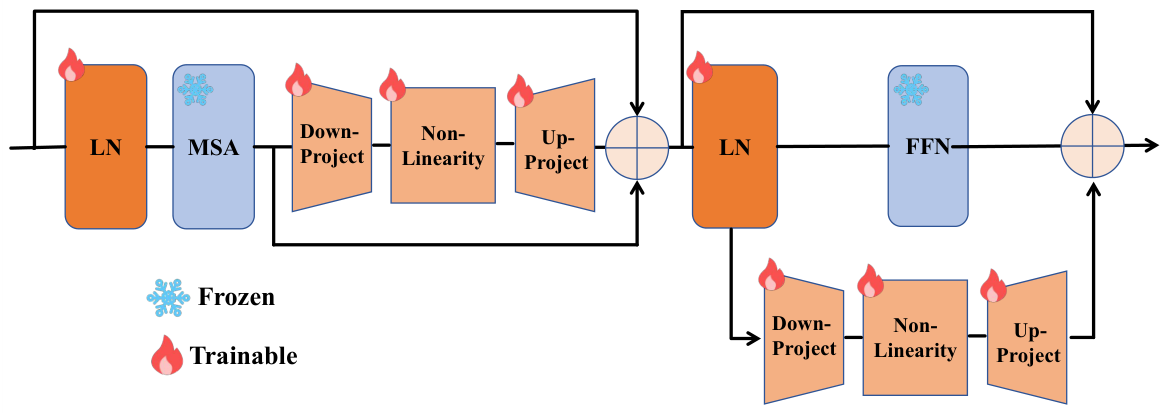
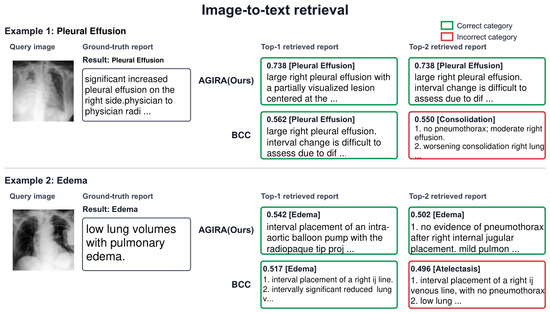
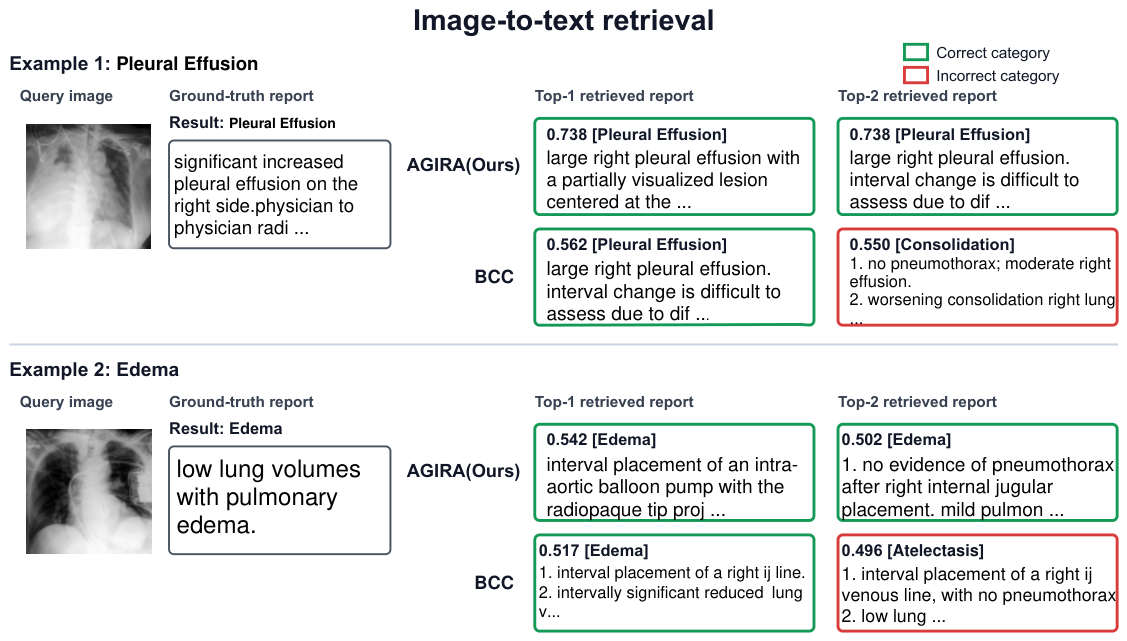
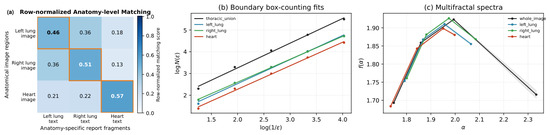
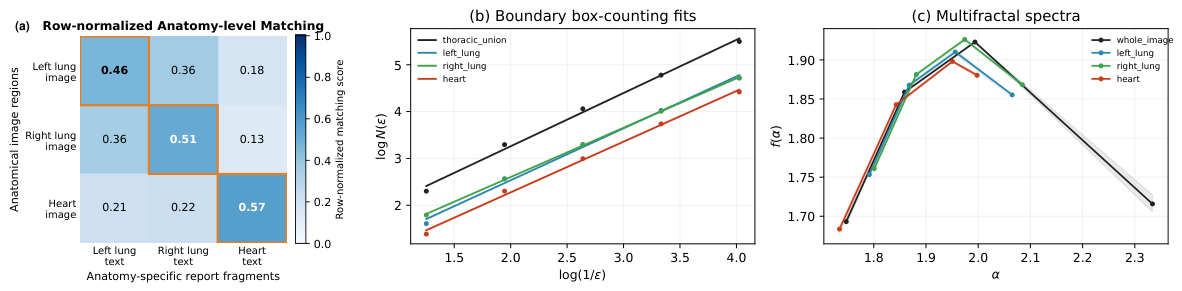
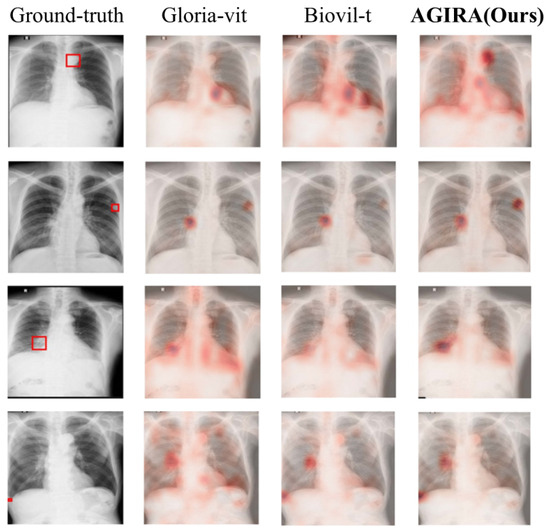
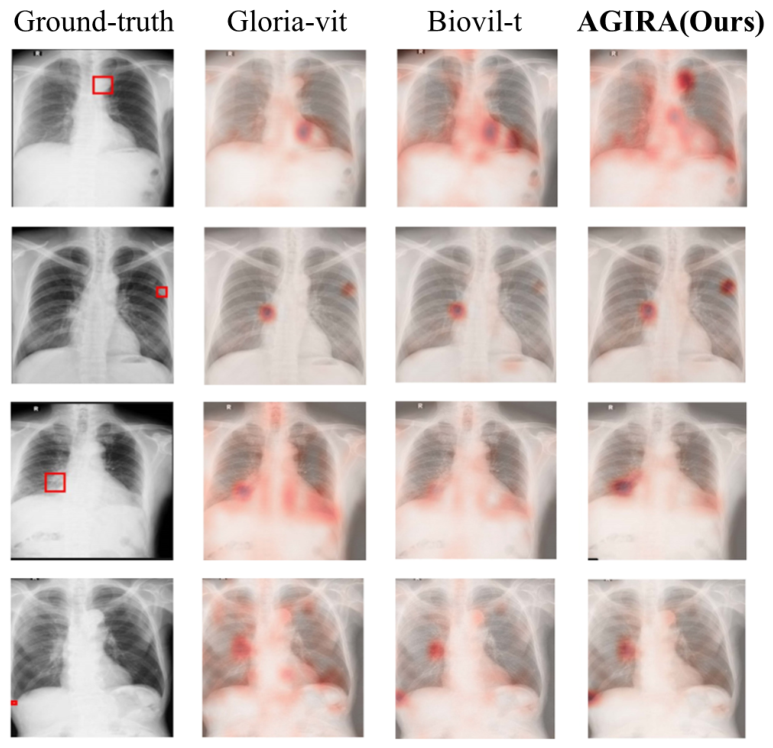
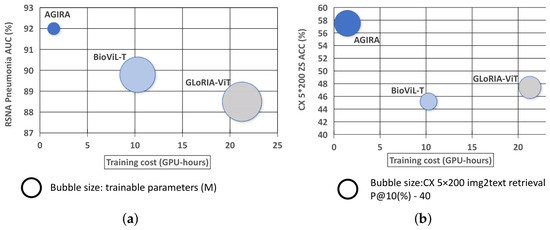
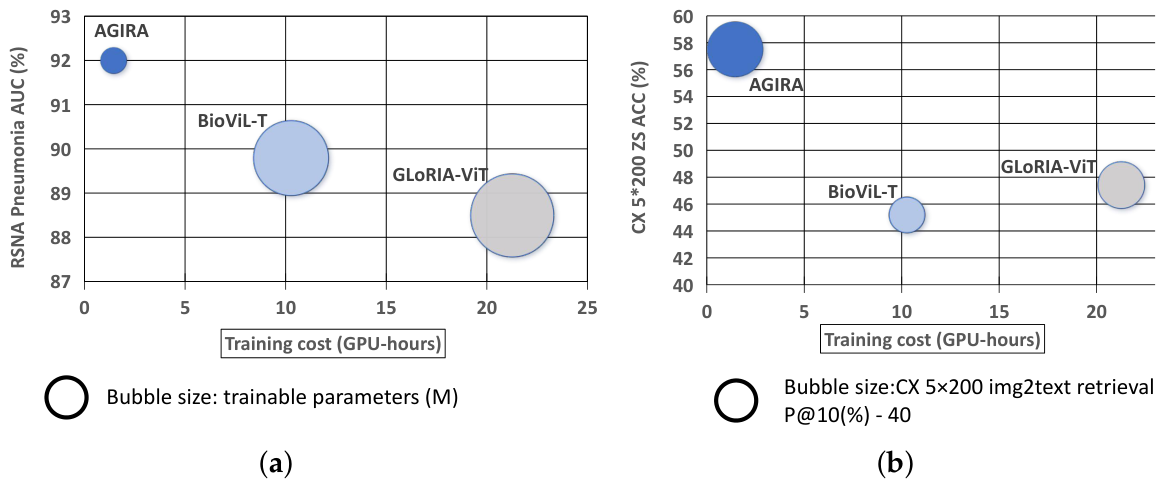

Disclaimer/Publisher’s Note: The statements, opinions and data contained in all publications are solely those of the individual author(s) and contributor(s) and not of MDPI and/or the editor(s). MDPI and/or the editor(s) disclaim responsibility for any injury to people or property resulting from any ideas, methods, instructions or products referred to in the content. |
© 2026 by the authors. Licensee MDPI, Basel, Switzerland. This article is an open access article distributed under the terms and conditions of the Creative Commons Attribution (CC BY) license.