


Abstract
Financial time series in turbulent markets exhibit complex long-memory dynamics and multifractal features that traditional deep learning models fail to capture due to inherent exponential forgetting mechanisms. To address this, we propose Frac-Attn-GL, a novel Fractional-order Spatiotemporal Attention-based GRU-LSTM framework. Grounded in the Fractal Market Hypothesis, the model embeds Grünwald–Letnikov fractional-order operators into a dual-channel architecture (FracLSTM and FracGRU) to characterize long-range memory with rigorous power-law decay priors. Furthermore, an extreme-aware asymmetric loss function is designed to drive a dynamic spatiotemporal routing mechanism, enabling adaptive shifts between long-term macro trends and short-term micro shocks. Empirical tests on major U.S. stock indices reveal three significant findings. First, the Frac-Attn-GL framework substantially reduces prediction errors, achieving up to a 93.1% RMSE reduction on the highly volatile NASDAQ index compared to standard baselines. Second, the adaptively learned fractional-order parameters exhibit a consistent quantitative alignment with the market’s empirical multifractal singularity spectrum, supporting the physical interpretability of the model’s endogenous memory mechanism. Finally, hybrid residual multifractal diagnostics indicate that the framework effectively captures deep long-range correlations, reducing the Hurst exponent of the prediction residuals from ~0.83 to approximately 0.50, a level consistent with the absence of significant long-range dependence.
1. Introduction
1.1. Research Background and Motivation
Against the backdrop of highly interconnected global capital markets, the accelerating velocity of information dissemination, and frequent perturbations from macroeconomic policies and geopolitical events, financial time series have come to exhibit more pronounced characteristics of nonlinearity, non-stationarity, heterogeneity, and heavy-tailed distributions. Regarding the forecasting of asset prices, returns, and volatility, machine learning and deep learning methodologies have expanded rapidly over the past decade, evolving from traditional auxiliary tools into critical technical support for quantitative research and intelligent decision-making. Existing literature reviews have systematically delineated the application boundaries of machine learning, deep learning, and reinforcement learning within quantitative finance, noting that financial forecasting has shifted from the pursuit of local fitting accuracy toward comprehensive frameworks that emphasize generalization ability, robustness, and interpretability [1,2,3].
From the perspective of methodological evolution, the proliferation of deep learning in finance is not a simple replication of its success in computer vision or natural language processing. Instead, it involves adaptation and reconstruction centered on unique financial features such as market microstructure, low signal-to-noise ratios, strong sample dependency, and the frequent occurrence of extreme shocks. Relevant surveys indicate that deep learning applications in the financial domain have gradually extended from price direction forecasting to multi-dimensional tasks, including risk measurement, portfolio management, event-driven modeling, and trade execution. However, whether complex market structures can be authentically characterized by these models remains the core prerequisite for methodological efficacy [4,5].
Furthermore, research on stock market movement prediction has formed a relatively rich academic lineage. Systematic reviews suggest that although forecasting models continuously introduce more sophisticated network architectures, feature engineering, and fusion strategies, they still exhibit significant deficiencies in predictive stability and cross-sample generalization when confronted with violent volatility, regime switching, and abrupt shocks [6,7]. This implies that merely increasing model complexity does not automatically resolve the challenge of extracting deep-seated dependencies within financial time series.
Early representative studies in deep learning demonstrated that convolutional neural networks, recurrent neural networks, and ensemble learning frameworks could outperform traditional linear methods under certain conditions, showing robust pattern recognition capabilities in financial forecasting. Chong et al. proved that deep neural networks can enhance stock market analysis through various data representation methods; Fischer and Krauss showed that LSTM networks possess substantial potential in financial market prediction; and Krauss et al. further discovered that deep neural networks, gradient boosted trees, and random forests could yield results superior to traditional benchmarks in statistical arbitrage tasks [8,9,10]. However, most of these studies are predicated on integer-order memory structures, whose internal state updates are inherently limited by a rapid, exponential forgetting mechanism.
“Building upon these foundations, researchers began to explore representation enhancement and structural fusion to improve financial forecasting performance. For instance, Bao et al. combined stacked autoencoders with LSTM to enhance the depth of feature extraction in financial time series; Chen and Ge introduced attention mechanisms into LSTM for predicting Hong Kong stock price movements; Sirignano and Cont, starting from high-frequency limit order books, revealed certain universal features in the price formation process within a deep learning framework [11,12,13]. These studies indicate that deep models can indeed capture complex patterns in finance, yet their success is often highly dependent on task configurations, sample environments, and feature construction.
Subsequently, a vast array of improved models emerged, attempting to further elevate predictive performance through optimizer design, signal decomposition, hybrid structures, and heuristic algorithms. Liu and Long constructed an improved deep learning price forecasting model; Huang et al. integrated genetic algorithms with LSTM to enhance forecasting efficiency; and Yun et al. improved stock price direction prediction through a three-stage feature engineering approach combined with a GA-XGBoost hybrid algorithm [14,15,16]. Such research suggests that improvements in financial forecasting performance increasingly rely on the integrated design of model structure, feature transformation, and parameter optimization, rather than the simple replacement of a single algorithm.
Simultaneously, new paradigms for time-series modeling have continued to surface. Wang et al. utilized reservoir computing for stock index prediction, demonstrating the feasibility of dynamical systems theory in finance; Wang et al. further applied Transformers to stock index forecasting, illustrating that long-distance dependency modeling has become a frontier direction; and Lin et al. proposed a hybrid CEEMDAN-LSTM model to predict realized volatility, providing empirical support for combining multi-scale decomposition with neural networks [17,18,19]. These methods emphasize that extracting effective signals from complex markets requires a simultaneous consideration of local fluctuations, global trends, and cross-scale structures.
In addition to the aforementioned methods, modal decomposition, swarm intelligence optimization, and novel neural networks have been widely applied in financial forecasting. The modal decomposition hybrid model by Lv et al. proved the effectiveness of the decomposition–reconstruction strategy in stock index prediction; the ISSA-BP neural network proposed by Liu et al. further demonstrated the synergistic potential of intelligent optimization and nonlinear modeling; Xu et al. introduced generative adversarial networks into stock price movement prediction to mitigate the issues of data sparsity and noise interference [20,21,22]. While these studies have enriched the methodological spectrum, they also reflect a common reality: the greater the market complexity, the more difficult it is for a single structure to maintain a stable advantage across different stages.
In recent years, the importance of explainability and Explainable Artificial Intelligence (XAI) in financial forecasting has risen steadily. Park and Yang constructed an interpretable deep learning LSTM decision model, emphasizing that models must not only “predict accurately” but also “explain why such predictions are made”; Çelik et al. further extended financial time series forecasting capabilities through XAI, indicating that explanation mechanisms have shifted from being secondary results to essential components of model design [23,24]. This also implies that high-level financial forecasting research in the future cannot remain solely at the level of error optimization but must simultaneously account for model mechanism transparency and the interpretation of economic significance.
From the perspective of market environments and the expansion of information sources, predictive research based on specific market institutional environments and external textual signals has also increased rapidly. Leippold et al. discussed the applicability and limitations of machine learning methods within the context of the Chinese stock market, suggesting that institutional backgrounds and market characteristics significantly influence model performance; Liu et al. incorporated news-driven information and sentiment-attention mechanisms into an index forecasting framework, illustrating that market dynamics are not determined solely by price sequences but are shaped collectively by prices, sentiment, and event flows [25,26]. Consequently, in real-world financial systems, forecasting models must confront a more challenging fact:market memory is not a simple short-term autoregression but may manifest as a complex accumulation across scales, events, and states.
1.2. Literature Review
From a more generalized perspective of time-series forecasting, existing research has explicitly identified long-span dependencies, distributional shifts, and noise contamination as critical bottlenecks limiting the stable performance of deep models. A review by Lim and Zohren indicates that although deep learning has significantly expanded the forecasting toolbox, it still faces challenges such as the difficulty of extracting long-term dependencies and insufficient robustness in real-world scenarios. Hewamalage et al. further noted that the efficacy of recurrent neural networks in time-series forecasting is highly dependent on data generation mechanisms and task structures, suggesting that the simple application of generic architectures does not invariably yield stable improvements [27,28].
Regarding recurrent networks themselves, van Houdt et al. [29] reviewed Long Short-Term Memory (LSTM) from a mechanistic level, noting that while its gating structure can mitigate gradient vanishing, it does not fundamentally resolve the issue of insufficient long-memory characterization. Chen et al. [30] summarized progress in deep learning for long-sequence time forecasting, arguing that “longer sequences” do not automatically equate to “more sufficient memory.” In a recent survey, Kim et al. further emphasized that the true challenge of deep learning for time series is not merely structural diversification but rather how to achieve stable long-range dependency modeling and transferable prediction within complex dynamic environments [29,30,31]. This conclusion is particularly vital for financial time series, as financial markets exhibit not only long-term correlation but also superimposed volatility clustering, jumps, and structural breaks.
Compared to general time-series tasks, the complexity of financial markets is also reflected in their significant fractal features and multifractal structures. Jiang et al. [32] conducted a systematic review of multifractal analysis in financial markets, pointing out that returns, volatility, and trading activities often exhibit cross-scale non-uniformity and complex correlation structures. Thompson and Wilson methodologically demonstrated the practical application value of Multifractal Detrended Fluctuation Analysis (MF-DFA) in financial time series, illustrating that markets are not dominated by linear laws on a single scale [32,33]. Consequently, if model designs neglect the multifractal nature of the market, it becomes difficult to truly understand the statistical physical properties of the forecasting object.
Furthermore, long memory and multifractality are not isolated from each other but may collectively shape the deep dynamics of financial sequences. Goddard and Onali proposed a joint testing approach for long memory and multifractality, emphasizing their coupled relationship in financial time series. Miloš et al. [34], based on MF-DFA evidence from Central and Eastern European market indices, again showed that complexity across different markets exhibits significant heterogeneity. Zhang and Fang noted that the multifractal behavior of stock indices is not merely a descriptive phenomenon but may also exert a substantial improvement on forecasting capability [34,35,36]. This suggests that a financial forecasting model design capable of actively absorbing multifractal and long-memory information may possess a more rigorous theoretical foundation than one relying on the simple stacking of deep structures.
In this context, fractional-order calculus provides an essential tool for characterizing non-locality and long-range dependencies. Walasek and Gajda discussed the potential applications of fractional-order differentiation in machine learning, noting its natural suitability for describing complex systems with historical dependence and power-law memory decay. The long-memory HEAVY process proposed by Karanasos et al. demonstrated the practical significance of long-memory mechanisms in financial forecasting from the perspective of volatility modeling [37,38]. Compared to integer-order systems, the core advantage of a fractional-order framework lies in its state updates, which can naturally embed a slower decay of historical weights, thereby more closely aligning with the information retention and risk accumulation processes in real markets.
Recent studies concerning volatility forecasting and high-dimensional predictor selection have further confirmed that financial markets are not short-sighted systems. Liang et al. [39] found that in the volatility forecasting of the Chinese stock market, the identification of strong predictors is crucial to model performance, a process that essentially involves the effective filtering of complex historical information. Zhang et al. demonstrated that combining machine learning with intraday commonality information can significantly enhance volatility forecasting performance [39,40]. This indicates that the key to financial forecasting is not merely whether to use deep learning, but whether the model can identify and retain historical structures that exert a continuous influence.
Synthesizing existing research, at least three directions warrant further advancement. First, a large volume of current financial deep learning research remains confined to the levels of integer-order recurrence, attention, or hybrid networks; while these can improve local prediction accuracy, they provide insufficient explanations for why markets possess predictability and what specific memory structures the models have captured [9,12,18]. Second, although multifractal and long-memory research has proven the existence of deep complex structures in financial sequences, such statistical physical diagnostics often remain at a descriptive level and have not been fully transformed into structural priors for deep models [32,34,38]. Third, few studies have examined fractal diagnostics, long-memory modeling, attention mechanisms, and extreme event responses within a unified framework to form a complete logical closed loop from complexity discovery to predictive modeling and finally to residual testing [36,37,40].
1.3. Contributions of This Study
Based on the aforementioned research background and literature gaps, this paper utilizes the Fractal Market Hypothesis (FMH) as a theoretical cornerstone to construct a novel Fractional-order spatio-temporal Attention-based GRU-LSTM fusion framework (Frac-Attn-GL). This study attempts to provide a unified paradigm that combines physical mechanistic interpretability with high predictive precision for complex financial time series, particularly asset returns containing long-range dependencies and tail shocks, from a cross-disciplinary perspective of statistical physics and deep learning.
Specifically, the marginal contributions of this paper are reflected in the following four aspects:
Prioritization and Quantization of Fractal Market Priors: This paper breaks the traditional practice of using Multifractal Detrended Fluctuation Analysis (MF-DFA) solely as a descriptive statistic by positioning it as a foundational theoretical constraint for deep model construction. Through complexity testing of three core U.S. stock indices (Dow Jones, NASDAQ, and S&P 500), this study demonstrates the heterogeneity of the singularity spectrum width () under different market microstructures from a statistical physical perspective. This provides robust empirical support for the subsequent introduction of fractional-order calculus operators characterized by power-law memory decay.
Construction of the Dual-Channel Fractional-Order Memory Network: Addressing the “short-sighted” flaws of the exponential forgetting mechanism inherent in traditional LSTM and GRU within long-memory sequences, this paper natively embeds the Grünwald–Letnikov fractional-order operator. We innovatively propose a dual-channel architecture consisting of FracLSTM and FracGRU. This design replaces black-box weight decay with fractional-order mathematical priors, allowing long-term macroeconomic trends and short-term micro-shocks to be absorbed in parallel under different fractional-order parameters . This approach closely aligns with the heavy-tailed and long-range correlation characteristics of financial data.
Spatio-Temporal Dynamic Routing Mechanism Anchored by Extreme Events: Rather than simply stacking attention mechanisms, this paper establishes them on the basis that the fractional-order network has already managed temporal decay. This allows Attention resources to be fully released to focus on spatial feature routing. Combined with a designed asymmetric Extreme-Aware Loss function, the model can achieve a rapid reversal of attention when encountering real-market “Black Swan” shocks, significantly enhancing the robustness and white-box interpretability of the model in highly volatile environments.
Establishment of a “Prediction-Residual” Statistical Physical Testing Loop: This paper moves beyond the evaluative limitations of relying solely on traditional error metrics such as RMSE and MAE by introducing a hybrid residual multifractal Detrended Moving Average diagnostic. The empirical results not only verify the leap in predictive accuracy but also prove from a physics perspective that the Frac-Attn-GL framework can thoroughly strip the highly complex long-range memory () from the original sequence and reduce it to residuals lacking long-range dependence (H ≈ 0.5), achieving comprehensive feature extraction.
2. Data and Multifractal Analysis
Prior to the introduction of deep learning models with complex topological structures, it is imperative to verify the existence of “Long-range Dependence” and “Multifractality” features in financial time series from a statistical physics perspective. Through rigorous data engineering and fractal testing, this section reveals the microscopic causes of the failure of traditional Markov models in extreme markets, thereby providing a solid empirical foundation for the subsequent introduction of fractional-order power-law memory operators.
2.1. Dataset Construction and Multi-Dimensional Preprocessing
This study selects three core United States stock indices (the Dow Jones Industrial Average, the S&P 500 Index, and the NASDAQ Composite Index) spanning from 1 January 2015 to 31 December 2025, as the empirical dataset. The sample size comprises approximately 2500 trading days, and the time span comprehensively covers extreme market events, including the 2020 COVID-19 pandemic shock and the aggressive interest rate hike cycle by the Federal Reserve. This provides an effective sample for testing the robustness of the model under extreme tail risks. The historical data for the three major indices were retrieved from Yahoo Finance. To ensure the temporal continuity required for fractional-order operators, any missing values or non-trading days were handled using the forward-filling (LOCF) method, which ensures that each model input is grounded in the most recent available market information.
The core task of this study is to achieve one-step-ahead forecasting of the next-day scaled return. Specifically, the model utilizes the historical sequence of the past 20 trading days (time windows to t) to accurately predict the return on day .
To adapt to the subsequent complex fractional-order spatio-temporal attention network, we expand the model input into a six-dimensional feature set. The daily logarithmic return is defined as follows:
where represents the closing price on the corresponding day t.
The selection of the logarithmic return model over simple discrete returns is driven by several mathematical and computational advantages critical to our framework. First, logarithmic returns possess time additivity, providing a theoretically sound measure for multi-period compounding. Second, they exhibit superior statistical properties—notably, enhanced symmetry and variance stabilization—which help transform highly non-stationary price series into relatively stationary sequences. This stabilization is a fundamental prerequisite for accurate multifractal analysis. Finally, from an optimization perspective within deep learning, logarithmic returns inherently constrain the magnitude of extreme value fluctuations, thereby effectively mitigating the risk of numerical overflow or gradient explosion during the Backpropagation Through Time (BPTT) process in our fractional-order recurrent networks.
To capture asymmetric shocks within the market microstructure, we specifically construct a binary indicator variable for extreme events:
The judgment threshold for extreme events is set to k = 2, where is the 20-day rolling standard deviation of log-returns. This configuration allows the extreme-event indicator to adaptively respond to local volatility regimes rather than global variance.
The final six-dimensional input features include the scaled open price, scaled high price, scaled low price, scaled close price, scaled return, and the extreme event indicator. The dataset is strictly sorted by timestamp and partitioned into a training set (70%), a validation set (15%), and a testing set (15%). The testing set is placed entirely at the tail of the data stream, comprehensively eliminating the possibility of future data leakage from a physical standpoint.
Specifically, features were mapped into the range using Min-Max normalization. Critically, to prevent look-ahead bias, the scaling parameters were fitted exclusively on the training set; these parameters were then fixed and applied to transform the validation and testing sets independently.
2.2. Hurst Exponent and Initial Long-Memory Diagnostics
To preliminarily evaluate the long-term dependence structure of the return volatility sequences, we first applied Rescaled Range (R/S) analysis to calculate the Hurst exponent. For a time series of length N, its R/S statistic and the time scale n obey the following power-law relationship:
Here, denotes the Hurst exponent. As illustrated in Figure 1, the empirical results demonstrate that the Hurst exponents of the volatility for all three major indices are approximately equal to 0.83. Specifically, the values are approximately 0.8268 for the Dow Jones Industrial Average, 0.8351 for the S&P 500, and 0.8314 for the NASDAQ. Because these values significantly exceed the threshold of 0.5 for a completely random walk white noise sequence, this preliminarily confirms the existence of strong positive long-range correlation within the sequences. This implies that past return sequences exert a profound nonlinear influence on future return predictions.
Figure 1.
Rescaled Range analysis and Hurst exponent estimation for the volatility sequences.
It is important to note that while the direct forecast target is the scaled return , our long-memory diagnostics focus on volatility . This follows the well-documented ‘stylized facts’ of financial markets, where returns often exhibit near-zero autocorrelation, but their magnitudes demonstrate strong long-range dependence. By embedding fractional-order operators to capture this volatility memory, the Frac-Attn-GL framework can effectively utilize the market’s hidden ‘persistence states’ to improve the accuracy and robustness of return predictions.
To systematically clarify this conceptual alignment within our methodology, Table 1 summarizes the distinct statistical physics properties of returns versus volatility and defines their respective roles in the Frac-Attn-GL framework.
Table 1.
Conceptual Alignment of Return and Volatility in the Frac-Attn-GL Framework.
2.3. Multifractal Singularity Spectrum Analysis
After confirming global long memory, we further employed Multifractal Detrended Fluctuation Analysis to extract the singularity spectrum to quantify the degree of localized extreme abrupt changes in the market. As shown in Figure 2, the width of the singularity spectrum is the core metric for measuring the multifractal strength of a time series.
Figure 2.
Empirical multifractal singularity spectrum for the three major U.S. stock indices.
The analytical results indicate that the NASDAQ index, which is dominated by technology assets, exhibits the widest and most left-skewed singularity spectrum with a value of This suggests that its market microstructure is governed by extreme heavy-tailed shocks and intricate long-range memory. In contrast, the traditional Dow Jones Industrial Average displays a relatively narrower spectral width of . This discrepancy constitutes the core physical motivation of this study. Specifically, as the structure of market volatility becomes more complex and the fractal spectrum widens, the exponential forgetting gates inherent in traditional deep learning models such as the standard LSTM inevitably undergo rapid decay and failure. Consequently, the introduction of fractional-order operators characterized by persistent power-law memory to enhance the prediction accuracy of extreme returns becomes a dual necessity from both physical and mathematical perspectives.
2.4. Global Hyperparameter Settings and Evaluation Benchmark
To establish a standardized evaluation benchmark between the multifractal analysis and the subsequent ablation experiments, this study formulated a rigorous global hyperparameter configuration. This configuration ensures that all baseline models and the deep fusion model proposed in this paper are compared for next-day return forecasting under equitable computational constraints. Simultaneously, multiple targeted mechanisms are introduced to overcome the persistent problem of overfitting in financial time-series modeling. The specific parameter settings are detailed in Table 2.
Table 2.
Global hyperparameter settings and evaluation benchmark configurations.
3. Methodology: The Frac-Attn-GL Fusion Framework
In the empirical testing of Section 2, we confirmed the presence of significant long-range correlation and heavy-tailed abrupt change characteristics in financial market volatility. To overcome the Markovian short-sighted bottleneck faced by traditional deep learning models when capturing such features, this section proposes a novel Fractional-order Spatiotemporal Attention Network architecture (Frac-Attn-GL). The global topological structure of this framework is illustrated in Figure 3. Its core innovation lies in natively embedding fractional-order calculus operators to characterize the long-range memory of the market with rigorous mathematical priors, supplemented by a dynamic spatiotemporal routing mechanism aware of extreme events.
Figure 3.
Architecture and micro-structure of the Frac-Attn-GL network.
3.1. Preliminaries on Fractional Calculus and GL Discretization
Fractional-order calculus is a generalization of traditional integer-order calculus to arbitrary real-order numbers, capable of naturally describing the non-locality and historical memory effects of complex dynamical systems. In discrete time-series modeling, the Grünwald–Letnikov (GL) definition is widely applied in algorithmic implementations due to its amenability to differencing.
For a time series xt, the standard form of its -order () GL fractional derivative is defined as:
In practical discrete modeling of financial time series, the sampling step is set to , and a truncation window is introduced to balance historical memory depth with computational complexity. Specifically, represents the finite number of past time steps (the memory length) considered in the discrete weighted sum. While the fractional derivative theoretically depends on the entire history of the sequence, the parameter allows the framework to capture essential long-range dependencies within a computationally tractable horizon, defining the reach of the power-law memory trail.
The GL fractional-order operator can be discretized and approximately expanded as a weighted sum of historical states:
where represents the GL expansion coefficients, which can be efficiently calculated through the iterative form of the Gamma function :
From the above derivation, unlike integer-order Markov processes that rely solely on the state of the preceding moment, the fractional-order state is accumulated from the weighted decay of the past W historical nodes. Its weight exhibits a slow power-law decay over time lag, laying a solid mathematical foundation for constructing deep neural networks with long-memory characteristics.
3.2. Dual-Channel Fractional RNNs
When standard recurrent neural networks (such as LSTM and GRU) process sequential data, the update weight decay of their internal states follows an exponential law of (as shown in the left panel of Figure 3). This rapid decay causes models to easily lose early macroeconomic signals in long sequences. Therefore, we designed a dual-channel parallel architecture comprising FracLSTM and FracGRU.
In the FracLSTM branch (focusing on long-range macroeconomic trends, Branch 1), we deeply inject the GL fractional-order operator into the update mechanism of the cell state. The cell state update equation of the traditional LSTM is reconstructed as:
where is the learnable fractional-order parameter for this branch; and are the forget gate and input gate, respectively; is the candidate cell state at the current time step; and denotes the Hadamard product. Through this reconstruction, the historical cell sequence is endowed with memory weights that follow a power-law distribution, allowing long-range trends to bridge time windows smoothly.
Similarly, in the FracGRU branch (focusing on short-term micro-shocks, Branch 2), the GL operator is directly applied to the deduction of the hidden state:
where is the update gate and is the independently learned fractional-order decay parameter for this branch. The design of dual-channel heterogeneous decay fundamentally activates the network’s capability to capture multi-scale long-range dependencies at the level of the underlying operators.
3.3. Spatiotemporal Attention Fusion
After obtaining the heterogeneous hidden representations and from the dual channels, this study introduces a spatiotemporal attention mechanism for adaptive feature routing. Because the underlying network has already achieved a “physical decay prior in the temporal dimension” via the fractional-order operators, this significantly liberates the representation space of the Attention mechanism, allowing it to adaptively focus on channel weight allocation in the “spatial dimension.”
The dynamic fusion process in the spatial dimension (corresponding to the middle panel of Figure 3) is calculated as follows:
where , and are learnable attention weight parameters; and represent the dynamic attention scores allocated by the model to the long-trend branch and the short-term shock branch, respectively. The fused global representation is subsequently fed into a fully connected prediction head to map the scalar output prediction value of the next-day scaled return.
3.4. Extreme-Aware Asymmetric Loss Function
Traditional Mean Squared Error imposes symmetric gradient penalties on all samples during optimization, which often leads to the underestimation of tail risks in heavily tailed financial time series. To enhance the “anti-shock” robustness of the model, this paper designs an Extreme-Aware asymmetric loss function.
This mechanism is coupled with the indicator constructed in Section 2.1, and the objective function is reconstructed as:
where the asymmetric penalty coefficient is set to:
When the real market experiences an extreme shock, the loss function imposes a threefold asymmetric gradient penalty. This mechanism compels the network to lean toward extreme tail data during the Backpropagation Through Time (BPTT) process, prompting the system to rapidly route attention to the FracGRU branch responsible for capturing abrupt changes during severe market turbulence, thereby effectively controlling tail prediction risks while ensuring accuracy during stable periods.
4. Hierarchical Ablation Study Design and Evaluation Metrics
To rigorously decouple and quantify the independent contributions of each core component (fractional-order calculus operators, dual-channel parallel architecture, spatiotemporal attention fusion mechanism) in the Frac-Attn-GL framework to prediction performance, this paper designs a stringent 9-step hierarchical ablation study.
4.1. Evaluation Metrics for Predictive Performance
This study employs two statistical error metrics widely utilized in financial time series forecasting to evaluate model performance: Root Mean Square Error (RMSE) and Mean Absolute Error (MAE).
where is the actual next-day scaled return, is the model’s predicted value, and is the sample size of the test set. RMSE is more sensitive to extreme deviations in the prediction sequence (i.e., failures in tail risk prediction), while MAE reflects the global average level of prediction errors.
In addition to RMSE and MAE, we employ the Diebold–Mariano (DM) test to formally evaluate the statistical significance of predictive accuracy differences between models. Furthermore, to rigorously diagnose the prediction residuals, we utilize the Ljung–Box Q-test to check for the absence of serial autocorrelation, thereby verifying whether the residuals have truly degraded into white noise.
4.2. Hierarchical Ablation Framework
According to the logic of model complexity and the introduction of physical priors, the entire ablation study framework is explicitly partitioned into three progressive camps. The specific parameter architectures and design intents are detailed in Table 3:
Table 3.
Comparison of Hyperparameters and Model Ablation.
Camp 1 (Baselines—Traditional and Monolithic Baselines): Evaluates the performance floor of traditional linear statistical models and standard monolithic deep learning networks lacking fractional-order priors, intended to expose the failure of exponential forgetting mechanisms in long-memory markets.
Camp 2 (Integer Fusion—Integer-Order Fusion Frameworks): Explores the performance limits achievable purely by combining dual-channel architectures and attention mechanisms without introducing fractional-order operators. This aims to verify whether attention computational resources are severely consumed in the absence of a “temporal physical decay prior.”
Camp 3 (Fractional Ultimate—Fractional-Order Ultimate Evolution): Comprehensively verifies the inherent superiority of fractional-order operators and their derived fusion architectures, ultimately culminating in the Frac-Attn-GL ultimate model proposed in this paper.
Specifically, to define the absolute performance floor of the prediction task, we incorporate the Naïve Random Walk (RW) model as a primary baseline. The Naïve RW assumes that the best predictor for tomorrow’s return is simply today’s observed value, i.e., . This benchmark is essential for verifying whether the proposed complex architectures provide a meaningful statistical advantage over a ‘no-change’ assumption in turbulent markets.
5. Empirical Results and Micro-Dynamics Discussion
5.1. Quantitative Analysis of Prediction Errors
This section systematically presents the predictive performance of each model across the three core stock indices. The analysis begins with a quantitative evaluation of error metrics at a macro level to dissect the absolute performance gains provided by the fractional-order architecture. Subsequently, the discussion shifts to the evolution of predictive trajectories under various market microstructures. Finally, the internal physical significance of fractional-order parameters and dynamic spatiotemporal routing mechanisms is analyzed through visualization to provide transparency to the deep learning process.
5.1.1. Hierarchical Ablation Trajectory and Error Descent Analysis
The core error metrics including root mean square error and mean absolute error for the nine models in the next-day return forecasting task are illustrated as ablation descent trajectories in Figure 4, Figure 5 and Figure 6. A comprehensive observation of these trajectories reveals that the error metrics exhibit a highly significant staircase descent across the three structurally divided camps. This trend validates the indispensable role of fractional-order physical priors. As expected, the Naïve Random Walk (RW) baseline yields the highest error across all datasets (e.g., RMSE of 0.3520 on NASDAQ), confirming that financial time series during the sample period exhibit significant structural dynamics that cannot be captured by a simple identity mapping. While the ARIMA model slightly outperforms the Naïve RW by capturing linear local dependencies, both traditional statistical methods fail to navigate the high-frequency noise and multifractal shocks present in the indices.
Figure 4.
Ablation Trajectory: Error descent of RMSE and MAE across three structural camps on the NASDAQ index.
Figure 5.
Ablation Trajectory: Error descent of RMSE and MAE across three structural camps on the Dow Jones index.
Figure 6.
Ablation Trajectory: Error descent of RMSE and MAE across three structural camps on the S&P 500 index.
Analysis of Limitations in Camp 1 regarding Traditional and Monolithic Baselines:
Under the pure linear paradigm, the ARIMA model yields root mean square error values exceeding 0.32 across all three indices, representing the least effective performance. This result exposes the failure of the linear homoscedasticity assumption when applied to financial time series characterized by significant nonlinearity, heavy tails, and multifractal features. Upon the introduction of nonlinear deep learning in Models 1 and 2, the root mean square error of the standard LSTM for the NASDAQ index decreases to 0.2153. However, the absolute error remains substantial. This empirically demonstrates that merely introducing nonlinear activation functions is insufficient to address the complex dynamics of financial data. The Markovian short-sighted forgetting gates within standard recurrent neural networks encounter a severe memory dissipation bottleneck when processing long-range dependencies spanning multiple weeks. The transition from the Naïve RW floor to standard deep learning models (Models 1–2) shows an initial error reduction, yet the persistence of substantial residuals indicates that integer-order gates still struggle to exceed the performance of sophisticated statistical priors without the aid of fractional-order memory.
Even with the introduction of powerful non-linear architectures like XGBoost and the standard Transformer, the absolute errors remain substantial (e.g., Transformer RMSE of 0.1945 on NASDAQ). This empirically demonstrates that standard self-attention mechanisms, while superior to basic RNNs, consume excessive computational resources learning temporal decay laws from scratch. Without the physical prior of fractional-order memory, generalized ML models struggle to overcome the high-frequency noise and heavy tails inherent in financial time series.
Computational Mismatch in Camp 2 regarding Integer-Order Fusion:
Moving along the trajectory to Camp 2, the application of the standard dual-channel architecture combined with an attention mechanism in Model 4 leads to a root mean square error of 0.1287 for the NASDAQ. While this suggests that architectural stacking provides certain benefits, the improvement quickly reaches a bottleneck. From an information theory perspective, because the underlying operators remain integer-order, the model is compelled to consume significant attention computational resources to encode temporal decay laws. This leads to a dilution of efficacy in spatial feature routing and increases susceptibility to overfitting when processing extreme heavy-tailed data.
Superior Performance of Camp 3 regarding the Fractional Ultimate Architecture:
The final transition into Camp 3 with the introduction of the Grünwald-Letnikov fractional-order results in a significant improvement in model performance. The ultimate Frac-Attn-GL framework proposed in this study achieves the most effective performance across all three indices. For the highly volatile NASDAQ index, the root mean square error of the ultimate model decreases to 0.0148. This represents a 93.1% error reduction compared to the standard LSTM and an 88.5% reduction compared to the pure integer-order attention network.
This aligns with the empirical findings in Section 2, where the NASDAQ exhibited the widest singularity fractal spectrum due to the dominance of technology stocks. These results strongly suggest that the more a market exhibits extreme heavy-tailed multifractal characteristics, the more rapidly traditional short-sighted networks fail, thereby highlighting the corrective advantage of fractional-order networks through their slow power-law memory decay.
To rigorously verify whether the performance gains of the Frac-Attn-GL framework are statistically significant rather than artifactual, we conducted the Diebold–Mariano (DM) test. As reported in Table 4, the DM test statistics are consistently negative and highly significant (p < 0.01) across all three indices when comparing Frac-Attn-GL against both traditional statistical baselines (ARIMA) and state-of-the-art deep learning architectures (Transformer, Std-LSTM). This formal statistical evidence corroborates our previous error metric evaluation, confirming that the native embedding of fractional-order temporal priors provides a robust and strictly superior predictive capability.
Table 4.
Diebold–Mariano (DM) test statistics for predictive accuracy.
5.1.2. Model Robustness to Random Initialization
To rigorously address the potential risk of single-trajectory bias and to ensure that the reported improvements are not artifacts of a specific “best-case” weight initialization, we further evaluated the robustness of the core baseline (Standard LSTM) and the ultimate model (Frac-Attn-GL) over 5 independent trials using distinct random seeds.
As illustrated in Figure 7, traditional statistical models like ARIMA maintain absolute stability (zero variance) but suffer from a high error floor. Conversely, generalized deep learning models (Transformer, Std-LSTM) exhibit significant performance oscillation across runs, reflecting their struggle to consistently capture deep dependencies in high-noise environments. The Frac-Attn-GL framework, however, not only achieves the lowest error but also demonstrates remarkable structural stability (NASDAQ RMSE Mean: 0.0156, Std: ). The exceptionally tight confidence interval confirms that natively embedding the Grünwald–Letnikov fractional-order operator effectively serves as a powerful physical prior. This prior severely constrains the blind exploration space during the optimization process, ensuring that the network consistently converges to an optimal state capable of filtering complex multifractal noise, regardless of the initial random seed.
Figure 7.
Model robustness and variance comparison across 5 independent random initializations on the NASDAQ index.
5.2. Local Shocks and Micro-Trajectory Evolution
Macro-level error averages can obscure the actual performance of models during local extreme events. Consequently, the next-day return prediction curves and loss convergence trajectories for each model at the end of the test set are extracted for a fine-grained analysis. This period includes real market shock cycles indicated by gray shading.
5.2.1. Micro-Trajectory Analysis of the NASDAQ Index
As a typically high-elasticity market, the NASDAQ is prone to severe pullbacks during periods of macroeconomic liquidity tightening. As shown in Figure 8, the standard LSTM and GRU models in Camp 1 exhibit a typical lagging effect when passing through the shock zone. Mathematically, these models degrade into a form of naive random walk where predicted peaks respond with a delay of one to two trading days after the actual shock occurs. Such delays would lead to significant losses in real-world quantitative trading. Figure 9 indicates that the Camp 2 fusion models lacking fractional-order priors still suffer from signal disorder under continuous heavy-tailed shocks. In contrast, the Frac-Attn-GL ultimate model in Figure 10 demonstrates prediction curves that tightly track actual returns during stable periods and exhibit high anticipatory sensitivity within the shock zones. The asymmetric extreme-aware loss function compels the model to maintain accuracy during tail events, resulting in a smooth and monotonic convergence of the loss curve.
Figure 8.
Model Ablation on Real NASDAQ Data—Baseline.
Figure 9.
Model Ablation on Real NASDAQ Data—Fusion.
Figure 10.
Model Ablation on Real NASDAQ Data—Fractional.
5.2.2. Micro-Trajectory Analysis of the Dow Jones Industrial Average
The Dow Jones Industrial Average consists of traditional blue-chip stocks and exhibits relatively stable volatility. In this mature market, Figure 11 and Figure 12 demonstrate that traditional integer-order networks still expose issues of high-frequency noise overfitting at extreme turning points. Similarly, fusion models based on pure architectural concatenation fail to achieve precise alignment at shock points. Figure 13 confirms that the FracLSTM branch within the fractional-order camp effectively serves as a low-pass filter through its smooth power-law decay memory . This mechanism successfully filters out micro-disturbances inherent in mature markets. The ultimate model does not overfit despite the introduction of attention and dual-channel parameters. Instead, it maintains the lowest absolute loss on the validation set, proving the robust generalization of the framework.
Figure 11.
Model Ablation on Real Dow Jones Data—Baseline.
Figure 12.
Model Ablation on Real Dow Jones Data—Fusion.
Figure 13.
Model Ablation on Real Dow Jones Data—Fractional.
5.2.3. Micro-Trajectory Analysis of the S&P 500 Index
As a representative of the broad-based market, the S&P 500 possesses both macroeconomic trend stability and local vulnerability. Figure 14 and Figure 15 indicate that conventional monolithic networks and attention mechanisms lacking temporal physical priors tend to show prediction amplitude attenuation when facing mixed oscillations. This is particularly evident under continuous shocks where the prediction signal significantly weakens. Conversely, Figure 16 proves that the Frac-Attn-GL ultimate model successfully navigates this hybrid market. Through the synergy of dual-channel fractional-order dynamics, the prediction curve exhibits strong shock resilience during cycles of high volatility.
Figure 14.
Prediction performance and loss convergence for the baseline models on the S&P 500 index.
Figure 15.
Prediction performance and loss convergence for the integer order fusion models on the S&P 500 index.
Figure 16.
Prediction performance and loss convergence for the fractional order networks and the ultimate framework on the S&P 500 index.
5.3. Dynamic Spatiotemporal Routing Anchored to Extreme Events
Deep learning models are frequently criticized for being opaque. However, this study provides robust physical interpretability for high-precision forecasting by analyzing the internally generated dynamic attention weights.
As illustrated in Figure 17, the attention weights allocated to the long-trend branch and the short-term shock branch are dynamic. During the majority of stable trading days characterized by oscillations or unilateral uptrends, the system adaptively allocates higher weights consistently to the FracLSTM branch to utilize its long-memory characteristics for capturing macroeconomic trends. The primary academic value lies in the transient response to extreme shocks. Once severe market turbulence is detected, the attention network undergoes a violent weight inversion. The system autonomously and rapidly shifts attention resources toward the FracGRU branch. This dynamic routing at the architectural level resolves the contradiction in classical time-series analysis between long-range trend smoothing and short-term mutation sensitivity.
Figure 17.
Dynamic Attention Routing Anchored to Real Market Shocks across Three Indices.
5.4. Endogenous Fractional Microstructure and the Fractal Market Hypothesis
This study explores the core physical prior parameters that spontaneously evolved during the training process of the network. The optimal fractional-order parameters () learned by the model across the three indices were extracted following a rigorous Time-Series Walk-Forward Validation (10 temporal splits) protocol. During this optimization process, the chronological sequence was strictly preserved to ensure absolutely zero future data leakage.
As shown in Figure 18, the distribution of parameter exhibits a rigorous heterogeneity aligned with market microstructure. The horizontal error bars represent the 95% confidence intervals derived from the 10 walk-forward temporal splits, while the shaded region highlights the consistent structural gap between the FracLSTM and FracGRU memory channels.
Figure 18.
Forest plot of the learned fractional-order parameters across market indices.
For the Dow Jones Industrial Average, which is dominated by traditional cyclical stocks with mature volatility, the model learns the highest value of at approximately 0.552. In fractional calculus, a value of approaching unity implies the system is nearing a memoryless integer-order Markovian state.
Conversely, for the high-volatility NASDAQ index characterized by dense technological innovation and frequent irrational exuberance, the entire parameter distribution shifts significantly to the left. The model learns the lowest values, specifically 0.445 for the FracLSTM trend branch and 0.520 for the FracGRU shock branch. A lower signifies an extremely slow and profound heavy-tailed memory decay.
As visually captured by the shaded region in Figure 18, a consistent structural gap is maintained across all indices, ensuring that FracGRU consistently decays faster than FracLSTM to capture short-term shocks. Furthermore, the wider 95% confidence intervals (horizontal error bars) observed in the NASDAQ index statistically reflect the higher microscopic uncertainty inherent in tech-heavy markets compared to the mature Dow Jones.
This finding has significant economic-physics implications. According to the Fractal Market Hypothesis, market liquidity crises stem from the homogenized behavior of participants with different investment horizons. The lowest parameter learned for the NASDAQ forms a consistent quantitative closed loop with the widest multifractal singularity spectrum measured in Section 2.3.
6. Robustness Check: Hybrid Residual Multifractal Diagnostics
In Section 5, the superiority of the Frac-Attn-GL framework was validated from the perspectives of prediction error metrics and micro-fitting trajectories. However, to confirm from a rigorous statistical physics level whether the framework truly extracts the complex long-memory dynamics in financial time series, this section introduces the Hybrid Multifractal Detrended Moving Average Residual Diagnostics.
A stringent criterion for evaluating the signal extraction capability of a time series forecasting model lies in testing the attributes of its prediction residual sequence . If the model successfully absorbs all nonlinear regularities including long-range memory and local trends, its residuals should approximate white noise characteristics where the Detrended Moving Average Hurst exponent is approximately 0.50. Conversely, if the residual Hurst exponent significantly deviates from 0.50, it indicates that the model has encountered a feature extraction bottleneck and omitted deep long-memory characteristics.
Based on this principle, Detrended Moving Average Hurst exponent measurements were conducted on the actual volatility sequences, the prediction residuals of the standard LSTM, and the prediction residuals of the ultimate Frac-Attn-GL model for the three major indices.
To verify that the model has achieved a high degree of information extraction for return forecasting, we perform residual diagnostics on the volatility of the prediction errors. Since the complexity of financial series is primarily embedded in its second-order moments, a successful model should not only minimize error but also ensure that the residuals’ volatility retains no untreated long-memory (i.e., ).
While the Detrended Moving Average Hurst exponent () provides physical evidence of long-memory elimination, we further introduce the Ljung–Box Q-test (Table 5) to formally assess the serial autocorrelation within the prediction residuals. Consistent with our physical diagnostics, the traditional models (ARIMA, Std-LSTM, and Transformer) all strongly reject the null hypothesis (), indicating that significant untreated long-range dependence remains trapped in their error terms. Strikingly, the Frac-Attn-GL model yields non-significant p-values ranging from 0.325 to 0.453 across all indices. By failing to reject the null hypothesis, this test provides strict statistical confirmation that our fractional-order framework successfully distills the predictable complex dynamics, degrading the ultimate residuals into pure, irregular white noise.
Table 5.
Ljung–Box Q-test for prediction residuals.
6.1. Residual Diagnostics of the NASDAQ Index
The NASDAQ index represents the market with the most complex fractal structure within the test set. The results of its hybrid residual diagnostics are illustrated in Figure 19. Observation of the top panel of Figure 19 reveals that the actual volatility of the NASDAQ market possesses extremely strong long-memory properties, as evidenced by a Detrended Moving Average Hurst exponent of approximately 0.7997. Regarding the standard LSTM residuals shown in the middle panel, although the model attempted to fit the curve, the Hurst exponent of its residual sequence remains high at 0.6666. As statistically confirmed by a Hurst exponent strictly greater than 0.5, this indicates that untreated long memory persists in the error terms, and the integer-order model indicating that significant serial correlation remains. Turning to the ultimate model residuals in the bottom panel, it is highly encouraging that the Hurst exponent of the prediction residuals for the Frac-Attn-GL model was successfully degraded to 0.4917. This value closely approximates the theoretical white noise baseline of 0.50, confirming that the framework has successfully extracted the long-range dependence and satisfies the diagnostic test.
Figure 19.
Hybrid MFA-DMA Residual Diagnostics for NASDAQ.
6.2. Residual Diagnostics of the Dow Jones Industrial Average
For the Dow Jones Industrial Average, which is dominated by traditional blue-chip stocks, the diagnostic results are detailed in Figure 20. The original market volatility of the Dow Jones index has a Detrended Moving Average Hurst exponent of approximately 0.7767. As shown in the middle panel for the standard LSTM residuals, the traditional integer-order network still leaves a residual Hurst exponent as high as 0.6517 even when facing the relatively stable Dow Jones market, failing to strip away long-range dependencies. Conversely, the bottom panel demonstrates that for the ultimate model residuals, the Frac-Attn-GL model continues to demonstrate powerful signal extraction capabilities by incorporating fractional-order physical priors, effectively suppressing the residual Hurst exponent of the Dow Jones index to approximately 0.4926, which is aligned with white noise characteristics.
Figure 20.
Hybrid MFA-DMA Residual Diagnostics for Dow Jones.
6.3. Residual Diagnostics of the S&P 500 Index
The hybrid multifractal diagnostics for the S&P 500 index, which serves as a macroeconomic barometer, are presented in Figure 21. The original sequence of the S&P 500 has a Detrended Moving Average Hurst exponent of 0.7993. In Figure 21, the same physical phenomenon is observed where the residual Hurst exponent of the standard model stays at 0.6590, indicating that long memory persists. In contrast, the Frac-Attn-GL model proposed in this study successfully reduces the residual Hurst exponent to 0.4944, effectively stripping the long-range dependence from the residual sequence.
Figure 21.
Hybrid MFA-DMA residual diagnostics for the S&P 500 index.
In Section 2 of this paper, multifractal testing confirmed that the original market data contains deep long-memory characteristics . In this robustness check, empirical evidence proves that the baseline models lack fractional-order operators and thus their prediction residuals retain untreated deep memory . Our proposed ultimate model Frac-Attn-GL functions as a robust framework that has effectively captured the long-memory features from the original sequence and reduced them to a state with no significant long memory (H ≈ 0.50). This complete stripping of features from to represents a comprehensive signal extraction in its truest sense.
7. Conclusions and Future Work
7.1. Research Summary: An End-to-End Closed Loop from Fractal Discovery to Long-Memory Quantization
In modern financial markets characterized by nonlinear mutations and extreme tail shocks, the accurate prediction of asset returns and volatility is not only the core of quantitative investment but also the cornerstone of systemic risk prevention. Traditional linear econometric models and standard deep learning networks based on integer-order calculus such as standard LSTM and GRU often fail to effectively characterize deep long-range correlations due to their inherent Markovian short-sighted traps when facing real markets with significant multifractal features.
To address this fundamental pain point in the field, this study pioneered a novel deep learning prediction framework that integrates economic physics priors namely the Fractional-order Spatiotemporal Attention Network or Frac-Attn-GL. Through rigorous hierarchical ablation experiments and residual diagnostics on three core stock indices including the Dow Jones, S&P 500, and NASDAQ covering multiple extreme shock cycles between 2015 and 2025, this study reaches several core conclusions.
First, market microstructure heterogeneity determines the endogenous evolution of model decay parameters. Multifractal Detrended Fluctuation Analysis indicates that the tech-heavy NASDAQ index exhibits the widest singularity fractal spectrum and contains the deepest long-range memory, while the blue-chip-dominated Dow Jones index is relatively stable. Without any manual intervention, the Frac-Attn-GL model adaptively learned the smallest fractional-order decay parameter for the NASDAQ and allocated the largest parameter for the Dow Jones. This consistent quantitative alignment between deep learning parameters and physical fractal width supports the premise that fractional-order operators possess the ability to capture the physical laws of real markets.
Second, the fractional-order dual-channel and spatiotemporal attention mechanisms significantly overcome the short-sighted bottleneck. Comparative results show that the prediction errors for the Frac-Attn-GL framework across all three indices achieved a sharp decline. Especially when dealing with local extreme shocks, the extreme-aware asymmetric loss function drives highly autonomous spatiotemporal routing inversions of attention weights, instantly shifting resources from the long-trend branch to the short-term mutation branch. This effectively avoids the lagging failure issue of traditional models during tail risk events.
Third, the framework achieves a high degree of financial long-memory signal extraction. Hybrid residual diagnostics provide the strongest physical evidence. The prediction residuals of the traditional standard LSTM model still contain deep long-range memory with a Detrended Moving Average Hurst exponent exceeding 0.65. In contrast, the Frac-Attn-GL model thoroughly extracts the long-memory characteristics from the original market sequences and successfully reduces the prediction residuals to a sequence lacking long-range dependence, where the Hurst exponent is approximately 0.50. This achieves a research closed loop from complexity discovery to comprehensive feature extraction.
7.2. Practical Applications and Commercial Potential
The Frac-Attn-GL framework demonstrates high transformation value in real-world quantitative finance and risk management scenarios.
First, regarding dynamic tail risk hedging and Value at Risk measurement, the framework is extremely sensitive to extreme shocks and can approximate true heavy-tailed distributions. Integrating its prediction outputs as underlying signals into Value at Risk and Expected Shortage estimation models can significantly mitigate the failure of traditional historical simulation methods in capital requirement calculations during crisis cycles.
Second, regarding high-frequency statistical arbitrage and alpha signal mining, the fractional-order operator possesses excellent mathematical scale-invariance which allows the architecture to extend from daily frequency to minute or even tick-level data. This model is expected to mine long-memory alpha returns in the nonlinear imbalance dynamics of the micro limit order book that traditional momentum or reversal factors cannot reach.
7.3. Limitations of the Study
Although the Frac-Attn-GL framework proposed in this paper has made breakthrough progress in countering financial long-range memory and extreme tail risks, there remain certain limitations due to research boundaries and computational resources. These limitations reflect the modeling difficulty of complex financial systems in three aspects.
First, there are limitations in sample dimensions and data frequency. The empirical benchmarks of this paper are primarily established on the daily frequency data of the three core U.S. stock indices. Although these markets are highly representative, the cross-market universality and robustness of the fractional framework have not been fully verified in high-frequency limit order book data containing more dense microstructure noise, or in emerging markets such as the Chinese A-share market characterized by irrationality and policy intervention.
Second, the long-memory operators cause an increase in computational complexity. Unlike standard recurrent neural networks that rely only on the state of the preceding moment for Markovian transitions, the non-locality of the Grünwald–Letnikov fractional-order operator requires the model to process and maintain historical memory tensors during each forward inference and backpropagation through time. This extraction of deep memory significantly increases the memory footprint and time complexity of the model, which may present computational bottlenecks in real-world high-frequency concurrent calculation scenarios involving large asset pools.
Third, there is a lack of exogenous macroeconomic driver variables. The current model essentially belongs to an endogenous price-volume dynamics framework and its prediction logic depends heavily on the historical trajectories of prices and volatility. However, extreme black swan events in real markets are often triggered by sudden exogenous macroeconomic policies such as unexpected interest rate hikes by the Federal Reserve or geopolitical conflicts. The model has not yet incorporated the fusion of multi-modal information such as macroeconomic indicators or unstructured news sentiment, which limits its forward-looking early warning capability for non-historical recurring external shocks.
7.4. Future Work
To address the aforementioned limitations and adapt to the evolving mechanisms of market memory within the Adaptive Market Hypothesis, this paper identifies potential evolutionary directions for the deep learning prediction of complex financial time series. Future work can be expanded along three core dimensions.
The first dimension involves dynamic evolution toward a multimodal time-varying fractional order. To address the lack of exogenous variables and the limitation of static parameters, future work can attempt to introduce meta-learning or reinforcement learning mechanisms so that the fractional-order operator evolves from a global static scalar into a dynamic time-varying tensor driven by exogenous features such as the VIX index or external news sentiment scores. This will enable the model to track and respond to the dramatic expansion and contraction of the market memory lifecycle in real-time.
The second dimension involves lightweight fractional-order operators and downscaling to high-frequency microstructures. To address computational complexity, future research can explore the introduction of the Fast Fourier Transform or low-rank sparsification matrices to approximate the Grünwald–Letnikov fractional-order operator, thereby significantly reducing the computational cost of long-memory convolutions. After overcoming computational bottlenecks, this architecture can be applied to the imbalance dynamics analysis of the micro limit order book to mine long-range alpha returns.
The third dimension involves graph-based volatility spillover extensions across assets. Modern financial markets are highly interconnected complex networks where assets do not evolve in isolation. Several specific factors necessitate the future integration of the Frac-Attn-GL framework with Graph Neural Networks (GNNs). First, while the current framework excels at extracting longitudinal temporal long memory within a single asset, it lacks a mechanism to explicitly model lateral spatial dependencies—specifically, cross-asset volatility spillover effects. Second, systemic risk contagion heavily depends on network topology (e.g., dynamic correlations among equities, bonds, and commodities). Future research should deeply couple fractional-order operators with Graph Attention Networks. In this proposed hybrid architecture, fractional operators would govern the temporal power-law decay of individual asset nodes, while the GNN would capture the dynamic structural linkages between nodes. This spatiotemporal integration could facilitate the development of a more comprehensive and robust macro-systemic risk early warning platform.
Author Contributions
Conceptualization, Y.W. and Y.Z.; Methodology, Y.W. and Y.Z.; Software, Y.W. and Y.Z.; Validation, Y.W. and Y.Z.; Formal analysis, Y.W. and Y.Z.; Investigation, Y.W. and Y.Z.; Resources, Y.W. and Y.Z.; Data curation, Y.W. and Y.Z.; Writing—original draft, Y.W. and Y.Z.; Writing—review & editing, Y.W. and Y.Z.; Visualization, Y.W. and Y.Z.; Supervision, Y.W. and Y.Z.; Project administration, Y.W. and Y.Z.; Funding acquisition, Y.W. and Y.Z. All authors have read and agreed to the published version of the manuscript.
Funding
This research received no external funding.
Data Availability Statement
The supporting dataset and code for this study can be downloaded at: https://doi.org/10.5281/zenodo.19325878. The original raw data were manually collected and organized from the Yahoo Finance public database (https://nz.finance.yahoo.com/author/yahoo--finance; accessed on 15 March 2026).
Conflicts of Interest
The authors declare no conflict of interest.
Abbreviations
| ARIMA | AutoRegressive Integrated Moving Average |
| LSTM | Long Short-Term Memory |
| GRU | Gated Recurrent Unit |
| Frac-Attn-GL | Fractional-order Spatiotemporal Attention-based GRU-LSTM framework |
| GL | Grünwald–Letnikov (fractional calculus operator) |
| FMH | Fractal Market Hypothesis |
| MF-DFA | Multifractal Detrended Fluctuation Analysis |
| MFA-DMA | Multifractal Detrended Moving Average |
| RMSE | Root Mean Square Error |
| MAE | Mean Absolute Error |
| OHLC | Open, High, Low, Close (prices) |
| BPTT | Backpropagation Through Time |
| XAI | Explainable Artificial Intelligence |
| RNN | Recurrent Neural Network |
| RW | Random Walk |
| R/S | Rescaled Range Analysis |
| LOCF | Last Observation Carried Forward |
| CEEMDAN | Complete Ensemble Empirical Mode Decomposition with Adaptive Noise |
| VIX | CBOE Volatility Index |
| GA | Genetic Algorithm |
| GAN | Generative Adversarial Network |
References
- Sahu, S.K.; Mokhade, A.; Bokde, N.D. An overview of machine learning, deep learning, and reinforcement learning-based techniques in quantitative finance: Recent progress and challenges. Appl. Sci. 2023, 13, 1956. [Google Scholar] [CrossRef] [Scilit]
- Nazareth, N.; Reddy, Y.V.R. Financial applications of machine learning: A literature review. Expert Syst. Appl. 2023, 219, 119640. [Google Scholar] [CrossRef] [Scilit]
- Sezer, O.B.; Gudelek, M.U.; Ozbayoglu, A.M. Financial time series forecasting with deep learning: A systematic literature review: 2005–2019. Appl. Soft Comput. 2020, 90, 106181. [Google Scholar] [CrossRef] [Scilit]
- Ozbayoglu, A.M.; Gudelek, M.U.; Sezer, O.B. Deep learning for financial applications: A survey. Appl. Soft Comput. 2020, 93, 106384. [Google Scholar] [CrossRef] [Scilit]
- Mienye, E.; Jere, N.; Obaido, G.; Mienye, I.D.; Aruleba, K. Deep learning in finance: A survey of applications and techniques. AI 2024, 5, 2066–2091. [Google Scholar] [CrossRef] [Scilit]
- Bustos, O.; Pomares-Quimbaya, A. Stock market movement forecast: A systematic review. Expert Syst. Appl. 2020, 156, 113464. [Google Scholar] [CrossRef] [Scilit]
- Kumbure, M.M.; Lohrmann, C.; Luukka, P.; Porras, J. Machine learning techniques and data for stock market forecasting: A literature review. Expert Syst. Appl. 2022, 197, 116659. [Google Scholar] [CrossRef] [Scilit]
- Chong, E.; Han, C.; Park, F.C. Deep learning networks for stock market analysis and prediction: Methodology, data representations, and case studies. Expert Syst. Appl. 2017, 83, 187–205. [Google Scholar] [CrossRef] [Scilit]
- Fischer, T.; Krauss, C. Deep learning with long short-term memory networks for financial market predictions. Eur. J. Oper. Res. 2018, 270, 654–669. [Google Scholar] [CrossRef] [Scilit]
- Krauss, C.; Do, X.A.; Huck, N. Deep neural networks, gradient-boosted trees, random forests: Statistical arbitrage on the S&P 500. Eur. J. Oper. Res. 2017, 259, 689–702. [Google Scholar] [CrossRef] [Scilit]
- Bao, W.; Yue, J.; Rao, Y. A deep learning framework for financial time series using stacked autoencoders and long-short term memory. PLoS ONE 2017, 12, e0180944. [Google Scholar] [CrossRef] [Scilit]
- Chen, S.; Ge, L. Exploring the attention mechanism in LSTM-based Hong Kong stock price movement prediction. Quant. Financ. 2019, 19, 1507–1515. [Google Scholar] [CrossRef] [Scilit]
- Sirignano, J.; Cont, R. Universal features of price formation in financial markets: Perspectives from deep learning. Quant. Financ. 2019, 19, 1449–1459. [Google Scholar] [CrossRef] [Scilit]
- Liu, H.; Long, Z. An improved deep learning model for predicting stock market price time series. Digit. Signal Process. 2020, 102, 102741. [Google Scholar] [CrossRef] [Scilit]
- Huang, Y.; Gao, Y.; Gan, Y.; Ye, M. A new financial data forecasting model using genetic algorithm and long short-term memory network. Neurocomputing 2021, 425, 207–218. [Google Scholar] [CrossRef] [Scilit]
- Yun, K.K.; Yoon, S.W.; Won, D. Prediction of stock price direction using a hybrid GA-XGBoost algorithm with a three-stage feature engineering process. Expert Syst. Appl. 2021, 186, 115716. [Google Scholar] [CrossRef] [Scilit]
- Wang, W.-J.; Tang, Y.; Xiong, J.J.; Zhang, Y.-C. Stock market index prediction based on reservoir computing models. Expert Syst. Appl. 2021, 178, 115022. [Google Scholar] [CrossRef] [Scilit]
- Wang, C.; Chen, Y.; Zhang, S.; Zhang, Q. Stock market index prediction using deep Transformer model. Expert Syst. Appl. 2022, 208, 118128. [Google Scholar] [CrossRef] [Scilit]
- Lin, Y.; Lin, Z.; Liao, Y.; Li, Y.; Xu, J.; Yan, Y. Forecasting the realized volatility of stock price index: A hybrid model integrating CEEMDAN and LSTM. Expert Syst. Appl. 2022, 206, 117736. [Google Scholar] [CrossRef] [Scilit]
- Lv, P.; Shu, Y.; Xu, J.; Wu, Q. Modal decomposition-based hybrid model for stock index prediction. Expert Syst. Appl. 2022, 202, 117252. [Google Scholar] [CrossRef] [Scilit]
- Liu, X.; Guo, J.; Wang, H.; Zhang, F. Prediction of stock market index based on ISSA-BP neural network. Expert Syst. Appl. 2022, 204, 117604. [Google Scholar] [CrossRef] [Scilit]
- Xu, H.; Cao, D.; Li, S. A self-regulated generative adversarial network for stock price movement prediction based on the historical price and tweets. Knowl.-Based Syst. 2022, 247, 108712. [Google Scholar] [CrossRef] [Scilit]
- Park, S.; Yang, J.-S. Interpretable deep learning LSTM model for intelligent economic decision-making. Knowl.-Based Syst. 2022, 248, 108907. [Google Scholar] [CrossRef] [Scilit]
- Çelik, T.B.; İcan, Ö.; Bulut, E. Extending machine learning prediction capabilities by explainable AI in financial time series prediction. Appl. Soft Comput. 2023, 132, 109876. [Google Scholar] [CrossRef] [Scilit]
- Leippold, M.; Wang, Q.; Zhou, W. Machine learning in the Chinese stock market. J. Financ. Econ. 2022, 145, 64–82. [Google Scholar] [CrossRef] [Scilit]
- Liu, W.-J.; Ge, Y.-B.; Gu, Y.-C. News-driven stock market index prediction based on trellis network and sentiment attention mechanism. Expert Syst. Appl. 2024, 250, 123966. [Google Scholar] [CrossRef] [Scilit]
- Lim, B.; Zohren, S. Time-series forecasting with deep learning: A survey. Philos. Trans. A Math. Phys. Eng. Sci. 2021, 379, 20200209. [Google Scholar] [CrossRef] [Scilit]
- Hewamalage, H.; Bergmeir, C.; Bandara, K. Recurrent neural networks for time series forecasting: Current status and future directions. Int. J. Forecast. 2021, 37, 388–427. [Google Scholar] [CrossRef] [Scilit]
- van Houdt, G.; Mosquera, C.; Nápoles, G. A review on the long short-term memory model. Artif. Intell. Rev. 2020, 53, 5929–5955. [Google Scholar] [CrossRef] [Scilit]
- Chen, Z.; Ma, M.; Li, T.; Wang, H.; Li, C. Long sequence time-series forecasting with deep learning: A survey. Inf. Fusion 2023, 97, 101819. [Google Scholar] [CrossRef] [Scilit]
- Kim, J.; Kim, H.; Kim, H.; Lee, D.; Yoon, S. A comprehensive survey of deep learning for time series forecasting: Architectural diversity and open challenges. Artif. Intell. Rev. 2025, 58, 216. [Google Scholar] [CrossRef] [Scilit]
- Jiang, Z.-Q.; Xie, W.-J.; Zhou, W.-X.; Sornette, D. Multifractal analysis of financial markets: A review. Rep. Prog. Phys. 2019, 82, 125901. [Google Scholar] [CrossRef] [Scilit]
- Thompson, J.R.; Wilson, J.R. Multifractal detrended fluctuation analysis: Practical applications to financial time series. Math. Comput. Simul. 2016, 126, 63–88. [Google Scholar] [CrossRef] [Scilit]
- Miloş, L.R.; Haţiegan, C.; Miloş, M.C.; Barna, F.M.; Boțoc, C. Multifractal detrended fluctuation analysis (MF-DFA) of stock market indexes. Empirical evidence from seven Central and Eastern European markets. Sustainability 2020, 12, 535. [Google Scholar] [CrossRef] [Scilit]
- Goddard, J.; Onali, E. Long memory and multifractality: A joint test. Physica A 2016, 451, 288–294. [Google Scholar] [CrossRef] [Scilit]
- Zhang, S.; Fang, W. Multifractal behaviors of stock indices and their ability to improve forecasting in a volatility clustering period. Entropy 2021, 23, 1018. [Google Scholar] [CrossRef] [Scilit]
- Walasek, R.; Gajda, J. Fractional differentiation and its use in machine learning. Int. J. Adv. Eng. Sci. Appl. Math. 2021, 13, 270–277. [Google Scholar] [CrossRef] [Scilit]
- Karanasos, M.; Yfanti, S.; Christopoulos, A. The long memory HEAVY process: Modeling and forecasting financial volatility. Ann. Oper. Res. 2021, 306, 111–130. [Google Scholar] [CrossRef] [Scilit]
- Liang, C.; Xu, Y.; Chen, Z.; Li, X. Forecasting China’s stock market volatility with shrinkage method: Can adaptive lasso select stronger predictors from numerous predictors? Int. J. Financ. Econ. 2023, 28, 3689–3699. [Google Scholar] [CrossRef] [Scilit]
- Zhang, C.; Zhang, Y.; Cucuringu, M.; Qian, Z. Volatility forecasting with machine learning and intraday commonality. J. Financ. Econom. 2024, 22, 492–530. [Google Scholar] [CrossRef] [Scilit]
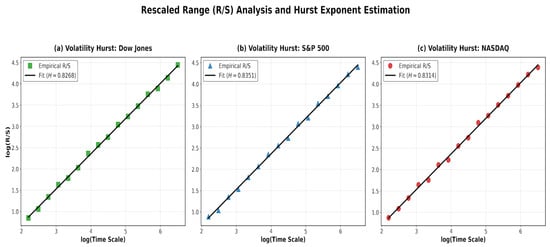
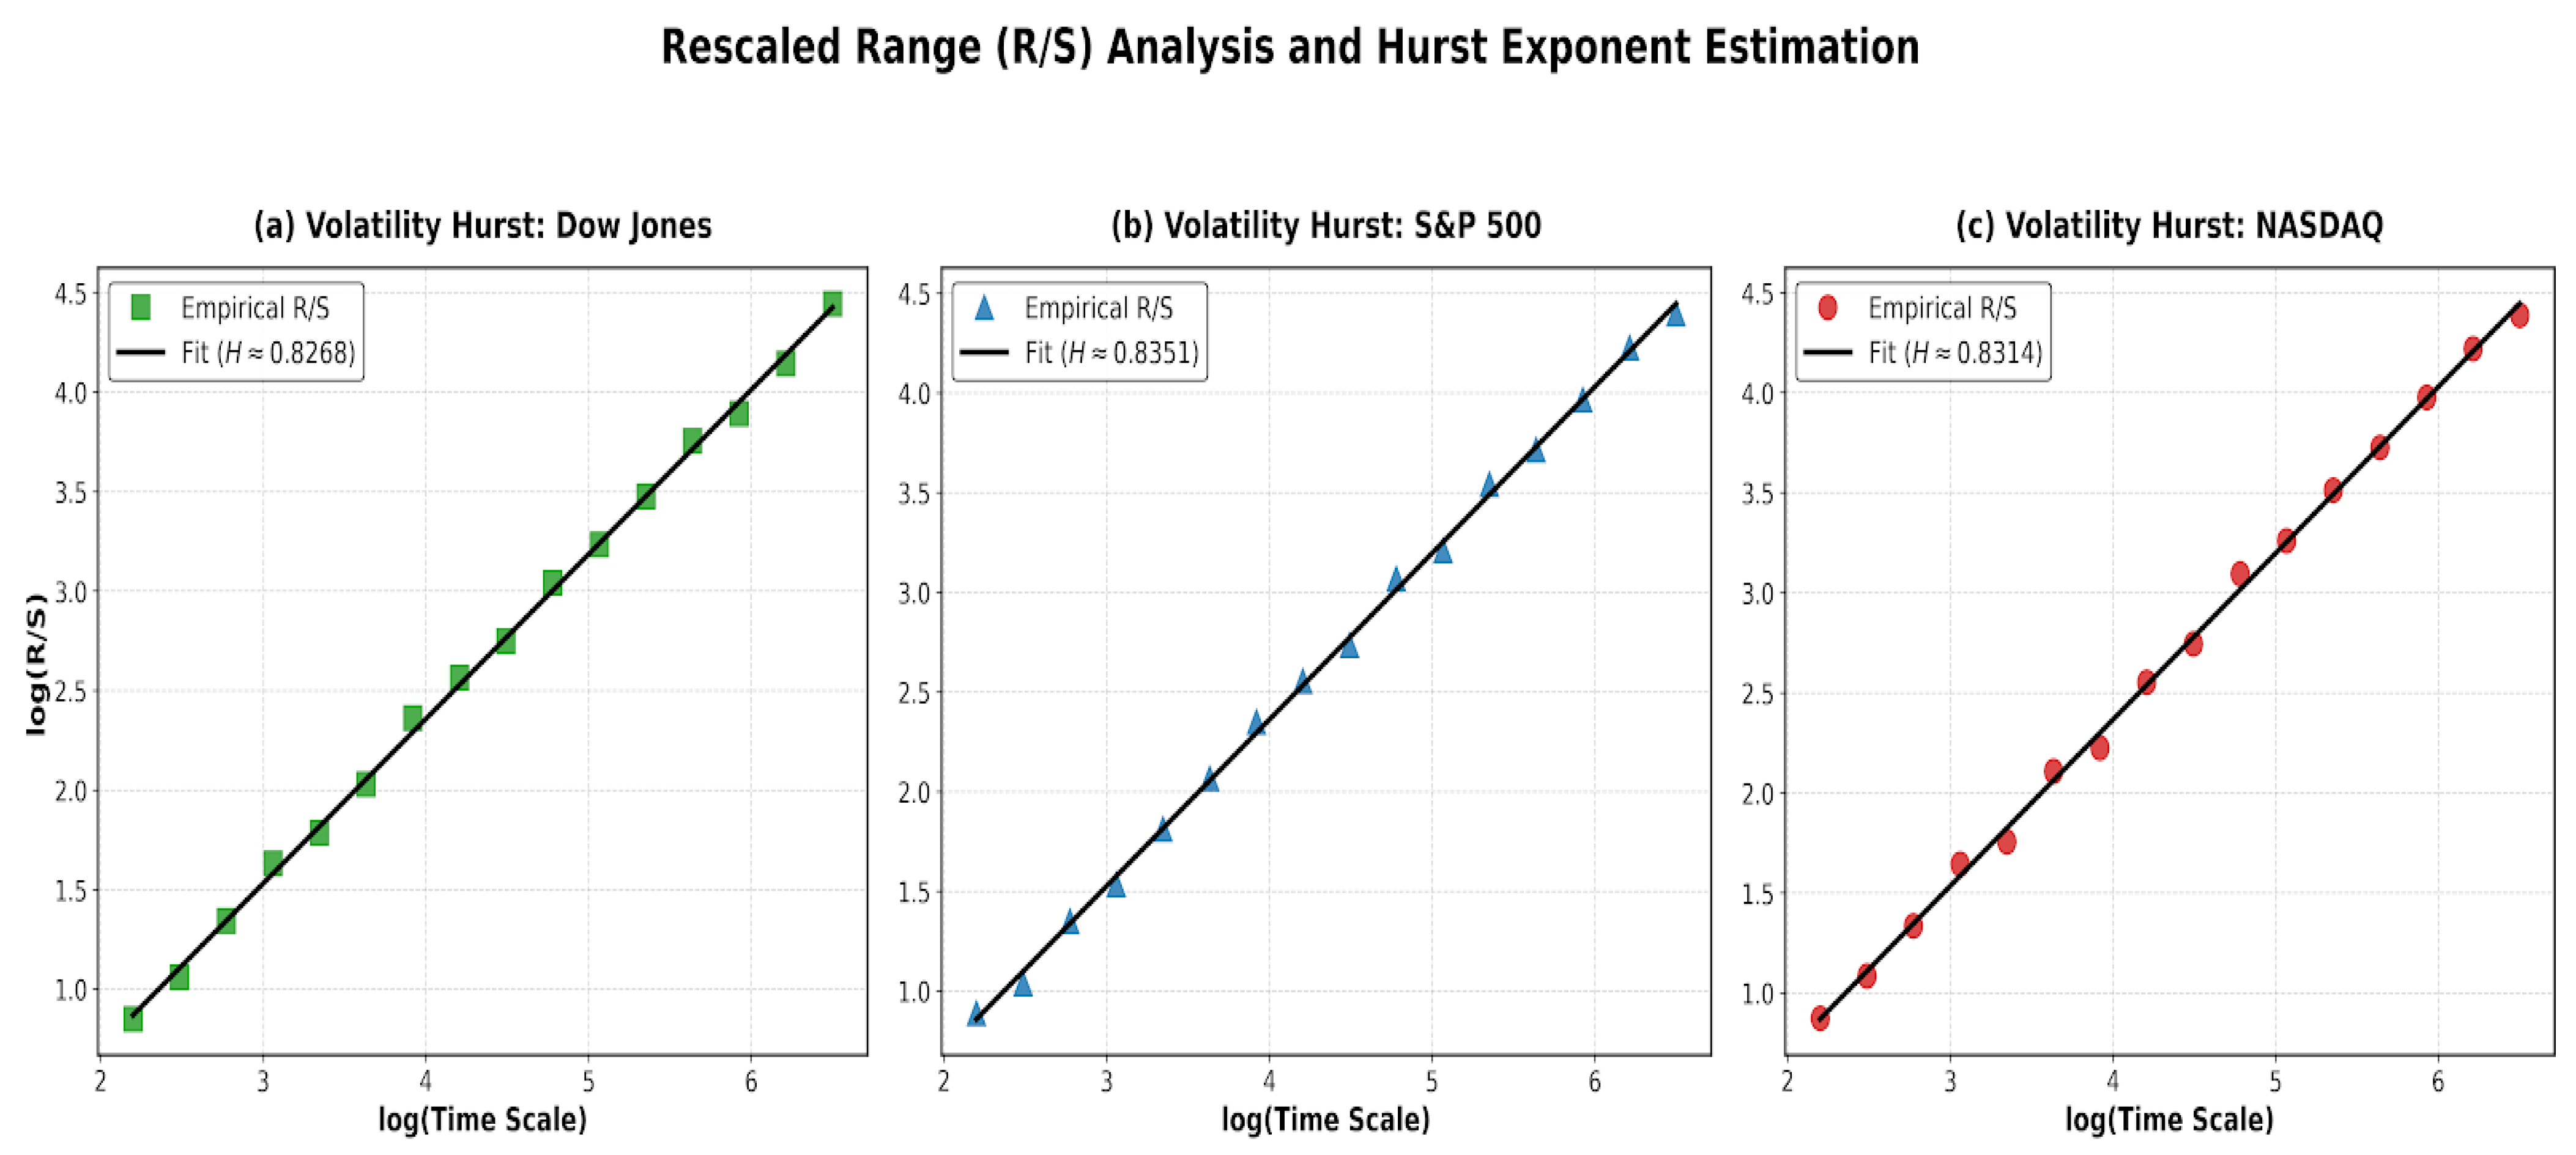
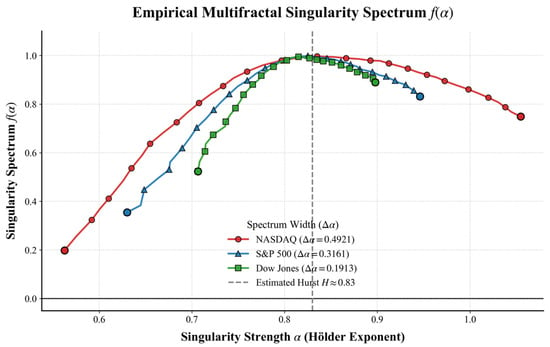
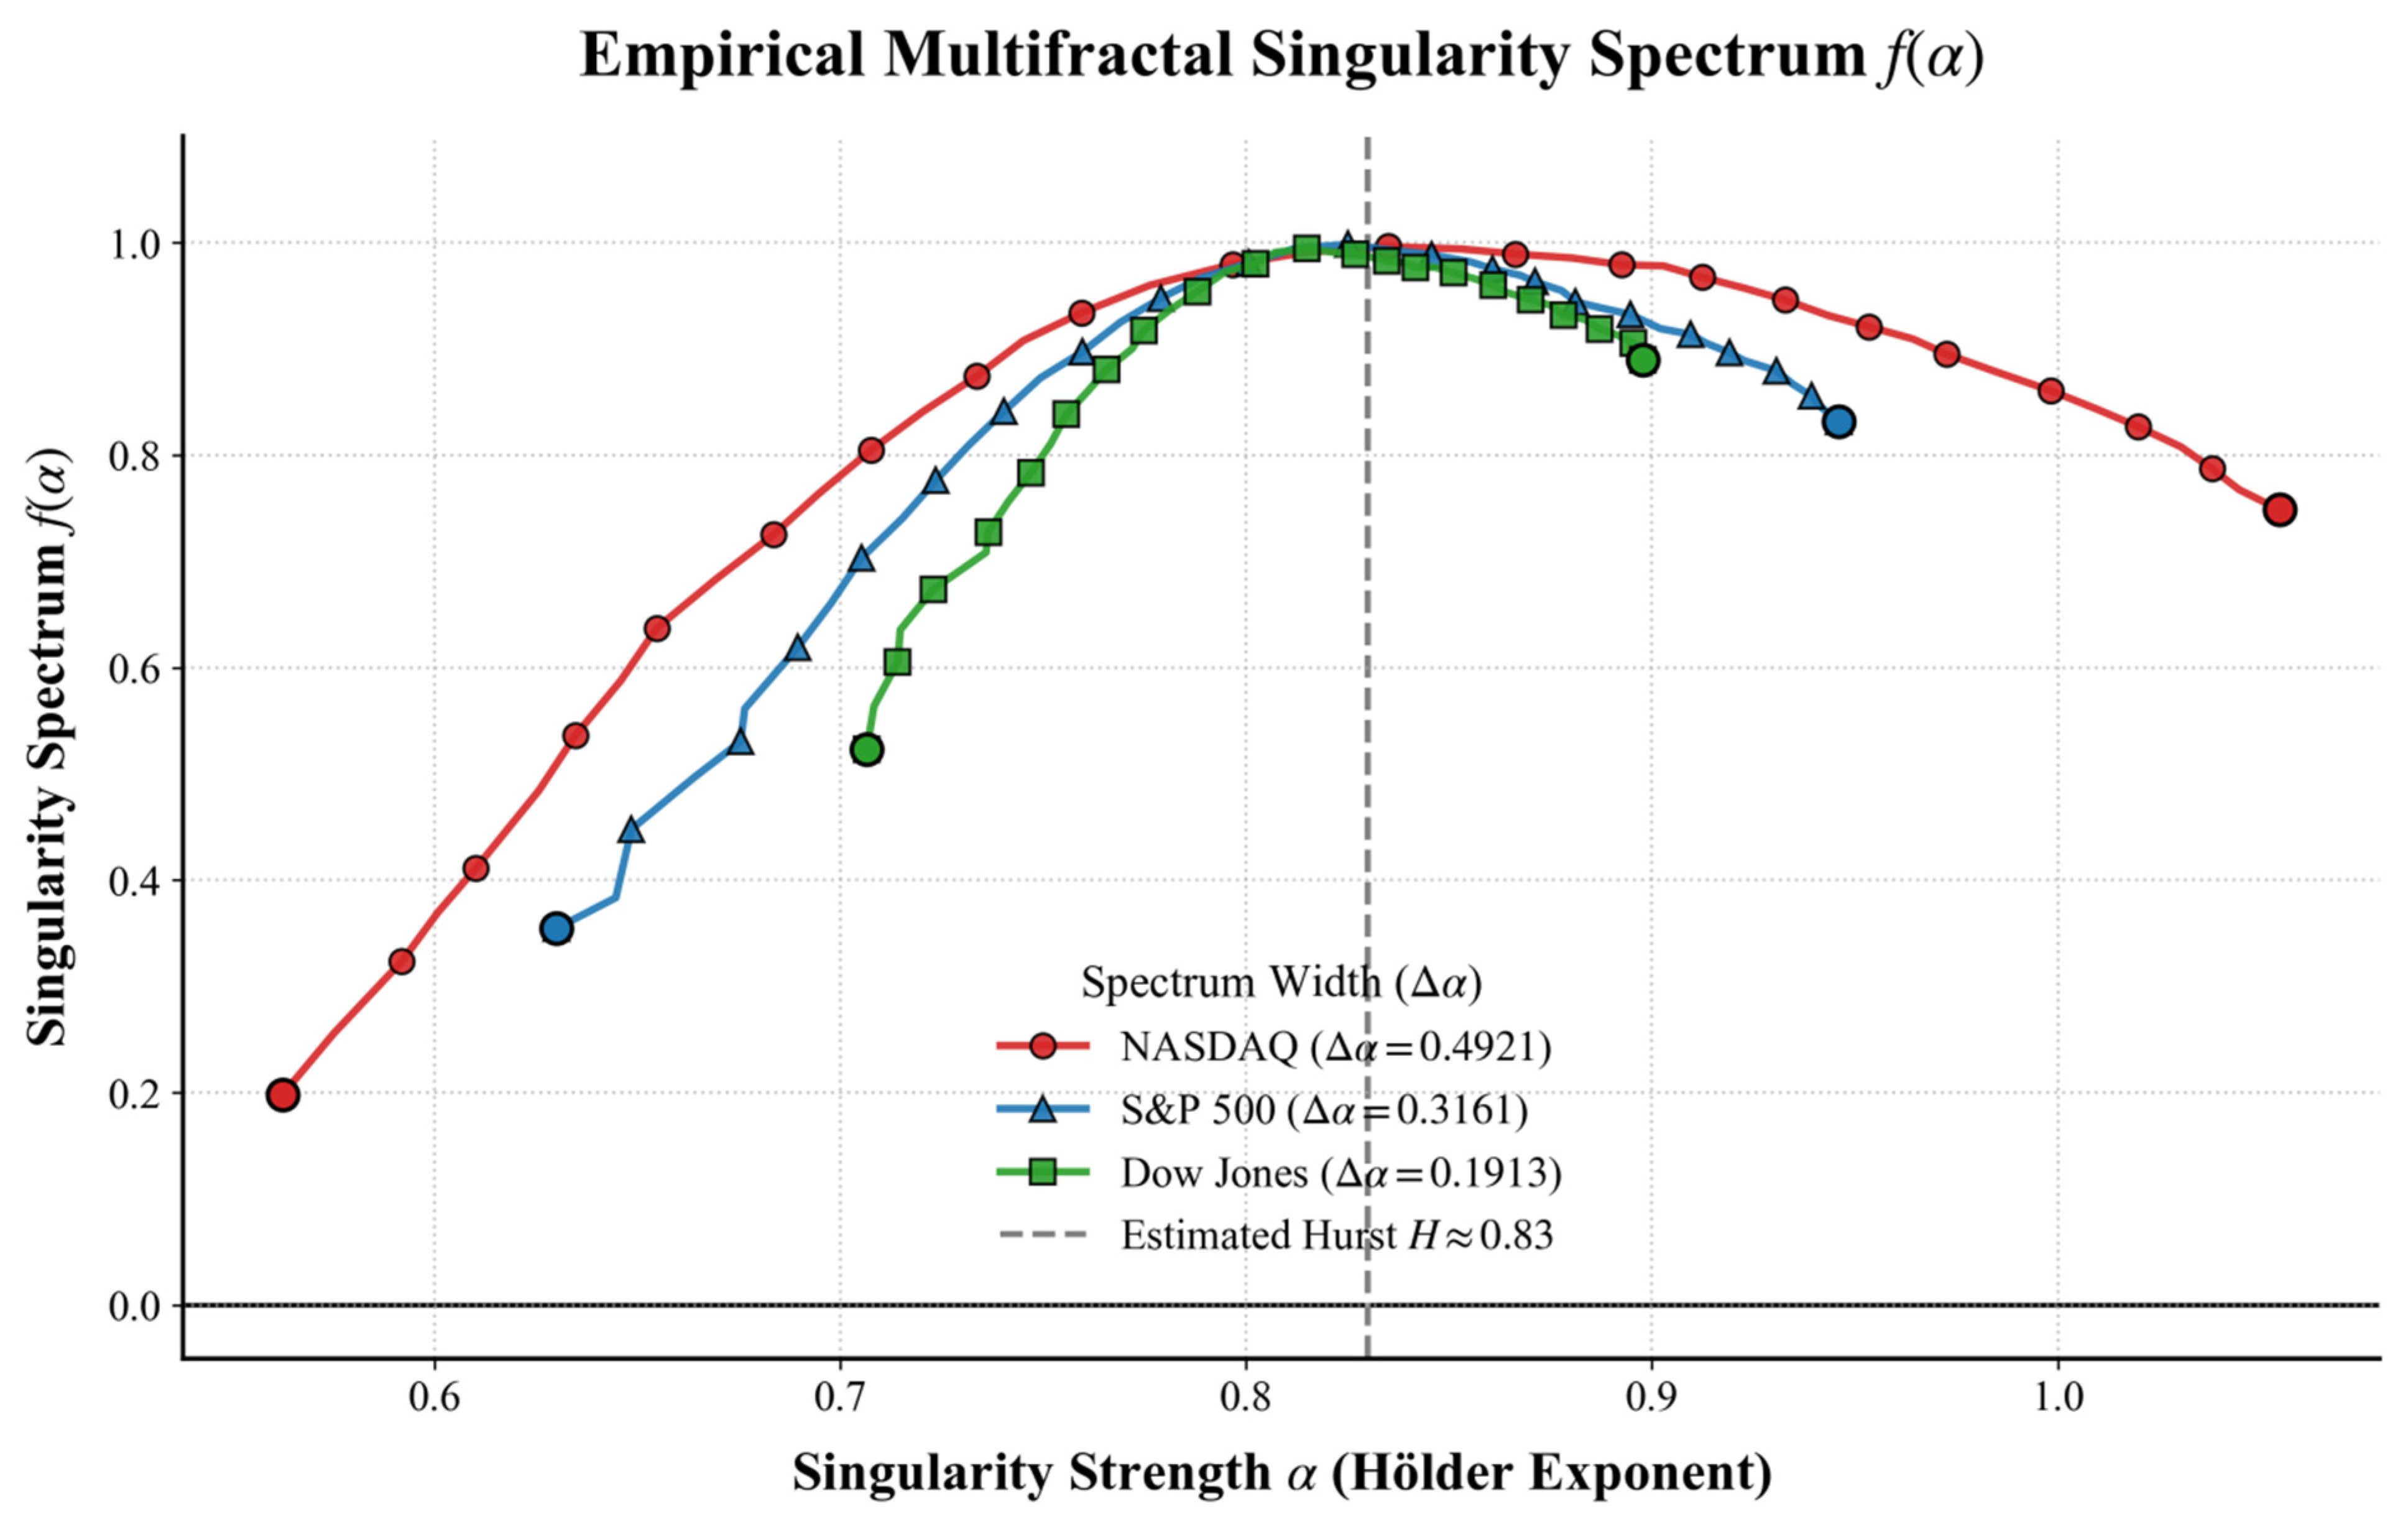
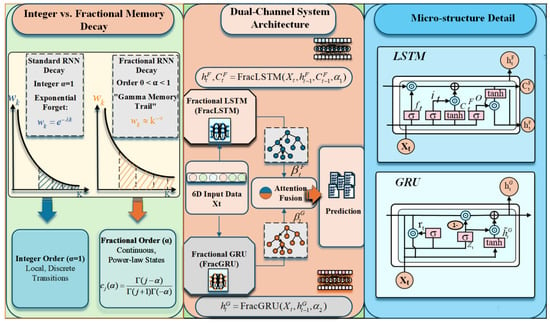
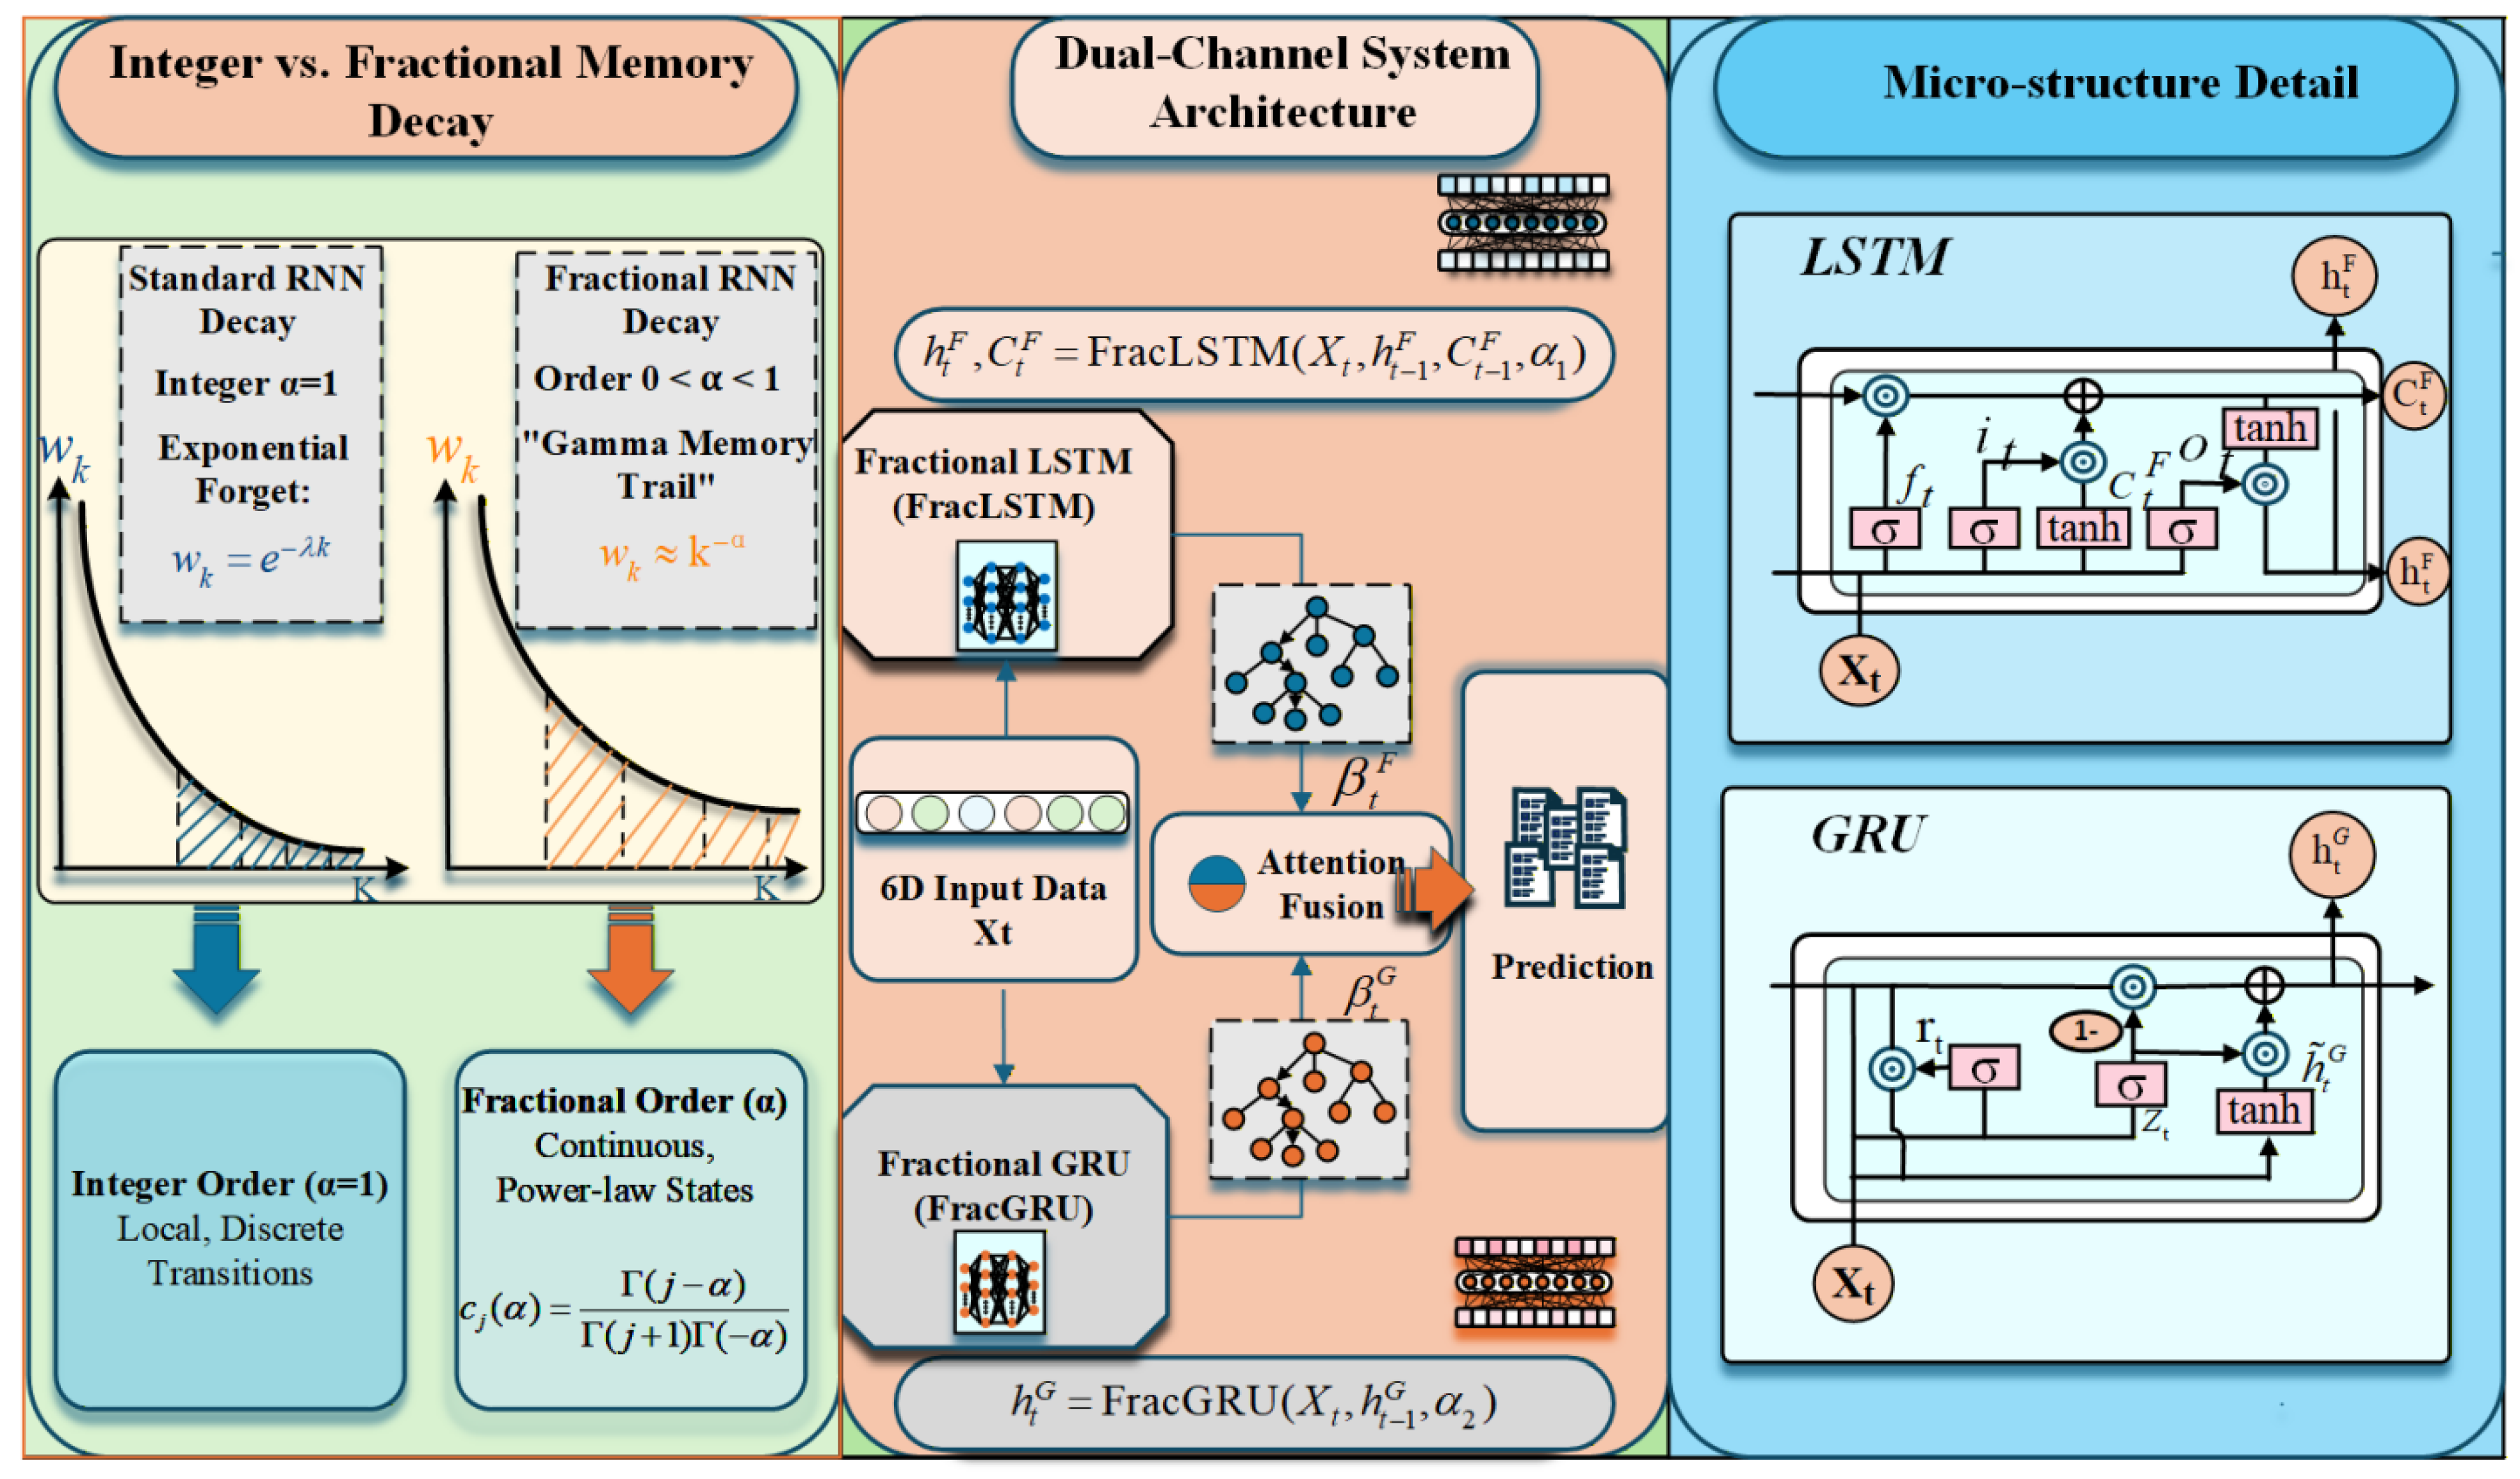
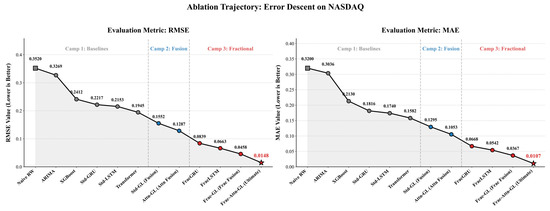
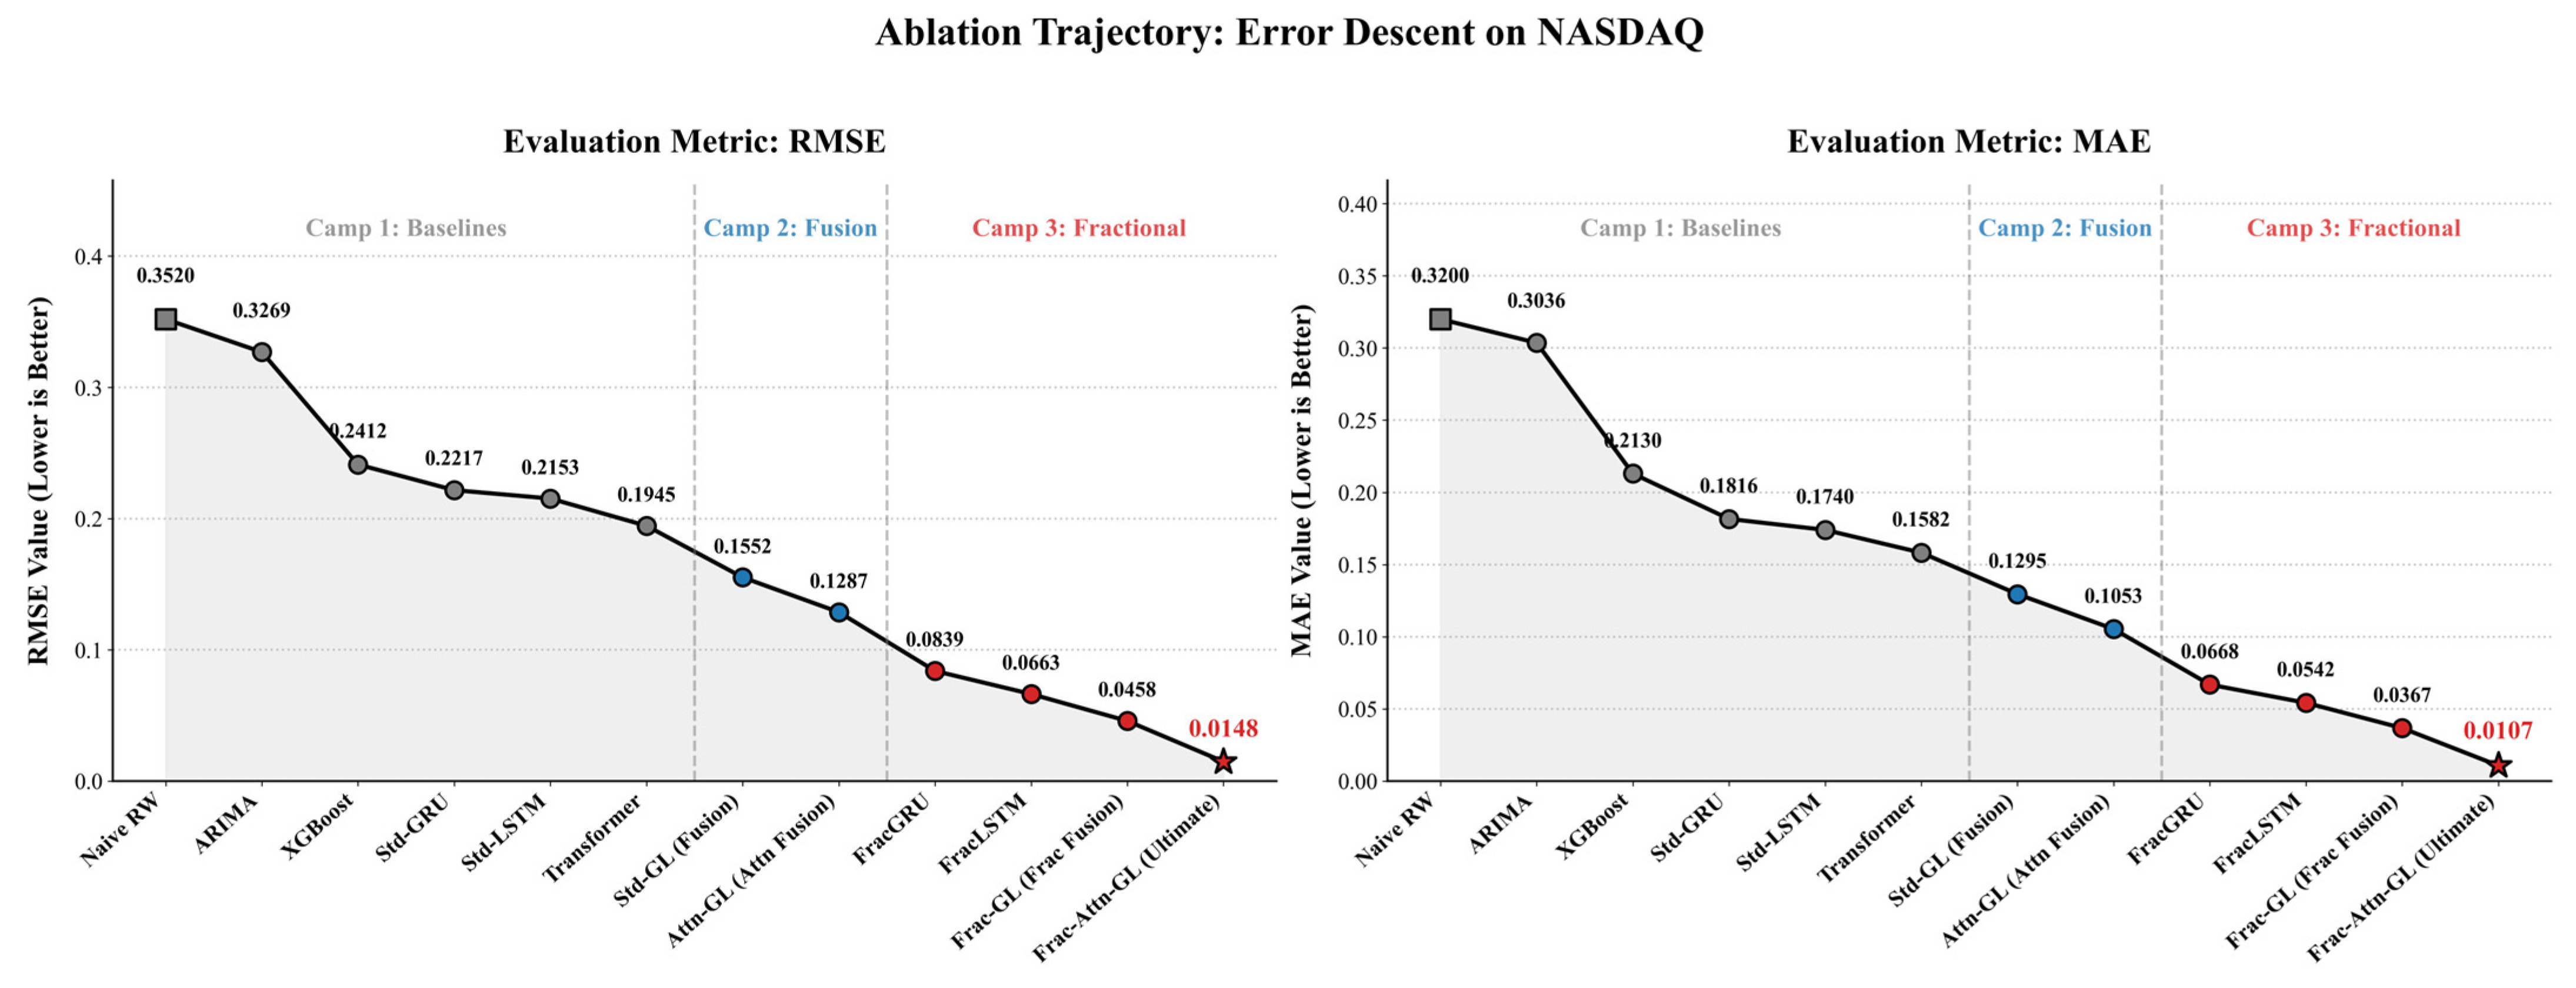
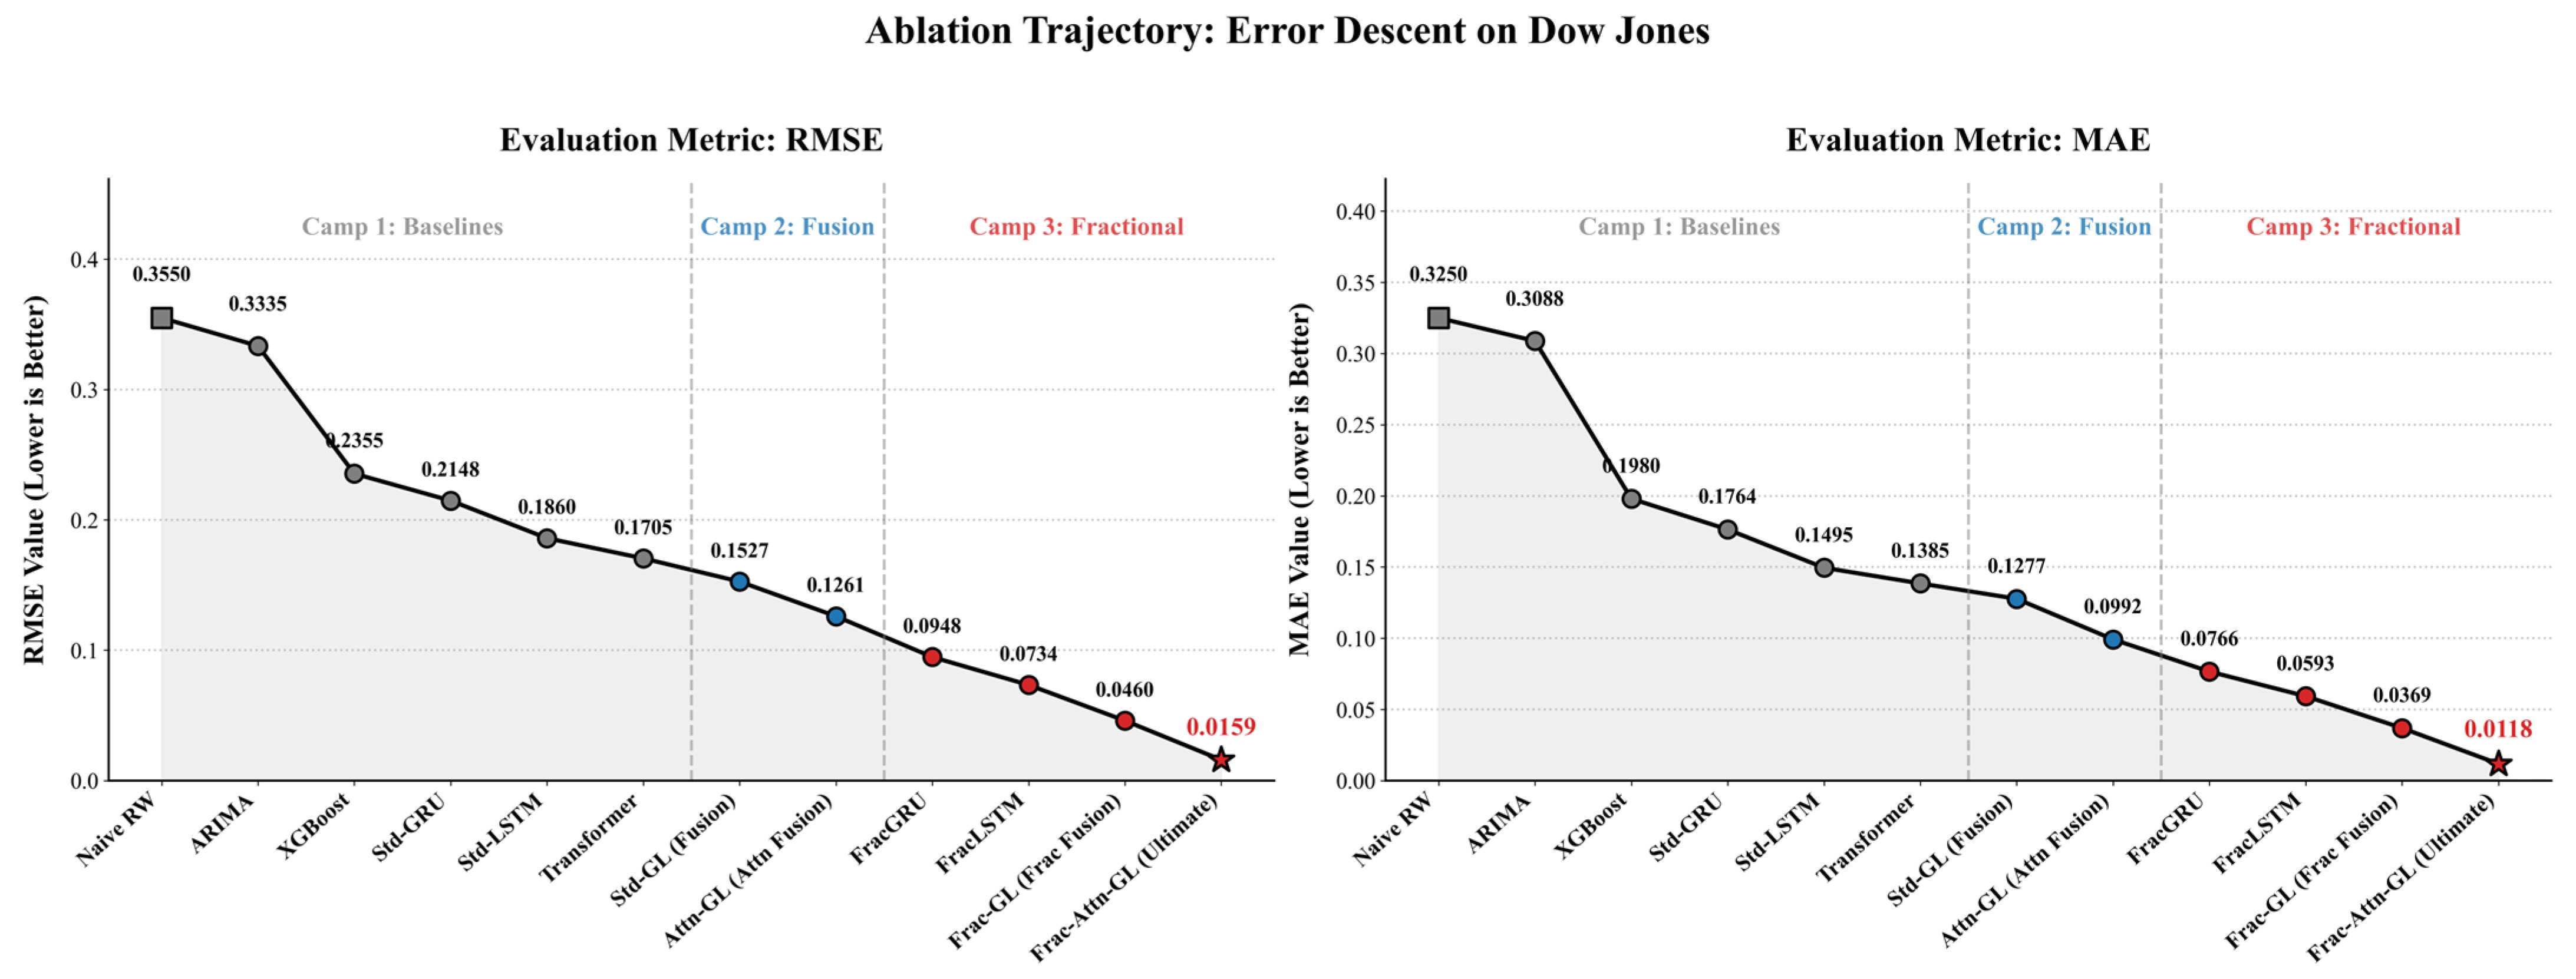
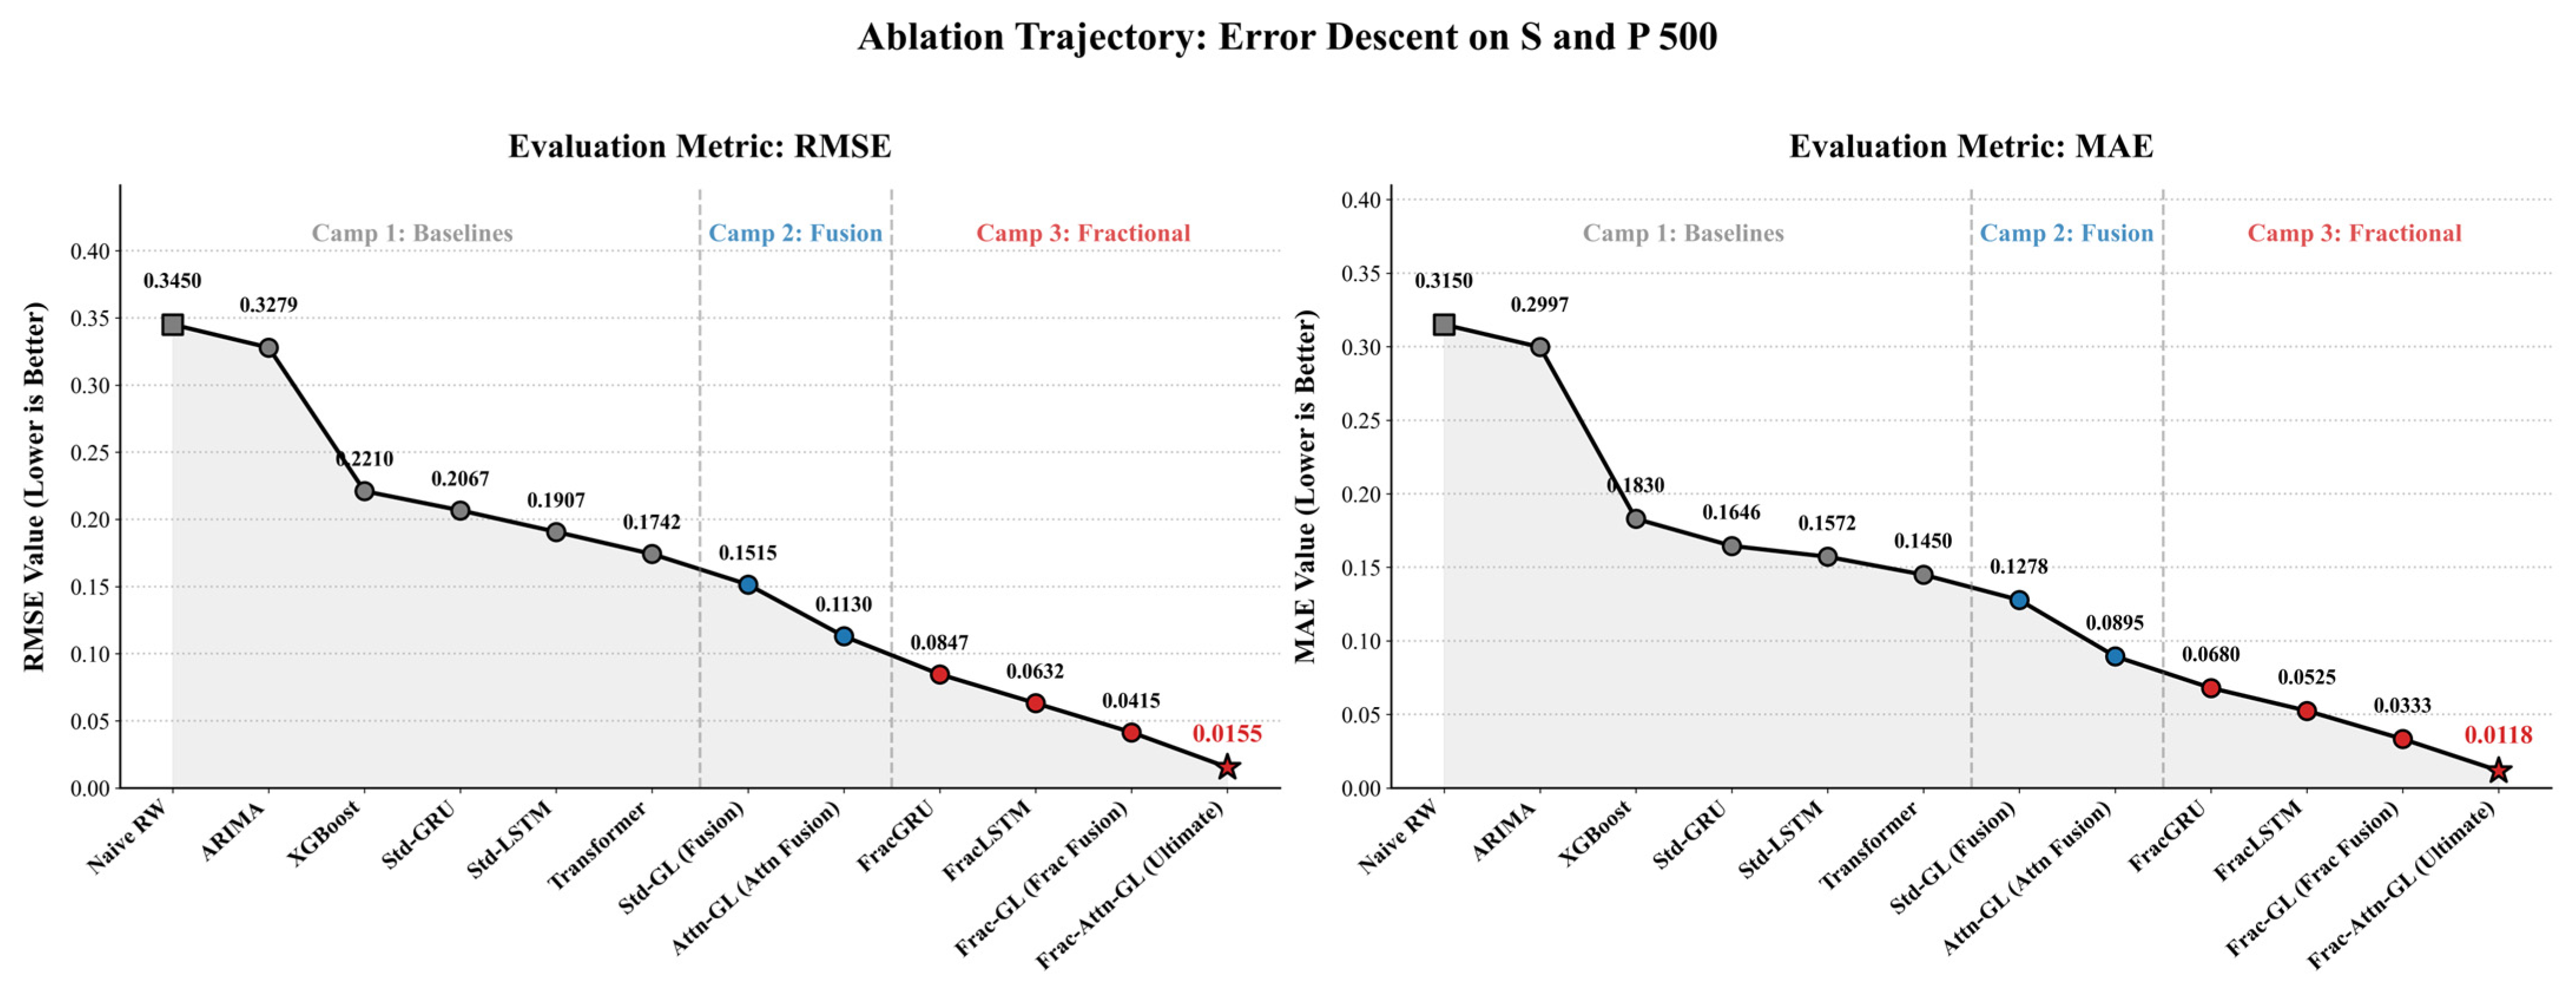
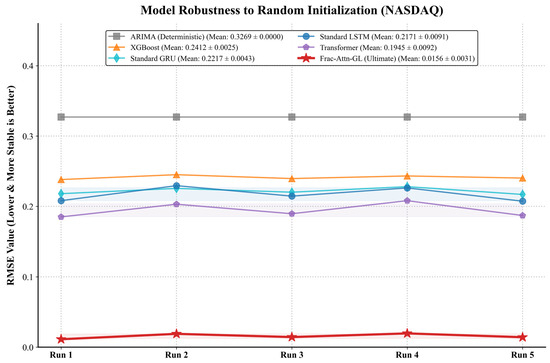
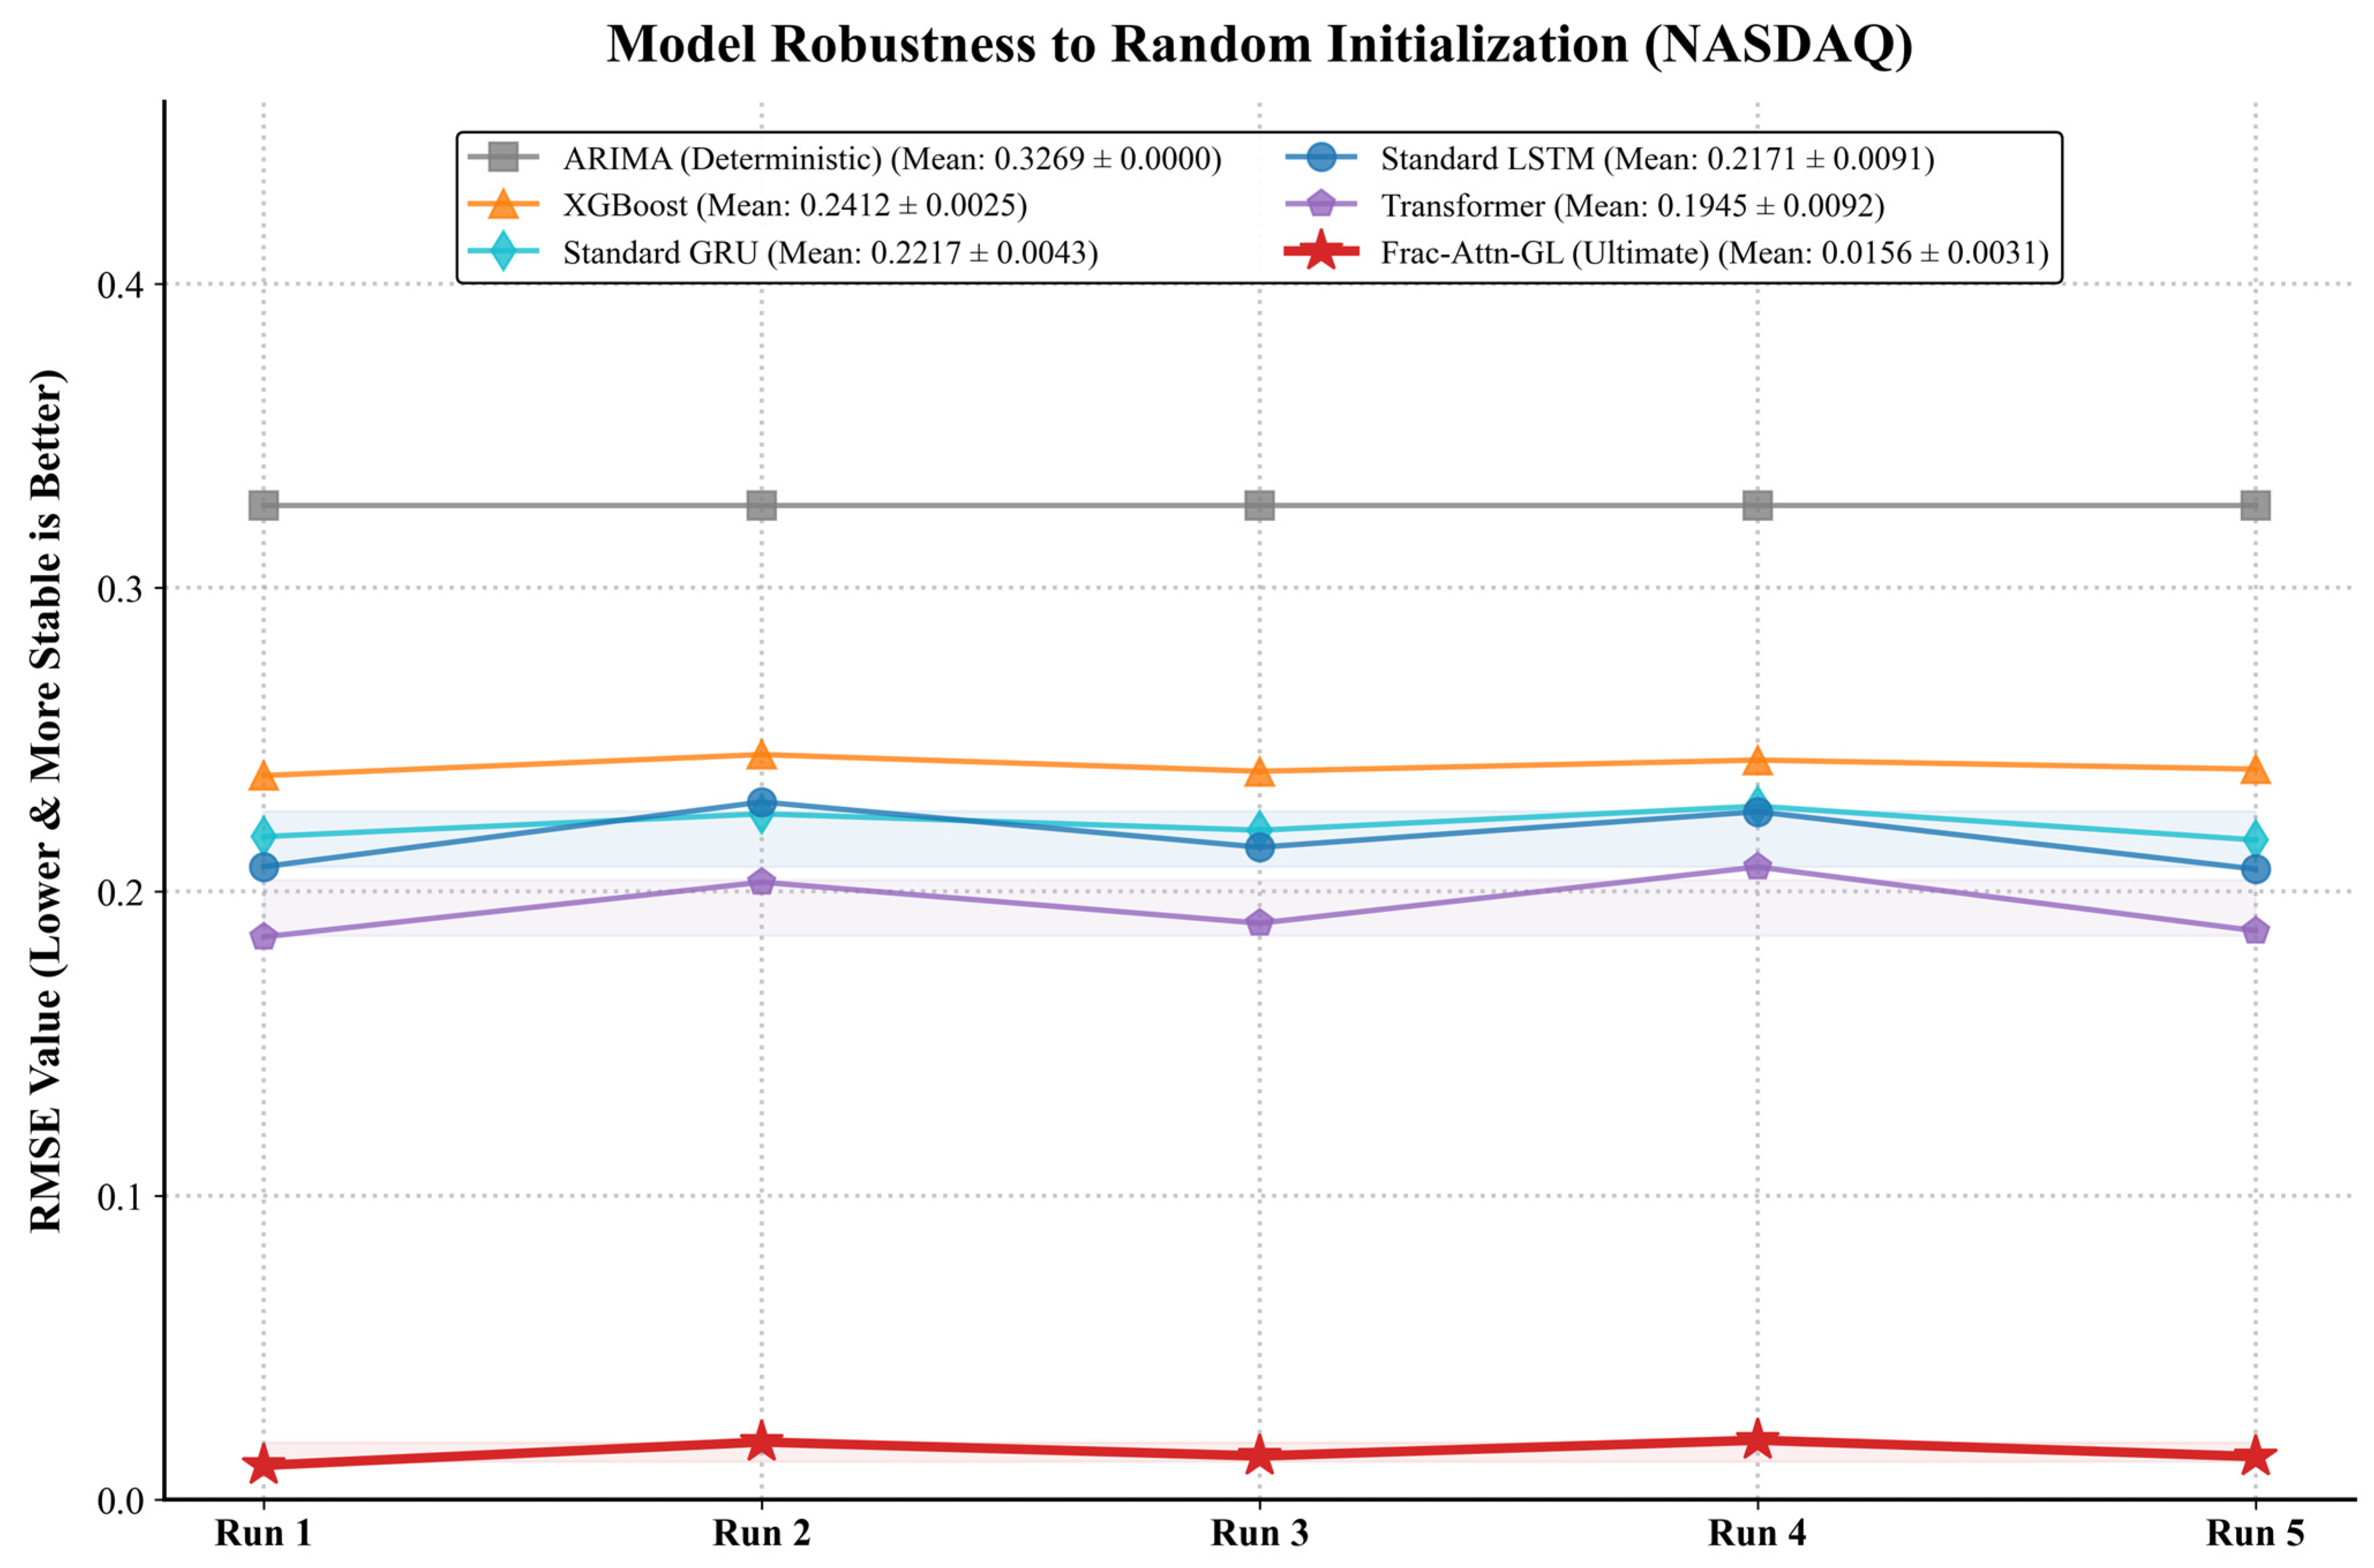
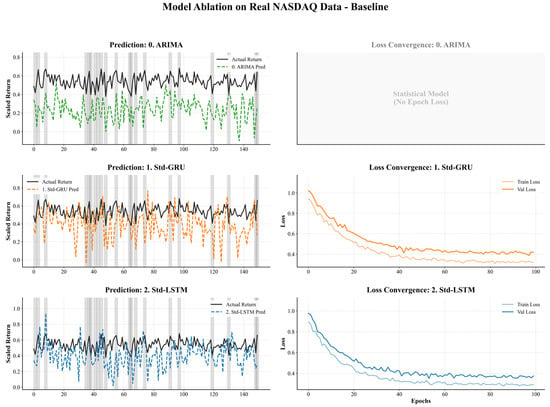
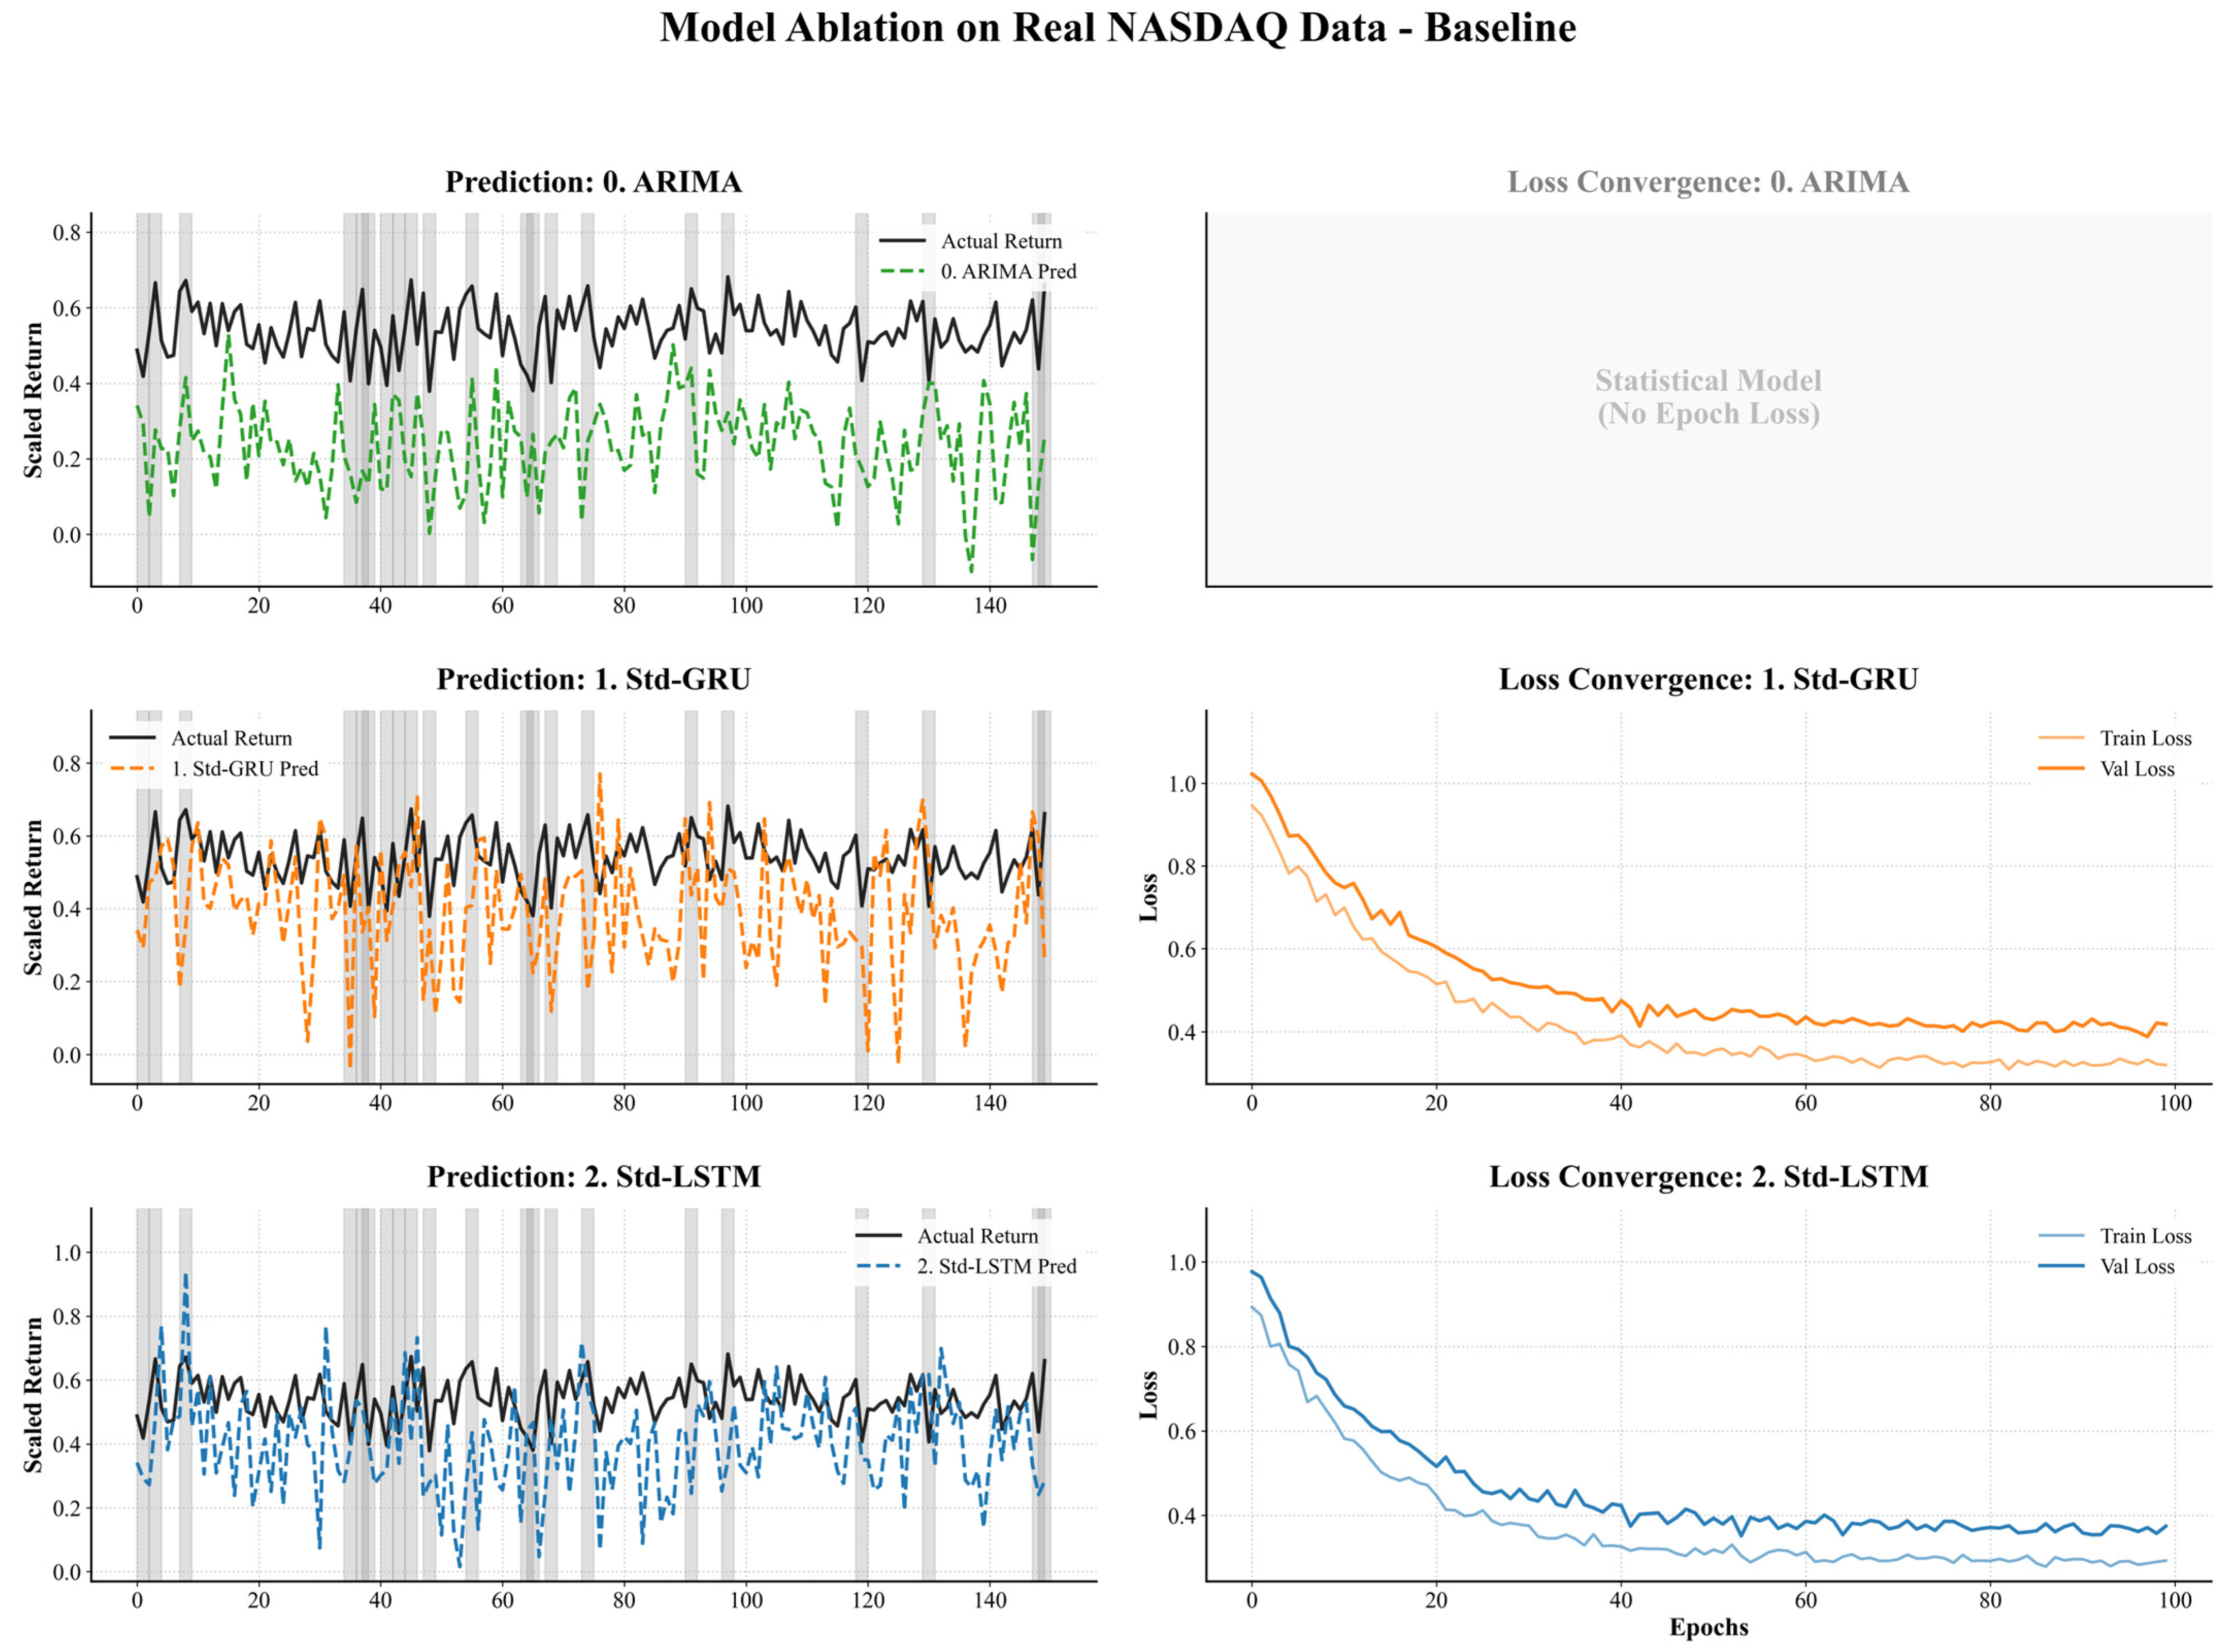
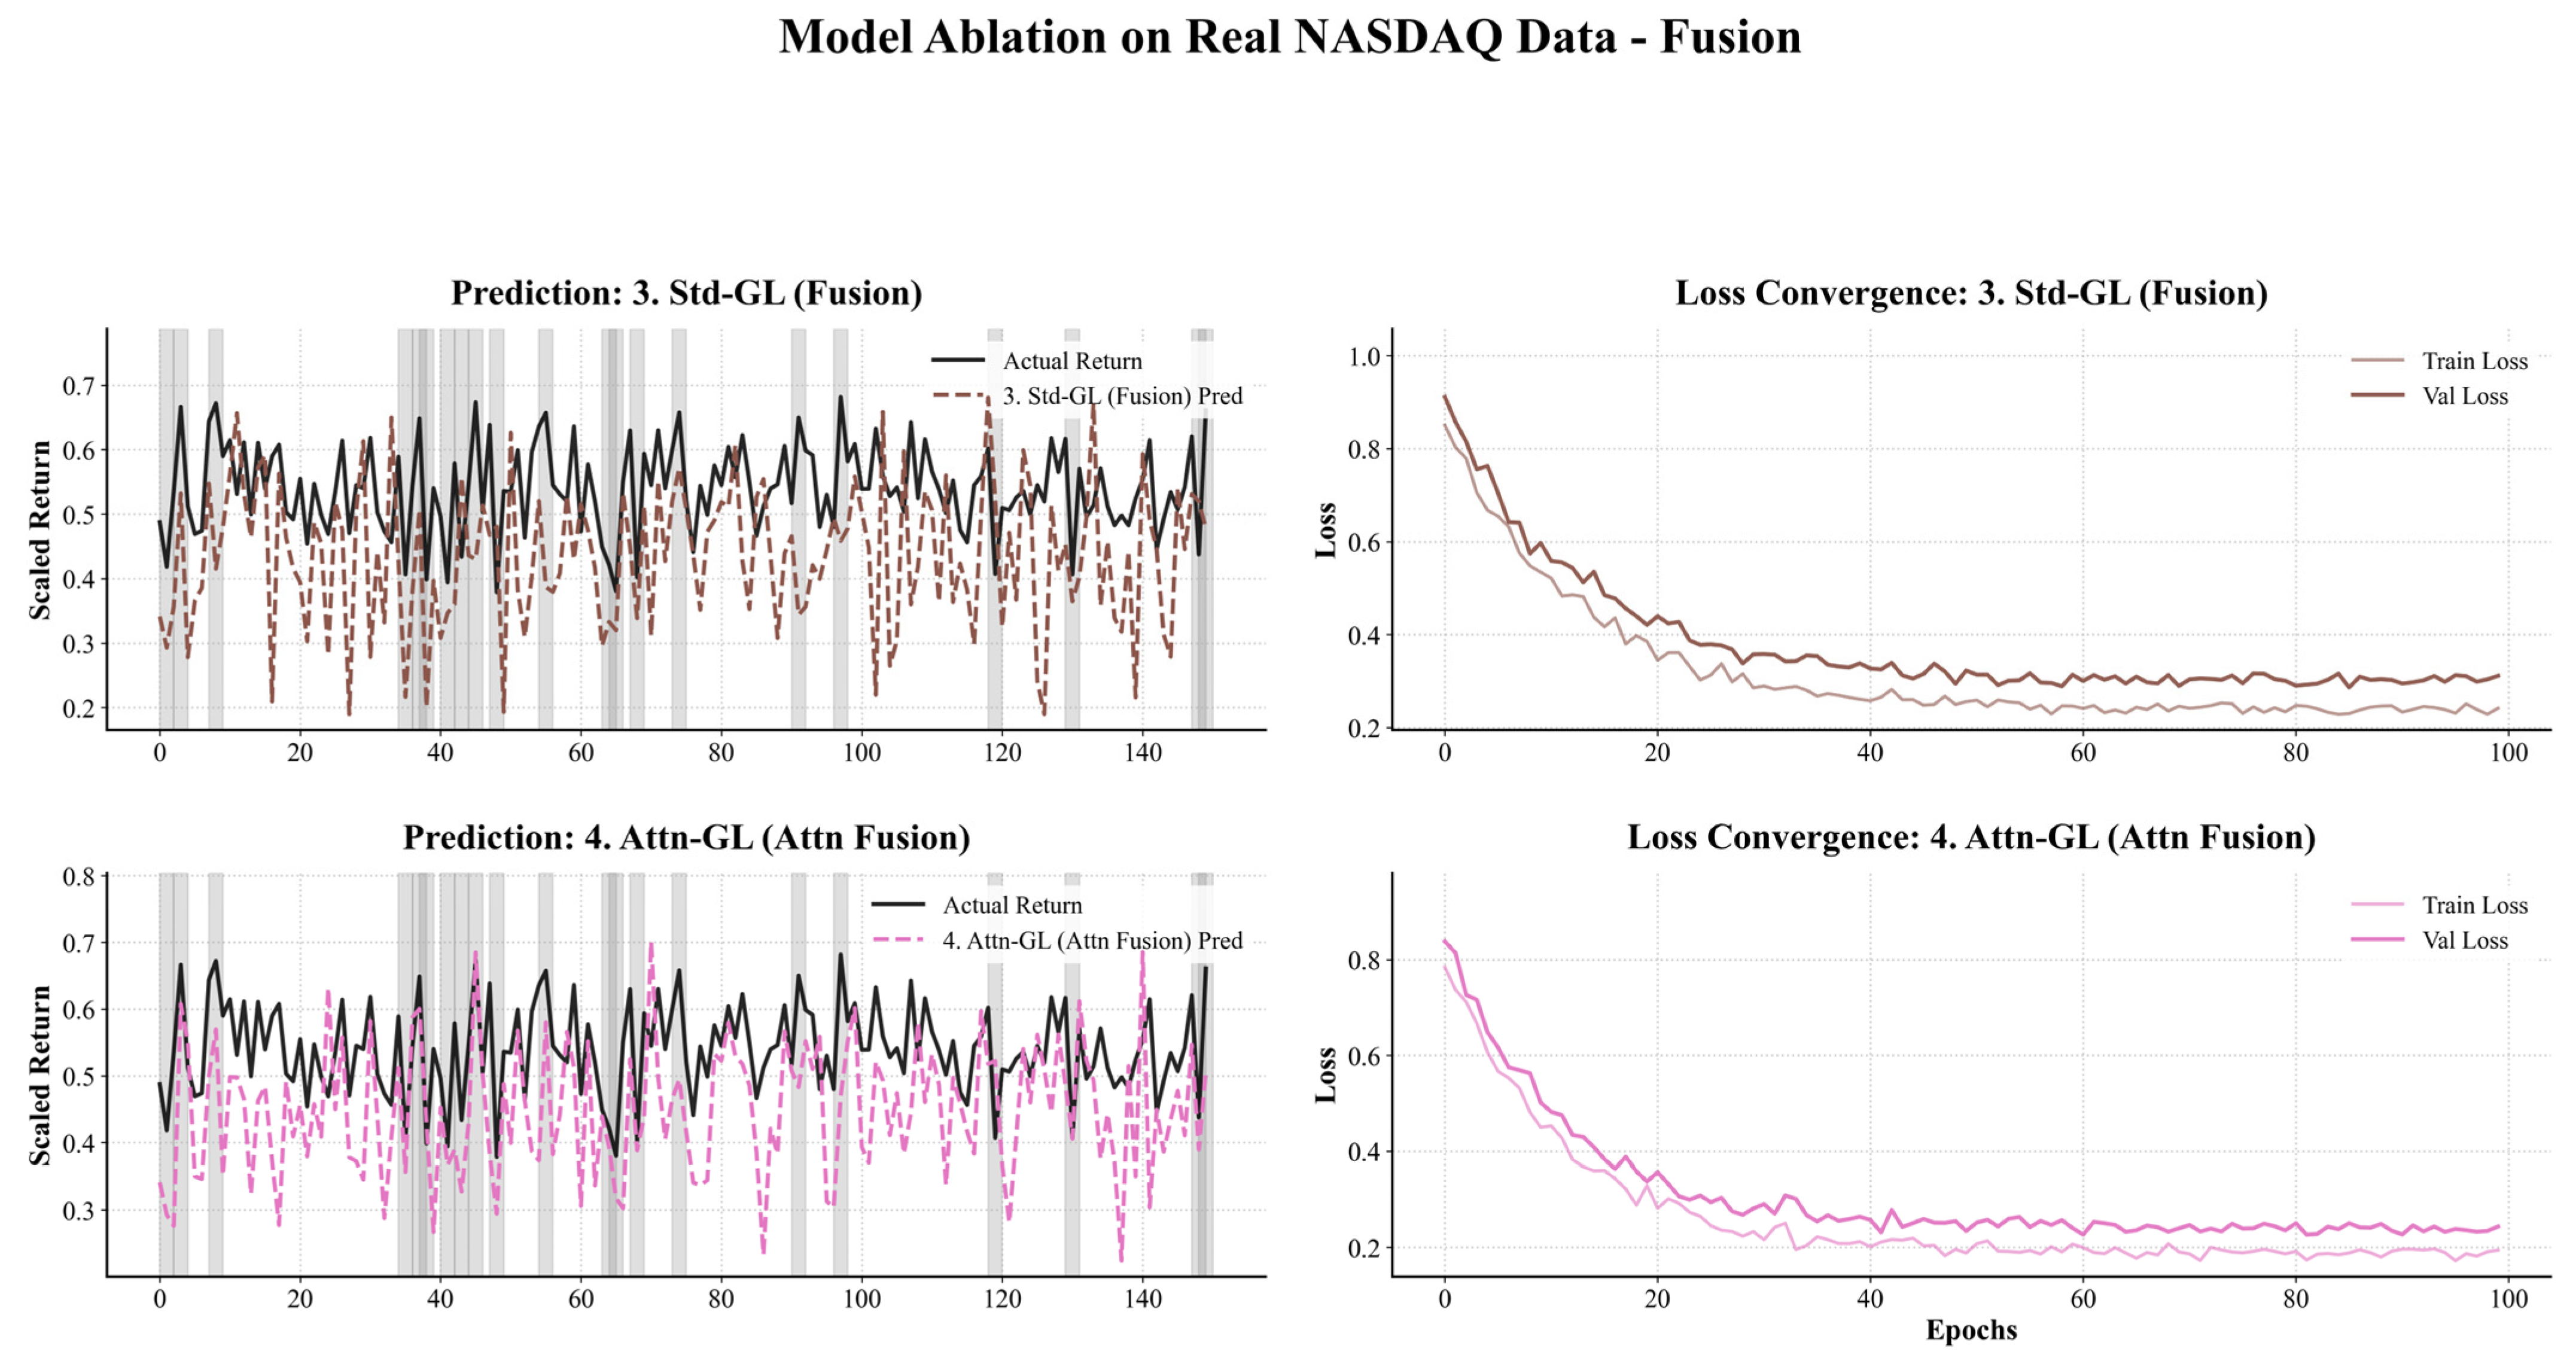
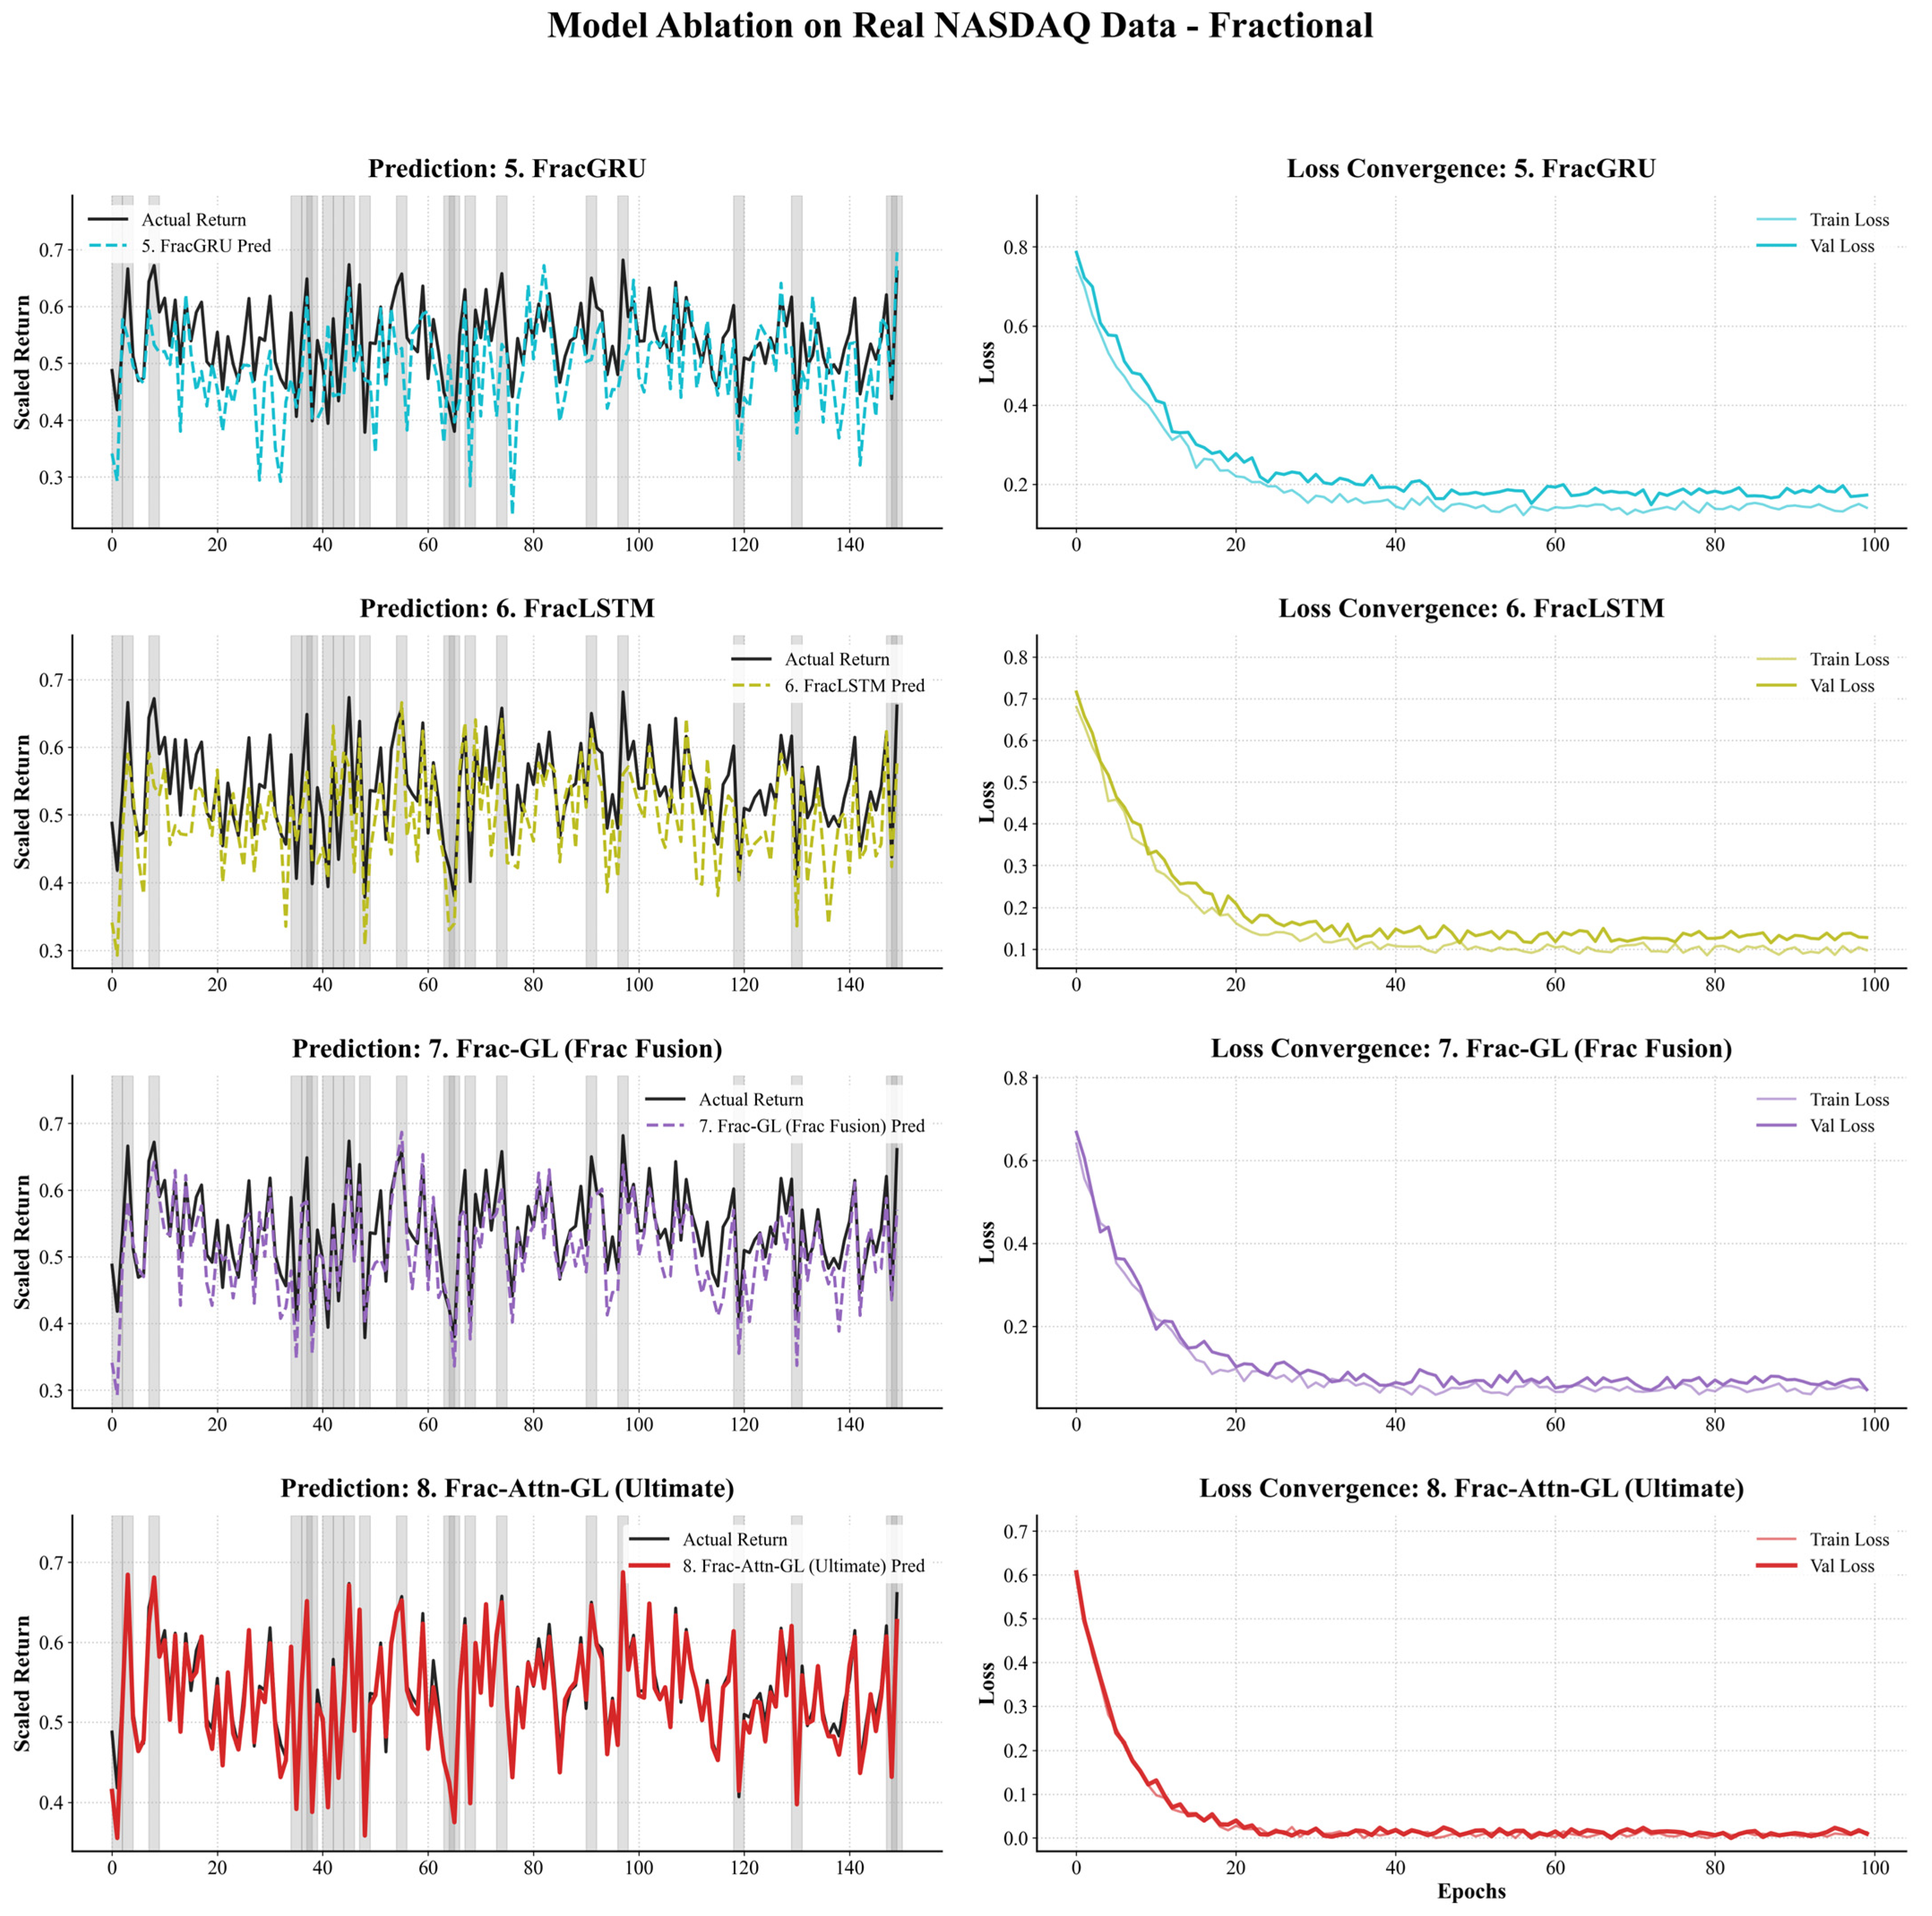
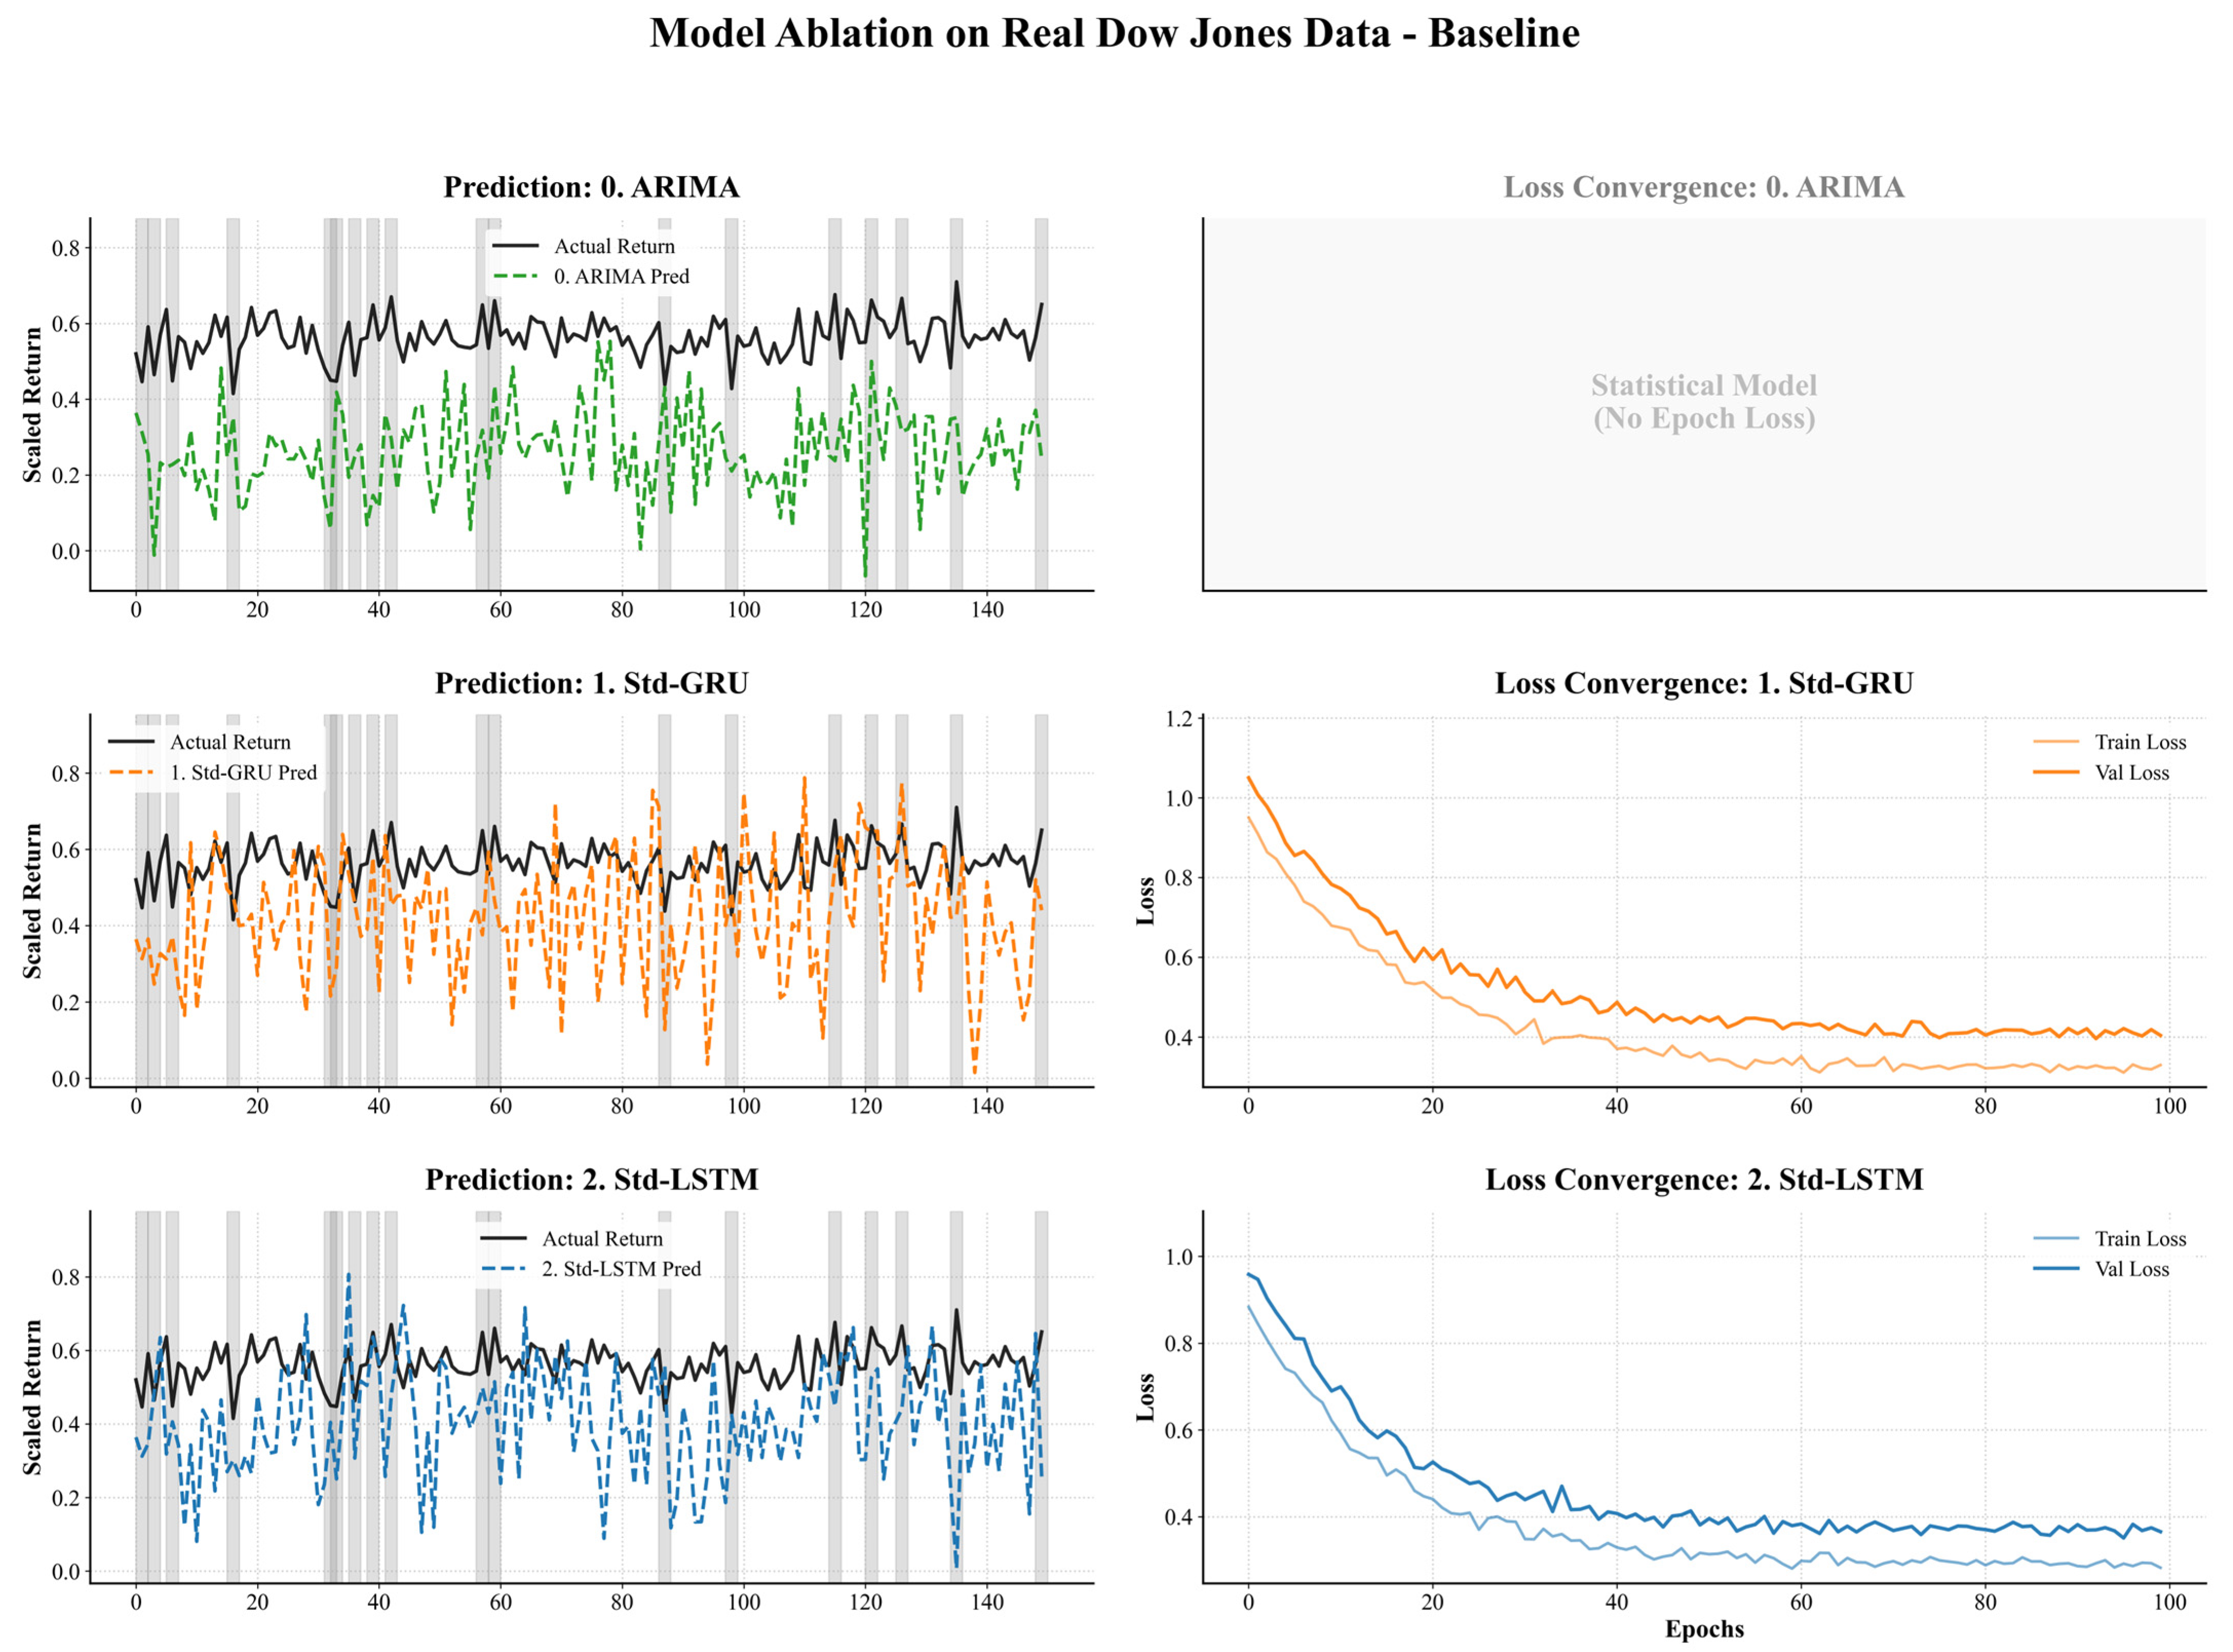
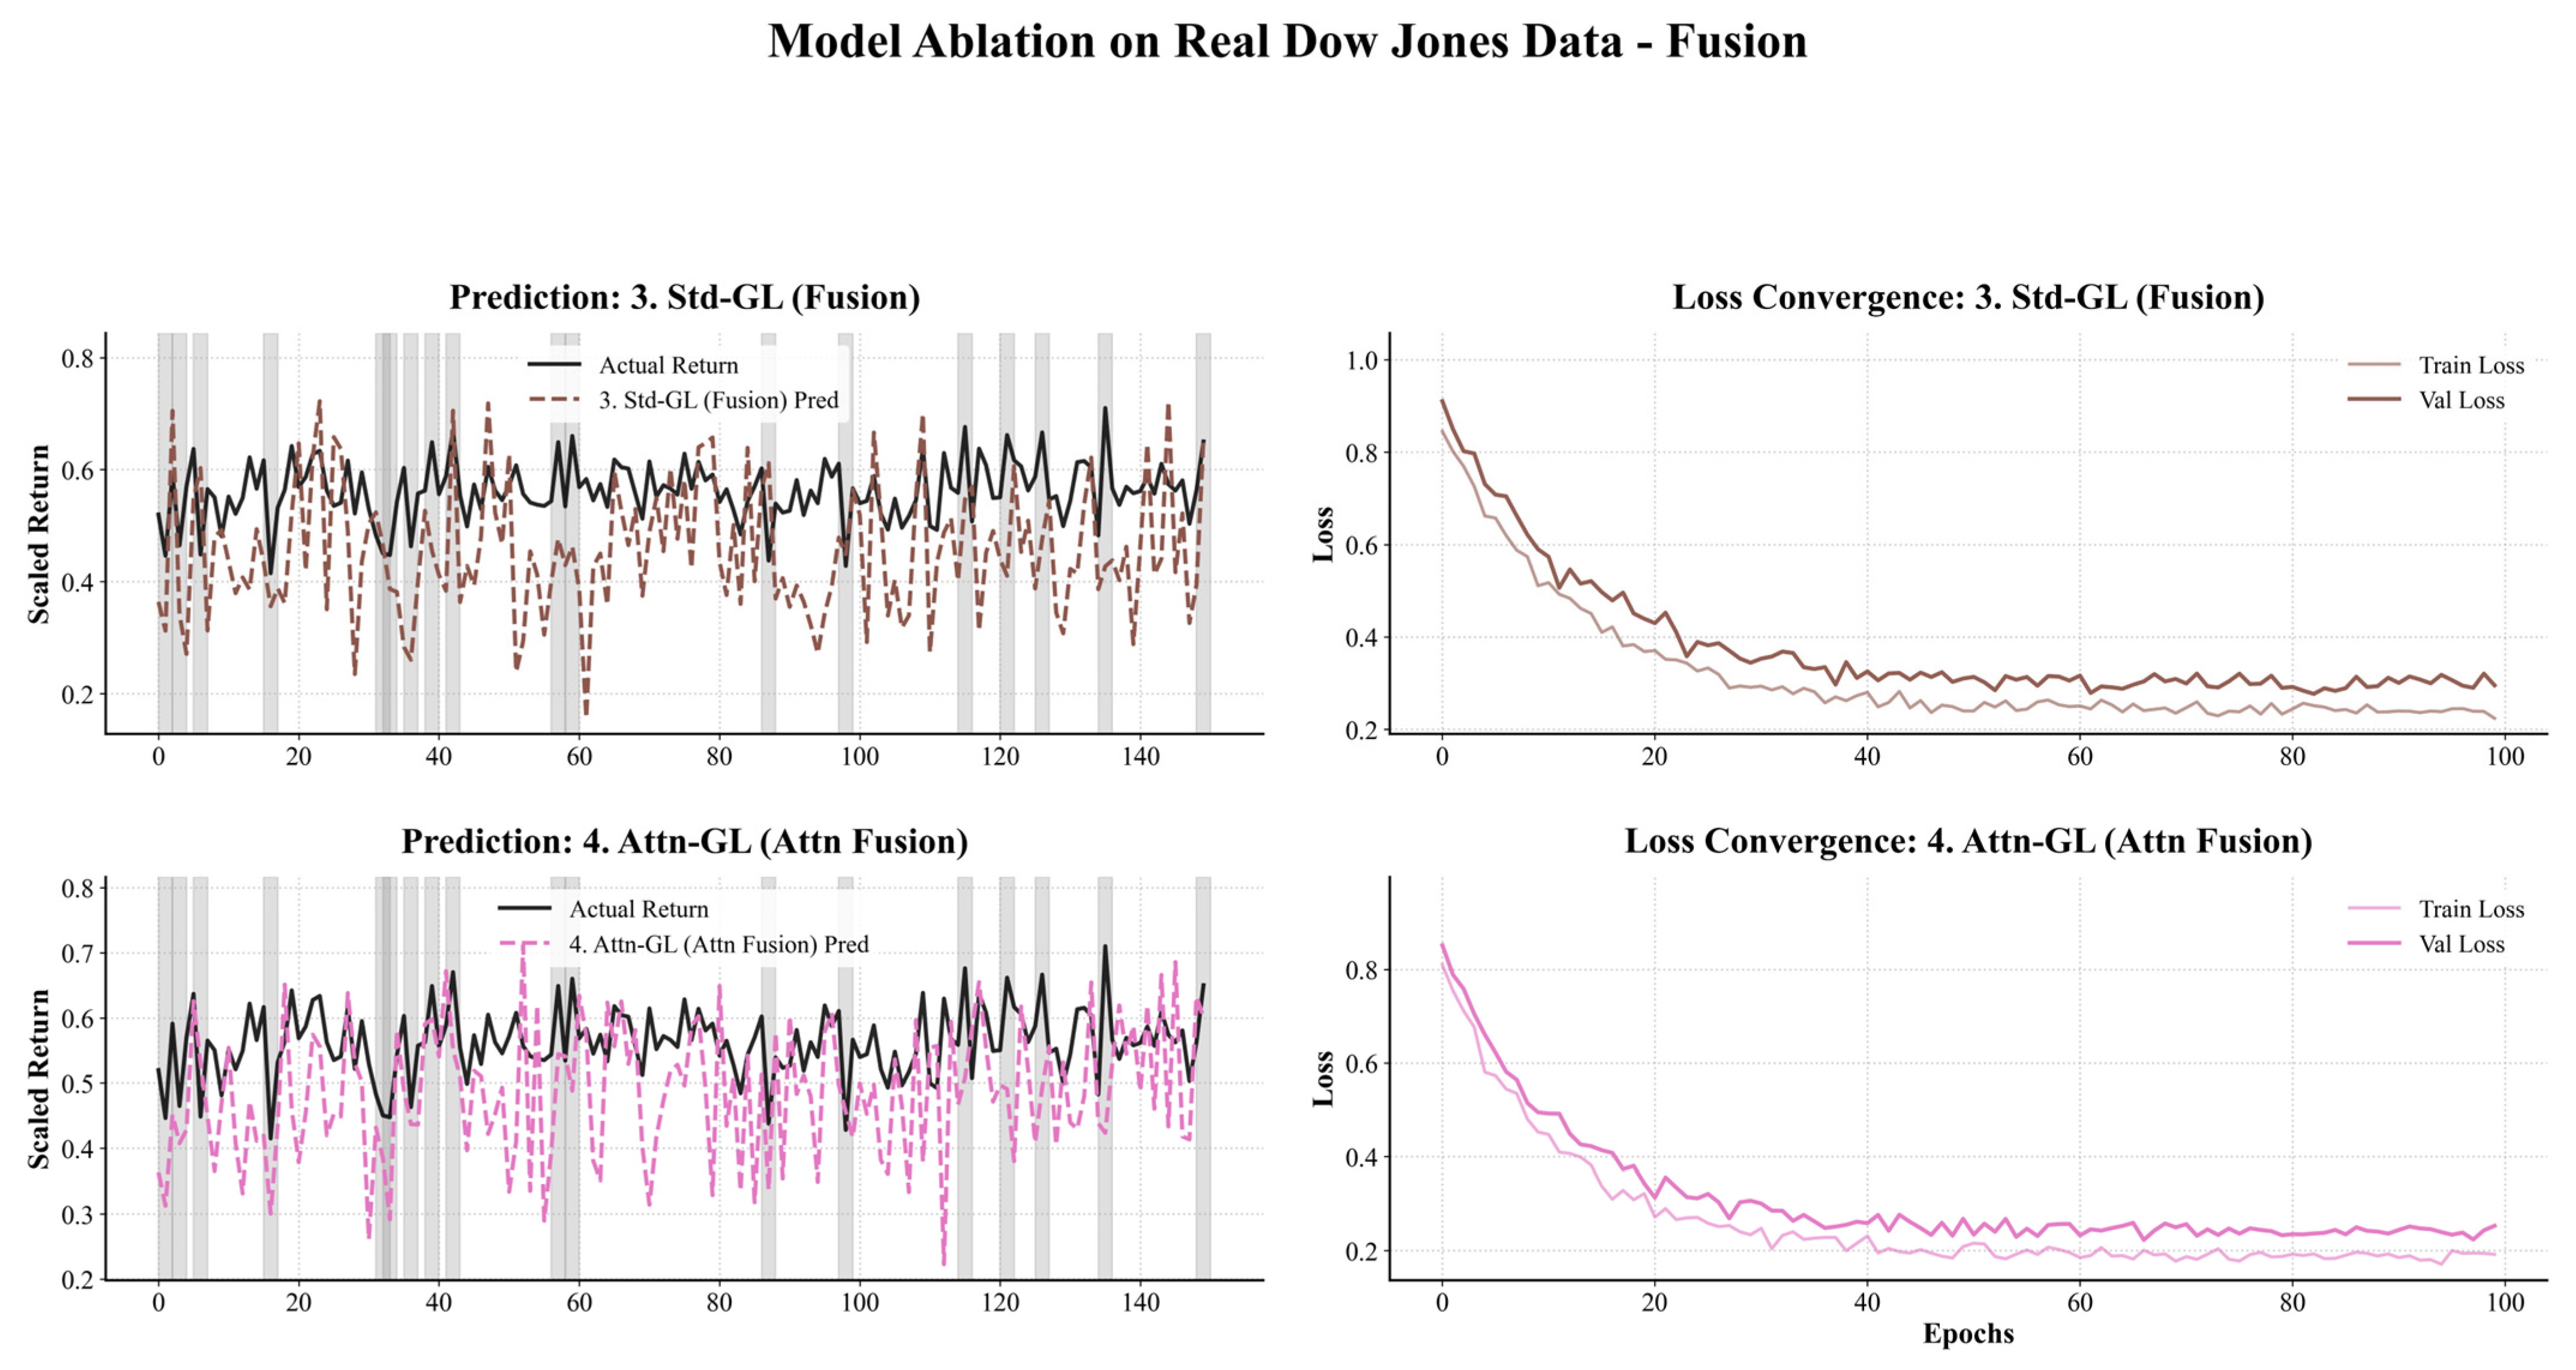
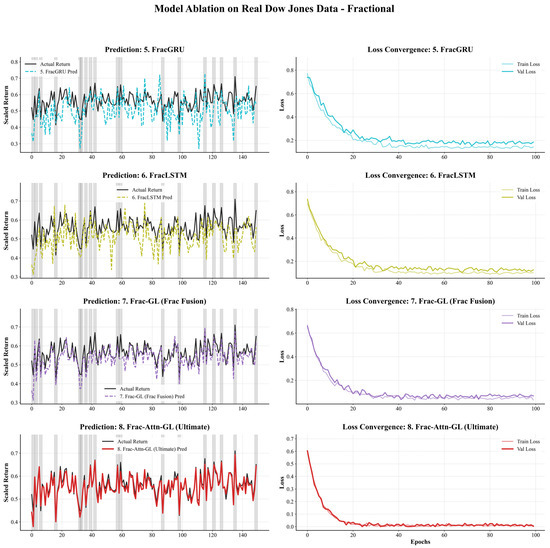
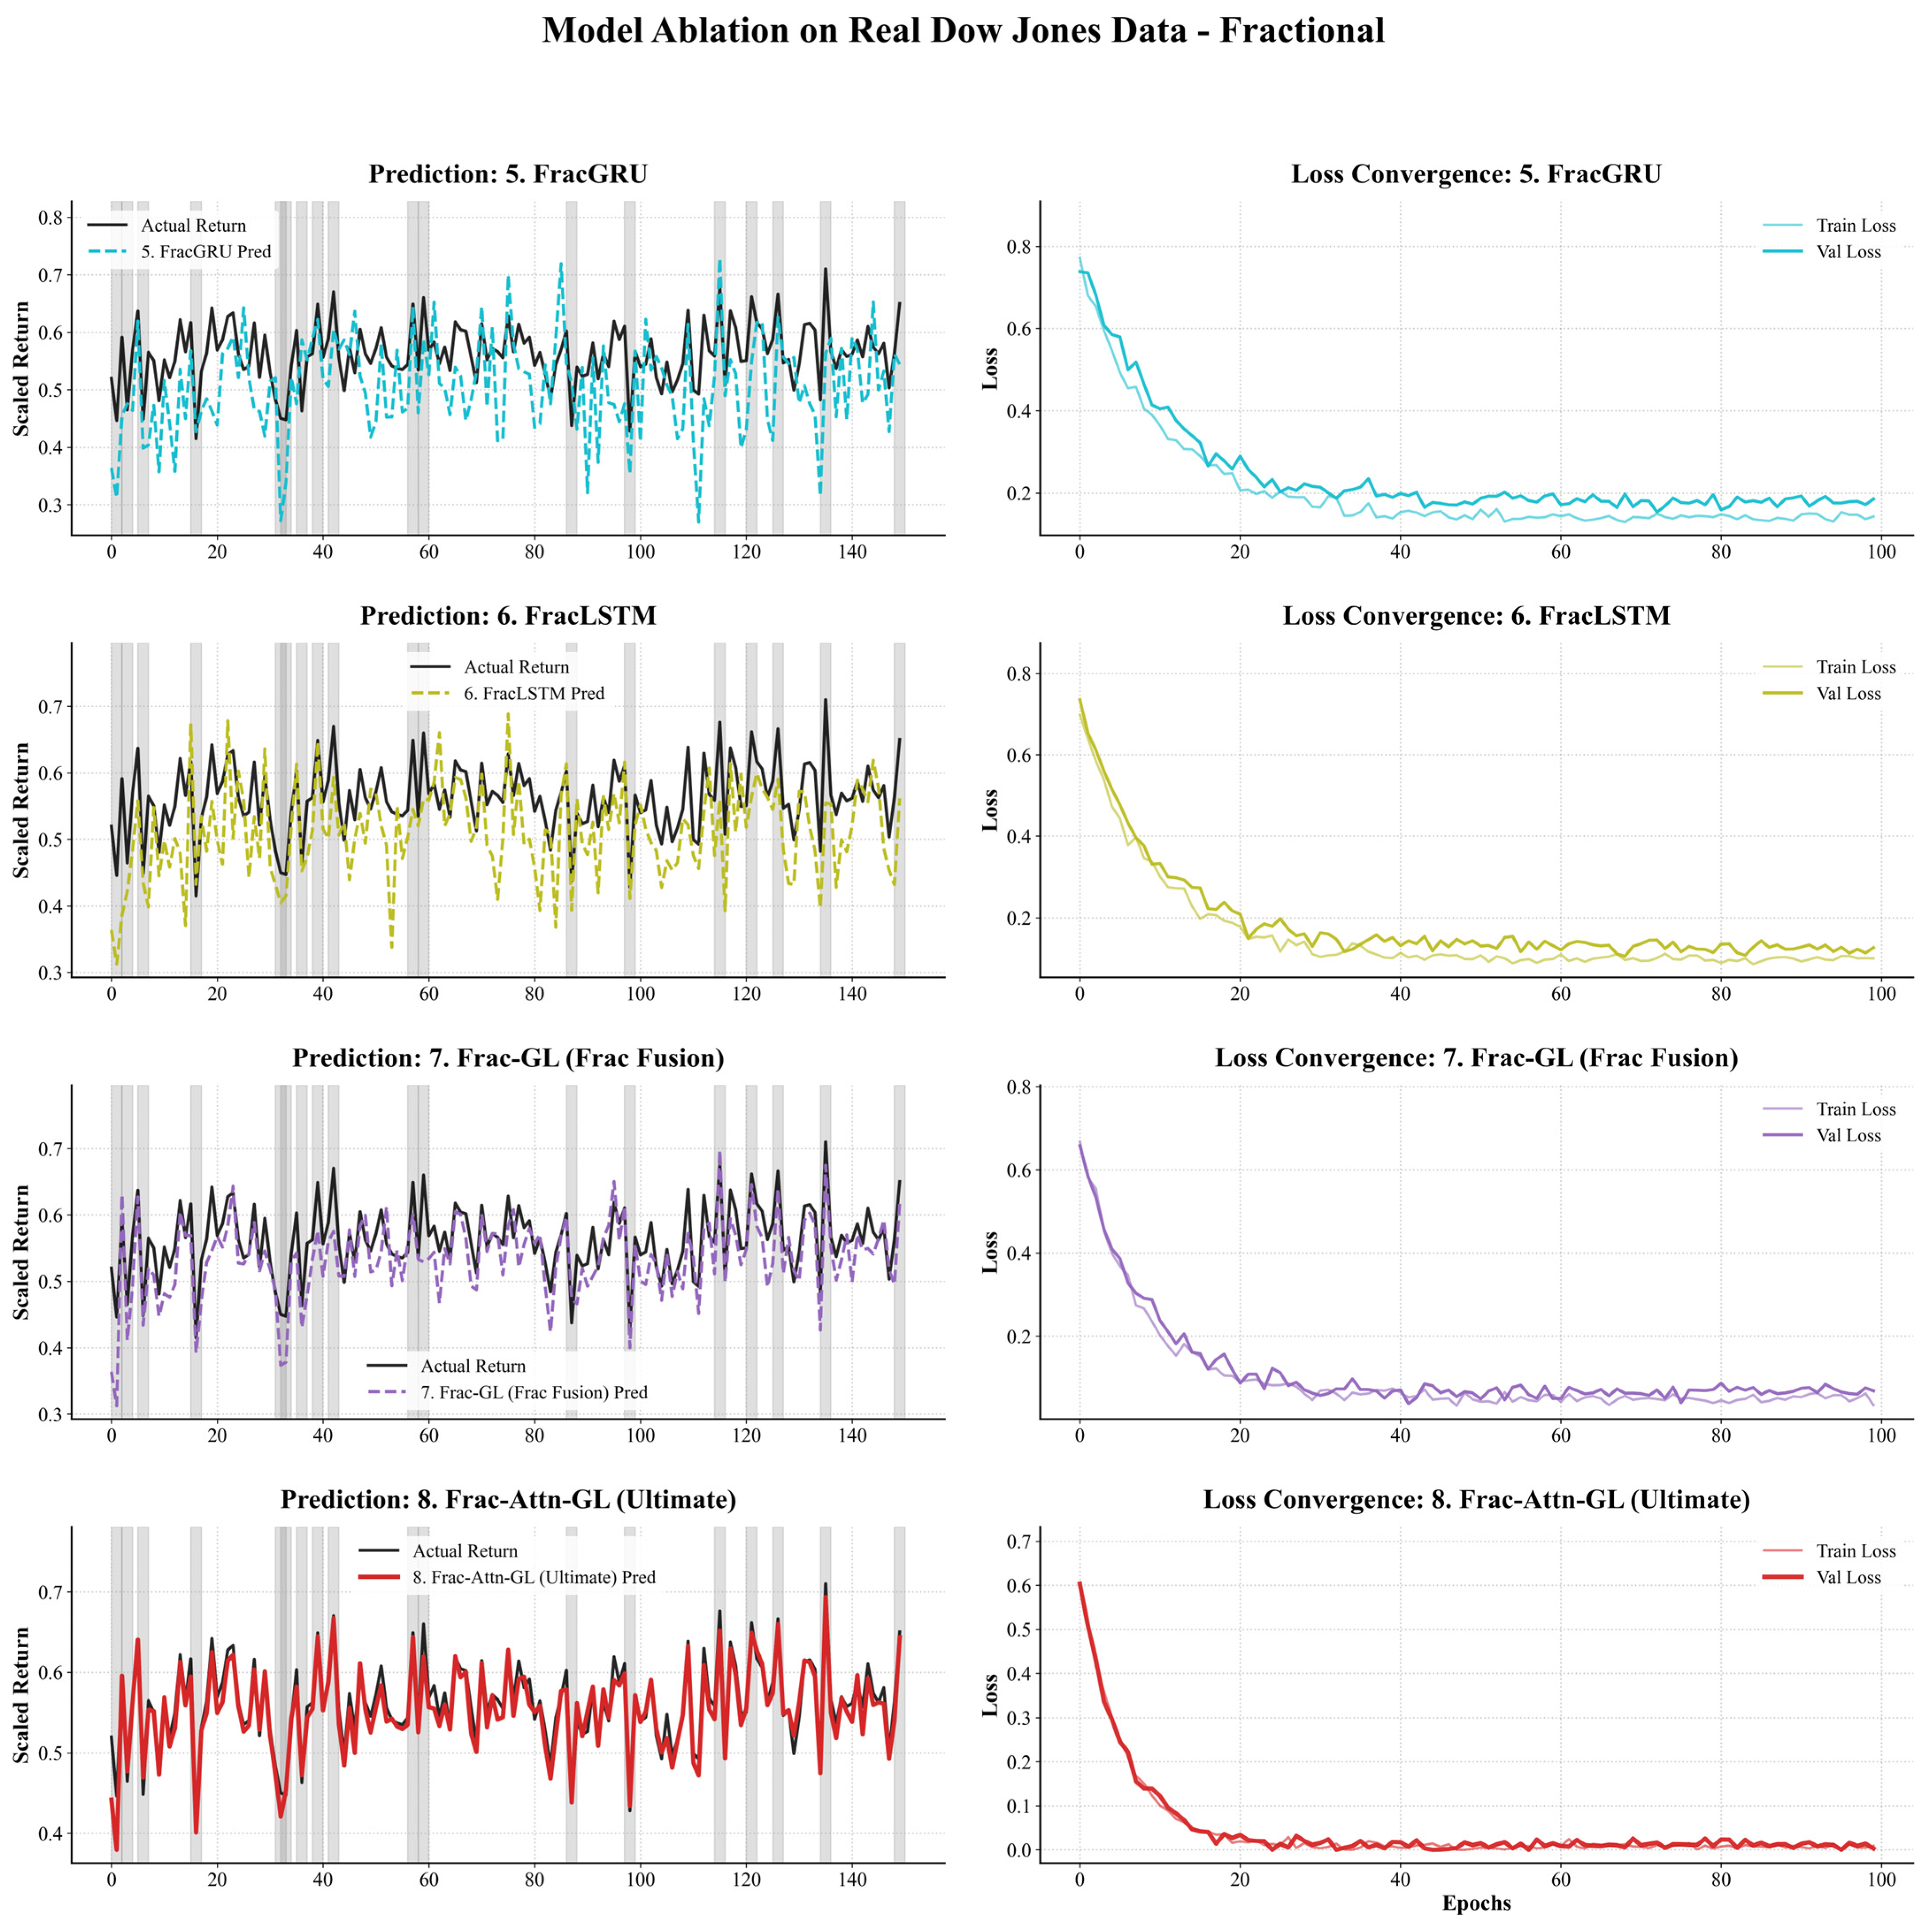
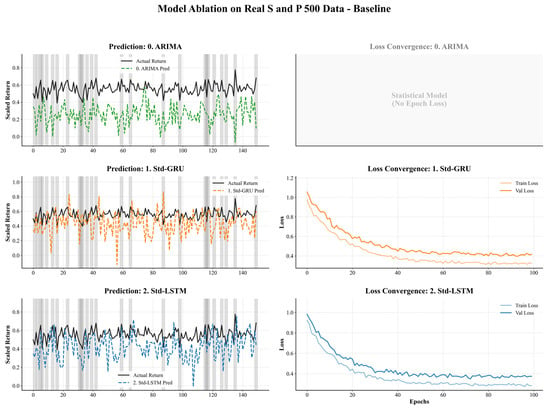
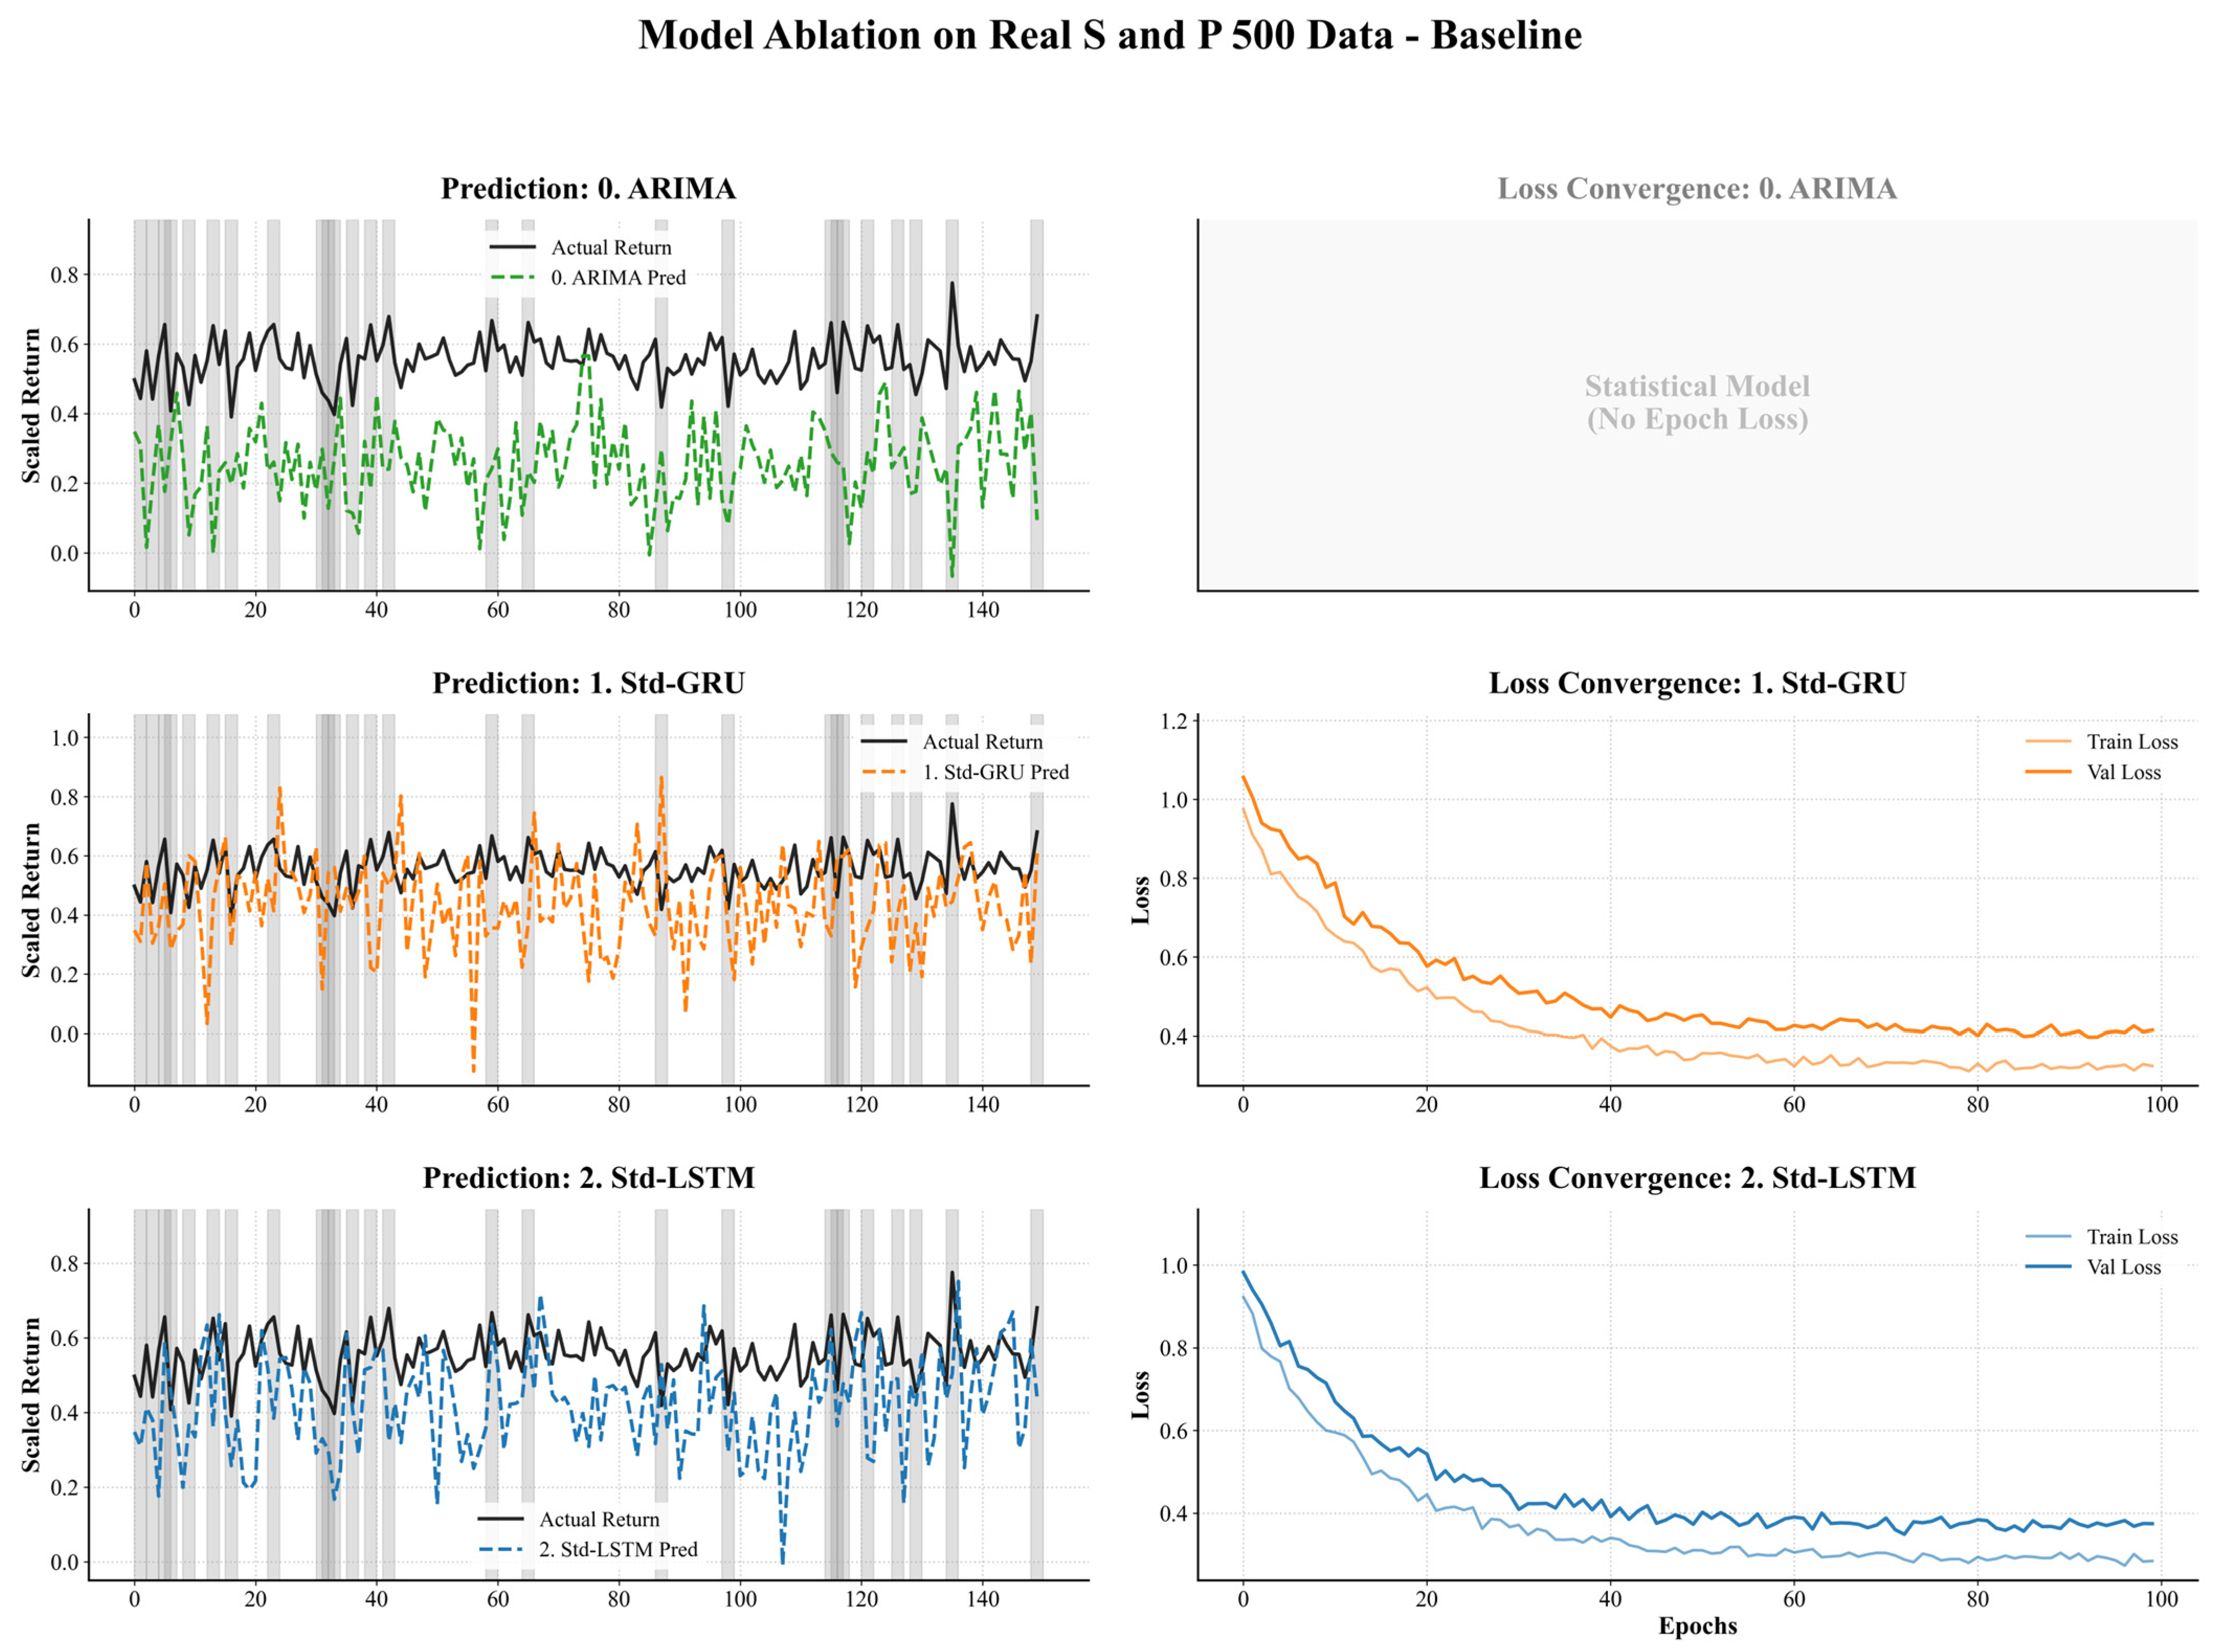
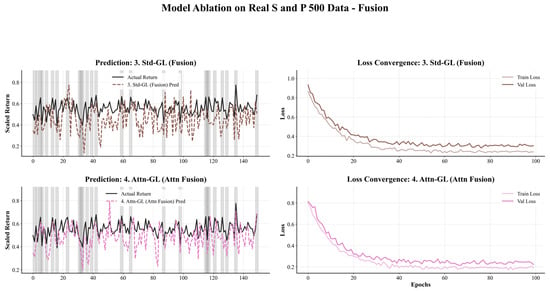
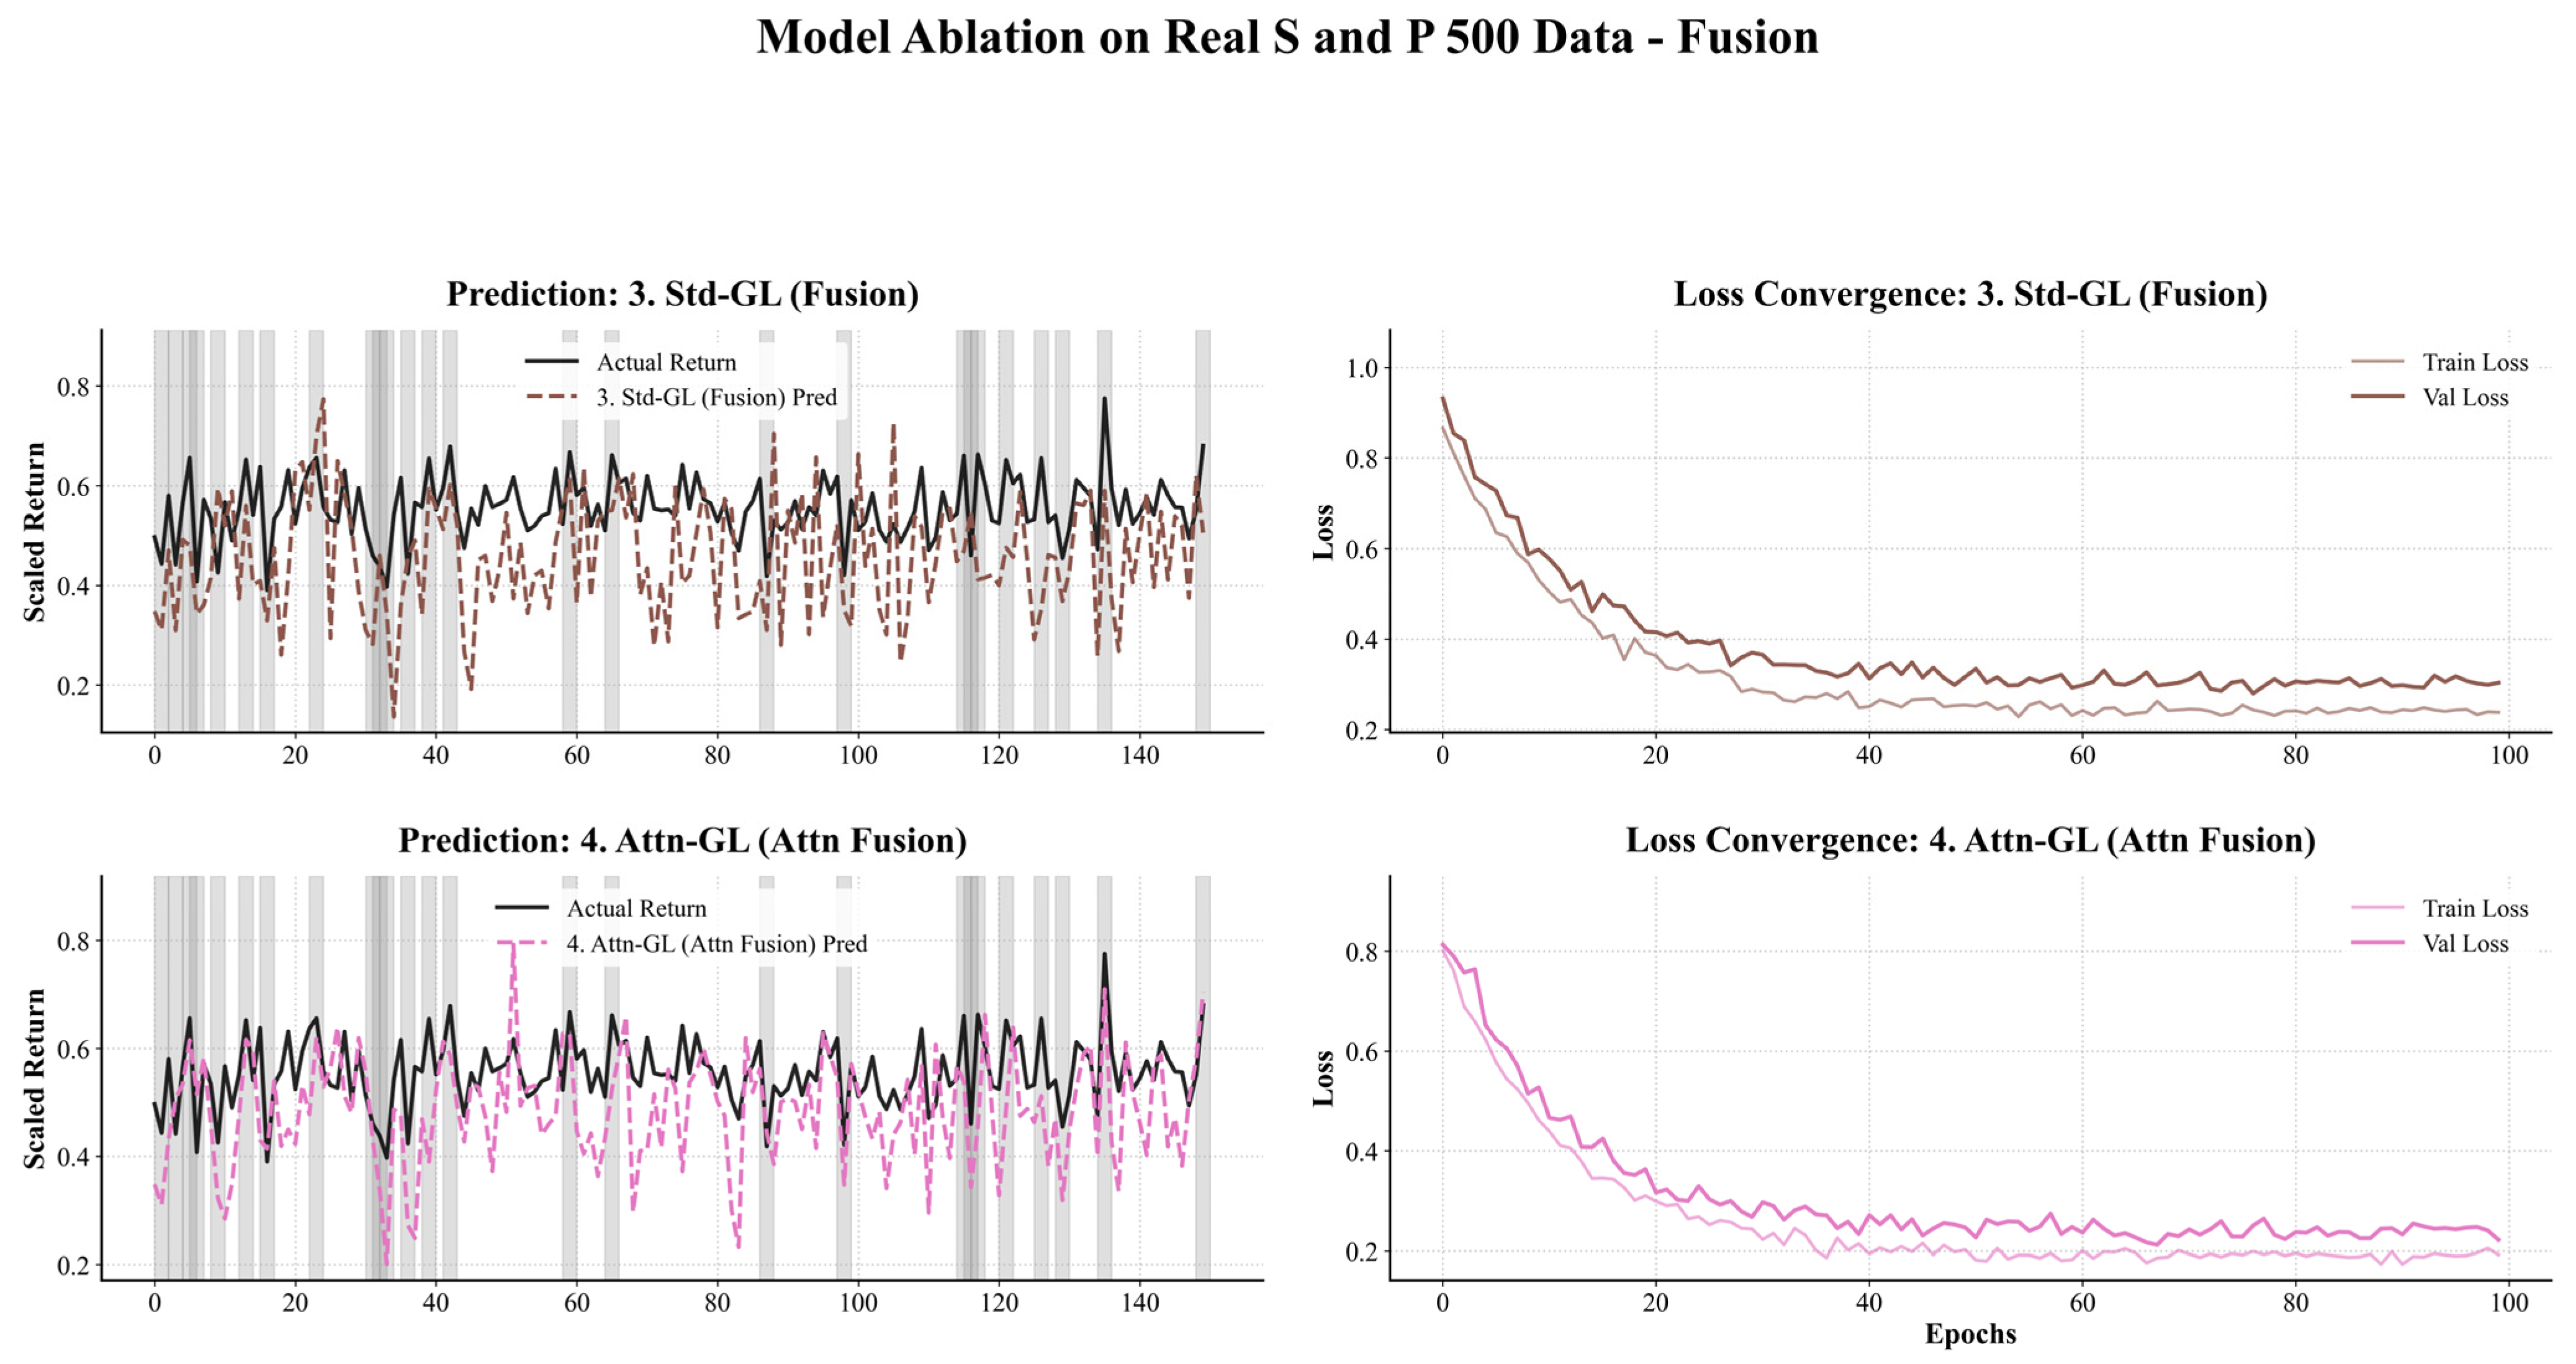
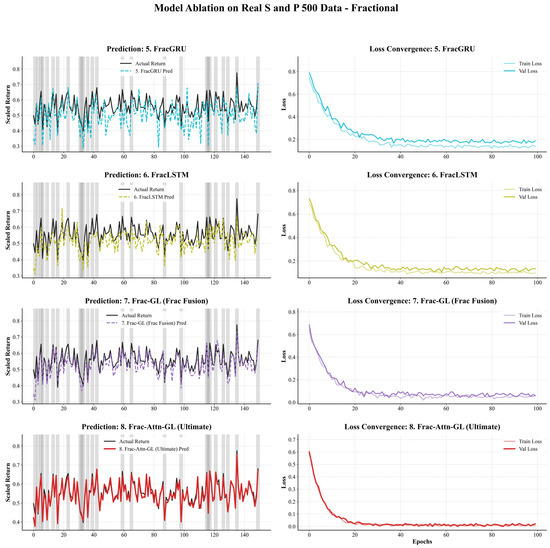
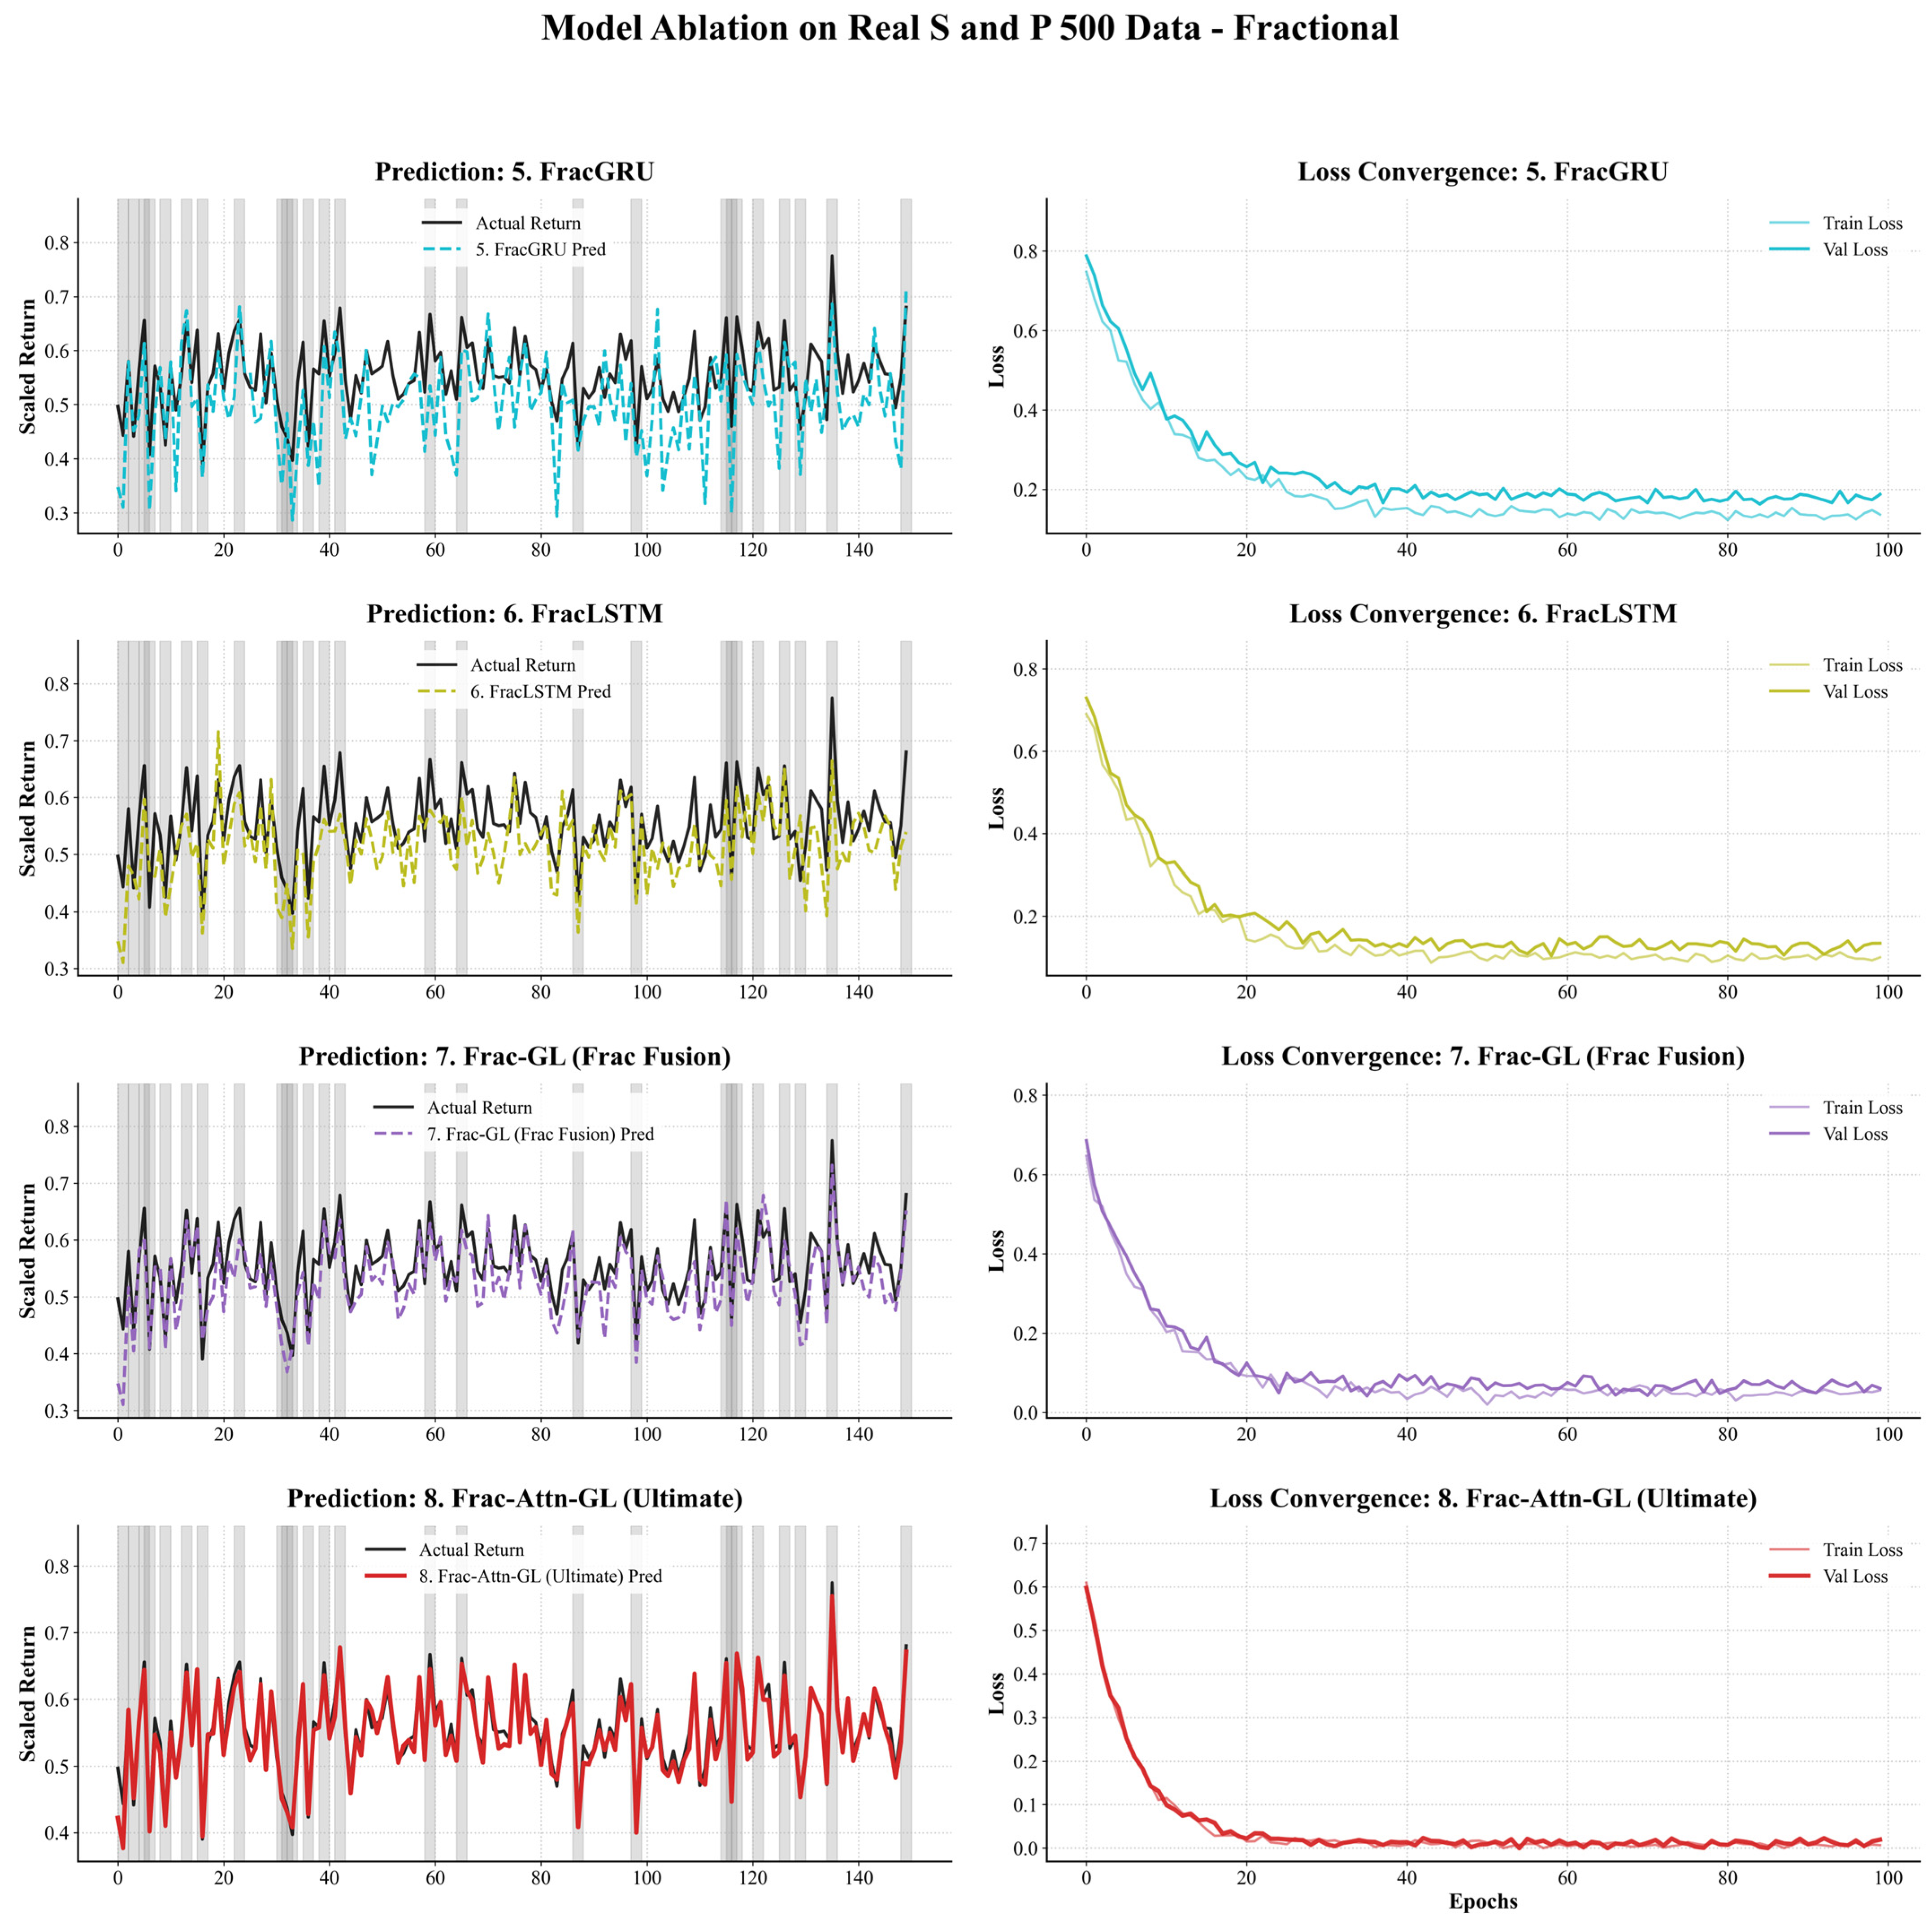
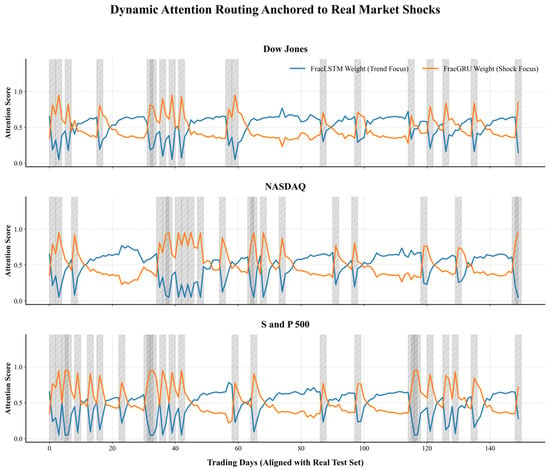
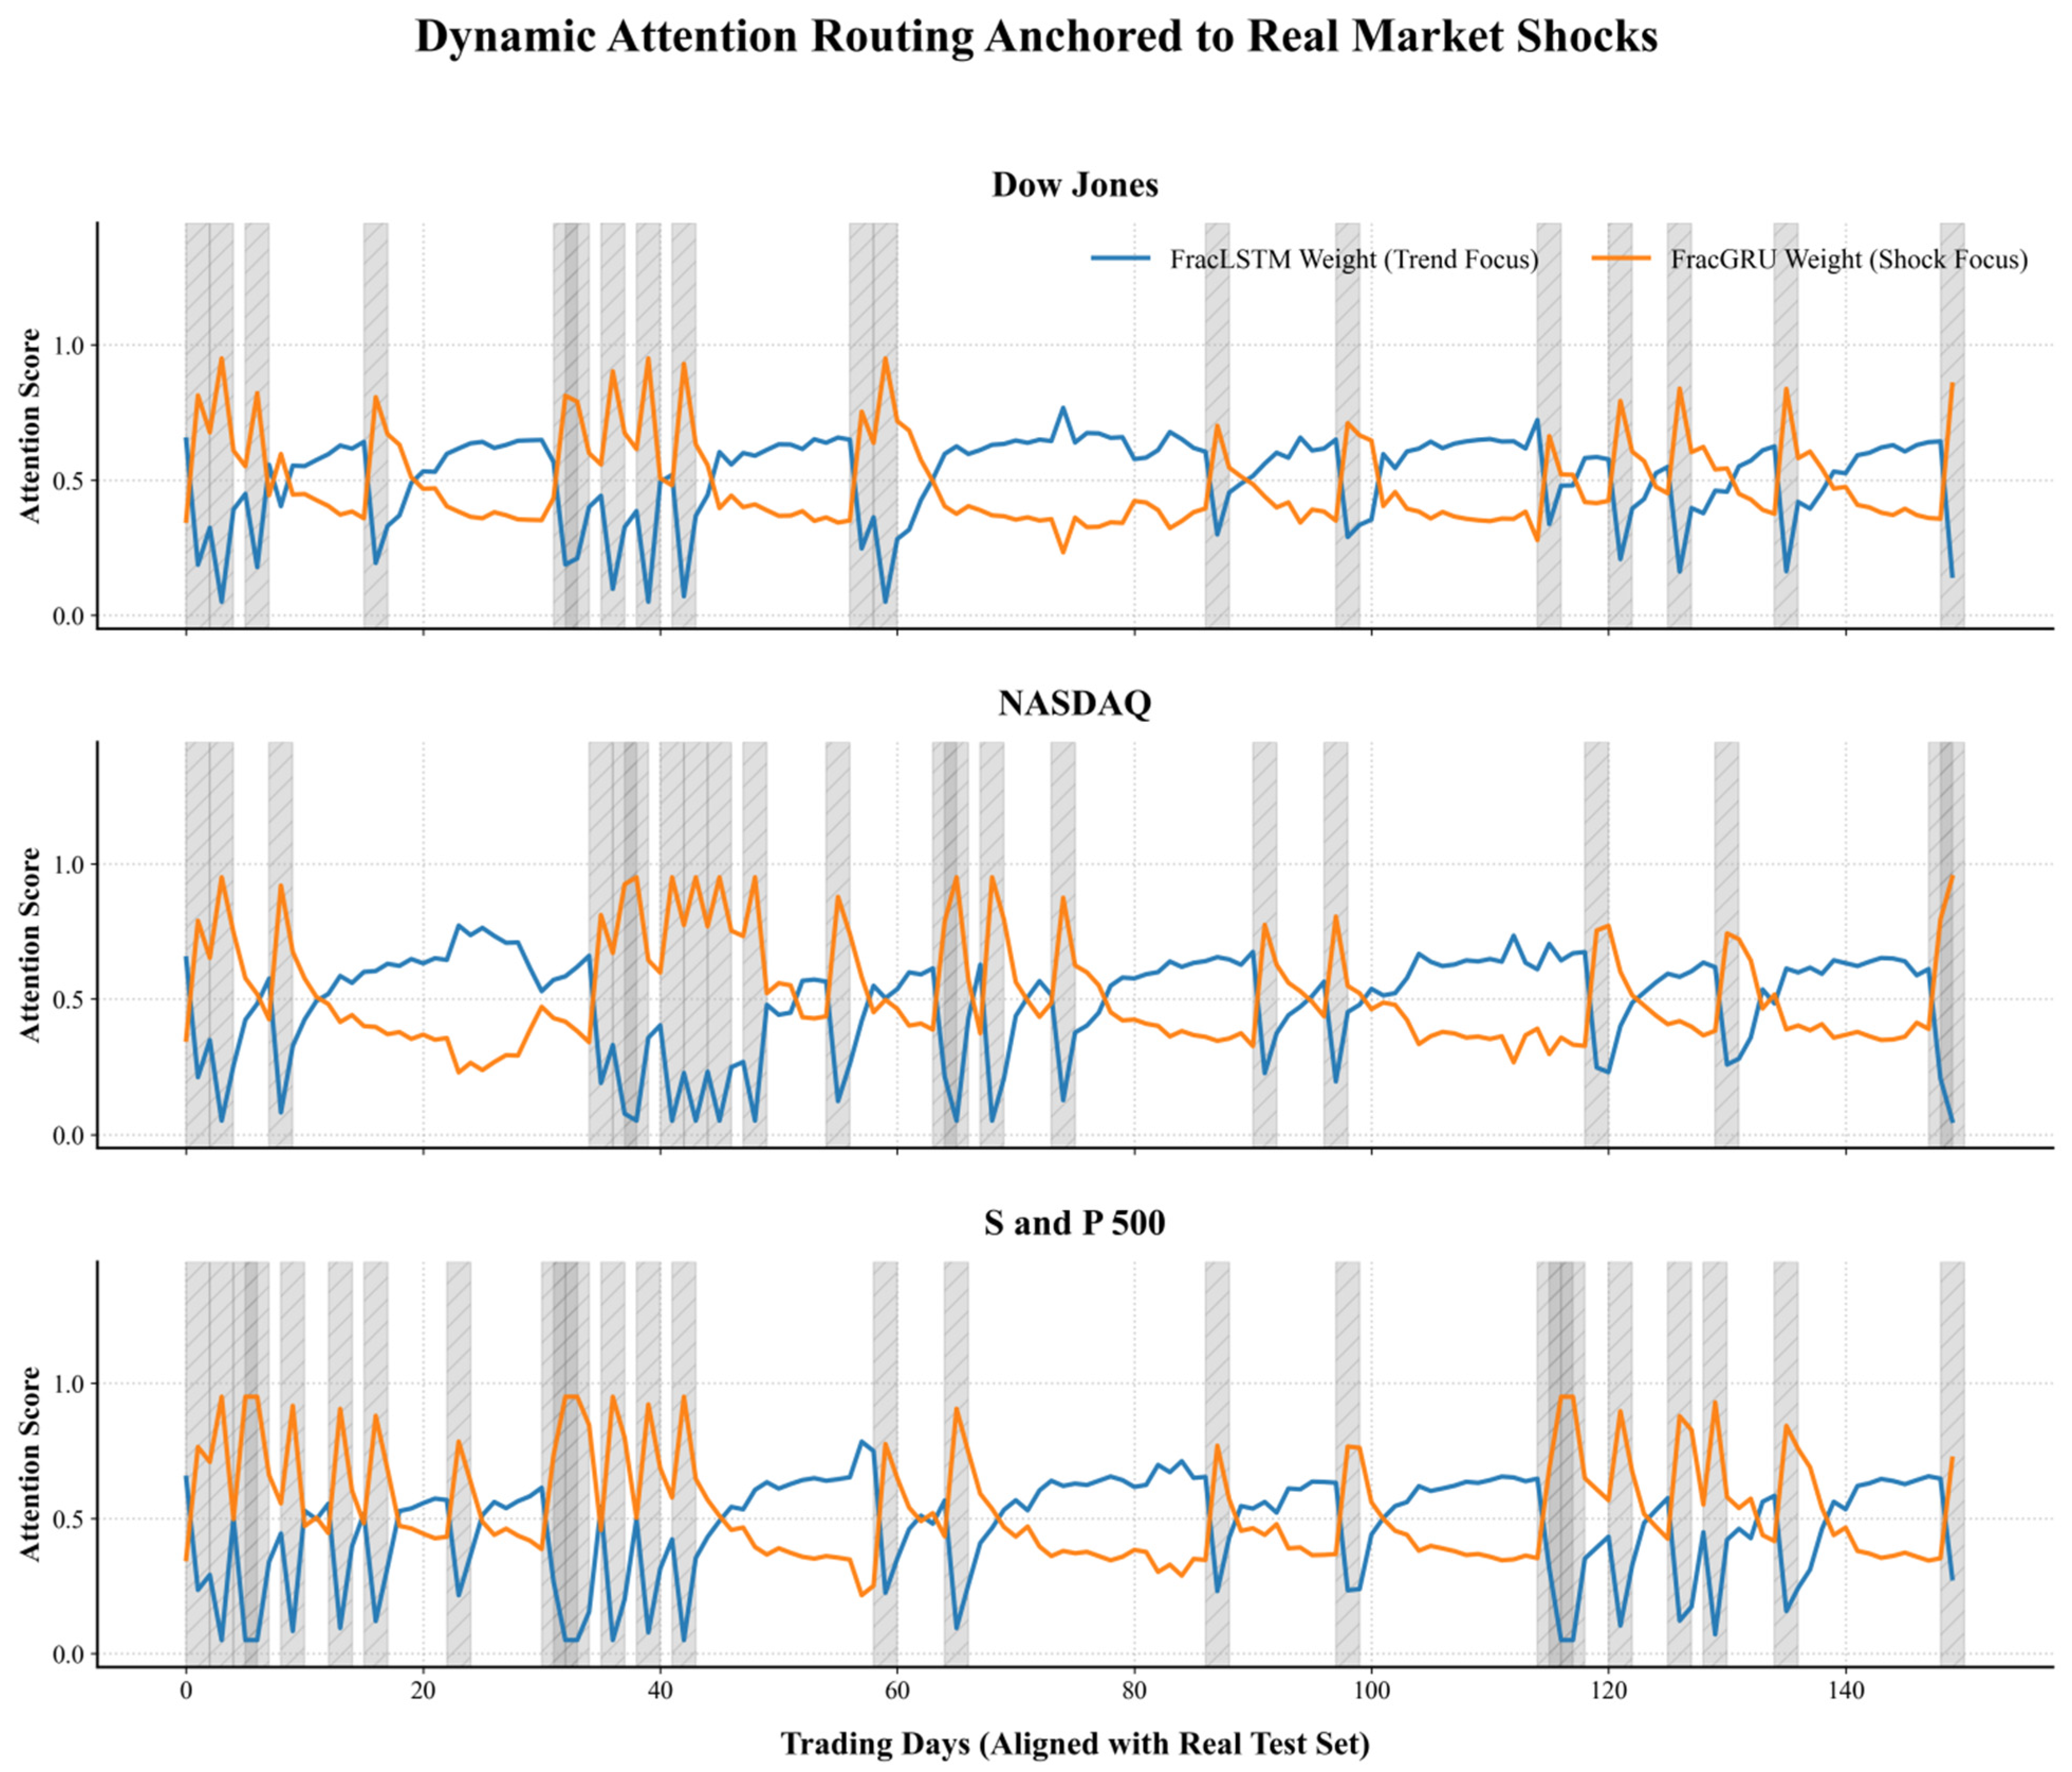
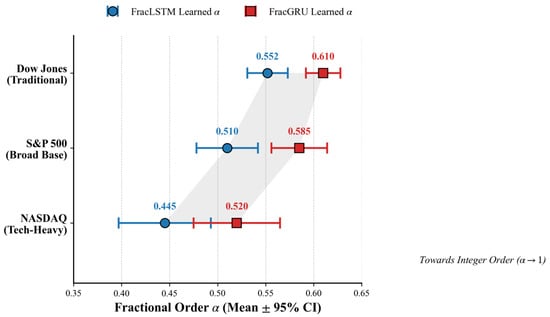
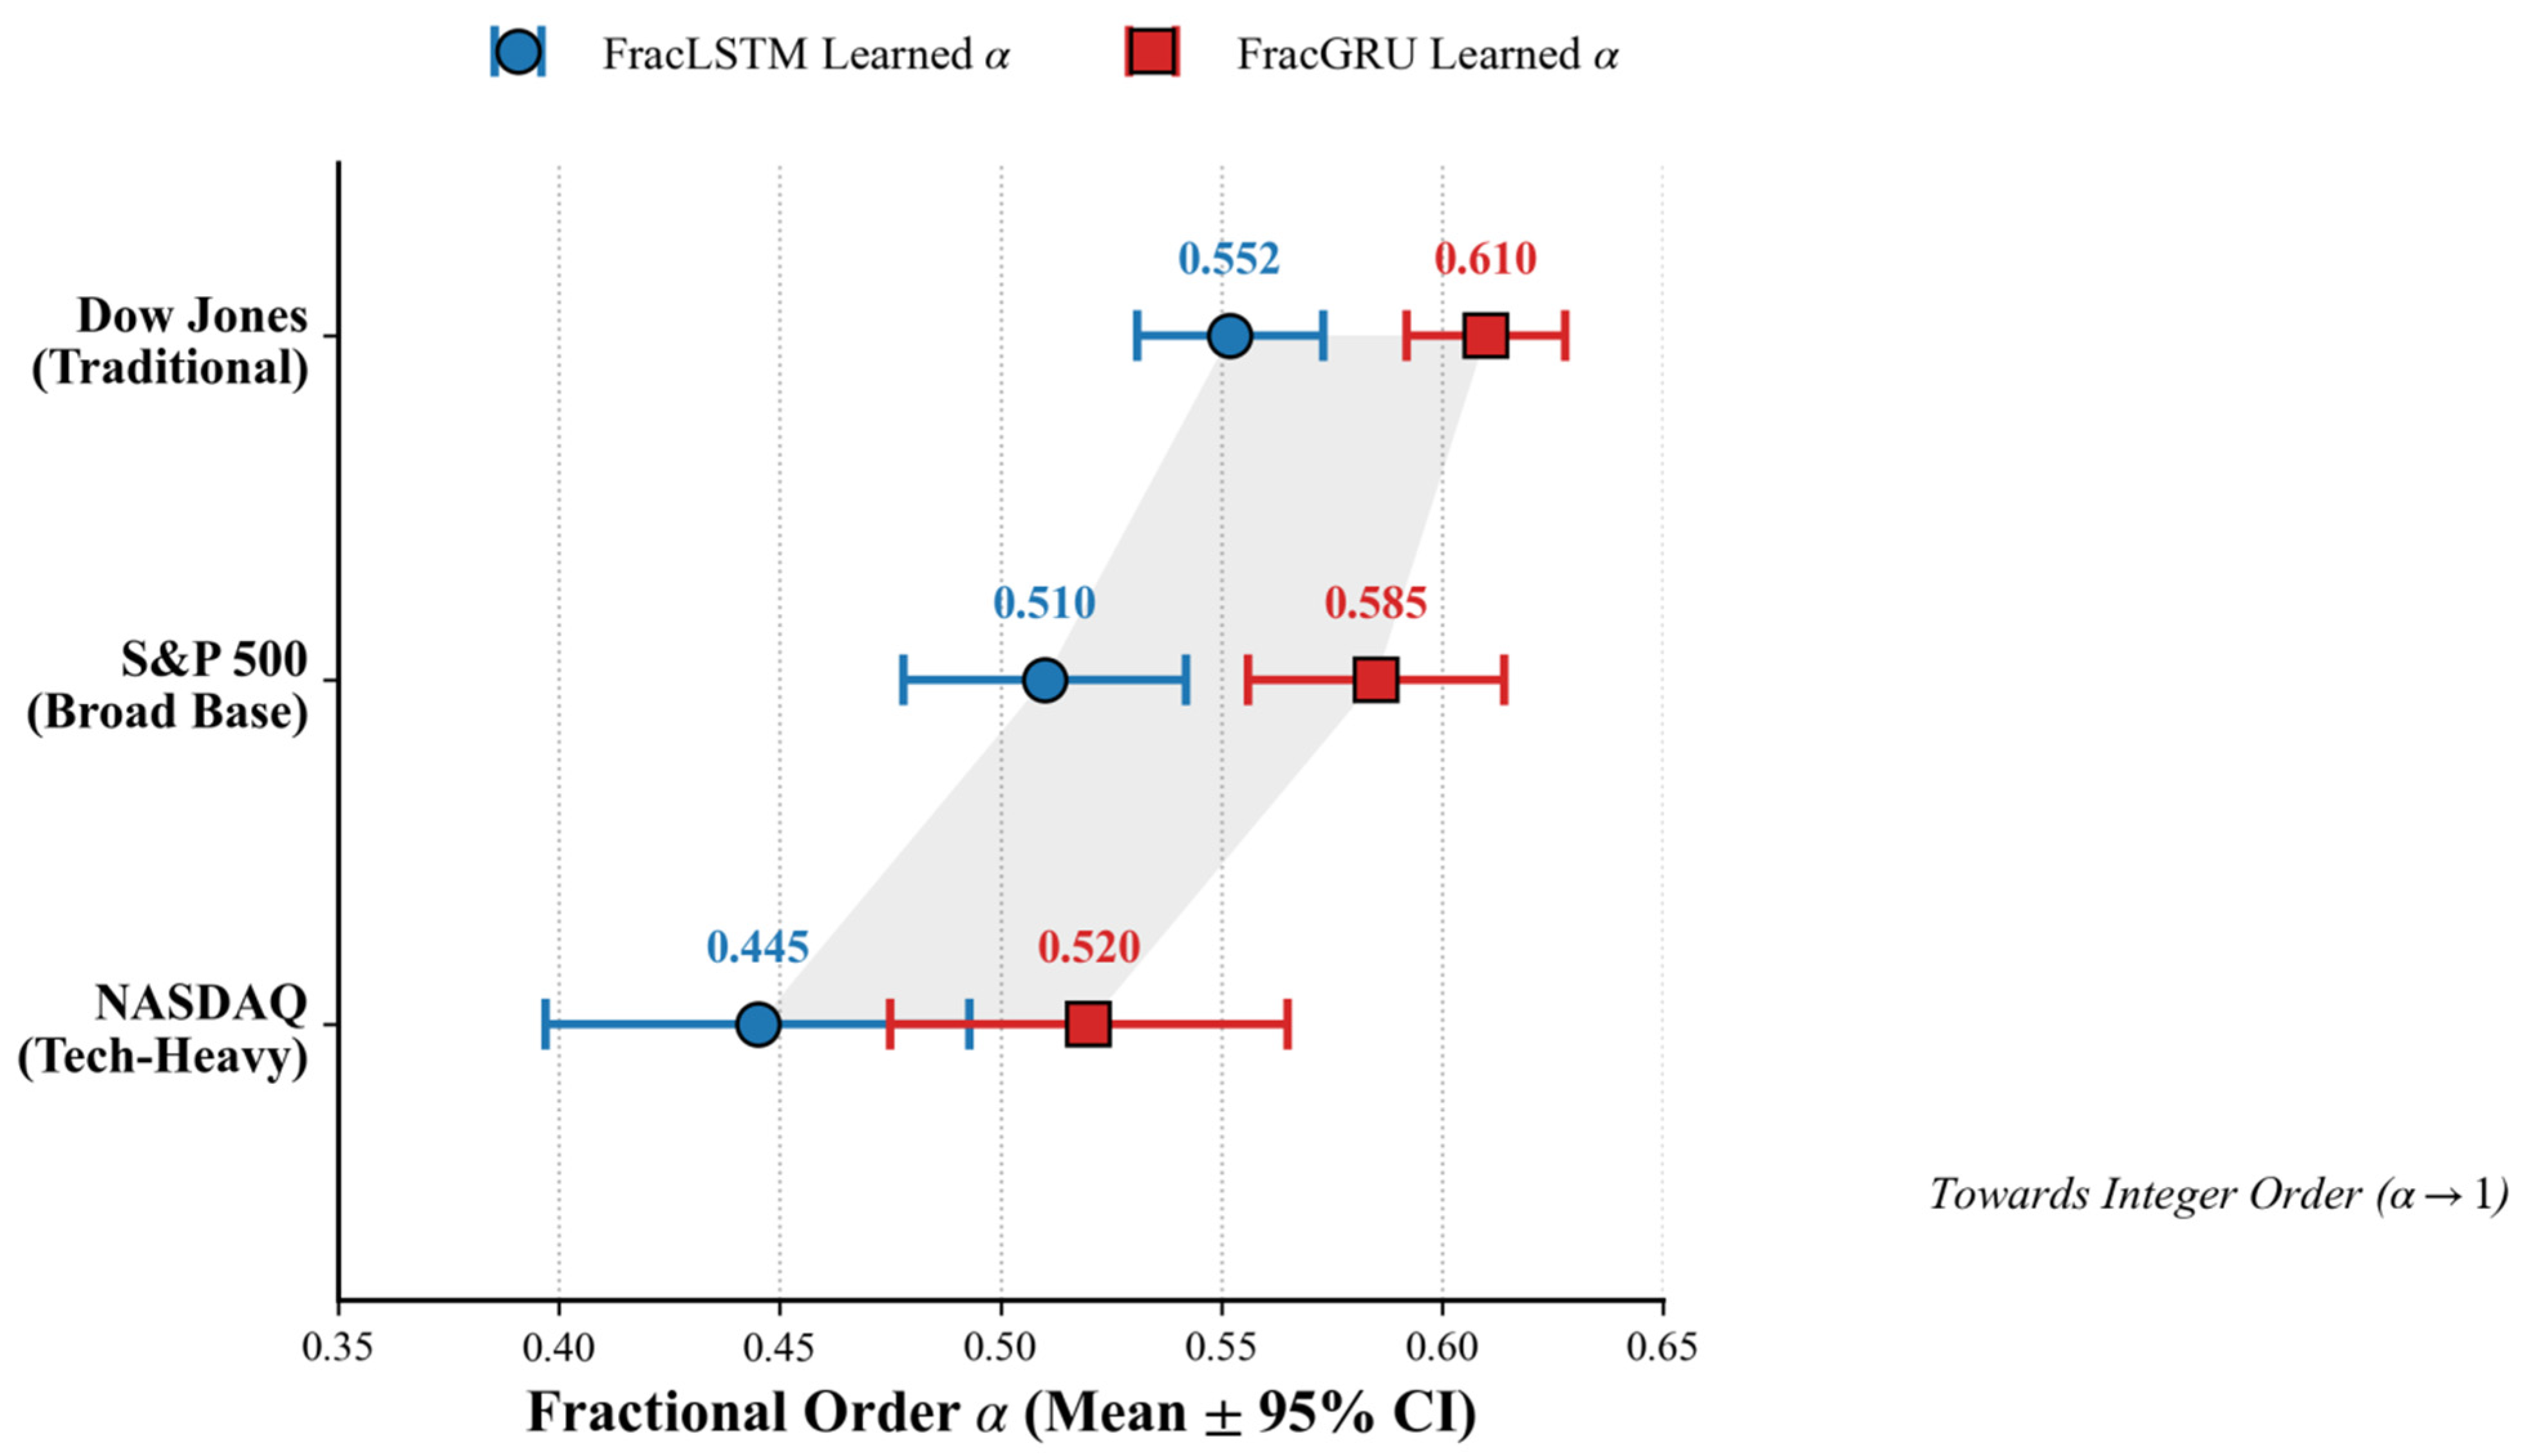
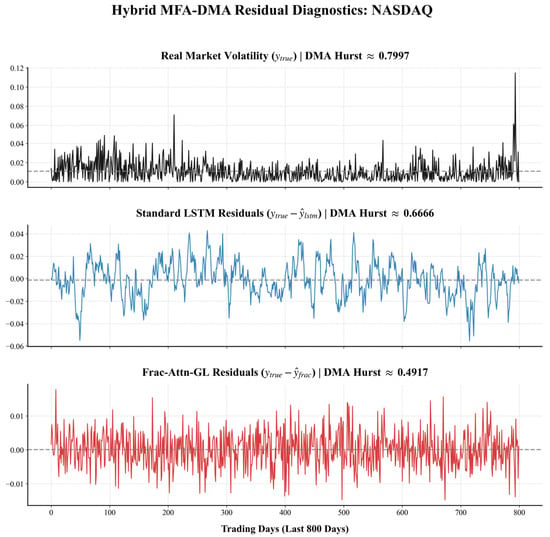
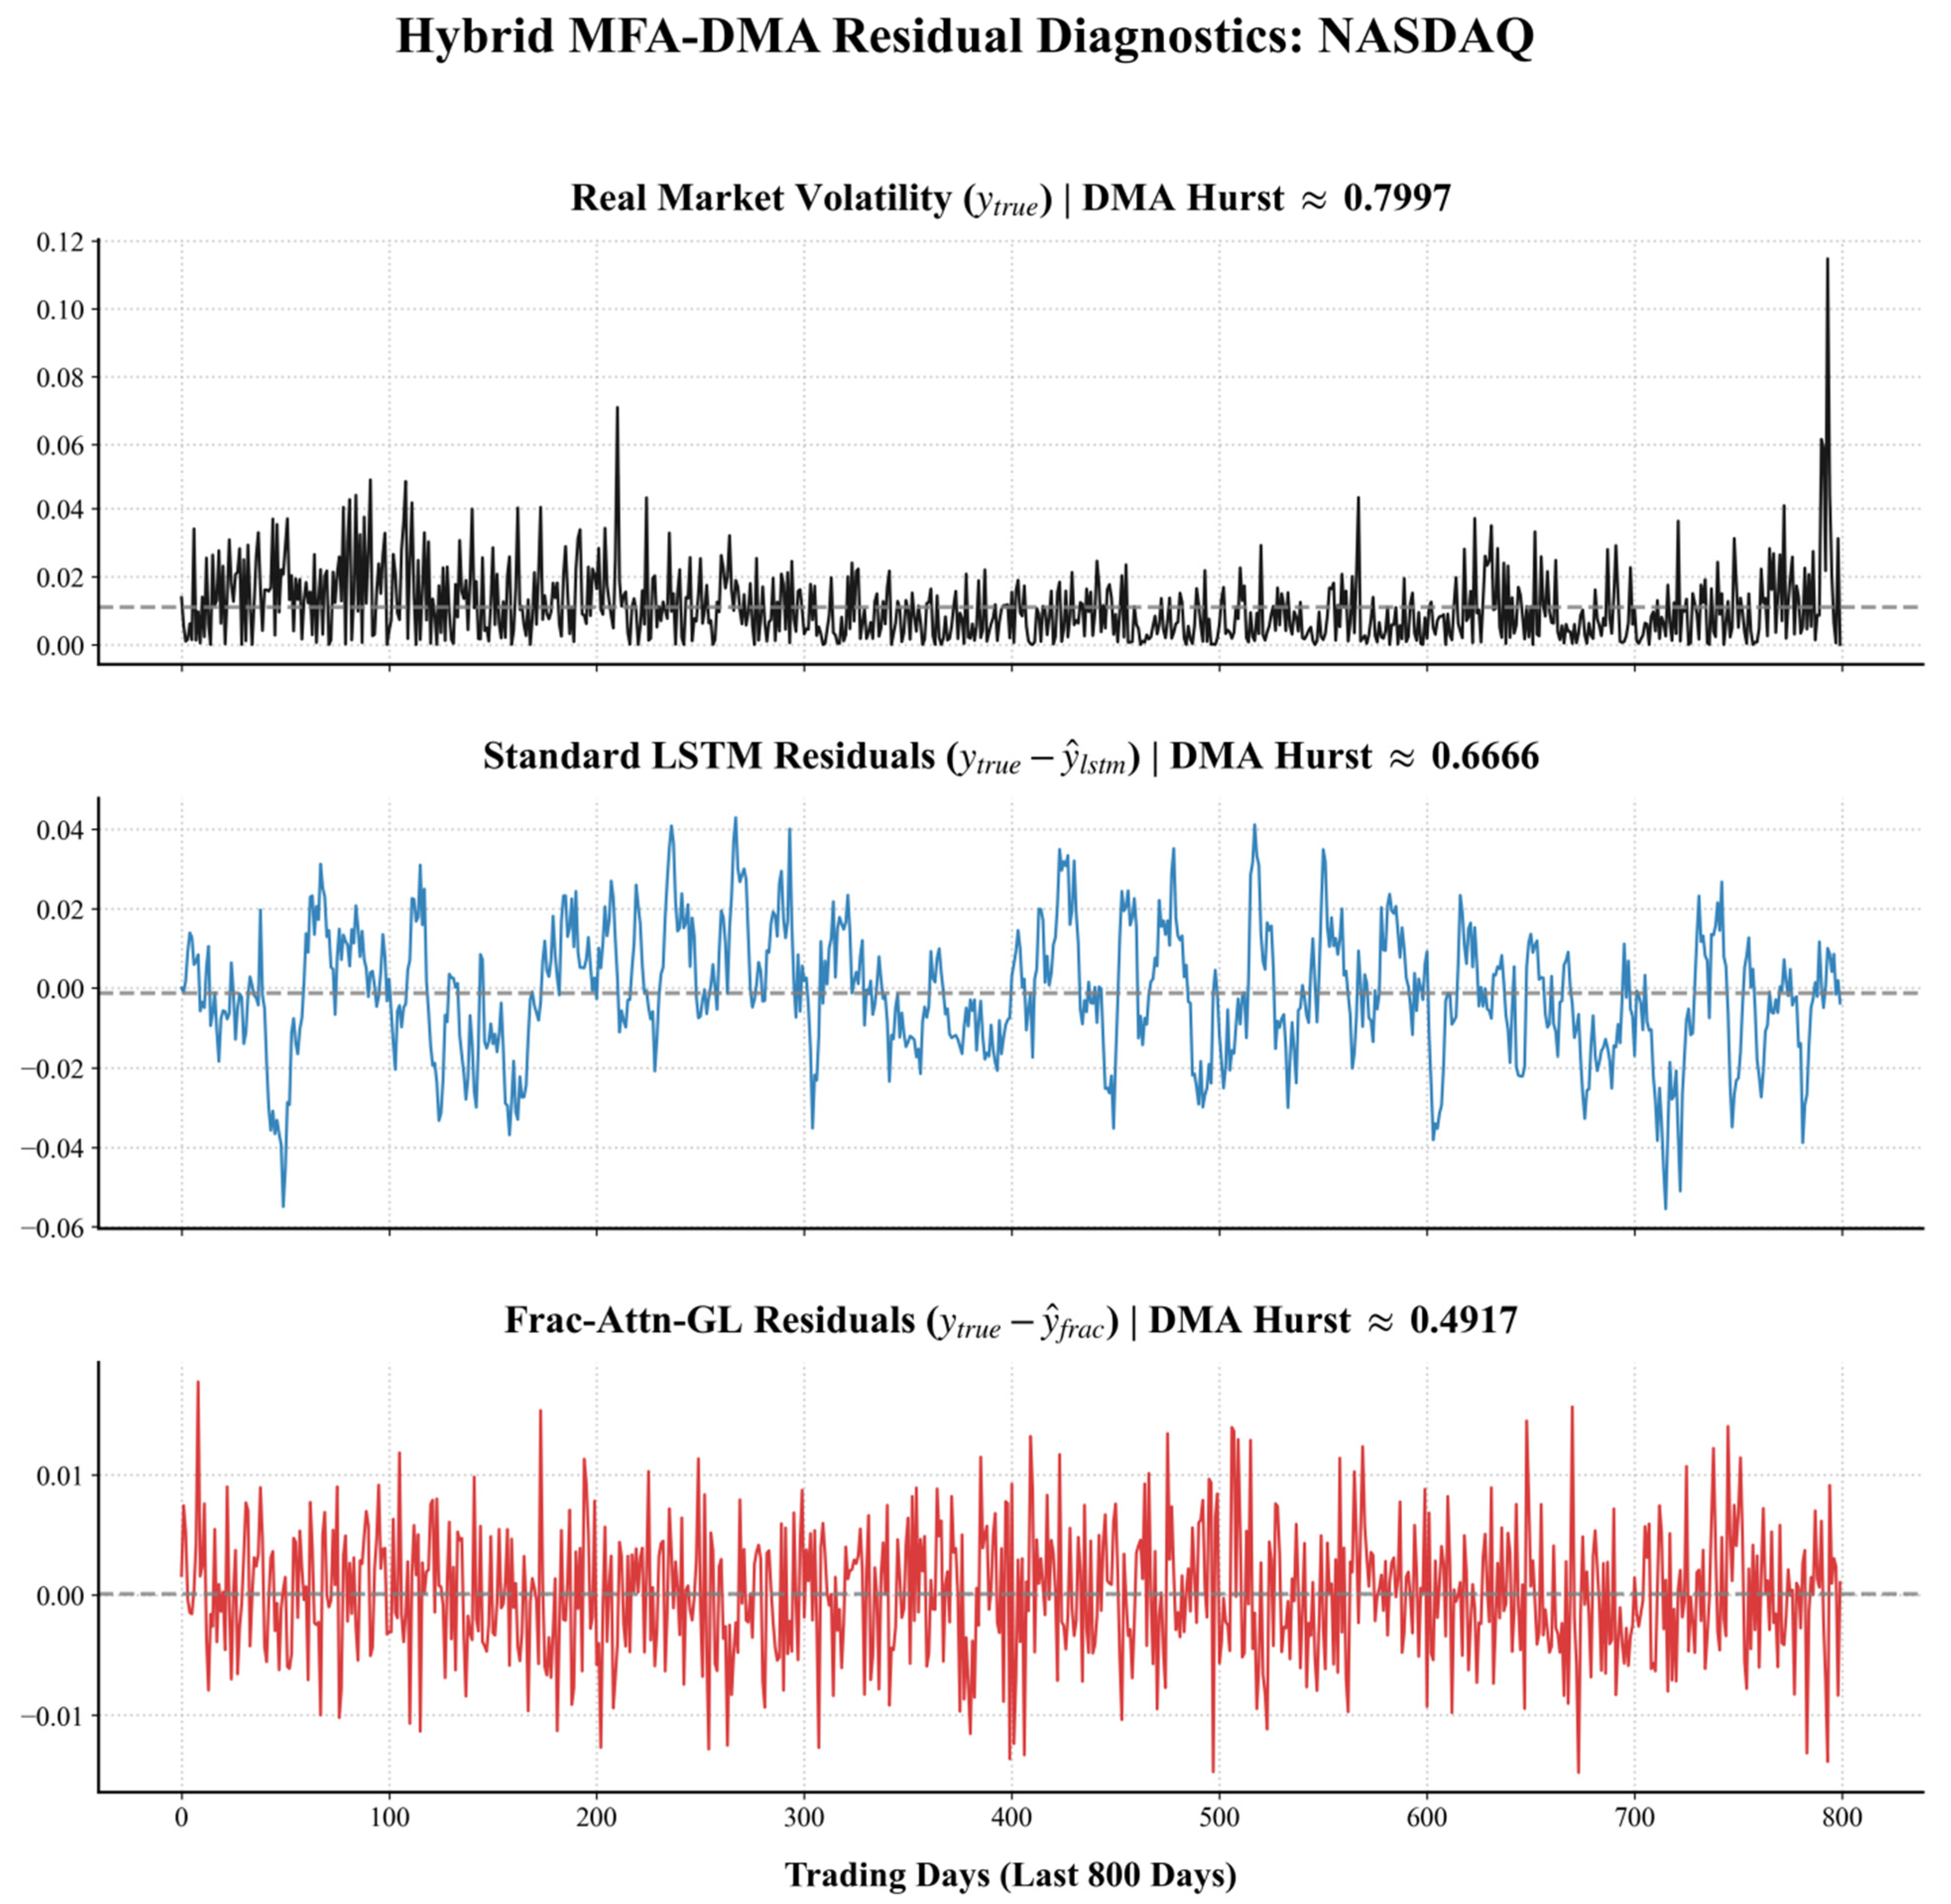
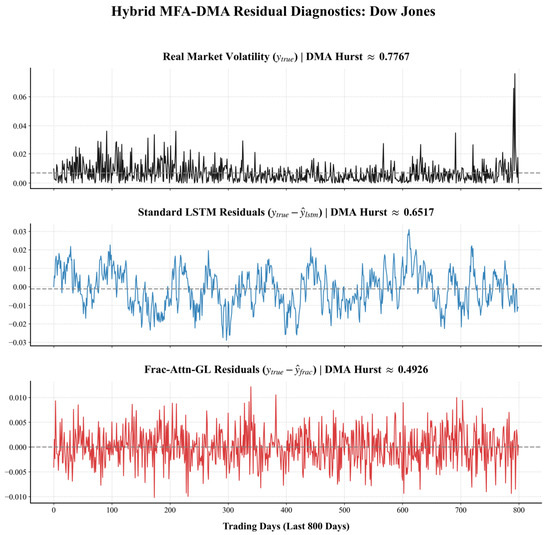
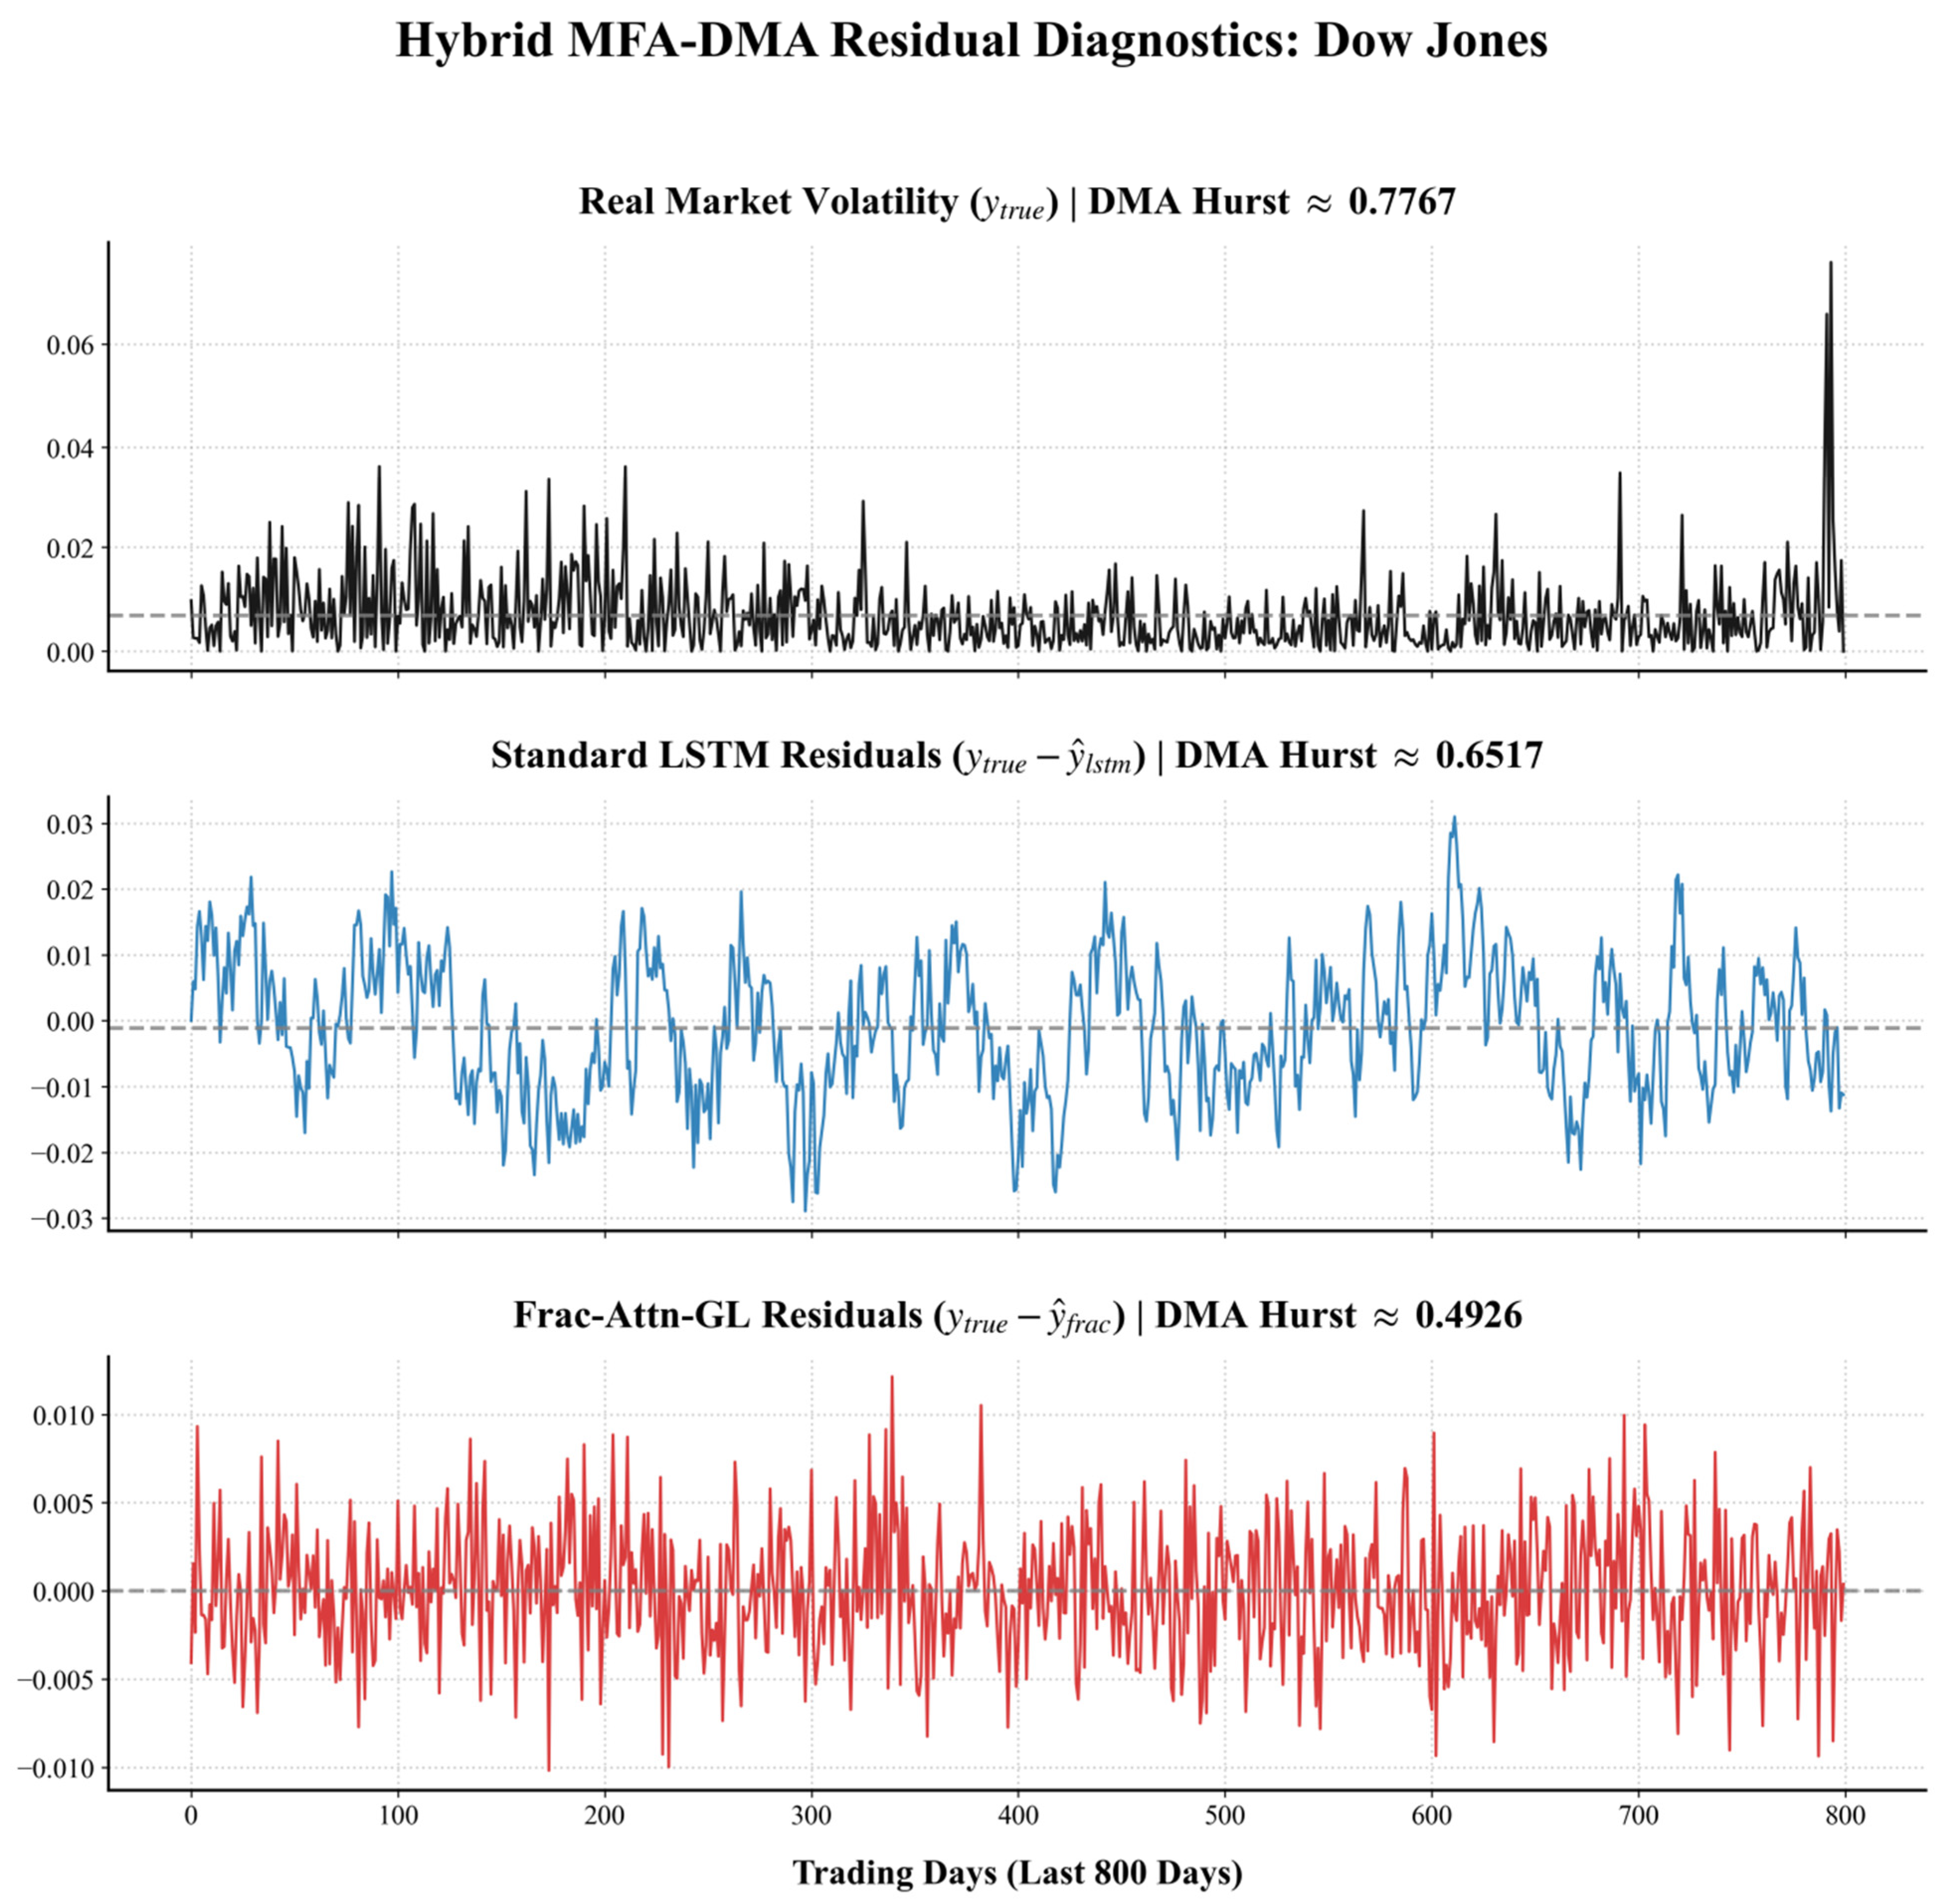
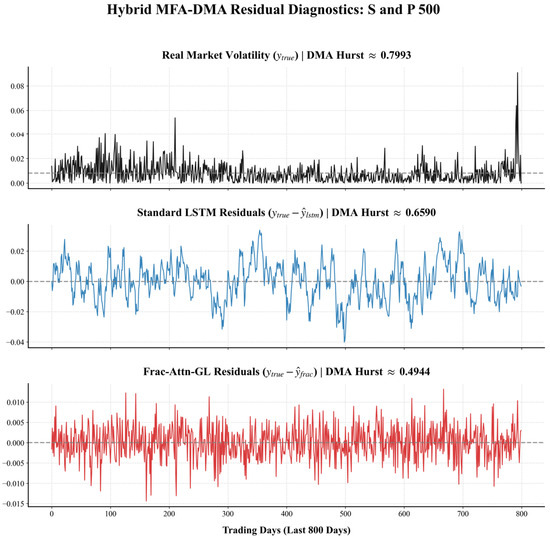
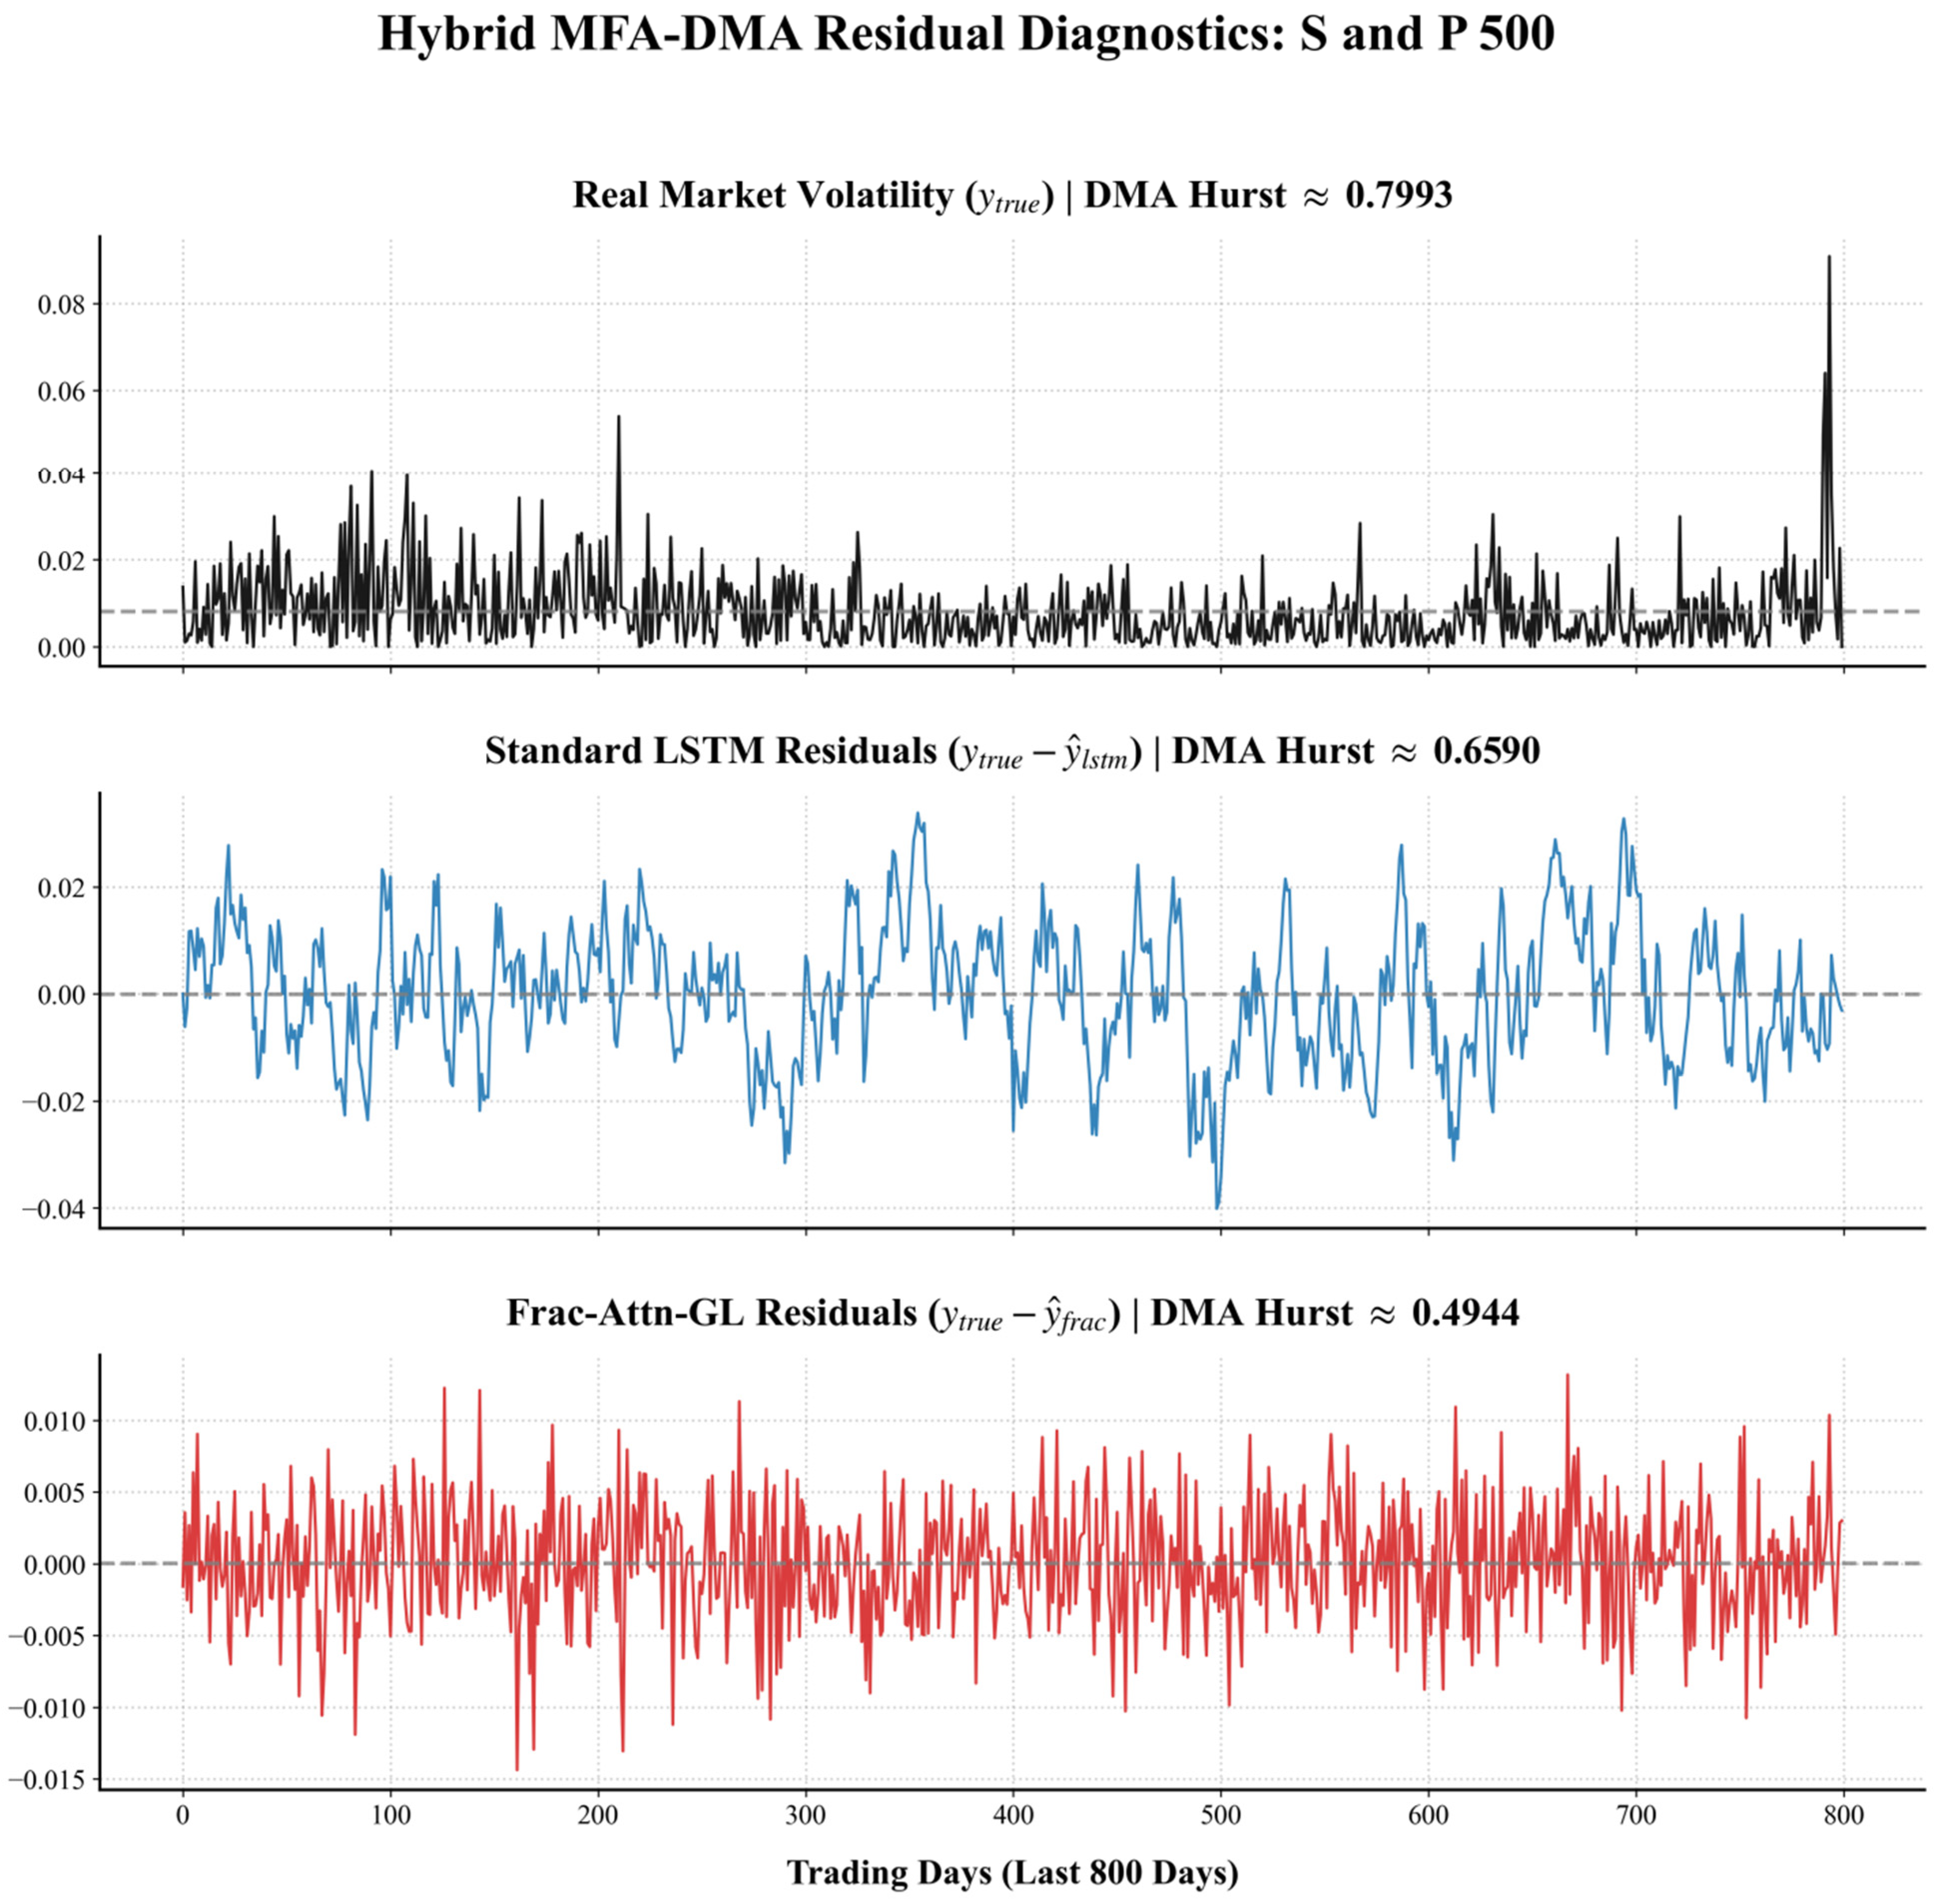

Disclaimer/Publisher’s Note: The statements, opinions and data contained in all publications are solely those of the individual author(s) and contributor(s) and not of MDPI and/or the editor(s). MDPI and/or the editor(s) disclaim responsibility for any injury to people or property resulting from any ideas, methods, instructions or products referred to in the content. |
© 2026 by the authors. Licensee MDPI, Basel, Switzerland. This article is an open access article distributed under the terms and conditions of the Creative Commons Attribution (CC BY) license.