


Abstract
Coalbed methane (CBM) development is strongly controlled by pore structure evolution in deformed coals and its influence on hydraulic fracturing behavior. To clarify the multifractal characteristics of cross-scale pores and their control on fracturing effectiveness, this study investigated eight different deformation coals from the Ordos Basin using low-temperature CO2/N2 adsorption (LT-CO2A/LT-N2A) and high-pressure mercury intrusion porosimetry (HMIP). Micropores (<2 nm), mesopores (2–50 nm), and macropores (>50 nm) were systematically characterized, and their pore size distributions (PSDs) were quantitatively analyzed using the Coal Structure Index (CSI) and multifractal theory. The results indicate that the multifractal parameters of macropores are significantly distinct from those of mesopores and micropores, exhibiting lower H (0.824–0.893) and D1 (0.766–0.853), and higher α0 (1.422–1.541), ΔD (1.230–1.408), and Δα (1.459–1.642). Macropores controlled by tectonic deformation exhibit stronger heterogeneity compared to mesopores and micropores in local parts of the coal mass; PSD varies significantly with deformation rising, derived from the differential pore structure evolution during brittle–ductile transition and the multi-scale synergistic effects including maturity and composition. Combined with field fracturing curves, the results further indicate that the α0, ΔD, and Δα of macropores are negatively correlated with breakdown pressure, with correlation coefficients of 0.51, 0.61, and 0.59, respectively, and that strong local heterogeneity of macropores favors fracture initiation and propagation and reduces breakdown pressure. Cataclastic coal is the most favorable for hydraulic fracturing, followed by undeformed coal, whereas granulated coal shows the poorest fracturing performance.
1. Introduction
With the continuous growth of China’s energy demand and the deepening advancement of the “carbon neutrality and peak carbon emissions” strategy, the strategic value of coalbed methane (CBM) as a clean energy source has become increasingly prominent [1]. The efficient development of CBM is closely linked to the coal texture characteristics, which are governed by geological processes such as tectonic stress and magmatic intrusion, manifested as different coal deformation degrees [2], and can be classified into four types: undeformed coal, cataclastic coal, granulated coal, and mylonitic coal. Different coal textures exhibit markedly distinct characteristics in the development of pores and fissures, which critically influence reservoir permeability and recoverability [3]. Coal pore sizes span several orders of magnitude from nanometers to micrometers (1 nm–1000 μm), and their distribution and connectivity exhibit significant heterogeneity, which is manifested not simply as “porous” or “non-porous” but through pore morphology, pore size distribution (PSD), and the variation degree (i.e., the variability of data across different intervals within the system), thus making accurate characterization challenging with conventional geometric methods [4]. The physical properties of the pore-fissure system concluding pore size, shape, distribution, connectivity, etc., demonstrate inhomogeneity and variation in three-dimensional space, termed heterogeneity. For CBM development, hydraulic fracturing serves as a key technology for creating artificial fracture networks and enhancing seepage pathways [5,6], with its fracture propagation paths and morphological characteristics being conditioned by the coal’s inherent pore-fissure structure. Therefore, systematically elucidating the pore characteristics corresponding to different coal textures and their influence on actual fracturing performance informs fracturing design and development optimization. Regarding pore structure characterization, although various experimental techniques such as low-temperature CO2 adsorption (LT-CO2A), low-temperature N2 adsorption (LT-N2A), and high-pressure mercury intrusion porosimetry (HMIP) have been widely applied [7,8], classical fractal theory remains largely limited to describing the overall self-similarity of pores from a statistical average perspective, often inadequately characterizing local heterogeneity [9,10]. The classical fractal theory generally corresponds to a mono-fractal description. In a mono-fractal system, the pore structure is assumed to exhibit statistically homogeneous self-similarity over different scales and can therefore be characterized by a single constant fractal dimension. Under this framework, the relationship between fractal dimension and porosity has been discussed from experimental [11], analytical [12], theoretical [13], and statistical perspectives [14]. However, because mono-fractal theory describes the pore system using only one average scaling exponent, it is more suitable for overall characterization of relatively homogeneous pore systems and is often insufficient to capture the local fluctuations and cross-scale heterogeneity of tectonically deformed coals. Therefore, multifractal theory is introduced in this study to further resolve the non-uniform pore distribution and local singularity characteristics over multiple scales. Multifractal theory can systematically characterize the pore structure characteristics of various deformed coals in multi-scale, integrating multiple experimental datasets covering the full pore size range. This method not only preserves the overall PSD characteristics but also reveals differences in local structures through the continuous spectrum function, thereby enabling a more comprehensive description of the heterogeneous characteristics of coal pore systems and providing a theoretical basis for further understanding the controlling mechanism of coal texture on hydraulic fracturing effectiveness.
Multifractal theory provides an effective mathematical tool for characterizing the heterogeneity and irregularity of coal pore structures and has been widely applied in energy geology in recent years [15,16]. Zheng et al. [17] developed a multifractal model applicable to the transverse relaxation time (T2) spectra of coals based on nuclear magnetic resonance (NMR) technology, proposing a new method for determining T2 cutoff values. This model demonstrated positive applicability in coal reservoirs of the Qinshui and Junggar Basins, and its conceptual framework can be extended to studies of other rocks such as shale. Yin et al. [18] investigated the damage evolution behavior of coals with different bursting liability through acoustic emission (AE) experiments, comparing the temporal variations in multifractality and nonlinear b-value characteristics, which provides significant insights into the coal breakdown mechanisms. Guo et al. [19] conducted LT-CO2A and LT-N2A on bituminous coals and applied multifractal theory to assess how tectonic stress affects the connectivity of micropores and mesopores. These studies have advanced the development of multifractal characterization methods for coal pore structures and laid a theoretical foundation for a deeper understanding of the intrinsic relationships among coal deformation, pore evolution, and fracturing response.
Hydraulic fracturing effectiveness in coal reservoirs and other rock masses is governed not only by the pore-fissure architecture, but also by the deformation characteristics and overall stability of the rock mass. Previous studies have shown that fracture initiation and propagation paths, fracturing fluid leak-off behavior, and breakdown pressure are not controlled by a single factor, but rather by the combined effects of in situ stress conditions, the degree of natural fracture development, rock mechanical strength, and structural integrity [20,21,22,23,24]. Conventional studies have mainly investigated fracturing performance from the perspectives of rock elastic deformation, stress evolution, natural fracture development, and post-fracturing fracture morphology. Through theoretical analysis and laboratory experiments on porous limestone and sandstone, Bruno et al. [20] demonstrated that tensile fracture initiation and propagation are jointly controlled by the local pore pressure magnitude around the crack tip and the global distribution of pore pressure gradients. Liu et al. [21] systematically investigated the effects of different types of natural fractures on hydraulic fracture propagation in tight reservoirs by introducing prefabricated natural fractures with different inclinations and different distances from a simulated wellbore. Their results showed that, as the distance between the prefabricated fracture and the wellbore increased, the influence of pre-existing fractures on hydraulic fracture propagation gradually weakened, whereas effective stress became the dominant factor controlling fracture extension. In recent years, increasing attention has been paid to the intrinsic relationship among coal structure, fracture networks, and hydraulic fracturing effectiveness. Using principal component analysis and multiple linear regression, Zou et al. [22] predicted coal structure types and established an index for forecasting fracturing effectiveness, showing that cataclastic coal exhibits the most favorable fracturing response. Based on laboratory triaxial compression experiments and CT reconstruction, Han et al. [23] proposed that the compression of bedding fractures, restriction of radial deformation, and weakening of interlayer effects are effective mechanisms for confining pressure-induced shale fracture network formation, and that confining pressure significantly suppresses and weakens shale fracture development.
Despite these advances, three important gaps remain in the existing literature. First, many studies evaluate hydraulic fracturing behavior mainly from a mechanical or engineering perspective, whereas pore structure studies often remain disconnected from actual fracturing performance. Second, conventional mono-fractal methods are insufficient to capture the local heterogeneity and cross-scale variation in pore systems in tectonically deformed coals. Third, there is still a lack of systematic studies directly linking cross-scale pore multifractal characteristics of differently deformed coals with field fracturing response, especially fracturing curve types and breakdown pressure. To address these gaps, this study aims to establish a direct link among coal deformation, cross-scale pore multifractal characteristics, and actual fracturing response based on multifractal analysis. Therefore, this study focuses on various deformed coal samples collected from the central Ordos Basin, aiming to investigate the multifractal characteristics of the pore structure in actual perforated coal sections, so as to provide a theoretical basis for optimizing hydraulic fracturing and enhancing CBM recovery in the study area. By integrating LT-CO2A, LT-N2A, and HMIP, the pore structures of micropores (<2 nm), mesopores (2–50 nm), and macropores (>50 nm) in coal are systematically characterized, achieving a detailed description of pore distribution across different scales. Based on the Coal Structure Index (CSI) and multifractal theory using the box-counting method, the singularity spectra (α-f(α)), generalized dimension spectra (q-Dq), and CSI values of the coal samples were obtained for different pore size ranges. These data were subsequently used to quantitatively evaluate the heterogeneity, connectivity characteristics, and the coal deformation. Compared with previous studies that mainly focused on a single pore size scale, a single fractal description, or purely mechanical analysis, this study establishes a cross-scale multifractal analytical framework oriented toward actual fracturing response. This framework not only provides a new theoretical basis for evaluating and optimizing hydraulic fracturing in tectonically deformed coals, but also deepens the understanding of coal pore deformation mechanisms and local pore evolution, thereby offering scientific support for predicting fracture morphology, optimizing fracturing parameters, and improving CBM recovery efficiency.
2. Materials and Methods
To systematically characterize the heterogeneity of pore structures in various deformed coals and to reveal the relationship between coal texture and pore characteristics, this study adopts an integrated research framework combining experimental testing and theoretical analysis (Figure 1). Three complementary experimental methods were selected: LT-CO2A, LT-N2A, and HMIP. These methods target the pore structure characterization in micropores (<2 nm), mesopores (2–50 nm), and macropores (>50 nm), respectively, based on the IUPAC classification [25]. Furthermore, multifractal theory was applied to conduct a comprehensive multi-scale analysis, incorporating measures of coal deformation derived from the CSI. This section details the experimental framework and theoretical models, thereby establishing the methodological foundation for the subsequent multifractal characterization and pore structure discussion.
Figure 1.
Characterization experiments and methods for coal texture and pore characteristics. The pore size classification follows the IUPAC classification. (a) Characterization of coal micropores based on LT-CO2A; (b) characterization of coal mesopores based on LT-N2A; (c) characterization of macropore fissures based on HMIP; (d) experimental equipment; (e) the Coal Structure Index (CSI); (f) multifractal theory.
2.1. Geological Setting of the Sampling Area
The Ordos Basin is bounded by the Luliang Mountains to the east, the Helan and Liupan Mountains to the west, the Qinling Mountains to the south, and the Yin Mountains to the north, trending roughly north–south with dimensions of approximately 800 km long and 400 km wide, covering an area of 3.2 × 10⁵ km2 [26] (Figure 2a). The study area, located in the central Ordos Basin, is characterized by a broad, gentle southeast-dipping monocline with relatively flat-lying strata, where the Carboniferous and Permian formations are nearly horizontal, generally dipping at 3–10°, and exhibit poorly developed faulting dominated by NE- and NW-trending normal faults (Figure 2b). The Paleozoic coal-bearing strata in the study area primarily consist of the Upper Carboniferous Taiyuan Formation and the Lower Permian Shanxi Formation, which constitute a transitional marine–continental deltaic depositional system characterized by interbedded sandstones and mudstones with thin limestone interlayers (Figure 2c). More than 20 coal seams with variable individual thicknesses are developed within the Carboniferous–Permian coal measures. Among them, coal seams No. 4 and No. 5 in the Shanxi Formation, and coal seams No. 8 and No. 9 in the Taiyuan Formation, are regionally widespread and relatively stable. In the Shanxi Formation, the No. 4 and No. 5 coal seams have an average thickness of 4.8 m and an average burial depth of 834.6 m, while in the Taiyuan Formation, the No. 8 and No. 9 coal seams exhibit an average thickness of 7.1 m and an average burial depth of 908 m. This study focuses on eight various deformed coal samples collected from the central Ordos Basin, which were obtained from the stably developed No. 4 and No. 5 coal seams in the Shanxi Formation and the No. 8 and No. 9 coal seams in the Taiyuan Formation (sampling locations shown in Figure 2b). Specifically, sample 1 (S1) and sample 2 (S2) were collected from the same perforation interval in well 1 (W1), whereas sample 4 (S4) and sample 5 (S5) were obtained from different hydraulic fracturing perforation intervals in well 3 (W3). Therefore, although a total of eight samples were analyzed in this study, they were collected from only six distinct well locations.
Figure 2.
Geological information of the central Ordos Basin. (a) Geographical location of the Ordos Basin; (b) distribution of coal seam burial depth and thickness in the study area; (c) coal-bearing strata.
2.2. Coal Samples and Experimental Equipment
The collected coal samples are dominated by tectonically deformed coals, including cataclastic coals in S1 and S4, granulated coals in S2, S3, S5, S7, and S8, and undeformed coal in S6 (Figure 3). In general, the samples are grayish black in color, commonly display vitreous to strong vitreous luster, have a hardness of approximately 3, and are mainly characterized by blocky construction, with locally homogeneous or banded structures. Except for S6, no obvious filling was observed in the endogenous cleats, and no apparent exogenous fractures were identified in any sample. In terms of lithotype, most samples are bright coal, whereas S5 and S6 are semi-bright coal. The proportions of vitrain plus clarain are generally high, accounting for about 95% in S1 and S2, 90% in S4 and S8, 85% in S7, 80% in S3, and 75% in S5 and S6. Cleats are generally well-developed. Most samples contain two sets of cleats approximately perpendicular to the bedding plane, with face-cleat densities of 8–14 cleats/5 cm and butt-cleat densities of 3–8 cleats/5 cm; the two cleat sets are mostly orthogonal or oblique to each other. In contrast, S3 exhibits only one prominent cleat set (13 cleats/5 cm). S6 is the only sample in which white filling was observed in endogenous cleats, indicating a distinct cleat characteristic compared with the other tectonically deformed coal samples.
Figure 3.
Comparison of coal sample cores, maceral composition (vitrinite and inertinite) and maximum vitrinite reflectance (Ro,max, %), proximate analysis parameters including moisture content (Mad, %), ash yield (Aad, %), volatile matter yield (Vad, %), and fixed carbon content (FCad, %), as well as the quantified Coal Structure Index (CSI) of the coal samples.
The pore structure tests in this study were mainly conducted using two types of apparatus: a high-pressure mercury intrusion porosimeter and a low-temperature N2/CO2 adsorption system. The former is based on the principle that non-wetting liquid mercury enters pores and pore throats under externally applied pressure. By recording the mercury intrusion and extrusion processes under different pressure conditions, parameters such as pore throat radius distribution, total pore volume, median pore size, and connectivity can be obtained. The latter is based on the principle of low-temperature gas adsorption; by measuring the adsorption behavior of N2 or CO2 on the sample surface and analyzing the corresponding adsorption isotherms, parameters such as specific surface area, pore volume, and PSD can be derived. These two types of apparatus are complementary and together provide the experimental basis for the multi-scale characterization of pore structures in coal samples. Photographs of the relevant equipment are shown in Figure 1d.
2.3. Experimental Framework
2.3.1. Low-Temperature CO2 Adsorption Experiment
The CO2 adsorption measurements and data analysis were carried out using an Autosorb-iQ physisorption analyzer (Anton Paar QuantaTec Inc., Boynton Beach, FL, USA). Prior to analysis, the coal samples were crushed and sieved to 60–80 mesh, and then vacuum degassed at 378.15 K for 12 h to remove moisture and volatile substances adsorbed on the sample surface. Subsequently, isothermal adsorption measurements were conducted at 273.15 K using high-purity CO2 (purity ≥ 99.999%) as the adsorbate over a relative pressure range of P/P0 = 0–0.03, where P0 is the saturation vapor pressure of CO2 at 273.15 K. To ensure data reliability, each sample was tested in triplicate, and the average value was used for subsequent analysis. Compared to LT-N2A, the CO2 molecule possesses a smaller kinetic diameter, facilitating its access into micropore structures. Furthermore, CO2 exhibits more sensitive detection capability for micropore and some mesopore structures due to its polar bonds, significant quadrupole moment, and specific chemical interactions with the coal mass [27]. This study employs Density Functional Theory (DFT) to characterize the specific surface area (SSA) and the micropore PSD; the detailed description of DFT can be found in reference [28]. Data processing was performed using the instrument’s built-in ASiQwin software (version 5.2) and Origin 2022 was additionally used for plotting and verification.
2.3.2. Low-Temperature N2 Adsorption Experiment
This experiment followed the Chinese National Standard GB/T 19587-2017 [29] (“Determination of the SSA of solids by gas adsorption using the BET method”). N2 adsorption–desorption measurements were performed using the Autosorb-iQ physisorption analyzer. The coal samples were first crushed and sieved to 60–80 mesh. About 10 g of each sample was then vacuum degassed at 378.15 K for 24 h to thoroughly remove moisture and volatile substances from the pore system. After degassing, high-purity N2 (purity ≥ 99.999%) was used as the adsorbate, and adsorption–desorption isotherms were measured at 77 K over a relative pressure range of P/P1 = 0–1, where P1 is the saturation vapor pressure of N2 at 77 K. The equilibration time at each relative pressure point was set to 30 s, and the pressure tolerance was set to 0.1%. To ensure data reliability, each sample was tested in triplicate, and the average value was used for subsequent analysis. The SSA of the samples was calculated using the Brunauer–Emmett–Teller (BET) model, while the mesopore PSD was analyzed based on the Barrett–Joyner–Halenda (BJH) model. The BET adsorption isotherm equation is given by Equation (1) [30] below, and the SSA is derived from Equation (2) [30]:
In the equations: P represents the partial pressure of nitrogen; P1 denotes the saturation vapor pressure of nitrogen; V is the actual adsorbed volume of nitrogen; Vm refers to the monolayer saturation adsorbed volume of nitrogen; C is a constant related to the adsorption capacity of the coal.
In the equations: NA is Avogadro’s constant; AN is the surface area of a nitrogen atom.
The total pore volume is calculated by Equation (3) [31]:
In the equation: M is the molar mass of nitrogen; ρN is the density of the adsorbed N2 phase.
The average pore size r1 can be obtained from the calculated SSA and total pore volume [30,31]:
Data processing and model fitting were carried out using the instrument’s built-in ASiQwin software, and Origin 2022 was additionally used for plotting and verification.
2.3.3. High-Pressure Mercury Intrusion Porosimetry
Following the Chinese National Standard GB/T 29171-2023 [32] (“Rock capillary pressure measurement”), coal samples were prepared into 1 cm3 cubes and dried at 378.15 K for 8 h. This drying temperature effectively removes moisture and adsorbed gases from the samples while avoiding potential damage to the original pore structure. HMIP was performed using a mercury intrusion porosimeter. The surface tension of mercury was set to 0.480 N/m, and the contact angle between mercury and the coal samples was set to 140°. The pore size measurement range for the HMIP was set from 3 nm to several hundred micrometers, encompassing macropores and part of the mesopore structures. An equilibration time of 10 s was used, and the mercury intrusion volume was recorded at each pressure step. To ensure data reliability, each sample was tested in triplicate, and the average values were used for subsequent analysis. The pore size is calculated using Equation (5) [30]:
In the equation, r2 is the pore diameter; p is the mercury intrusion pressure; γ is the surface tension of mercury; θ is the mercury contact angle on the solid surface, the value of which is jointly influenced by the mode of mercury spreading and the physicochemical properties of the solid surface.
Data processing was conducted using the instrument’s built-in AutoPore V software (version 2.03), with Excel 2021 and Origin 2022 additionally used for data export and plotting verification.
2.4. Theoretical Models
2.4.1. Quantitative Model of Coal Texture
Traditional core description methods are highly subjective and lack a unified standard for quantitative characterization. To address this, this study introduces the Coal Structure Index (CSI) to achieve a quantitative representation of the coal deformation degree [33]. This model is derived from the Geological Strength Index (GSI) within the Hoek–Brown strength criterion [34], establishing a quantitative coal texture chart (Figure 1e) through a constructed two-dimensional parameter system. The horizontal axis of the chart is the Surface Condition Rating (SCR), which reflects the combined effect of the Brittle Deformation Index (BDI) and the Ductile Deformation Index (DDI). The BDI is related to cleat density and coal lithotype, while the DDI characterizes features of plastic deformation such as the development of discontinuities, bedding structures, and tectonic slickensides. The vertical axis is the Coal Strength Designation (CSD), quantitatively assessed based on core block size and the proportions of block types. By plotting the SCR-CSD parameter pair onto the chart, a CSI ranging from 0 to 100 can be obtained. The CSI exhibits a positive correlation with the coal deformation degree. Based on the CSI, coal textures can be classified into four types: undeformed coal (CSI 0–25), cataclastic coal (CSI 25–45), granulated coal (CSI 45–70), and mylonitic coal (CSI 70–100). Among these, undeformed and cataclastic coals are classified as undeformed-brittle deformation coals, whereas granulated and mylonitic coals are classified as ductile deformation coals. In this study, the CSI values were calculated using Excel 2021 and Origin 2022.
2.4.2. Multifractal Theory
Multifractal theory, as an extension of fractal theory, investigates the normalized distribution characteristics of a studied object. This theory treats the whole as a superposition of multiple subsets, each possessing distinct fractal properties, thereby forming a singular set with spatially inhomogeneous distribution [35]. Multifractal theory encompasses two mathematically equivalent descriptions: the generalized fractal dimension spectrum (q-D(q)) and the multifractal singularity spectrum (α-f(α)). For the multifractal analysis in this study, the box-counting method was employed to calculate the multifractal spectra. The relative pressure range from gas adsorption experiments and the pressure range from HMIP were each treated as a total interval, which was subsequently divided into N equal subintervals of scale ε using the bisection method [4,36,37]. To quantitatively characterize the distribution characteristics of the adsorbed volume within each subinterval, the mass probability function Pi(ε) for the i-th subinterval is defined as [36]
In the equation: Ni(ε) is the adsorbed volume in the i-th subinterval (i = 1, 2, …); Nt is the total adsorbed volume in the total interval.
For the i-th subinterval with a scale ε, its mass probability function can be expressed in an exponential form [36]:
In the equation, αi is the singularity index, which reflects the local singularity intensity of the mass probability function Pi(ε) within that subinterval, indicating the data variation degree within that interval [38].
For boxes exhibiting multifractal characteristics, the number of subintervals, N(ε), decreases exponentially as the scale ε increases. If the number of subintervals with the same probability marked by α is defined as Nα(ε), then the following relationship holds [37]:
In the equation, f(α) represents the fractal dimension of the subset characterized by a specific singularity index α.
A curve formed by α and f(α), termed the multifractal singularity spectrum, characterizes the inhomogeneous distribution of pore adsorption capacity across the fractal structure, thereby providing more comprehensive information than a single fractal dimension [16]. The specific expressions for α(q) and f(α) are given as follows [39]:
In the equations, α(q) is the multifractal singularity index; ui(q, ε) is a family of partition functions constructed from Pi(ε), defined as [36,37]
In the equations: ui(q, ε) is the q-order probability value of the i-th subinterval; χ(q, ε) is the sum of the q-order probabilities over all subintervals. The parameter q represents the order of the statistical moment, ranging from −∞ to +∞. In this study, q takes integer values within the closed interval [−10, 10], with a step size of 1.
For χ(q, ε), q, and ε, they satisfy the following power-law scaling relationship [36,40]:
In the equation, τ(q) represents the mass exponent of order q, which is a characteristic function of the fractal feature. It can be obtained from the slope of the double logarithmic plot of χ(q, ε) versus ε.
Dq-q and f(α)-α represent two equivalent descriptions within multifractal theory. The relationship between Dq and q is given by [41]
To ensure the continuity of Dq at q = 1, L’Hôpital’s rule can be applied for its solution, yielding the complete expression as follows [38,41]:
Through the Legendre transformation [39], the relationship among α(q), q, and τ(q) can be expressed as [42]
Based on the acquired mass probability, partition function, mass exponent, and generalized fractal dimension, Dq-q and f(α)-α can be constructed, from which the relevant multifractal parameters are derived. Among these, D0, D1, and D2 correspond to the capacity dimension, information dimension, and correlation dimension, respectively. The correlation dimension D2 can be expressed in the Hurst exponent (H) as follows [39]:
In this study, the multifractal parameters and the corresponding spectra were calculated and plotted using Excel 2021 and Origin 2022, respectively.
3. Results
3.1. Petrographic and Structural Characteristics of Coal Samples
The organic maceral composition of coal samples is dominated by vitrinite, which has the maximum mass fraction ranging from 66.8% to 79.2%, followed by inertinite (20.8–33.2%), while liptinite content is lowest. The maximum vitrinite reflectance (Ro,max) varies between 0.82% and 1.64%, with an average of 1.11%, indicating a relatively high rank of thermal evolution for all samples (Figure 3). The moisture content of the samples is generally low, mostly <1.0%. Among them, S2 has the highest moisture content (1.21%), while S6 has the lowest (0.69%). The ash yield (Aad) of the samples shows significant variation, with S2 exhibiting the lowest value (3.66%) and S4 the highest (22.86%). The fixed carbon content (FCad) of the coal samples ranges from 52.29% to 71.17%, with an average value of 59.74%. The calculation of the CSI indicates that S2 has the highest CSI (61.6), while S6 has the lowest (18.7). Among them, S6 is the undeformed coal; S1 and S4 are cataclastic coals; and S2, S3, S5, S7, and S8 are granulated coals. Detailed data of the coal samples are shown in Table 1.
Table 1.
Data on maceral composition (vitrinite and inertinite), maximum vitrinite reflectance (Ro,max, %), proximate analysis parameters including moisture content (Mad, %), ash yield (Aad, %), volatile matter yield (Vad, %), and fixed carbon content (FCad, %), as well as the quantified Coal Structure Index (CSI) of the coal samples.
Considering the averaged multifractal parameters across micropores, mesopores, and macropores (Table 2), the coal samples show H values ranging from 0.891 to 0.911, α0 from 1.32 to 1.39, ΔD from 1.01 to 1.14, D1 from 0.86 to 0.88, and Δα from 1.23 to 1.37. These results indicate that all samples exhibit pronounced multifractal characteristics, although certain inter-sample differences are still evident. Among them, S1 has the lowest H value, suggesting relatively poor connectivity of its pore system, whereas S8 shows the highest H value, indicating relatively better pore connectivity. In terms of α0, S5 has the lowest value, while S4 has the highest, implying that the dominant pore types in S4 are more strongly concentrated in local spatial domains. Meanwhile, S4 exhibits the highest ΔD and Δα values, whereas S2 shows the lowest ΔD and Δα values, reflecting that the former has stronger pore structure differences between regions of different probabilities and greater local heterogeneity. As for D1, S1 shows the lowest value and S8 the highest, further indicating that the overall homogeneity of PSD in S8 is better than that in S1.
Table 2.
The averaged multifractal parameters (H, α0, ΔD, D1, and Δα) of the coal samples. All parameters are dimensionless.
3.2. Cross-Scale Analysis of Pores and Fissures in Coals
3.2.1. Analysis of Low-Temperature CO2 Adsorption
The CO2 adsorption volume gradually increases with rising relative pressure, exhibiting the higher adsorption rate and region of adsorption predominance at the low-pressure stage (P/P0 ≤ 0.01), while the adsorption rate gradually slows as pressure enters the medium-to-high-pressure stage (P/P0 > 0.01). The adsorption curves of the eight coal samples generally conform to a logarithmic function distribution, with the maximum CO2 adsorption volume ranging from 7.41 to 13.27 cm3/g (Figure 4a).
Figure 4.
LT-CO2A results of the coal samples. (a) CO2 adsorption isotherms of samples S1–S8, showing adsorbed volume as a function of relative pressure (P/P0); (b) micropore pore size distribution (PSD) curves, showing the variation in pore volume with pore diameter in the micropore range.
The DFT model was employed to characterize the microporous structure within the range of 0.3 to 2.0 nm, revealing similar PSDs across all coal samples, with pore volume generally decreasing as pore diameter increases and exhibiting a peak at approximately 0.55 nm, where pore volume is predominantly concentrated within the 0.45–0.65 nm range. As the pore diameter increases further, the rate of change in pore volume tends to stabilize (Figure 4b).
3.2.2. Analysis of Low-Temperature N2 Adsorption
The morphology and connectivity of pores can be characterized by the features of LT-N2A isotherms. According to the IUPAC classification (Figure 1), adsorption isotherms are categorized into six types [25]. The adsorption–desorption curves for all samples (Figure 5a) belong to type IV isotherms. At low relative pressure (0 < P/P1 ≤ 0.4), the isotherm reflects the interaction between N2 molecules and the pore wall surface. At medium relative pressure (0.4 < P/P1 < 0.8), the isotherm exhibits monolayer to multilayer adsorption along with capillary condensation, forming a hysteresis loop, and the steep rise in the curve indicates well-developed mesopores with a relatively homogeneous PSD compared to other pore sizes. At high relative pressure (0.8 ≤ P/P1 < 1), the adsorbed volume continues to increase with rising pressure, demonstrating the presence of macropores larger than 50 nm.
Figure 5.
LT-N2A results of the coal samples. (a) N2 adsorption–desorption isotherms of samples S1–S8, illustrating adsorption behavior and hysteresis characteristics over the relative pressure range; (b) mesopore pore size distribution (PSD) curves, showing the variation in pore volume with pore diameter in the mesopore range.
According to the IUPAC classification of hysteresis loops (Figure 2), the hysteresis loops are gentle in shape and belong to type H3 (corresponding to wedge-shaped pore geometry) [25]. The hysteresis loops of some samples (e.g., S4) are considerably narrower, and their shapes approach that of type III isotherms, indicating a lower mesopore development degree in these samples and a predominance of semi-open pore structures.
Based on the LT-N2A, the BJH total pore volume and SSA results (Table 3) show that the BJH total pore volume of the samples ranges from 0.004 to 0.006 cm3/g, with an average value of 0.0049 cm3/g. The SSA calculated using the BET multilayer adsorption model reveals that sample S3 has a maximum value of 1.51 m2/g, a minimum value of 0.95 m2/g, and an average value of 1.27 m2/g. Further analysis of the pore size–pore volume distribution plots (Figure 5b) indicates that the pore structure of all samples is dominated by mesopores and micropores, while macropores account for a minor proportion and contribute relatively limitedly to the overall pore system. Integrating these results with the LT-CO2A findings indicates that the pore structure of the samples is dominated by micropores, followed by mesopores, with macropores making the smallest contribution.
Table 3.
Pore structure characteristics of coal samples obtained from LT-CO2A, LT-N2A, and HMIP, where Vtotal is the total pore volume obtained from LT-CO2A (mL/g), Stotal is the total specific surface area obtained from LT-CO2A (m2/g), VBJH is the BJH total pore volume (mL/g), SBET is the BET-specific surface area (m2/g).
3.2.3. Analysis of Mercury Intrusion Porosimetry
The mercury intrusion curves of all coal samples (Figure 6) show a relatively slow intrusion rate at pressures < 10 MPa, which increases significantly at pressures > 10 MPa, reflecting a high displacement pressure and a pore structure dominated by mesopores and a lower proportion of macropores. The narrow hysteresis loop between the mercury intrusion and extrusion curves, with the small volume difference, indicates that semi-closed pores dominate the pore structure, resulting in relatively limited storage potential.
Figure 6.
HMIP results of the coal samples. Mercury intrusion pore size distribution (PSD) histograms and intrusion–extrusion curves of samples S1–S8, showing the distribution of macropores.
The HMIP data (Table 3) further indicate that S1 exhibits the highest mercury extrusion efficiency (91.76%), reflecting better pore connectivity conducive to fluid flowback, while the efficiencies of the remaining samples range from 75.98% to 87.69%, remaining at a relatively high level overall. Furthermore, the mercury intrusion saturation for all samples is >90%, further confirming generally favorable internal pore connectivity in the coal samples. The median pore radius of the samples ranges from 0.009 to 0.011 μm, with an average of 0.0096 μm, indicating that pore throat sizes across the samples are relatively similar, with well-developed fine throats. The PSD results (Figure 6) reveal that mesopores and micropores account for 76.10% to 84.86% of the coal samples, whereas macropores constitute a smaller proportion, ranging only from 15.14% to 28.07%.
3.3. Characteristics of the Generalized Fractal Dimension Spectrum for Coal Pores
Multifractal analysis was conducted on the pore structures of micropores, mesopores, and macropores based on low-temperature gas adsorption and HMIP data. The relationship between the mass exponent τ(q) and the variable q can be used to reflect the fractal characteristics of PSD: if τ(q) exhibits a linear relationship with q, it indicates a homogeneous pore system lacking fractal features [43]. In this study, all samples displayed clear nonlinear behavior in the τ(q)-q plots (Figure 7). Specifically, in the low-probability regions (q < 0), τ(q) increased significantly with increasing q; in the high-probability regions (q > 0), τ(q) still increased with q, but the growth trend gradually flattened. This variation indicates that the pore systems of all samples are inhomogeneously distributed and exhibit distinct multifractal characteristics. The Dq-q spectrum can be used to characterize the complexity and local structural differences in PSDs [16,37]. The generalized fractal dimension spectra for micropores, mesopores, and macropores in the coal samples all show a monotonically decreasing, inverse sigmoidal trend (Figure 8). Based on the variation features, the curves can be divided into two segments: when q < 0, Dq decreases rapidly with increasing q; when q > 0, Dq decreases slowly with increasing q, and the absolute value of the curve slope gradually decreases. This inverse sigmoidal shape further confirms that all coal samples possess multifractal characteristics.
Figure 7.
Mass exponent spectrum τ(q)-q of coal pores in different pore size ranges: (a) micropores characterized by LT-CO2A; (b) mesopores characterized by LT-N2A; (c) macropores characterized by HMIP. The x-axis represents the moment order q, where q < 0 emphasizes low-probability pore regions and q > 0 emphasizes high-probability pore regions, and the y-axis represents the mass exponent τ(q). The nonlinear increase in τ(q) with q indicates that the pore systems are heterogeneous and exhibit clear multifractal characteristics. All parameters are dimensionless.
Figure 8.
Generalized fractal dimension spectrum D(q)-q of coal pores in different pore size ranges: (a) micropores characterized by LT-CO2A; (b) mesopores characterized by LT-N2A; (c) macropores characterized by HMIP. The x-axis represents the moment order q, where q < 0 emphasizes low-probability pore regions and q > 0 emphasizes high-probability pore regions, and the y-axis represents the generalized fractal dimension D(q), which characterizes the structural complexity and local variability of the PSD. The monotonically decreasing inverse sigmoidal curves indicate pronounced heterogeneity and multifractal behavior of the pore systems. All parameters are dimensionless.
ΔD−10, ΔD10, Δτ(−10), and Δτ(10) are respectively defined as max(D−10) − min(D−10), max(D10) − min(D10), max(τ(−10)) − min(τ(−10)), and max(τ(10)) − min(τ(10)), with their corresponding values for each pore size listed in Table 4. The τ(q)-q and Dq-q curves of the coal samples exhibit significant branching differences (Figure 7 and Figure 8): in the micropore and mesopore ranges, ΔD−10 and Δτ(−10) are notably larger than ΔD10 and Δτ(10), indicating that the left branch (q < 0), representing low-probability regions, is broader, while the right branch (q > 0), representing high-probability regions, is narrower. The left branch exhibits a significant variation, indicating a significantly different PSD of smaller pores within the corresponding pore size ranges, whereas the right branch displays a gentle variation, which tends toward a straight line, reflecting a similar PSD of larger pores. By comparison, for the macropore range, the values of ΔD−10, Δτ(−10), ΔD10, and Δτ(10) are close to each other. This indicates that their τ(q)-q and Dq-q curves do not show the distinct “wide-left, narrow-right” morphology but instead approximate a “wide-left, wide-right” characteristic, suggesting that the PSDs of macropores exhibit significant differences for both relatively smaller and larger pores.
Table 4.
Branch parameters of the τ(q) − q and Dq − q curves for different pore size ranges. Here, ΔD−10 and ΔD10 denote the inter-sample ranges of D(q) at q = −10 and q = 10, respectively, while Δτ(−10) and Δτ(10) denote the inter-sample ranges of τ(q) at q = −10 and q = 10, respectively. All parameters are dimensionless.
3.4. Singularity Spectrum Characteristics of Coal Pores
The heterogeneity of the pore system and the distribution characteristics of high-and low-probability regions can be quantitatively characterized by the multifractal singularity spectrum [16,37]. The morphology and symmetry of the multifractal spectrum reflect the singularity information of the pore structure, which defines the concentration degree in physical quantity distribution at arbitrarily small scales [43]. All samples exhibit asymmetric inverted parabola-shaped multifractal spectra (Figure 9), each divisible into left and right branches: the left branch corresponds to the high-probability region with a rapidly ascending f(α), while the right branch represents the low-probability region characterized by a slowly descending f(α). The symmetry differences in the f(α) − α spectra further confirm the multifractal characteristics of the PSD. The symmetry of the singularity spectrum can also be quantified by the parameter Rd, calculated as follows [44,45]:
Figure 9.
Multifractal singularity spectrum f(α)−α of coal pores in different pore size ranges: (a) micropores characterized by LT-CO2A; (b) mesopores characterized by LT-N2A; (c) macropores characterized by HMIP. The x-axis represents the singularity strength α, and the y-axis represents the spectrum function f(α), i.e., the fractal dimension of the subset associated with α. The left branch corresponds to high-probability pore regions, whereas the right branch corresponds to low-probability pore regions. The asymmetry of the spectra reflects the degree of pore structure heterogeneity. All parameters are dimensionless.
When Rd > 0, the singularity spectrum exhibits a leftward-tilting trend, indicating that the system’s properties are predominantly controlled by high-probability regions; conversely, when Rd < 0, the spectrum shows a rightward-tilting trend, reflecting a more significant influence from low-probability regions. Based on the singularity spectrum symmetry parameters (Table 5), the Rd in the coal samples are >0, indicating that the PSD is primarily influenced by high-probability regions. Notably, the Rd for macropores is significantly higher, suggesting that the macropore distribution is extremely inhomogeneous, with pore volume being highly concentrated in localized areas, potentially forming the “hot spot” regions.
Table 5.
Multifractal parameters for different pore size ranges, where Mic represents micropores, Mes represents mesopores, and Mac represents macropores. All parameters are dimensionless.
4. Discussion
4.1. Multifractal Characteristics of Different Pore Sizes
In this study, pore heterogeneity is not represented by a single parameter, but is quantified using a combination of generalized dimension spectrum parameters and singularity spectrum parameters. Specifically, D1 and H mainly reflect the bulk homogeneity and connectivity of the PSD. In contrast, α0/ΔD/Δα mainly characterize local structural differences. Therefore, the “heterogeneity” discussed in this study includes not only the bulk coal, but also local concentration. Within the generalized dimension spectrum, key characteristic parameters include D0, D1, D2, and ΔD (the difference between D−10 and D10). D0 is an indicator that measures the number of nonempty boxes containing pores at different scales, independent of their specific distribution and merely reflecting the pore presence or absence within each box [16]. The D0 across the entire pore size range is one (Figure 8), indicating that every box contains pores, which satisfies the box-partition criterion in multifractal theory. D1 characterizes the homogeneity of PSD, with values approaching one indicating a more homogeneous pore system overall [46]. The D1 for micropores, mesopores, and macropores range from 0.766 to 0.925 (Table 5), with the relatively lower D1 of macropores indicating that their PSDs tend to concentrate in local parts of the coal mass, whereas micropores and mesopores exhibit more dispersed distribution characteristics. ΔD represents the pore structure variation degree from the lowest to the highest probability regions in local parts of the coal mass; a higher ΔD indicates a greater structure variation degree [16]. The comparison of ΔD—mesopores < micropores < macropores—indicates that macropores have the highest pore structure variation degree, while mesopores exhibit the lowest degree—a finding consistent with the morphology of the N2 adsorption–desorption isotherms. D2 can be further described by the Hurst exponent (H), which reflects the connectivity among pores [47,48]. The H for the coal samples is close to one, indicating a strong correlation between different pore sizes, and relatively favorable pore connectivity.
Within the singularity spectrum parameters, key characteristic parameters include α0, Rd, and Δα (the difference between α(−10) and α(10)). The α0 parameter can assess the local concentration of the dominant pore type (i.e., the pore types with the most prevalent singularity in space), where a higher α0 corresponds to greater variation in dominant pore volume, a narrower PSD range, and increased pore structure complexity [37]. Rd describes the symmetry of the singularity spectrum, reflecting the degree to which the PSD is influenced by high- or low-probability regions [45]. Rd > 0 indicates that the PSD is controlled by high-probability regions; a larger value signifies a greater influence from high-probability regions. Conversely, Rd < 0 indicates a distribution controlled by low-probability regions; a smaller value indicates a greater influence from low-probability regions. Δα and ΔD can be used to characterize the variation degree in pore structure from the lowest to the highest probability regions in local parts of the coal mass; a larger value indicates a greater pore structure variation degree [16,19].
Rd > 0 for all pore size ranges, indicating a significant influence of high-probability regions on the PSD (Table 5). Macropores exhibit lower H/D1 and higher α0/ΔD/Δα, whereas micropores and mesopores exhibit higher H/D1 with lower α0/ΔD/Δα, suggesting that macropores probably exhibit significant aggregation, resulting in inhomogeneous distribution and poorer connectivity; in contrast, micropores and mesopores display more homogeneous distribution and superior connectivity, which has been supported by the symmetry parameter Rd. The opposite trends observed between H/D1 and α0/ΔD/Δα indicate that simpler pore structures contribute to improved pore connectivity, and the connectivity generally increases as heterogeneity decreases, which aligns with previous research findings [4].
The detection ranges of LT-CO2A, LT-N2A, and HMIP differ, leading to differences in the revealed heterogeneity of pore structures. The heterogeneity indicated by HMIP is greater than that by the LT-CO2A, which in turn exceeds that by the LT-N2A, probably due to the contribution of macropores, whereas micropores and mesopores are relatively homogeneously distributed with macropores tending to be locally concentrated. LT-N2A primarily probes mesopores, HMIP targets macropores, and LT-CO2A covers the micropore range, with these three methods exhibiting minimal overlap in their respective pore size detection ranges [37]. Consequently, combining these techniques enables a more comprehensive characterization of the pore structure and its heterogeneity in coal samples.
4.2. Interrelationship Between Coal Deformation and Pore Multifractal Characteristics
4.2.1. Comparison of Micropore Characteristics in Various Deformed Coals
D1 characterizes the overall distribution homogeneity of the pore system, while H is a quantitative indicator of pore structure connectivity, and an increase in their values indicates that after coal deformation, the PSD becomes more homogeneous overall and the connectivity between pores as well as with the external environment is improved. Figure 10a indicates that with increasing CSI, both D1 and H show a significant upward trend (with correlation coefficients of 0.74 and 0.64, respectively). In the brittle deformation stage (CSI ≤ 45), tectonic action intensifies the irregularity and fragmentation of the original pores in the coal mass [49,50]. Under stress, weak points such as macropores and mesopores are prone to shear off; as these brittlely deformed points break into micropores, the original pore throats are damaged, accompanied by chemical bond rupture, ultimately forming a micropore network with shorter transport pathways [51]. These newly formed micropores, on one hand, increase local micropore concentration, while on the other hand, they probably slightly disperse the originally concentrated micropore distribution. Consequently, the overall homogeneity parameter (D1) and connectivity parameter (H) only increase slightly, remain unchanged, or even decrease. In the ductile deformation stage (CSI > 45), the mean values of H (0.931) and D1 (0.906) are significantly higher than those in the brittle deformation stage (CSI < 45), where H averages 0.920 and D1 averages 0.889. The coal mass elongation and flattening promote a more homogeneous spatial distribution of both residual and newly formed micropores, thereby enhancing the homogeneity of PSD. Additionally, during the ductile deformation stage, tectonic stress induces polycondensation of coal macromolecular structures, resulting in the directional alignment of aromatic lamellae, a reduction in interlayer spacing, and consequently, the generation of numerous micropores dominated by interlayer molecular pores [19]. This pore type exhibits homogeneous distribution and certain directionality, which helps reduce local differences in micropore structure, further enhancing their homogeneity and connectivity. As shown in Figure 10, when the CSI reaches 61.63, the numerous micropores generated by polycondensation significantly increase the H and D1 values, reaching their maximums of 0.941 and 0.917, respectively.
Figure 10.
Relationship between the CSI and multifractal parameters for micropores: (a) Relationship between CSI and H/D1/Rd; (b) Relationship between CSI and α0/ΔD/Δα. All parameters are dimensionless.
Rd indicates the symmetry of the singularity spectrum; α0 is used to assess the local concentration degree in the distribution of the dominant pore type, where a larger α0 indicates more significant fluctuation in the local distribution, a narrower distribution range, and the presence of localized pore concentration; ΔD and Δα jointly reflect the variation degree from the lowest to the highest probability regions. The analysis indicates a strong linear negative correlation between Rd and the CSI (Figure 10a), with a correlation coefficient of 0.82, whereas α0/ΔD/Δα exhibit inverted U-shaped relationships with the CSI (Figure 10b), showing lower correlation coefficients of 0.4, 0.36, and 0.35, respectively. The weaker correlation of α0/ΔD/Δα with the CSI is primarily because they are influenced not only by tectonic deformation but also by multiple factors such as maceral composition and ash content, often exhibiting certain fluctuations [36]. The initial increase and subsequent decrease in α0/ΔD/Δα suggest that the local micropore concentration degree first increases and then weakens. This is attributed to the fact that during the brittle deformation stage, tectonic stress induces shearing and fracturing within the coal mass, generating numerous new pores and resulting in a multimodal distribution of local pore spaces. For example, in the late stage of brittle deformation, sample S1 (with a CSI of 41.28) exhibits the highest values of α0/ΔD/Δα, reaching 1.454, 1.222, and 1.459, respectively. In the ductile deformation stage, the coal mass elongation and flattening make locally concentrated pores more spatially homogeneous. The strong transformation effect of tectonic stress on the coal mass is significant in this stage, causing the rates of decrease for α0/ΔD/Δα during ductile deformation to be faster than increase during brittle deformation; i.e., the decreasing slope is much larger than the increasing slope (Figure 10b). With the exception of S2, the Rd > 0 indicates that the micropore size distribution is primarily controlled by the high-probability region, and the influence of this region progressively diminishes with increasing the deformation degree. When the CSI > 61, the PSD becomes dominated by low-probability regions, which further indicates that intense tectonic deformation facilitates the homogenization of micropore distribution and the connectivity improvement.
4.2.2. Comparison of Mesopore Characteristics in Various Deformed Coals
Figure 11 indicates that the CSI exhibits an inverted U-shaped relationship with H and D1 (with correlation coefficients of 0.80 and 0.60, respectively), while it shows a U-shaped relationship with Rd (correlation coefficient of 0.52). This indicates that with increasing the coal deformation degree, both pore connectivity and distribution homogeneity initially increase and then decrease, a trend consistent with previous studies [49], and is accompanied by the phenomenon that the influence of the high-probability region weakens during brittle deformation but intensifies during ductile deformation. The trend is closely related to the structural evolution mechanisms at different deformation stages. In the brittle deformation stage (CSI ≤ 45), tectonic stress induces vertical directional compression of mesopores [19], resulting in a more homogeneous pore structure with improved connectivity between mesopores. For example, in the late stage of brittle deformation, sample S1 (with the CSI of 41.28) exhibits the highest H and D1 values for mesopores, reaching 0.931 and 0.925, respectively. Upon entering the ductile deformation stage (CSI > 45), intense tectonic activity exerts a strong transformative effect [52], triggering microscopic deformations such as aromatic core dislocation and aromatic layer slippage, which generate numerous secondary structural defects dominated by micropores [53]; this process is accompanied by localized fragmentation, pulverization, and even ductile flow of the coal mass, ultimately leading to the larger mesopore formation. Simultaneously, secondary structural defects interconnect under stress and evolve into mesopores [19], thereby amplifying the difference in the mesopore structure, which leads to increased complexity of the pore network and a reduction in both homogeneity and connectivity. Additionally, coal deformation causes coal metamorphism, resulting in the generation of abundant thermogenic pores (10–50 nm) that are susceptible to blockage, thereby further impairing mesopore connectivity [54].
Figure 11.
Relationship between the CSI and multifractal parameters for mesopores. All parameters are dimensionless.
4.2.3. Comparison of Macropore Characteristics in Various Deformed Coals
Figure 12 shows that the CSI exhibits inverted U-shaped relationships with Δα/ΔD/α0 with correlation coefficients of 0.70, 0.66, and 0.43, respectively, indicating that the three parameters initially increase and then decrease with increasing deformation. In the brittle deformation stage, tectonic processes exacerbate the irregularity and fragmentation of the original macropores in the coal, leading to increased structural complexity [49,50]. Specifically, tectonic stress induces destroy and deformation in the coal mass, forming structures such as breccia, granules, and slickensides, which in turn develop numerous associated pores and fissures. The pore sizes are predominantly concentrated within the 100–10,000 nm range, falling into the macropore [53]. The introduction of these newly formed macropores significantly increases the complexity in local parts of the coal mass, enhances the local concentration, and consequently intensifies the local heterogeneity. For example, in the late stage of brittle deformation, sample S1 (with the CSI of 41.28) exhibits the highest values of α0/ΔD/Δα, reaching 1.541, 1.408, and 1.642, respectively. Multifractal analysis results indicate that macropores in both undeformed-brittle and ductile coals exhibit distinct concentration characteristics. As the coal enters the ductile deformation stage, the coal mass undergoes softening accompanied by elongated deformation, leading to a reduction in the heterogeneity of macropores compared to the brittle deformation stage. However, the heterogeneity of macropores remains significantly stronger than micropores and mesopores. For example, in the ductile deformation stage, the average values of α0/ΔD/Δα for macropores (1.460, 1.283, and 1.514, respectively) are higher than those for micropores (1.355, 1.008, and 1.228) and mesopores (1.193, 0.798, and 0.999). Considering the bulk coal, there is no clear correlation between the connectivity and homogeneity of macropore and the deformation. This indicates that during tectonic deformation, the localized formation of new macropores enhances pore size heterogeneity in local parts of the coal mass; however, such deformation also shears macropores into mesopores and micropores, while the infilling of the coal fines and associated chemical interactions with the coal mass further reduce the proportion of macropores, thereby diminishing the overall homogeneity of the macropore and resulting in an indistinct relationship between the homogeneity of the macropore and deformation for bulk coal.
Figure 12.
Relationship between the CSI and multifractal parameters for macropores. All parameters are dimensionless.
For the macropore range, the multifractal parameters (α0/ΔD/Δα) evaluating the local parts of the coal mass show better correlation with the CSI; however, their correlation coefficients are significantly lower for the micropore and mesopore (Figure 10, Figure 11 and Figure 12). This indicates that the CSI has a smaller influence on the local PSD of micropores and mesopores, but a greater influence on the local macropores’ PSD. The multifractal parameters H/D1/Rd for bulk coal exhibit different trends across different pore size ranges: in the micropore range, increasing CSI leads to more homogeneous distribution and improved connectivity; in the mesopore range, both connectivity and homogeneity initially increase and then decrease with rising CSI; whereas in the macropore range, no clear trend is observed for overall pore connectivity and homogeneity. Figure 13 illustrates the influence of vitrinite reflectance (Ro), maceral composition, Aad, and FCad on the different pore sizes, with the most pronounced effect and strongest correlation observed for micropores (average correlation coefficient of 0.44), an intermediate effect for mesopores (average correlation coefficient of 0.31), and the weakest influence on macropores (average correlation coefficient of 0.24). Since Pearson correlation analysis primarily examines linear relationships, and in conjunction with Figure 10, Figure 11 and Figure 12, it can be concluded that multiple factors—including Ro, maceral composition, Aad, FCad, and deformation intensity—collectively influence the PSD for bulk coal; however, in local parts of the coal mass, macropores are predominantly affected by tectonic activity, while micropores and mesopores are similarly affected by the combination of these factors.
Figure 13.
Pearson correlation coefficients between petrographic characteristics and multifractal parameters for different pore sizes. All correlation coefficients are dimensionless.
4.3. Influence of Pore Fractal Characteristics and Coal Deformation on Hydraulic Fracturing
Hydraulic fracturing, as a primary technique for CBM extraction, generates and propagates artificial fracture networks whose pathways are governed by the coal’s inherent pore-fissure system. Therefore, a detailed investigation of how coal pore structure characteristics influence fracture morphology and breakdown pressure holds key guidance for optimizing fracturing design and enhancing productivity.
4.3.1. Relationship Between Multifractal Characteristics and Types of Fracturing Curves
Key fracturing parameters, including pressure, displacement, and sand ratio, reflect fracture connectivity and propagation behavior within the reservoir, and when analyzed with the treatment logs, they allow for further assessing human-induced impacts on stimulation effectiveness. The formation of high-conductivity fractures requires that the fractures created by fracturing have sufficient length and that the proppant can effectively support the formation. Therefore, the fracturing curve during the sand injection process intuitively reflects the effectiveness of the fracturing and directly determines the gas production capacity of the well.
The S1 and S2 were collected from the same perforation interval in W1, while S4 and S5 were taken from different fracturing perforation intervals in W3. Therefore, the study involved a total of six wells. During the analysis, engineering factors such as fracturing fluid volume and proppant type were not considered. To minimize the influence of subjective human factors, the analysis of fracturing curves focuses on pressure variations during the normal sand injection stage, where curves with a pressure fluctuation amplitude of <4 MPa are classified as stable-type curves [22,55]. Based on the criteria, fracturing curves can be categorized into four types: stable, declining, rising, and fluctuating [22]. The gas production performance corresponding to different curve types shows significant differences, generally following the order: declining type> stable type > rising type > fluctuating type [55].
No stable-type curves were observed in the wells (Figure 14); therefore, the analysis focuses on the multifractal characteristics corresponding to the declining, rising, and fluctuating curve types. Figure 15 indicates that for the macropore, the declining-type curves exhibit lower D1, while the rising- and fluctuating-type curves show higher and relatively similar D1. ΔD and Δα display a similar pattern: they are significantly higher for the declining type and lower for the other two types. The declining-type curves exhibit higher ΔD and Δα, along with a lower D1, indicating stronger heterogeneity in the region with the highest macropore concentration and a slightly lower homogeneity compared to the other two types. This is because hydraulic fracturing aims to create dominant fractures with extensive propagation and stability. During the fracturing process, macropores act as stress-weak points and are prone to becoming the initiation points of primary fractures [56]. The higher ΔD and Δα, the more concentrated the PSD in the highest probability regions, indicating locally enriched pore volume and the potential existence of significant “hot spots”. Under such conditions, fracturing operations are more probably to generate main fractures from these macropore concentrations, facilitating the effective ingress of fracturing fluid and thereby promoting further fracture propagation; consequently, enhanced heterogeneity in the highest probability macropore regions contributes to improved hydraulic fracturing effectiveness. In contrast, the rising-type and fluctuating-type curves exhibit higher D1, indicating a more homogeneous macropore distribution, which disperses stress across multiple macropore concentration regions and thereby promotes the generation of numerous branch fractures alongside the main fracture. These branch fractures have limited propagation, which can weaken the extension length and stability of the main fracture, hindering the formation of long, stable fracture networks and ultimately affecting gas production performance. Consequently, the fractal parameters for these two curve types are correspondingly lower.
Figure 14.
Representative hydraulic fracturing curves for different curve types, showing pressure (MPa), sand ratio (%), and displacement (m3/min): (a) declining type, S1 + S2 (W1), S4 (W3); (b) rising type, S5 (W3), S8 (W6); (c) fluctuating type, S3 (W2), S6 (W4), S7 (W5).
Figure 15.
Relationship between hydraulic fracturing curve types and multifractal parameters for different pore sizes. D, declining type; R, rising type; F, fluctuating type. All parameters are dimensionless.
No clear pattern was observed between the multifractal parameters for the mesopore and micropore and the fracturing effectiveness (Figure 15). This is primarily because micropores and mesopores contribute relatively limited direct gas production, while during hydraulic fracturing, coal fracturing is more susceptible to occurring within stress-weak regions enriched with macropores. Therefore, the characteristics of the micropore and mesopore size distribution have a minor influence on the actual fracturing behavior and fracture propagation.
As the deformation degree increases, the heterogeneity of the highest probability macropore regions shows a trend of initially increasing slowly and then decreasing rapidly (Figure 12). When the CSI is 41, the coal is in the cataclastic coal stage and its heterogeneity reaches its peak; as the CSI increases to 45, the coal texture enters the granulated coal stage and heterogeneity begins to decline rapidly; by the time the CSI reaches 55, the intensified deformation results in a heterogeneity significantly lower than that of the undeformed coal. Since stronger heterogeneity in the highest probability macropore regions is more favorable for enhancing the gas production effectiveness of hydraulic fracturing, cataclastic coal is the most suitable for hydraulic fracturing, followed by undeformed coal, while granulated coal yields the poorest fracturing performance.
Cataclastic coal is characterized by relatively well-developed natural fractures and commonly tends to form long and stable artificial fractures during hydraulic fracturing [33]. Its treatment curves are generally of the declining type, and the resulting fracture network is favorable for sustained and efficient CBM production. In contrast, undeformed coal contains fewer natural fractures, and fracture propagation requires higher treatment pressure. Moreover, hydraulic fractures in undeformed coal are more likely to propagate vertically and generate branch fractures [57], commonly forming a fracture geometry characterized by “a long main fracture accompanied by surrounding branch fractures”. Accordingly, its fracturing curves are generally of the stable type. Although granulated coal also exhibits relatively developed natural fractures, its mechanical strength is relatively low. Consequently, hydraulic fractures tend to propagate multi-directionally along surrounding fractures, making it difficult for them to form a stable and long main fracture. Meanwhile, coal fines are prone to blocking the fractures, and their fracturing curves therefore commonly exhibit rising or fluctuating patterns [22].
4.3.2. Relationship Between Multifractal Characteristics and Breakdown Pressure
During hydraulic fracturing, fractures tend to initiate and propagate preferentially from regions rich in macropores, suggesting a certain correlation between the multifractal characteristics of macropores and the breakdown pressure. To quantitatively analyze this relationship, this study employs the Hubbert–Willis equation to estimate the breakdown pressure, with the specific expression as follows [58]:
In the equation: is the breakdown pressure; σh is the minimum horizontal principal stress; σH is the maximum horizontal principal stress; T is the tensile strength of the rock.
Since the burial depths of the selected coal seams range from 2151 m to 2308 m, showing only minor variation, the influence of depth on in situ stress was not considered in the analysis.
Parameters such as the ΔD/Δα/α0 can reflect the local concentration in the PSD from different perspectives. Larger ΔD/Δα/α0 indicate a stronger variation in local pore distribution and higher local heterogeneity. The correlation analysis results show that the breakdown pressure has a weak correlation with the multifractal parameters of micropores and mesopores, but a relatively strong correlation with the parameters of macropores (Figure 16). Specifically, the breakdown pressure shows a significant negative correlation with α0/ΔD/Δα, with correlation coefficients of 0.51, 0.61, and 0.59, respectively. The above relationships indicate that the breakdown pressure is primarily controlled by the distribution of macropores: the stronger the local heterogeneity of macropores, the lower the breakdown pressure. This is because during hydraulic fracturing, fractures tend to initiate from structurally weak regions within the coal mass [56], and the localized macropore concentration creates such local structural weaknesses, thereby promoting the initiation and propagation of fractures. In contrast, the weak regions formed by micropores and mesopores are extremely small, so their influence on breakdown pressure is not significant. In summary, the local heterogeneity of macropores plays a dominant role in the breakdown pressure during hydraulic fracturing, while the influence of micropores and mesopores is relatively limited.
Figure 16.
Relationship between multifractal parameters of macropores and breakdown pressure.
5. Conclusions
Based on LT-CO2A (<2 nm), LT-N2A (2–50 nm), and HMIP (>50 nm), this study achieved a multi-scale characterization of coal pore structure. By integrating multifractal theory and the CSI, the correlation between coal fractal characteristics and the coal deformation was thoroughly investigated, and its influence on hydraulic fracturing effectiveness was further analyzed. The main conclusions are as follows:
- (1)
- The macropore’s PSD exhibits a higher localized concentration degree, tending to form concentration phenomena in space, with relatively inhomogeneous distribution and poor connectivity. In contrast, micropores and mesopores demonstrate relatively homogeneous distribution characteristics and better connectivity. In terms of the heterogeneity reflected by different testing methods, the pore structure characterized by HMIP shows the strongest heterogeneity, followed by LT-CO2A, while LT-N2A exhibits the weakest heterogeneity.
- (2)
- With increasing coal deformation, the heterogeneity of pore systems at different pore size ranges exhibits different variation patterns at both the bulk coal and local parts of the coal mass, rather than following a uniform trend. For micropores, intense deformation facilitates the distribution homogenization and improved connectivity for bulk coal; in local parts of the coal mass, however, the pore concentration follows an inverted U-shaped trend, which is collectively governed by the combined effects of deformation intensity, maturity and composition. For mesopores, both pore connectivity and homogeneity for bulk coal also show an inverted U-shaped trend with increasing deformation, a pattern closely linked to the directional compression of pores during the brittle deformation stage and the interconnection of secondary defects alongside the generation of thermogenic pores in the ductile deformation stage. For macropores, no clear pattern is observed for bulk coal, while in local parts of the coal mass their concentration also follows an inverted U-shaped trend with increasing deformation, a mechanism attributable to the development of associated pores and fissures during brittle deformation, as well as the softening and extensional deformation of the coal mass in the ductile deformation stage.
- (3)
- Considering the bulk coal, the PSD is jointly regulated by multiple factors including maturity, composition, and deformation intensity, while in local parts of the coal mass, the macropore’s distribution is significantly influenced by the deformation intensity, whereas the distributions of mesopores and micropores are governed by the synergistic effects of multiple factors. Enhanced local heterogeneity of macropores contributes to improved hydraulic fracturing effectiveness and plays a dominant controlling role in breakdown pressure. In contrast, the distribution characteristics of micropores and mesopores have a relatively limited influence on actual fracture formation and propagation during the fracturing process. Cataclastic coal exhibits the strongest local heterogeneity in macropores, making it the most suitable for hydraulic fracturing, followed by undeformed coal, while granulated coal demonstrates the least effective fracturing performance.
Author Contributions
Y.W.: Writing—original draft, Writing—review and editing, Supervision, Resources, Methodology, Funding acquisition, Formal analysis. Q.Z.: Writing—original draft, Validation, Methodology, Investigation. X.H.: Writing—review and editing, Data curation, Conceptualization. G.Z.: Writing—review and editing, Resources, Project administration. J.Q.: Writing—review and editing, Validation, Software. H.M.: Writing—review and editing, Visualization. All authors have read and agreed to the published version of the manuscript.
Funding
This research was supported by the Natural Science Foundation of Anhui Province (No. 2508085MD074 and 2508085MD073), the Fundamental Research Funds for the Central Universities (JZ2023HGTA0177 and JZ2023HGQA0146), and the University-industry collaboration project (W2025JSFW1206).
Data Availability Statement
Data will be made available on request.
Conflicts of Interest
Author Yingjin Wang was employed by Chuzhou Yantu Technology Co., Ltd. The remaining authors declare that the research was conducted in the absence of any commercial or financial relationships that could be construed as a potential conflict of interest.
Abbreviations
The following abbreviations are used in this manuscript:
| CBM | Coalbed methane |
| PSD | Pore size distribution |
| CSI | Coal Structure Index (dimensionless) |
| LT-CO2A | Low-temperature CO2 adsorption |
| LT-N2A | Low-temperature N2 adsorption |
| HMIP | High-pressure mercury intrusion porosimetry |
| T2 | Transverse relaxation time (ms) |
| NMR | Nuclear magnetic resonance |
| AE | Acoustic emission |
| GSI | Geological Strength Index (dimensionless) |
| DFT | Density Functional Theory |
| SSA | Specific surface area (m2/g) |
| BET | Brunauer–Emmett–Teller |
| BJH | Barrett–Joyner–Halenda |
| SCR | Surface Condition Rating (dimensionless) |
| BDI | Brittle Deformation Index (dimensionless) |
| DDI | Ductile Deformation Index (dimensionless) |
| CSD | Coal Strength Designation (dimensionless) |
| H | Hurst exponent (dimensionless) |
| Ro,max | Maximum vitrinite reflectance (%) |
| Mad | Moisture content (%) |
| Vad | Volatile matter yield (%) |
| Aad | Ash yield (%) |
| FCad | Fixed carbon content (%) |
| Vtotal | Total pore volume (mL/g) |
| Stotal | Total specific surface area (m2/g) |
| VBJH | BJH total pore volume (mL/g) |
| SBET | BET-specific surface area (m2/g) |
| Mic | Micropores |
| Mes | Mesopores |
| Mac | Macropores |
| D | Declining type |
| R | Rising type |
| F | Fluctuating type |
References
- Yang, L.; Zou, G.; Wang, X.; Xie, S.; Yin, Y. Fractional Order Derivative Models of Porosity on Physical Fractal Spaces. Fractal Fract. 2026, 10, 118. [Google Scholar] [CrossRef] [Scilit]
- Li, Z.; Liu, D.; Wang, Y.; Si, G.; Cai, Y.; Wang, Y. Evaluation of Multistage Characteristics for Coalbed Methane Desorption-Diffusion and Their Geological Controls: A Case Study of the Northern Gujiao Block of Qinshui Basin, China. J. Pet. Sci. Eng. 2021, 204, 108704. [Google Scholar] [CrossRef] [Scilit]
- Cheng, G.; Jiang, B.; Li, M.; Li, F.; Song, Y. Effects of Pore-Fracture Structure of Ductile Tectonically Deformed Coals on Their Permeability: An Experimental Study Based on Raw Coal Cores. J. Pet. Sci. Eng. 2020, 193, 107371. [Google Scholar] [CrossRef] [Scilit]
- Hao, J.; Li, Y. Research on Multi-Scale Fractal Characteristics of Pore Structure in Tectonic Coal and Analysis of Its Influence Factors. Coal Sci. Technol. 2020, 48, 164–174. [Google Scholar] [CrossRef]
- Ghaderi, A.; Taheri-Shakib, J.; Sharifnik, M.A. The Effect of Natural Fracture on the Fluid Leak-Off in Hydraulic Fracturing Treatment. Petroleum 2019, 5, 85–89. [Google Scholar] [CrossRef] [Scilit]
- Wang, Q.; Wang, Y.; Wang, R.; Zhao, J.; Hu, Y.; Zhao, J. Evolution Law of Stress Induced by Pressure Depletion in Fractured Shale Reservoirs: Implications for Subsequent Refracturing and Infill Well Development. Petroleum 2025, 11, 71–83. [Google Scholar] [CrossRef] [Scilit]
- Wang, D.; Hu, H.; Wang, T.; Tang, T.; Li, W.; Zhu, G.; Chen, X. Difference between of Coal and Shale Pore Structural Characters Based on Gas Adsorption Experiment and Multifractal Analysis. Fuel 2024, 371, 132044. [Google Scholar] [CrossRef] [Scilit]
- Aborafia, R.; Dehaghani, A.H.S. Investigating the Phase Behavior of Methane, Ethane and Their Binary Mixture Confined in a 5 Nm Slit-Like-Pore with Different Wall Types: Monte Carlo Simulation Study. Petroleum 2025, 11, 744–756. [Google Scholar] [CrossRef] [Scilit]
- San José Martínez, F.; Martín, M.A.; Caniego, F.J.; Tuller, M.; Guber, A.; Pachepsky, Y.; García-Gutiérrez, C. Multifractal Analysis of Discretized X-Ray CT Images for the Characterization of Soil Macropore Structures. Geoderma 2010, 156, 32–42. [Google Scholar] [CrossRef] [Scilit]
- Wang, Y.; Cheng, H.; Hu, Q.; Liu, L.; Jia, L.; Gao, S.; Wang, Y. Pore Structure Heterogeneity of Wufeng-Longmaxi Shale, Sichuan Basin, China: Evidence from Gas Physisorption and Multifractal Geometries. J. Pet. Sci. Eng. 2022, 208, 109313. [Google Scholar] [CrossRef] [Scilit]
- Bogahawaththa, M.; Mohotti, D.; Wijesooriya, K.; Lee, C.K. Impact of Polyurethane (PU) Infill on the Energy Absorption Efficiency of 3D-Printed Metallic Menger Fractal Structures. Thin-Walled Struct. 2026, 218, 114045. [Google Scholar] [CrossRef] [Scilit]
- Mollinedo, H.; Pineda León, E.; De-León, D.; Kryvko, A.; Miguel-Andrés, I.; Samayoa, D.; Damián-Adame, L. The Fractal Timoshenko Beam Equation. Fractal Fract. 2026, 10, 65. [Google Scholar] [CrossRef] [Scilit]
- Vita, M.C.; De Bartolo, S.; Fallico, C.; Veltri, M. Usage of Infinitesimals in the Menger’s Sponge Model of Porosity. Appl. Math. Comput. 2012, 218, 8187–8195. [Google Scholar] [CrossRef] [Scilit]
- Huillet, T.; Porzio, A.; Alaya, M.B. On Lévy Stable and Semistable Distributions. Fractals 2001, 9, 347–364. [Google Scholar] [CrossRef] [Scilit]
- Lv, R.; Zhu, Y.; Ma, X.; Ni, X.; Ren, J. Coupled Seepage Mechanics Model of Coal Containing Methane Based on Pore Structure Fractal Features. Fractal Fract. 2022, 6, 391. [Google Scholar] [CrossRef] [Scilit]
- Xue, S.; Han, F.; Zheng, C.; Liu, S.; Liu, B. Pore Multi-Fractal Characteristics of Coal under True Triaxial Tetrahydrofuran Hydraulic Injection. J. China Coal Soc. 2025, 50, 3252–3264. [Google Scholar] [CrossRef]
- Zheng, S.; Yao, Y.; Liu, D.; Cai, Y.; Liu, Y.; Li, X. Nuclear Magnetic Resonance T2 Cutoffs of Coals: A Novel Method by Multifractal Analysis Theory. Fuel 2019, 241, 715–724. [Google Scholar] [CrossRef] [Scilit]
- Yin, S.; Wang, E.; Li, Z.; Zang, Z.; Liu, X.; Zhang, C.; Ding, X.; Aihemaiti, A. Multifractal and B-Value Nonlinear Time-Varying Characteristics of Acoustic Emission for Coal with Different Impact Tendency. Measurement 2025, 248, 116896. [Google Scholar] [CrossRef] [Scilit]
- Guo, D.; Guo, X.; Li, D. Effects of Tectonic Deformation on Micropore-Mesopore of Bituminous Deformed Coal. J. China Coal Soc. 2019, 44, 3135–3144. [Google Scholar] [CrossRef]
- Bruno, M.S.; Nakagawa, F.M. Pore Pressure Influence on Tensile Fracture Propagation in Sedimentary Rock. Int. J. Rock Mech. Min. Sci. Geomech. Abstr. 1991, 28, 261–273. [Google Scholar] [CrossRef] [Scilit]
- Liu, Y.; Zheng, X.; Peng, X.; Zhang, Y.; Chen, H.; He, J. Influence of Natural Fractures on Propagation of Hydraulic Fractures in Tight Reservoirs during Hydraulic Fracturing. Mar. Pet. Geol. 2022, 138, 105505. [Google Scholar] [CrossRef] [Scilit]
- Zou, Q.; Wang, Y.; Zhou, G.; Hou, X. Logging-Based Quantitative Evaluation of Coal Deformation Using PCA-MLR Coupled with GSI: Implications for Hydraulic Fracturing Zoning in Structurally Controlled CBM Reservoirs. J. Appl. Geophys. 2026, 244, 106015. [Google Scholar] [CrossRef] [Scilit]
- Han, J.; Gao, M.; Wu, Y.; Raza, A.; He, P.; Li, J.; Lu, Y.; Yang, M.; Zhu, H. Experimental Study of Confining Pressure-Induced Fracture Network for Shale Gas Reservoir under Triaxial Compression Conditions. Fractal Fract. 2025, 9, 311. [Google Scholar] [CrossRef] [Scilit]
- Liu, X.; Zhang, J.; Li, T.; Liang, Z.; Meng, S.; Zheng, L.; Wu, N. Fracture Complexity and Mineral Damage in Shale Hydraulic Fracturing Based on Microscale Fractal Analysis. Fractal Fract. 2025, 9, 535. [Google Scholar] [CrossRef] [Scilit]
- Zhang, S.; Tang, S.; Tang, D.; Huang, W.; Pan, Z. Determining Fractal Dimensions of Coal Pores by FHH Model: Problems and Effects. J. Nat. Gas Sci. Eng. 2014, 21, 929–939. [Google Scholar] [CrossRef] [Scilit]
- Cai, Y.; Liu, D.; Zhang, K.; Elsworth, D.; Yao, Y.; Tang, D. Preliminary Evaluation of Gas Content of the No. 2 Coal Seam in the Yanchuannan Area, Southeast Ordos Basin, China. J. Pet. Sci. Eng. 2014, 122, 675–689. [Google Scholar] [CrossRef] [Scilit]
- Wang, H.; Xiang, J.; Deng, X.; Gao, W. Molecular Simulation of the Adsorption and Diffusion Properties of CH4 and CO2 in the Microporous System of Coal. Fuel 2024, 360, 130566. [Google Scholar] [CrossRef] [Scilit]
- Yu, S.; Bo, J.; Fengli, L.; Jiegang, L. Structure and Fractal Characteristic of Micro- and Meso-Pores in Low, Middle-Rank Tectonic Deformed Coals by CO2 and N2 Adsorption. Microporous Mesoporous Mater. 2017, 253, 191–202. [Google Scholar] [CrossRef] [Scilit]
- GB/T 19587-2017; Determination of the Specific Surface Area of Solids by Gas Adsorption Using the Bet Method. Standards Press of China: Beijing, China, 2017.
- Michot, L.J.; Villieras, F. Surface Area and Porosity. Dev. Clay Sci. 2006, 1, 965–978. [Google Scholar] [CrossRef] [Scilit]
- Barrett, E.P.; Joyner, L.G.; Halenda, P.P. The Determination of Pore Volume and Area Distributions in Porous Substances. I. Computations from Nitrogen Isotherms. J. Am. Chem. Soc. 1951, 73, 373–380. [Google Scholar] [CrossRef] [Scilit]
- GB/T 29171-2023; Rock Capillary Pressure Measurement. Standards Press of China: Beijing, China, 2023.
- Wang, Y.; Liu, D.; Cai, Y.; Yao, Y.; Pan, Z. Constraining Coalbed Methane Reservoir Petrophysical and Mechanical Properties through a New Coal Structure Index in the Southern Qinshui Basin, Northern China: Implications for Hydraulic Fracturing. AAPG Bull. 2020, 104, 1817–1842. [Google Scholar] [CrossRef] [Scilit]
- Hoek, E.; Brown, E.T. The Hoek–Brown Failure Criterion and GSI—2018 edition. J. Rock Mech. Geotech. Eng. 2019, 11, 445–463. [Google Scholar] [CrossRef] [Scilit]
- Salat, H.; Murcio, R.; Arcaute, E. Multifractal Methodology. Phys. A Stat. Mech. Its Appl. 2017, 473, 467–487. [Google Scholar] [CrossRef] [Scilit]
- Paz Ferreiro, J.; Vidal Vázquez, E. Multifractal Analysis of Hg Pore Size Distributions in Soils with Contrasting Structural Stability. Geoderma 2010, 160, 64–73. [Google Scholar] [CrossRef] [Scilit]
- Zhang, M.; Liu, Q.; Wang, X.; Dong, Z. Multiple Fractal Characterization of Medium-High Rank Coal Integrating Mercury Intrusion Porosimetry, N2 and CO2 Adsorption Experiments. J. China Coal Soc. 2024, 49, 2394–2404. [Google Scholar] [CrossRef]
- Halsey, T.C.; Jensen, M.H.; Kadanoff, L.P.; Procaccia, I.; Shraiman, B.I. Fractal Measures and Their Singularities: The Characterization of Strange Sets. Phys. Rev. A 1986, 33, 1141–1151. [Google Scholar] [CrossRef] [Scilit]
- Chhabra, A.; Jensen, R.V. Direct Determination of the f(α) Singularity Spectrum. Phys. Rev. Lett. 1989, 62, 1327–1330. [Google Scholar] [CrossRef] [Scilit]
- Zhao, P.; Wang, X.; Cai, J.; Luo, M.; Zhang, J.; Liu, Y.; Rabiei, M.; Li, C. Multifractal Analysis of Pore Structure of Middle Bakken Formation Using Low Temperature N2 Adsorption and NMR Measurements. J. Pet. Sci. Eng. 2019, 176, 312–320. [Google Scholar] [CrossRef] [Scilit]
- Ge, X.; Fan, Y.; Li, J.; Aleem Zahid, M. Pore Structure Characterization and Classification Using Multifractal Theory—An Application in Santanghu Basin of Western China. J. Pet. Sci. Eng. 2015, 127, 297–304. [Google Scholar] [CrossRef] [Scilit]
- Yu, X.; Xing, Z.; Xiang, X.; Zhai, C.; Cheng, Z.; Hong, L.; Regenauer-Lieb, K. Multifractal Characterization of Coal Deterioration Induced by Cyclic Hydraulic Pressure Based on the Acoustic Emission Test and X-Ray Microscopy. Energy Fuels 2024, 38, 14221–14234. [Google Scholar] [CrossRef] [Scilit]
- Guan, M.; Liu, X.; Jin, Z.; Lai, J. The Heterogeneity of Pore Structure in Lacustrine Shales: Insights from Multifractal Analysis Using N2 Adsorption and Mercury Intrusion. Mar. Pet. Geol. 2020, 114, 104150. [Google Scholar] [CrossRef] [Scilit]
- Liu, K.; Ostadhassan, M.; Zou, J.; Gentzis, T.; Rezaee, R.; Bubach, B.; Carvajal-Ortiz, H. Multifractal Analysis of Gas Adsorption Isotherms for Pore Structure Characterization of the Bakken Shale. Fuel 2018, 219, 296–311. [Google Scholar] [CrossRef] [Scilit]
- Wang, F.-Y.; Yang, K.; Zai, Y. Multifractal Characteristics of Shale and Tight Sandstone Pore Structures with Nitrogen Adsorption and Nuclear Magnetic Resonance. Pet. Sci. 2020, 17, 1209–1220. [Google Scholar] [CrossRef] [Scilit]
- Zhang, M.; Duan, C.; Li, G.; Fu, X.; Zhong, Q.; Liu, H.; Dong, Z. Determinations of the Multifractal Characteristics of the Pore Structures of Low-, Middle-, and High-Rank Coal Using High-Pressure Mercury Injection. J. Pet. Sci. Eng. 2021, 203, 108656. [Google Scholar] [CrossRef] [Scilit]
- Guoxi, C.; Bo, J.; Ming, L.; Fengli, L.; Shaochun, X. Quantitative Characterization of Fracture Structure in Coal Based on Image Processing and Multifractal Theory. Int. J. Coal Geol. 2020, 228, 103566. [Google Scholar] [CrossRef] [Scilit]
- Tong, Z.; Zhang, J.; Li, Z.; Wu, Y.; Wang, D.; Gong, D. Investigation of Organic-Shale Nanopores in the Lower Cambrian Niutitang Formation Using Low Temperature N2 and CO2 Adsorption: Multifractality and Classification. Microporous Mesoporous Mater. 2022, 337, 111935. [Google Scholar] [CrossRef] [Scilit]
- Yu, S.; Bo, J.; Pei, S.; Jiahao, W. Matrix Compression and Multifractal Characterization for Tectonically Deformed Coals by Hg Porosimetry. Fuel 2018, 211, 661–675. [Google Scholar] [CrossRef] [Scilit]
- Pan, J.; Niu, Q.; Wang, K.; Shi, X.; Li, M. The Closed Pores of Tectonically Deformed Coal Studied by Small-Angle X-Ray Scattering and Liquid Nitrogen Adsorption. Microporous Mesoporous Mater. 2016, 224, 245–252. [Google Scholar] [CrossRef] [Scilit]
- Duan, R.; Xu, Z.; Dong, Y.; Liu, W. Characterization and Classification of Pore Structures in Deeply Buried Carbonate Rocks Based on Mono- and Multifractal Methods. J. Pet. Sci. Eng. 2021, 203, 108606. [Google Scholar] [CrossRef] [Scilit]
- Zhang, K.; Zou, A.; Wang, L.; Cheng, Y.; Li, W.; Liu, C. Multiscale Morphological and Topological Characterization of Coal Microstructure: Insights into the Intrinsic Structural Difference Between Original and Tectonic Coals. Fuel 2022, 321, 124076. [Google Scholar] [CrossRef] [Scilit]
- Li, Y.; Zhang, Y.; Zhang, L.; Hou, J. Characterization on Pore Structure of Tectonic Coals Based on the Method of Mercury Intrusion, Carbon Dioxide Adsorption and Nitrogen Adsorption. J. China Coal Soc. 2019, 44, 1188–1196. [Google Scholar] [CrossRef]
- Li, Y.; Zhang, C.; Tang, D.; Gan, Q.; Niu, X.; Wang, K.; Shen, R. Coal Pore Size Distributions Controlled by the Coalification Process: An Experimental Study of Coals from the Junggar, Ordos and Qinshui Basins in China. Fuel 2017, 206, 352–363. [Google Scholar] [CrossRef] [Scilit]
- Xiao, C.; Chen, Z.; Jin, X. Coal Structure Model and Fracturing Effect of Yanchuannan Coalbed Gas Field. Coal Sci. Technol. 2021, 49, 38–46. [Google Scholar] [CrossRef]
- Dong, F.; Yin, H.; Ren, H.; Cheng, W.; Tai, S.; Miao, T.; Zhang, Y.; Wu, B. Trapezoidal Failure Behavior and Fracture Evolution Mechanism of Overburden in Extra-Thick Coal Mining in Weakly Cemented Strata. Rock Mech. Rock Eng. 2024, 57, 11239–11260. [Google Scholar] [CrossRef] [Scilit]
- Liu, J.; Yao, Y.; Liu, D.; Xu, L.; Elsworth, D.; Huang, S.; Luo, W. Experimental Simulation of the Hydraulic Fracture Propagation in an Anthracite Coal Reservoir in the Southern Qinshui Basin, China. J. Pet. Sci. Eng. 2018, 168, 400–408. [Google Scholar] [CrossRef] [Scilit]
- Ljunggren, C.; Amadei, B. Estimation of Virgin Rock Stresses from Horizontal Hydrofractures. Int. J. Rock Mech. Min. Sci. Geomech. Abstr. 1989, 26, 69–78. [Google Scholar] [CrossRef] [Scilit]
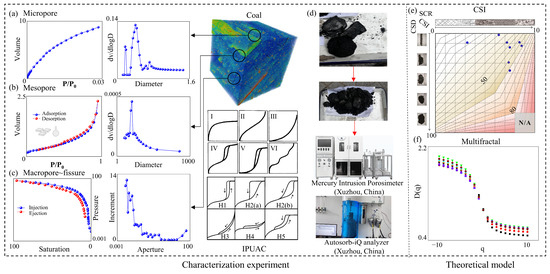
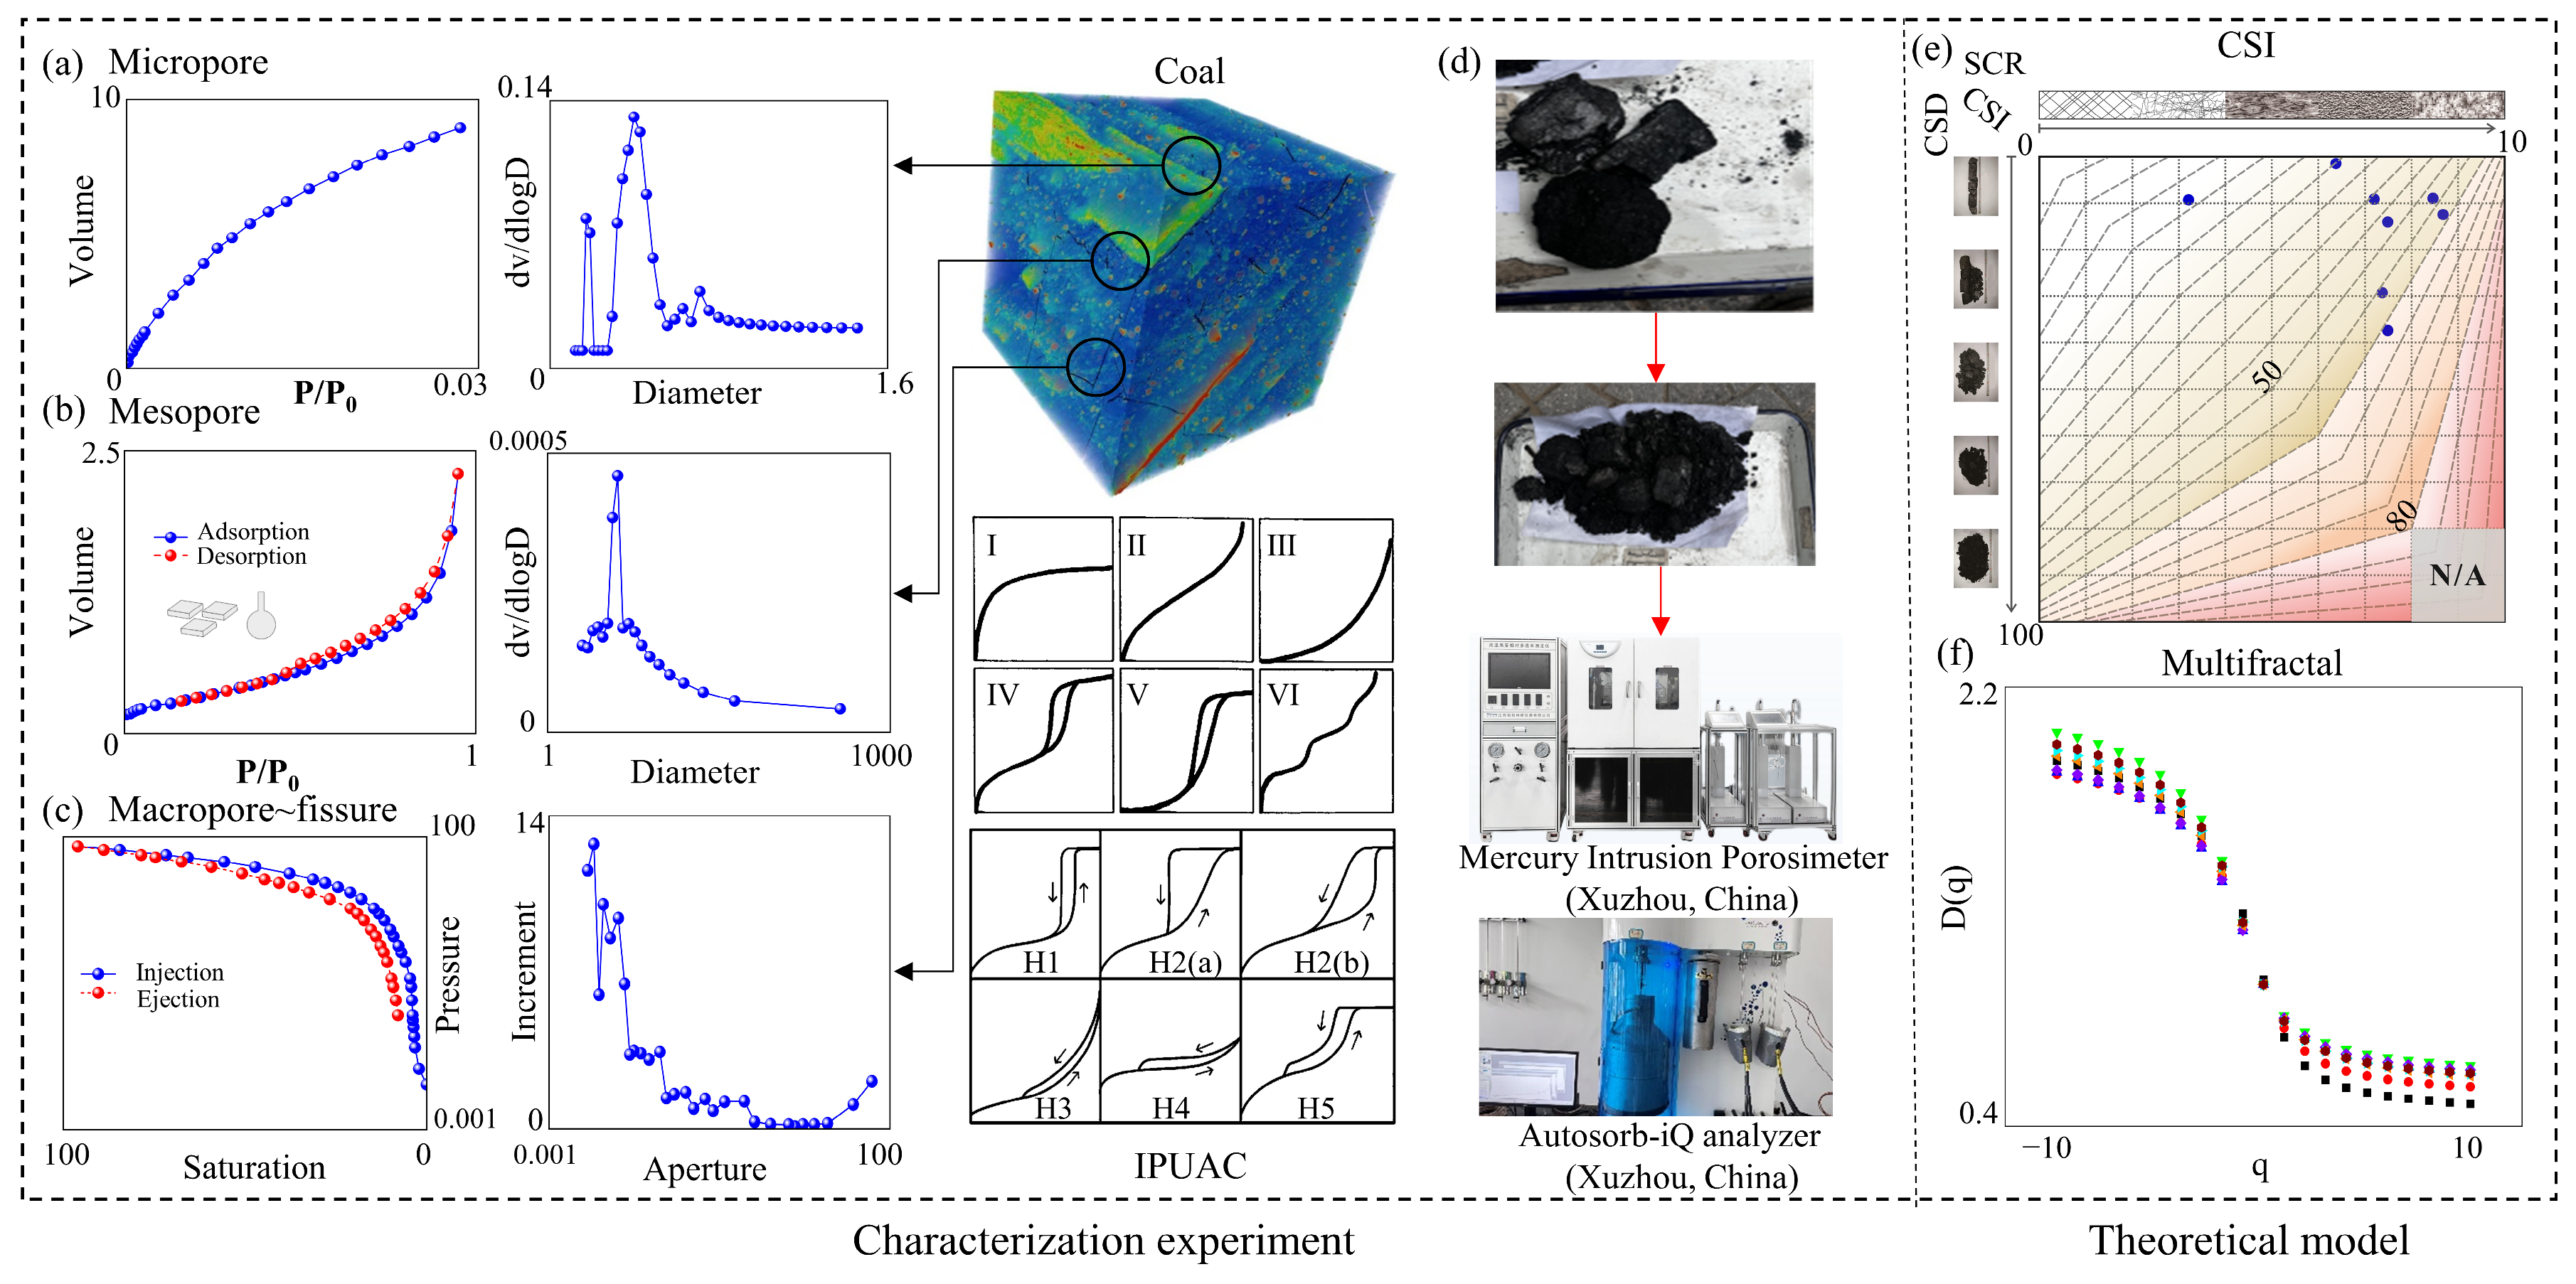
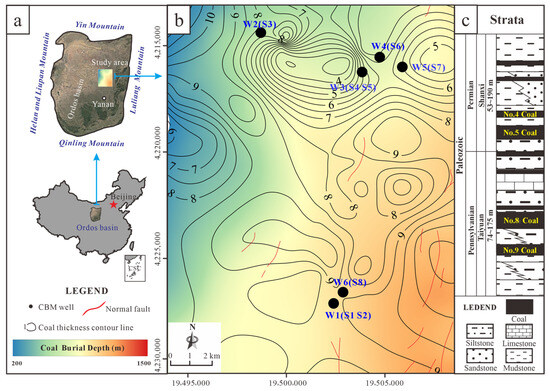
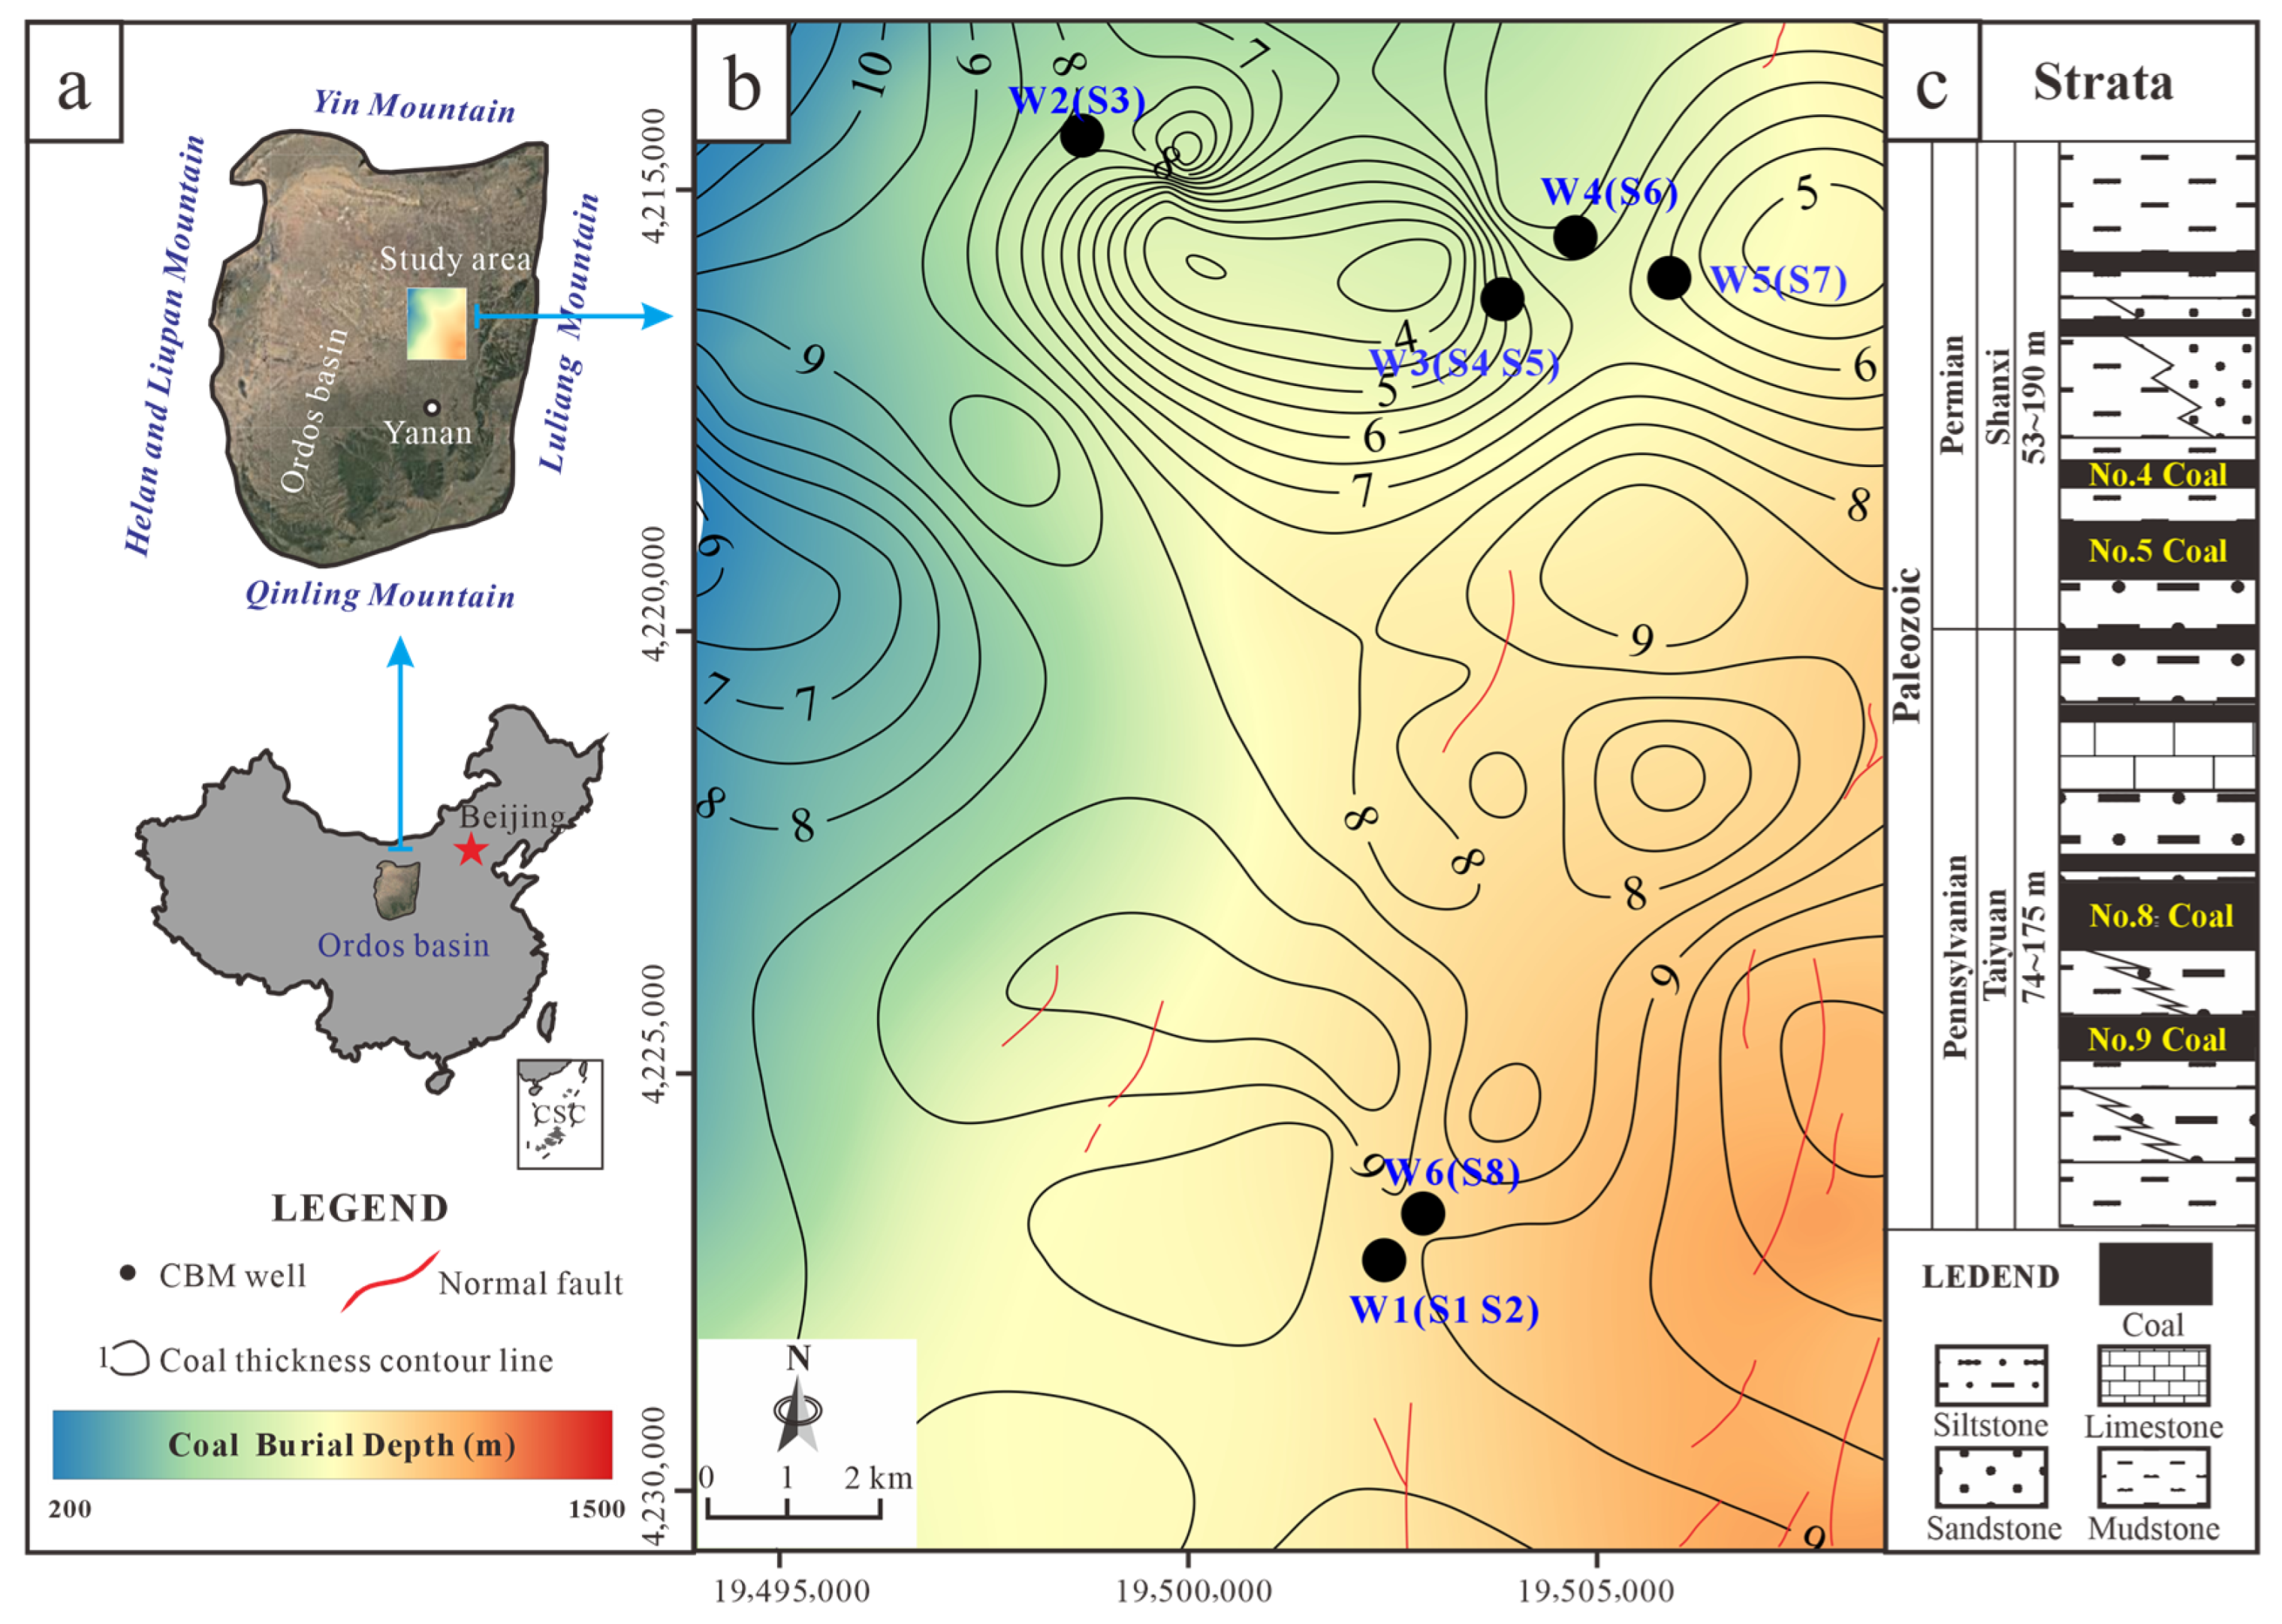
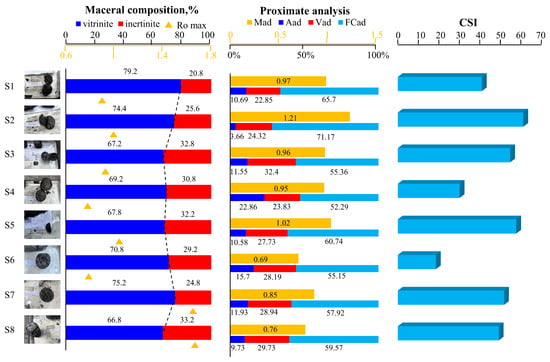
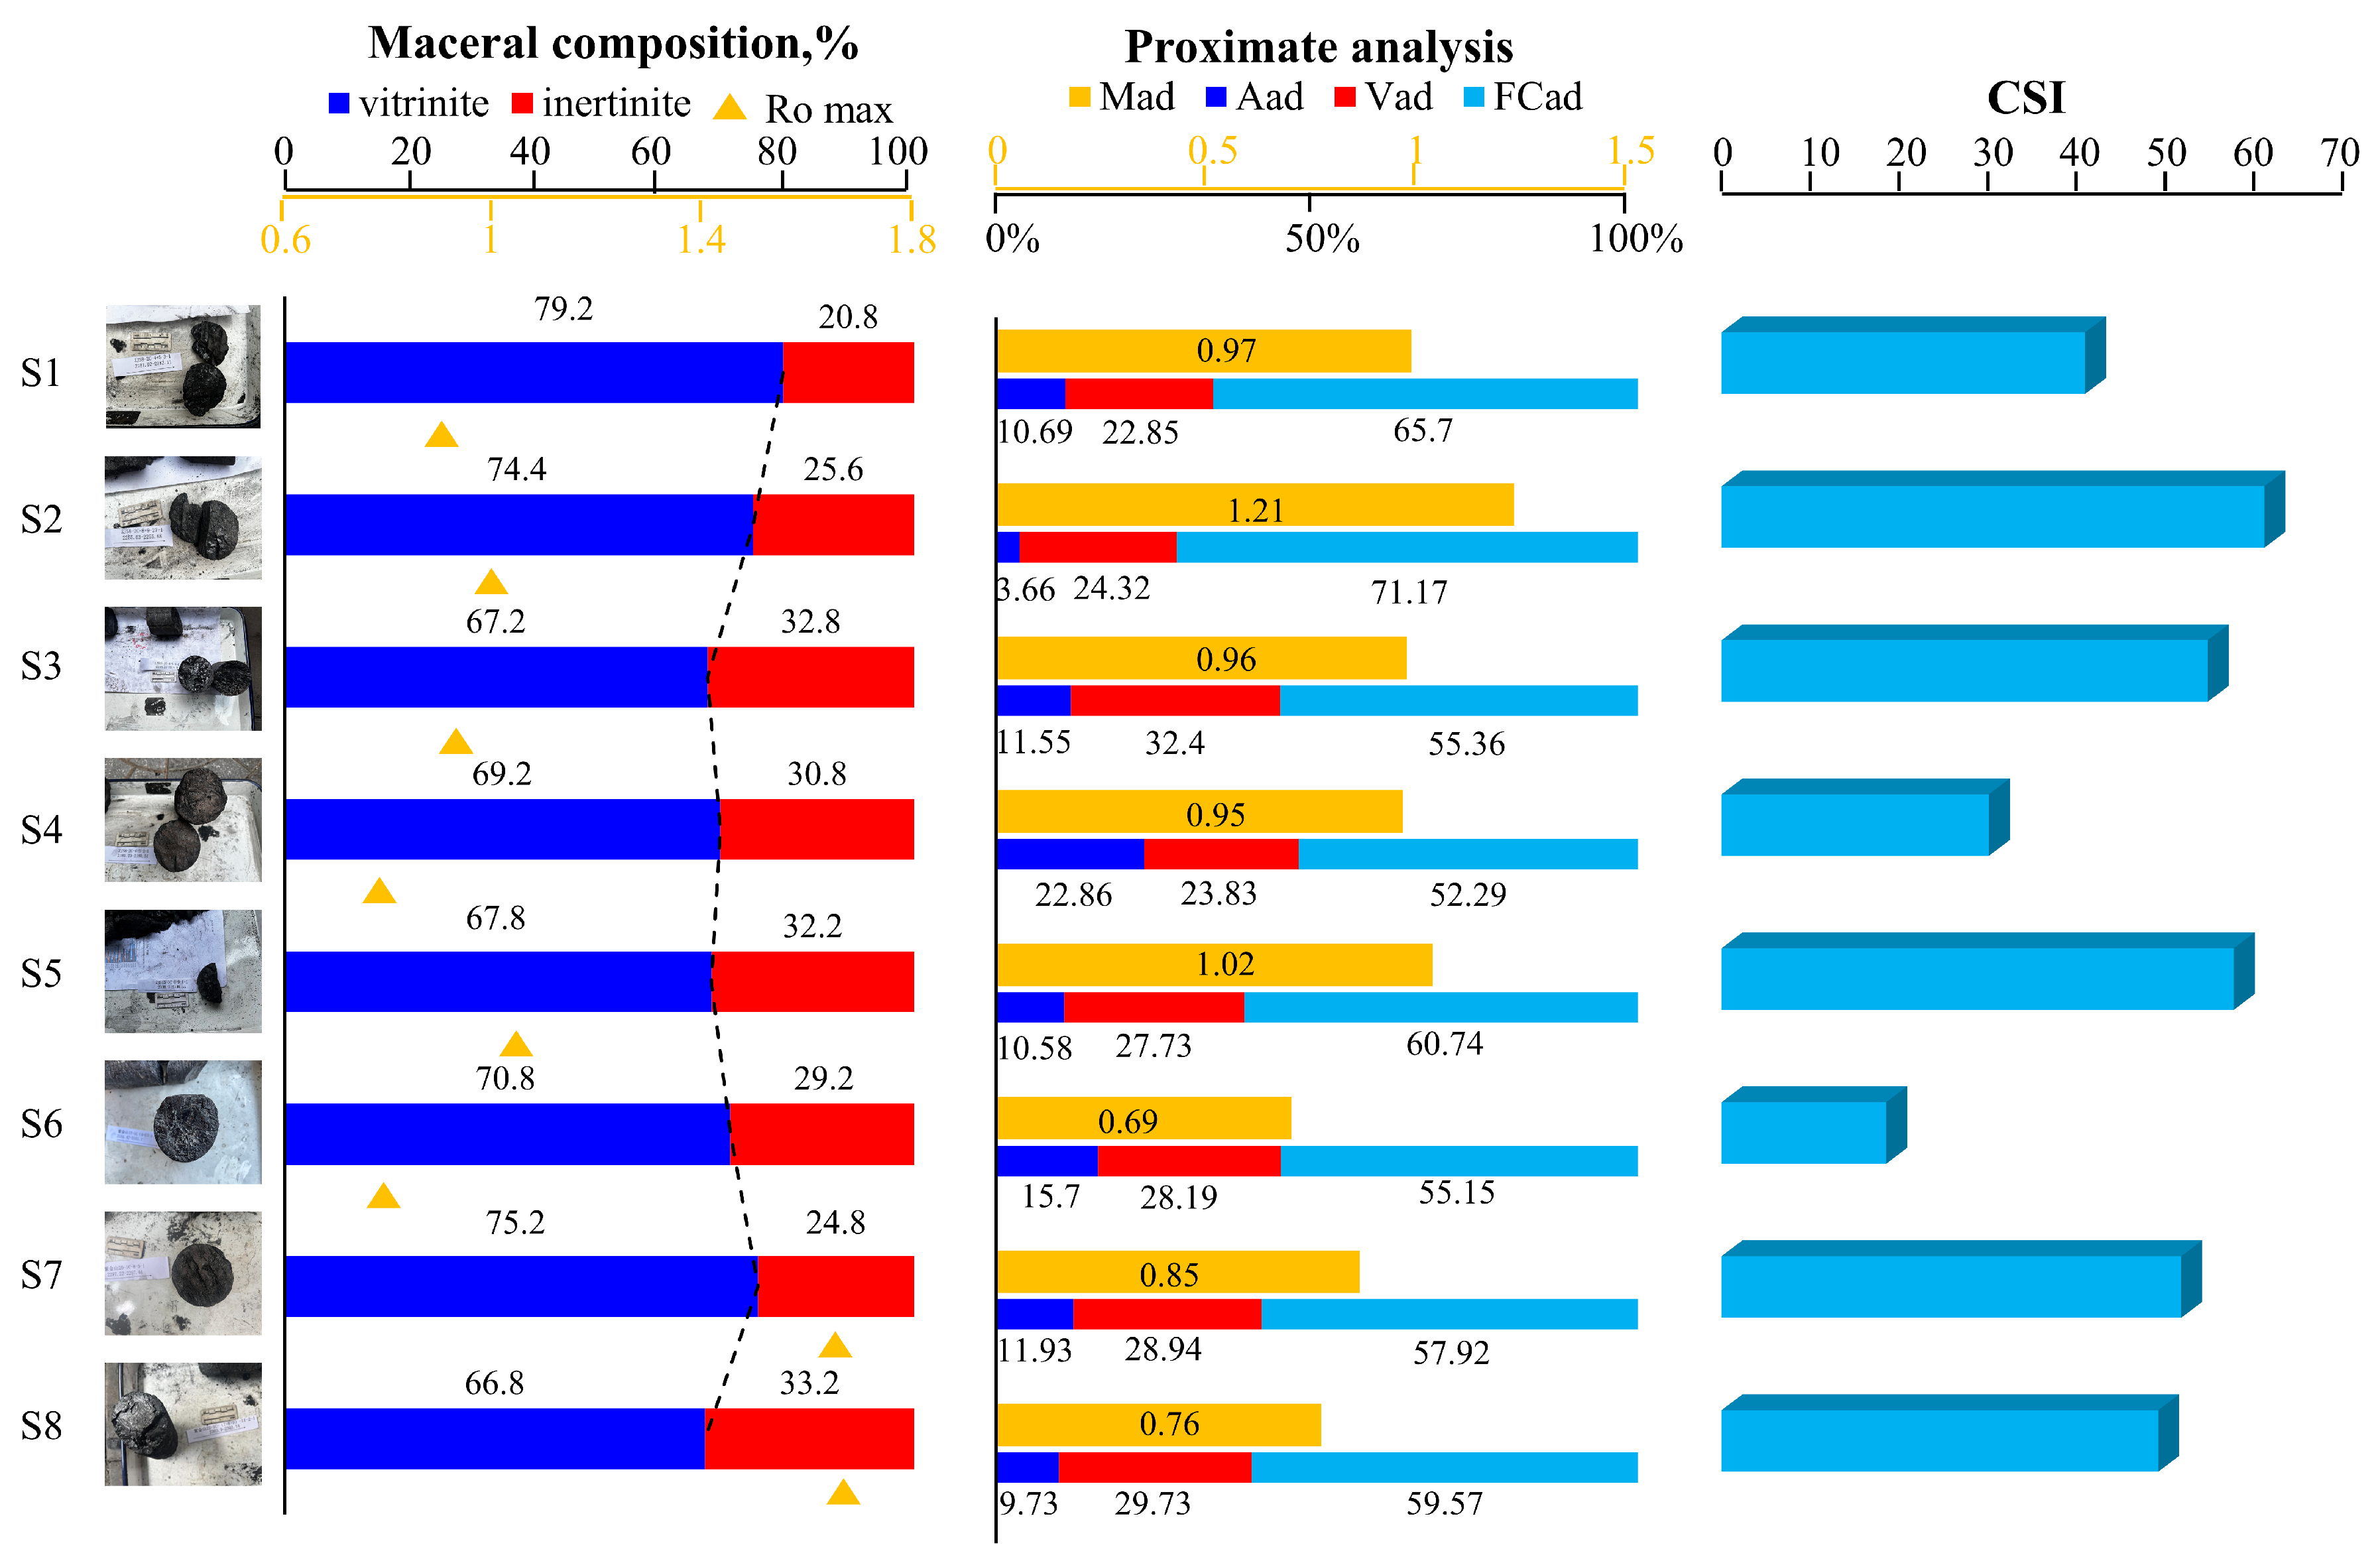
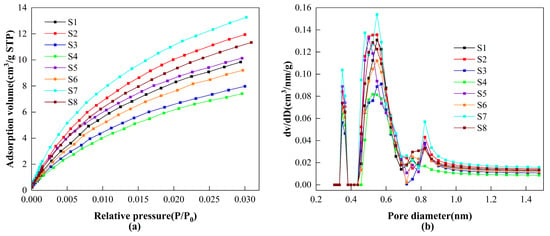
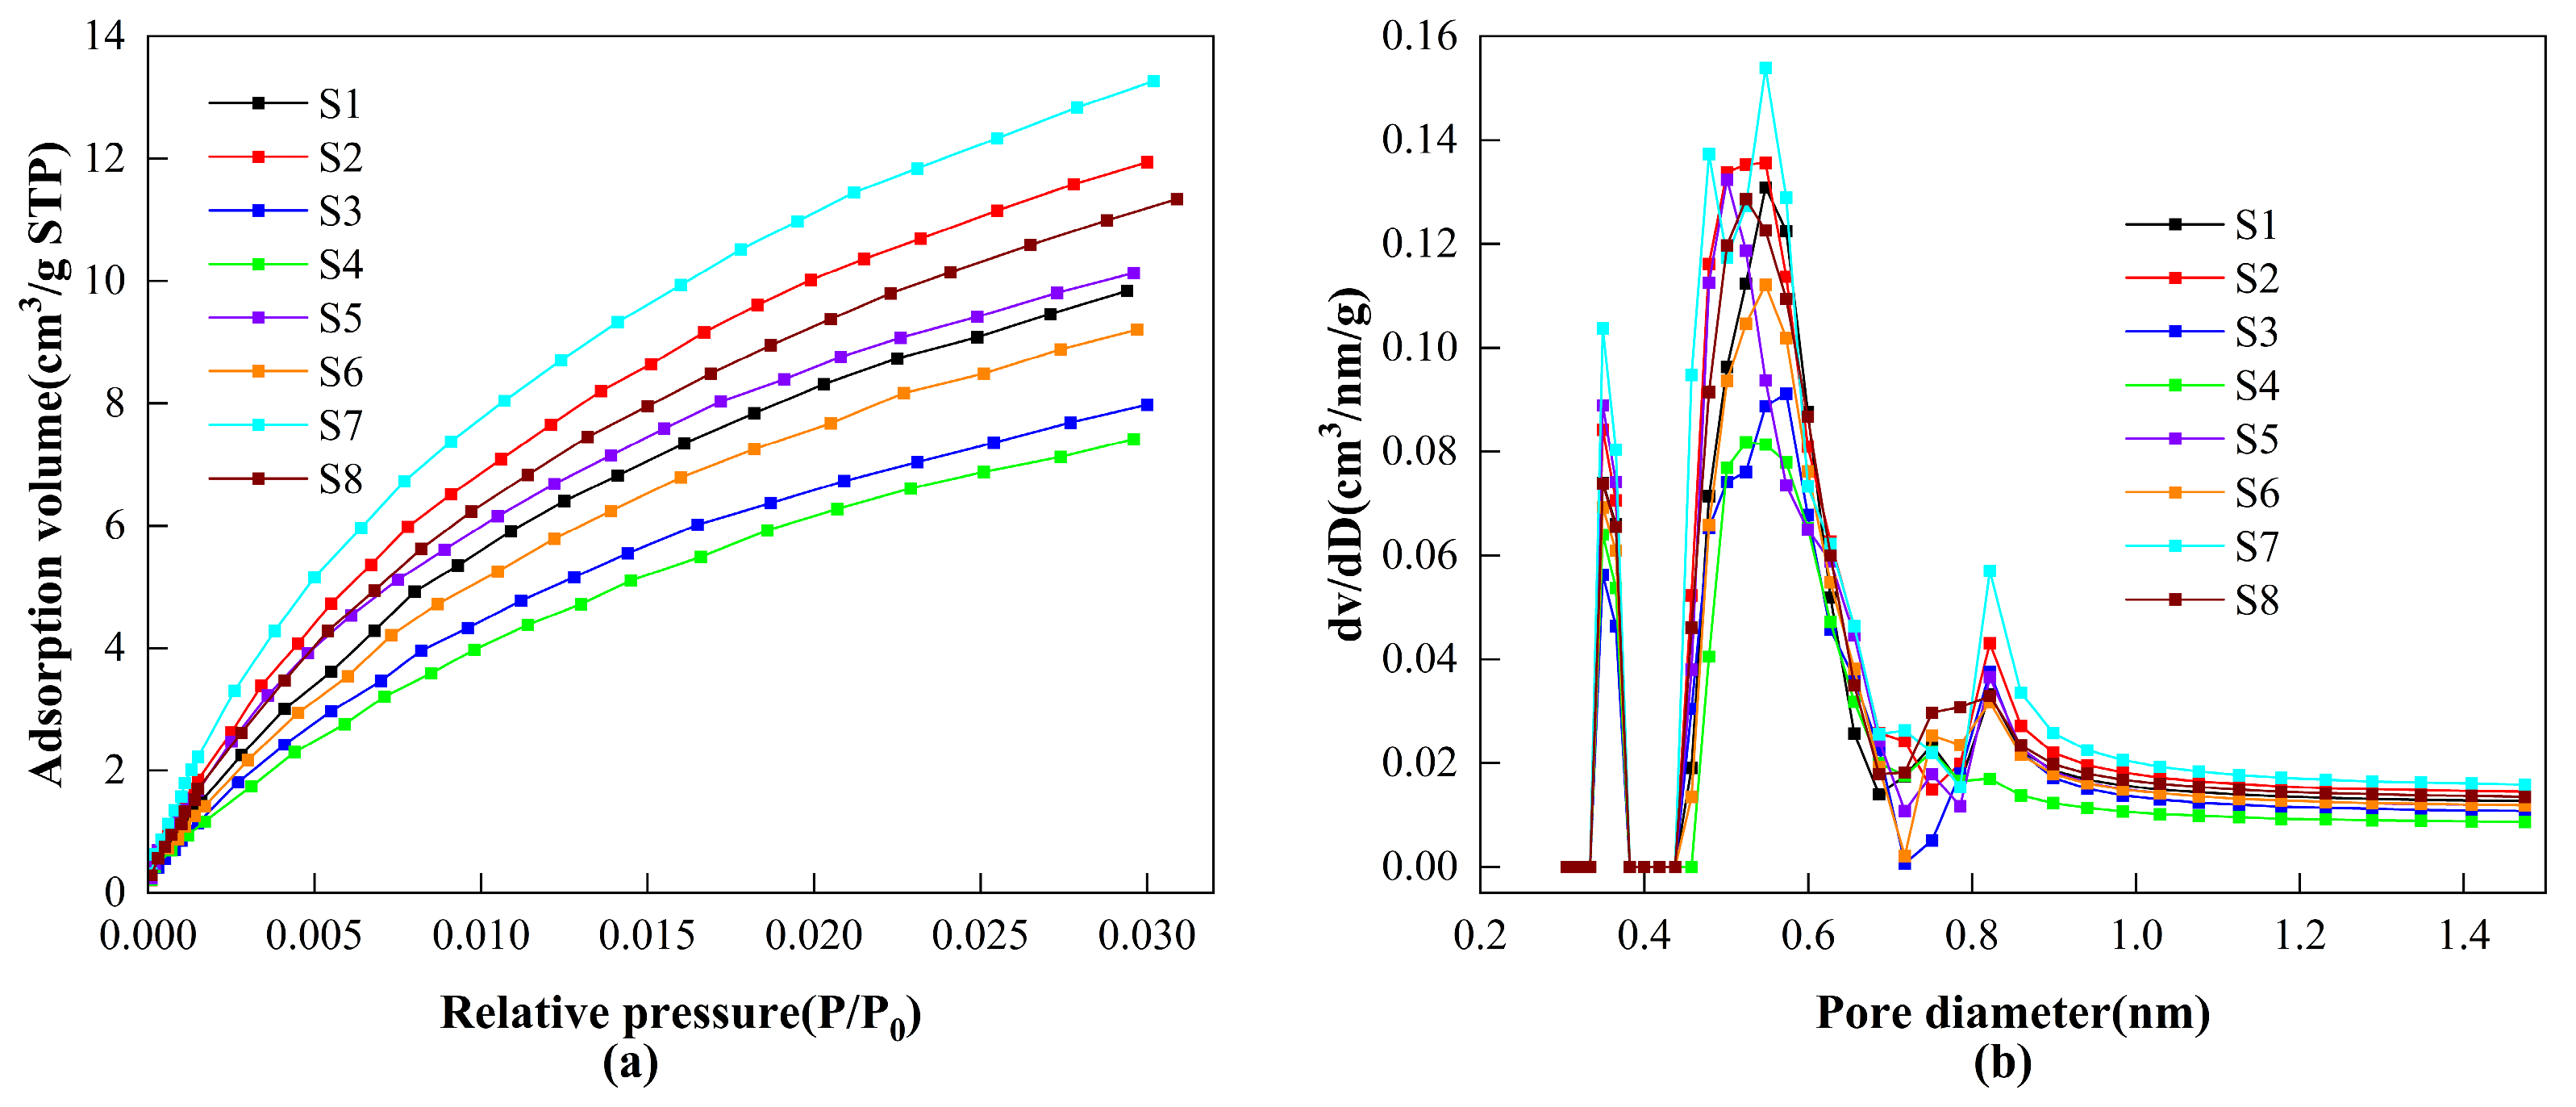
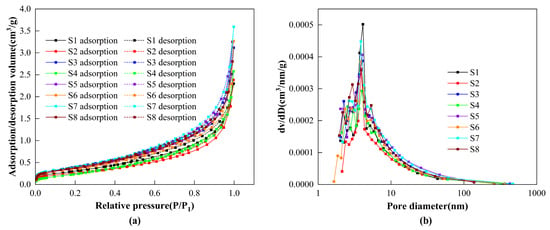
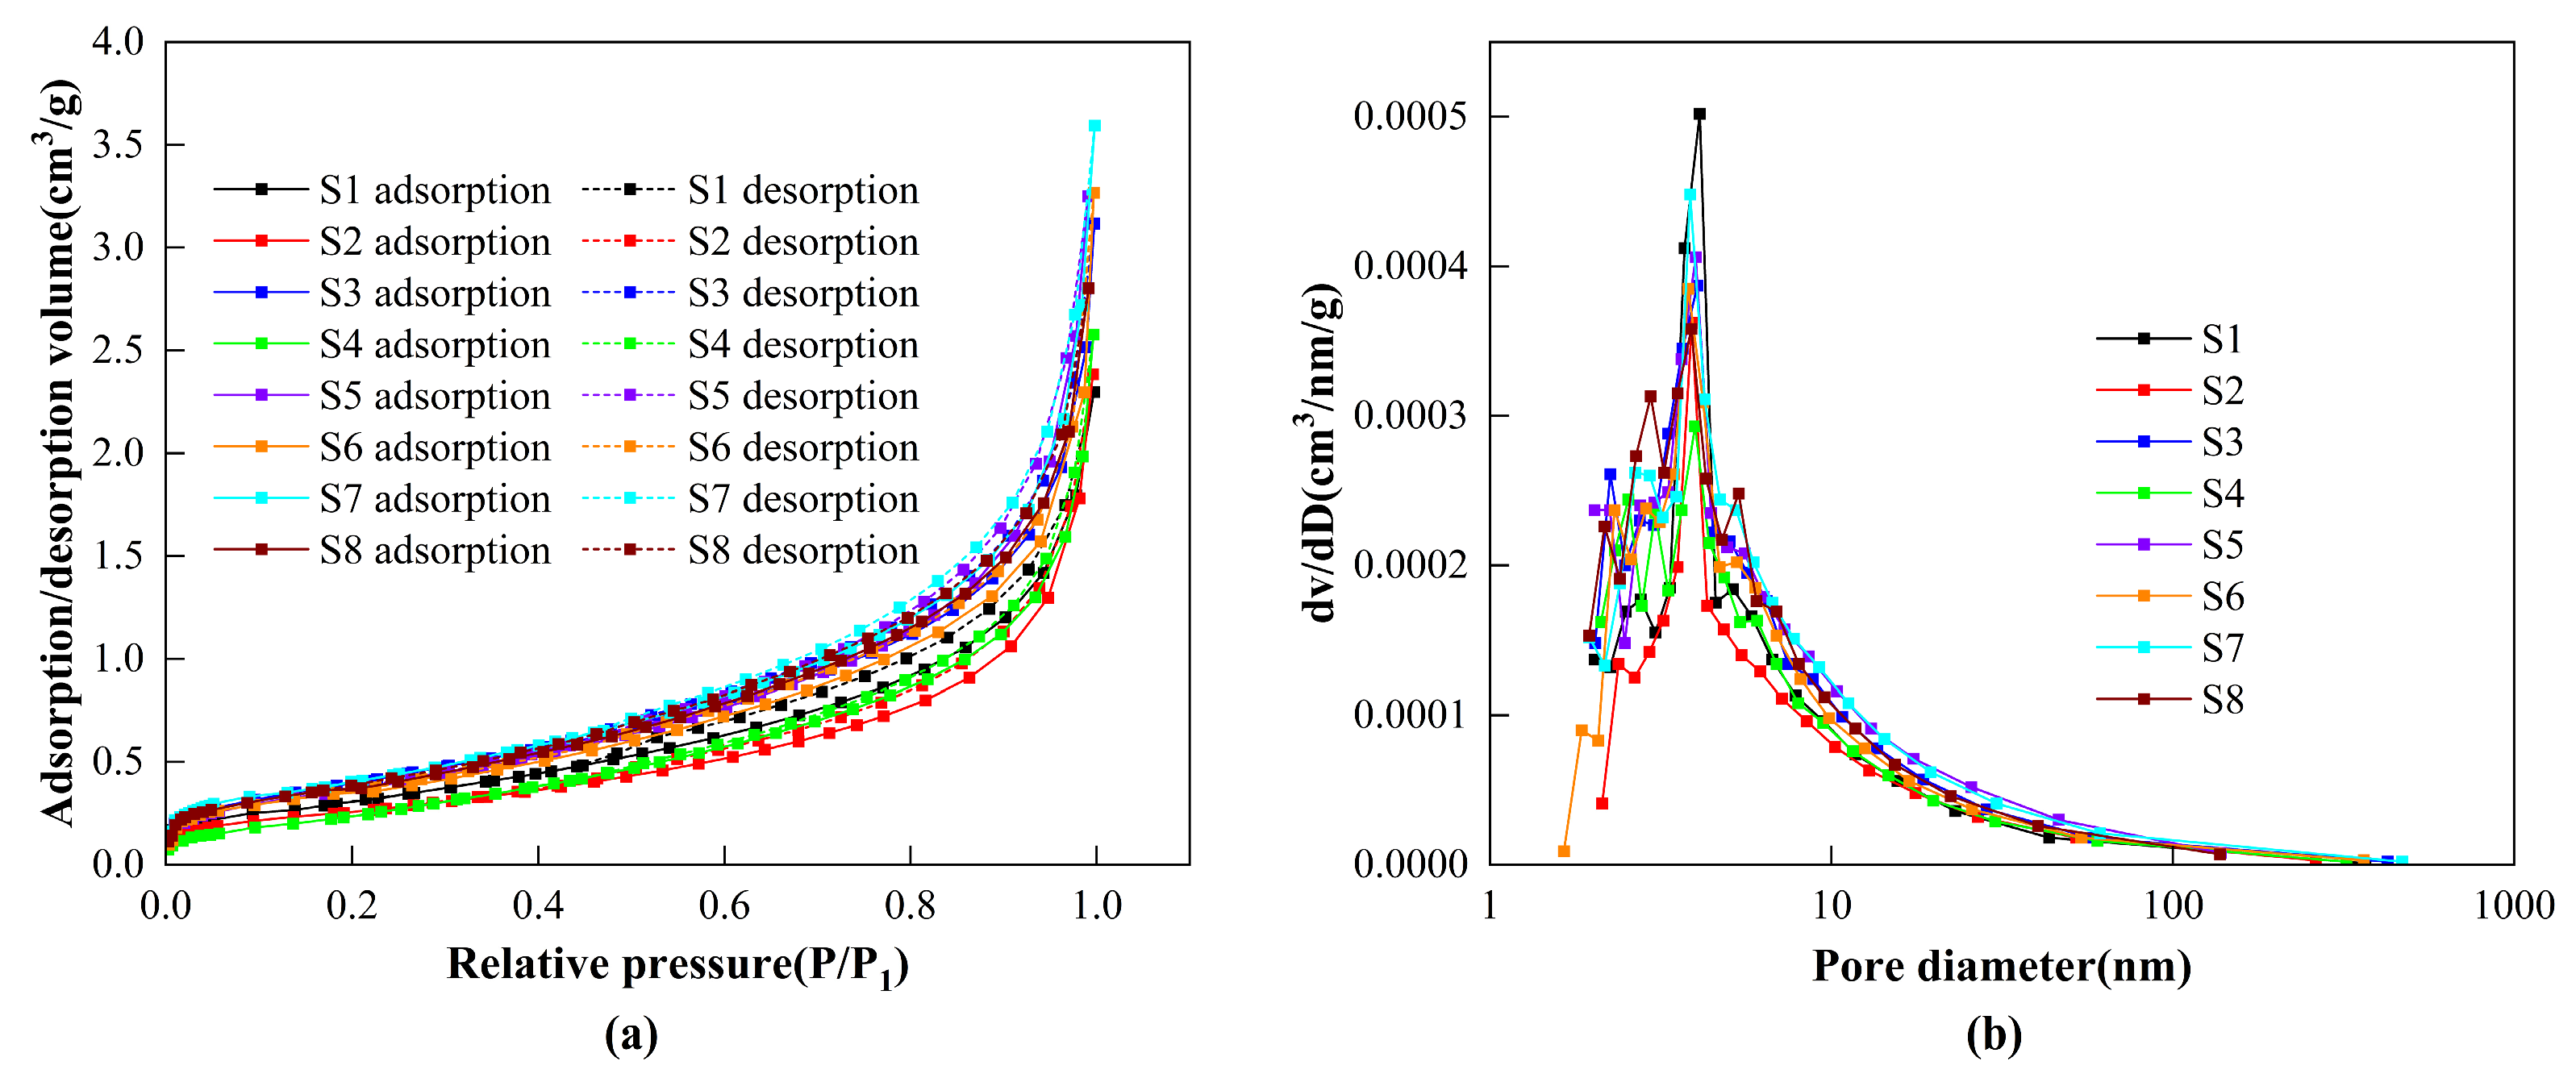
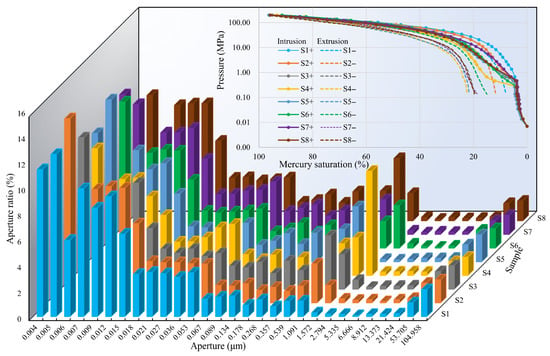
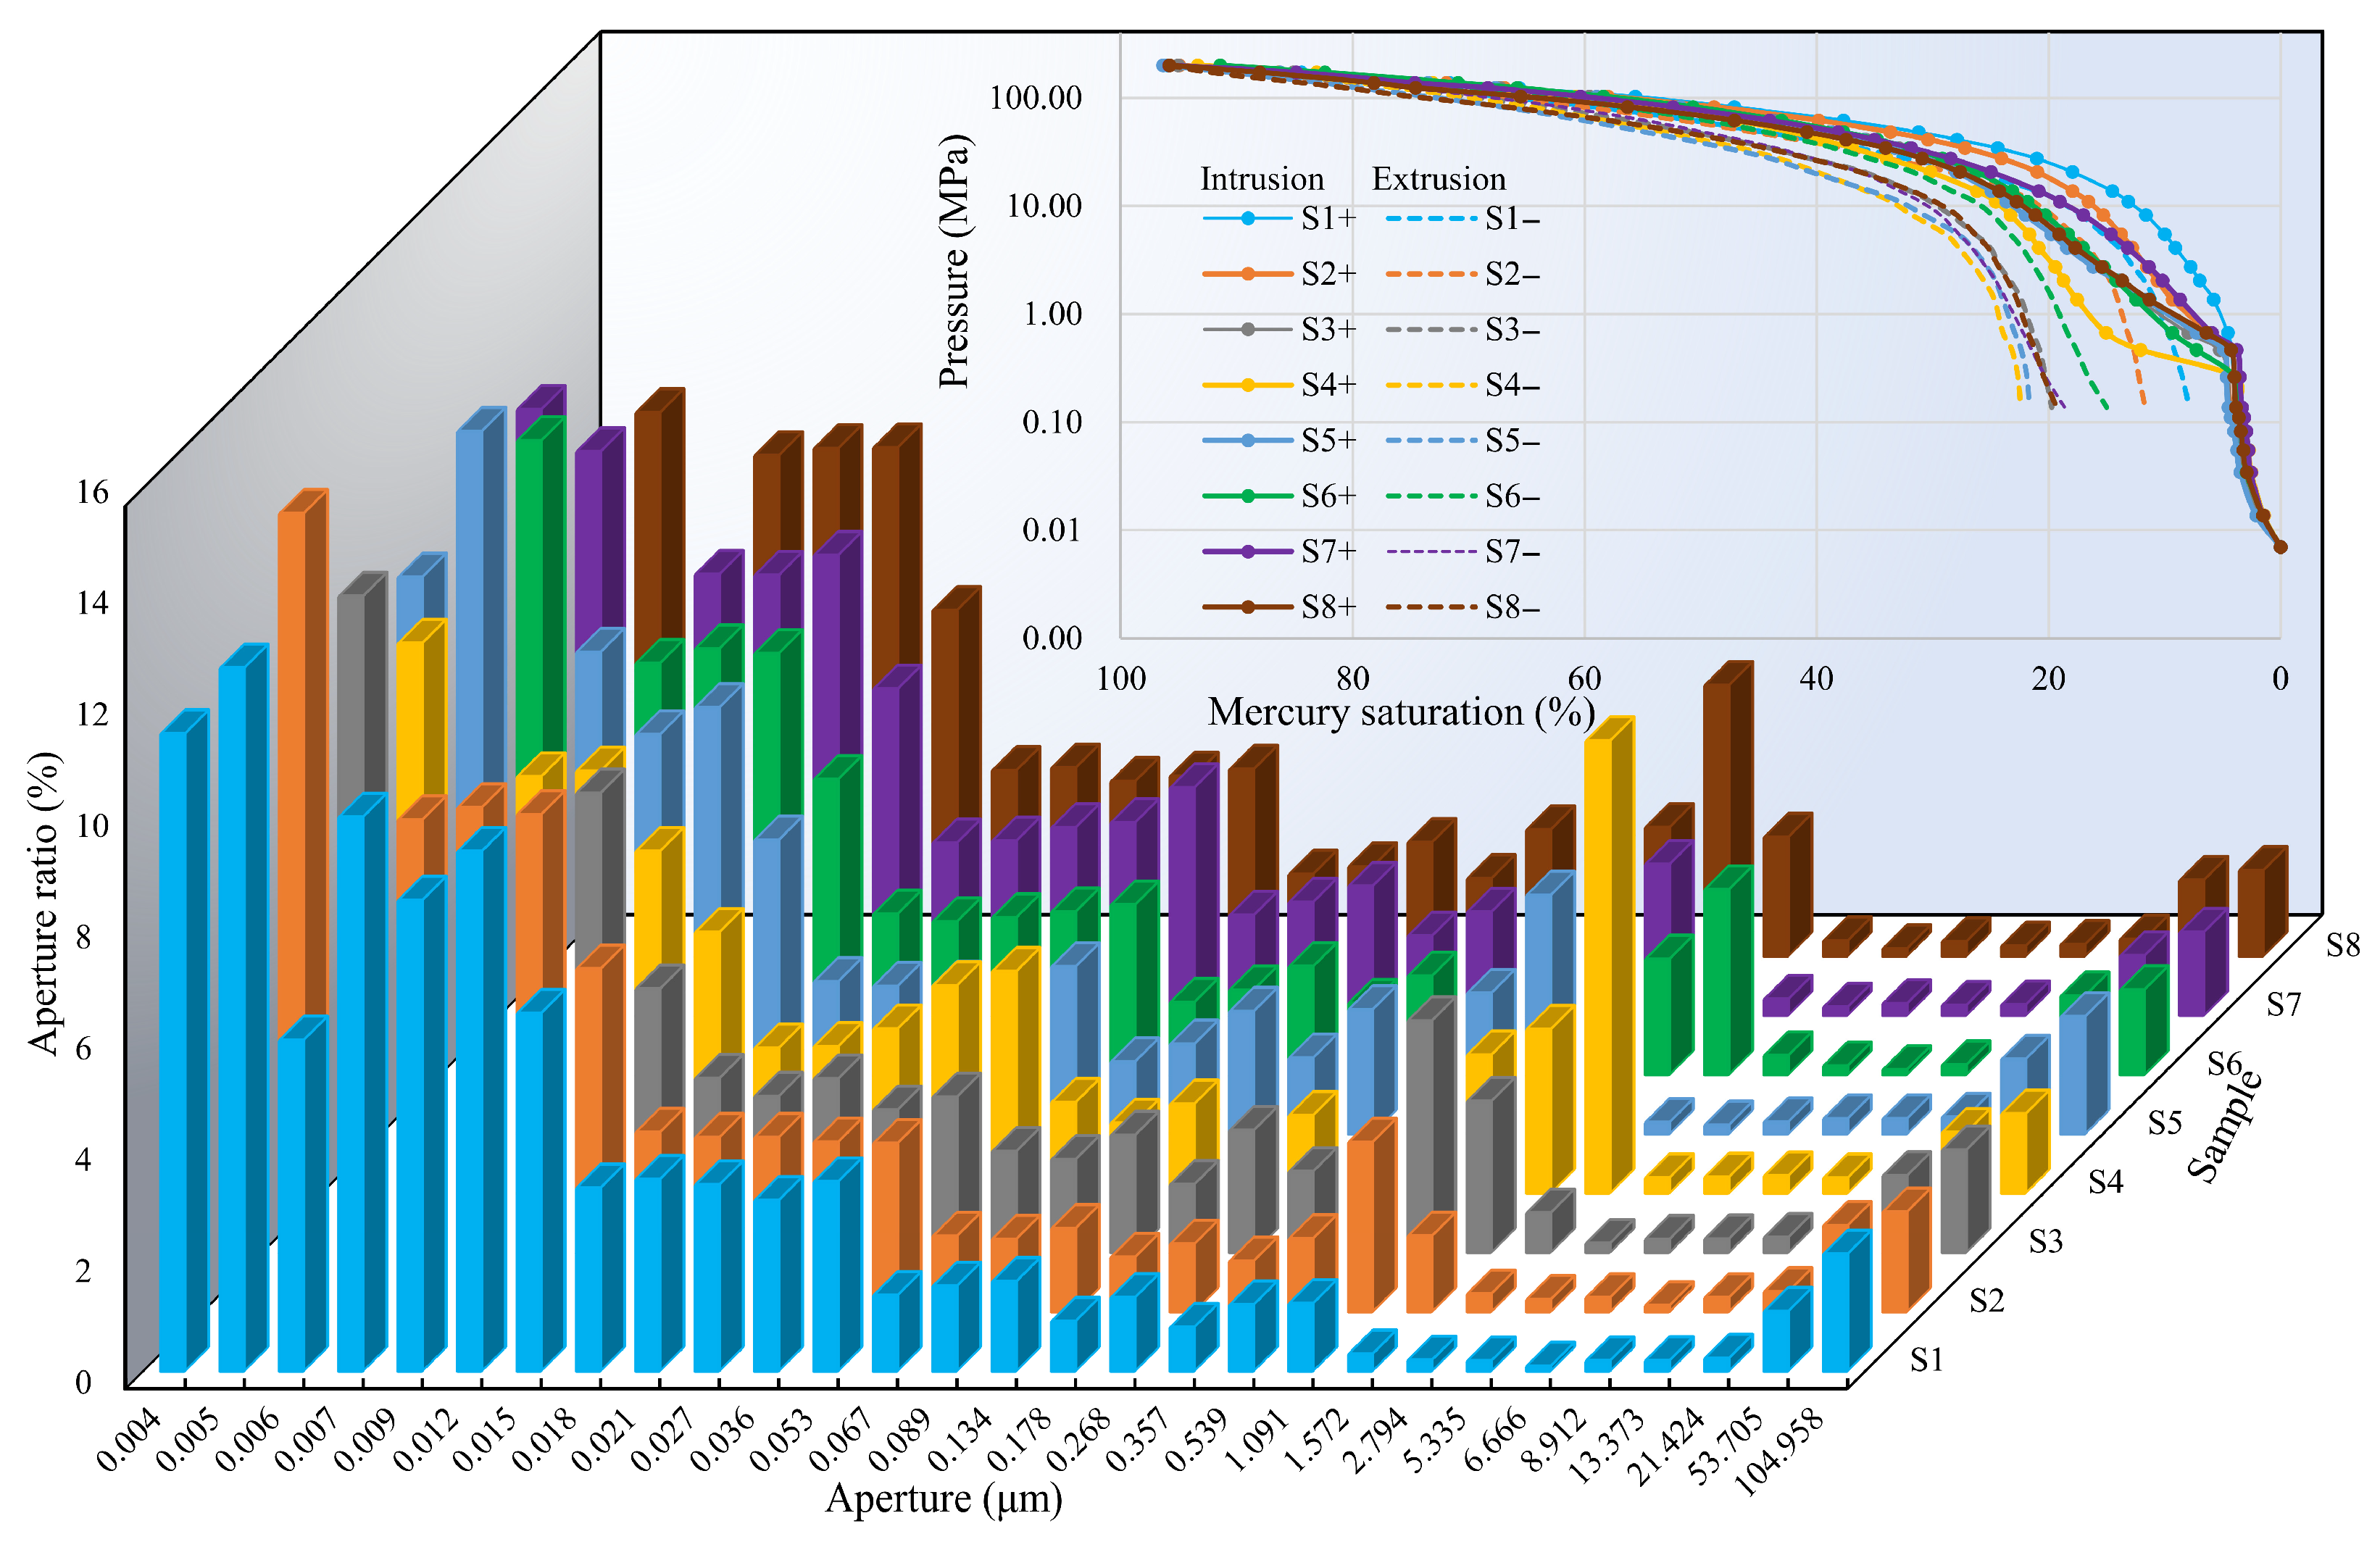
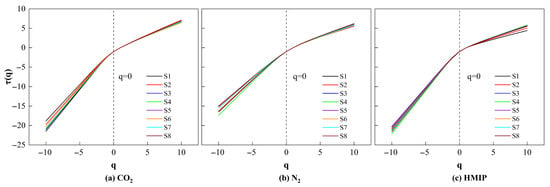
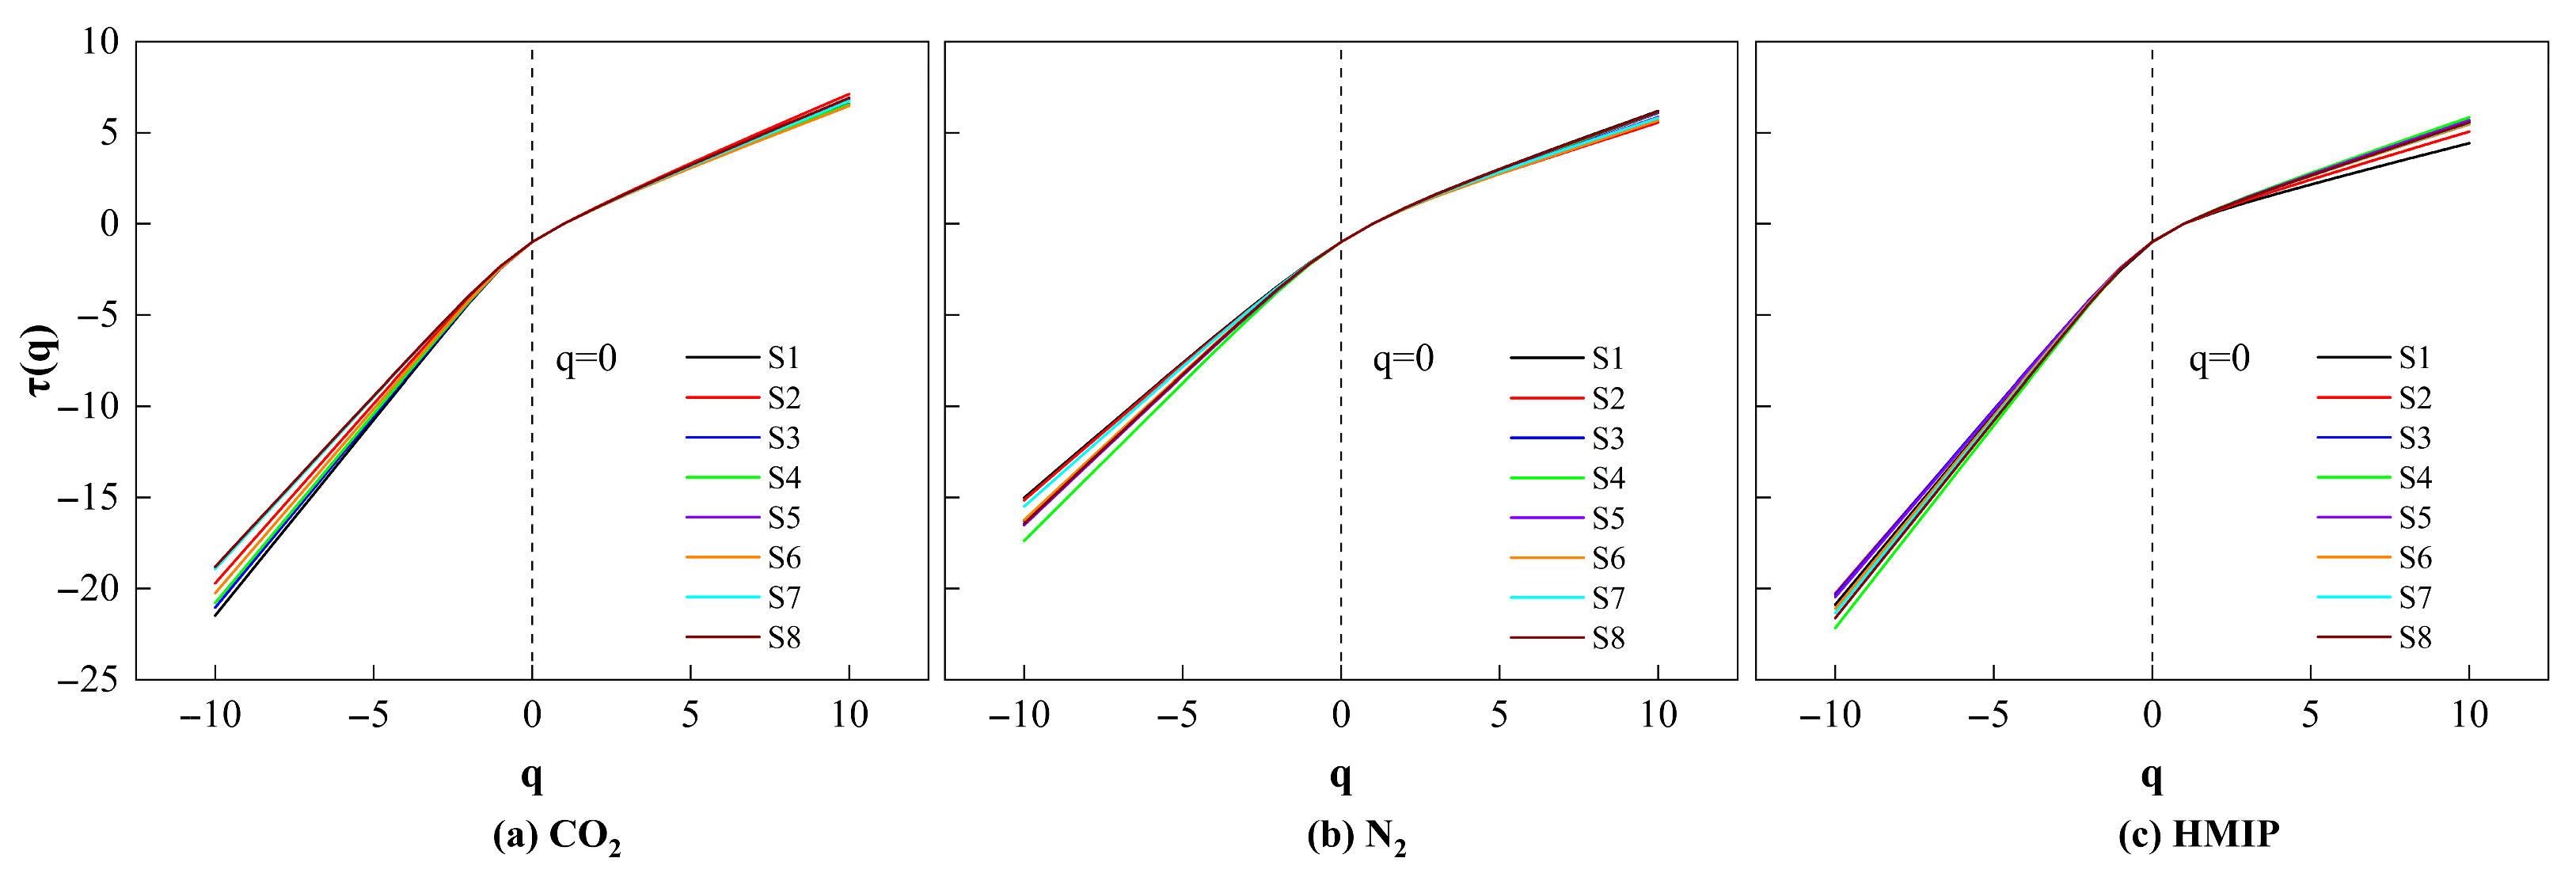
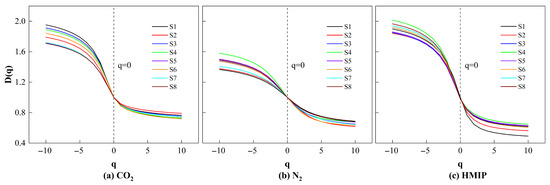
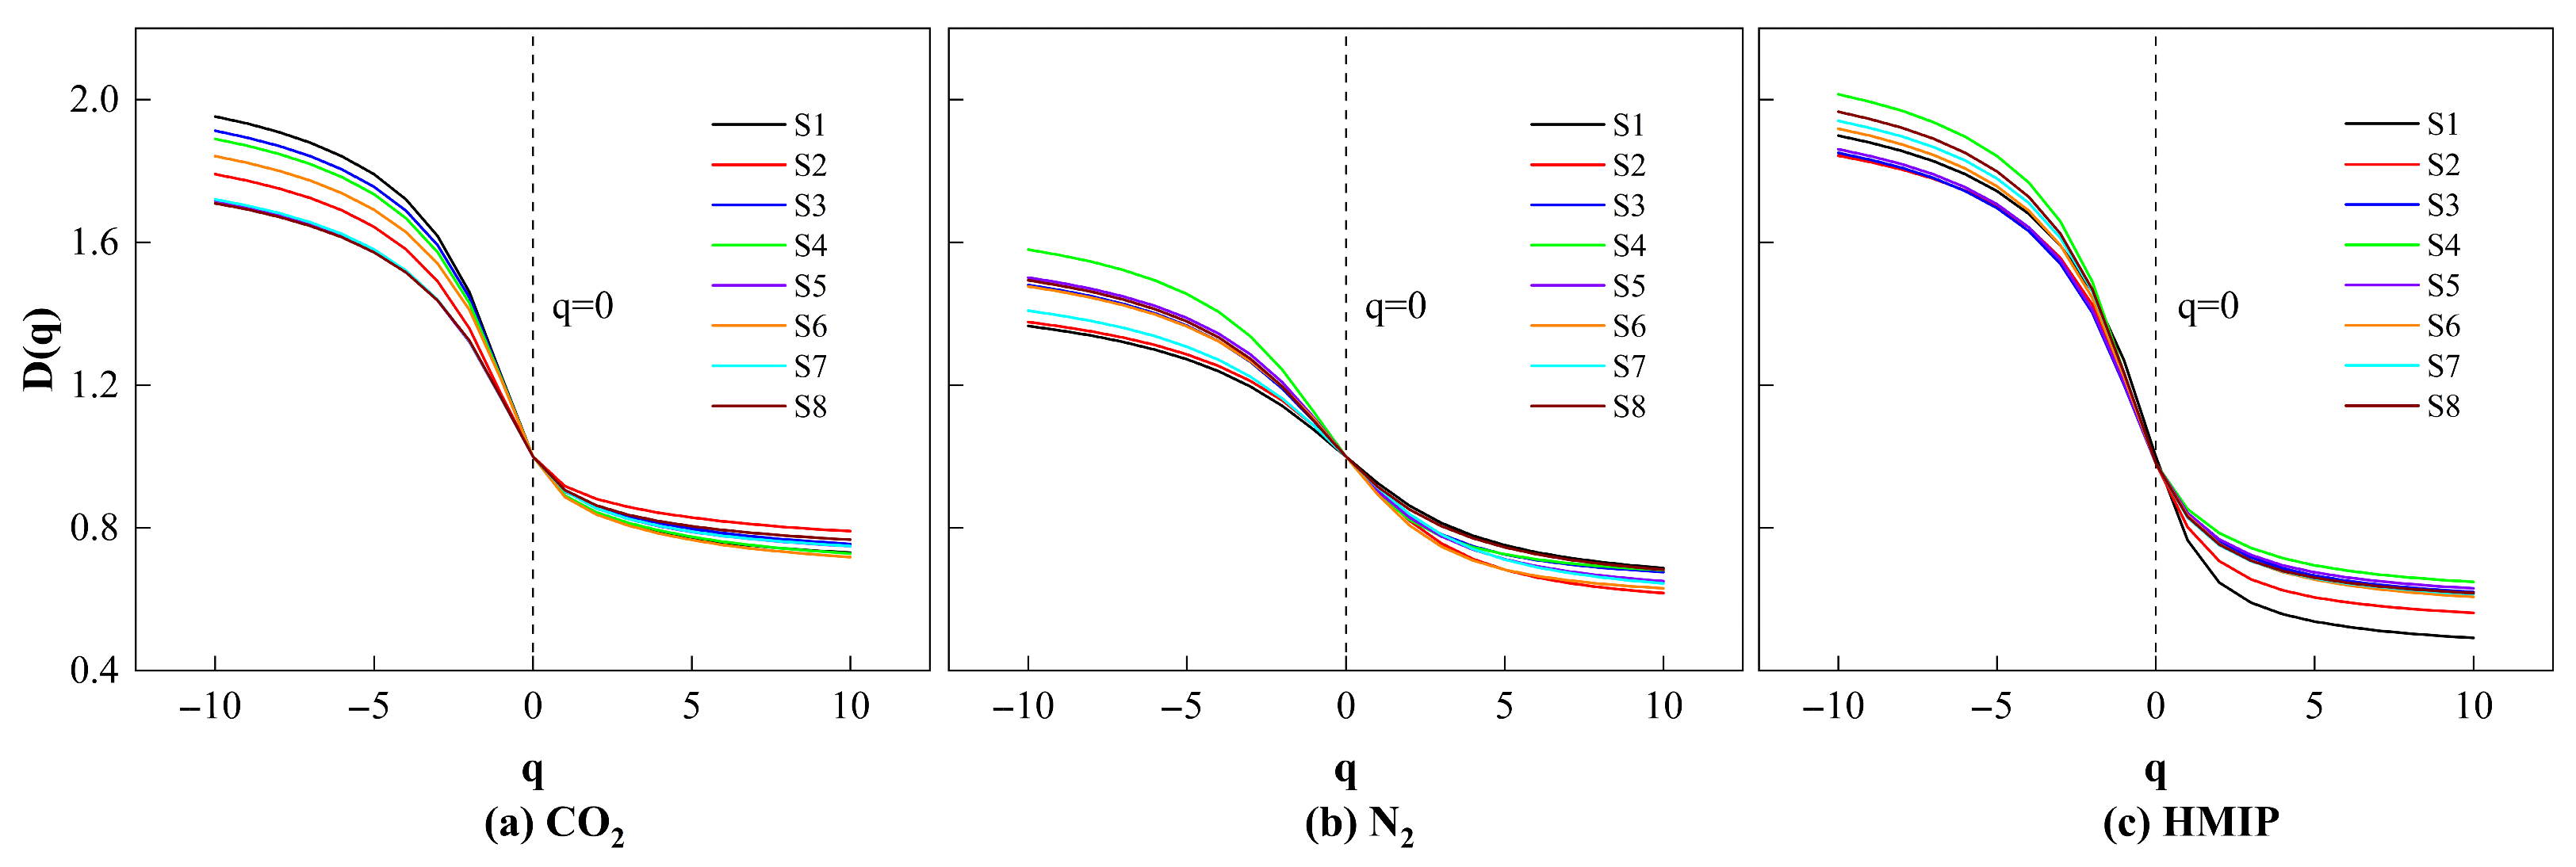
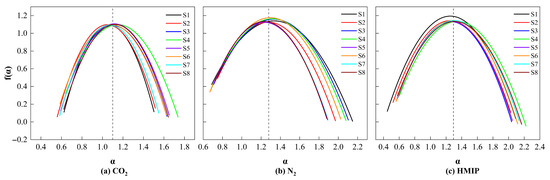
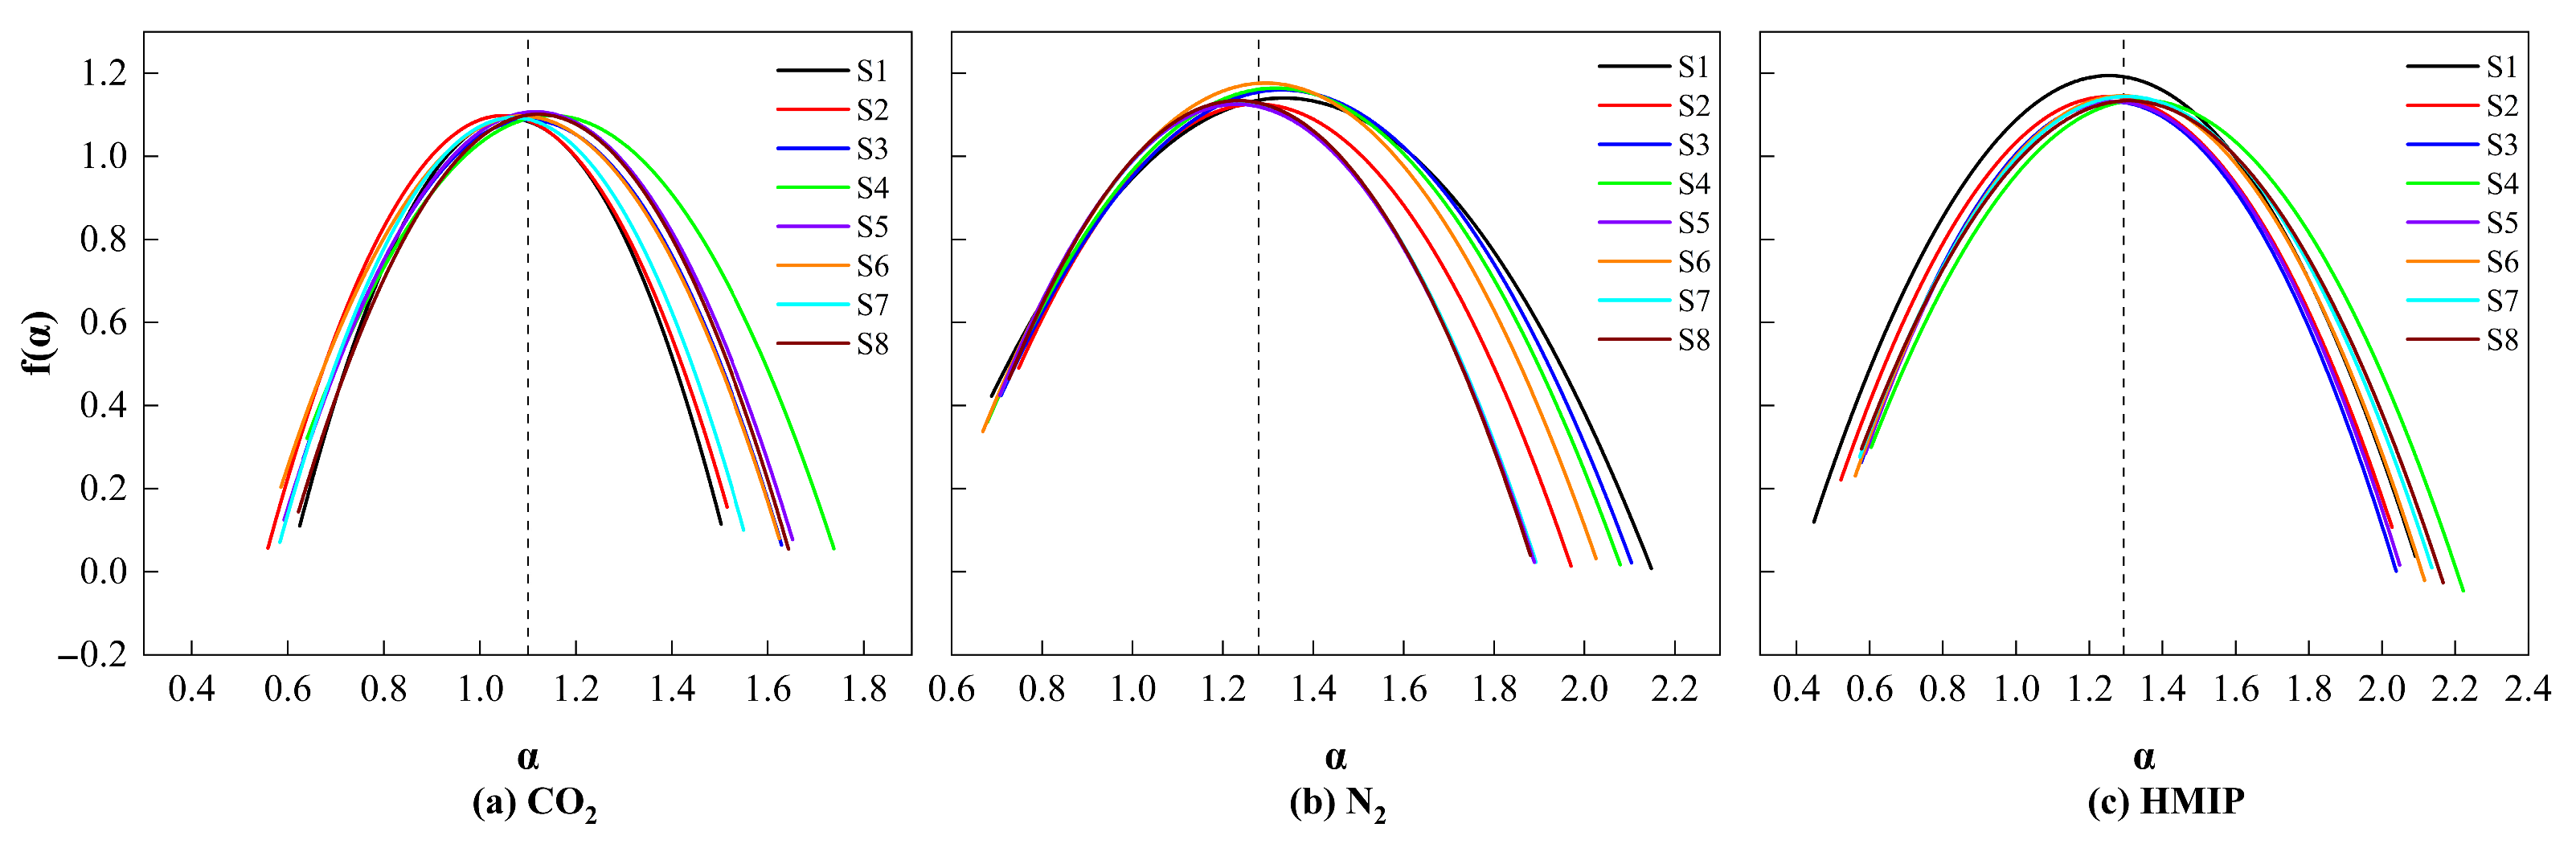
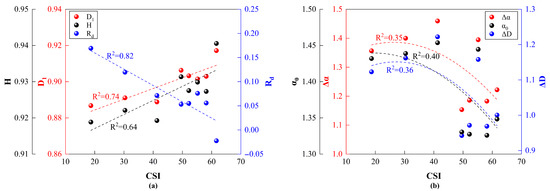
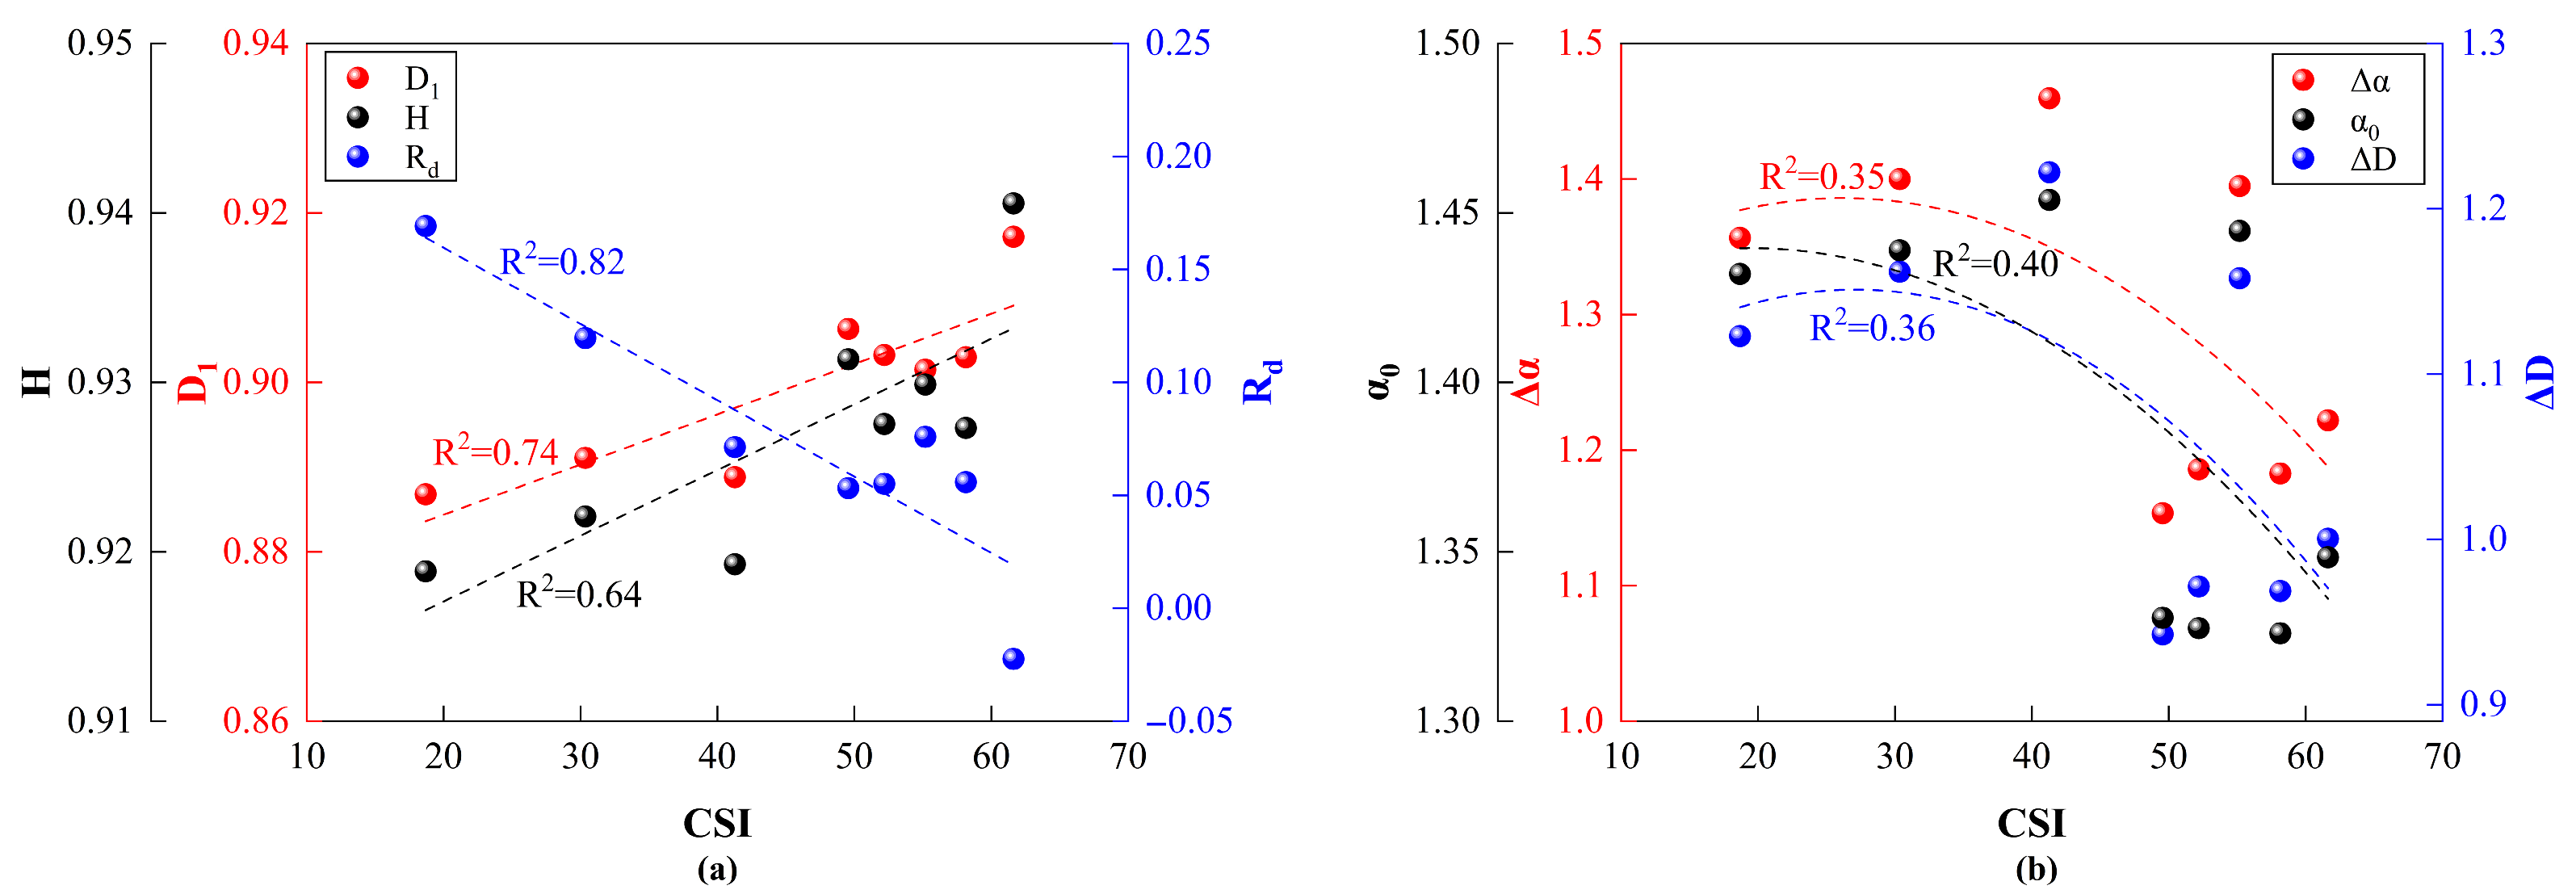
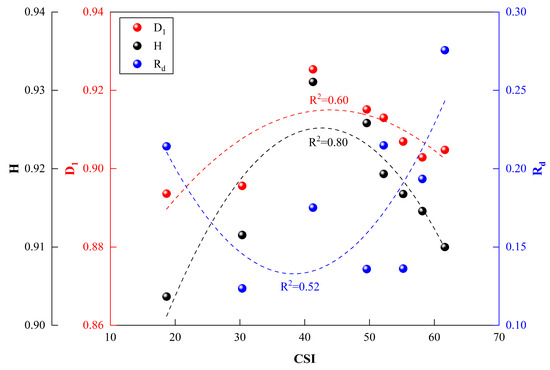
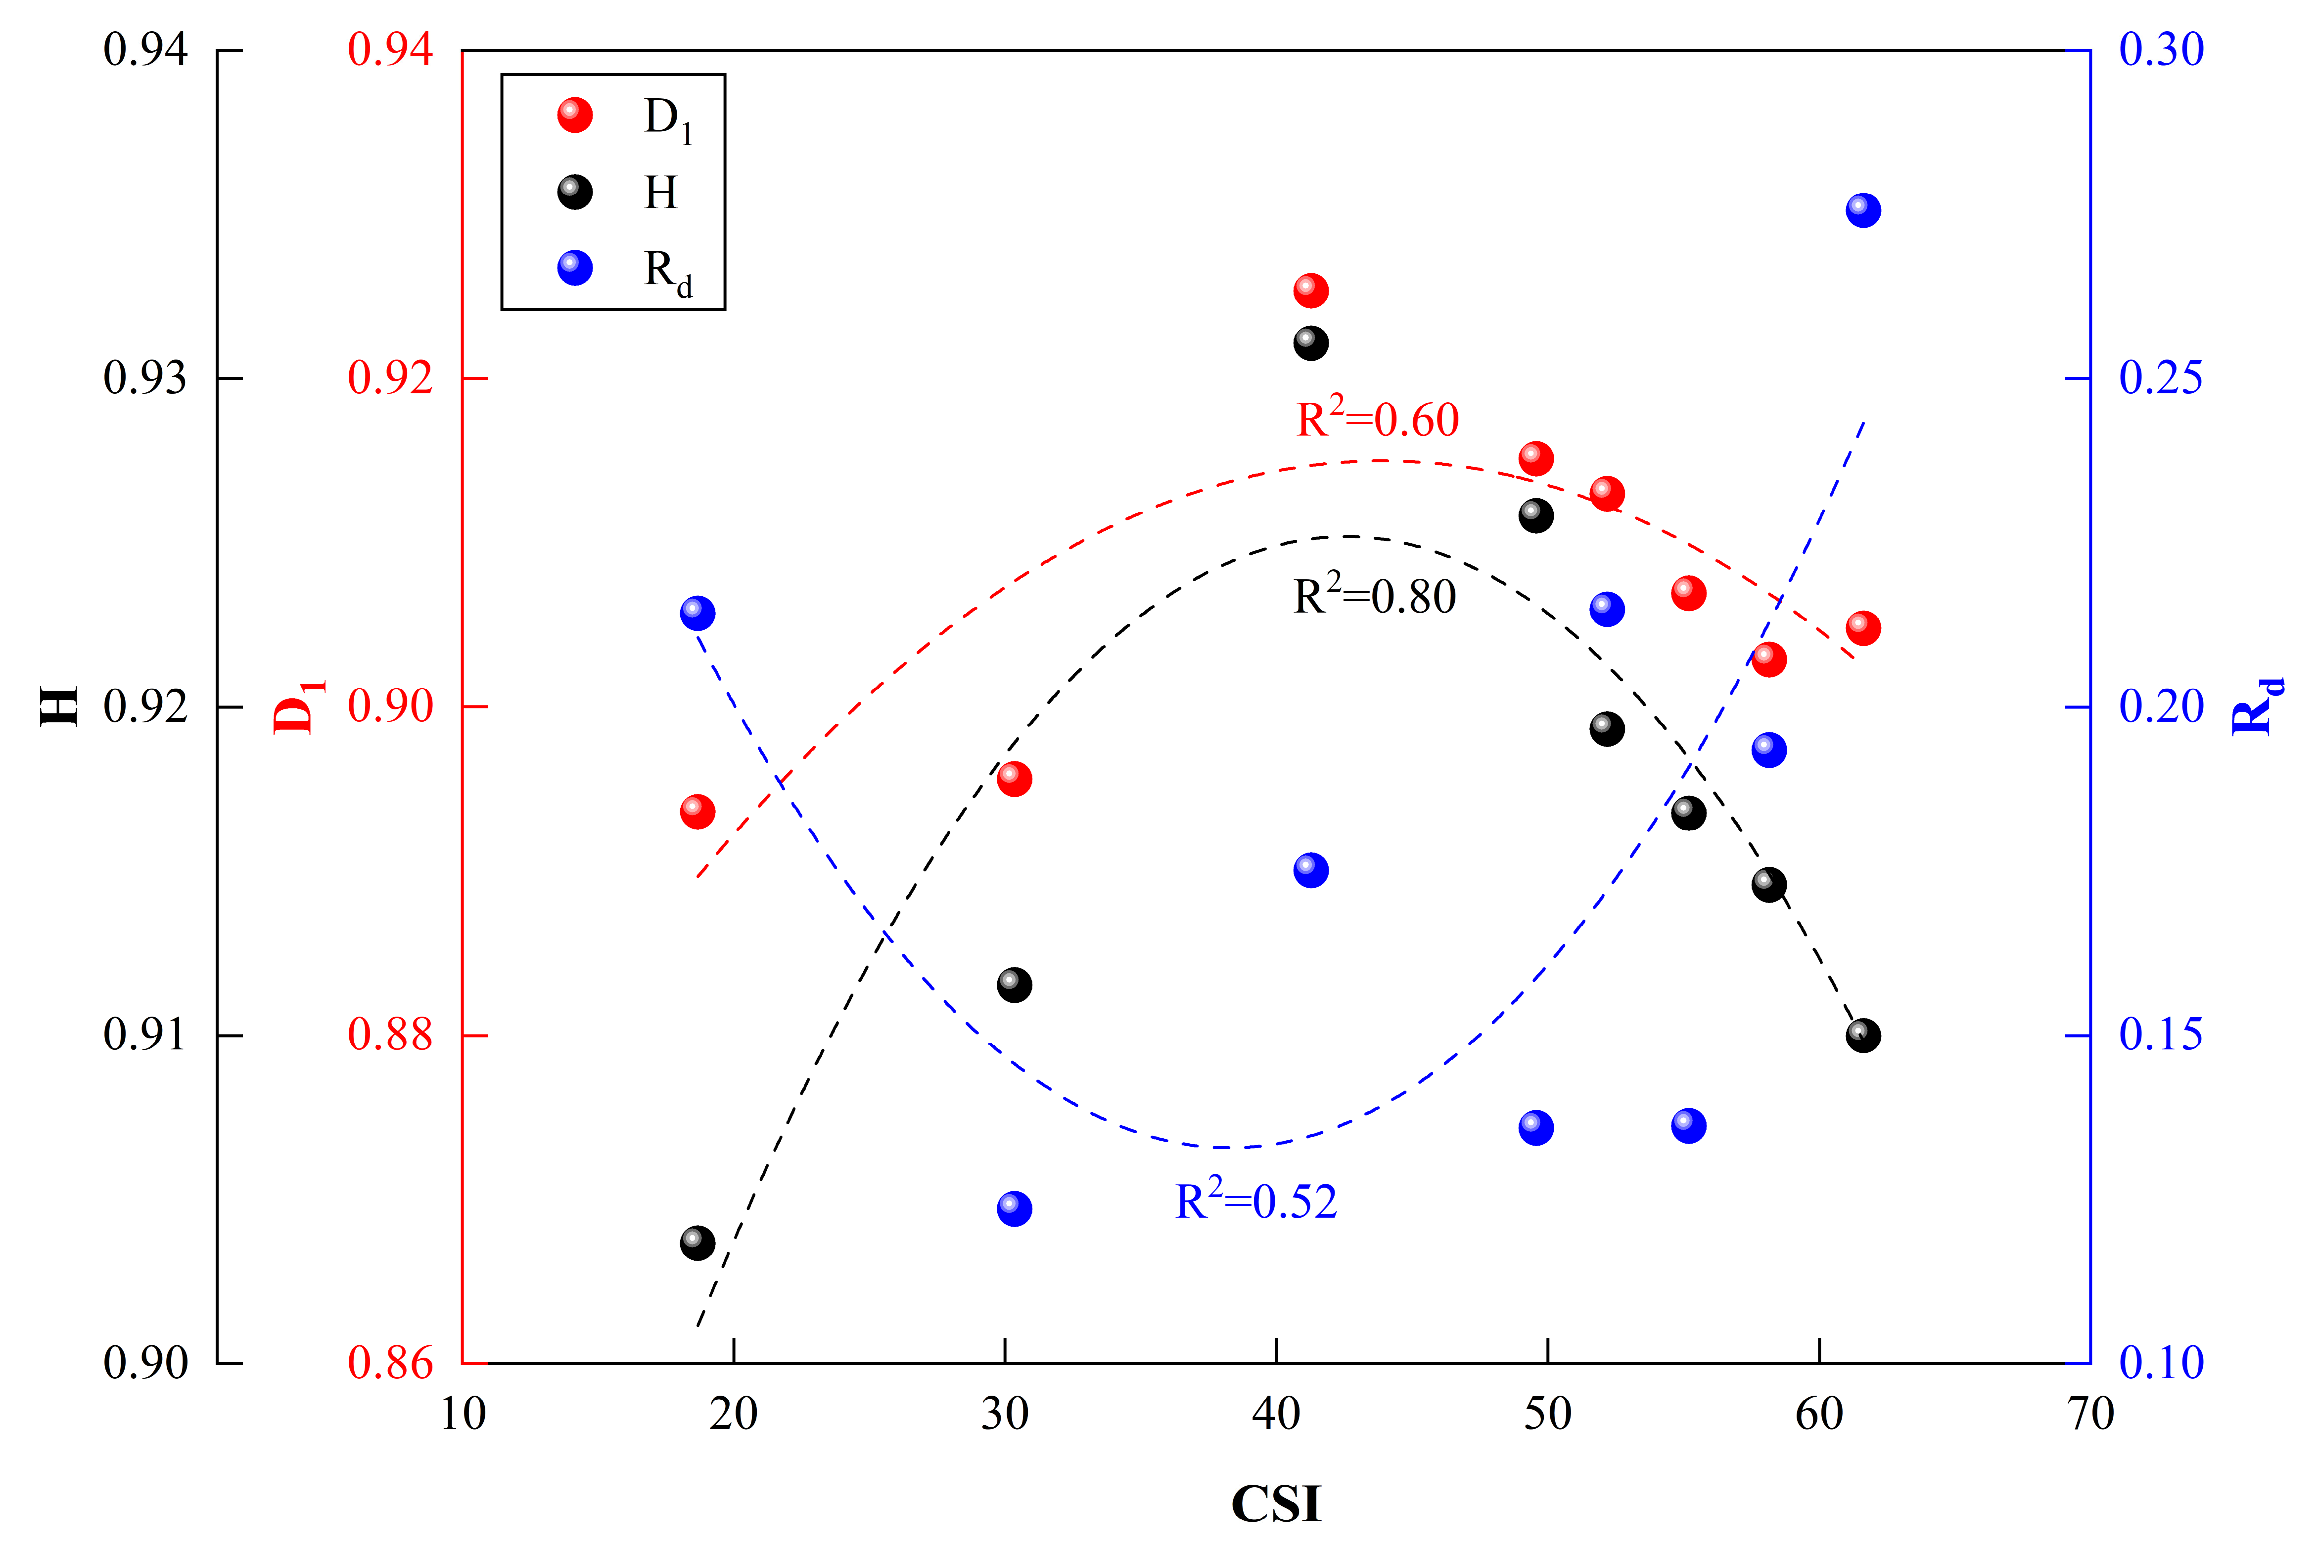
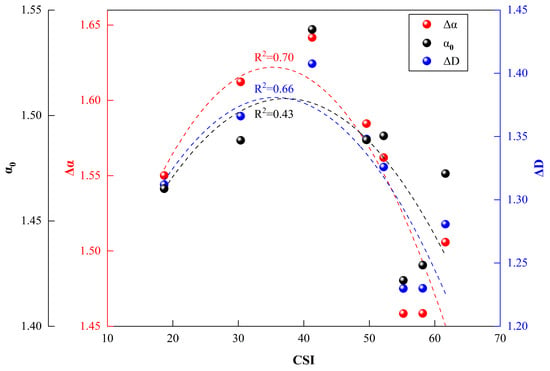
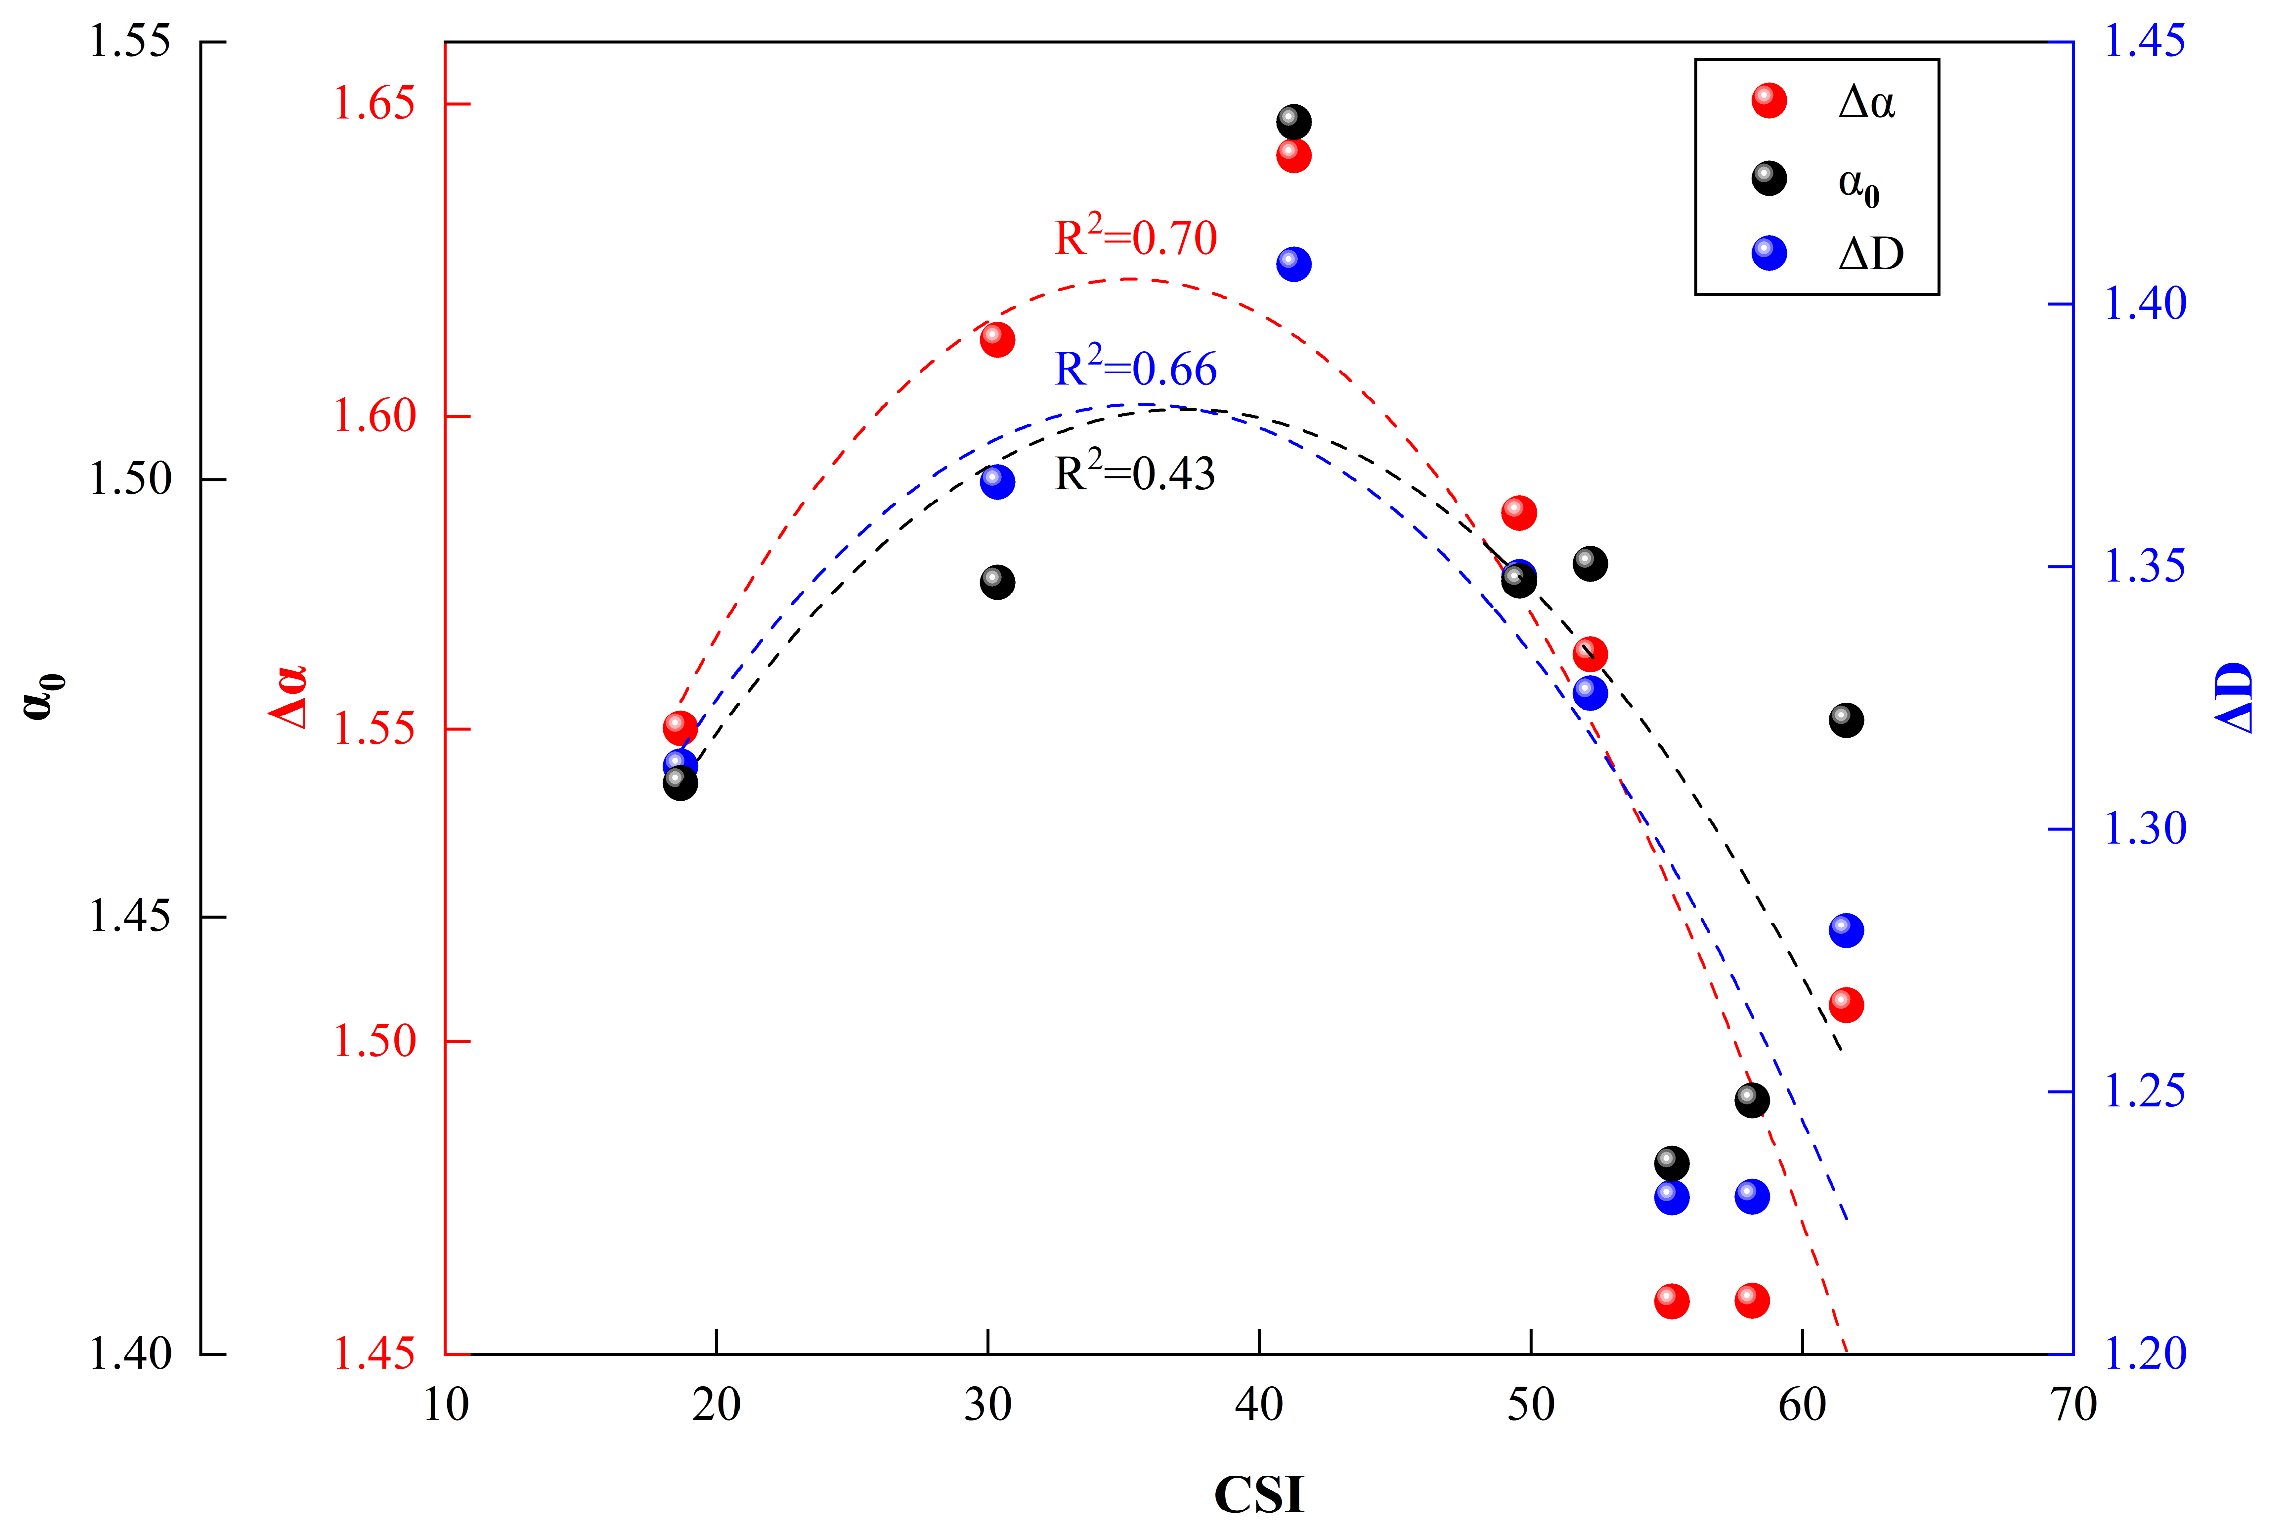
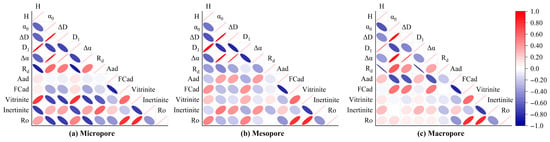
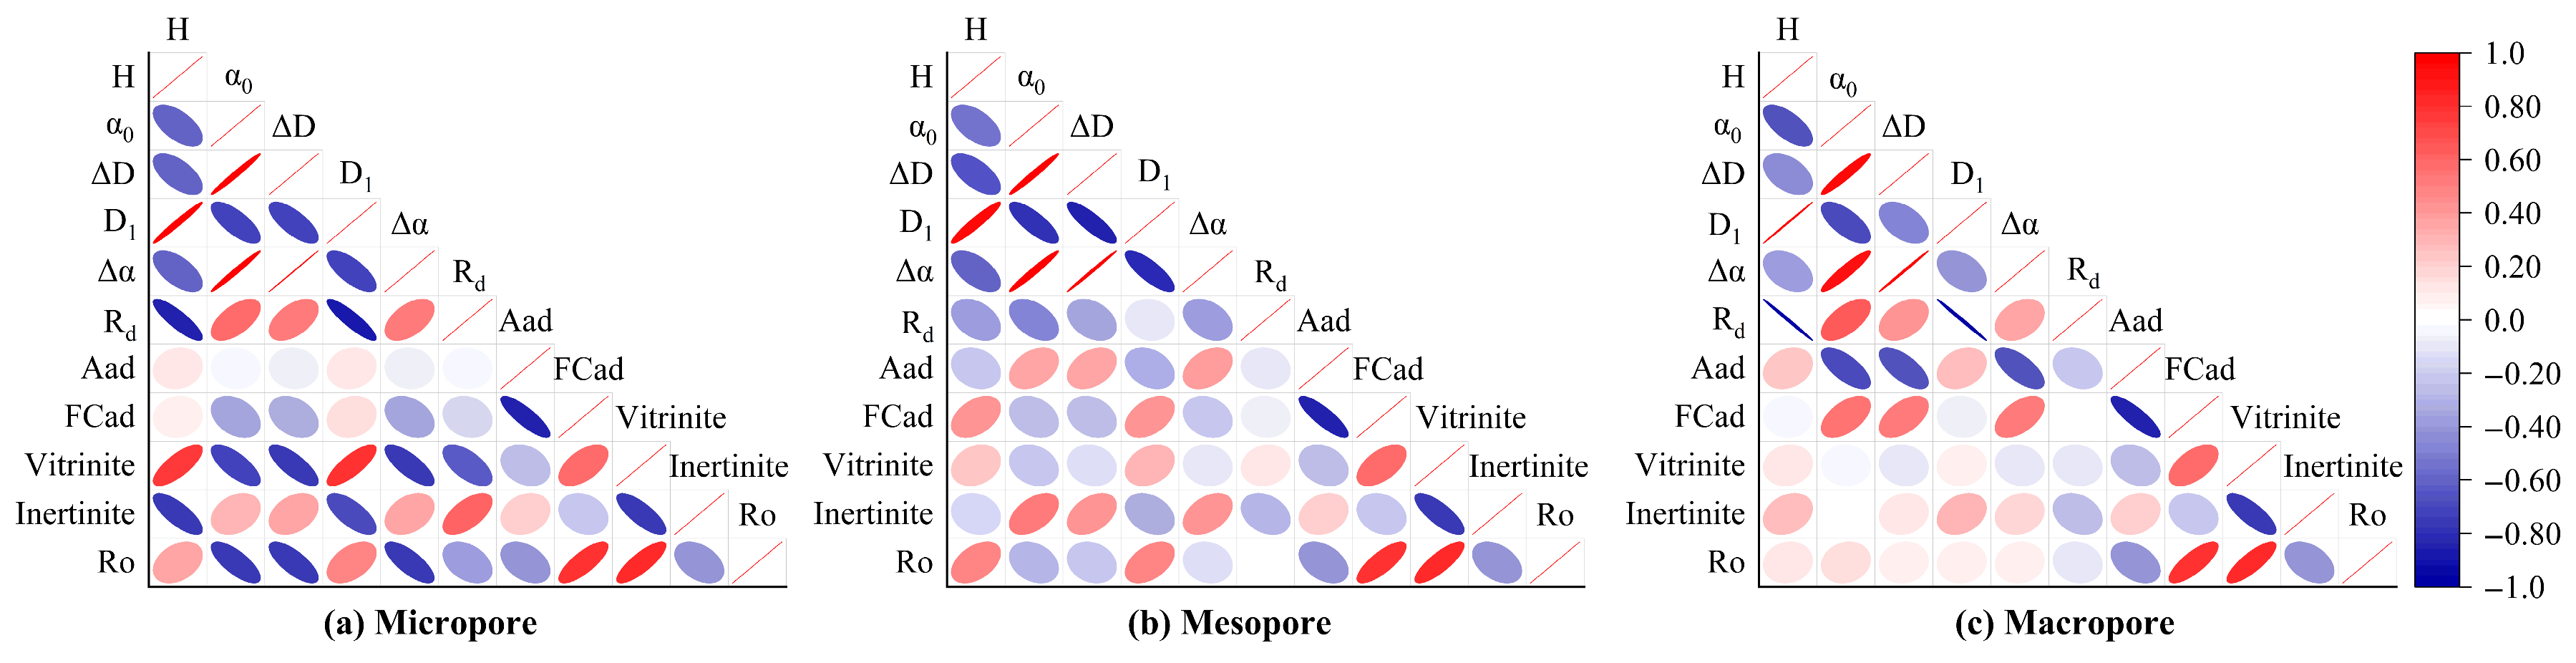
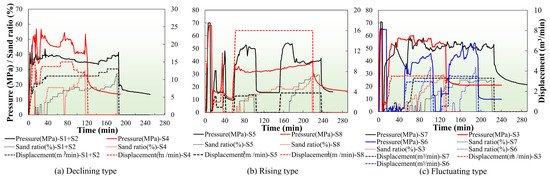
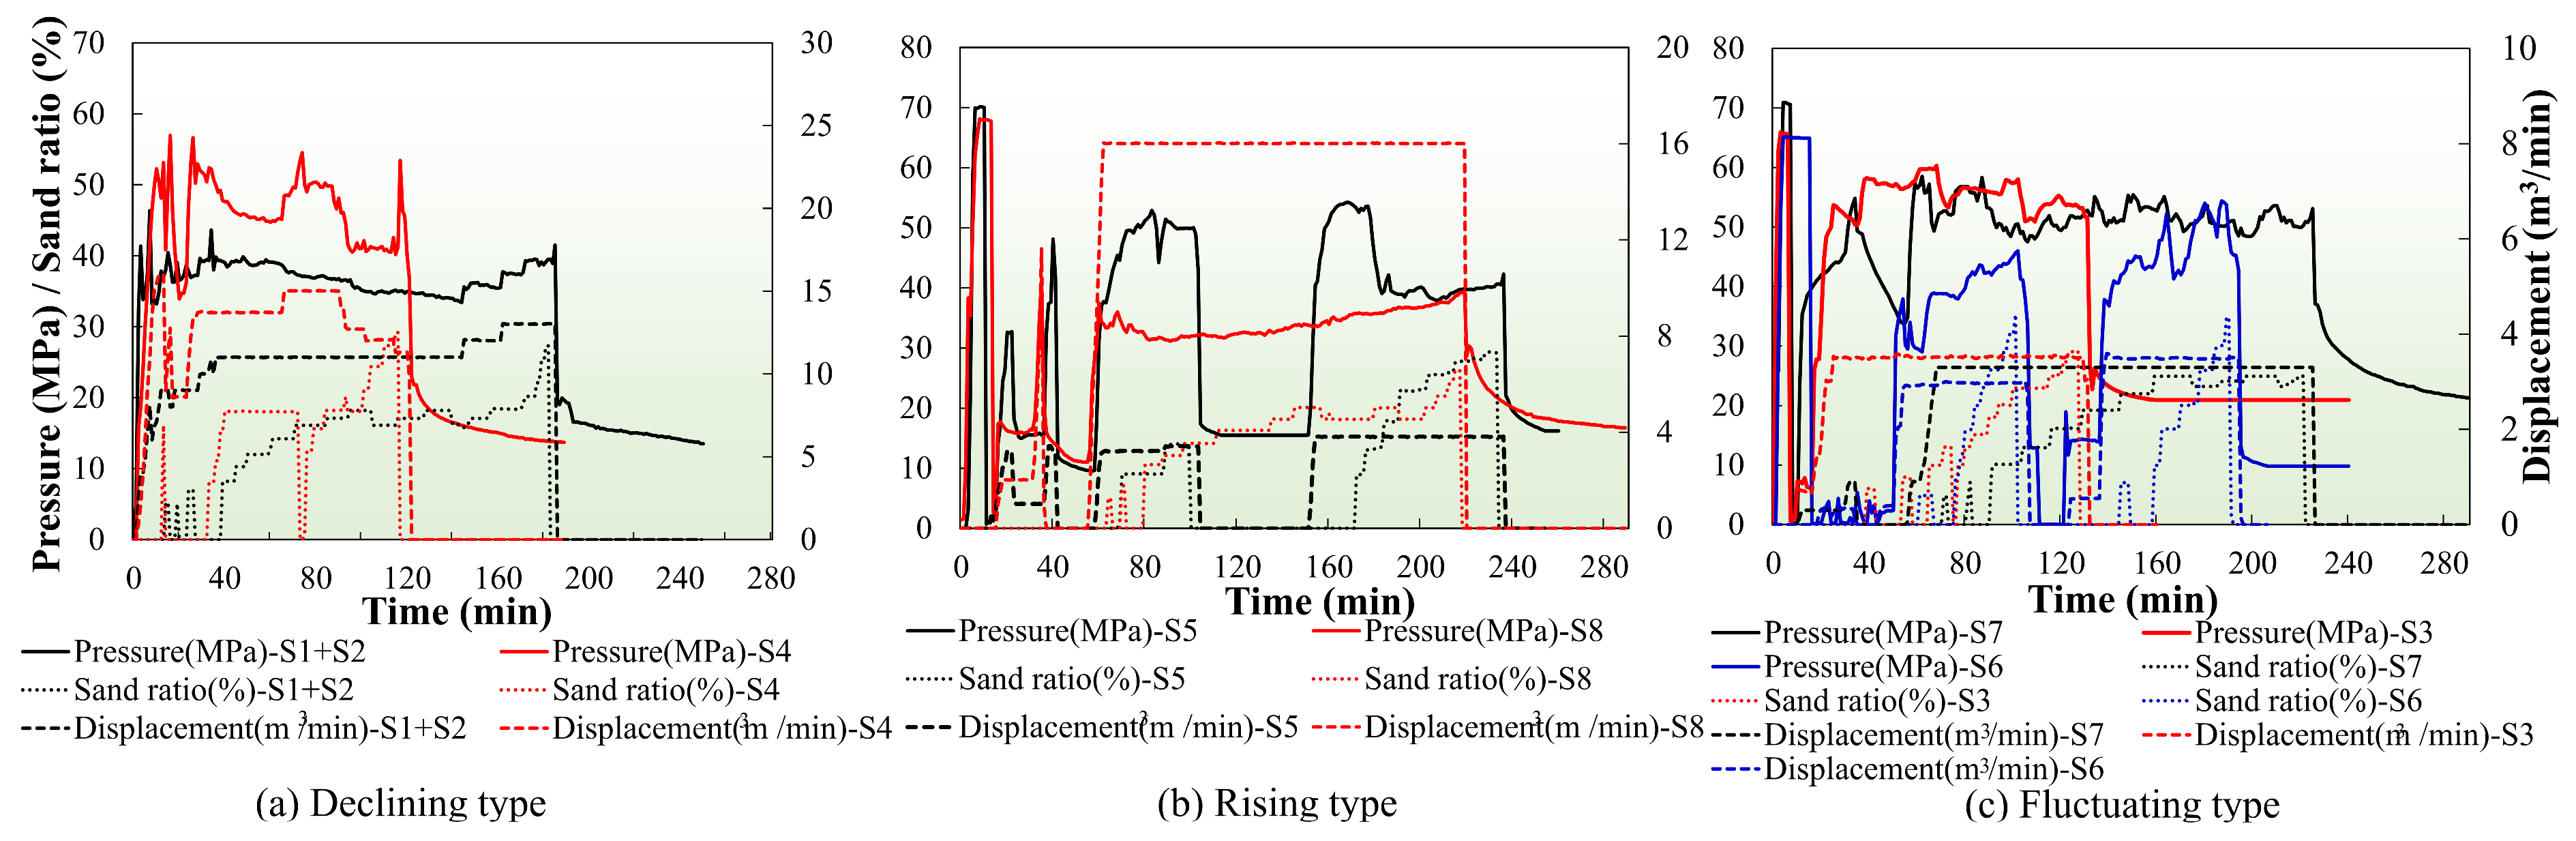
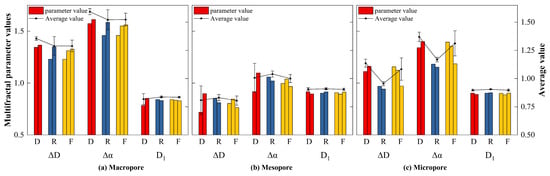
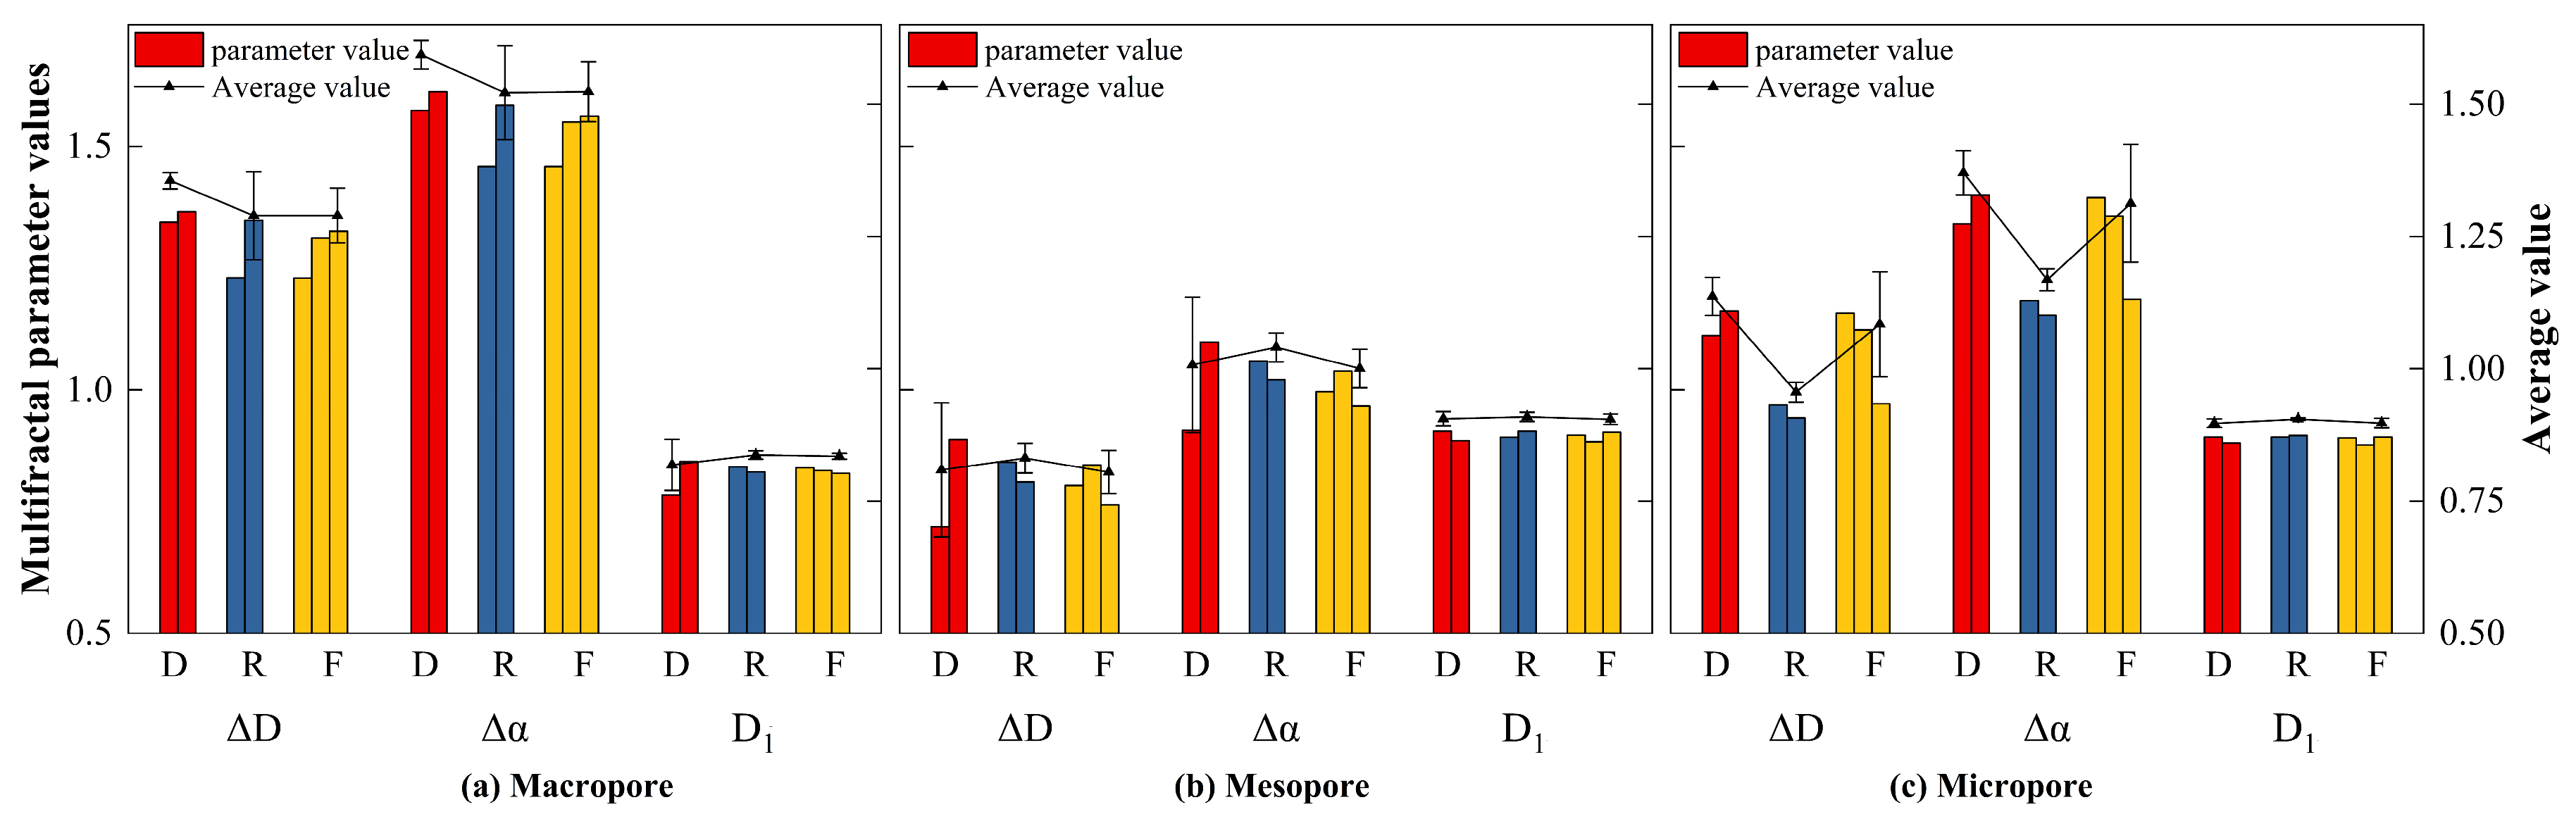
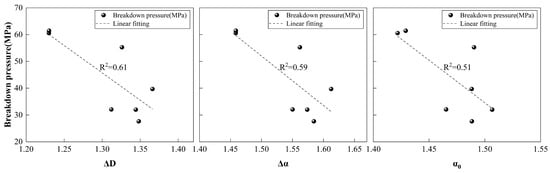
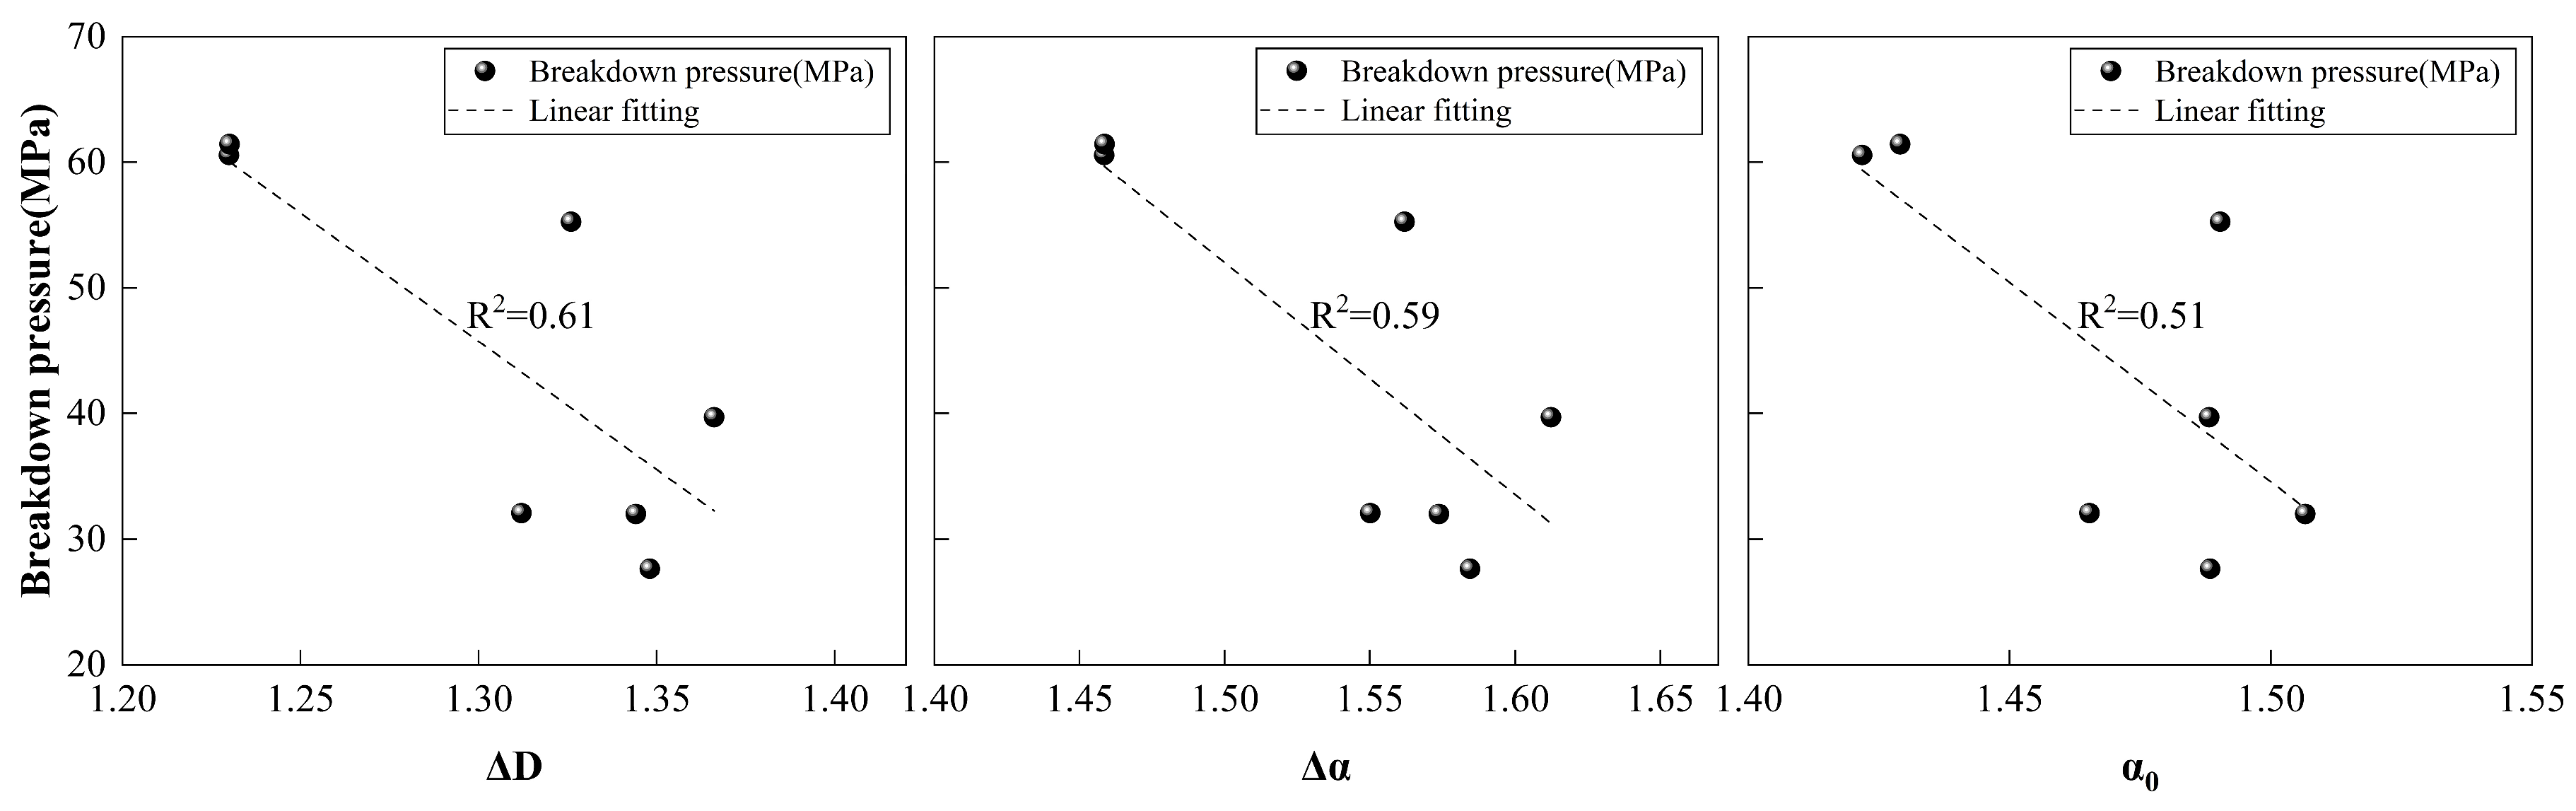

Disclaimer/Publisher’s Note: The statements, opinions and data contained in all publications are solely those of the individual author(s) and contributor(s) and not of MDPI and/or the editor(s). MDPI and/or the editor(s) disclaim responsibility for any injury to people or property resulting from any ideas, methods, instructions or products referred to in the content. |
© 2026 by the authors. Licensee MDPI, Basel, Switzerland. This article is an open access article distributed under the terms and conditions of the Creative Commons Attribution (CC BY) license.