


Abstract
A Monte Carlo based fractal prediction model is proposed to describe the evolution of surface morphology during the running-in process. The model accounts for the random and fractal characteristics of worn surfaces. The Weierstrass–Mandelbrot function is employed to simulate rough surfaces and establish the correlation between fractal dimension and surface roughness. By integrating traditional sliding wear models with surface effect functions, a unified prediction framework is developed. Experiments are conducted to obtain worn surface parameters and calculate fractal dimensions at different running-in stages. Model parameters are optimized by minimizing the variance between experimental and predicted results. Monte Carlo simulations are then introduced to represent the stochastic nature of the friction system, thereby improving prediction accuracy and objectivity. The proposed model reveals locally random yet globally convergent patterns, which are consistent with experimental observations. It effectively captures the stochastic evolution of surface morphology and provides a reliable approach for predicting worn surface behavior during running-in.
1. Introduction
Running-in is a complex process occurring between the contact interfaces of solid surfaces with relative motion. It is the initial stage that mechanical friction pairs experience before the normal operation. In order to achieve the prediction and control of the running-in process of mechanical systems, many scholars have proposed prediction models for the running-in process.
Existing predictive models primarily follow several research paradigms. The first type of model is macro prediction research based on the classical Archard model. For example, Argatov et al. [1] established a macroscopic prediction model for the running-in process based on elastic contact theory and the Archard wear model. The prediction results were consistent with the experimental results. Similarly, Ghosh et al. [2] simulated the surface wear depth using a modified Archard wear model and established a surface roughness prediction model based on the Hertz contact theory. The results showed that surfaces with higher roughness had higher wear rates. Akbarzadeh et al. [3] established a mathematical model for predicting the influence of the load distribution on the wear depth, surface temperature, and friction coefficient during the running-in process. In addition, Li et al. [4], Zhang et al. [5], and An et al. [6,7] constructed a mathematical model to predict the influence of load distribution on wear depth, surface temperature, and friction coefficient during the running-in process. They adopted machine learning, support vector machine, and contact stiffness analysis methods for modeling and prediction.
The second is the research on a new physical model for exploring the microscopic mechanisms of wear. To break through the limitations of classical models, scholars are committed to developing models based on physical mechanisms. Brink et al. [8] proposed a simple adhesive wear model under dry sliding conditions. The model relates the elastic–plastic contact solution to the volume detachment of the sliding surface in the form of wear particles, and the minimum size of the wear particles can be estimated. Hu et al. [9] discussed the plowing wear process of Archard’s law at interlocking interfaces through molecular dynamics simulations. In addition, increasing interfacial adhesion or reducing material ductility can shift the main wear factor from plasticity to fracture. Wu et al. [10] proposed a micro mechanical model to study the shear fracture and wear of metal materials containing random inclusions. Through this model, crack branching and crack aggregation during contact loading were simulated, elucidating the formation process of sheet-like wear particles. Li et al. [11] proposed a prediction model for cylinder block/valve plate interface wear considering multi-scale morphological evolution, including macroscopic contour wear and rough deformation. Although these models are effective under specific conditions, their common limitation is that they rely on Euclidean geometric parameters (such as Ra, Rz) to describe the surface, making it difficult to fundamentally characterize the multi-scale features and inherent randomness of surface morphology. Therefore, there are disadvantages in describing the complex nonlinear behavior of surface evolution during running-in processes.
To overcome the above limitations, the third type of model introduces fractal geometry theory. Fractal geometry has self-similarity and scale-free properties, which can more objectively describe the random behavior and detailed features of surface roughness at different scales [12,13,14,15]. Therefore, it is increasingly being used for the characterization of worn surfaces. Based on this, Chen et al. [16] developed a fractal prediction model to predict the sliding friction characteristics, contact mechanics, and asperities using kinematic analysis. When the surface roughness was large, mechanical deformation was dominant, and the friction resistance decreased with an increase in the fractal dimension. In contrast, the molecular adhesion on the surface was dominant, and the frictional resistance increased with a decrease in the surface roughness. Liu et al. [17] established a fractal model for predicting the fractal characteristics of worn surfaces during running-in wear based on contact and wear theories. The results showed that the results obtained from the prediction model were consistent with the experimental results. Wei et al. [18,19] used fractal parameters to characterize the changes in the morphology of the sealed end face during the running-in process. A prediction model for the average film thickness of the contact interface and the volume of micro-holes was established, and the wear prediction models using the bi-fractal layered surface characteristic parameters of the average change rate of surface wear depth under certain operating conditions with the wear process. These studies demonstrate the superiority of fractal geometry in describing complex surface shapes. However, most existing fractal prediction models are still deterministic frameworks that fail to fully incorporate the inherent randomness and nonlinear effects of friction systems, resulting in significant deviations between their prediction results and experimental data.
In terms of the system random, the Monte Carlo simulation method is optimal. As the Monte Carlo simulation method [20,21,22] has been successfully used in surface mechanics, tribology, and analytical models of abrasive wear, the results indicate that the Monte Carlo method is a very useful numerical calculation method. Thus, the key problem to be solved in this article is how to combine Archard, physical models, fractal geometry, and Monte Carlo methods to elucidate the surface evolution mechanism of the running-in process.
To fill the research gap mentioned above, this paper proposes a fractal prediction model that integrates Monte Carlo simulation, aiming to more accurately depict the random evolution behavior of the surface morphology of the friction pair during the running-in process. Firstly, the model is established based on the relationship between the fractal dimension and the roughness of the worn surface, as well as the traditional sliding prediction model. Then, the results of the running-in process tests are used to determine the relevant parameter values in the fractal prediction model. Finally, a fractal prediction model with randomness for surface morphology during the running-in process was established based on the random fractal dimension of the worn surface simulated by Monte Carlo. The effectiveness of the model was verified through running-in experiments. Thus, the proposed method can be used to predict and control the running-in process.
2. Fractal Characterization and Prediction Model for Worn Surfaces
This section describes the fractal characterization method of worn surfaces and the relationship between the surface’s fractal dimension and surface roughness. Then, a wear rate model that considers surface morphology parameters is established based on the traditional sliding wear model. The surface fractal dimension is introduced to establish a fractal prediction model for the worn surface during the running-in process.
2.1. Fractal Characterization Method for Worn Surfaces
Research has shown [23,24,25] that worn surfaces have complex and fine structures, exhibiting self-similarity and self-affine properties over a large-scale range. Therefore, worn surfaces have fractal characteristics, which are commonly simulated or characterized using the Weierstrass–Mandelbrot (W-M) fractal function. The expression for the W-M function is [26,27]
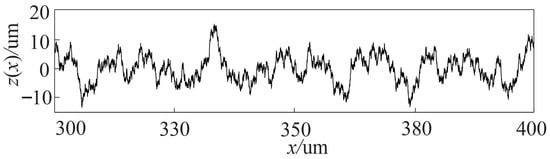
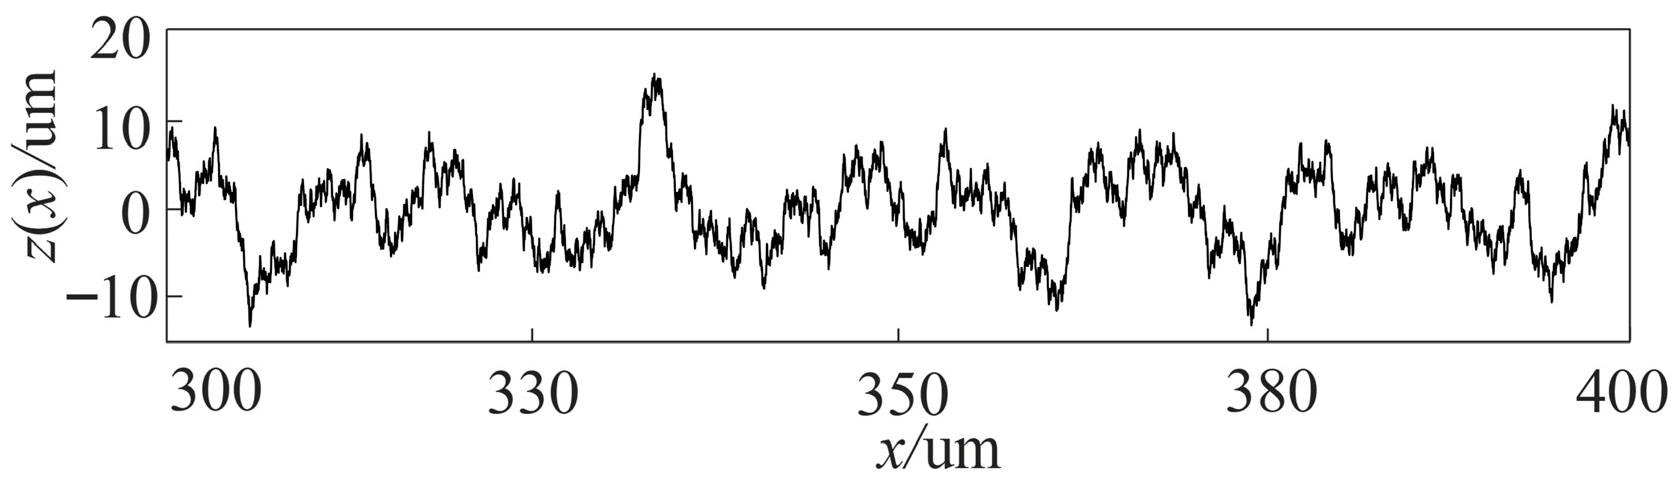
where z(x) is the rough surface contour height, x is the rough surface contour displacement coordinate, and D (1 < D < 2) is the surface contour fractal dimension, reflecting the complexity and roughness of the surface. G is the scale coefficient reflecting the surface roughness level and L is the sampling length. n is the frequency index, γ is a constant, which is greater than 1, and γn represents the spatial frequency of the contour curve, which is related to the sampling length L, γn = 1/L. Figure 1 shows the simulated wear surface morphology derived from the W-M function under specific parameter values.
Figure 1.
The worn surface morphology simulated by the W-M function.
The main characteristic quantity of fractal is the fractal dimension, which is a fraction. Only by measuring fractal objects with non-integer dimension scales can their characteristics be objectively reflected. Many definitions and calculation methods for fractal dimension have been used, including the root mean square method, structural function method, and the box dimension method. This study uses the structural function method to calculate the fractal dimension of worn surfaces. It is calculated as follows [28]:
where S(τ) is the measure of structural function; Z(x) is the fractal function derived from the W-M function; Ds is the fractal dimension; C is the scale coefficient, which is a function of G and D; and τ is coordinate displacement or measurement scale.
Equation (2) is rewritten as a power–law relationship in the following form:
where α(Ds) is a function of the surface fractal dimension Ds.
Equation (3) provides a straight line in the log–log coordinate system:
where α(Ds) is the slope of the line, from which the fractal dimension Ds of the surface contour can be obtained. logC is the intercept between the line and the vertical axis, from which the scale coefficient C can be obtained.
Different wear surfaces have corresponding fractal parameters. To perform a fractal characterization of wear surfaces, the measure S(τ) at different scales τ is calculated by measuring the surface profile curve. Point pairs (log S(τ), log τ) are obtained on a logarithmic coordinate system and fit in a straight line; the fractal dimension D can be obtained from the slope of the fitted line, and the scale coefficient C is obtained from the intercept, thereby achieving fractal characterization of the worn surface.
2.2. The Relationship Between the Surface Fractal Dimension and Roughness
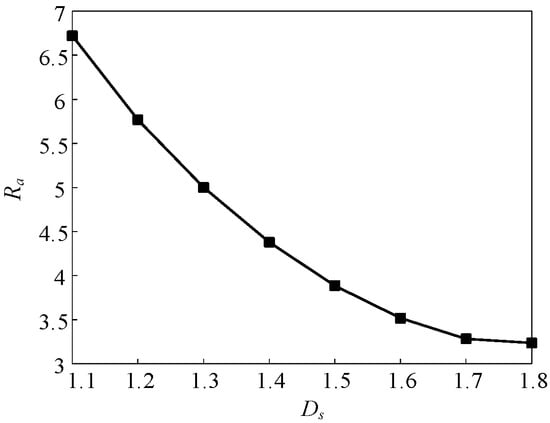
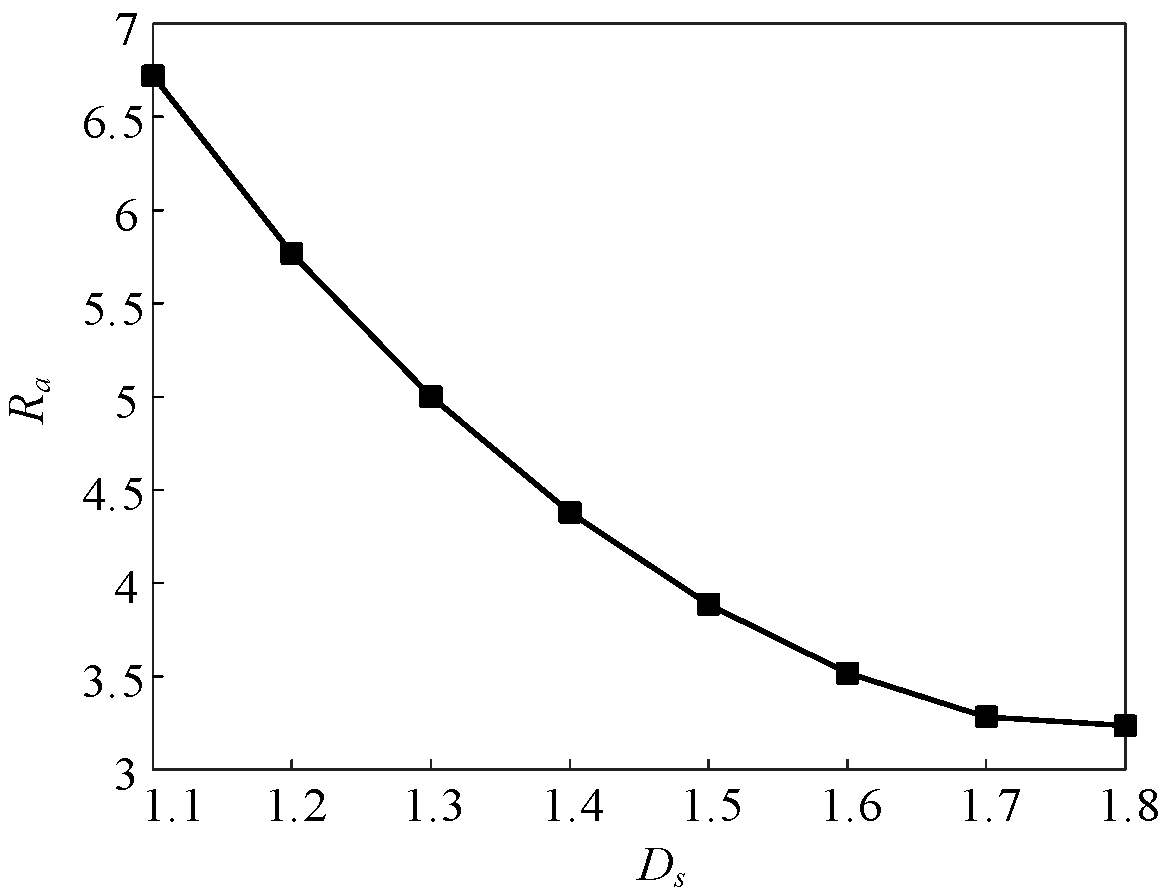
The relationship between the fractal dimension parameters and roughness parameters are determined using the surface profile generated by the W-M function in Equation (1). The range of values for x is 300–400 μm, and G = 1.5 × 10⁻⁷ μm, γ = 1.1. The value range of n is 0–80, generating a profile with 10,000 points [26,27]. The fractal dimension Ds ranges from 1.1 to 1.8, with an interval of 0.1, which is selected through the experiments results. Therefore, by calculating the roughness Ra of contour curves with different fractal dimensions, the relationship between the Ra and Ds is shown in Figure 2.
Figure 2.
The relationship between Ra and Ds (G = 1.5 × 10⁻⁷ μm).
As shown in Figure 2, as the fractal dimension Ds increases, the roughness Ra gradually decreases, indicating that the surface roughness and surface fractal dimension have opposite evolutionary characteristics. The fitted relationship is
2.3. Fractal Prediction Model for Worn Surfaces
- (1)
- Wear rate equation
For adhesive wear and abrasive wear, the wear amount W is directly proportional to the normal load Fn and sliding distance S, and is inversely proportional to the yield limit of softer materials σs or hardness H [29]:
Equation (6) is the Archard equation for adhesive wear, i.e., the amount of wear during plastic contact. K is the wear coefficient related to the contact surface morphology. The K value is generally 10−8–10−4 for mild wear and10−4–10−2 for severe wear.
In most plastic contacts cases, the composite action of the normal stress σs and shear stress τ causes plastic yielding at the contact point, increasing the contact area and affecting the friction coefficient. For general micro convex bodies, there are
where α = (σm/τb)2, τb is the shear strength limit of softer materials. Based on empirical studies, α = 9 [30]; σm is the contact stress during the complete plastic deformation under normal compression, and σm = H.
According to Bowden and Tabor et al. [31,32], τ = μσs. The wear rate can be obtained using Equation (8):
where vr is the relative sliding speed of the two surfaces and μ is the friction coefficient. K is a constant when the system is stable; when the system is unstable, the K value depends on the surface morphology, lubrication medium, and other factors.
- (2)
- Surface state equation
A simplified surface state equation function F(Ra) describing the effect of the surface morphology on the wear rate is established based on Hu et al. [33] and Kragelsky’s theory. It does not consider physical and chemical factors and uses only roughness as the factor influencing surface morphology. Therefore, Equation (8) can be rewritten as
where the expression of the surface effect function F(Ra) is
where a0, a1, and a2 are parameters of physical and chemical properties (such as parameters greater than 0 related to surface material and lubrication).
Therefore, substituting Equation (10) into Equation (9) yields a wear rate of
Two processes, i.e., smoothing and roughing of the surface, are considered to study the influence of the surface morphology on the wear rate during the running-in process. The two processes occur simultaneously, and the degree of wear depends on the dominant process. The state equation for the surface morphology during the running-in and roughening processes is defined as
where is the change rate of surface roughness, is the wear rate, and is the wear rate of the system in the lowest stable wear stage; b0, b1, and b2 represent the probability of surface roughness, which depends on the lubrication medium and other physical and chemical factors. P is
Since μ changes over time, using μ(t) substitute, then
- (3)
- Fractal prediction equation
Substitute Equation (5) into Equation (12) to obtain the fractal prediction model for worn surface morphology:
where b2′ = b2/6.229 is the probability parameter of surface roughness. The wear rate expressed by the surface fractal dimension is obtained by substituting Equation (5) into Equation (11) as follows:
where a1′ = a1/6.229 and a2′ = 6.2292a2 are parameters related to physical factors. When the materials of the pair changes, the parameters of a2′, a2, a1′, a1, a0, b0, Ra, and μ have changes with a different hardness ratio.
3. Results
The running-in experiments were conducted and the collected surface morphology data were used to calculate the roughness and fractal dimensions of the worn surface and determine the parameters of the fractal prediction model. Subsequently, the fractal prediction model is used to predict the fractal dimension, and the results are compared with the experimental results.
3.1. Running-In Experiments and Results
3.1.1. Running-In Experiments
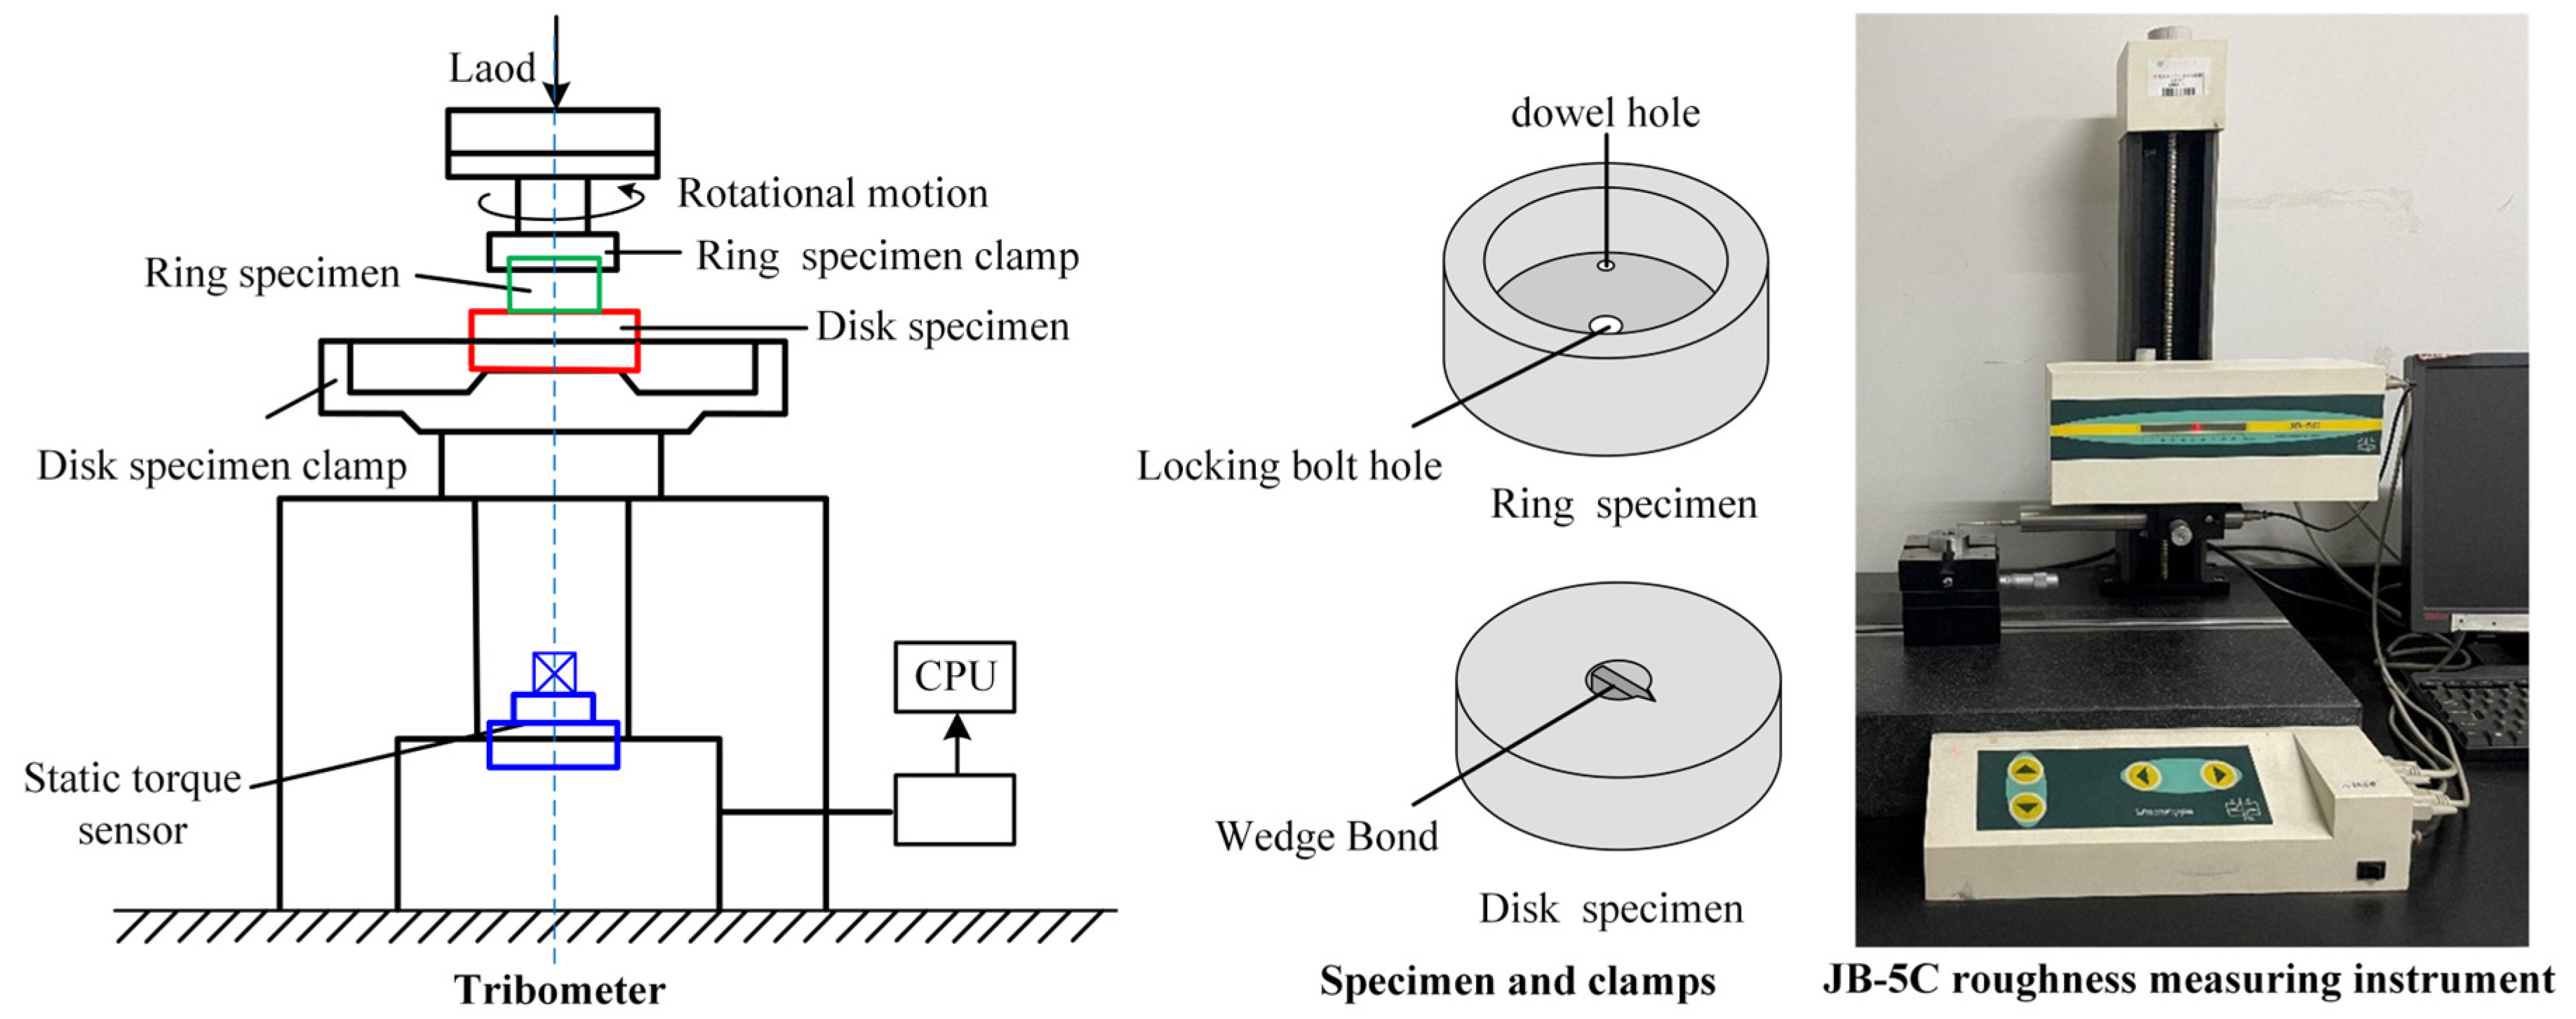
The running-in test is conducted on a tribometer using a ring disk friction pair. The running-in tests were conducted on the tribometer and the surface roughness was measured with JB-5C instrument, and the devices are shown in Figure 3; the working condition parameters are listed in Table 1. In addition, the ring specimen material is GCr15 bearing steel, with a hardness of 61 RC and surface roughness Ra = 0.05 ± 0.005 μm. The outer diameter of the ring specimen is 34 mm and the inner diameter is 24 mm. The disk specimen material is 45# steel, with a hardness of 22 HRC and surface roughness Ra = 2.4 ± 0.05 μm. The dimensions are Φ46 mm × 12 mm. In order to ensure the consistency of the surface morphology of the friction pair specimen, the processing of the ring and disk specimens is carried out by the same person on the same equipment. The surface of the ring is obtained by grinding, and the surface of the disk is obtained by turning; a softer body is considered for the faster wear and large changes, and the more solid body has less wear amount and small changes.
Figure 3.
The devices used in the experiments.
Table 1.
Working condition parameters for running-in test.
Staged running-in tests with different specimens were used to measure the surface morphology and wear rate at different times. Multiple friction pairs with the same or similar initial surface roughness values were used (18 pairs were used in each of the four sets of tests). The test was stopped when the set time was reached. The friction pair was replaced after collecting surface morphology and wear rate data. The same amount of lubricating oil was added, and another running-in test was conducted. The running-in time for the friction pairs was increased. Due to the complex changes in surface morphology and other information during the initial running-in stage, the test time interval during the initial running-in stage is set to be shorter, while the information change during the stable stage is relatively stable, and the time interval is set to be longer. The durations of the four tests were 15 min, 30 min, 45 min, 60 min, 75 min, 90 min, 105 min, 120 min, 150 min, 180 min, 210 min, 240 min, 270 min, 300 min, 330 min, 360 min, 390 min, and 420 min. The wear surface morphology and roughness values were obtained offline in each running-in stage. Before collecting the surface morphology data, the specimen was degreased and cleaned by ultrasound.
3.1.2. Experimental Results and Analysis
- •
- Surface morphology of worn specimens during the running-in process
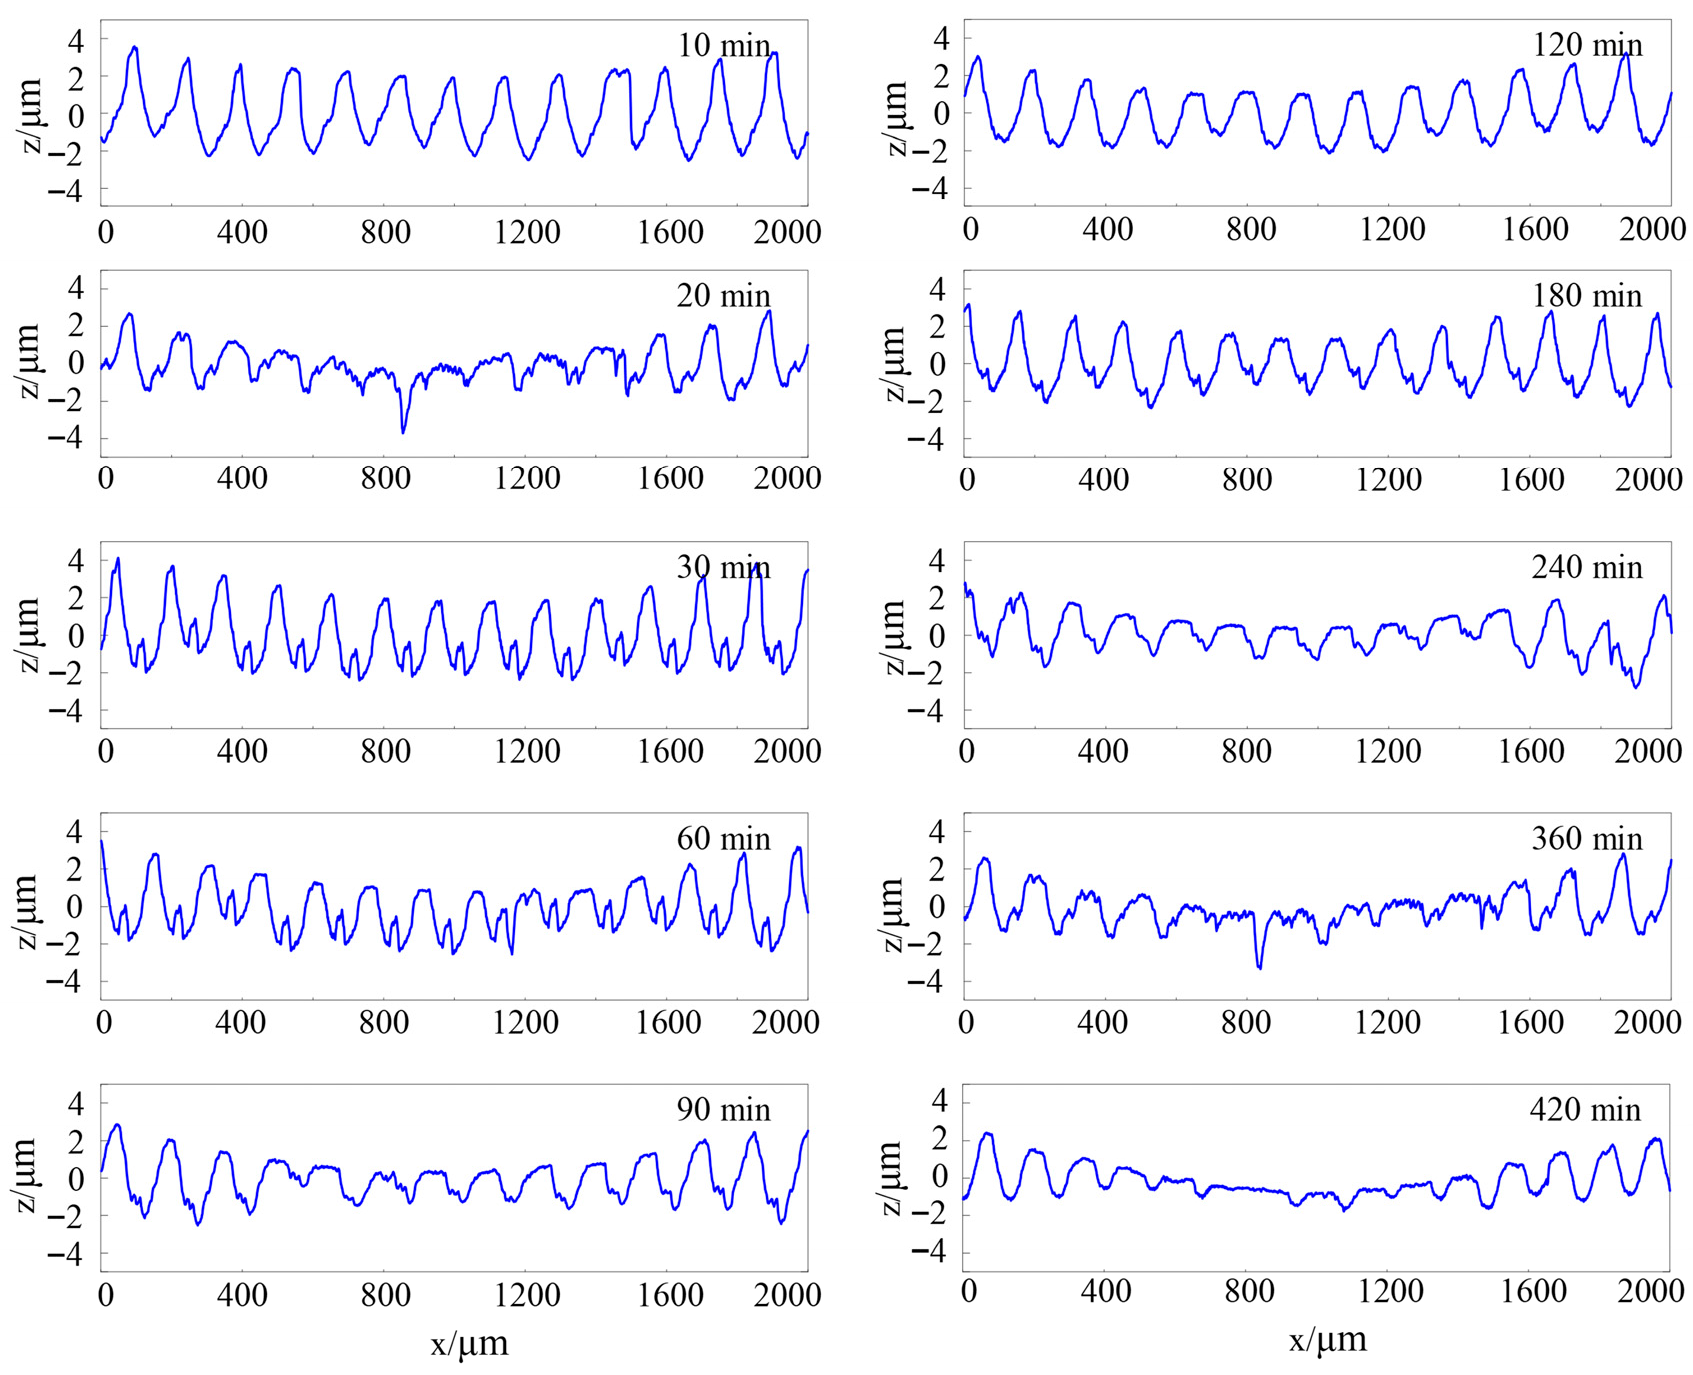
Due to space limitations, only the results for some of the surface profiles of the specimens in test 1 are shown in Figure 4.
Figure 4.
Changes in surface profiles of the disk specimens during the running-in process in test 1.
As the running-in process progresses, the amplitude of the surface contour curve of the disk specimen decreases, indicating that the surface of the disk specimen becomes smoother. The amplitude of the contour curve of the ring specimen increases, indicating that the surface is becoming rougher. Therefore, the disk and ring specimens exhibit opposite responses during the running-in process, resulting in similar morphologies of the two surfaces and indicating that the friction pair has entered the running-in state. The other three sets of running-in tests showed the same results.
- •
- Surface roughness and wear rate during the running-in process
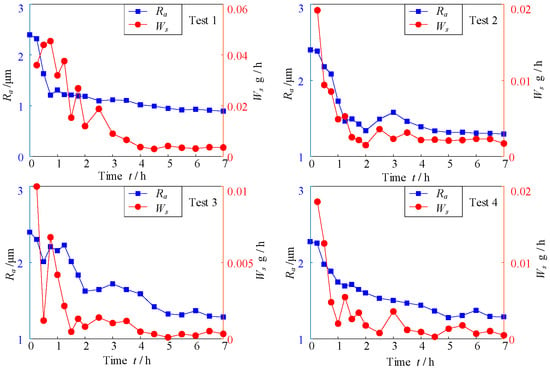
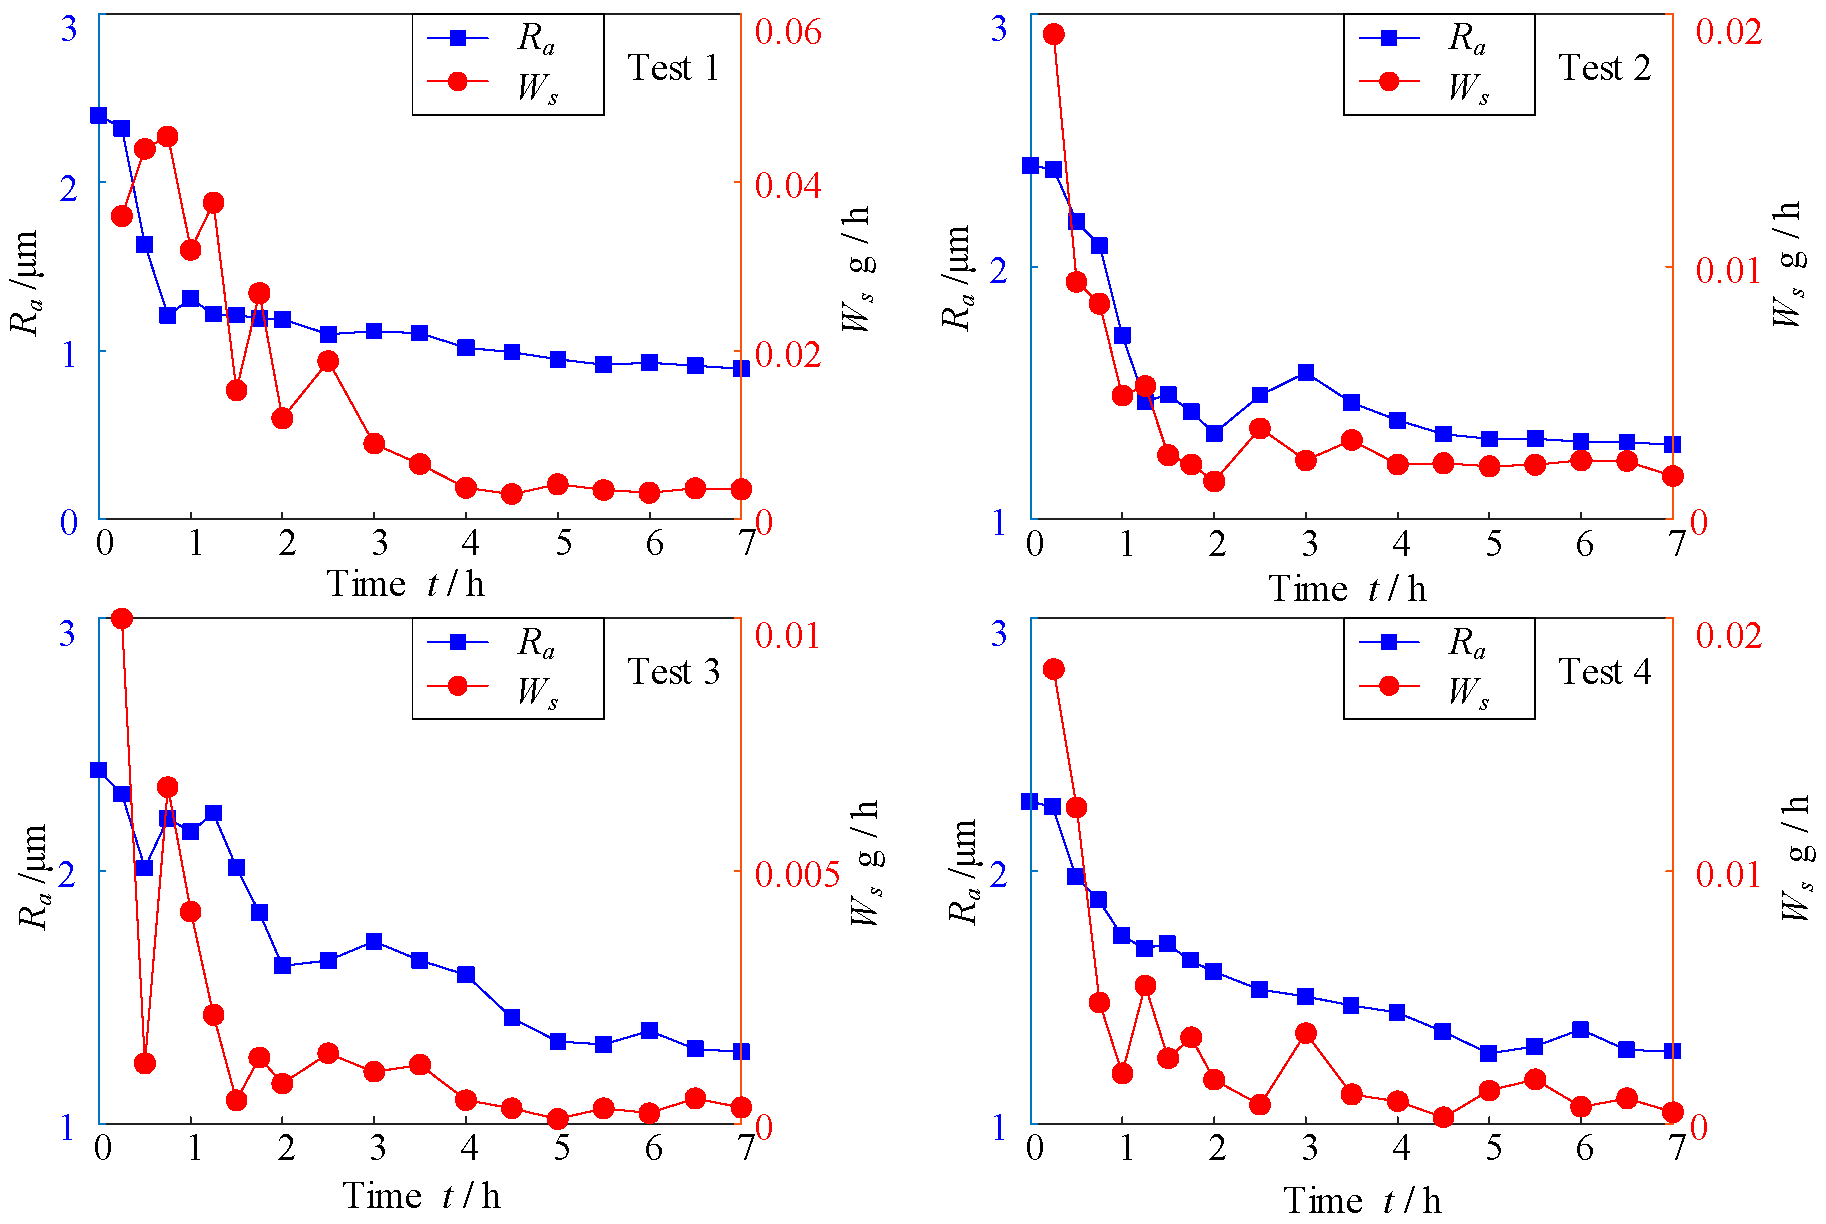
The evolution of the surface roughness and wear rate of the disk specimens in the four sets of running-in tests is shown in Figure 5. Roughness decreases with increasing speed, while wear rate increases with increasing speed. As speed increases, roughness decreases and wear rate increases; as load increases, wear rate increases and roughness decreases. Due to the limited number of experimental variables, the evolution laws with speed and load are also influenced by the randomness of the friction system, resulting in certain differences. The experimental data in this paper can provide a basis for the study of operating condition parameter laws.
Figure 5.
Evolution of the surface roughness and wear rate of disk specimens during running-in tests.
During the running-in process shown in Figure 5, the surface of the disk specimen gradually becomes smoother from rough, and the wear rate decreases and eventually stabilizes. In the initial running-in stage (especially during the first 1–2 h), the disk surface is relatively rough. The peak points (micro-protrusions) on its initial rough surface undergo severe plastic deformation, fracture, and removal, leading to non-uniform changes in wear volume within a short period of time, and thus significant fluctuations in the wear rate curve. This phenomenon is mainly attributed to the dynamic characteristics of the running-in period: firstly, the rapid reconstruction of surface topography and the severe changes in micro-protrusions cause short-term uneven wear volume. Secondly, large-sized and irregular wear debris generated in the initial stage may temporarily reside in the contact area, acting as a “third body” that sometimes exacerbates abrasive wear and sometimes is ejected, leading to fluctuations in the wear rate. Thirdly, the contact state is unstable, and during the transition from initial point contact to stable surface contact, the actual contact area and contact stress undergo drastic changes.
As the running-in process progresses, the harder ring surface gradually wears down the rough peaks of the softer disk surface, reducing the roughness of the disk surface and thus gradually lowering the wear rate. In the later stage of running-in, the rate of decrease in disk surface roughness slows down and stabilizes near the lowest value, with the surface becoming smoother. At this point, the disk surface is worn down, the generated wear debris decreases, and the wear rate remains at a lower level. The entire running-in period, as a dynamic process, experiences a transition from severe changes to a stable state in terms of surface topography and wear behavior. Generally speaking, in terms of the influence of the load, the steady-state wear rate also rises as the load increases. For surface roughness, there may be a critical load threshold. Below this threshold, roughness decreases due to plastic flattening, while above it, it increases due to severe plowing or spalling. Regarding the influence of speed, an increase in speed usually leads to an increase in frictional heat, which may promote the formation of oxide films (thereby reducing wear rate and roughness), but it may also cause thermal softening (thereby increasing adhesion and roughness).
- •
- The evolution of the surface fractal dimension during the running-in process
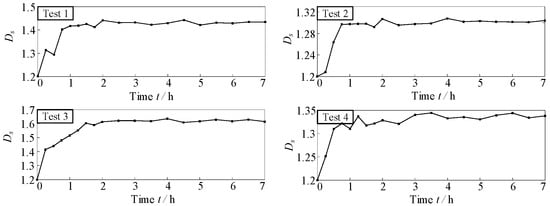
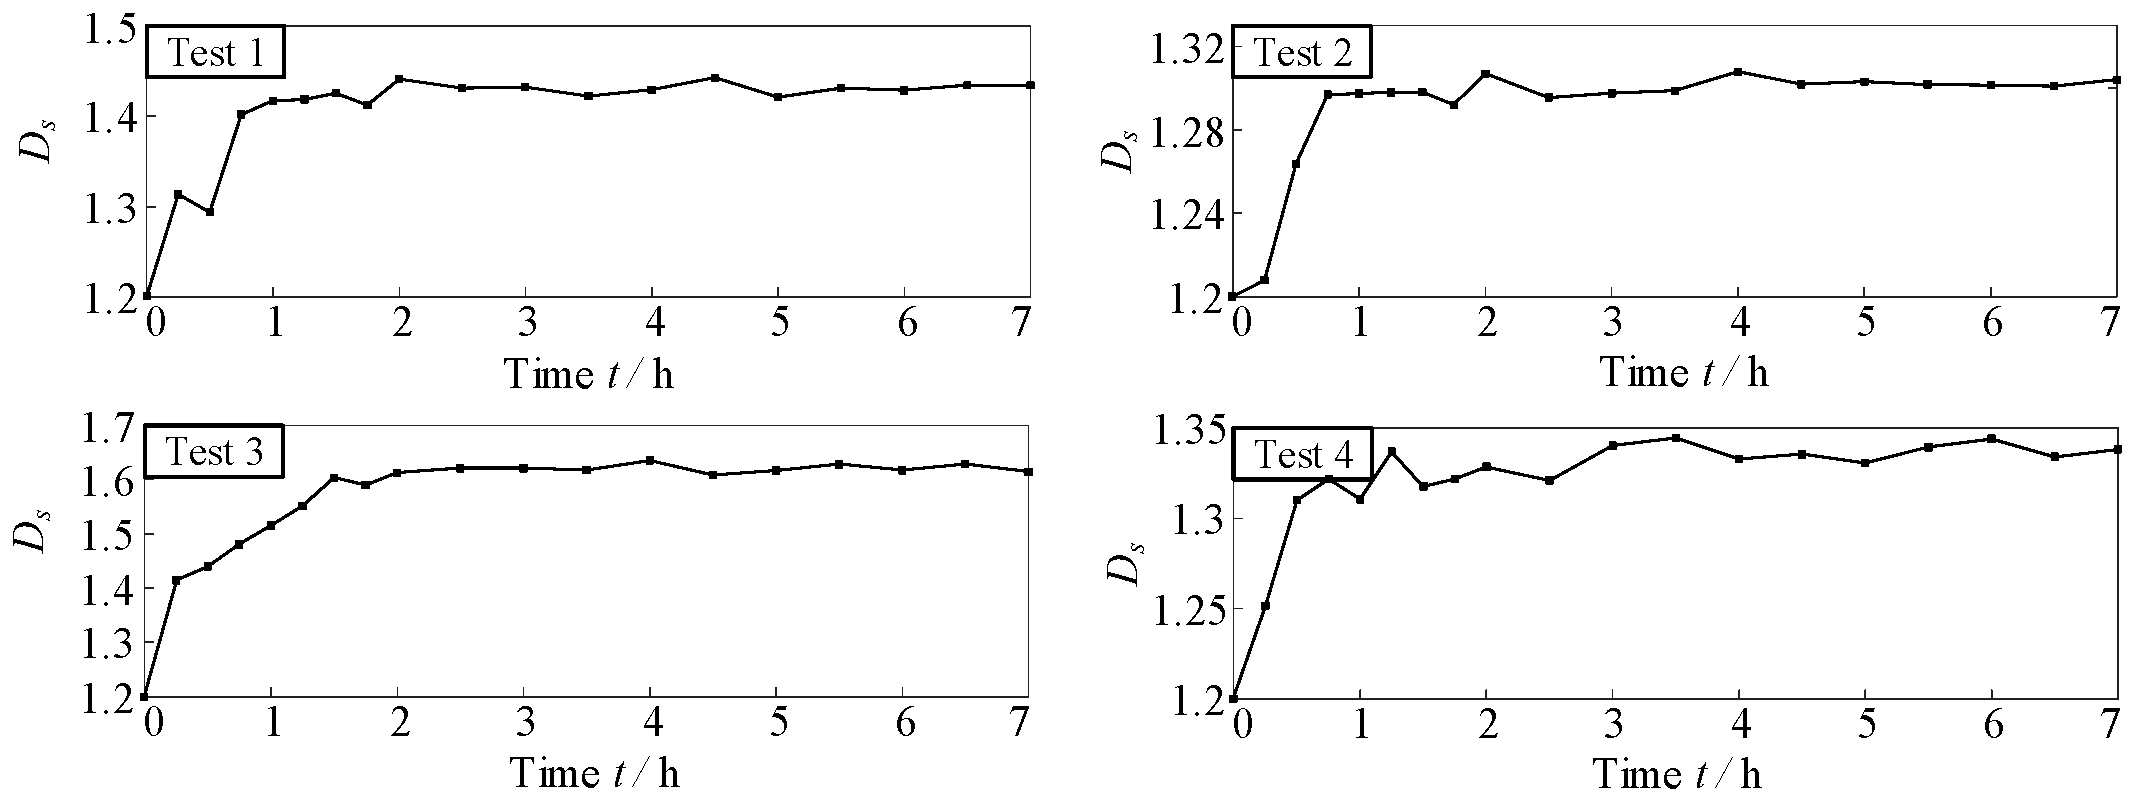
The evolution of the disk specimen surface fractal dimension Ds in the four sets of tests are shown in Figure 6.
Figure 6.
Changes in the disk specimen surface Ds in four sets of experiments.
As the running-in process progresses, the Ds of the worn surface increases and stabilizes. In the initial running-in stage, the disk specimen initial Ds is small and then fluctuates. When the running-in process enters the later stage and reaches the running-in state, Ds gradually increases and stabilizes at a larger value. These results are consistent with the evolution process of the worn surface morphology from initial roughness to smoothness after the running-in process.
3.2. Comparison of Calculated and Experimental Results
The values of the system parameters under four different operating conditions are calculated based on the experimental results. The unknown parameters of the system were derived from the experiment using the following three steps:
- (1)
- We used initial roughness μ0 ∈ [0.1, 0.3] and mean roughness μs ∈ [0.1, 0.2] with an interval of 0.01; a0 ∈ [1 × 10⁻⁵, 1 × 10⁻³] and a1′ ∈ [1 × 10⁻⁵, 1 × 10⁻³], with an interval 1 × 10⁻⁵; a2′ ∈ [1 × 10⁻³, 0.1] and b0 ∈ [1 × 10⁻³, 0.1], with an interval of 1 × 10⁻³; b1 ∈ [1 × 10⁻⁴, 1 × 10⁻³] and b2′ ∈ [1 × 10−4,1 × 10−3], with an interval of 1 × 10⁻⁴; and the values of the parameters are clarified and validated according to experiment signals.
- (2)
- The sequences of the interval of each parameter are generated, and they are substituted into Equations (15) and (16) so as to participate in the cyclic calculation. In addition, the other parameter of G, H, α, Wm, and Ds0 are decided by the material characteristics, initial surface characteristics, and experiment signals of the friction pair with a mean value.
- (3)
- Calculate the minimum variance σmin2 between the experimental and simulation results: σ2 = (Ds1 − Dsm)2 + (Ds2 − Dsm)2 … + (Dsn − Dsm)2)/n, where Dsm is the experimentally derived fractal dimension during the running-in process and n is the number of sample values. The σmin2 values obtained are 0.09864, 0.02747, 0.1255, and 0.05134 for the four tests, respectively. The parameters obtained from the fractal prediction model are listed in Table 2.Table 2. Parameters of prediction models under different operating conditions.
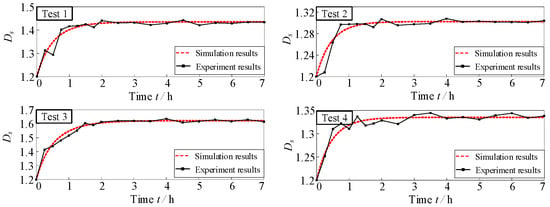
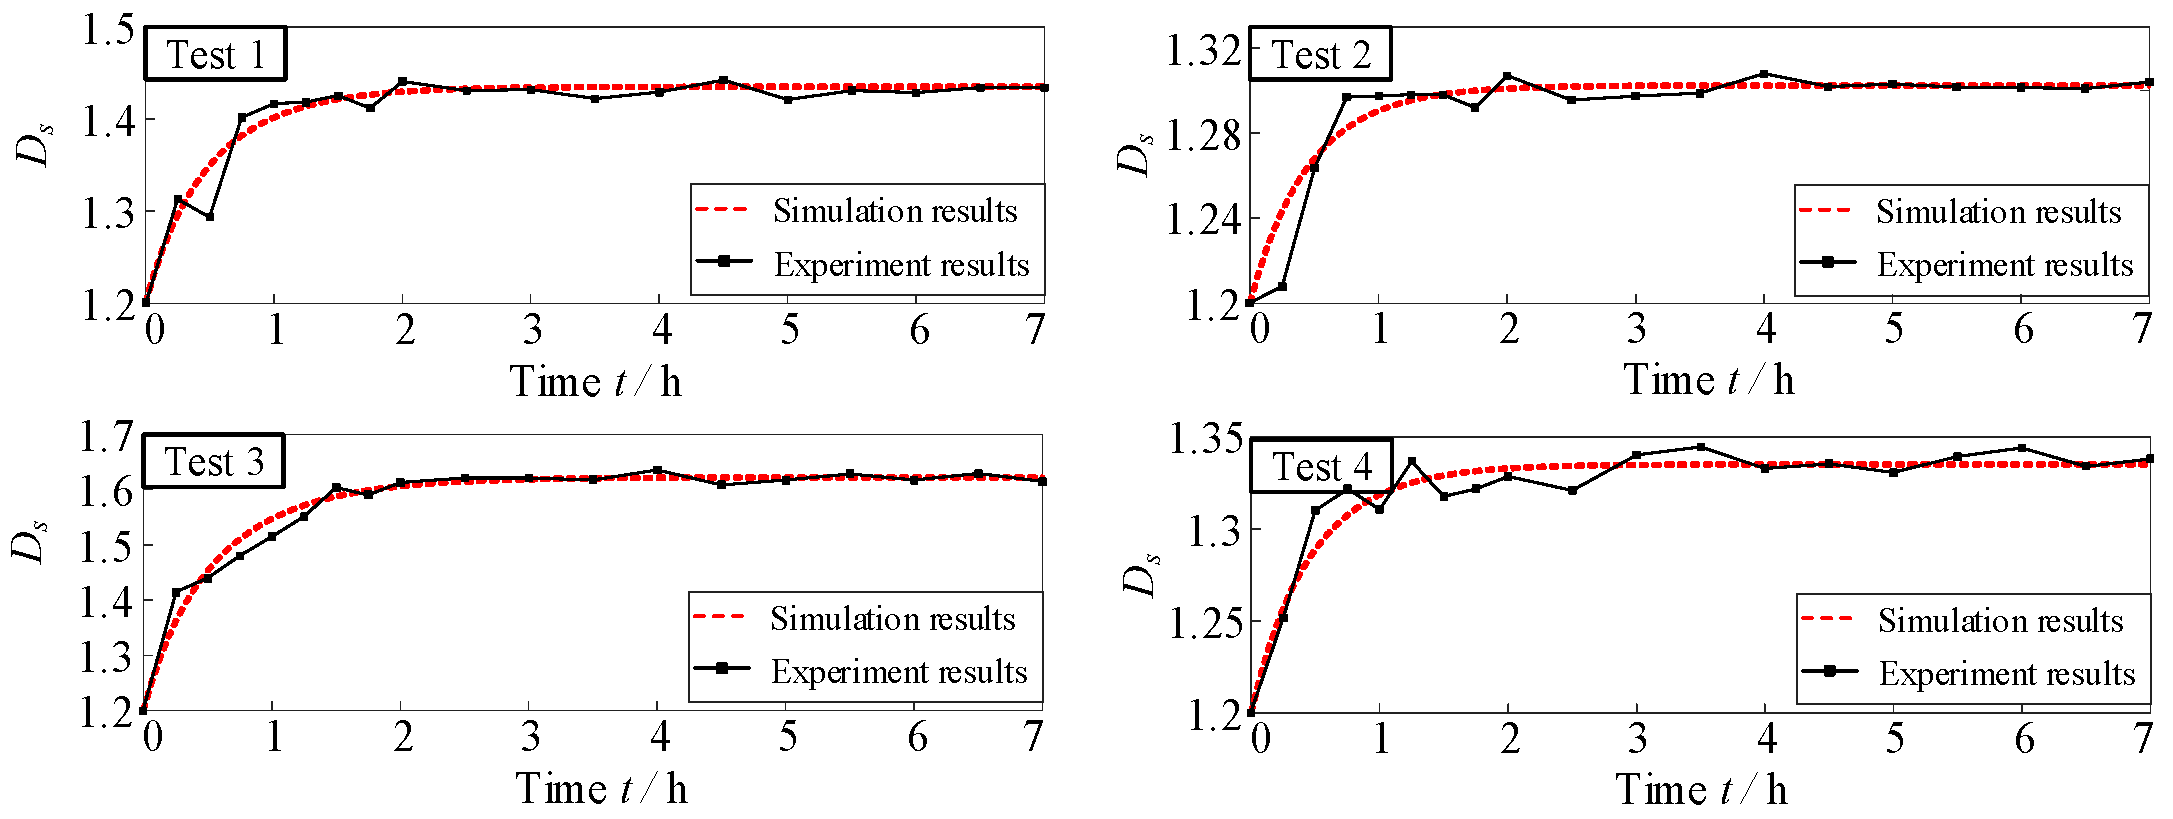
Based on the parameter results in Table 2, calculations were conducted to obtain the fractal dimensions for the four test conditions (Figure 7).
Figure 7.
Experimental and simulation results of fractal dimension of worn surfaces.
The Ds evolution of the wear surface derived from the fractal prediction model is consistent with the experimental results. The surface fractal dimension of the friction system changes from an unstable to a stable state, and the simulation results reflect the effectiveness of the proposed fractal prediction model.
Through the simulation process, it can be found that when the materials of the pair change, the parameters of a2′, a2, a1′, a1, a0, b0, G, and H have changes with a different hardness ratio. These parameters directly affect the results of the surface fractal dimension in experiments and simulation. The parameters of Wm, μ, μ0, and Ra are decided by the processing technology and operating conditions of the sample, etc. Thus, it can affect the experiments and simulation results in Ds.
4. Discussion
4.1. Randomness of Fractal Dimension Evolution of Surface Morphology
As shown in Figure 7, the fractal dimension curve of the wear surface simulated by the fractal prediction model is a smooth. However, the results of the wear surface roughness and surface fractal dimension obtained from the experiment indicate a gradual transition from an unstable rough surface to a stable smooth surface on the worn surface during the running-in process. Due to the interaction of wear mechanisms such as adhesive wear and abrasive wear, the changes in the wear surfaces at two similar moments during the running-in process are random. The wear surfaces may become rough or smooth at two similar moments, and the fractal dimension exhibits random fluctuations in a small range. The curve derived from the experimental result is not as smooth as that obtained from the fractal prediction model. Thus, the model does not reflect the randomness of the friction system. Therefore, a Monte Carlo simulation fractal prediction model was established to improve the accuracy of the model’s prediction results.
4.2. Monte Carlo Simulation
A Monte Carlo simulation method was used to generate a random quantity of surface fractal dimension rε. The random vector variable rε in Equation (15) was used to obtain Equation (17):
where k is the coefficient of the random quantity and rε is the random vector of the fractal dimension of worn surface morphology.
The determination of a random quantity rε includes the following steps:
- (1)
- According to the experimental results of the fractal dimension (Figure 7), it is assumed that the fractal dimension during the running-in process has a normal distribution with a mathematical expectation of 0 and a standard deviation of 1.
- (2)
- Assuming that the random parameter k in the fractal prediction model has a range of [10−6, 10−4], with an interval of 10−6, we obtain a random vector sequence with a normal distribution using a random number generator.
- (3)
- The random vector sequence is substituted into Equations (15) and (16) for cyclic iteration to generate a surface fractal dimension with random characteristics.
- (4)
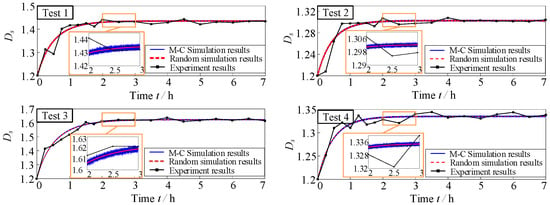
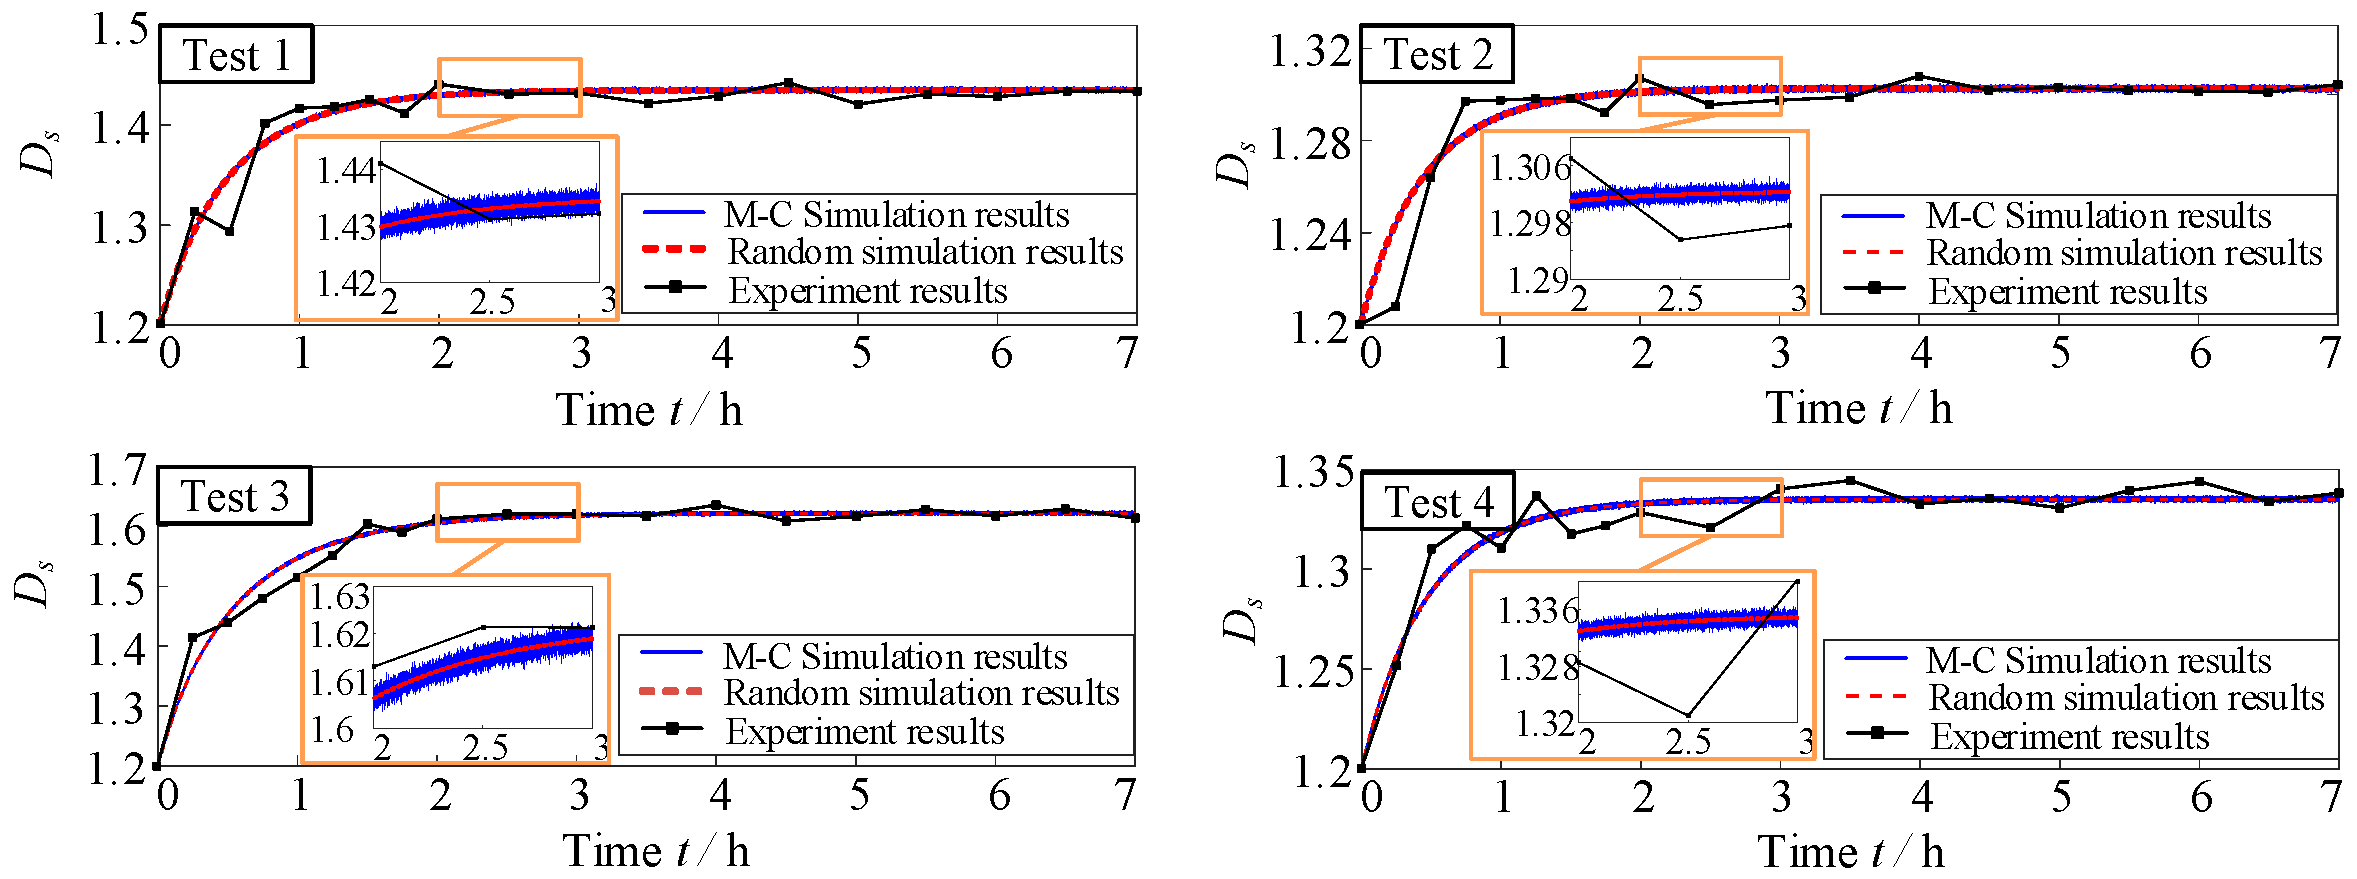
- The coefficients k of the random vector parameters of the prediction model are 2 × 10⁻⁵, 1.5 × 10⁻⁵, 2 × 10⁻⁵, and 1.1 × 10⁻⁵ for the minimum variances between the fractal dimension of the four simulated and experimental results (0.0005, 0.0005, 0.0009, and 0.0011, respectively). The Monte Carlo (M-C) simulation results of the fractal dimensions of four sets of worn surfaces are shown in Figure 8. In the Monte Carlo simulation, the simulation cycle is 500, the result is the mean value, the random simulation number is 252,000, and the generation criteria for the random number and the assumed number of k value are the experiment signals’ stochastic characteristics, which can be improved through a large amount of experimental data.Figure 8. Results of the fractal dimension of worn surface.
In Figure 8, due to the difficulty in distinguishing the detailed characteristics of curve thickness under the same scale coordinate, the method of intercepting and enlarging part of the curve result is used to observe its dynamic characteristics and randomness. Compared with the M-C simulation results, due to the limited experimental data samples, the fluctuation range of the experimental results is relatively large; however, the fluctuation of the fitting results is too small and too smooth, which does not conform to the actual situation. In the initial running-in process (in 1–2 h), the experiment result has large fluctuations for adhesive wear which exhibits significant randomness, including the formation of adhesive junctions, uncertainty in shear locations, and the sudden transfer of material. In the stable running-in stage, the M-C results fluctuate within a small range, which not only characterizes the stability and randomness of the wear stage. Unlike the simulation results that do not consider the randomness characteristics of the friction system, the Monte Carlo simulation results show randomness. The trend of the fractal dimension has not changed, i.e., it increases and then stabilizes at a large value. However, local fluctuations occur, as shown in the magnification in Figure 8, indicating that the fractal prediction model with the Monte Carlo simulation accurately reflects the random characteristics of the friction system. Therefore, it is an objective method to describe the characteristics of the wear surface during the running-in process.
The accuracy improvement of the Monte Carlo-based fractal prediction model over the basic fractal prediction model is 3.33%, 4.1%, 3.14%, and 3.05% for the four tests, consistent with the experimental results. This result not only confirms the effectiveness of the introduced random parameters, but also demonstrates that the constructed Monte Carlo framework can systematically depict the inherent random mechanism in the friction system, thus providing a more objective and explanatory analytical method for the evolution of wear surface morphology.
4.3. Wear Mechanism of the Running-In Process
When discussing the differences between experimental non-smooth curves and simulated smooth curves, it is necessary to provide an in-depth explanation of the dominant wear mechanisms and their randomness. Adhesive wear exhibits significant randomness, including the formation of adhesive junctions, uncertainty in shear locations, and the sudden transfer of material, which directly lead to instantaneous jumps in the friction coefficient and wear depth in experimental data. Meanwhile, the randomness of abrasive wear is manifested in fluctuations in the size, hardness, and distribution of abrasive particles, which may come from external contaminants or self-generated debris, and in turn cause changes in the depth and width of plowing grooves, exacerbating data fluctuations.
The current deterministic–stochastic hybrid models primarily capture the macroscopic trend variations caused by surface topography randomness, but have not fully incorporated the extreme randomness of the aforementioned microscopic mechanism events. Therefore, the models predict the “average expected” path (i.e., a smooth curve) of the wear process, while experimental data reveal the actual fluctuations around this path. This also explains why simulation results that do not consider the stochastic characteristics of the friction system often present smooth curves, whereas the Monte Carlo simulation enables the results to exhibit random fluctuations.
5. Conclusions
This paper established a Monte Carlo simulation fractal prediction model to characterize the worn surface morphology during the running-in process based on traditional friction and wear models. The proposed model considers the randomness of the friction system. The main conclusions are as follows:
- (1)
- The expression of surface morphology geometric features based on wear rate expression was obtained using the traditional wear model and the surface effect function established based on Kragelsky’s theory. The smoothing and roughing processes of surface morphology are analyzed during the running-in process, and established the state equation of the surface.
- (2)
- The W-M function was used to simulate the theoretical fractal dimension of the wear surface, and the roughness parameters were calculated for different fractal dimensions to establish a fractal prediction model describing the relationship between the fractal dimension and the roughness.
- (3)
- Four sets of staged running-in tests were conducted under different working conditions to obtain the changes in the surface morphology, surface roughness, wear rate, and surface fractal dimension. As the running-in process progresses, the surface roughness and wear rate decreased and stabilized, whereas the surface fractal dimension increased and stabilized.
- (4)
- The fractal dimensions of the worn surface obtained from four sets of running-in tests were compared and used in the model. The variance between the simulation and experimental results was minimized to determine the optimal model parameter values of the fractal dimension. The results indicated that the simulation results were consistent with the experimental results.
- (5)
- A Monte Carlo simulation study was carried out to simulate the randomness of the fractal dimension of the worn surface during the running-in process. A Monte Carlo simulation fractal prediction model for the running-in process was established. The results showed that it accurately reflected the random characteristics of the worn surface. The simulation results of the model were consistent with the experimental results.
Author Contributions
Conceptualization, S.L., C.Z. and H.Z.; methodology, S.L. and C.Z.; software, S.L.; validation, S.L., H.Z. and C.Z.; formal analysis, S.L.; investigation, S.L.; resources, H.Z.; data curation, S.L.; writing—original draft preparation, S.L.; writing—review and editing, S.L.; visualization, S.L.; supervision, C.Z. and H.Z.; project administration, H.Z.; funding acquisition, S.L. All authors have read and agreed to the published version of the manuscript.
Funding
This research was funded by the Jiangsu Funding Program for Excellent Postdoctoral Talent (2024ZB585); the Fundamental Research Funds for the Central Universities (grant no. 2024QN11018); the National Natural Science Foundation of China (grant no. 51775546); and the Priority Academic Program Development of Jiangsu Higher Education Institutions (PAPD).
Data Availability Statement
The original contributions presented in the study are included in the article; further inquiries can be directed to the corresponding author.
Acknowledgments
The authors gratefully acknowledge all the professors for their guidance and help during testing and writing.
Conflicts of Interest
The authors declare no conflicts of interest.
References
- Argatov, I.I.; Fadin, Y.A. A Macro-scale Approximation for the Running-in Period. Tribol. Lett. 2011, 42, 311–317. [Google Scholar] [CrossRef] [Scilit]
- Ghosh, A.; Sadeghi, F. A Novel Approach to Model Effects of Surface Roughness Parameters on Wear. Wear 2015, 338–339, 73–94. [Google Scholar] [CrossRef] [Scilit]
- Akbarzadeh, S.; Khonsari, M.M. Experimental and theoretical investigation of running-in. Tribol. Int. 2011, 44, 92–100. [Google Scholar] [CrossRef] [Scilit]
- Li, C.L.; Chen, S.; Wu, X.X.; Zhao, Y.Y.; Li, Y.L.; Li, X. Inner surface roughness prediction model of 316L stainless steel slender tube by magnetic abrasive finishing based on PSO-ELM. China Surf. Eng. 2023, 36, 213–221. [Google Scholar]
- Zhang, G.P.; Liu, X.J.; Lu, W.L. A parameter prediction model of running-in based on surface topography. Proc. Inst. Mech. Eng. Part J J. Eng. Tribol. 2013, 227, 1047–1055. [Google Scholar] [CrossRef] [Scilit]
- An, Q.; Liu, Y.; Huang, M.; Suo, S. A Novel Contact Stiffness Model for Grinding Joint Surface Based on the Generalized Ubiquitiformal Sierpinski Carpet Theory. Fractal Fract. 2024, 8, 351. [Google Scholar] [CrossRef] [Scilit]
- Liu, Y.; An, Q.; Huang, M.; Shang, D.; Bai, L. A Novel Modeling Method of Micro-Topography for Grinding Surface Based on Ubiquitiform Theory. Fractal Fract. 2022, 6, 341. [Google Scholar] [CrossRef] [Scilit]
- Brink, T.; Frérot, L.; Molinari, J.-F. A parameter-free mechanistic model of the adhesive wear process of rough surfaces in sliding contact. J. Mech. Phys. Solids 2021, 147, 104238. [Google Scholar] [CrossRef] [Scilit]
- Hu, J.; Song, H.; Sandfeld, S.; Liu, X.; Wei, Y. Breakdown of Archard law due to transition of wear mechanism from plasticity to fracture. Tribol. Int. 2022, 173, 107660. [Google Scholar] [CrossRef] [Scilit]
- Wu, A.; Weng, L.; Hu, D.; Liao, A. Micromechanical Modeling for the Damage Accumulation and Adhesive Wear of Metallic Materials Containing Inclusions. ASME J. Tribol. 2021, 143, 011702. [Google Scholar] [CrossRef] [Scilit]
- Li, X.; Zhang, J.; Lyu, F.; Fang, Y.; Wang, D.; Zhang, X.; Xu, J.; Miao, K.; Xu, B. Multi-scale topography wear mechanism of the valve plate in axial piston pumps during running-in process: A case study. Eng. Fail. Anal. 2025, 182, 110058. [Google Scholar] [CrossRef] [Scilit]
- Zhu, H.; Ge, S.R.; Huang, X.; Huang, X.L.; Zhang, D.K.; Liu, J.L. Experimental study on the characterization of worn surface topography with characteristic roughness parameter. Wear 2003, 255, 309–314. [Google Scholar] [CrossRef] [Scilit]
- Zuo, X.; Zhu, H.; Zhou, Y.; Ding, C.; Sun, G. Development of fractal dimension and characteristic roughness models for turned surface carbon steels. Fractals 2016, 24, 259–265. [Google Scholar] [CrossRef] [Scilit]
- Zhu, H.; Ge, S.R.; Chen, G.A. Characterization of surface topography during running-in process with fractal parameter. Chin. J. Mech. Eng. 2001, 37, 68–71+77. [Google Scholar] [CrossRef] [Scilit]
- Wei, C.L.; Zhu, H.; Lang, S.H. The bi-fractal stratified characterization of a plateau honing cylinder liner surface profile during the wearing process. Fractals 2021, 29, 2150113. [Google Scholar] [CrossRef] [Scilit]
- Chen, G.A.; Ge, S.R. A prediction model for running-in wear based on fractal theory. Chin. J. Mech. Eng. 2000, 2, 29–33. [Google Scholar] [CrossRef] [Scilit]
- Liu, J.L.; Ge, S.R.; Chen, G.A.; Wu, Z.-F. Fractal prediction of wear in running-in process. Tribology 2000, 20, 310–312. [Google Scholar] [CrossRef]
- Wei, L.; Gu, B.Q.; Zhang, P.G.; Fang, G.F. Average film thickness prediction of end faces in contacting mechanical seals in running-in period. CIESC J. 2013, 64, 4137–4142. [Google Scholar]
- Wei, C.L.; Zhu, H.; Lang, S.H. A modified complete normal contact stiffness model of a fractal surface considering contact friction. Fractals 2020, 28, 2050081. [Google Scholar] [CrossRef] [Scilit]
- Fang, L.; Liu, W.; Du, D.; Zhang, X.; Xue, Q. Predicting three-body abrasive wear using Monte Carlo methods. Wear 2004, 256, 685–694. [Google Scholar] [CrossRef] [Scilit]
- Mamalis, A.G.; Vortselas, A.K. Wear of ceramic interfaces: Multiscale statistical simulation. Wear 2012, 294–295, 402–408. [Google Scholar] [CrossRef] [Scilit]
- Li, B.; Fang, L.; Sun, K. Variance of Particle Size: Another monitor to evaluate abrasive wear. Tribol. Lett. 2014, 55, 465–472. [Google Scholar] [CrossRef] [Scilit]
- Wei, L.; Gu, B.; Zhang, P. Wear prediction for end face of contact mechanical seals. J. Nanjing Univ. Technol. (Nat. Sci. Ed.) 2012, 34, 16–21. [Google Scholar]
- Ge, S.; Suo, S. The Computation Methods for the Fractal Dimension of Surface Profiles. Tribology 1997, 17, 66–74. [Google Scholar]
- Majumdar, A.; Bhushan, B. Fractal model of elastic-plastic contact between rough surfaces. Trans. ASME J. Tribol. 1991, 113, 1–11. [Google Scholar] [CrossRef] [Scilit]
- Liu, Y.; Meng, Q.Y.; Yan, X.X.; Zhao, S.Y.; Han, J.Y. Research on the solution method for thermal contact conductance between circular-arc contact surfaces based on fractal theory. Int. J. Heat Mass Transf. 2019, 145, 118740. [Google Scholar] [CrossRef] [Scilit]
- Lang, S.; Zhu, H.; Wei, C.; Zhou, W.; Li, Y. Study on characterization method of phase-point saturation based on the capacity dimension. Fractals 2022, 30, 2250035. [Google Scholar] [CrossRef] [Scilit]
- Zhao, Y.N.; Zhao, C.Y.; Wang, L.C.; Wang, P. A rail corrugation evaluation method using fractal characterization based on structure function method. Wear 2022, 506–507, 204454. [Google Scholar] [CrossRef] [Scilit]
- Oden, P.I.; Majumdar, A.; Bhushan, B.; Padmanabhan, A.; Graham, J.J. AFM Imaging, roughness analysis and contact mechanics of magnetic tape and head surfaces. J. Tribol. 1992, 114, 666–674. [Google Scholar] [CrossRef] [Scilit]
- Chen, G.A.; Zhu, Z.C.; Zhu, H. Research on Wear of Engineering Equipment; Weapon Industry Press: Beijing, China, 2003. [Google Scholar]
- McFarlane, J.S.; Tabor, D. Adhesion of solids and the effect of surface films. Proc. R. Soc. Lond. 1950, 202, 224–243. [Google Scholar] [CrossRef] [Scilit]
- Bowden, F.D.; Tabor, D. The Friction and Lubrication of Solids; Parts II; Clarendon and Press: Oxford, UK, 1973. [Google Scholar]
- Hu, Y.Z.; Li, N.; Tonder, K. A dynamic system model for lubricated sliding wear and running-in. J. Tribol. Trans. 1991, 113, 499–505. [Google Scholar] [CrossRef] [Scilit]

Disclaimer/Publisher’s Note: The statements, opinions and data contained in all publications are solely those of the individual author(s) and contributor(s) and not of MDPI and/or the editor(s). MDPI and/or the editor(s) disclaim responsibility for any injury to people or property resulting from any ideas, methods, instructions or products referred to in the content. |
© 2026 by the authors. Licensee MDPI, Basel, Switzerland. This article is an open access article distributed under the terms and conditions of the Creative Commons Attribution (CC BY) license.