


Abstract
Maceral composition critically controls nanoscale pore structure and influences methane behavior in low-rank coal reservoirs, yet the role of individual macerals remains inadequately quantified. Therefore, vitrinite, semifusinite, and fusinite of low-rank coal were characterized by atomic force microscopy (AFM) and micro-Raman spectroscopy to reveal their surface morphology, nanoscale pore parameters, and chemical structure. Bulk coal samples enriched in different maceral assemblages were subjected to low-pressure CO2 adsorption, low-temperature N2 adsorption, and high-pressure mercury intrusion to quantify the full-scale pore size distribution. Vitrinite exhibits the highest surface fractal dimension, the largest pore number, the highest micropore proportion, and the smallest mean pore size, forming an adsorption-favorable nanostructure. Fusinite has the largest mean pore size and a pore system dominated by mesopores and macropores, favoring diffusion and desorption, while semifusinite shows transitional characteristics. Raman analysis further indicates that fusinite has higher aromatic condensation and larger structural domains, whereas vitrinite is enriched in amorphous carbon and aliphatic functional groups. At the bulk coal scale, vitrinite-rich bright coal C2 is micropore-dominated, with micropores contributing 91.79% of the total specific surface area, whereas the inertinite-rich semi-dull coal develops abundant macropores but poor connectivity. The V/(V + I) ratio decreases from bright coal to dull coal and may provide a practical parameter for reservoir evaluation. Differentiated CBM exploration and development strategies are suggested. Bright and semi-bright coals are suggested to be prioritized for sweet-spot identification. Fracturing should connect the micropore-dominated matrix to the macro-fracture network in vitrinite-rich zones and bypass mineral-clogged pore throats in inertinite-rich zones.
1. Introduction
Coalbed methane (CBM) is both an important unconventional natural gas resource and a major safety concern in coal mining. In China, medium- and high-rank CBM has achieved comparatively mature commercial development, especially in the Qinshui Basin [1,2]. However, low-rank coal reservoirs account for approximately 47% of China’s CBM geological resources, and low-rank coal-bearing basins, such as the Junggar Basin in Xinjiang and the Ordos Basin in northern Shaanxi, have become important targets for future exploration [3]. Although low-rank CBM has been commercially exploited in the United States, Canada, and Australia [4], large-scale industrial development in China remains restricted by low production and low efficiency in more than one-third of the wells [5]. Clarifying the intrinsic controls on methane storage and migration in low-rank coal is therefore essential for improving reservoir evaluation and engineering design.
Macerals are the fundamental organic constituents of coal, and their physicochemical heterogeneity directly affects methane adsorption, desorption, and diffusion [2,5,6]. Many studies have reported a positive correlation between vitrinite content, micropore development, and methane adsorption capacity [7,8], whereas others have emphasized the adsorption or desorption contribution of inertinite-rich components [9,10]. Semifusinite is important because it is transitional between reactive vitrinite and inert fusinite and may preserve mixed structural characteristics during coalification [11]. These views indicate that maceral percentage alone cannot explain CBM behavior; instead, the nanoscale pore structure, surface morphology, and molecular structure of individual macerals should also be evaluated.
Pore structure is a fundamental factor governing methane adsorption, desorption, and migration in coal. Nanopores provide storage space for adsorbed methane, whereas multi-scale pores and fractures act as pathways for gas diffusion and seepage [12,13,14,15,16]. Micropores generally dominate methane adsorption capacity, while mesopores and macropores contribute more strongly to diffusion, desorption, and pressure transmission [14,15,16]. However, the pore heterogeneity of low-rank coal macerals remains insufficiently quantified, which restricts the mechanistic interpretation of low-rank CBM reservoir performance [8,17]. In particular, the quantitative relationship between maceral nanopore morphology, pore-size distribution, and gas transport properties remains unclear, and complementary microscopic evidence is urgently needed to reveal the structure–performance relationship of coal organic matter [18,19].
Traditional pore characterization methods, including CO2 adsorption, N2 adsorption, and mercury intrusion porosimetry [12,20], can provide quantitative pore volume and pore-size distributions but cannot directly visualize the morphology of individual macerals. In addition, external fluid intrusion may alter original nanopores [21]. Scanning electron microscope (SEM) and transmission electron microscope (TEM) are useful for pore visualization [22,23], but their resolution is insufficient to resolve the fine structure of individual macerals surfaces. Atomic force microscopy (AFM) provides direct, non-destructive, nanometer-scale imaging of surface morphology [19,24,25,26,27]. Micro-Raman spectroscopy reveals the aromatic condensation and the structural ordering of organic matter [28,29,30]. Combing these techniques with fluid-based pore characterization therefore offers a means to link maceral chemistry and nanoscale morphology to full-scale pore structures.
Although the pore structure and morphology of macerals have been studied, the linkage between molecular structure, surface nanomorphology, and a full-scale pore system has not been established. The novel contribution of this study is linking these maceral-scale characteristics to the full-scale pore system of bulk coals with contrasting macerals and proposing the V/(V + I) ratio as a macroscopic index for the microscale pore structure of low-rank CBM reservoirs. In this study, vitrinite, semifusinite, and fusinite from Jurassic series low-rank coals were characterized by AFM and micro-Raman spectroscopy, and bulk coals representing different maceral assemblages were characterized by low-pressure CO2 adsorption, low-temperature N2 adsorption, and high-pressure mercury intrusion. The objectives were to (1) quantify the surface morphology, nanoscale pore parameters, and chemical structure of individual macerals and (2) establish the genetic link between maceral composition and full-scale pore structure, thereby providing a basis for differentiated CBM exploration and development strategies in low-rank coal reservoirs.
2. Samples and Methods
2.1. Samples and Pretreatment
The coal samples used in this study were collected from Jurassic coal seams, following the Chinese national standard GB/T 482-2008 (Sampling of coal seams) [31]. Maceral composition identification was performed according to GB/T 8899-2013 (determination of maceral group composition and minerals in coal) [32], and the maximum vitrinite reflectance (Ro,max) was measured according to GB/T 6948-2008 (Method of determining microscopically the reflectance of vitrinite in coal). Maceral determination and vitrinite reflectance measurement are conducted using a Germany produced Leica Confocal Microscope modelled DM 2700P (Leica, Wetzlar, Germany) [33].
2.2. Methods
2.2.1. Raman Spectroscopy Analysis
Raman spectra of three macerals (vitrinite, semifusinite, and fusinite) were collected using a Germany produced WITec alpha 300 R confocal Raman microscope equipped with a Zeiss EC Epiplan-Neofluar Dic objective lens, from Carl Zeiss Microscopy Deutschland GmbH in Oberkochen, Germany. A 532 nm laser was used as the excitation source. The experimental parameters were set as follows. Laser power was 0.8 mW, accumulation times were 5, and the single integration time was 3 s. Each maceral was tested on the same polished section to ensure the consistency of the measured position and eliminate the influence of sample heterogeneity. Macerals were identified under an optical microscope and then for Raman analysis. For each maceral, eight points were selected for Raman spectra analysis. All original Raman spectra were peak-fitted and deconvoluted using Origin software (2024 version), and the peak fitting protocol followed Chen et al. [30]. The detailed peak-fitting procedures are listed in Figure S1 (Supplementary Materials), and Gaussian peak functions were chosen for the peak fitting.
2.2.2. AFM Analysis
The morphological features (two-dimensional and three-dimensional) and pore structural characteristics of vitrinite, semifusinite, and fusinite were characterized using a Bruker produced AFM modelled Dimension Icon (from Berlin, Germany). The scanning area for each maceral was set to 2 μm × 2 μm. For each maceral, eight zones were scanned and analyzed under identical conditions on the same pellet. To obtain distortion-free and stable surface images, the tapping mode was adopted with a scanning rate of 1 Hz. For accuracy measurement, scanning spots of 512 × 512 were selected. The frequency of the tip and cantilever was 300 KHz. The horizontal and vertical resolutions of the instrument are 0.2 nm and 0.03 nm, respectively. AFM images were acquired using NanoScope Analysis software (3.00 version). Image export, fractal dimension calculation, and pore structural analysis were completed via NanoScope Analysis and Gwyddion software (2.59 version). The detailed procedures of AFM image analysis and data processing were completed according to Liu et al. (2019) [26] and Nečas et al. (2012) [34]. The fractal dimension of surface morphology (Ds) was obtained following the methods of Elson et al. (1995) [35] and Zhang et al. (2023) [36]. The fractal dimension of surface pores (D) was calculated based on the Hausdorff dimension following the methos of Mandelbrot (1975) [37] and Peng et al. [38]. The detailed calculations of Ds and D are listed in Supplementary Materials (Equations (S1)–(S13)).
2.2.3. CO2 and N2 Gas Adsorption
Gas adsorption experiments were conducted on a Beijing JWGB Sci. & Tech. Co., Ltd. produced automated surface area and porosity analyzer modelled JW-BK200C from Beijing, China. Around 2 g of each 60-mesh coal sample was degassed at 378 K for 12 h under vacuum to remove moisture. Afterwards, low-pressure CO2 adsorption and low-temperature N2 adsorption were conducted. Low-pressure CO2 adsorption was used to measure pores with diameters below 2 nm; it was conducted at a temperature of 273.15 K. High-purity CO2 was employed as the adsorbate, with relative pressures ranging from 0.0004 to 0.0294. Low-temperature N2 adsorption was used to measure pores with diameters above 2 nm. N2 adsorption measurements were subsequently carried out at 77 K with high-purity N2 as the adsorbate over a relative pressure (P/P0) range of 0.01–0.99. The detailed procedures for gas adsorption were carried out following GB/T 21650.3-2011 [39] and GB/T 21650.2-2008 [40]. For low-pressure CO2 adsorption and low-temperature N2 adsorption, the pore size distributions were calculated using the Density Functional Theory (DFT) model.
2.2.4. High-Pressure Mercury Intrusion
High-pressure mercury intrusion was performed using a Micromeritics produced porosimeter modelled AutoPore V 9600 from Norcross, GA, USA, following the standard GB/T 21650.1-2008 [41]. Fractures and pores with diameters of 3.5–106 nm are characterized by this experiment. Based on the Washburn equation, the volume of mercury intruding into the coal pores under different pressures was measured, yielding a relationship curve between mercury intrusion pressure and intruded mercury volume. The maximum intrusion pressure reached approximately 61,000 psia (420 MPa) to access pores down to 2.96 nm. However, because the coal matrix is compressible, the high-pressure segment is prone to cause matrix compression. Therefore, pore diameters below 50 nm, corresponding to intrusion pressure at around 25 MPa, were not used for pore quantification. Instead, this range was characterized by low-pressure CO2 adsorption and low-temperature N2 adsorption (DFT). The surface tension of mercury was taken as 0.485 N/m.
3. Result and Discussion
3.1. Basic Properties of Coal Samples
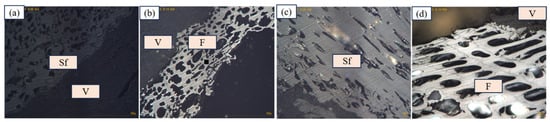
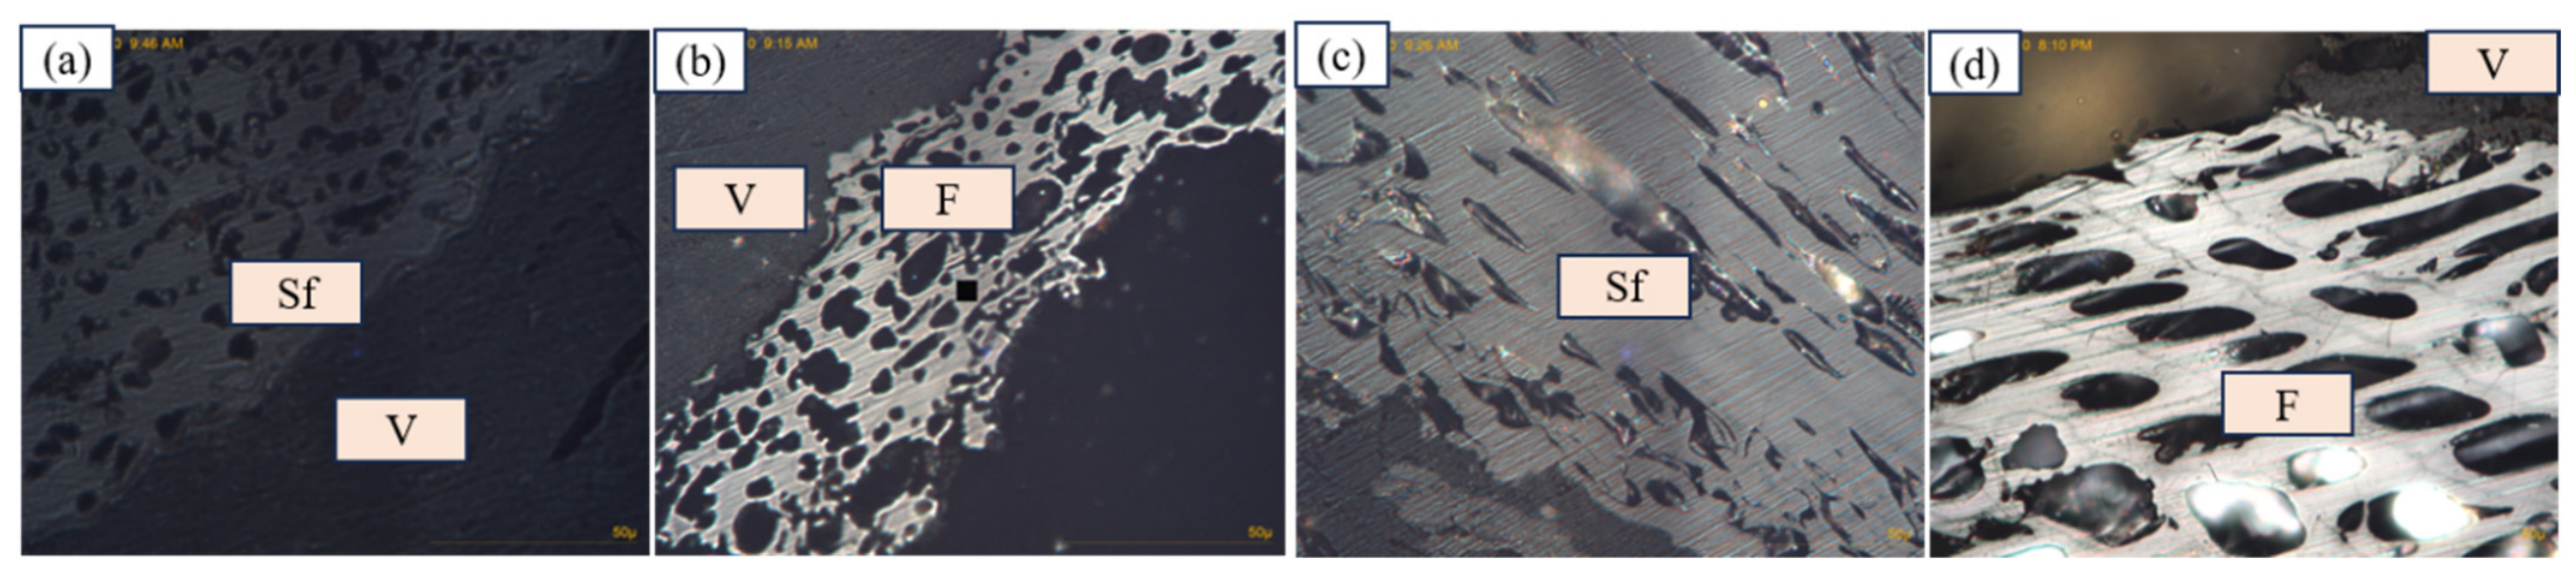
The basic properties of the coal samples are presented in Table 1 and Table 2, including proximate analysis, ultimate analysis, and petrological components. The four bulk coal samples represent varied maceral assemblages and macrolithotypes. The maceral images are shown in Figure 1. In the C1 coal sample, inertinite (51.1%) is the dominant group, including fusinite (6.1%) and semifusinite (31.3%). This was followed by vitrinite, with a content of 43.9% in volume, mainly occurring as collodetrinite. Liptinite had the lowest content by volume (0.2%), occurring mainly in the form of cutinite. The detailed maceral components are shown in Table 2. C1 and C4 are semi-dull coals of the macrolithotype, with relatively high contents of inertinite. C2 and C3 comprise bright coal and semi-bright coal, respectively, with relatively high contents of vitrinite.
Table 1.
Basic properties of the studied low-rank coal.
Table 2.
Petrological components of the studied low-rank coal.
Figure 1.
Petrological images of coal macerals. (a) semifusinite(Sf) and vitrinite(V); (b) vitrinite(V) and fusinite(F); (c) semifusinite(Sf); (d) fusinite(F) and vitrinite(V).
3.2. Chemical Structural Characteristics of Macerals
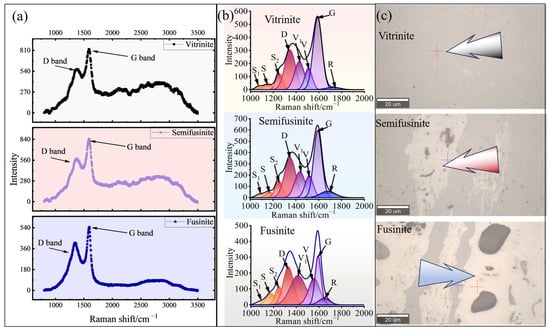
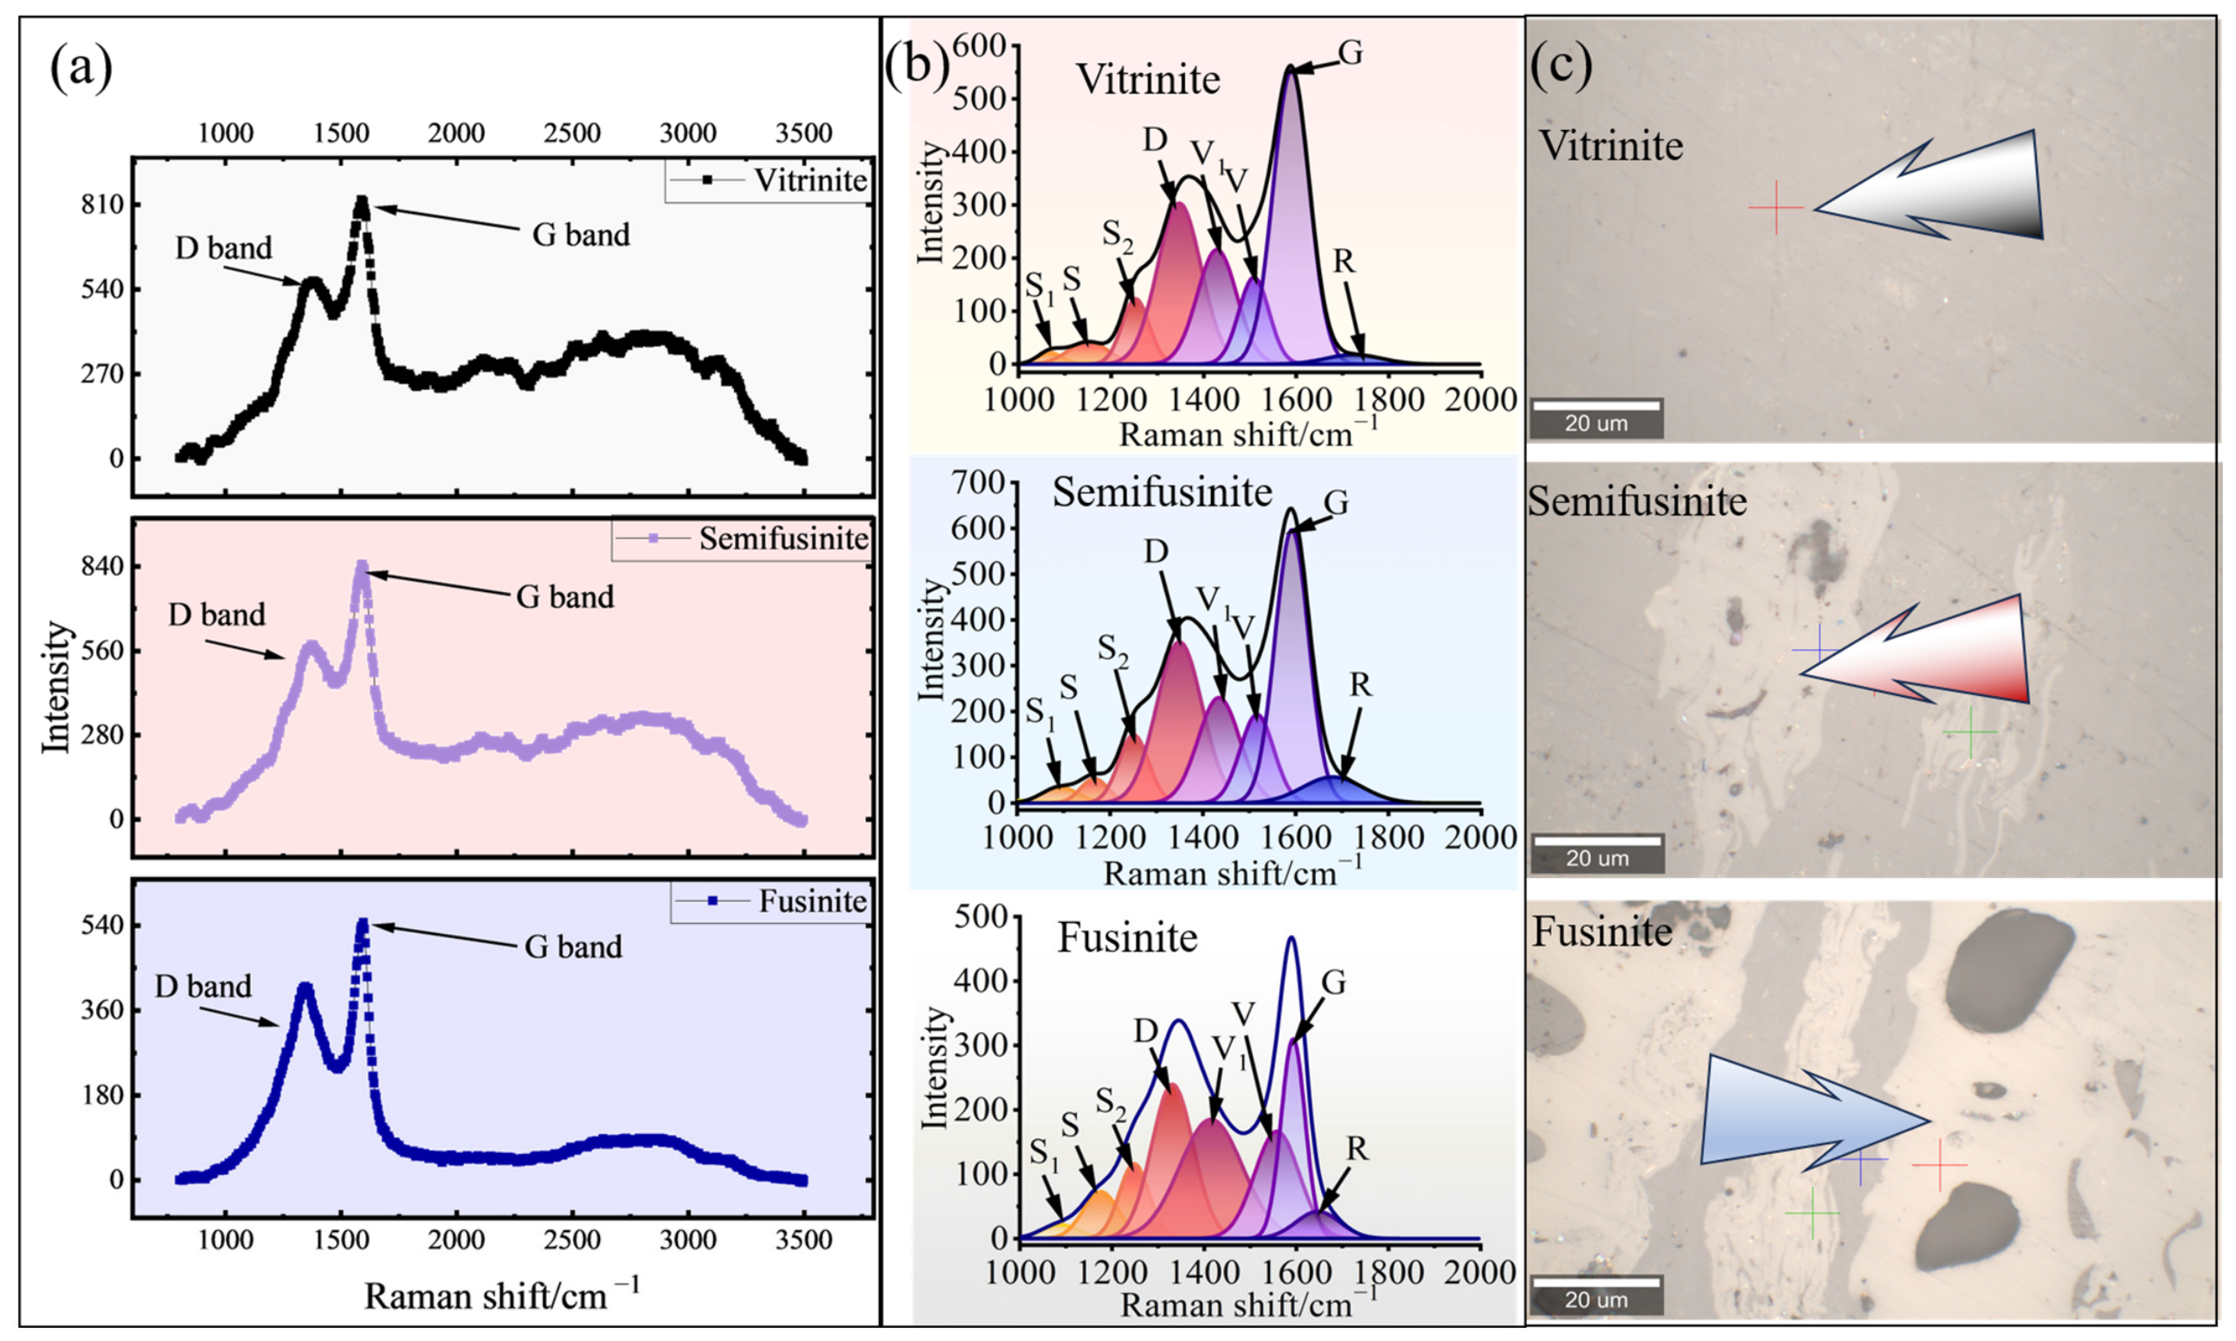
Coal is composed of complex macromolecules, including aromatic nuclei, aliphatic chains, and other functional groups. Based on the peak deconvolution proposed by Morga (2011) [11,42] and Guedes et al. (2010) [43], eight Raman peaks (S1, S, S2, V1, V, D, G, and R) were curve-fitted for vitrinite, semifusinite, and fusinite, as shown in Figure 2, and the assignment of bands is shown in Table 3. The Raman spectra of macerals are shown in Figure 2a; all three macerals exhibit two dominant bands at ~1350 cm−1 (D band) and ~1580 cm−1 (G band). The D band (~1350 cm−1) corresponds to lattice defects and aromatics with not less than six rings, while the G band represents the vibration of sp2 aromatic carbons in graphite/graphite-like skeletons, which directly reflects the aromatization degree and stacking order of aromatic basic structural units (BSUs). S-series bands (S, S1, and S2) correlate with aromatic C-H and aliphatic substituents on aromatic edges; the V1 and V bands represent disordered amorphous carbon; the R band is attributed to oxygen-containing functional groups in organic matter, including C=O and -COOR [42,43].
Figure 2.
Raman spectra of macerals in low-rank coal C1. Note: (a) shows the raw Raman spectra of macerals, (b) shows the peak-fitting curves of the Raman spectra, and (c) shows the identifying microscopic images of macerals.
Table 3.
Assignments of Raman bands [30,42].
Spectral disparities are identified among vitrinite, semifusinite, and fusinite. An obvious baseline fluorescence uplift is present in vitrinite and semifusinite spectra, while fusinite presents a flat baseline with negligible fluorescence interference, consistent with previous research on low-rank coal macerals [43]. This distinction arises from higher contents of non-aromatic structural groups in vitrinite, which generate strong fluorescence under 532 nm laser excitation. Fusinite undergoes intense early thermal oxidation during peatification, with aliphatic structures removed and the aromatic skeleton condensed; thus, its fluorescence response is probably weakened.
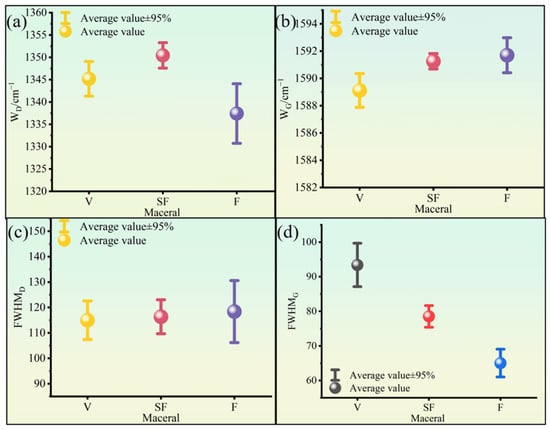
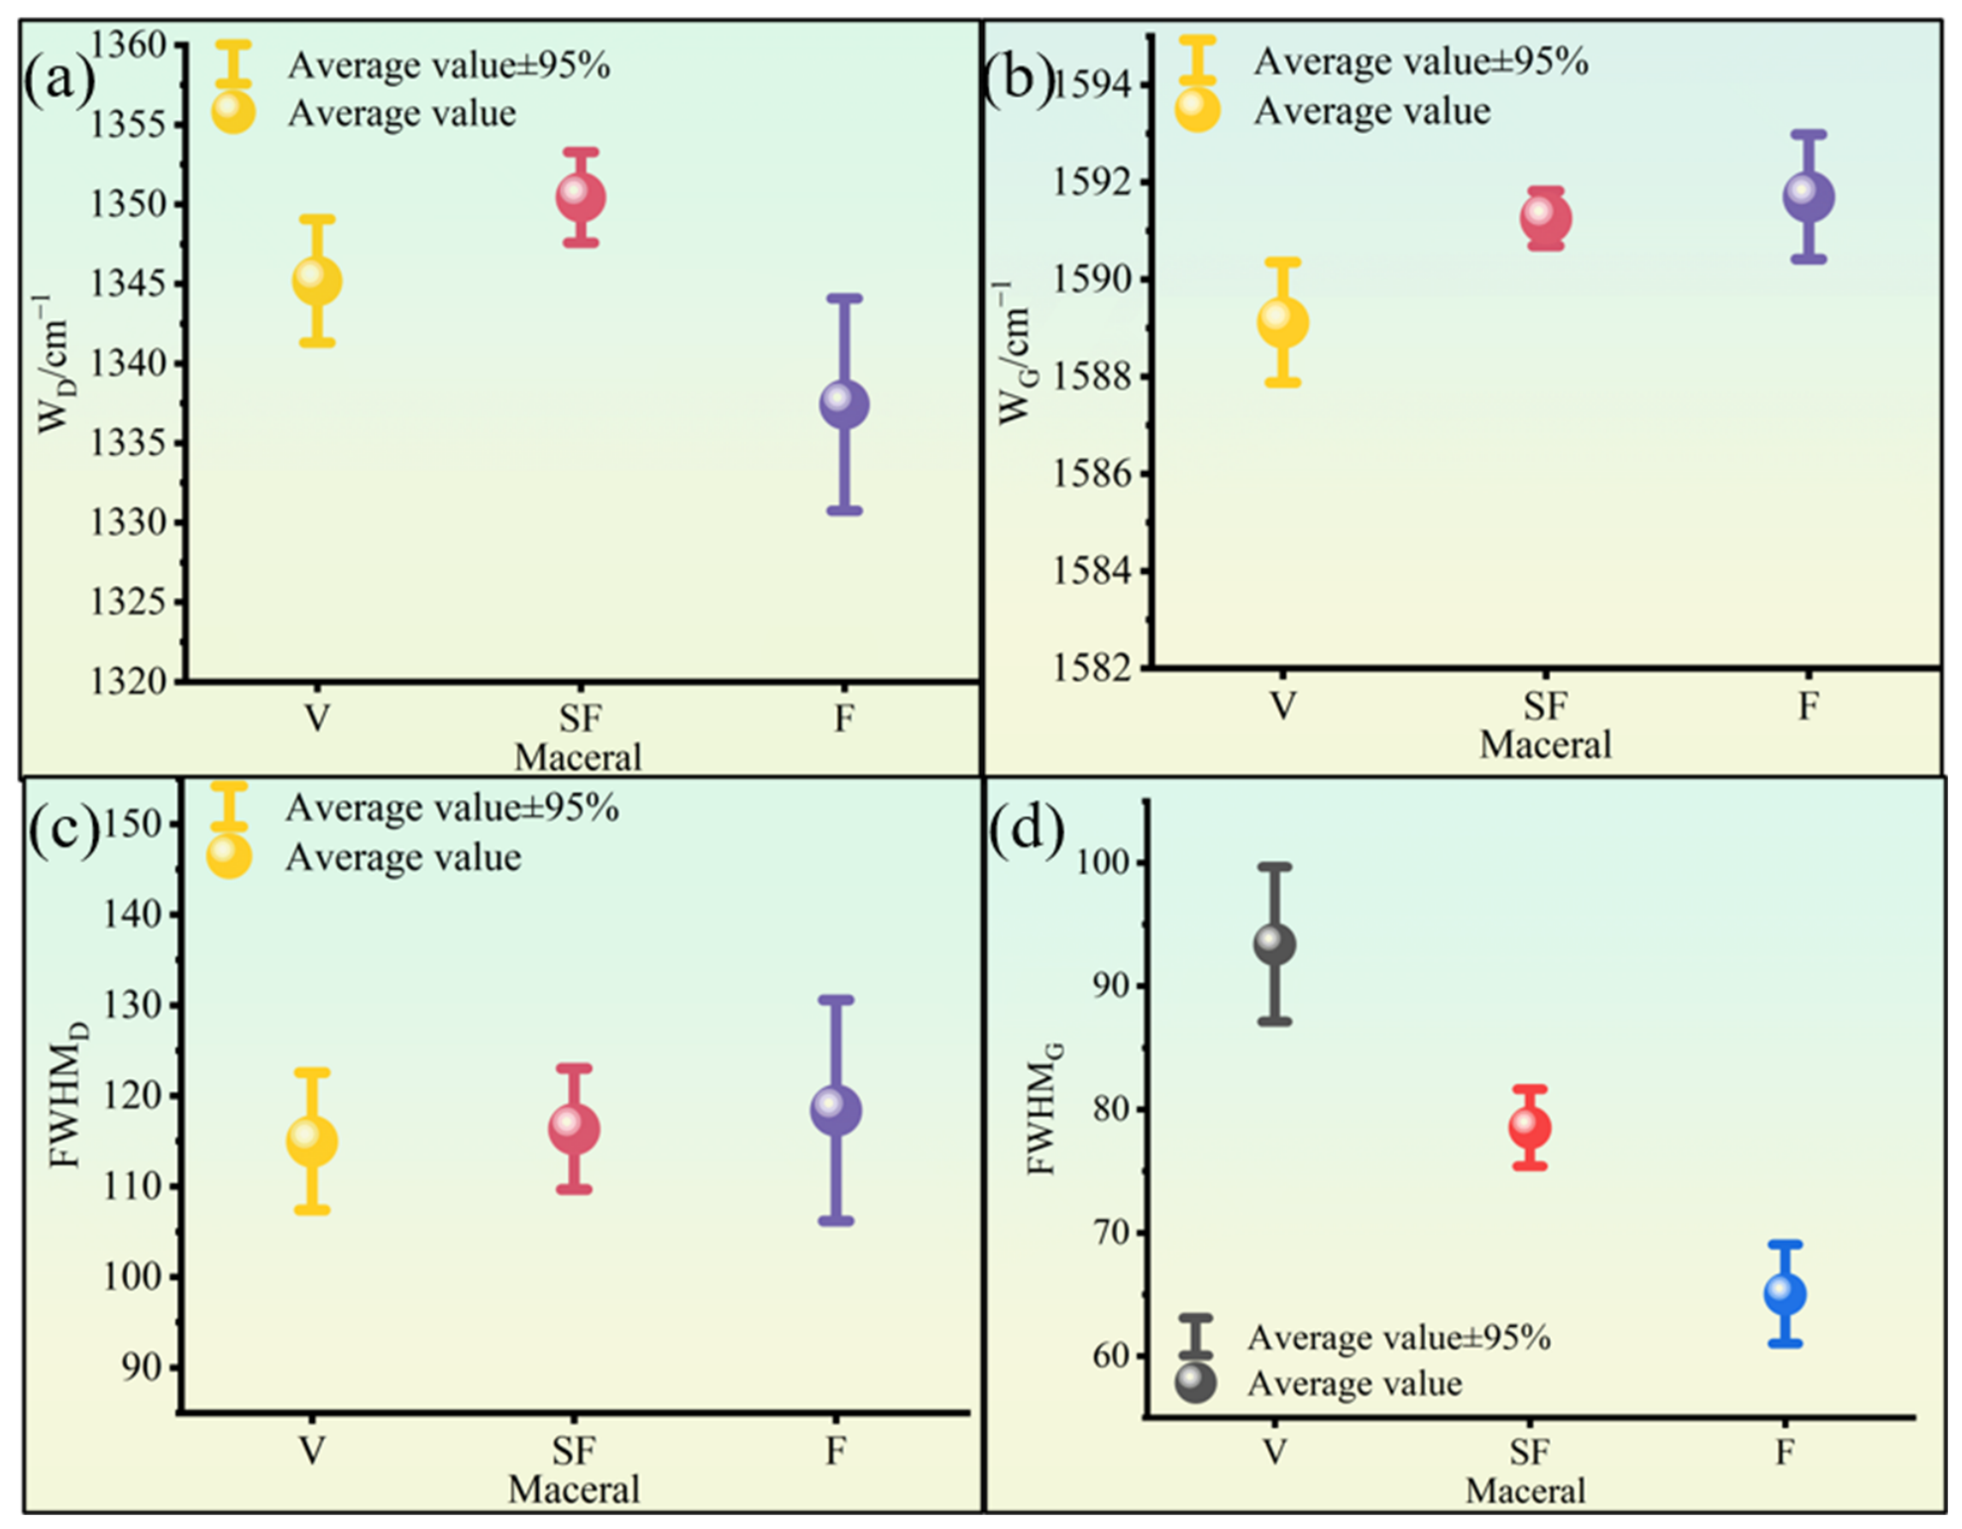
As shown in Figure 3, the D-band wavenumber ranges of vitrinite, semifusinite, and fusinite are 1329 cm−1 to 1351 cm−1, 1336 cm−1 to 1355 cm−1, and 1328 cm−1 to 1348 cm−1, respectively. The G-band position of the three macerals is distributed at 1585 cm−1 to 1592 cm−1 (vitrinite), 1588 cm−1 to 1592 cm−1 (semifusinite), and 1589 cm−1 to 1593 cm−1 (fusinite). For fusinite, the D band is located at lower wavenumbers (1328 cm−1 to 1348 cm−1), whereas the G band shifts to higher positions (1589 cm−1 to 1593 cm−1), demonstrating higher aromatic condensation and larger primary structural domains compared with vitrinite and semifusinite, consistent with the inherent high-temperature wildfire genesis of fusinite [11,42]. Semifusinite acts as a transitional maceral between vitrinite and fusinite, containing both reactive and non-reactive types. Reactive semifusinite possesses more abundant aliphatic chains and surface-active sites than non-reactive semifusinite [11,42,43].
Figure 3.
Raman data of macerals in low-rank coal. The measured number of each maceral is eight. (a) wavenumber of D band in macerals; (b) wavenumber of G band in macerals; (c) half-width at half-maximum of D band; (d) half-width at half-maximum of G band.
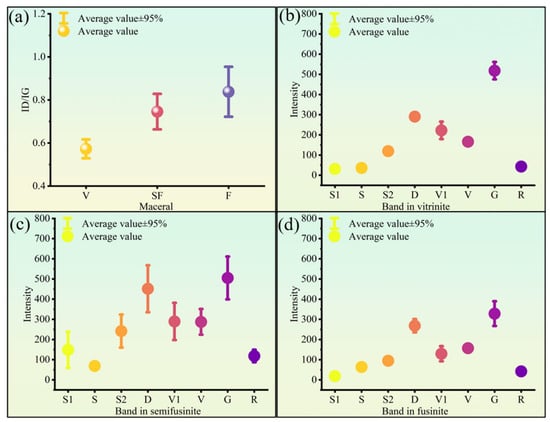
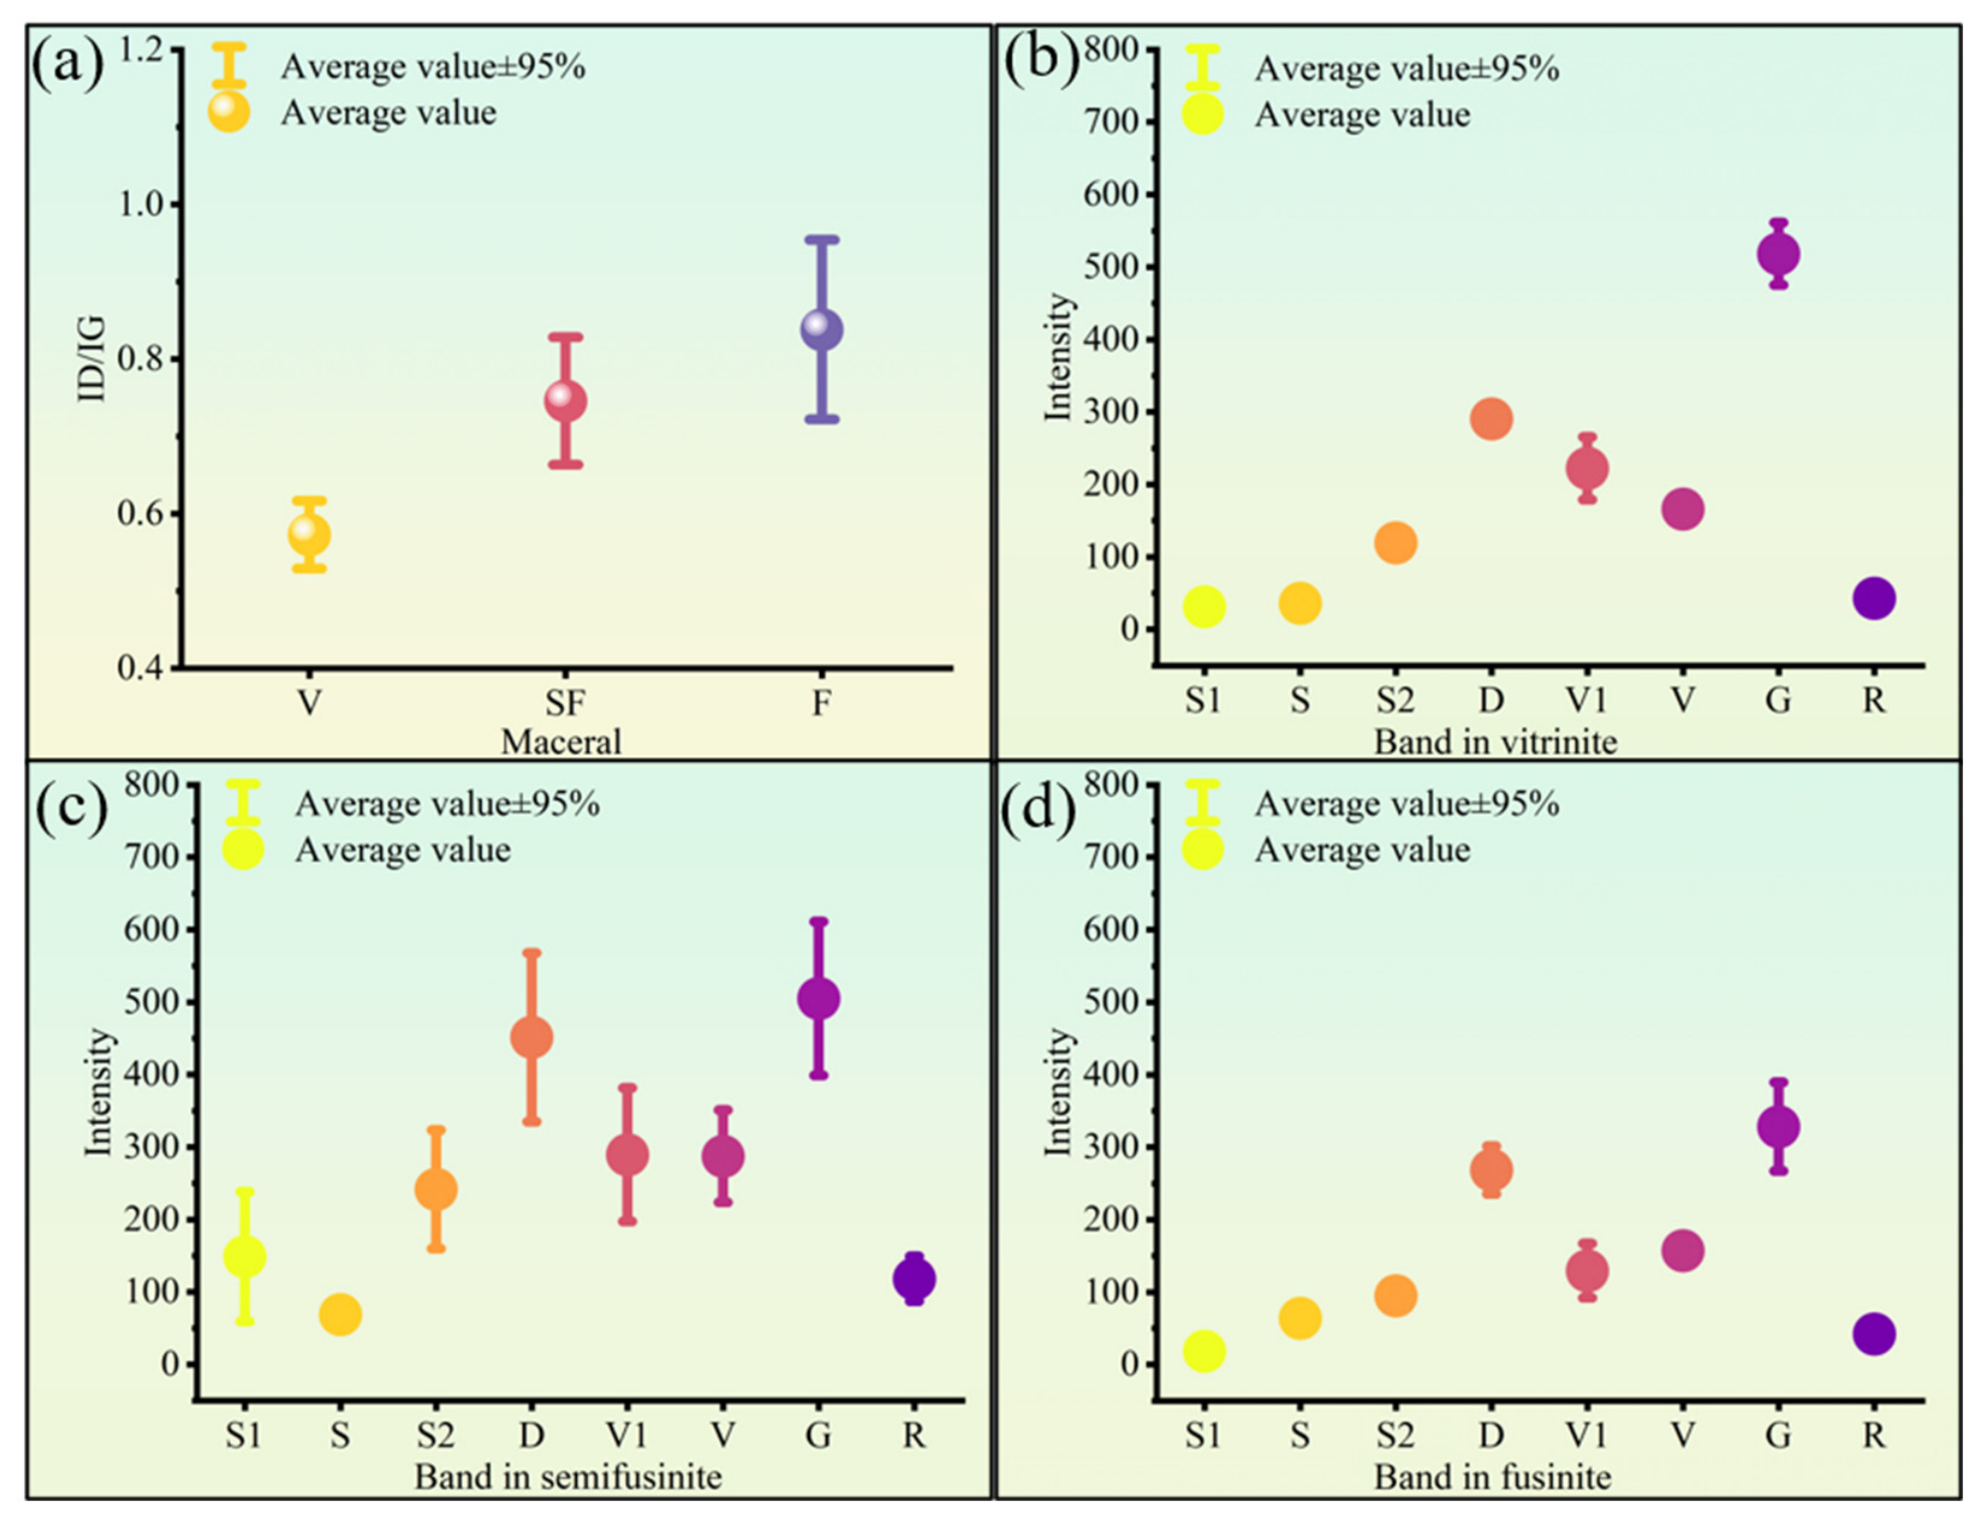
Quantitative Raman structural parameters further verify maceral heterogeneity (Figure 3 and Figure 4). Fusinite has the highest average G peak position, the lowest D peak wavenumber, and the maximum intensity of the R band, which matches the fact that inertinite groups have higher O/C atomic ratios at identical coal ranks [11,42]. High oxygenated groups of inertinite-rich coals were also reported by Morga et al. (2011) [11,42]. This phenomenon is related to the formation of inertinite, which forms during wildfires due to complete or incomplete combustion [11,42,43]. Semifusinite presents scattered Raman parameter distributions (Figure 4b) because of the coexistence of reactive and non-reactive subtypes. Vitrinite has the lowest R band intensity and the broadest FWHM of the G band, reflecting abundant amorphous carbon and aliphatic functional groups.
Figure 4.
Raman parameters of macerals in low-rank coal. The measured number of each maceral is eight. (a) ID/IG of macerals. (b) intensity of Raman bands in vitrinite; (c) intensity of Raman bands in semifusinite; (d) intensity of Raman bands in fusinite.
3.3. Morphological Characteristics of Macerals
3.3.1. Three-Dimensional Morphological Characteristics
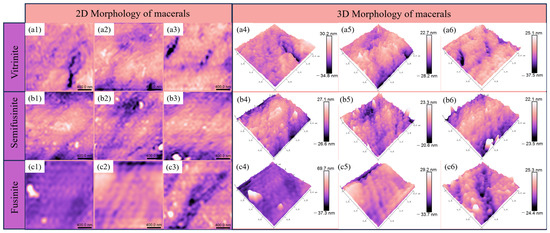
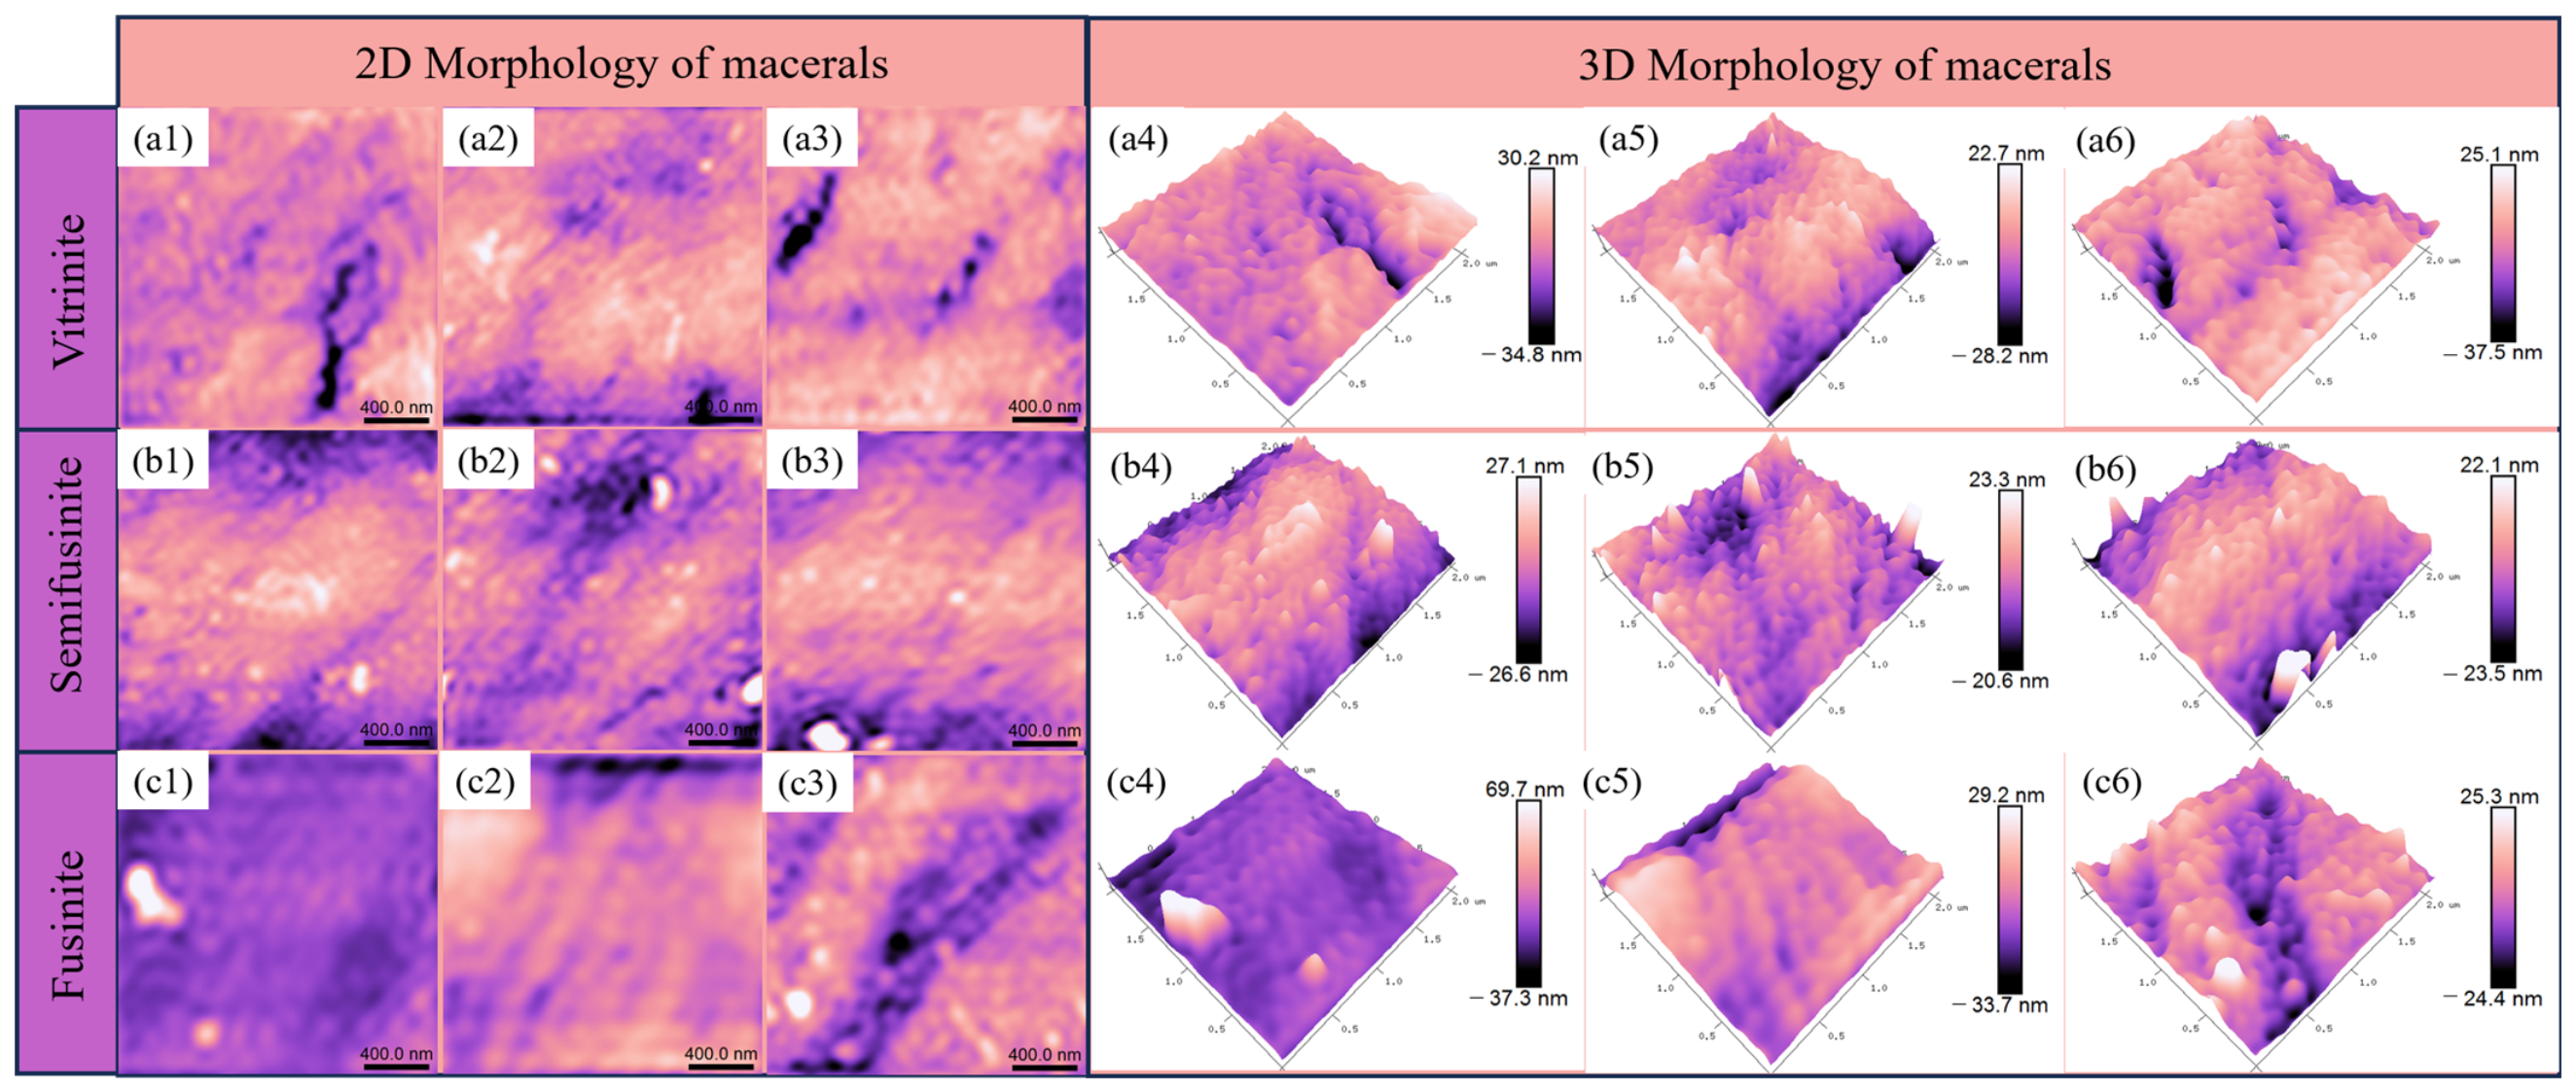
AFM has become a key technique for the molecular-scale characterization of polymers, nanomaterials, and coal organic matter [25]. The visible granular structures in AFM images correspond to coal macromolecular aggregates, which are assembled by condensed aromatic nuclei, aliphatic chains, and functional groups [25,44]. The morphological features of vitrinite, semifusinite, and fusinite were explicated by 2D and 3D images, as visually displayed in Figure 5. For vitrinite (Figure 5a1–a6), macromolecular aggregates present a loose, chaotic arrangement with uneven inter-aggregate connections. Even some of these macromolecular aggregates were partially well aligned, but most were connected to each other, without a compact structure. The overall structure is highly complex, consistent with its high fractal dimension. The functional groups in vitrinite further increase the surface heterogeneity [27,29,44,45]. For semifusinite (Figure 5b1–b6), the arrangements of macromolecule aggregates are slightly ordered, and the connections among macromolecule aggregates number fewer than those of vitrinite. Some of the macromolecule aggregates can be isolated. For fusinite (Figure 5c1–c6), the macromolecule aggregates are organized without many connections. Their orientations were quite uniform, and arrangements were well aligned, matching its low fractal dimension. Even though pores existed, the macromolecule aggregates were quite evenly distributed and had a simple spatial structure.
Figure 5.
2D and 3D AFM morphology of macerals. Modified based on Ref. [36]. (a1–a3) two-dimension AFM images of vitrinite; (a4–a6) three-dimension AFM images of vitrinite; (b1–b3) two-dimension AFM images of semifusinite; (b4–b6) three-dimension AFM images of semifusinite; (c1–c3) two-dimension AFM images of fusinite; (c4–c6) three-dimension AFM images of fusinite.
3.3.2. Fractal Characteristics of Morphology
Organic matter of coal is assembled by complex macromolecules consisting of aromatic nuclei, aliphatic chains, and various oxygen-containing functional groups [44,46]. AFM can intuitively characterize the nanoscale morphology of macromolecular aggregates, but it is difficult to quantitatively describe the irregularity and complexity of surface structures. Fractal theory, first proposed by Mandelbrot in 1975, is widely used to quantify the irregularity of geological materials [37]. The fractal analysis used here is an application of the established power spectral density (PSD) framework of surface fractal analysis [26,37]. Fractal analysis has been extensively applied to coal pore structure research; few studies have focused on the fractal features of macromolecular aggregates in individual macerals. Here, PSD-based quantitative fractal analysis and qualitative 3D morphological observation are combined to analyze the surface structure of three macerals (vitrinite, semifusinite, and fusinite).
Taking the surface height as a random variable, the surface structure of coal macerals can be regarded as a random spatial process described by the autocorrelation function φ(x). Combined with spatial-frequency and angular-frequency transformations, the power spectral density S(ω) is defined. For a fractal surface, S(ω) follows a power-law relationship with the angular frequency ω. After logarithmic transformation, the surface fractal dimension Ds is obtained from the linear fitting result. The general theory is summarized in Equations (1)–(4) below based on previous publications [35,36,37,38], and the full derivation is provided in the Supplementary Materials. Detailed calculations are shown in Supplementary Materials Equations (S1)–(S10).
S(ω)∞ω−β,
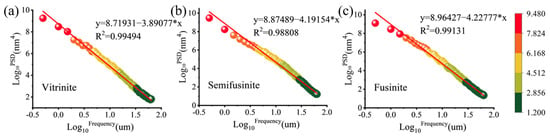
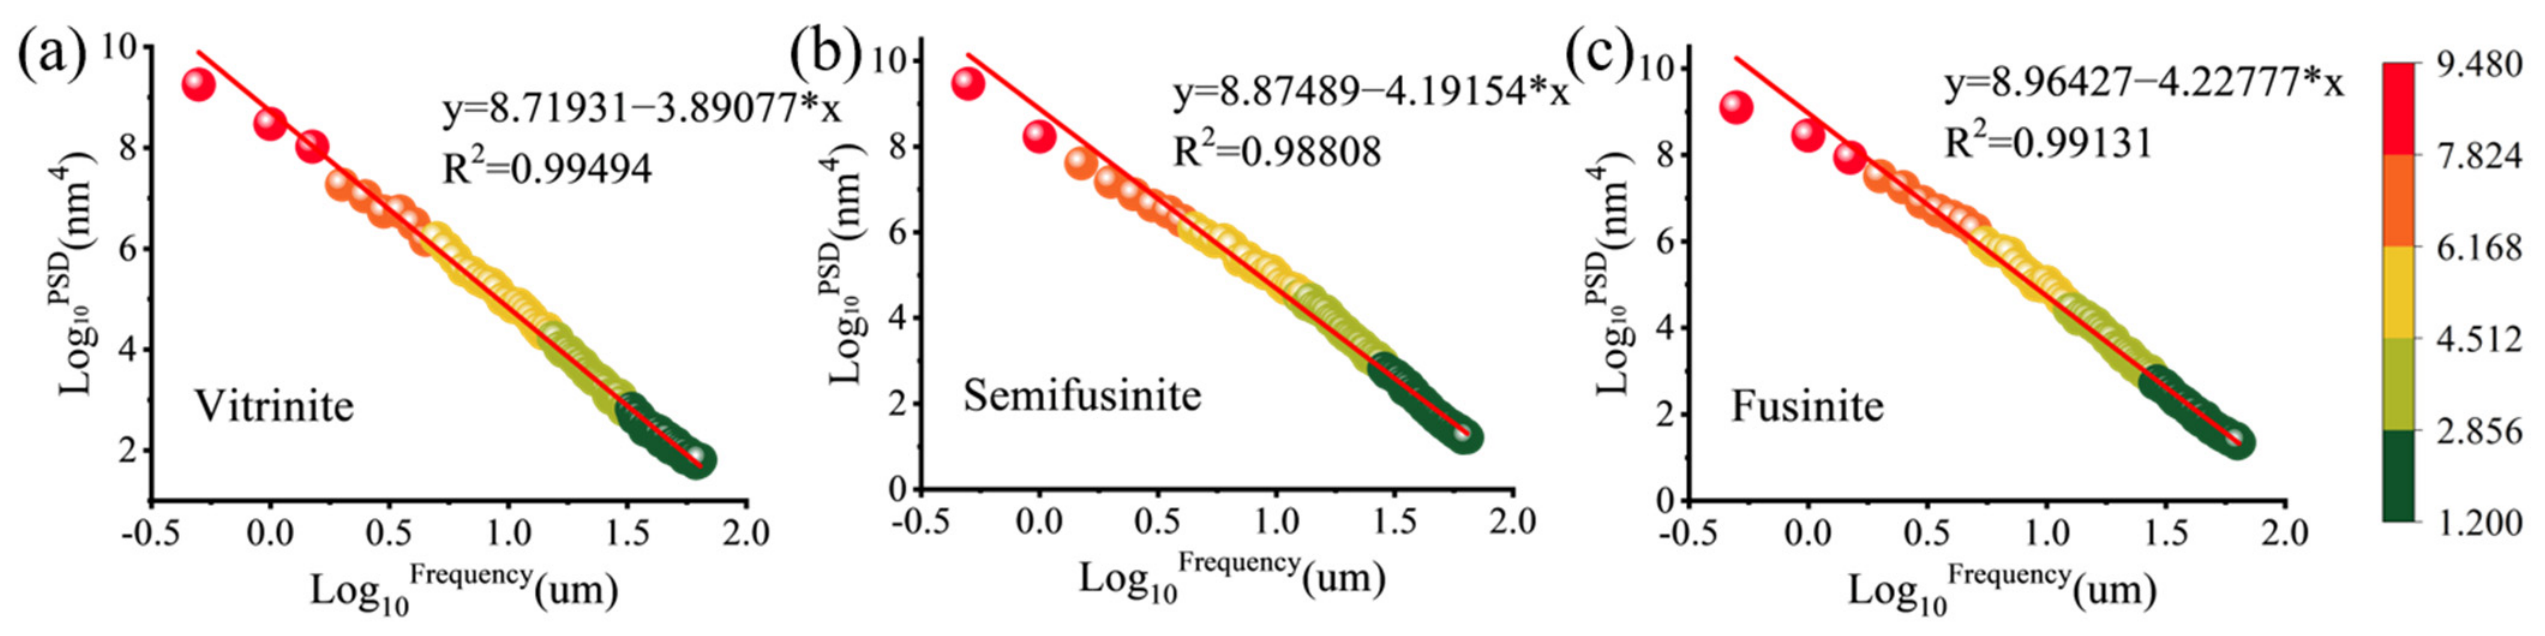
The logarithmic PSD frequency fitting results of three macerals are shown in Figure 6. The coefficients of determination (R2) of vitrinite, semifusinite, and fusinite are 0.99494, 0.98808, and 0.99131, respectively, indicating a strong linear correlation and confirming that PSD-based fractal analysis is applicable to the surface structure of macerals.
Figure 6.
Linear fitting of logarithmic PSD versus logarithmic frequency for three macerals. (a) Vitrinite; (b) semifusinite; (c) fusinite.
The calculated surface fractal dimensions, Ds, are summarized in Table 4. Vitrinite has the highest Ds (1.55), whereas semifusinite (1.40) and fusinite (1.39) show lower and similar fractal dimensions. A larger fractal dimension represents a more complex surface morphology and stronger undulation of macromolecular aggregates [24,25,26,27]. Here, the three macerals were measured with identical instrument and processing parameters. The complex surface of vitrinite provides abundant adsorption sites for methane molecules, which is the structural basis for its strong adsorption capacity [47].
Table 4.
Fractal dimension (Ds) of morphology in different macerals.
3.4. Pore Structural Characteristics of Macerals Derived from AFM
3.4.1. Pore Structural Parameters
The quantitative analysis of average pore parameters in vitrinite, semifusinite, and fusinite is listed in Table 5, including pore number, pore area, mean pore size, and the pore-size distribution. These parameters were obtained by processing the 2D AFM images (2 μm × 2 μm) of each maceral. Vitrinite develops the largest number of micropores (<2 nm). Fusinite has fewer pores but a larger pore area and average pore size. The total pore area of inertinite is mainly controlled by mesopores (2–50 nm) and followed by macropores (>50 nm), so semifusinite and fusinite have a larger total pore area than vitrinite. In vitrinite, the total pore number is 921, and the total pore area and mean pore size are 508.14 nm2 and 15.86 nm, respectively. The mean pore size is defined as the arithmetic mean of the equivalent diameters of all AFM-identified pores. Therefore, when numerous micropores coexist with a small number of macropores, the latter can raise the arithmetic mean. The proportion of micropores is highest in vitrinite (72.45%), followed by mesopores (26.86%), with macropores accounting for only 0.69%. Micropores were not detected in semifusinite or fusinite under the AFM scanning area and image-processing conditions; this reflects the detection limit and the surface-specific nature of the AFM analysis and does not imply that these macerals contain no micropores. Inertinite has the highest proportion of mesopores, followed by macropores; the combined proportion of mesopores and macropores in the inertinite group is much higher than that in vitrinite (Table 5).
Table 5.
Pore structural parameters of the macerals.
3.4.2. Fractal Characteristics of Pores
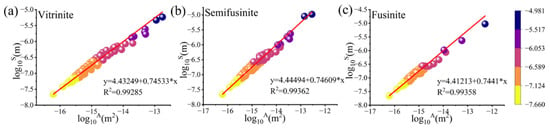
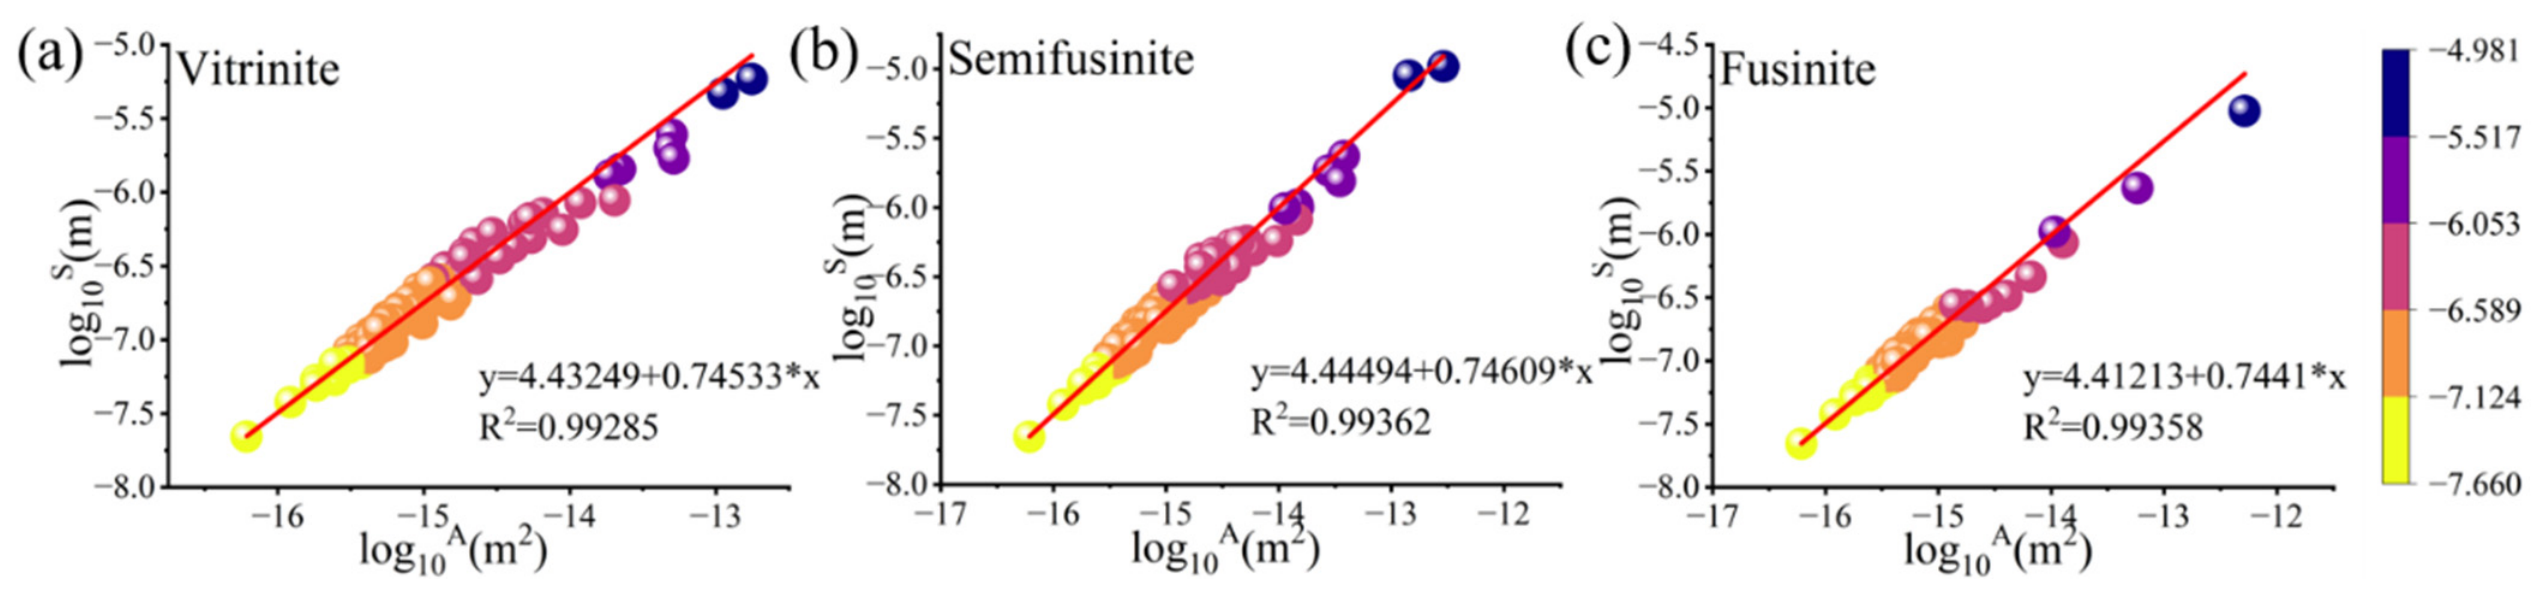
Pores in coal typically exhibit irregular shapes and cannot be described as circular or elliptical. Mandelbrot et al. showed that the equivalent perimeter and area can be used to compute fractal parameters that indicate the degree of irregularity of pores [37]. A higher fractal dimension corresponds to a greater degree of irregularity. A linear relationship exists between the logarithm of the perimeter (log10S) and the logarithm of the area (log10A) of microscopic pores. For each maceral, log10S was plotted against log10A, and a linear relationship log10S = (D/2) × log10A + c was obtained by least-squares fitting; the fractal dimension was then calculated as D = 2 × slope. The results demonstrate a strong linear correlation among these data points, indicating the self-similarity of the pore structure (Figure 7).
Figure 7.
Fitting curves of the pores in the macerals. (a) Vitrinite; (b) semifusinite; (c) fusinite.
The pore fractal dimension (D) was calculated and is shown in Table 5. The pore fractal dimensions for vitrinite, semifusinite, and fusinite were determined to be 1.491, 1.492, and 1.488, respectively. The fractal dimension D reported here is calculated from the equivalent perimeter and area of AFM-identified surface pores and therefore represents a two-dimensional morphological parameter. Therefore, it should not be directly compared with the three-dimensional fractal dimensions derived from gas adsorption isotherms, which are typically larger. The difference in fractal dimension (D) between semifusinite and vitrinite is minimal, with both values exceeding that of fusinite (Table 6). This may suggest approximate similarity and a higher degree of pore irregularity in vitrinite and semifusinite, whereas fusinite exhibits relatively less irregular pore structures among the three macerals. Nevertheless, AFM characterizes only the surface topography of polished sections, and the pores quantified by AFM are surface depressions that differ from the volumetric pores measured by adsorption and intrusion. Therefore, a multi-scale pore characterization of different maceral assemblages was performed.
Table 6.
Fractal dimensions of pores in different macerals.
3.5. Multiple-Scale Pore Characteristics of Different Maceral Assemblages
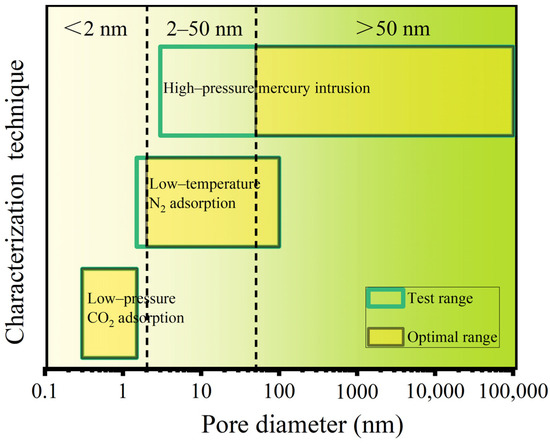
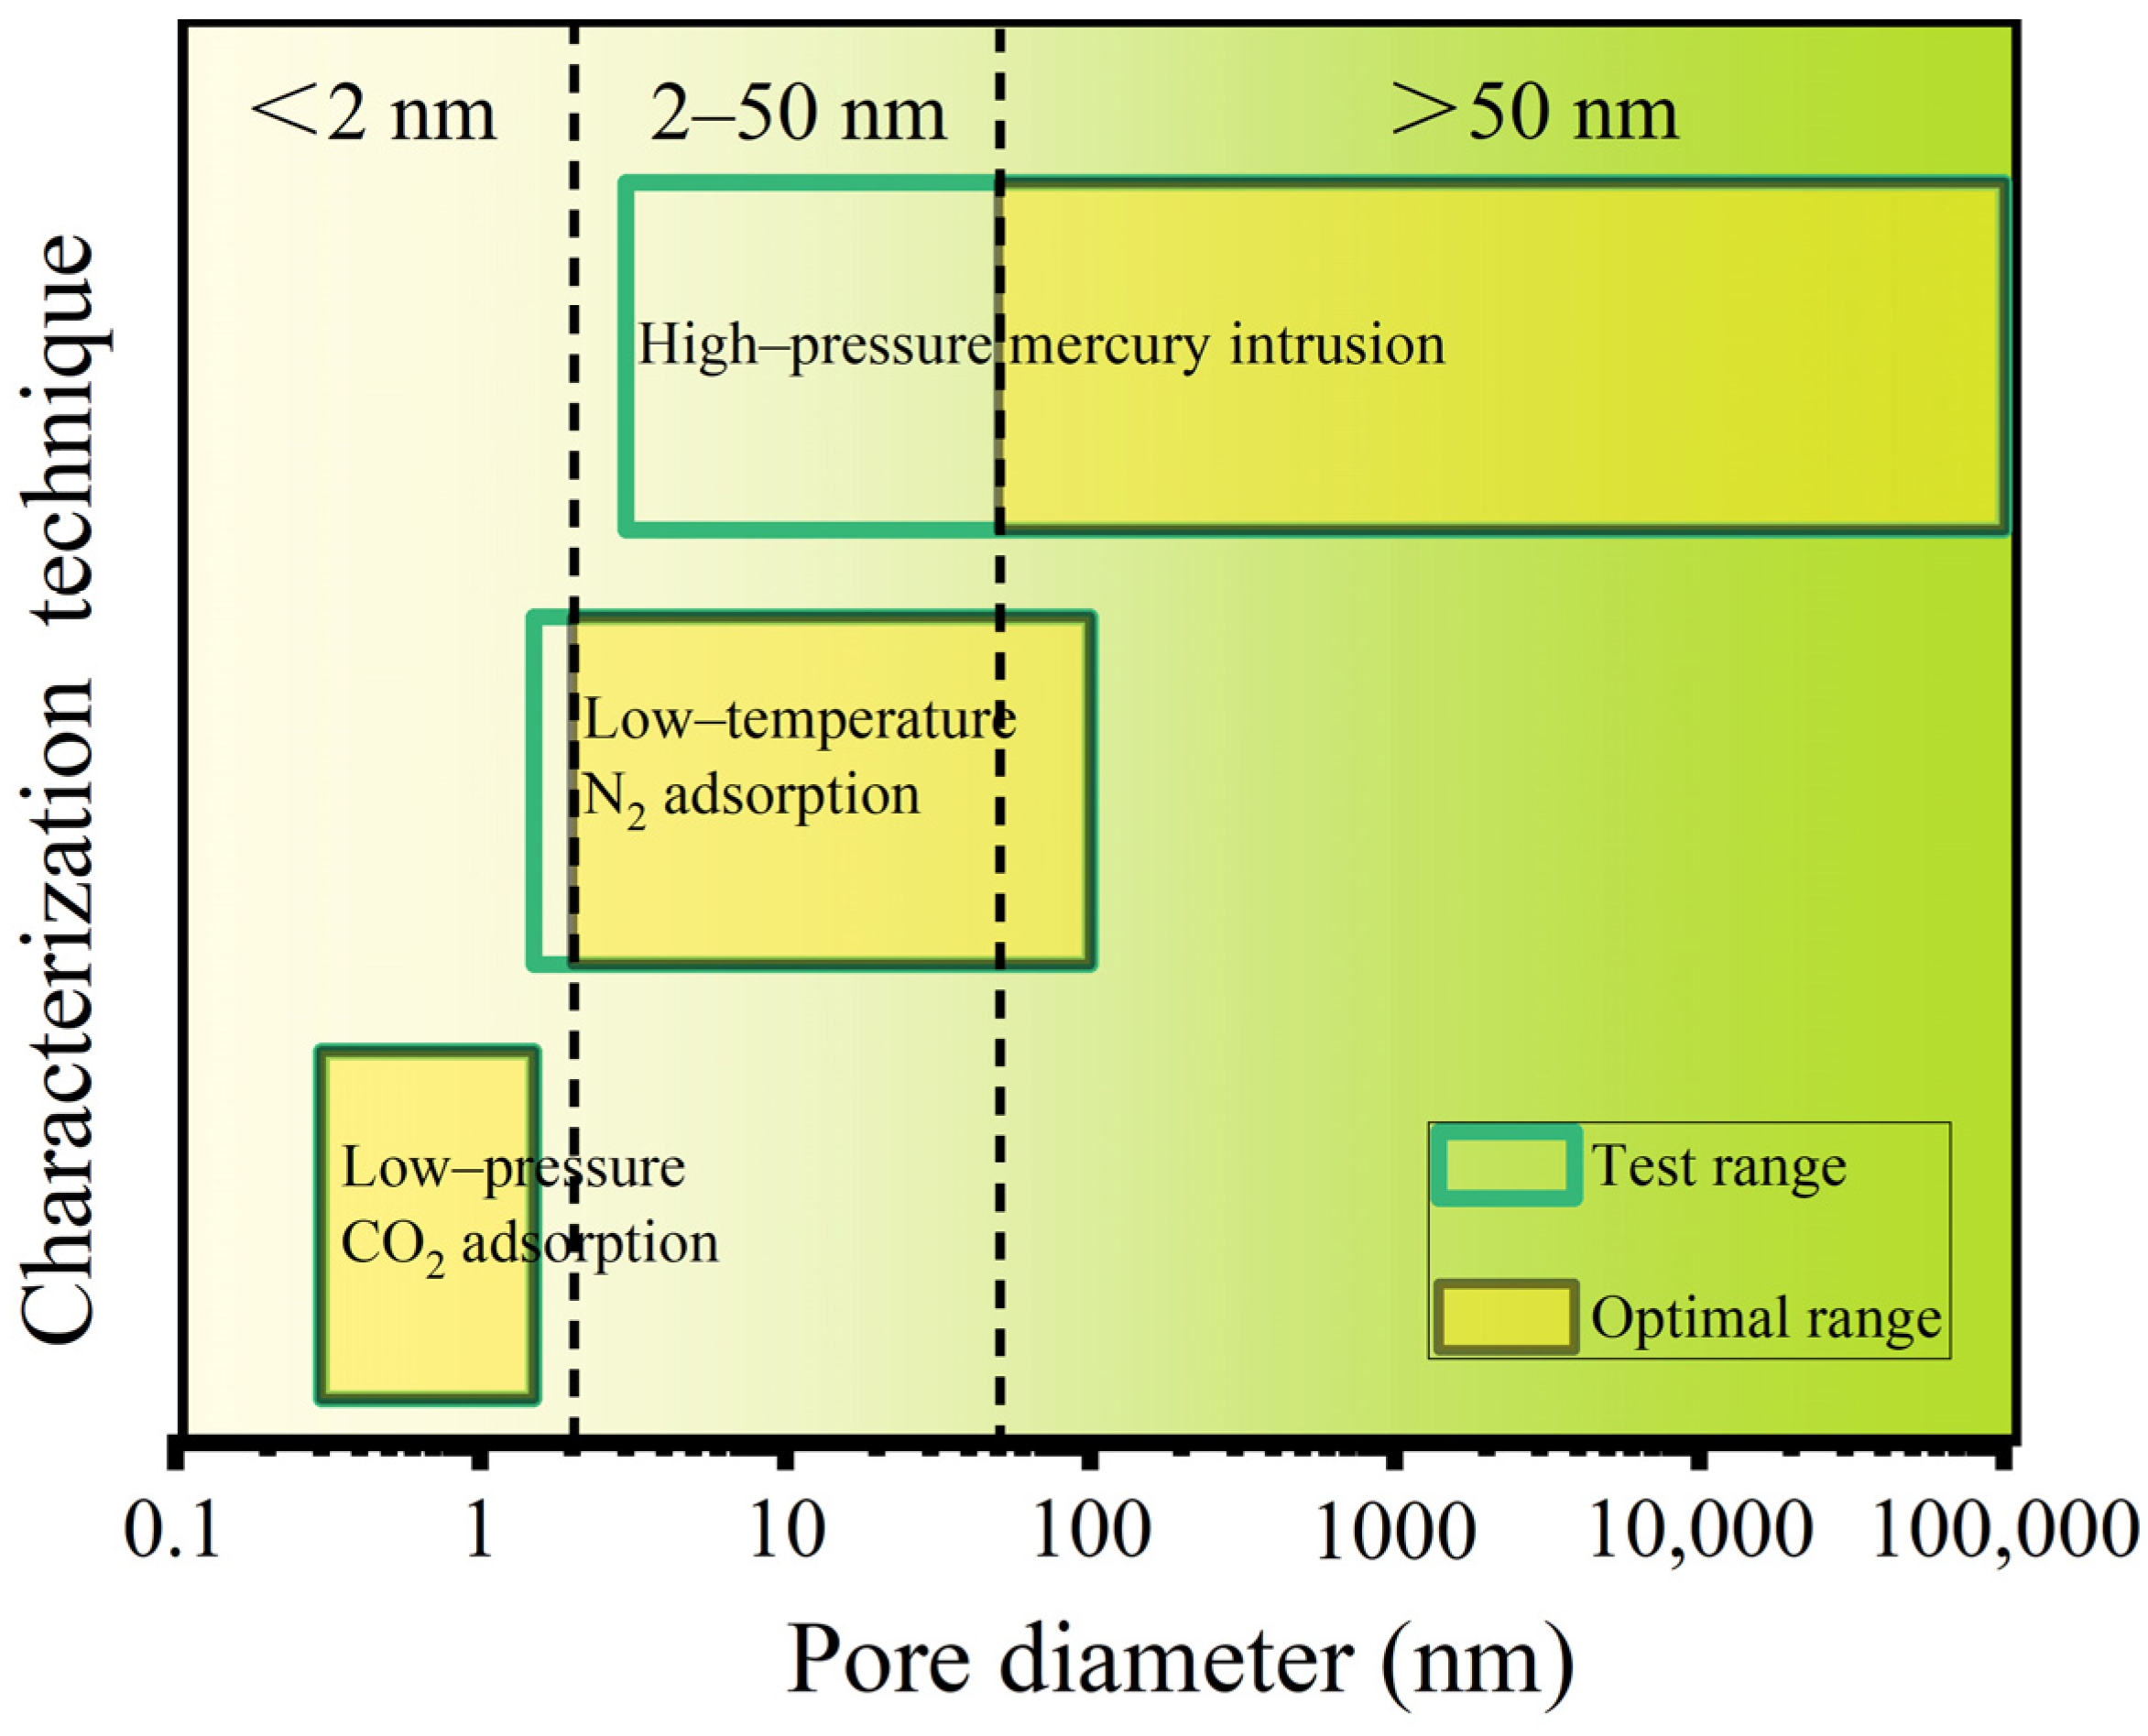
To accurately characterize the full-range pore structure of bulk coal samples, an integrated approach combining three techniques (including high-pressure mercury intrusion, low-pressure CO2 adsorption, and low-temperature N2 adsorption) was employed. By merging the optimal pore-size ranges of these three techniques (Figure 8), a continuous quantitative characterization from micropores to macropores was achieved. The three datasets were joined at their optimal ranges. The CO2-derived micropore distributions (<2 nm) were connected to the N2-derived mesopore distributions (2–50 nm), which were, in turn, connected to the mercury-intrusion macropore distributions (>50 nm). The gas adsorptions and high-pressure mercury intrusion data are shown in Figure 9, Figure 10 and Figure 11. To reduce the effects of coal rank, the full-scale pore analysis was restricted to C2–C4. Because C1 had the lowest Ro,max value (0.46%), C2, C3, and C4 had similar Ro,max values (0.64 to 0.69%).
Figure 8.
Test ranges and optimal ranges of different experimental methods for pore size characterization of coal samples. Redrawn based on [48].
Figure 9.
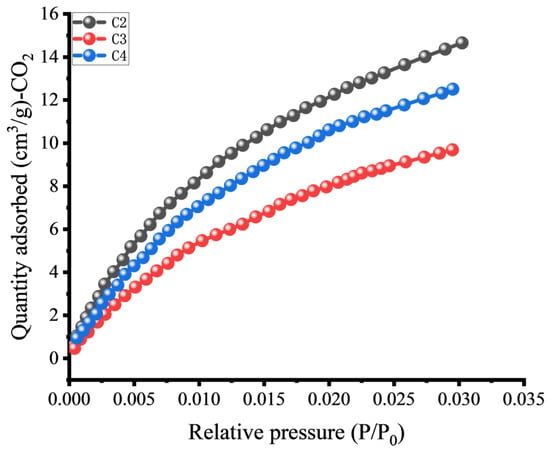
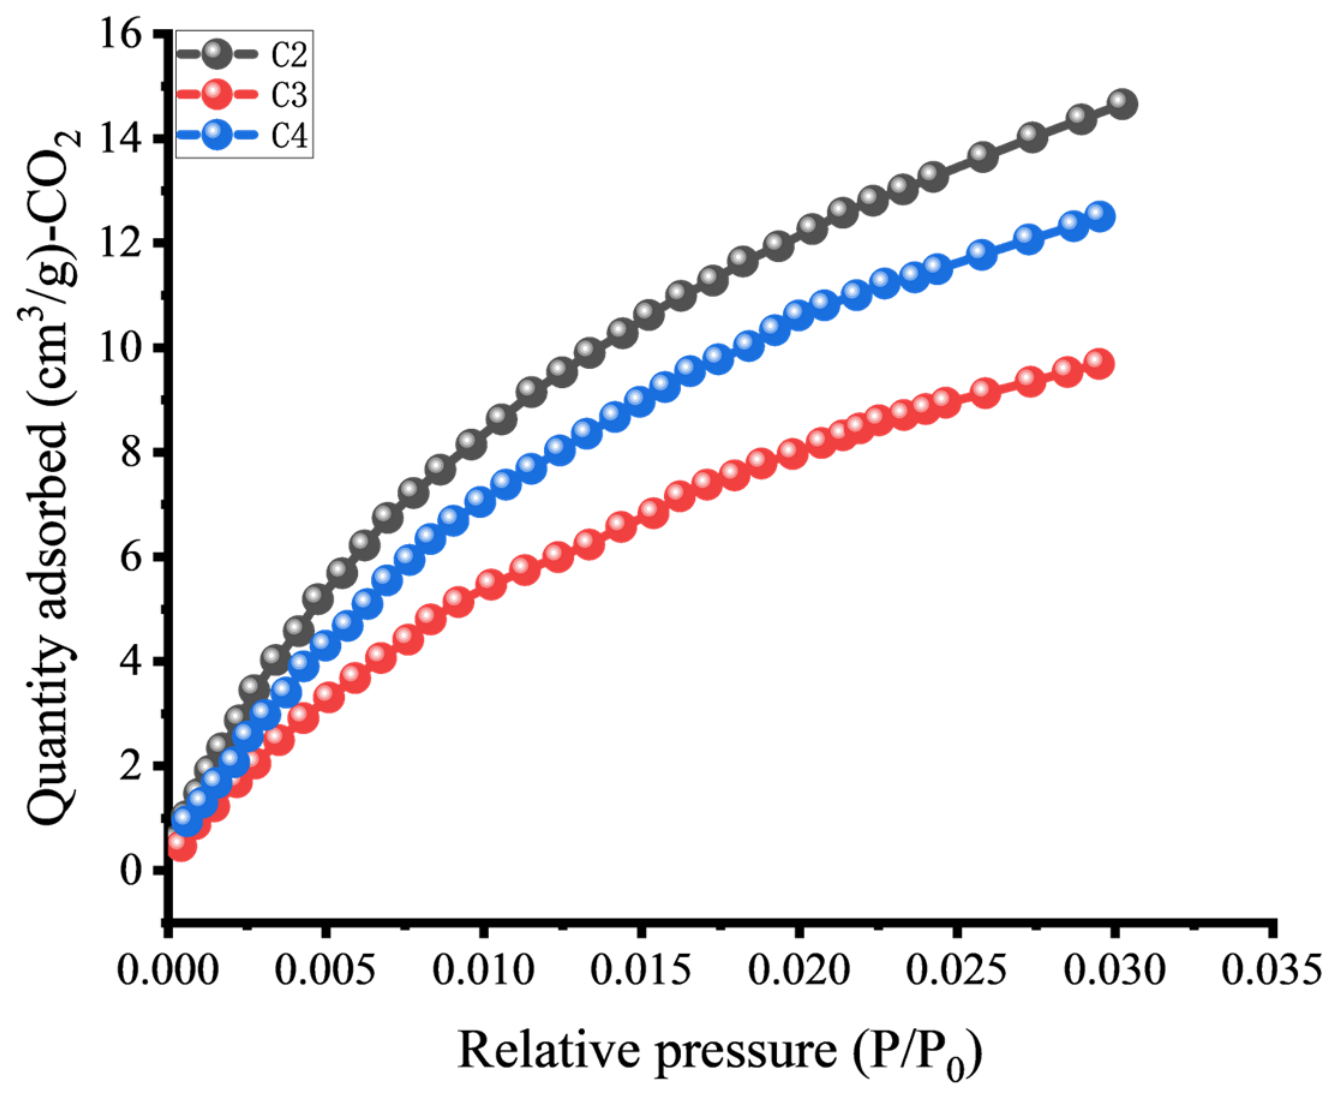
Low-pressure CO2 adsorption curves of coal samples.
Figure 10.
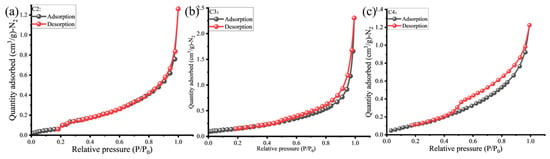
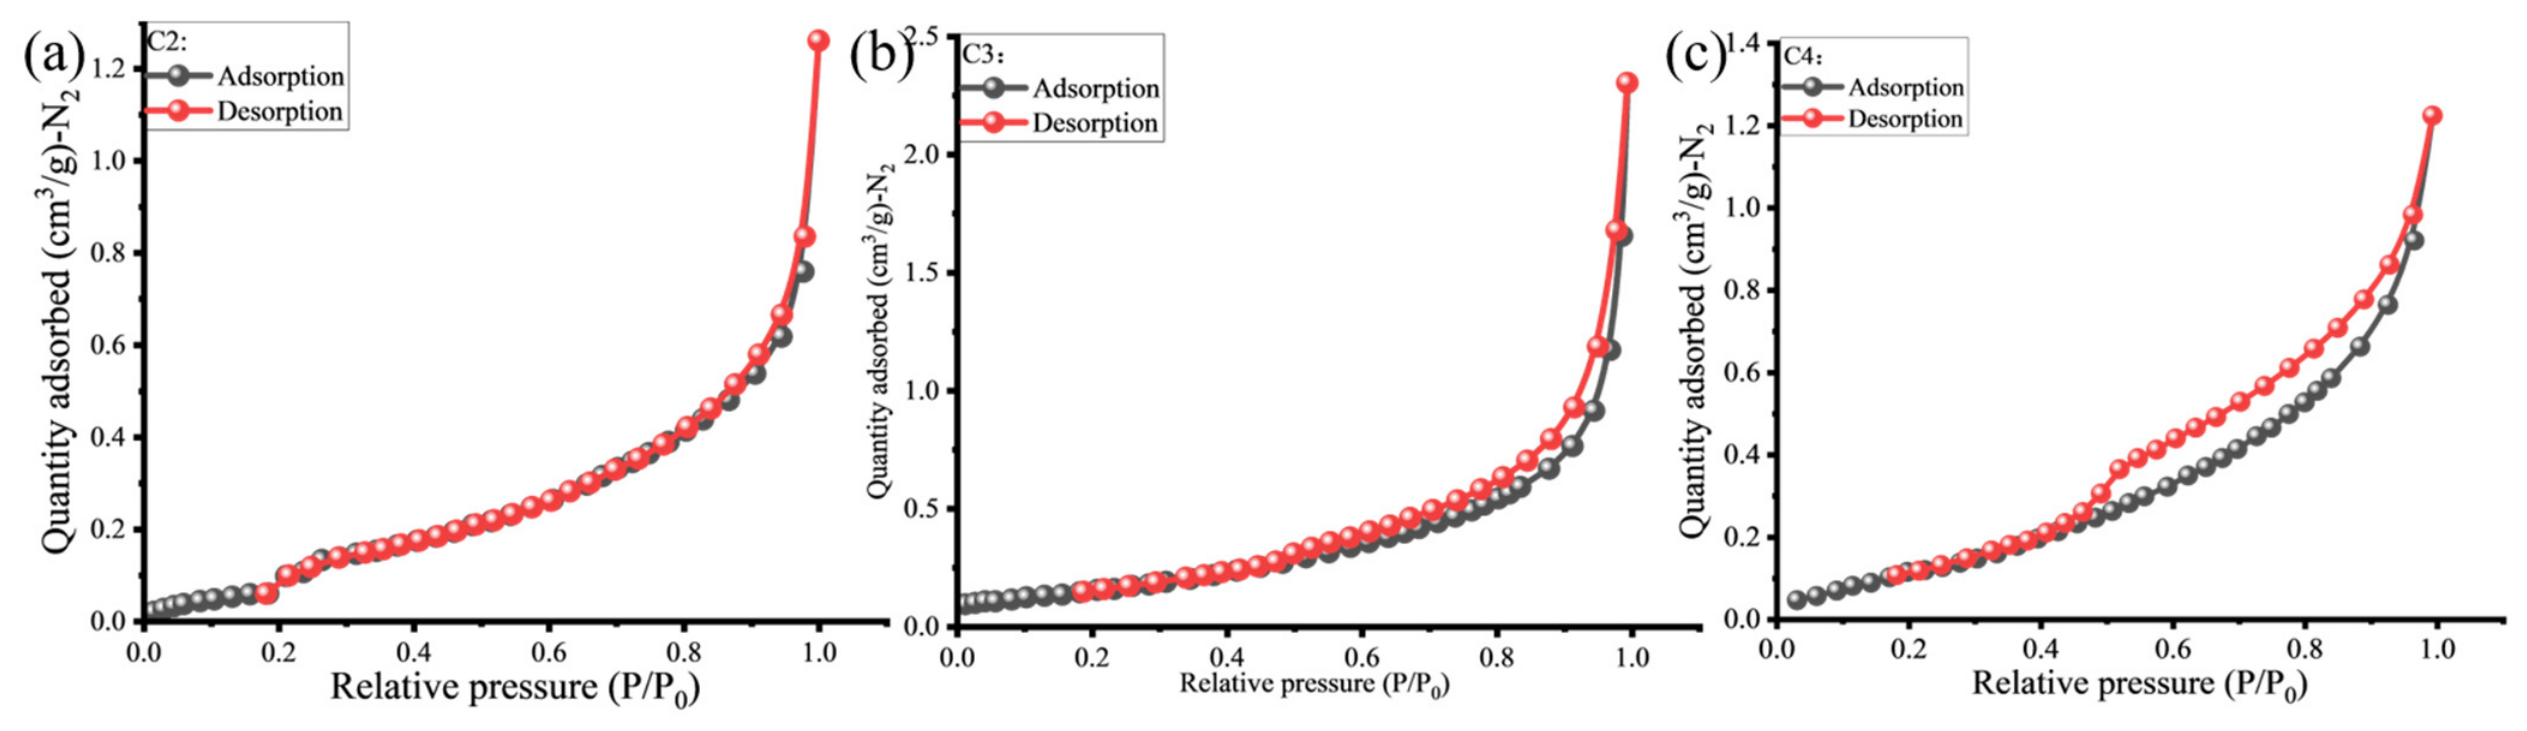
Low-temperature N2 adsorption curves of coal samples. (a) C2 sample; (b) C3 sample; (c) C4 sample.
Figure 11.
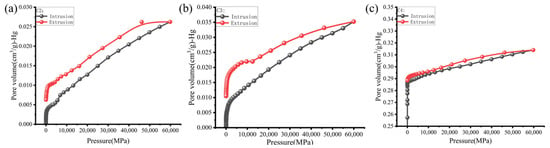
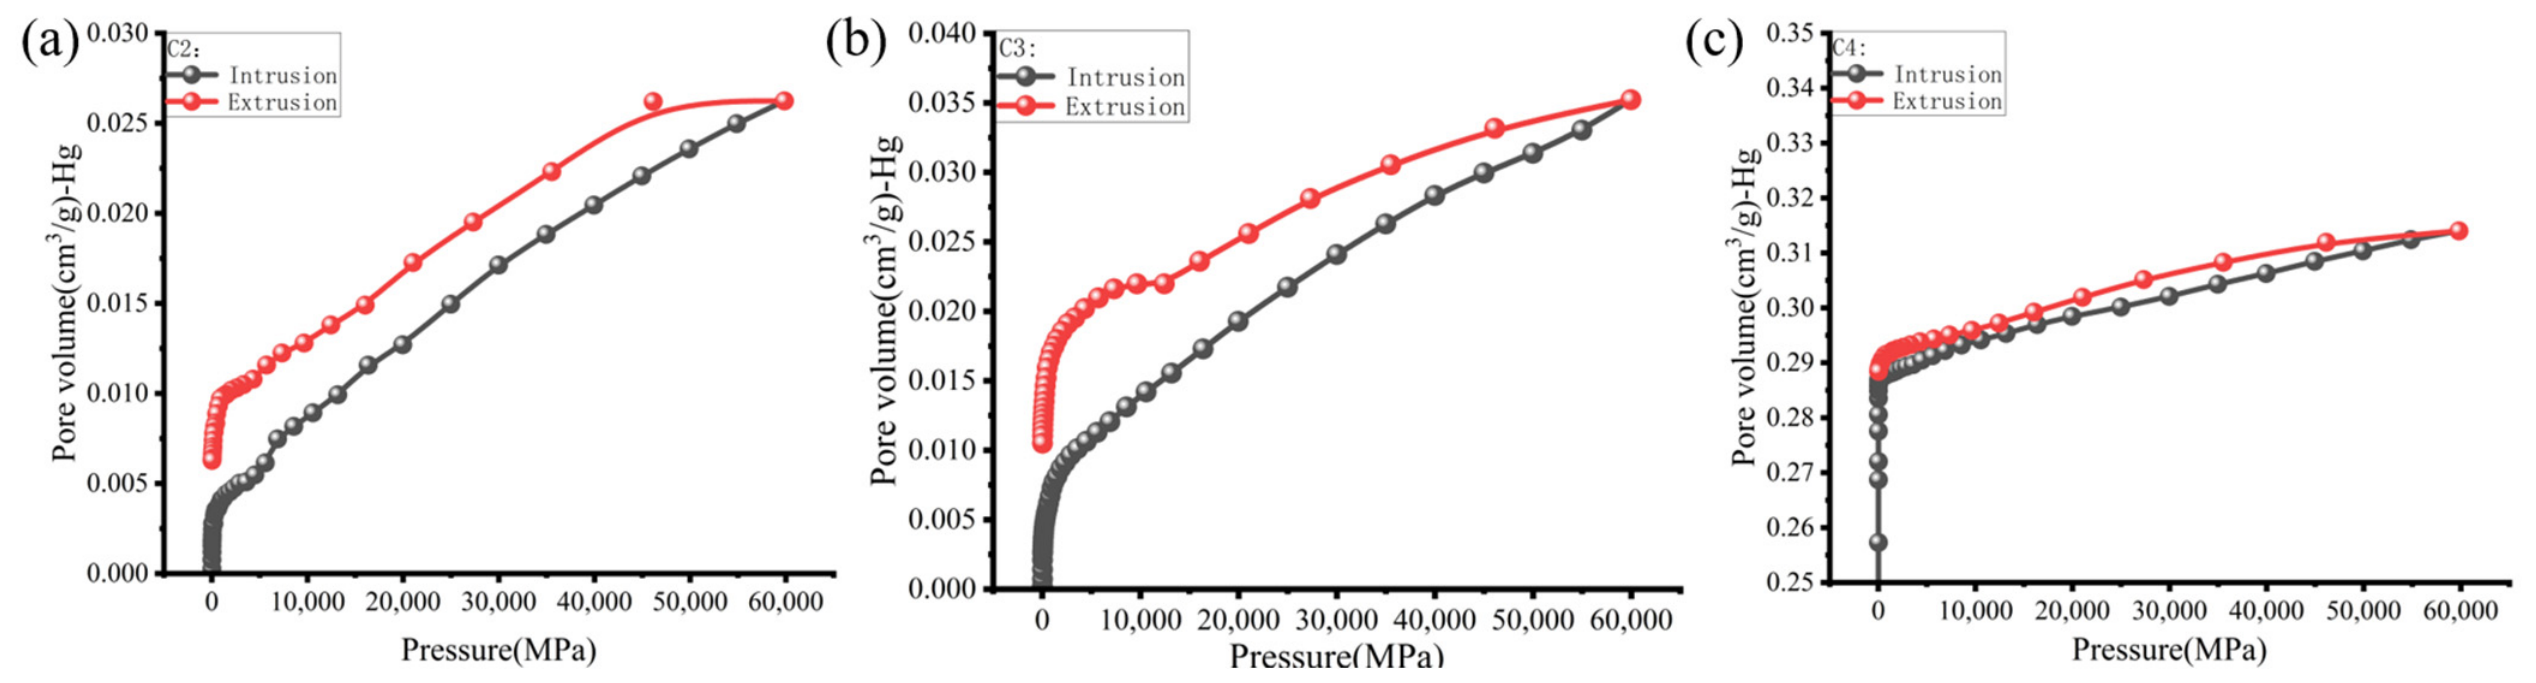
High-pressure mercury intrusion curves of coal samples. (a) C2 sample; (b) C3 sample; (c) C4 sample.
The multiple-scale pore structure characteristics reveal systematic variations that are intrinsically governed by the maceral assemblages. As shown in Figure 9, sample C2 (bright coal) exhibits the highest CO2 adsorption capacity, followed by C4 and C3, confirming the largest micropore abundance in C2. This is consistent with the AFM and Raman results of individual macerals, which demonstrated that vitrinite possesses a loose macromolecular arrangement (Figure 5), the highest surface fractal dimension (Ds = 1.55), and abundant amorphous carbon (Figure 2). These microscopic features are consistent with the development of abundant adsorption-available micropores [48], constituting the structural basis for the superior adsorption capacity of vitrinite-rich coals (C2 and C3).
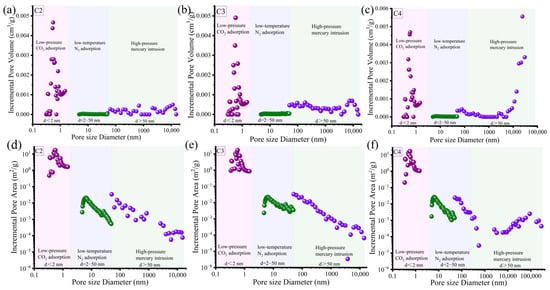
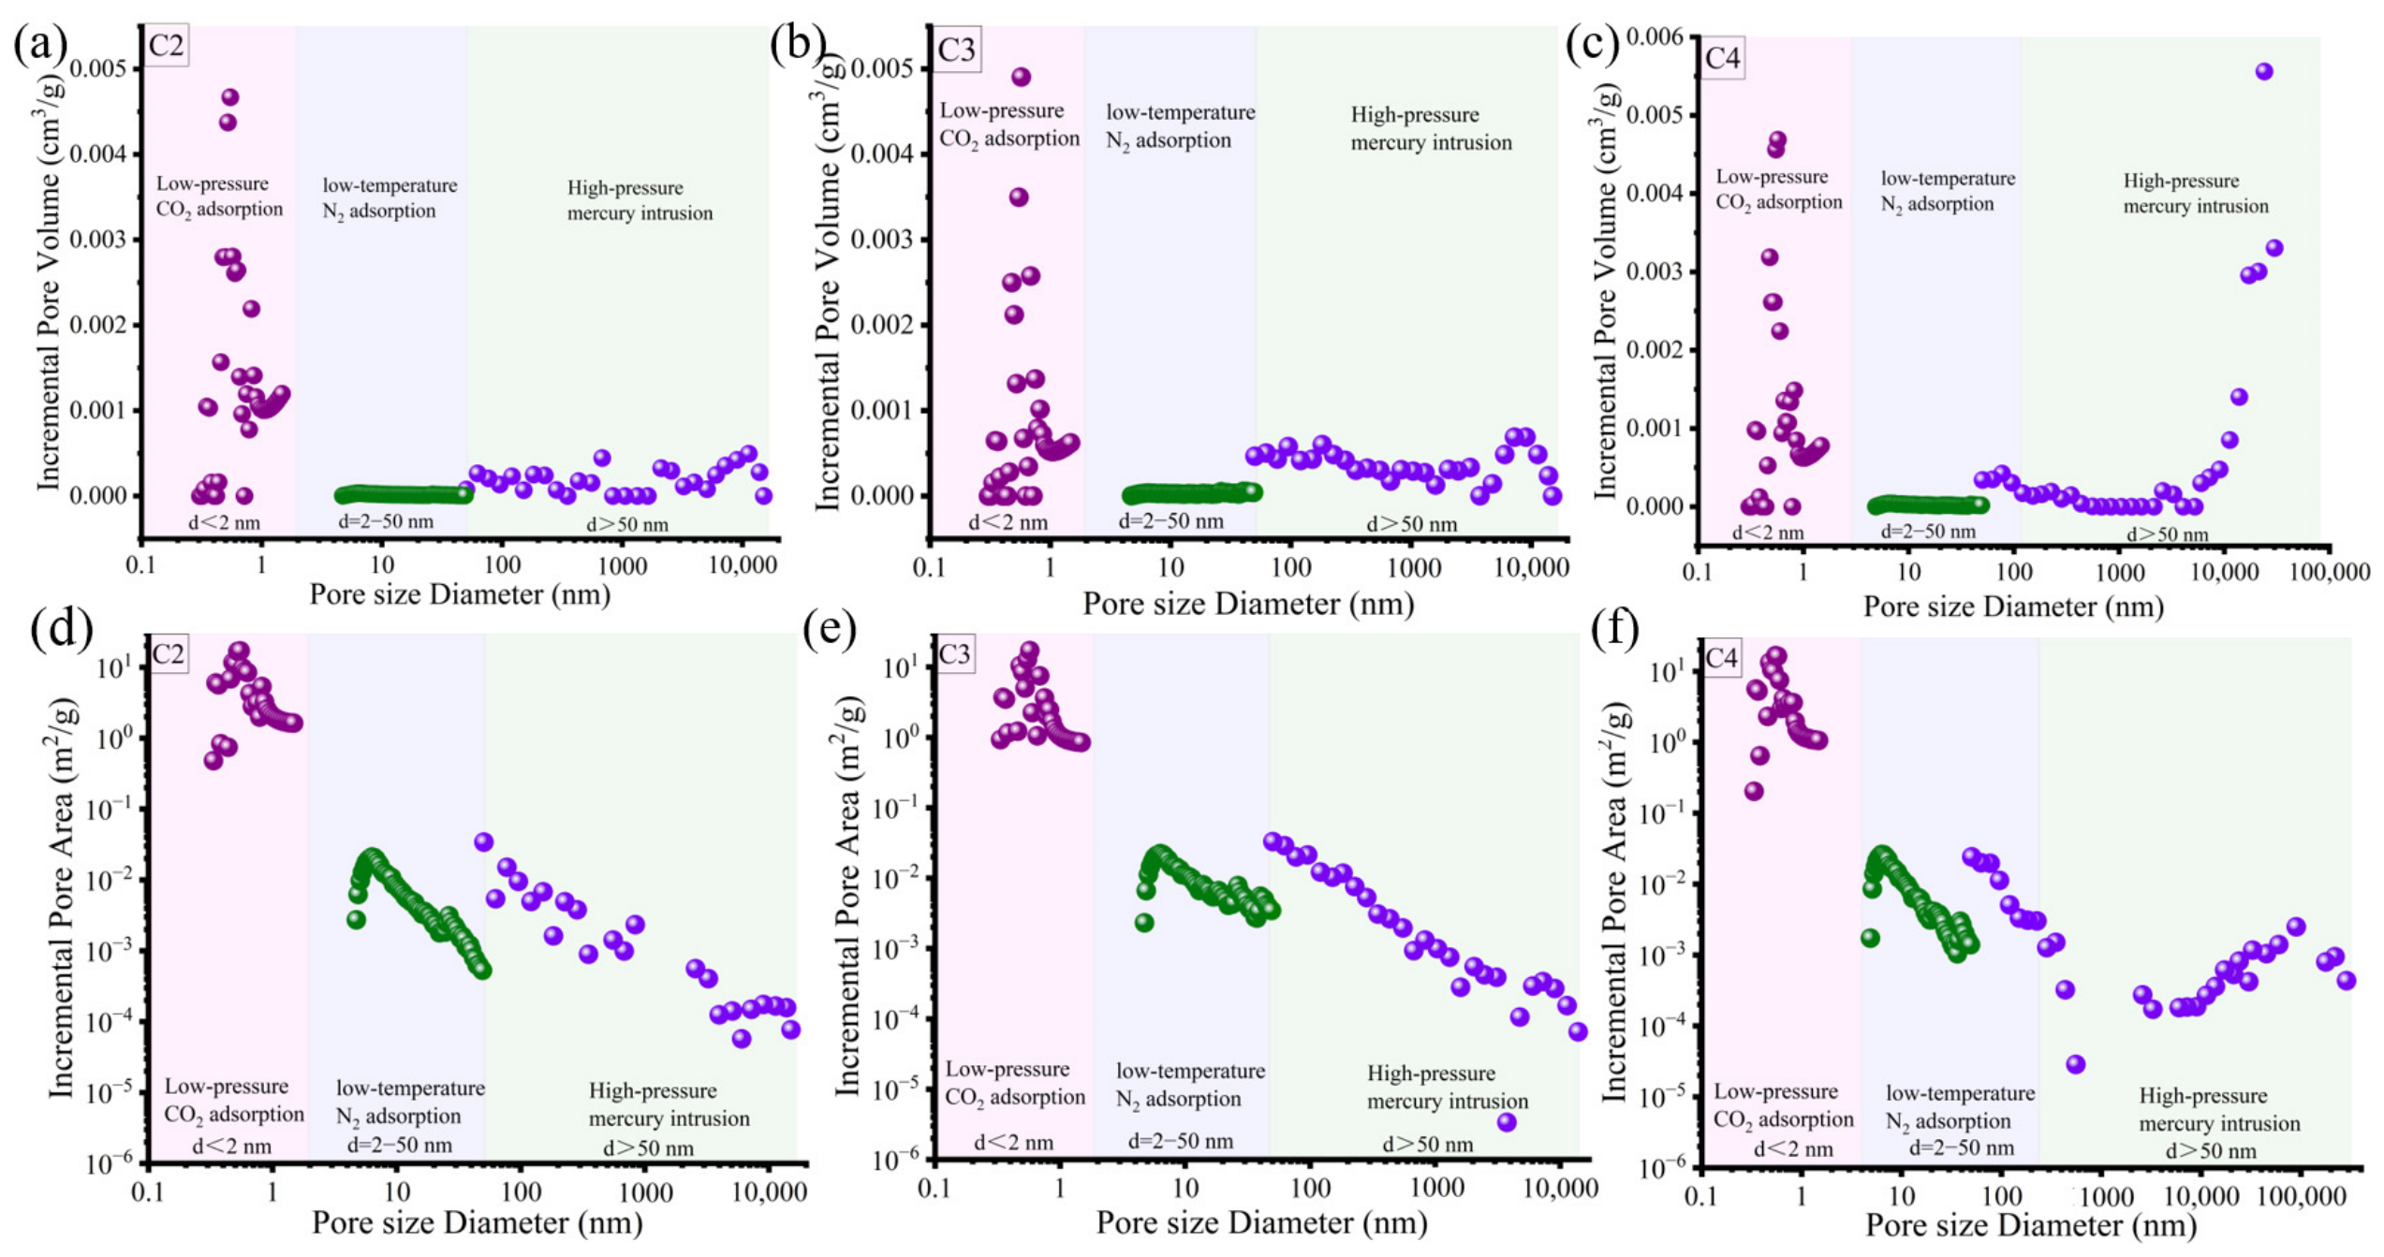
However, the macropore structure characteristics reveal a different maceral control mechanism. The high-pressure mercury intrusion curves (Figure S2e–g) show that sample C4 has the maximum macropore volume, followed by C3 and C2. Correspondingly, the integrated full-scale pore size distributions (Figure 12a–c) display a unimodal distribution dominated by micropores in C2 and C3, whereas C4 exhibits a distinct bimodal distribution dominated by both micropores and macropores. This bimodality in C4 is attributed to its elevated inertinite content (I = 27.7%). AFM analysis on individual macerals confirmed that fusinite and semifusinite possess a pore system overwhelmingly dominated by mesopores (above 97.39%), with the largest mean pore size (21.22 nm).
Figure 12.
The integrated full-scale pore size distributions of the coal samples. (a–c) are pore volume distributions; (d–f) are specific surface area data.
Despite the substantial macropore volume in C4, its pore connectivity is significantly compromised. The N2 adsorption of C4 displays an H2-type hysteresis loop with a sharp drop at P/P0 ≈ 0.5 (Figure 10c), a diagnostic feature of the “ink-bottle” effect. This phenomenon indicates an abundance of narrow-necked, wide-bodied pores. It directly reflects the fact that, in semi-bright or semi-dull coals (enriched in inertinite), authigenic clay minerals (as indicated by the high ash yield of C3 in Table 1) can physically clog and segment the mesopores and macropores. In contrast, C2 and C3 display narrow H3-type hysteresis loops with nearly parallel branches, indicating slit-shaped pores with minimal “ink-bottle” effects and excellent mesopore connectivity [49], consistent with their vitrinite-rich composition.
The pore size distribution curves of micropores, mesopores, and macropores are shown in Figure S2 (Supplementary Materials). The micropore size distribution curves (Figure S2) exhibit a consistent trimodal pattern for three coal samples, with three distinct peaks centered at approximately 0.3 nm, 0.5 nm, and 0.9 nm. The peak at approximately 0.5 nm is the most prominent, contributing the most to the pore volume and specific surface area. Quantitatively, Table 7 shows that micropores contribute 63.57%, 44.70%, and 10.94% of the total pore volume and 91.79%, 85.26%, and 88.40% of the total specific surface area for C2, C3, and C4, respectively. This indicates that although C4 has a large macropore volume, its methane adsorption capacity is still dominated by micropores, which are mainly associated with vitrinite. The mesopore size distribution curves are shown in Figure S2b,e,h. The pore volume (black curves) shows a multimodal pattern across the three coal samples. Pore volumes are mainly contributed by the 5–50 nm region in C2 and C4, while the pore volume is mainly contributed by the >20 nm region in C3. The specific surface area (red curves) is overwhelmingly dominated by pores smaller than 15 nm, with prominent peaks at 3–10 nm. When pore diameters are above 20 nm, the mesopore specific surface area exhibits an overall decreasing trend. The macropore-size distribution curves are shown in Figure S2c,f,i. The pore volume (black curves) is mainly contributed by pores of larger diameters, a phenomenon that is most pronounced in inertinite-rich sample C4, while the specific surface area (red curves) is mainly contributed by pores of 50–200 nm.
Table 7.
The pore volume and specific surface area of different pore sizes.
The integrated full-scale pore-size distributions (Figure 12) and associated pore parameters (Table 7) further reveal that pores in C2 and C3 are dominated by well-developed micropores, whereas C4 is dominated by both well-developed micropores and macropores. Mesopores are relatively underdeveloped. For all studied coal samples, the specific surface area decreases with increasing pore size. Micropores, peaking at 0.55–0.58 nm, are well developed and dominate methane adsorption, contributing 85.26–91.79% of the total specific surface area. In contrast, the well-developed macropores and fractures act as the principal seepage pathways facilitating gas flow towards the wellbore [47,48,49]. These contrasting pore systems, controlled by maceral composition, have significant implications for CBM exploitation.
3.6. Implications of Maceral-Controlled Pore Structure for CBM Exploitation
The microscopic heterogeneity of macerals fundamentally dictates the macroscopic storage and transport behavior of CBM. Based on the differentiation among vitrinite, semifusinite, and fusinite and their corresponding full-scale pore responses in bulk coals, evidence from the perspective of maceral-controlled pore structure is discussed.
3.6.1. Relationship Between Maceral Composition and Macrolithotypes
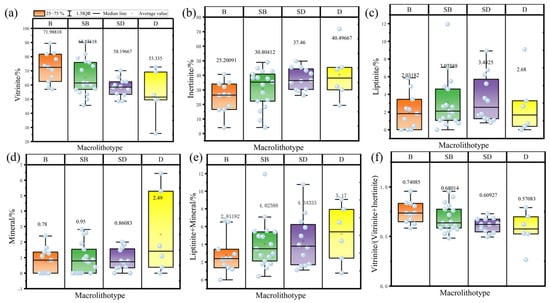
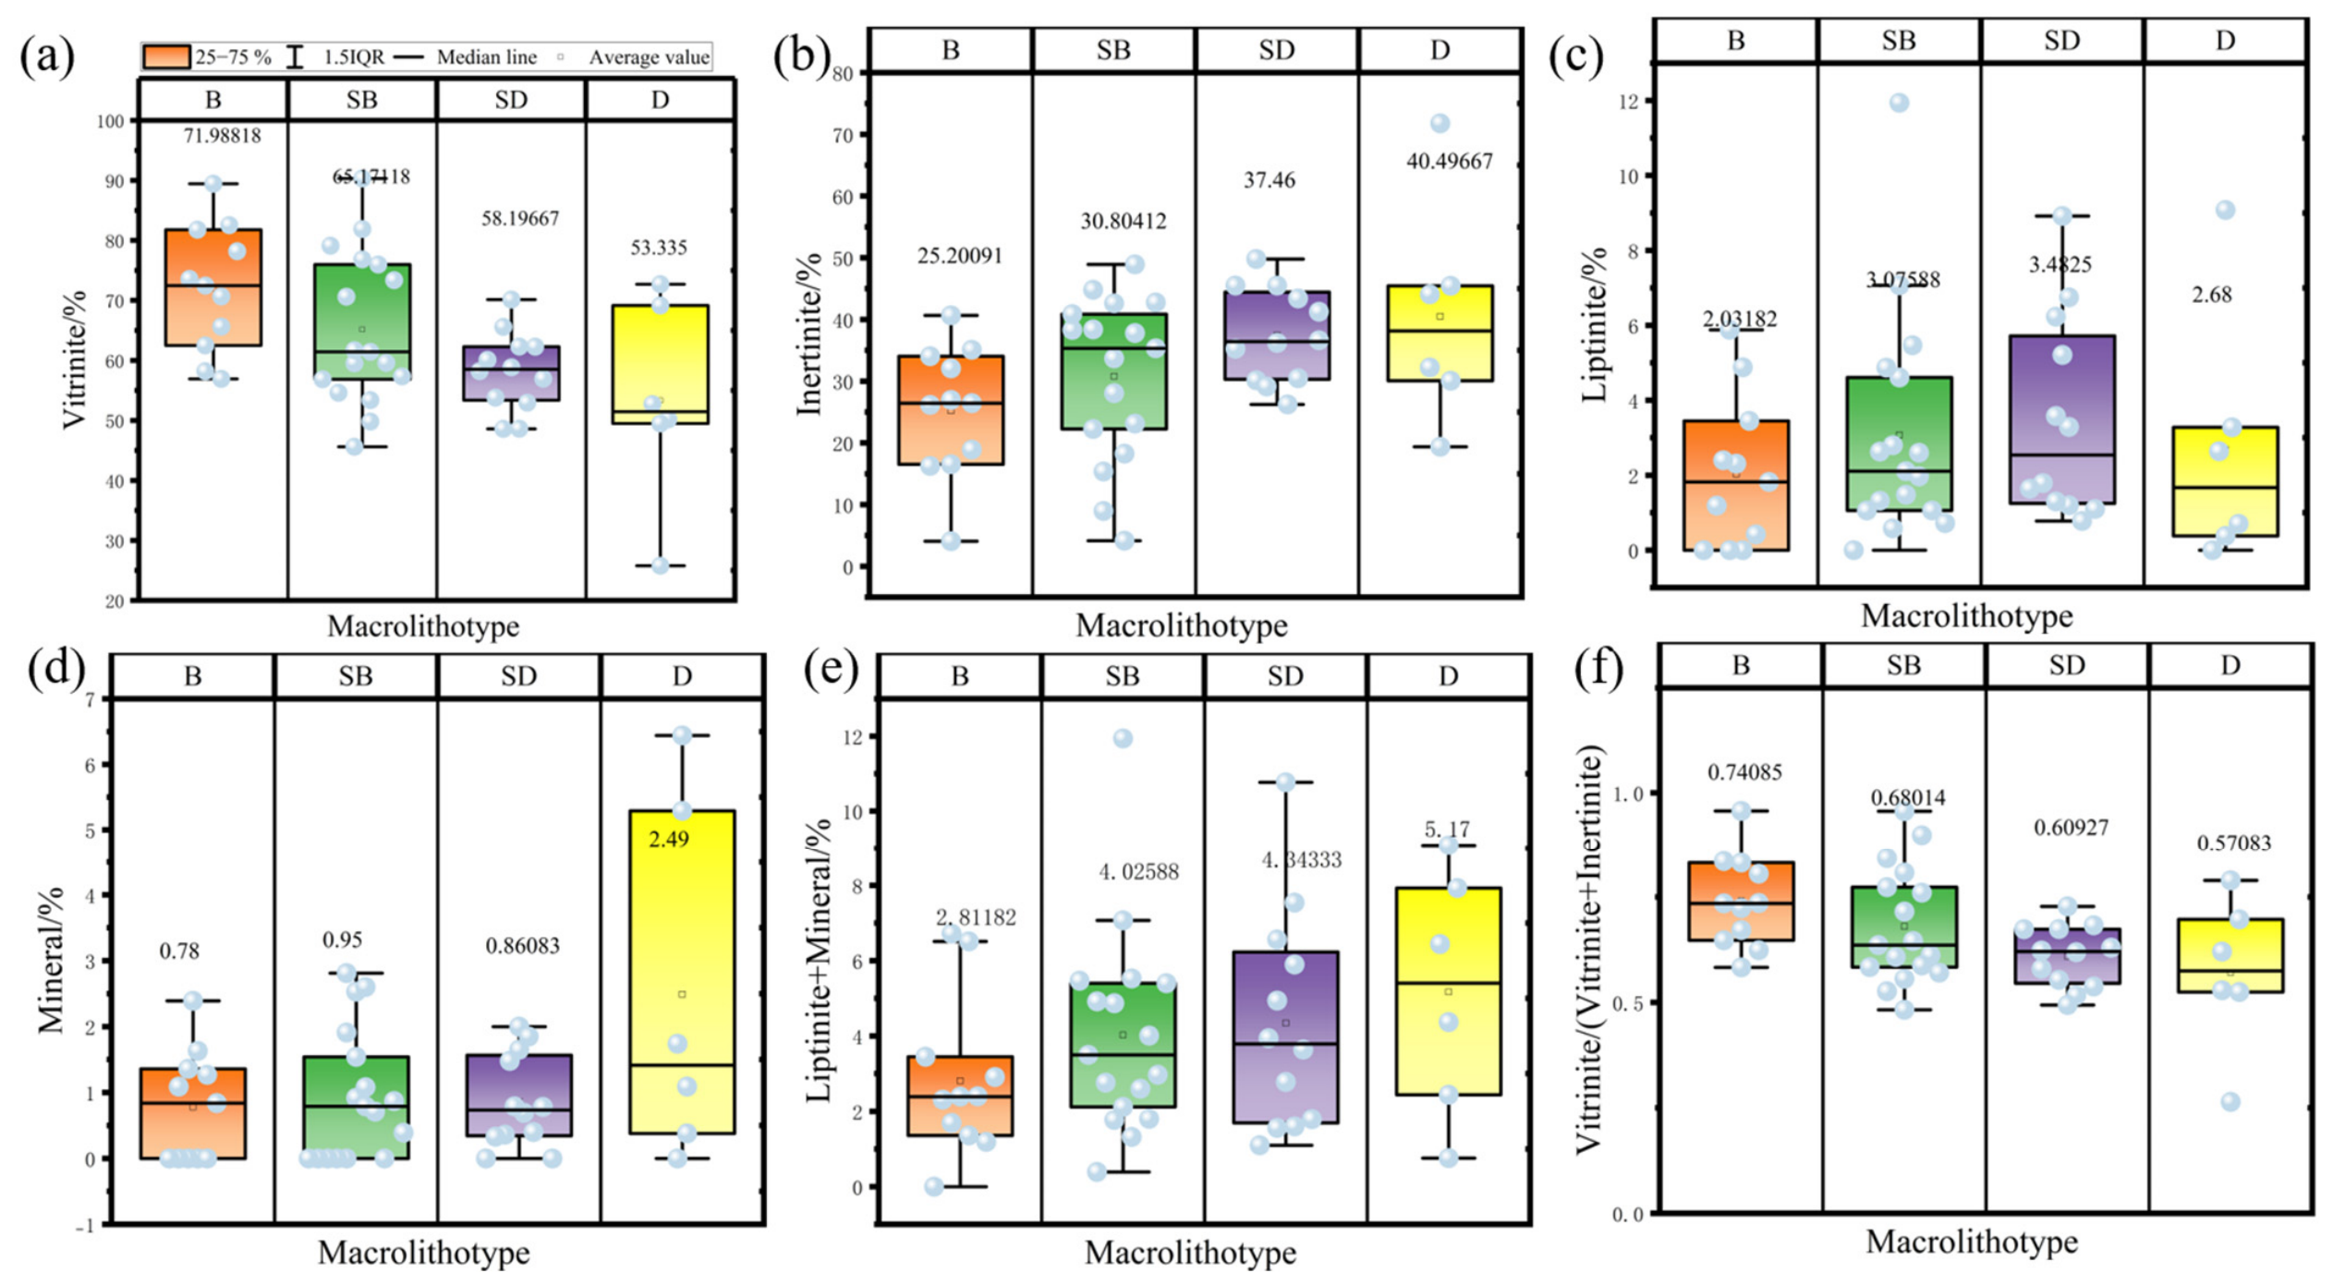
The maceral composition varied systematically across macrolithotypes (Figure 13), demonstrating that macrolithotype is essentially a macroscopic expression of the organic and inorganic composition. Vitrinite content decreases progressively from bright coal (B) to dull coal (D), with mean values of 71.99%, 65.17%, 58.20%, and 53.34%, respectively (Figure 13a). In contrast, inertinite content shows an opposite trend, increasing from 25.20% in bright coal to 40.50% in dull coal (Figure 13b). Liptinite is generally low in all samples, with a slight enrichment in semi-dull coal (Figure 13c). Mineral content is significantly higher in dull coal compared to the other types and exhibits a large variance, suggesting a highly heterogeneous distribution of inorganic matter (Figure 13d). The combined Liptinite + Mineral content further confirms the upward trend towards duller coals (Figure 13e). Consequently, the Vitrinite/(Vitrinite + Inertinite) ratio, a diagnostic parameter for organic matter composition, displays a clear stepwise decrease from bright coal (0.7408) to dull coal (0.5708) (Figure 13f), demonstrating a strong negative correlation with coal dullness.
Figure 13.
Relationship between macrolithotypes and macerals/minerals composition. B is bright coal; SB is semi–bright coal; SD is semi–dull coal; D is dull coal. Data were collected from a series of low–rank coals in Ref. [19]. The number of statistical samples is 50. (a) relationship between vitrinite and macrolithotype; (b) relationship between inertinite and macrolithotype; (c) relationship between liptinite and macrolithotype; (d) relationship between mineral and macrolithotype; (e) relationship between liptinite+mineral and macrolithotype; (f) relationship between vitrinite/(vitrinite+inertinite) and macrolithotype.
The strong relationship between maceral composition and macrolithotypes provides a macroscopic basis for reservoir evaluation. Bright and semi-bright coals, enriched in vitrinite, are expected to possess well-developed micropores, thereby offering superior methane adsorption capacity. Conversely, dull coals, characterized by high inertinite and mineral content, may develop larger pores and fractures, but their pore connectivity could be compromised by mineral infilling (especially clay minerals) [19]. Therefore, the macrolithotype distribution, easily identifiable in the field or via well logs, can serve as a practical proxy for predicting the microscale pore structure and gas storage/transport behavior of low-rank coal reservoirs.
3.6.2. Implications for Methane Adsorption and Migration
The maceral-controlled pore structure has direct implications for methane adsorption and storage in low-rank coals [48,50]. Methane adsorption in coal is primarily governed by micropore surface area [12,13]; this result indicates that adsorption capacity is essentially controlled by the abundance of micropores, which, in turn, is closely linked to vitrinite content. Sample C2, with the highest vitrinite content, exhibits the highest CO2 adsorption capacity, consistent with its well-developed microporous structure revealed by AFM and Raman analyses. In contrast, C4, which is enriched in inertinite, has a larger macropore volume but a lower micropore contribution to specific surface area, suggesting a reduced adsorption capacity. These observations are consistent with previous studies reporting a positive correlation between vitrinite content and methane adsorption capacity [51,52], although the adsorption contribution of inertinite remains debated [46,48,52]. The high inertinite and mineral contents in dull coal do not translate into superior adsorption capacity, because mineral infilling and the dominance of mesopores and macropores reduce the available micropore surface. Therefore, bright and semi-bright coals (C2 and C3) represent the most favorable intervals for methane storage in the studied low-rank coal reservoir.
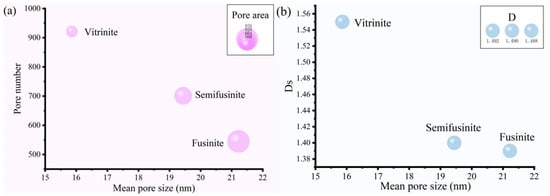
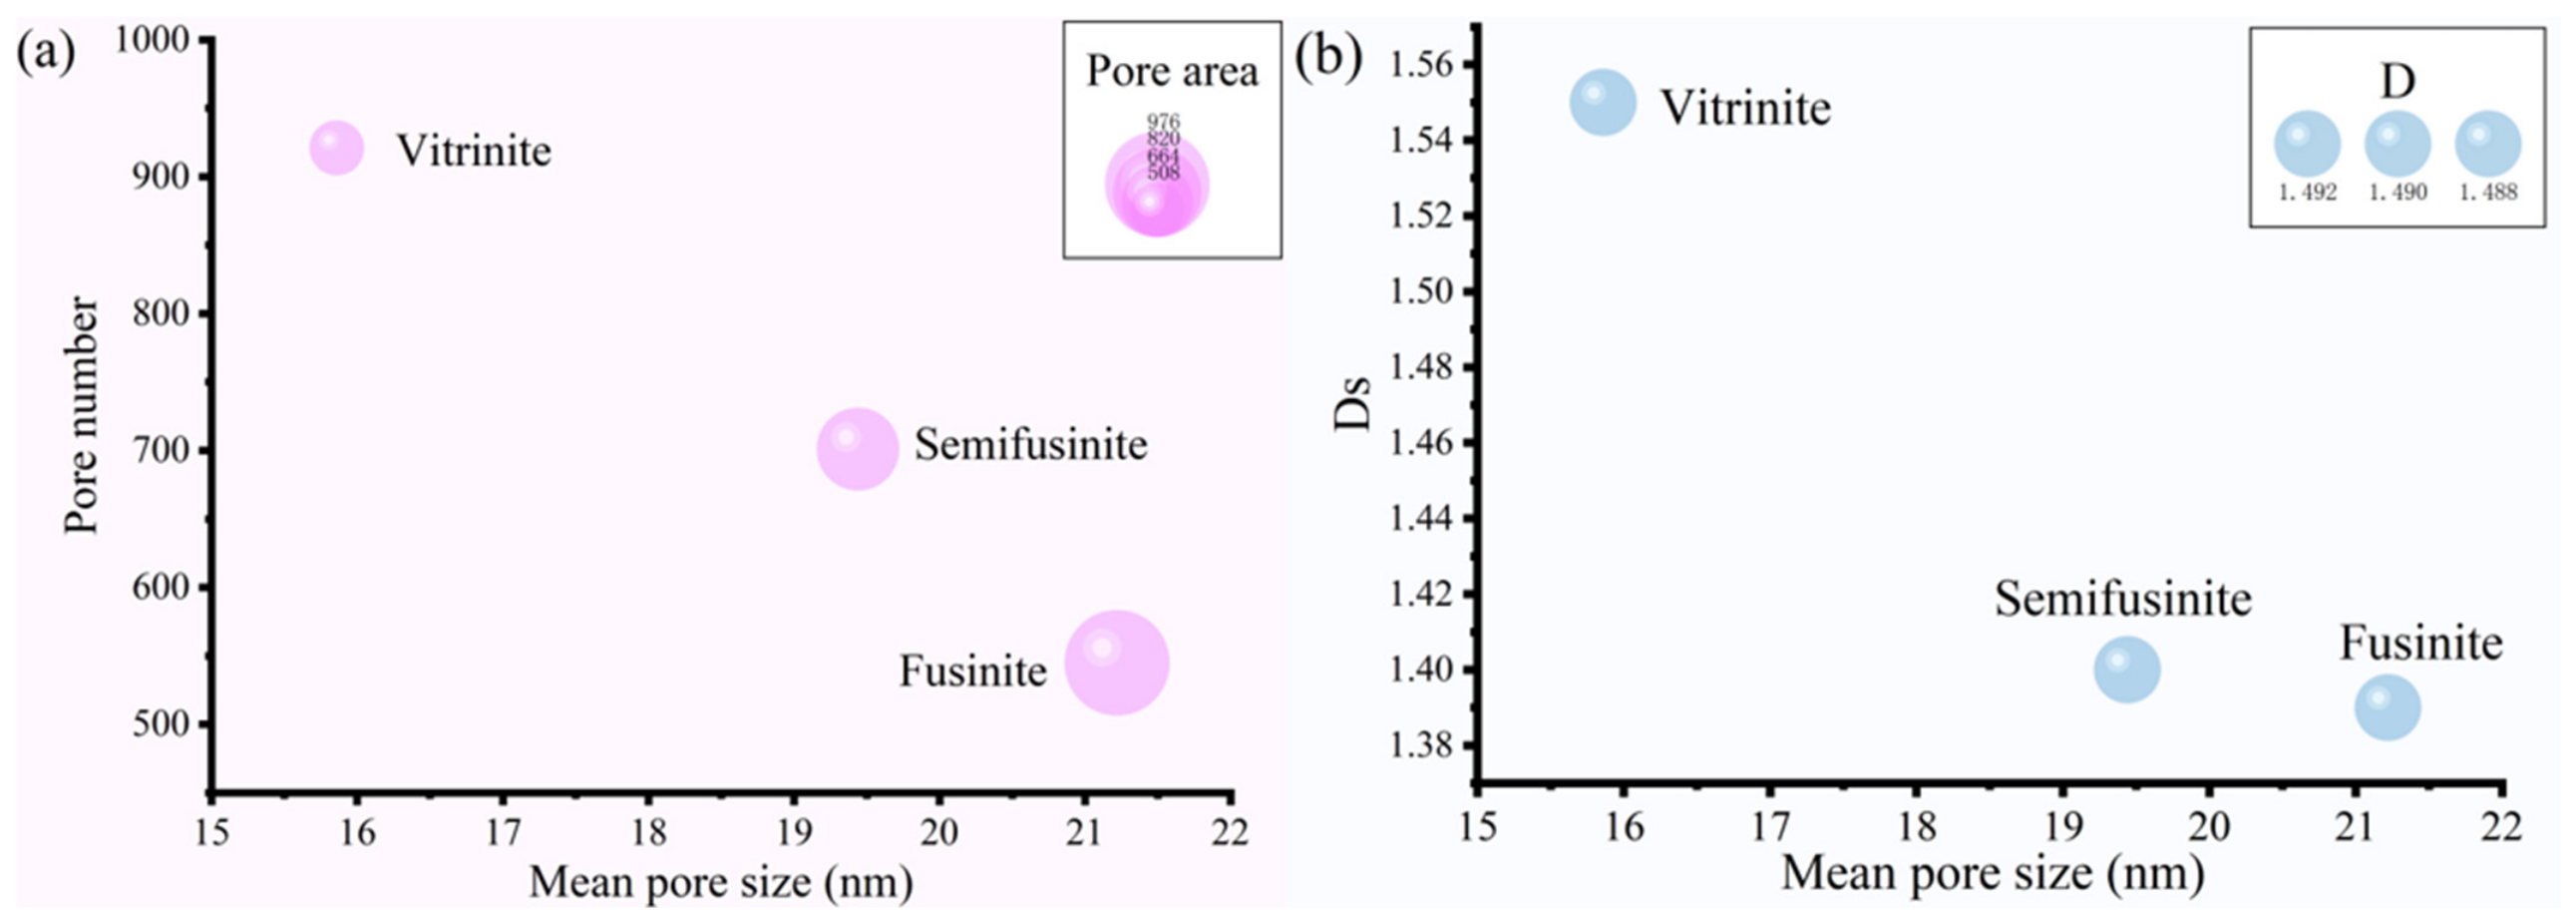
This maceral-scale control on methane adsorption can be further understood by considering the coupled variations in pore-structure parameters among individual macerals (Figure 14). Vitrinite exhibits a porous characteristic with a high pore number, small mean pore size, and a complex, undulating surface, whereas fusinite develops a coarser porous characteristic with fewer but larger pores and a relatively uniform surface; semifusinite exhibits transitional characteristics. This contrast suggests that the adsorption capacity of low-rank coals is governed not merely by total pore volume or maceral percentage but also by nanoscale pore partitioning (measured by gas adsorption and mercury intrusion), together with surface complexity (measured by AFM). The high adsorption potential of vitrinite can be attributed to its disordered macromolecular arrangement, abundant oxygen-containing functional groups, and highly heterogeneous surface, which together generate numerous micropores and high surface fractal dimensions. These features provide abundant adsorption sites and enhance van der Waals interactions with methane molecules [46,53]. In contrast, fusinite has experienced intense early oxidation and structural condensation, resulting in a more ordered and compact macromolecular structure that favors larger pores, but it offers fewer micropore adsorption sites [46,48,53]. From the perspective of intermolecular interactions, methane adsorption is dominated by van der Waals forces, particularly dispersion forces owing to the nonpolar nature of CH4 [54,55]. The disordered nanostructure of vitrinite enhances adsorption through increased isosteric heat, whereas the simpler morphology of fusinite offers fewer adsorption sites but larger pores that facilitate diffusion and desorption [27,53,54]. This interpretation is consistent with previous studies that reported a positive correlation between vitrinite content and methane adsorption capacity [54], although it contrasts with the view that inertinite-rich components may possess superior adsorption capacity [11,42,43,48]. The discrepancy may arise from differences in mineral content, pore connectivity, and coal rank. In the studied low-rank coals, mineral matter varies among samples, and where present, it may occlude micropores and reduce the effective surface area available for adsorption.
Figure 14.
Coupled variations of pore structure parameters and fractal dimension among macerals from AFM data. Ds is the morphological fractal dimension; D is the pore fractal dimension. (a) Mean pore size versus pore number; bubble size represents pore area. (b) Mean pore size versus morphological fractal dimension (Ds); bubble size represents pore fractal dimension (D).
Methane migration and production are governed by the connectivity and size distribution of mesopores and macropores, as well as by fractures. The well-developed macropores and fractures in C4 act as potential seepage pathways, but their effectiveness may be compromised by mineral infilling, particularly the minerals that filled the cavity of inertinites [56]. Although elevated mineral matter content is traditionally regarded as an indicator of reduced permeability, the spatial distribution and mode of occurrence of minerals, particularly those concentrated within the cell lumens of fusinite and semifusinite, are also critical in governing pore-fracture occlusion and CBM permeability [56]. Mineral matter, which is elevated toward the dull macrolithotype (Figure 13), may clog and segment the mesopores and macropores [48]. This interpretation is consistent with Cai et al. (2013), who showed that pore connectivity, rather than total pore volume, controls gas flow capability in medium- to low-rank coals [12]. Therefore, semi-dull and dull coals may possess large pore volumes but act as poorly connected seepage systems, potentially leading to high capillary trapping and low gas recovery efficiency [48]. These observations indicate that the balance between methane adsorption and migration in low-rank coals is controlled both by the relative proportions of vitrinite and inertinite and by the extent to which mineral matter modifies the pore network.
3.6.3. Optimization of CBM Exploration and Development Strategies
Evidence from the perspective of maceral-controlled pore structure is used for differentiated CBM exploration and development strategies in low-rank coal reservoirs. The key implication is that bright and semi-bright coals (vitrinite-rich) and dull coals (inertinite- and mineral-rich) require different engineering approaches because their pore systems serve different functions. The former is adsorption-dominated, whereas the latter is transport-limited by relatively poor connectivity.
For exploration targeting, bright and semi-bright coals are suggested to be prioritized for their superior methane storage capacity, as indicated by their high micropore surface area and high CO2 adsorption capacity. These intervals are expected to have higher gas content and are therefore favorable for sweet-spot identification. In contrast, dull coals should not be dismissed entirely, because their large macropore volumes may provide seepage pathways if the mineral-clogged pore throats can be bypassed or stimulated.
For fracturing design, vitrinite-rich zones require strategies that connect the micropore-dominated matrix to the macro-fracture network, thereby enhancing gas desorption and diffusion. In contrast, the challenge in inertinite-rich zones is overcoming mineral-clogged pore throats. Fracturing should therefore be designed to bypass these clogged zones and access the preserved larger pores. For drainage strategies, rapid depressurization in vitrinite-rich zones may cause severe matrix shrinkage and permeability loss [12,57], whereas slow depressurization in inertinite-rich zones may fail to overcome capillary trapping [48,58]. Optimizing the depressurization rate according to macrolithotype distribution is therefore critical for maximizing CBM recovery.
4. Conclusions
This study investigated the nanoscale pore structure, surface morphology, and chemical structure of vitrinite, semifusinite, and fusinite from Jurassic low-rank coals using AFM, micro-Raman, CO2/N2 adsorption, and mercury intrusion. The results show that maceral is associated with distinct nanoscale pore characteristics and surface complexity, which are expected to influence methane adsorption and migration. These findings provide a maceral-scale basis for differentiated CBM exploration and development strategies in low-rank coal reservoirs. The main conclusions are as follows:
- (1)
- Vitrinite, semifusinite, and fusinite exhibit distinct nanoscale pore structures and surface morphologies. Vitrinite has the highest surface fractal dimension, the largest pore number, and the highest micropore proportion, forming an adsorption-favorable nanostructure. Fusinite has the largest mean pore size and a pore system dominated by mesopores and macropores, favoring diffusion and desorption. Semifusinite shows transitional characteristics.
- (2)
- Maceral composition is strongly associated with full-scale pore characteristics that have implications for methane adsorption and migration. Vitrinite-rich coals are microporous and adsorption-dominated, with micropores contributing 88.40–91.79% of the total specific surface area. In contrast, inertinite-rich coals exhibit a bimodal pore-size distribution with abundant macropores but compromised connectivity, which may be caused by mineral infilling in inertinite.
- (3)
- Evidence in terms of maceral-controlled pore structure is proposed, in which vitrinite acts as an adsorption-favorable phase, fusinite acts as a migration-favorable phase, and semifusinite acts as a transitional phase. Macrolithotype refers to the macroscopic expression of maceral assemblages. The V/(V + I) ratio decreases from 0.74 in bright coal to 0.57 in dull coal, which still requires validation using larger engineering and production datasets, yet this may serve as a practical diagnostic parameter for low-rank coal reservoir evaluation.
Supplementary Materials
The following supporting information can be downloaded at https://www.mdpi.com/article/10.3390/fractalfract10110744/s1. Figure S1: The detailed peak-fitting procedures of Raman spectra; Figure S2: Pore size distributions of coal samples; Table S1: Definitions of notations.
Author Contributions
Conceptualization, X.Z.; methodology, X.Z.; software, X.C. and S.M.; formal analysis, X.Z.; investigation, X.Z.; writing—original draft preparation, X.Z.; writing—review and editing, H.C., X.L., and S.F.; funding acquisition, X.Z. All authors have read and agreed to the published version of the manuscript.
Funding
This research is supported by the Science and Technology Program of Xinjiang Uyghur Autonomous Region (2025B01009-2); the Natural Science Foundation of Xinjiang Uygur Autonomous Region (2026D01C288); and the “Tianchi Talent” program of Xinjiang Uygur Autonomous Region Introduction Plan (5105260180j).
Data Availability Statement
The data that support the findings of this study are available from the corresponding author upon reasonable request.
Acknowledgments
We thank Q. G. for their assistance during experimental analysis. We also thank the editor and reviewers for their careful review, which resulted in improvements in the quality of publication.
Conflicts of Interest
The authors declare no conflicts of interest.
References
- Zhao, X.; Yang, Y.; Sun, F.; Wang, B.; Zuo, Y.; Li, M.; Shen, J.; Mu, F. Enrichment Mechanism and Exploration and Development Technologies of High Coal Rank Coalbed Methane in South Qinshui Basin, Shanxi Province. Pet. Explor. Dev. 2016, 43, 332–339. [Google Scholar] [CrossRef] [Scilit]
- Shen, J.; Qin, Y.; Zhao, J. Maceral Contribution to Pore Size Distribution in Anthracite in the South Qinshui Basin. Energy Fuels 2019, 33, 7234–7243. [Google Scholar] [CrossRef] [Scilit]
- Tao, S.; Chen, S.; Pan, Z. Current Status, Challenges, and Policy Suggestions for Coalbed Methane Industry Development in China: A Review. Energy Sci. Eng. 2019, 7, 1059–1074. [Google Scholar] [CrossRef] [Scilit]
- Beaton, A.; Langenberg, W.; Pana, C. Coalbed Methane Resources and Reservoir Characteristics from the Alberta Plains, Canada. Int. J. Coal Geol. 2006, 65, 93–113. [Google Scholar] [CrossRef] [Scilit]
- Jian, K.; Fu, X.; Ding, Y.; Wang, H.; Li, T. Characteristics of Pores and Methane Adsorption of Low-Rank Coal in China. J. Nat. Gas Sci. Eng. 2015, 27, 1142–1152. [Google Scholar] [CrossRef] [Scilit]
- Yu, S.; Bo, J.; Fengli, L.; Jiegang, L. Structure and Fractal Characteristic of Micro- and Meso-Pores in Low, Middle-Rank Tectonic Deformed Coals by CO2 and N2 Adsorption. Microporous Mesoporous Mater. 2017, 253, 191–202. [Google Scholar] [CrossRef] [Scilit]
- Lamberson, M.N.; Bustin, R.M. Coalbed Methane Characteristics of Gates Formation Coals, Northeastern British Columbia: Effect of Maceral Composition. AAPG Bull. 1993, 77, 2062–2076. [Google Scholar] [CrossRef] [Scilit]
- Li, Q.; Lin, B.; Wang, K.; Zhao, M.; Ruan, M. Surface Properties of Pulverized Coal and Its Effects on Coal Mine Methane Adsorption Behaviors under Ambient Conditions. Powder Technol. 2015, 270, 278–286. [Google Scholar] [CrossRef] [Scilit]
- Wang, M.S.; Zou, G.G.; Zhu, R.B. Relationship between Maceral of Coal and Coal-Bed Methane Adsorption Ability in Sihe Coalmine of Qinshui Basin, China. IOP Conf. Ser. Mater. Sci. Eng. 2018, 359, 012026. [Google Scholar] [CrossRef] [Scilit]
- Laxminarayana, C.; Crosdale, P.J. Role of Coal Type and Rank on Methane Sorption Characteristics of Bowen Basin, Australia Coals. Int. J. Coal Geol. 1999, 40, 309–325. [Google Scholar] [CrossRef] [Scilit]
- Morga, R. Changes of Semifusinite and Fusinite Surface Roughness during Heat Treatment Determined by Atomic Force Microscopy. Int. J. Coal Geol. 2011, 88, 218–226. [Google Scholar] [CrossRef] [Scilit]
- Cai, Y.; Liu, D.; Pan, Z.; Yao, Y.; Li, J.; Qiu, Y. Pore Structure and Its Impact on CH4 Adsorption Capacity and Flow Capability of Bituminous and Subbituminous Coals from Northeast China. Fuel 2013, 103, 258–268. [Google Scholar] [CrossRef] [Scilit]
- Faiz, M.I.; Aziz, N.I.; Hutton, A.; Jones, B.G. Porosity and Gas Sorption Capacity of Some Eastern Australian Coals in Relation to Coal Rank and Composition. In Proceedings of the Coalbed Methane Symposium, Townsville, Australia, 19–21 November 1992. [Google Scholar]
- Levy, J.H.; Day, S.J.; Killingley, J.S. Methane Capacities of Bowen Basin Coals Related to Coal Properties. Fuel 1997, 76, 813–819. [Google Scholar] [CrossRef] [Scilit]
- Clarkson, C.R.; Bustin, R.M. Variation in micropore capacity and size distribution with composition in bituminous coal of the Western Canadian Sedimentary Basin: Implications for coalbed methane potential. Fuel 1996, 75, 1483–1498. [Google Scholar] [CrossRef] [Scilit]
- Zhang, Z.; Qin, Y.; Wang, G.X.; Fu, X.H. Numerical description of coalbed methane desorption stages based on isothermal adsorption experiment. Sci. China Earth Sci. 2013, 56, 1029–1036. [Google Scholar] [CrossRef] [Scilit]
- Crosdale, P.J.; Beamish, B.B.; Valix, M. Coalbed methane sorption related to coal composition. Int. J. Coal Geol. 1998, 35, 147–158. [Google Scholar] [CrossRef] [Scilit]
- Zhao, S.; Li, Y.; Wang, Y.; Ma, Z.; Huang, X. Quantitative study on coal and shale pore structure and surface roughness based on atomic force microscopy and image processing. Fuel 2019, 244, 78–90. [Google Scholar] [CrossRef] [Scilit]
- Hou, H.; Liang, G.; Shao, L.; Tang, Y.; Yan, Z. Dual Control of Macrolithotype and Coal Structure on the Pore Parameters of Middle Jurassic Coals in the Southern Junggar Basin, NW China. Acta Geol. Sin. (Engl. Ed.) 2025, 99, 194–211. [Google Scholar] [CrossRef] [Scilit]
- Clarkson, C.R.; Solano, N.R.; Bustin, R.M.; Bustin, A.M.M.; Blach, T.P. Pore Structure Characterization of North American Shale Gas Reservoirs Using USANS/SANS, Gas Adsorption, and Mercury Intrusion. Fuel 2013, 103, 606–616. [Google Scholar] [CrossRef] [Scilit]
- Walker, P.L., Jr.; Verma, S.K.; Rivera-Utrilla, J.; Khan, M.R. A Direct Measurement of Expansion in Coals and Macerals Induced by Carbon Dioxide and Methanol. Fuel 1988, 67, 719–726. [Google Scholar] [CrossRef] [Scilit]
- Rantitsch, G.; Lämmerer, W.; Fisslthaler, E.; Mitsche, S.; Kaltenböck, H. On the Discrimination of Semi-Graphite and Graphite by Raman Spectroscopy. Int. J. Coal Geol. 2016, 159, 48–56, Erratum in Int. J. Coal Geol. 2016, 167, 238. [Google Scholar] [CrossRef] [Scilit]
- Cao, H.; Zhang, H.; Li, K.; Liu, Q. Investigation on the Graphitization of Anthracite Promoted by Kaolinite under High-Temperature Treatment. Appl. Surf. Sci. 2026, 720, 165122. [Google Scholar] [CrossRef] [Scilit]
- Qiao, P.; Ju, Y.; Yu, K.; Ju, L.; Xiao, L.; Feng, H.; Yao, Y.; Nie, B.; Li, X.; Tian, J.; et al. Nanoscale Quantitative Characterization of Microstructure Evolution of Partly Graphitized High Rank Coal: Evidence from AFM and HRTEM. Fuel 2022, 324, 124802. [Google Scholar] [CrossRef] [Scilit]
- Zhang, X.; Wang, S.; Chen, H.; Guo, Q.; Li, L.; Luo, G. Aromatic Structural Characterization of Different-Rank Vitrinites: Using HRTEM, XRD and AFM. Polycycl. Aromat. Compd. 2019, 41, 1319–1330. [Google Scholar] [CrossRef] [Scilit]
- Liu, X.; Nie, B.; Wang, W.; Wang, Z.; Zhang, L. The Use of AFM in Quantitative Analysis of Pore Characteristics in Coal and Coal-Bearing Shale. Mar. Pet. Geol. 2019, 105, 331–337. [Google Scholar] [CrossRef] [Scilit]
- Wang, S.; Liu, S.; Sun, Y.; Jiang, D.; Zhang, X. Investigation of Coal Components of Late Permian Different Ranks Bark Coal Using AFM and Micro-FTIR. Fuel 2017, 187, 51–57. [Google Scholar] [CrossRef] [Scilit]
- Jiao, K.; Yao, S.; Zhang, K.; Hu, W.; Cao, J. The Evolution of Nanopores and Surface Roughness in Naturally Matured Coals in South China: An Atomic Force Microscopy and Image Processing Study. Fuel 2018, 234, 1123–1131. [Google Scholar] [CrossRef] [Scilit]
- Chen, C.; Tang, Y.; Guo, X. Comparison of Structural Characteristics of High-Organic-Sulfur and Low-Organic-Sulfur Coal of Various Ranks Based on FTIR and Raman Spectroscopy. Fuel 2022, 310, 122362. [Google Scholar] [CrossRef] [Scilit]
- Chen, H.; Wang, S.; Deng, J.; Zhang, X.; Liu, Y.; Li, X. Petrologic Characteristics and Chemical Structures of Macerals in a Suite of Thermally Altered Coals by Confocal Raman. ACS Omega 2021, 6, 33409–33418. [Google Scholar] [CrossRef] [Scilit] [PubMed]
- GB/T 482-2008; Sampling of Coal Seams. Standardization Administration of China: Beijing, China, 2008.
- GB/T 8899-2013; Determination of Maceral Group Composition and Minerals in Coal. Standardization Administration of China: Beijing, China, 2013.
- GB/T 6948-2008; Method of Determining Microscopically the Reflectance of Vitrinite in Coal. Standardization Administration of China: Beijing, China, 2008.
- Nečas, D.; Klapetek, P. Gwyddion: An Open-Source Software for SPM Data Analysis. Cent. Eur. J. Phys. 2012, 10, 181–188. [Google Scholar] [CrossRef] [Scilit]
- Elson, J.M.; Bennett, J.M. Calculation of the Power Spectral Density from Surface Profile Data. Appl. Opt. 1995, 34, 201–208. [Google Scholar] [CrossRef] [Scilit] [PubMed]
- Zhang, X.M.; Wang, S.Q.; Chen, H.; Deng, J.S.; Huo, L.Q. Micro Morphology and Pore Structure of Macerals in Coal Observed by Atomic Force Microscopy (AFM). Coal Sci. Technol. 2023, 51, 127–132. [Google Scholar] [CrossRef]
- Mandelbrot, B.B. Stochastic Models for the Earth’s Relief, the Shape and the Fractal Dimension of the Coastlines, and the Number-Area Rule for Islands. Proc. Natl. Acad. Sci. USA 1975, 72, 3825–3828. [Google Scholar] [CrossRef] [Scilit] [PubMed]
- Peng, R.D.; Xie, H.P.; Ju, Y. Calculation Method of Fractal Dimension of 2-D Digital Image. J. China Univ. Min. Technol. 2004, 33, 22–27. [Google Scholar] [CrossRef]
- GB/T 21650.3-2011; Pore Size Distribution and Porosity of Solid Materials by Mercury Porosimetry and Gas Adsorption—Part 3: Analysis of Micropores by Gas Adsorption. Standardization Administration of China: Beijing, China, 2011.
- GB/T 21650.2-2008; Pore Size Distribution and Porosity of Solid Materials by Mercury Porosimetry and Gas Adsorption—Part 2: Analysis of Mesopores and Macropores by Gas Adsorption. Standardization Administration of China: Beijing, China, 2008.
- GB/T 21650.1-2008; Pore Size Distribution and Porosity of Solid Materials by Mercury Porosimetry and Gas Adsorption—Part 1: Mercury Porosimetry. Standardization Administration of China: Beijing, China, 2008.
- Morga, R. Micro-Raman Spectroscopy of Carbonized Semifusinite and Fusinite. Int. J. Coal Geol. 2011, 87, 253–267. [Google Scholar] [CrossRef] [Scilit]
- Guedes, A.; Valentim, B.; Prieto, A.C.; Rodrigues, S.; Noronha, F. Micro-Raman Spectroscopy of Collotelinite, Fusinite and Macrinite. Int. J. Coal Geol. 2010, 83, 415–422. [Google Scholar] [CrossRef] [Scilit]
- Shi, Q.; Mi, Y.; Wang, S.; Cai, Y.; Ji, R.; Xue, W.; Li, X.; Han, B. Pyrolysis Behavior of Tar-Rich Coal with Various Coal-Forming Environments: A TGA and In-Situ Transmission FTIR Study. Fuel 2024, 358, 130250. [Google Scholar] [CrossRef] [Scilit]
- He, X.; Liu, X.; Nie, B.; Song, D. FTIR and Raman Spectroscopy Characterization of Functional Groups in Various Rank Coals. Fuel 2017, 206, 555–563. [Google Scholar] [CrossRef] [Scilit]
- Zhou, H.; Wu, C.; Pan, J.; Wang, Z.; Niu, Q.; Du, M. Research on Molecular Structure Characteristics of Vitrinite and Inertinite from Bituminous Coal with FTIR, Micro-Raman, and XRD Spectroscopy. Energy Fuels 2021, 35, 1322–1335. [Google Scholar] [CrossRef] [Scilit]
- Fu, H.; Tang, D.; Xu, H.; Xu, T.; Chen, B.; Hu, P.; Yin, Z.; Wu, P.; He, G. Geological Characteristics and CBM Exploration Potential Evaluation: A Case Study in the Middle of the Southern Junggar Basin, NW China. J. Nat. Gas Sci. Eng. 2016, 30, 557–570. [Google Scholar] [CrossRef] [Scilit]
- Hu, B.; Yang, X.; Chen, K.; Tang, S.; Li, X.; Zhang, S.; Ding, J.; Zhao, M. Pore Structure and Heterogeneity in Deep Coal Reservoirs: Macrolithotype Controls and Implications for CBM Development. Fractal Fract. 2026, 10, 60. [Google Scholar] [CrossRef] [Scilit]
- Song, D.; Ji, X.; Li, Y.; Zhao, H.; Song, B.; He, K. Heterogeneous Development of Micropores in Medium-High Rank Coal and Its Relationship with Adsorption Capacity. Int. J. Coal Geol. 2020, 226, 103497. [Google Scholar] [CrossRef] [Scilit]
- Fu, X.; Qin, Y.; Zhang, W.; Wei, C.; Zou, R. Fractal Classification and Natural Classification of Coal Pore Structure Based on Migration of Coal Bed Methane. Chin. Sci. Bull. 2005, 50, 66–71. [Google Scholar] [CrossRef] [Scilit]
- Hanlin, L.; Caineng, Z.; Zhen, S.; Vandeginste, V.; Qun, Z.; Yanpeng, C.; Ze, D.; Guangjun, F.; Sijian, Z.; Deke, S.; et al. Structural alignment of PAH in vitrinite-rich anthracite and its impact on methane adsorption. Fuel 2026, 405, 136719. [Google Scholar] [CrossRef] [Scilit]
- Liu, Z.; Cao, D.; Chen, G.; Bi, Z.; Chen, Q. Differences in Molecular Structure between Vitrinite and Inertinite and Their Impact on Coal Conversion and Utilization. ACS Omega 2023, 8, 46450–46465. [Google Scholar] [CrossRef] [Scilit] [PubMed]
- Jingyu, J.; Weihua, Y.; Yuanping, C.; Ke, Z. Molecular structure characterization of middle-high rank coal via XRD, Raman and FTIR spectroscopy: Implications for coalification. Fuel 2019, 239, 559–572. [Google Scholar] [CrossRef] [Scilit]
- Yu, S.; Yan-ming, Z.; Wu, L. Macromolecule simulation and CH4 adsorption mechanism of coal vitrinite. Appl. Surf. Sci. 2017, 396, 291–302. [Google Scholar] [CrossRef] [Scilit]
- Iwata, K.; Yamazaki, S.; Mutombo, P.; Hapala, P.; Ondrá?ek, M.; Jelínek, P.; Sugimoto, Y. Chemical structure imaging of a single molecule by atomic force microscopy at room temperature. Nat. Commun. 2015, 6, 7766. [Google Scholar] [CrossRef] [Scilit] [PubMed]
- Gamson, P.D.; Beamish, B.B.; Johnson, D.P. Coal microstructure and micropermeability and their effects on natural gas recovery. Fuel 1993, 72, 87–99. [Google Scholar] [CrossRef] [Scilit]
- Shi, J.Q.; Durucan, S. Drawdown Induced Changes in Permeability of Coalbeds: A New Interpretation of the Reservoir Response to Primary Recovery. Transp. Porous Media 2004, 56, 1–16. [Google Scholar] [CrossRef] [Scilit]
- Zhu, Y.; Xing, H.; Rudolph, V.; Chen, Z. Quantifying the impact of capillary trapping on coal seam gas recovery. J. Nat. Gas Sci. Eng. 2020, 83, 103588. [Google Scholar] [CrossRef] [Scilit]

Disclaimer/Publisher’s Note: The statements, opinions and data contained in all publications are solely those of the individual author(s) and contributor(s) and not of MDPI and/or the editor(s). MDPI and/or the editor(s) disclaim responsibility for any injury to people or property resulting from any ideas, methods, instructions or products referred to in the content. |
© 2026 by the authors. Licensee MDPI, Basel, Switzerland. This article is an open access article distributed under the terms and conditions of the Creative Commons Attribution (CC BY) license.