


Abstract
Pore systems within different pore size intervals in shale reservoirs exhibit heterogeneity in surface roughness and structure, which can be quantitatively characterized by fractal dimensions. To quantitatively characterize the pore structure characteristics, six Longmaxi shale samples were collected from the southern Sichuan Basin. Mercury intrusion, low-pressure N2 adsorption, and low-pressure CO2 adsorption experiments were conducted to obtain the pore size distributions of macropores, mesopores, and micropores, respectively. Fractal dimensions of micropores (D1), mesopores (D2), and macropores (D3) were calculated using the volume-specific surface area (V-S), Frenkel–Halsey–Hill (FHH), and Menger models, and the controls of total organic carbon (TOC) and clay content on these fractal dimensions were investigated. The results show that surface roughness and structural irregularity decrease in the order of macropores > mesopores > micropores, with D3 (2.89–2.98) > D2 (2.777–2.812) > D1 (2.187–2.304). These differences in fractal dimensions are mainly attributed to the development of small pores within the walls of larger pores, as well as the presence of bubble-like, honeycomb-like, and beaded organic matter pores observed under scanning electron microscopy. Specifically, D1 is predominantly controlled by TOC owing to the extensive development of micropores within organic matter, whereas D2 and D3 are governed by clay content, which hosts abundant intraparticle and interparticle mesopores and macropores. These findings provide a quantitative characterization of the pore structure of the Longmaxi Formation across multiple pore size scales and may serve as a reference for future studies on pore structure characterization of organic-rich shales.
1. Introduction
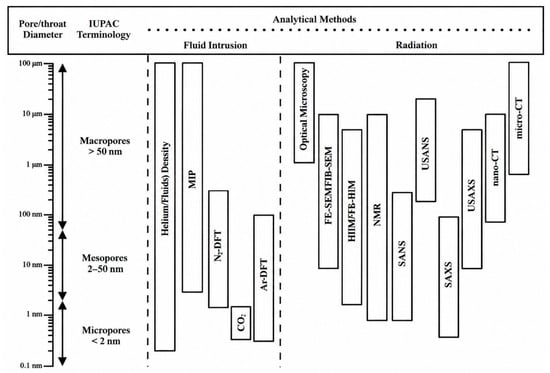
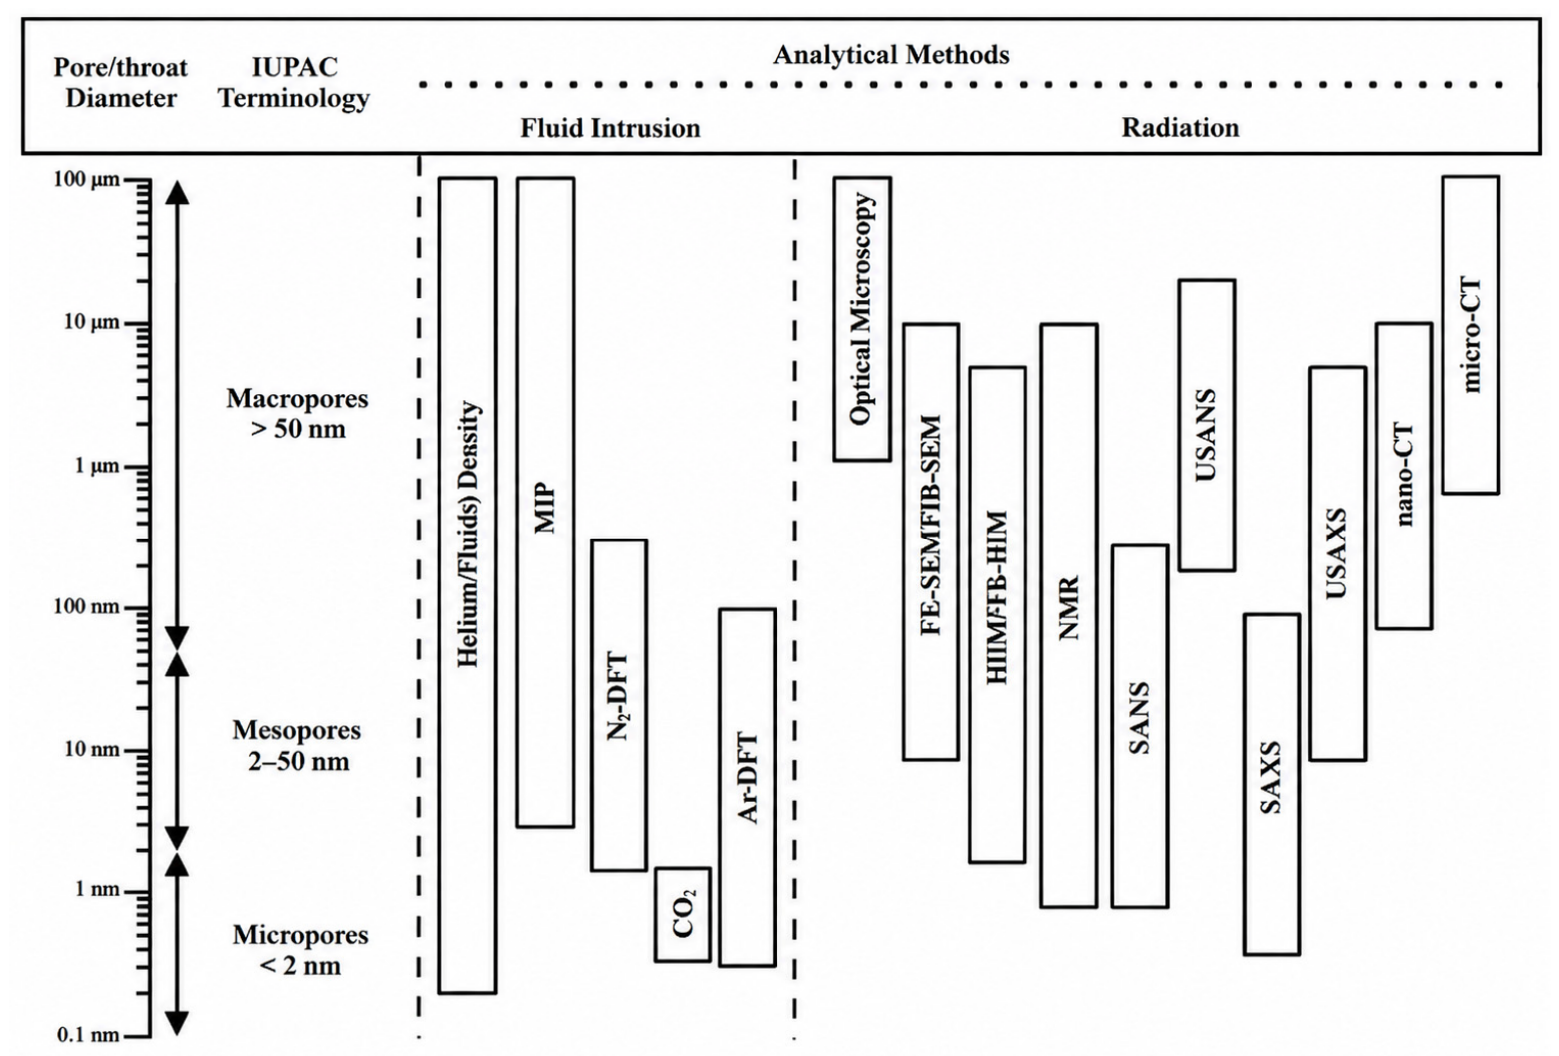
Shale gas represents a vital unconventional energy resource characterized by pronounced compositional and structural heterogeneity [1,2]. Shale gas reservoirs are typically distinguished by low porosity and ultra-low permeability, hosting highly intricate reservoir spaces [3,4]. Consequently, investigating the types, architecture, and complexity of these reservoir spaces is a critical prerequisite for clarifying the mechanisms governing shale gas accumulation, enrichment, seepage, and production [5,6]. Previous studies have demonstrated that fractal dimensions can quantitatively characterize the surface roughness and structural complexity of shale pores from a geometric perspective [7,8]. Typically, these fractal dimensions are derived from various advanced characterization techniques (Figure 1), which comprise two-dimensional/three-dimensional imaging (e.g., optical microscopy, scanning electron microscopy, helium ion microscopy, and atomic force microscopy), fluid intrusion and gas adsorption (e.g., mercury intrusion porosimetry, low-pressure N2 and CO2 adsorption, and nuclear magnetic resonance), and radiation-based methods (e.g., micro- and nano-computed tomography, small-angle neutron scattering, small-angle X-ray scattering, and ultra-small-angle scattering) [9,10].
Figure 1.
Methods used to investigate pore characteristics in shale. Reproduced with permission from Ref [10].
The fractal dimensions of the Lower Cambrian Niutitang shale were determined using nuclear magnetic resonance [11]. Their findings indicated that the surface complexity and roughness of adsorption pores were primarily governed by feldspar content owing to diagenetic chemical reactions, whereas those of seepage pores were predominantly controlled by clay and quartz contents. Similarly, pore fractal dimensions extracted from scanning electron microscopy images of the Bakken shale demonstrated that heightened pore complexity typically correlates with elevated clay content [12]. Regarding specific mathematical frameworks, the Menger model has been widely adopted to derive fractal dimensions from mercury intrusion porosimetry data, yielding exceptional fitting accuracy, particularly for macropores [13,14]. Meanwhile, the FHH model has been extensively validated for characterizations based on low-pressure N2 adsorption, exhibiting an excellent goodness of fit [15,16]. Additionally, the V-S model was introduced to capture the fractal characteristics of micropores and has demonstrated robust applicability [17,18]. Although scholars have conducted extensive and substantive research on quantifying shale reservoir space complexity, significant variations persist across different unconventional plays due to pronounced compositional and structural heterogeneities. Furthermore, the factors controlling this structural complexity remain multifaceted, as the individual impacts of TOC and mineral composition vary widely. However, most previous studies on Longmaxi shales have focused either on limited pore size ranges in specific areas or on individual fractal dimensions without systematic cross-scale comparison. As a result, the scale-dependent relationships among fractal dimensions of micropores, mesopores, and macropores, as well as the differential controls of geochemical and mineralogical compositions on pore complexity across scales, remain insufficiently constrained.
Therefore, the full-scale pore structure of the Longmaxi shale was quantitatively investigated by integrating mercury intrusion porosimetry with low-pressure N2 and CO2 adsorption experiments in this work. Subsequently, the V-S, FHH, and Menger models were employed to determine the fractal dimensions of micropores, mesopores, and macropores, respectively. Additionally, the TOC and clay contents of the shale samples were quantified to unravel their distinct influences on cross-scale reservoir heterogeneity. The findings provide a systematic case study of multi-scale fractal characteristics in the Longmaxi shale and contribute to a better understanding of the scale-dependent controls on pore structure in shale gas reservoirs.
2. Experiments and Methods
2.1. Sample and Experiments
2.1.1. Sample Preparation
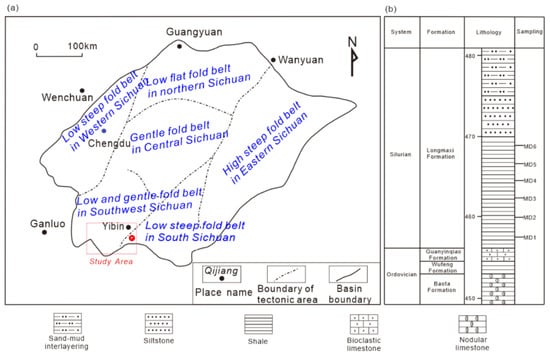
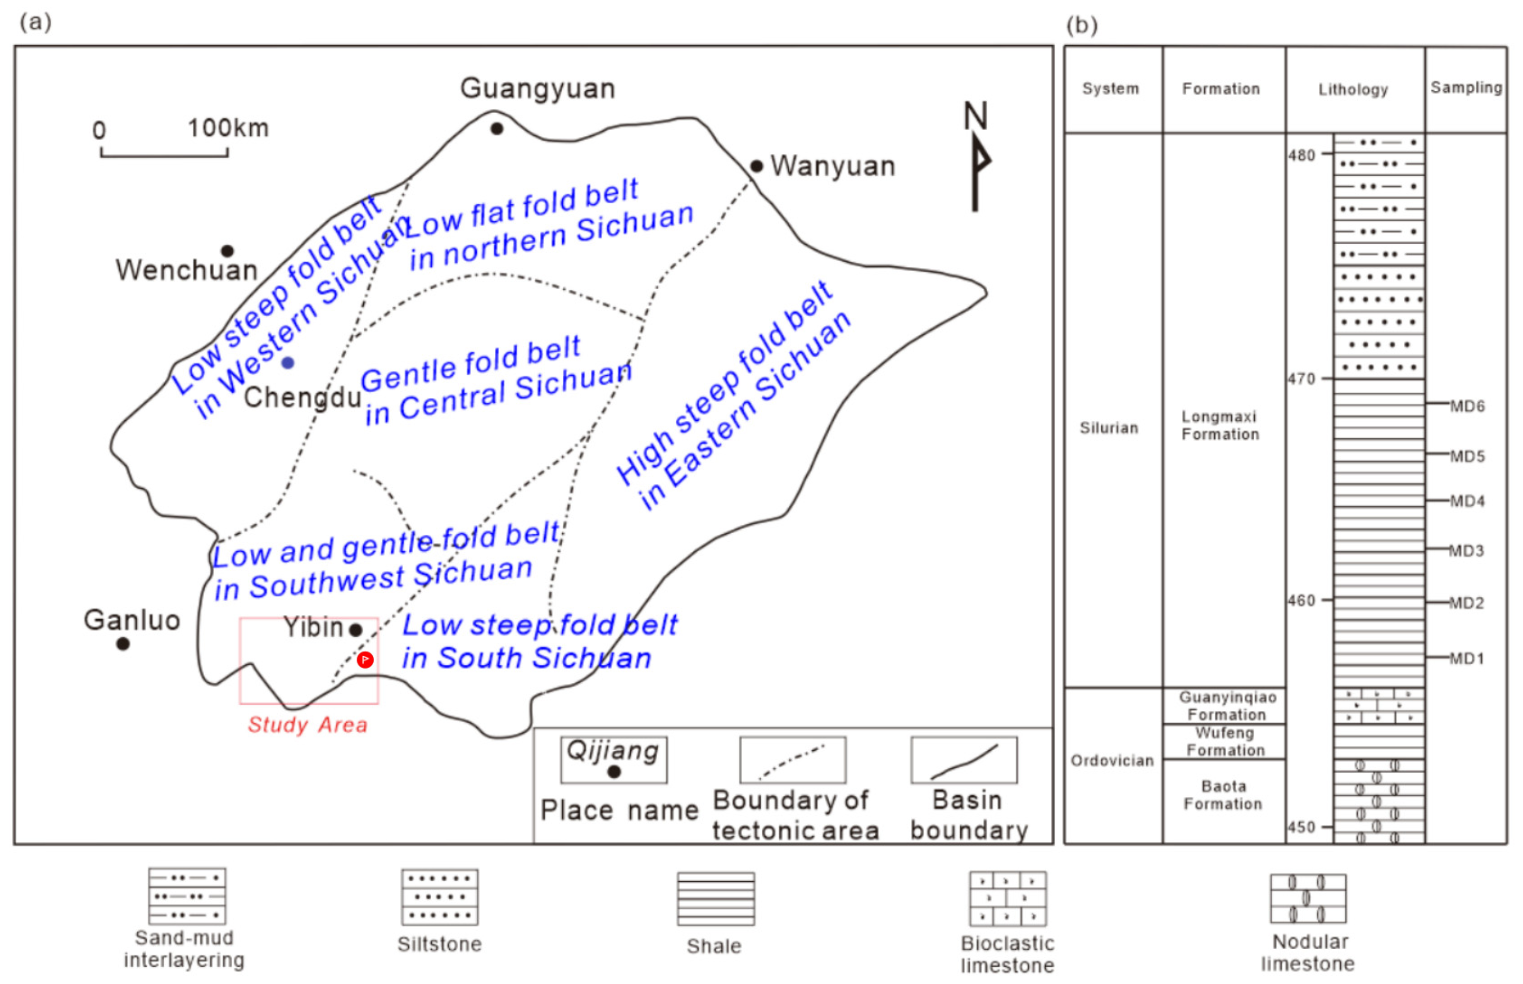
Six shale samples (MD1–MD6) were collected from the Lower Silurian Longmaxi Formation in the Changning area, southern Sichuan Basin (Figure 2). Each sample was split into subsamples and ground to different grain sizes according to the requirements of the individual analytical procedures described below.
Figure 2.
Study area location map (a) and stratigraphic column (b). (The red markers in the figure indicate the sampling points.)
2.1.2. TOC and XRD Mineralogical Analyses
Total organic carbon (TOC) content was determined on 5 g subsamples ground to 100–200 mesh using a CS-230 carbon and sulfur analyzer (LECO Corporation, 3000 Lakeview Avenue, St. Joseph, MI, USA), with a replicate precision of ±0.05 wt%.
XRD analysis was performed on 1 g subsamples ground to less than 200 mesh using a D8 Advance diffractometer (Bruker AXS LLC, 5465 East Cheryl Parkway, Madison, WI, USA) under the following conditions: Cu Kα radiation, 40 kV, 40 mA, 2θ = 3–70°, at room temperature. Semi-quantitative mineral contents were derived using Jade 6.5 software, with errors within ±5%; all samples were analyzed in duplicate.
2.1.3. Mercury Intrusion Porosimetry (MIP)
Shale cubes of approximately 1 cm3 were vacuum-dried at 60 °C for 24 h, and mercury intrusion was performed on a PoreMaster-60 porosimeter (Quantachrome Instruments, 1900 Corporate Drive, Boynton Beach, FL, USA) with a maximum pressure of 414 MPa, covering 3 nm–1000 μm. Measurements were made at 25 °C with an equilibration time of 10 s and a contact angle of 140°. According to the IUPAC classification (macropores > 50 nm, mesopores 2–50 nm, micropores < 2 nm), only the macropore results (>50 nm) were adopted, corresponding to the optimal resolution of MIP. Pore volume errors were less than ±3%.
2.1.4. Low-Pressure N2 Adsorption
For adsorption experiments, 10 g subsamples were ground to 40–60 mesh and vacuum-degassed at 80 °C for 12 h. Measurements were conducted on a Quadrasorb SI analyzer (Quantachrome, USA). N2 adsorption was performed at 77.35 K over P/P0 = 0.005–0.995 with 60 s equilibration. The mesopore (2–50 nm) size distribution was derived from N2 data, and the specific surface area was calculated by the multi-point BET method (R2 > 0.999). Replicate errors were <±5% for surface area and <±3% for pore volume.
2.1.5. Low-Pressure CO2 Adsorption
CO2 adsorption was measured at 273.15 K over P/P0 = 0.0001–0.03 with 45 s equilibration. The micropore size distribution was obtained by combining both datasets: 1.5–2 nm micropores from N2 adsorption, and micropores < 1.5 nm from CO2 data using the NLDFT model. Pore volume errors were less than ±4%.
2.1.6. Data Processing
Full-scale pore structure characteristics of the shale samples were obtained by integrating the results of mercury intrusion porosimetry, low-pressure N2 adsorption, and low-pressure CO2 adsorption experiments. At the overlap of adjacent methods, the results from the technique within its optimal resolution range were preferentially selected, thereby constructing a continuous full-scale pore size distribution for subsequent fractal analysis.
2.2. Fractal Models
(1) V-S Model
The V-S model (Equation (1)) was proposed by Mandelbrot and Wheeler (1983) to quantitatively characterize the pore structure complexity of the porous solid. Based on the relationship between pore volume and surface area, the fractal dimension was calculated from the slope of the linear fitting of lnV1 versus lnS. Shale is a porous sedimentary medium and is conformed to the application principle of the V-S model, this model has been applied to the fractal dimension calculation of the shale micropore structure, and exhibited excellent goodness of fit [17,18]. Nevertheless, the V-S model is not available for calculating the fractal dimension of mesopores and macropores in shale gas reservoirs.
D1 is the fractal dimension of micropores, dimensionless; V1 is the total micropore volume with the pore sizes greater than r, cm3/g; S is the total specific surface area with the pore sizes greater than r, m2/g; and k is a fitting constant, dimensionless.
(2) FHH model
The FHH model (Equation (2)) was extensively used to quantitatively characterize the chemical and mathematical features of the heterogeneous surfaces [19]. In the expression, V2 is the volume of adsorbed gas, P/P0 is the relative pressure, and the slope k1 is obtained from the linear fitting of the adsorption isotherm. Also, The FHH model has been proven applicable for calculating the fractal dimension of the pores in porous sediments such as coal and shale, based on the adsorption isotherms of low-pressure N2 adsorption experiments [20,21]. Two-stage characteristics were found in the fitting curves with obviously different slopes. Further, this model performs excellently in the calculation of fractal dimension at the mesopore scale but not for all pores covered by N2 adsorption results [22,23]. Therefore, it is used to calculate the fractal dimension of mesopores in this work.
D2 is the fractal dimension of mesopores, dimensionless; V2 is the incremental pore volume of mesopores, cm3/g; P0 is the saturated vapor pressure of N2 at the experimental temperature, MPa; P is the experimental pressure according to a specific V2, MPa; and k1 is a fitting constant, dimensionless.
(3) Menger model
Menger (1928) proposed a sponge model, which is a fractal calculation curve with a topological dimension of 1. The model describes a cube that is iteratively subdivided, with pores removed at each scale, and the number of pores follows a power law relationship with pore size. In this model, any curve is homeomorphic to a subset of the Menger sponge. It is also suitable for calculating the fractal dimension of the pores in the porous sediments according to the results of mercury intrusion porosimetry experiments [24,25]. Nevertheless, scholars found that it performs best in the calculation of macropore fractal dimension, whereas it is generally not available for micropores and mesopores [13,22]. The simplified calculation process of Menger model is as Equation (3).
D3 is the fractal dimension of macropores, dimensionless; VP is the incremental pore volume of macropores, cm3/g; P is the experimental pressure according to a specific VP, MPa.
3. Results and Discussion
3.1. TOC, Thermal Maturity, and Clay Content of the Shale Samples
The Longmaxi shale in this work is organic-rich (Table 1), with TOC ranging from 1.68% to 3.28% (2.45% on average). This meets the standard of a TOC of over 2% for high-quality shale gas reservoirs [26]. TOC represents the gas generation potential of shale reservoirs and is also a significant contributor to the gas enrichment space. At Ro = 2.48%, indicating an over-mature stage, the high TOC reflects intense hydrocarbon generation. The micro- to nanopores formed during organic matter generation and evolution significantly improved the pore fracture system. Therefore, TOC is generally positively correlated with petrophysical parameters such as porosity and specific surface area, serving as a dual contributor to both gas generation and gas enrichment space. Ro of MD1 is 2.48% (Table 1), which implies the shale gas reservoir is in an over-mature stage. The source rock has experienced multiple hydrocarbon generation peaks in the geological history, and biogas, oil, wet gas, condensate gas, and dry gas were generated sequentially during this process. Also, a large amount of micro- to nanopores were formed along with the hydrocarbon generation process, which greatly enhances the development of the pore fracture system of the gas reservoir, as well as having an impact on the heterogeneity of the reservoir. Clay minerals are also important gas adsorbents in shale gas reservoirs, secondary only to organic matter. The clay content of these samples ranges from 23% to 33%, with an average of 28% (Table 1).
Table 1.
TOC, Ro, clay content, and fractal dimension of the six shale samples.
3.2. The Calculation Results of Fractal Dimension
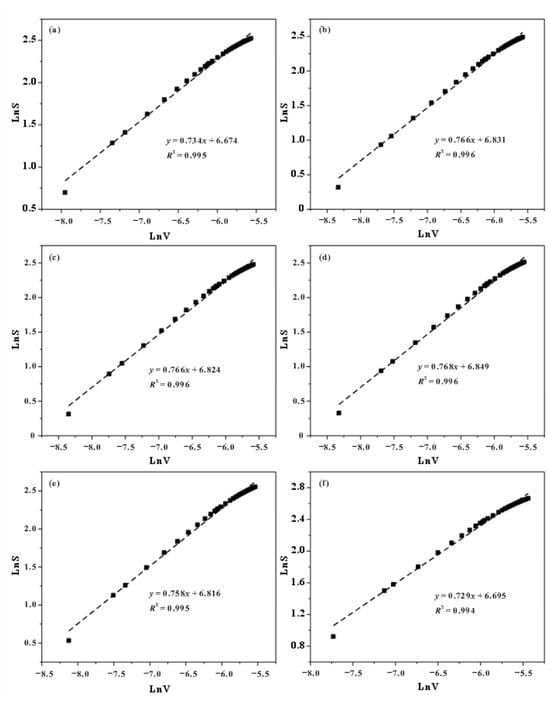
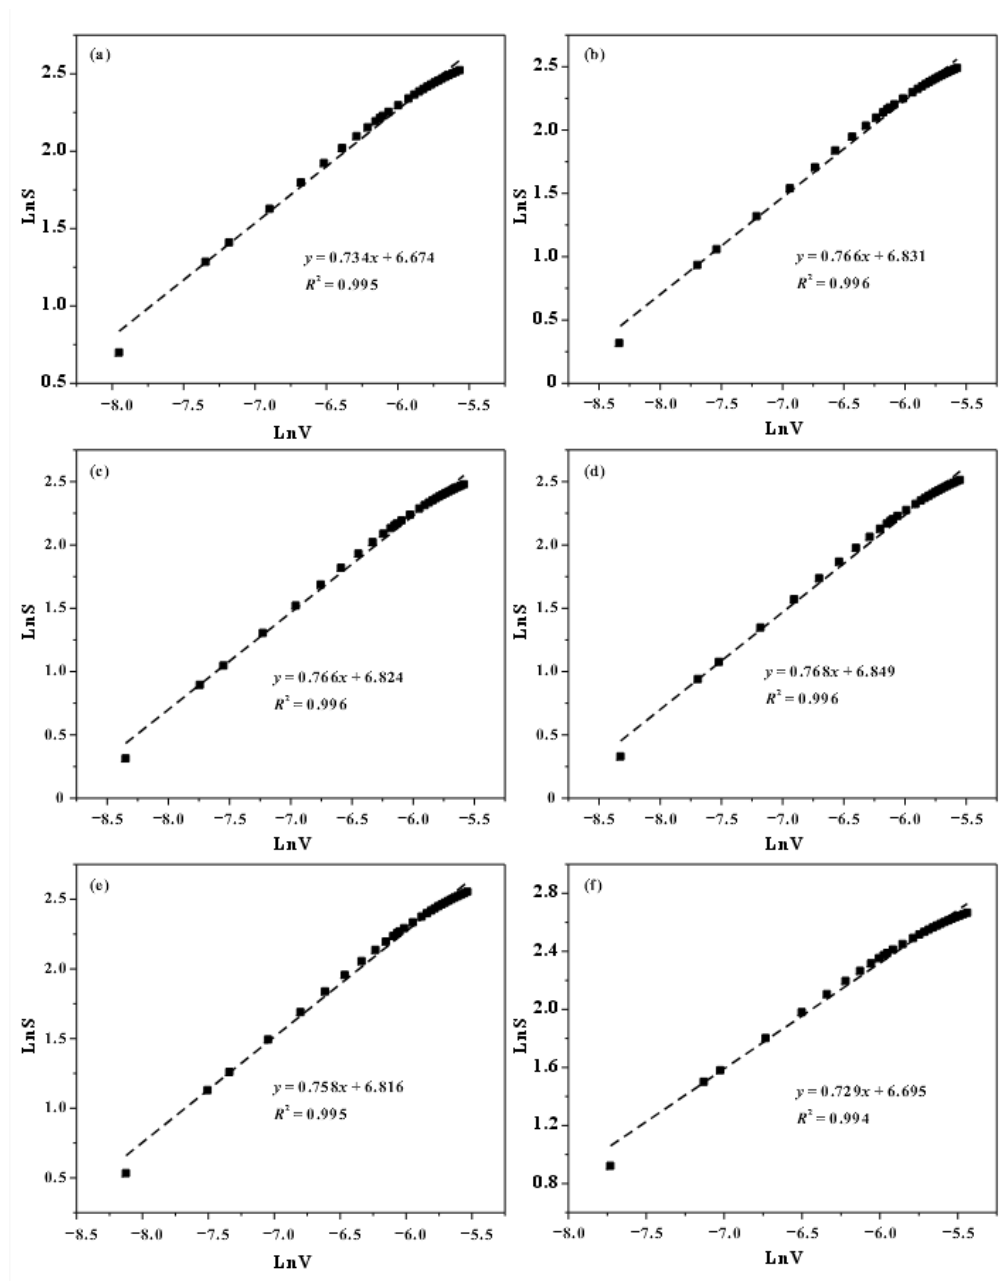
The V-S model performs excellent applicability for the fractal dimension calculating process of micropores (Figure 3). The LnS–LnV plots of all six samples display strong linear relationships, with fitted slopes of 0.729–0.768 and R2 values ranging from 0.994 to 0.996 (0.995 on average), confirming the reliability of the fractal dimension calculation. Moreover, the slopes and intercepts of the fitting lines (6.674–6.849) are highly consistent among samples, indicating that the micropore structures of these shales share similar fractal characteristics and weak heterogeneity. Accordingly, the calculated D1 values range from 2.187 to 2.304, with an average of 2.261 (Table 1 and Figure 3). Given that the theoretical fractal dimension of pores lies between 2 and 3, the D1 values close to the lower limit of 2 suggest that the micropore surfaces of these Longmaxi shale samples are relatively smooth, with low roughness and simple pore structures. The D1 values of twelve Dalong shale samples (A-1 to A-12) were calculated to range from 2.354 to 2.687 [22]. In comparison, the D1 values reported for other shales ranged from 2.23 to 2.62 and from 2.014 to 2.294 [17,18], respectively. D1 from this work falls between the values of above research, which indicates the differences in the pore structure and the strong heterogeneity of shale gas reservoirs.
Figure 3.
The calculation results of micropore fractal dimension based on V-S model. (a–f) are MD1–MD6.
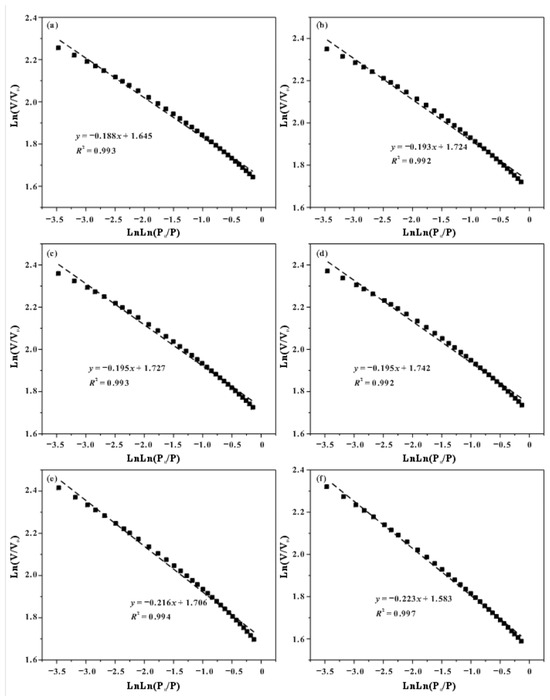
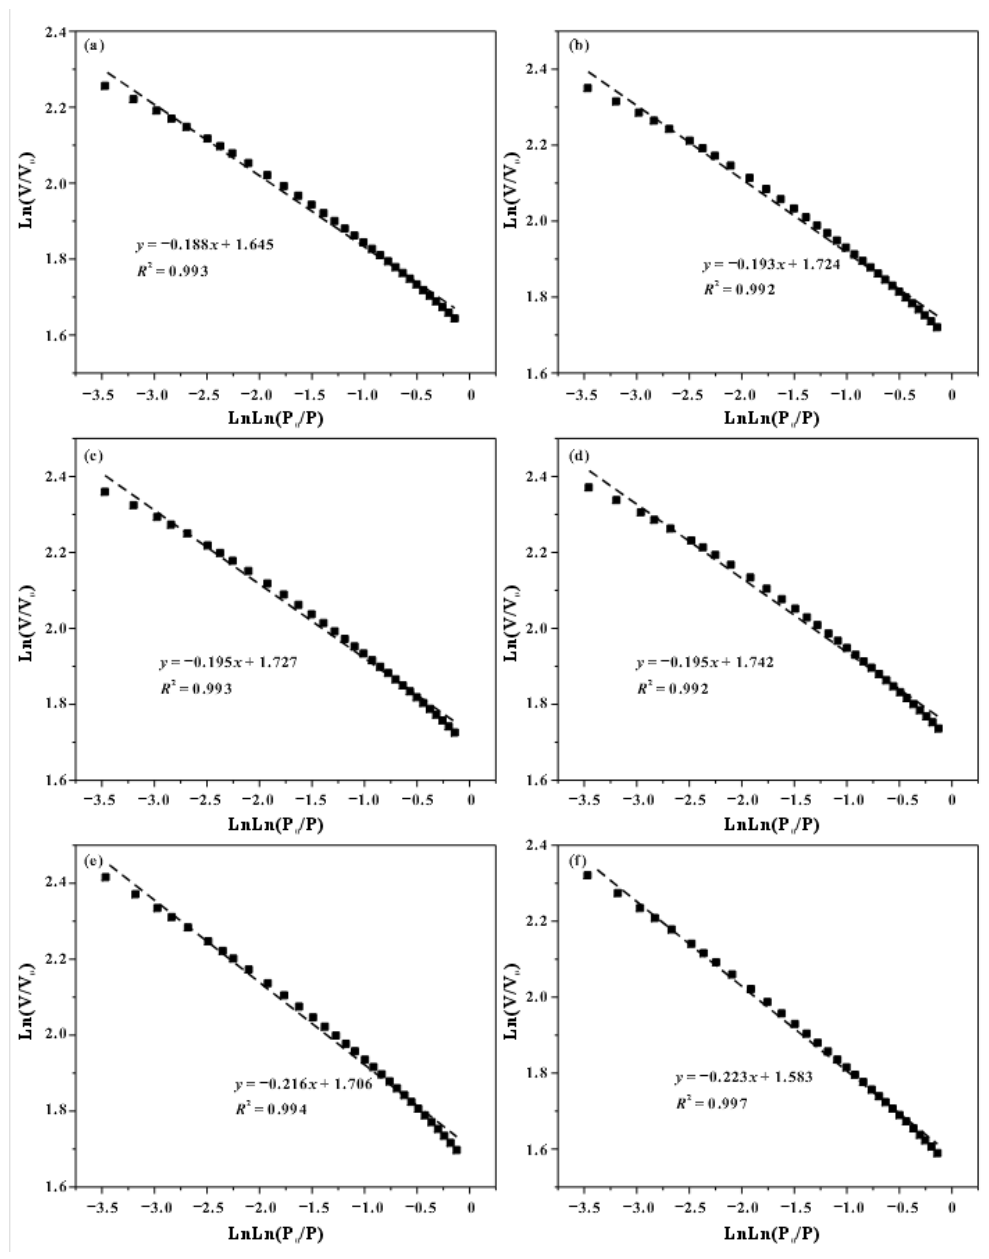
The FHH model also exhibits excellent goodness of fit for the fractal dimension calculating process of mesopores (Figure 4), The LnV–ln(ln(P0/P)) plots of all six samples exhibit strong linear relationships, with fitted slopes ranging from −0.188 to −0.236 and R2 values between 0.992 and 0.997 (0.994 on average), demonstrating the applicability of the FHH model for mesopore fractal characterization. Based on the FHH model, the calculated D2 values range from 2.777 to 2.812, with an average of 2.798 (Table 1 and Figure 4). Notably, the D2 values are markedly larger than the corresponding D1 values, suggesting that the mesopores have more complex structures and rougher surfaces than the micropores, which may be related to the stronger pore-wall heterogeneity and richer geometric diversity of mesopores developed in these Longmaxi shale samples.
Figure 4.
The calculation results of mesopore fractal dimension based on FHH model. (a–f) are MD1–MD6.
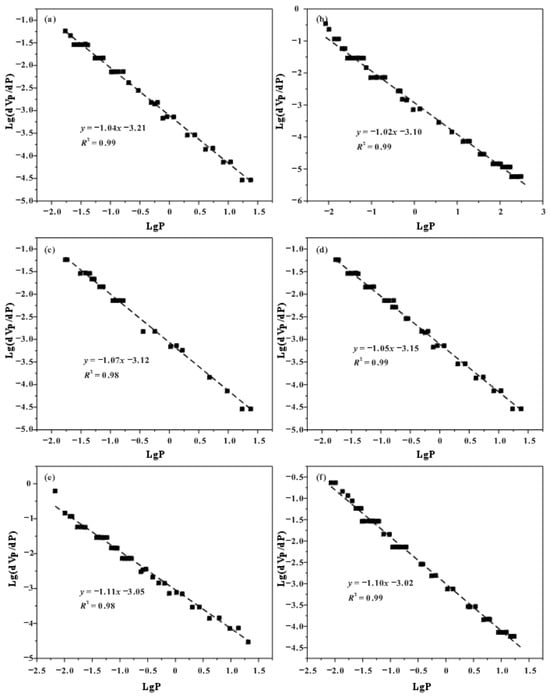
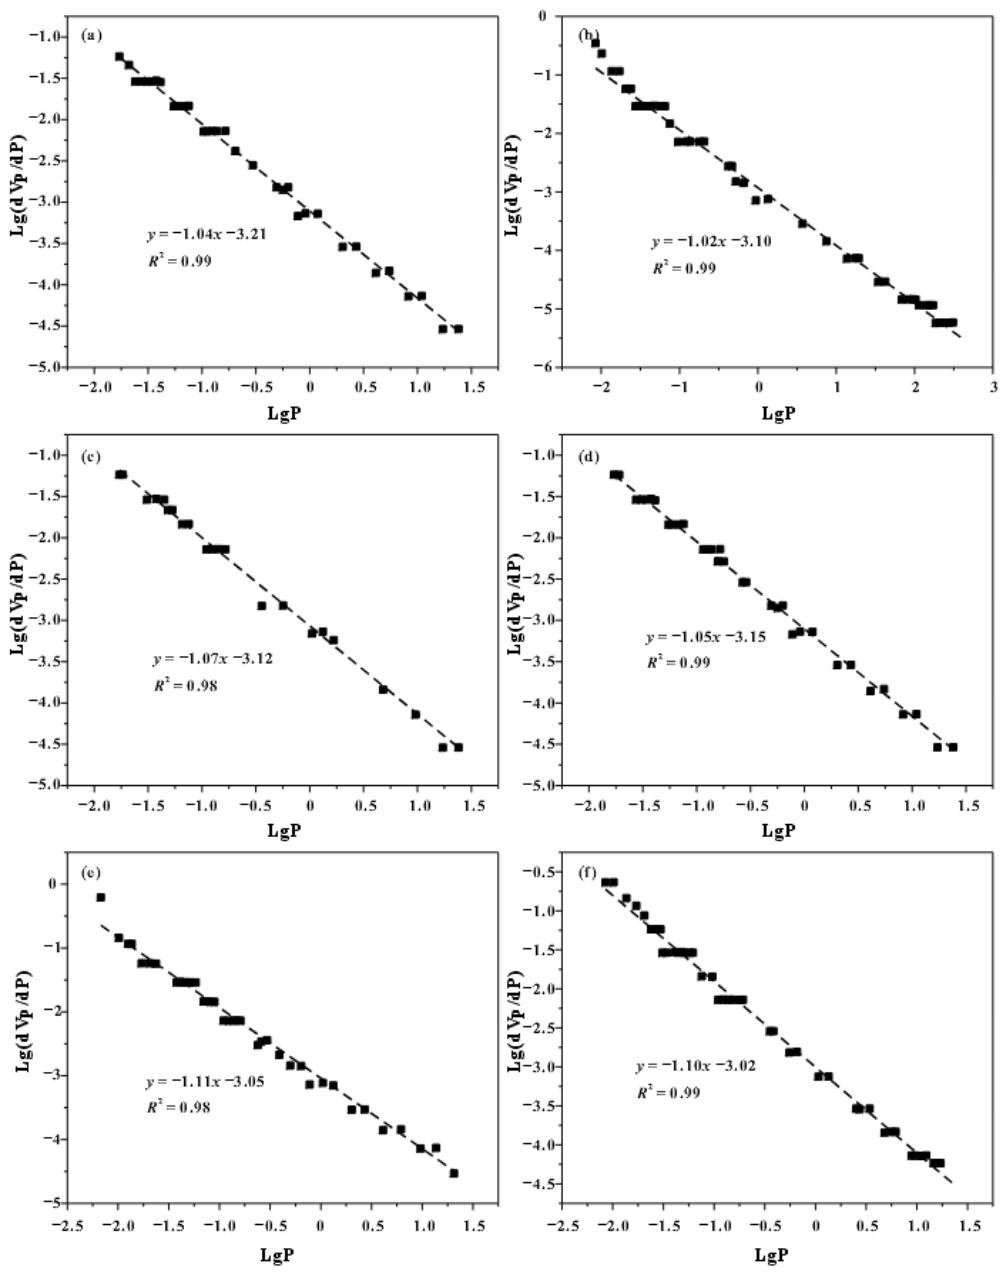
The goodness of fit of the Menger model on the mercury intrusion porosimetry results is also very good, with R2 values ranging from 0.98 to 0.99 (Figure 5). The fitted lines of the six samples display similar slopes (−1.04 to −1.17) and gradually decreasing intercepts (from 3.21 to 3.02), indicating that the macropore fractal characteristics of these samples are comparable while the macropore volumes differ among samples. Based on the Menger model, the calculated D3 values range from 2.89 to 2.98, with an average of 2.94 (Table 1 and Figure 5). Notably, the D3 values approach the theoretical upper limit of 3, indicating that the surfaces of macropores are the roughest among the three pore types and that their pore structures are the most complex. Overall, the fractal dimensions increase with increasing pore size in the sequence of D3 > D2 > D1, suggesting that the pore structure becomes progressively more complicated from micropores to macropores. This variation in fractal dimension among micropores, mesopores, and macropores can be attributed to the differences in their pore structures and formation mechanisms.
Figure 5.
The calculation results of macropore fractal dimension based on the Menger model. (a–f) are MD1–MD6.
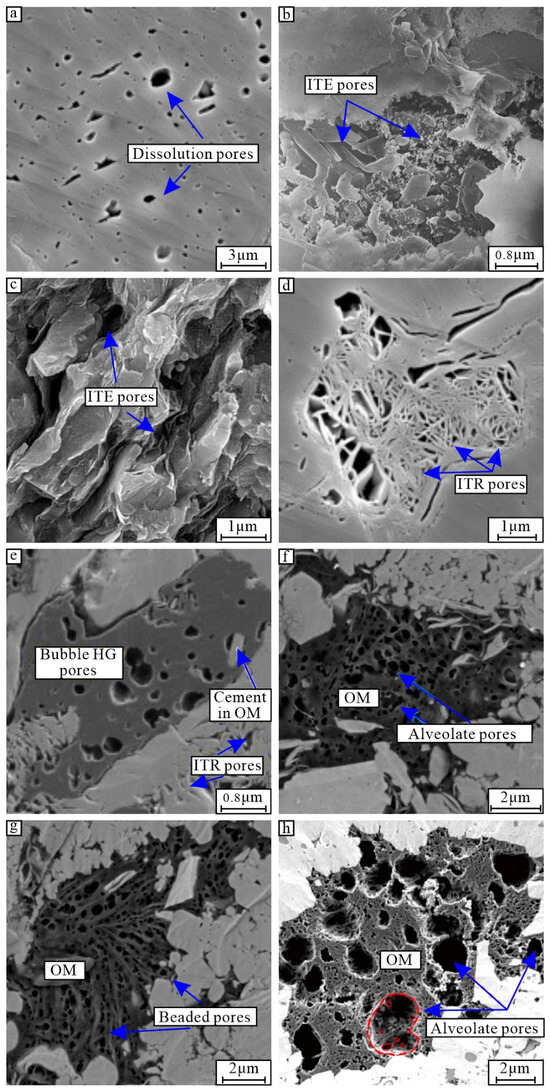
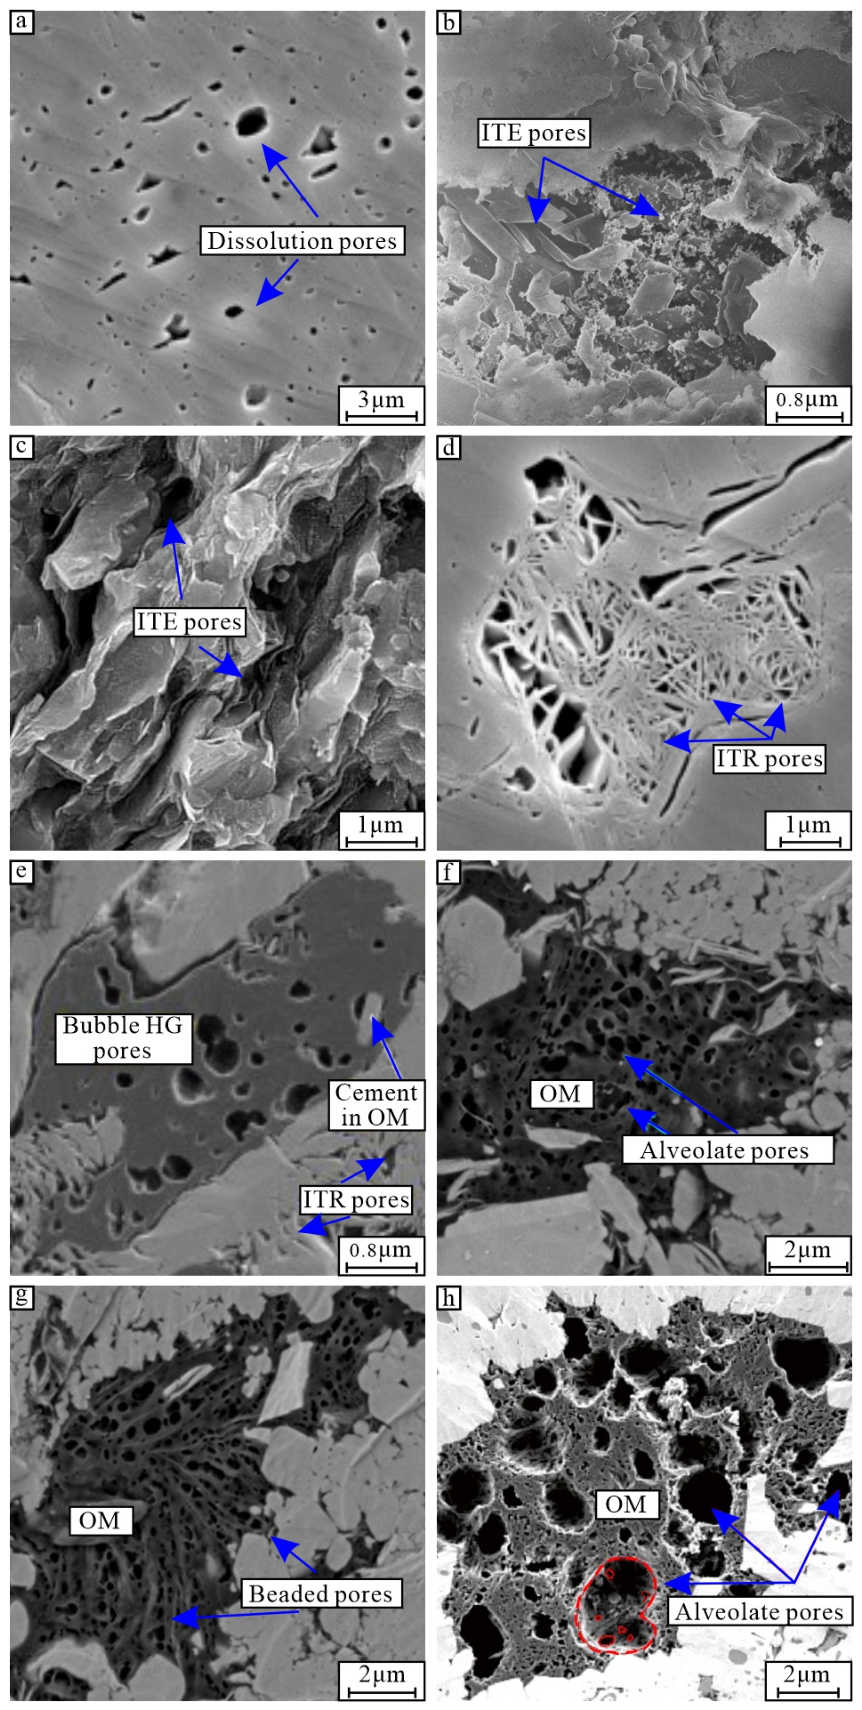
The pores in shale gas reservoirs are divided into organic matter pores, intergranular pores, intragranular pores, and micro-fractures [27]. The latter three types of pores are mainly mineral pores, especially clay mineral pores (Figure 6a–d). A dissolution pore is a kind of intragranular pore (Figure 6a), which is formed during the diagenetic process. The pore morphology is mainly elliptical, including also some narrow and irregular types. The pore structure is relatively simple, the pore surface is smooth, and the pores are developed isolated. The intergranular pores are mostly formed by the stacking of minerals (Figure 6b,c), and their pore morphology is various. The pore structure is more complex than that of dissolution pores, and their pore surface is rougher. Also, some small pores develop in the larger pores, which enhances the complex and roughness of the pore structure and results in the larger fractal dimension of macropores. Furthermore, a large amount of intragranular pores are also developed in clay minerals (Figure 6d,e), and their pore size is clearly smaller than that of intergranular pores. The pore morphology is diverse, the pore structure is complex, and large and small pores are combined developed. Organic matter is generally regarded as the dominator of the commercial shale gas reservoirs, especially the high-mature and over-mature reservoirs. Nano-scale organic matter pores are widely developed in them along with the hydrocarbon generation process in the geological history (Figure 6e–h), and the pore size is obviously smaller than that of intergranular and intragranular pores. Their pore structure is very complex, and the pore surface is rough, which includes bubble-shaped pores, alveolate pores, and beaded pores. The small pores are widely developed in the pore surface large pores in a mosaic structure, and some small pores exhibit interconnectivity during hydrocarbon generation (Figure 6f–h), which significantly enhances the complexity and roughness of the pore structure in shale, especially the nano-scale pores. This is an important reason for the larger D3 than D1 and D2 from the perspective of organic matter.
Figure 6.
Typical mineral pores and organic matter pores in shale gas reservoirs. OM is organic matter, HG is hydrocarbon generation, ITE is intergranular, and ITR is intragranular. (a) dissolution pores of brittle minerals; (b) intergranular pores of clay minerals; (c) intergranular pores of clay minerals; (d) intragranular pores of clay minerals, reproduced with permission from Refs [28,29,30]. (e) bubble-shaped hydrocarbon generation (HG) pores in organic matter; (f) alveolate-shaped organic matter pores; (g) beaded-shaped organic matter pores; (h) mosaic-shaped organic matter pores, reproduced with permission from Refs [31,32,33].
3.3. The Influence of TOC and Clay Content on Fractal Dimension
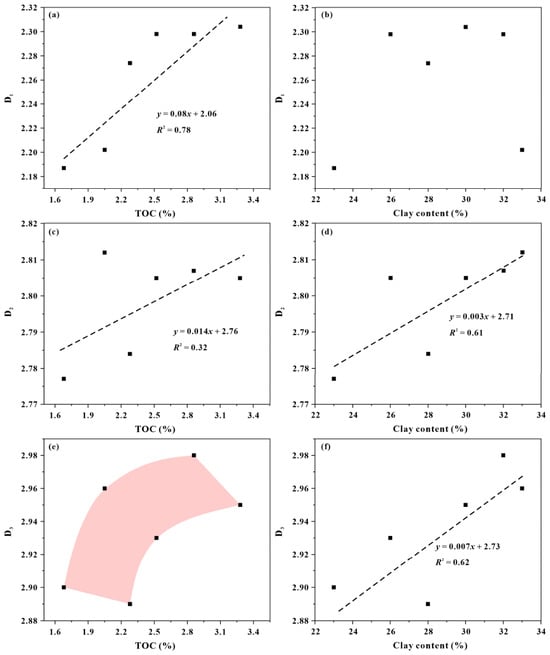
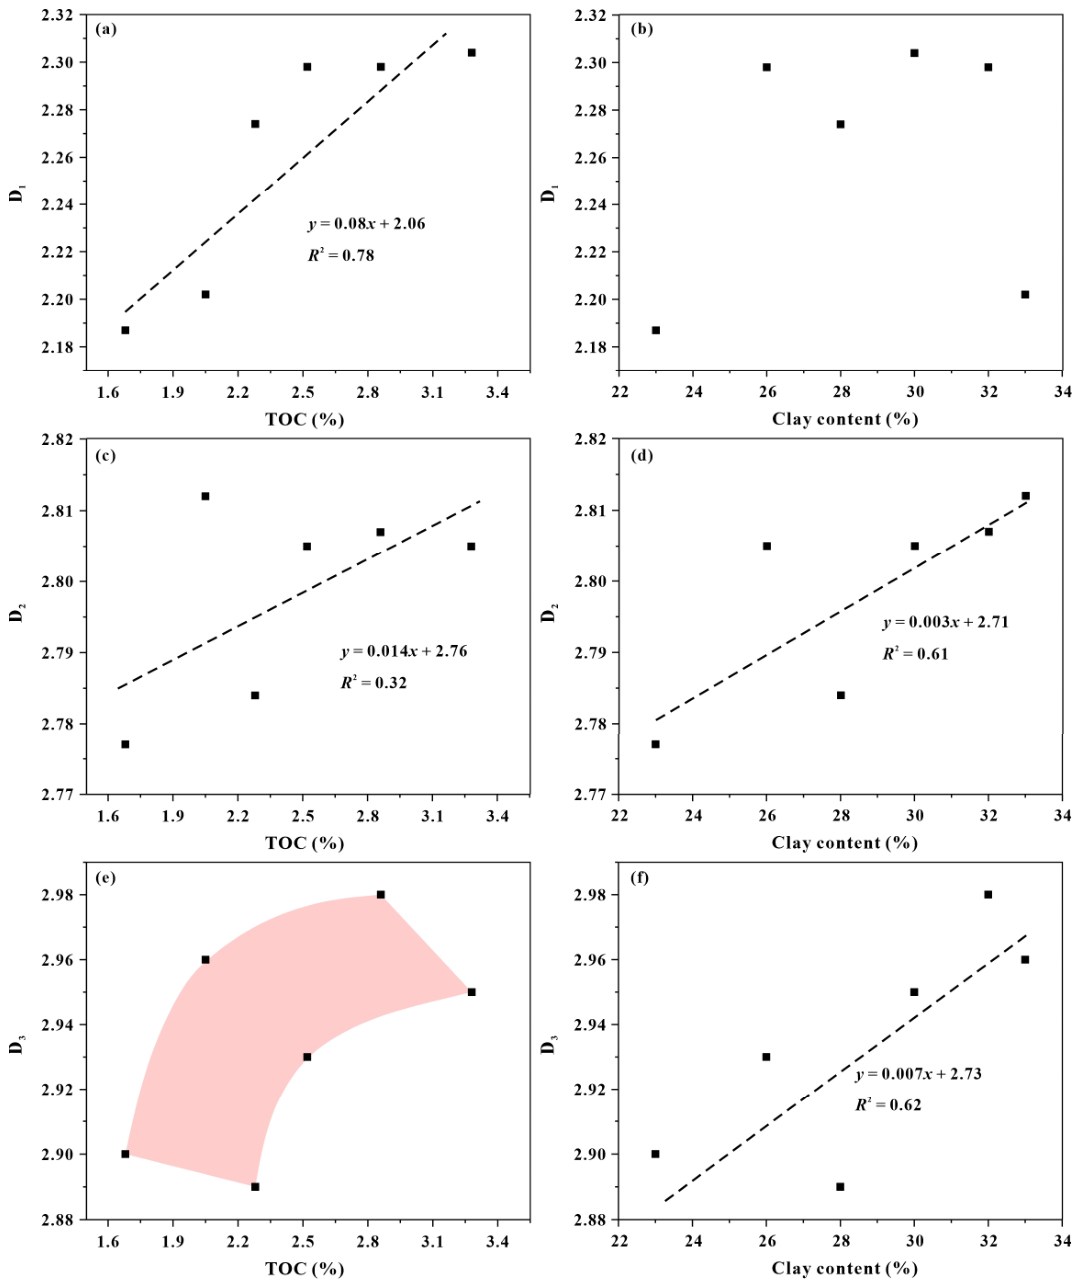
To quantitatively reveal the influence of the two important accumulation carriers of organic matter and clay minerals on the pore structure complexity, the relevance scatter of D1, D2, and D3 versus TOC and clay content were drawn (Figure 7). There is an apparently positive linear correlation between D1 and TOC (Figure 7a), with a R2 value of 0.78. As mentioned above, nano-scale organic matter pores are widely developed (Figure 6e–h). Moreover, these pores are dominated by micropores. Positive linear correlations have been reported between the pore volume and specific surface area of micropores and TOC, suggesting that micropores contribute significantly to the pore structure of the Longmaxi shale [34]. Also, a positive linear correlation of TOC versus D2 was recorded (Figure 7c), but the regression coefficient is lower than that of D1 (R2 = 0.32). Moreover, mesopores are also developed in organic matter, which serves as a significant contributor to the shale pore structure [35]. The amount of macropores in organic matter is lower than that of micropores and mesopores in the Longmaxi shale [36]; therefore, the relevance of D3 and TOC is weak and no obvious correlation was observed (Figure 7e). Some scholars tested the pore size distribution of clay minerals and found that the pores developed in the range mostly from 3 to 200 nm [37]; hence, the fractal dimension of mesopores and macropores exhibits positively linear correlation versus clay content (Figure 7d,f), with R2 values of 0.61 and 0.62. Also, plenty of nano to micron intragranular and intergranular pores are developed in and at the edge of clay minerals (Figure 6b–d). However, the micropores are poorly developed in clay minerals, resulting in a cluttered scatter of D1 versus clay content. Overall, the pore structure complexity of the Longmaxi shale gas reservoir is controlled by the two main accumulation carriers of organic matter (micropores and mesopores) and clay minerals (mesopores and macropores).
Figure 7.
The correlation of D1, D2, and D3 versus TOC (a,c,e) and clay content (b,d,f) in shale gas reservoir.
4. Conclusions
(1) D3 (2.94 on average) of these shale samples is the largest, followed by D2 (2.798 on average) and D1 (2.261 on average), indicating that surface roughness and structural irregularity increase with pore size. This phenomenon is caused by the development of micropores on the pore surfaces of larger pores, whether intergranular pores, intragranular pores, or organic matter pores. In addition, bubble-shaped, alveolate-shaped, and beaded organic matter pores are increasingly developed during the hydrocarbon generation process, which further contributes to the irregularity of the pore structure.
(2) Pores in the Longmaxi shale are mainly developed in organic matter and clay minerals; therefore, the fractal dimensions are controlled by these two components. These shale samples are organic-rich and at the over-mature stage; the fractal dimensions of micropores and mesopores increase linearly with increasing TOC, with the former showing a stronger correlation. The clay content of these samples ranges from 23% to 33%, and mesopores and macropores are widely developed in clay minerals. Positive linear correlations of D2 and D3 versus clay content were observed.
(3) In summary, the fractal dimension is an effective indicator of pore structure heterogeneity in over-mature organic-rich shale: organic matter dominates the roughness and irregularity of micropores–mesopores, while clay minerals govern the development of mesopores–macropores. Future work should integrate multi-scale characterization methods and clarify the quantitative relationships between fractal dimensions and gas storage capacity, thereby improving the pore structure characterization of shale reservoirs.
Author Contributions
Scientific literature collection and data analysis, B.J., Z.L., H.W. (Haiguang Wu) and H.W. (Haixue Wang); writing and revision, Y.S., B.J., H.W. (Huijian Wen) and W.X. All authors have read and agreed to the published version of the manuscript.
Funding
The National Natural Science Foundation of China (grant number: 42602181), The Natural Science Foundation of Heilongjiang Province of China (grant number: JJ2025YX0382).
Data Availability Statement
The original contributions presented in this study are included in the articlel. Further inquiries can be directed to the corresponding authors.
Acknowledgments
The authors gratefully acknowledge the supports of the National Natural Science Foundation of China (grant number: 42602181), and the Natural Science Foundation of Heilongjiang Province of China (grant number: JJ2025YX0382).
Conflicts of Interest
The authors declare no competing financial interest.
References
- Striolo, A.; Cole, D.R. Understanding shale gas: Recent progress and remaining challenges. Energy Fuels 2017, 31, 10300–10310. [Google Scholar] [CrossRef] [Scilit]
- Liu, B.; Zhang, Y.; Chen, W.; Li, F.; Wen, Y.; Lin, R. Full-Scale Pore Structure Characterization of the Late Permian Dalong Shale in Western Hubei, Southern China. Geofluids 2026, 2026, 4843079. [Google Scholar] [CrossRef] [Scilit]
- Akilu, S.; Padmanabhan, E.; Sun, Z. A review of transport mechanisms and models for unconventional tight shale gas reservoir systems. Int. J. Heat Mass Transf. 2021, 175, 121125. [Google Scholar] [CrossRef] [Scilit]
- Sander, R.; Pan, Z.; Connell, L.D. Laboratory measurement of low permeability unconventional gas reservoir rocks: A review of experimental methods. J. Nat. Gas Sci. Eng. 2017, 37, 248–279. [Google Scholar] [CrossRef] [Scilit]
- Zheng, F.; Zeng, J.; Yang, Z.; Feng, Z. Characteristics of Tight Gas Accumulation and Main Controlling Factors of Differential Enrichment in the Shaximiao Formation, Yanjinggou Area, Southwest of the Western Sichuan Depression. J. Pet. Geol. 2025, 48, 163–187. [Google Scholar] [CrossRef] [Scilit]
- Liu, D.; Zhao, Z.; Cai, Y.; Xu, S.; Qiu, F.; Sun, F. Review on deep coal measure gas accumulation and its geological effects of efficient coproduction. Energy Fuels 2025, 39, 14437–14454. [Google Scholar] [CrossRef] [Scilit]
- Sakhaee-Pour, A.; Li, W. Fractal dimensions of shale. J. Nat. Gas Sci. Eng. 2016, 30, 578–582. [Google Scholar] [CrossRef] [Scilit]
- Mishra, S.; Mendhe, V.A.; Varma, A.K.; Kamble, A.D.; Sharma, S.; Bannerjee, M.; Kalpana, M. Influence of organic and inorganic content on fractal dimensions of Barakar and Barren Measures shale gas reservoirs of Raniganj basin, India. J. Nat. Gas Sci. Eng. 2018, 49, 393–409. [Google Scholar] [CrossRef] [Scilit]
- Xie, W.; Liu, Y.; Fu, X.; Wang, H.; Gan, H.; Wang, H.; Vandeginste, V.; Wang, J.; Jiang, F. Three-dimensional model reconstruction of intact shale gas reservoir based on the composition, structure, and content of different components. J. Earth Sci. 2026, 37, 2177–2194. [Google Scholar] [CrossRef] [Scilit]
- Sun, M.; Zhao, J.; Pan, Z.; Hu, Q.; Yu, B.; Tan, Y.; Sun, L.; Bai, L.; Wu, C.; Blach, T.P.; et al. Pore characterization of shales: A review of small angle scattering technique. J. Nat. Gas Sci. Eng. 2020, 78, 103294. [Google Scholar] [CrossRef] [Scilit]
- Sun, W.; Zuo, Y.; Wu, Z.; Liu, H.; Xi, S.; Shui, Y.; Wang, J.; Liu, R.; Lin, J. Fractal analysis of pores and the pore structure of the Lower Cambrian Niutitang shale in northern Guizhou province: Investigations using NMR, SEM and image analyses. Mar. Pet. Geol. 2019, 99, 416–428. [Google Scholar] [CrossRef] [Scilit]
- Liu, K.; Ostadhassan, M. Multi-scale fractal analysis of pores in shale rocks. J. Appl. Geophys. 2017, 140, 1–10. [Google Scholar] [CrossRef] [Scilit]
- Liu, S.; Xue, H.; Zhao, M. Pore Structure and Fractal Characteristics of Coal Measure Shale in the Wuxiang Block in the Qinshui Basin. Processes 2023, 11, 3362. [Google Scholar] [CrossRef] [Scilit]
- Frischer, R.; Singh, M.P.; Porcaro, C.; Namazi, H. Fractal theory: A comprehensive review of applications across engineering disciplines. Fractals 2025, 33, 2530008. [Google Scholar] [CrossRef] [Scilit]
- Liu, K.; Ostadhassan, M.; Jang, H.W.; Zakharova, N.V.; Shokouhimehr, M. Comparison of fractal dimensions from nitrogen adsorption data in shale via different models. RSC Adv. 2021, 11, 2298–2306. [Google Scholar] [CrossRef] [Scilit] [PubMed]
- He, H.; Liu, P.; Xu, L.; Hao, S.; Qiu, X.; Shan, C.; Zhou, Y. Pore structure representations based on nitrogen adsorption experiments and an FHH fractal model: Case study of the block Z shales in the Ordos Basin, China. J. Pet. Sci. Eng. 2021, 203, 108661. [Google Scholar] [CrossRef] [Scilit]
- Wang, X.; Zhu, Y.; Wang, Y. Fractal characteristics of micro-and mesopores in the Longmaxi Shale. Energies 2020, 13, 1349. [Google Scholar] [CrossRef] [Scilit]
- Xie, W.; Wang, M.; Wang, X.; Wang, Y.-D.; Hu, C.-Q. Nano-pore structure and fractal characteristics of shale gas reservoirs: A case study of Longmaxi Formation in southeastern Chongqing, China. J. Nanosci. Nanotechnol. 2021, 21, 343–353. [Google Scholar] [CrossRef] [Scilit] [PubMed]
- Pfeifer, P.; Avnir, D. Chemistry in noninteger dimensions between two and three. I. Fractal theory of heterogeneous surfaces. J. Chem. Phys. 1983, 79, 3558–3565. [Google Scholar] [CrossRef] [Scilit]
- Zhang, S.; Tang, S.; Tang, D.; Huang, W.; Pan, Z. Determining fractal dimensions of coal pores by FHH model: Problems and effects. J. Nat. Gas Sci. Eng. 2014, 21, 929–939. [Google Scholar] [CrossRef] [Scilit]
- Jiang, F.; Chen, D.; Chen, J.; Li, Q.; Liu, Y.; Shao, X.; Hu, T.; Dai, J. Fractal analysis of shale pore structure of continental gas shale reservoir in the Ordos Basin, NW China. Energy Fuels 2016, 30, 4676–4689. [Google Scholar] [CrossRef] [Scilit]
- He, C.; Zhao, Y.; Yu, L.; Lu, L.; Liu, X.; Pan, A.; Li, C. Pore structure and fractal characteristics of deep shale gas reservoirs in the Permian Dalong Formation, northeastern Sichuan Basin. Pet. Geol. Exp. 2024, 46, 263–277. [Google Scholar]
- Xie, W.; Wang, M.; Wang, H.; Duan, H. Multi-scale fractal characteristics of pores in transitional shale gas reservoir. Nat. Gas Geosci. 2022, 33, 451–460. [Google Scholar]
- Lu, G.; Wang, J.; Wei, C.; Song, Y.; Yan, G.; Zhang, J.; Chen, G. Pore fractal model applicability and fractal characteristics of seepage and adsorption pores in middle rank tectonic deformed coals from the Huaibei coal field. J. Pet. Sci. Eng. 2018, 171, 808–817. [Google Scholar] [CrossRef] [Scilit]
- Han, X.; Shan, S.; Xu, G.; Han, Y.; Guo, Y.; Yang, B.; Zhang, J.; Yao, P.; Chu, X.; Zhang, P. Single-and Multifractal Dimension Variation of the Pore-Fracture System in Tight Sandstone by Using High-Pressure Mercury Intrusive Tests and Its Influence on Porosity–Permeability Variation. Energy Fuels 2023, 37, 11969–11981. [Google Scholar] [CrossRef] [Scilit]
- Xie, W.; Chen, S.; Gan, H.; Wang, H.; Wang, M.; Vandeginste, V. Preservation conditions and potential evaluation of the Longmaxi shale gas reservoir in the Changning area, southern Sichuan Basin. Geosci. Lett. 2023, 10, 36. [Google Scholar] [CrossRef] [Scilit]
- Loucks, R.G.; Reed, R.M.; Ruppel, S.C.; Jarvie, D.M. Morphology, genesis, and distribution of nanometer-scale pores in siliceous mudstones of the Mississippian Barnett Shale. J. Sediment. Res. 2009, 79, 848–861. [Google Scholar] [CrossRef] [Scilit]
- Zhang, S.; Liu, H.; Wang, M.; Liu, X.; Liu, H.; Bao, Y.; Wang, W.; Li, R.; Luo, X.; Fang, Z. Shale pore characteristics of Shahejie Formation: Implication for pore evolution of shale oil reservoirs in Dongying sag, north China. Pet. Res. 2019, 4, 113–124. [Google Scholar] [CrossRef] [Scilit]
- King, H.E., Jr.; Eberle, A.P.R.; Walters, C.C.; Kliewer, C.E.; Ertas, D.; Huynh, C. Pore architecture and connectivity in gas shale. Energy Fuels 2015, 29, 1375–1390. [Google Scholar] [CrossRef] [Scilit]
- Yang, Y.; Yao, J.; Wang, C.; Gao, Y.; Zhang, Q.; An, S.; Song, W. New pore space characterization method of shale matrix formation by considering organic and inorganic pores. J. Nat. Gas Sci. Eng. 2015, 27, 496–503. [Google Scholar] [CrossRef] [Scilit]
- Wang, Y.; Liu, L.; Cheng, H. Gas adsorption characterization of pore structure of organic-rich shale: Insights into contribution of organic matter to shale pore network. Nat. Resour. Res. 2021, 30, 2377–2395. [Google Scholar] [CrossRef] [Scilit]
- Ji, W.; Song, Y.; Rui, Z.; Meng, M.; Huang, H. Pore characterization of isolated organic matter from high matured gas shale reservoir. Int. J. Coal Geol. 2017, 174, 31–40. [Google Scholar] [CrossRef] [Scilit]
- Zhang, Y.; Yu, B.; Pan, Z.; Hou, C.; Zuo, Q.; Sun, M. Effect of thermal maturity on shale pore structure: A combined study using extracted organic matter and bulk shale from Sichuan Basin, China. J. Nat. Gas Sci. Eng. 2020, 74, 103089. [Google Scholar] [CrossRef] [Scilit]
- Zhang, Y.; Shao, D.; Yan, J.; Jia, X.; Li, Y.; Yu, P.; Zhang, T. The pore size distribution and its relationship with shale gas capacity in organic-rich mudstone of Wufeng-Longmaxi Formations, Sichuan Basin, China. J. Nat. Gas Geosci. 2016, 1, 213–220. [Google Scholar] [CrossRef] [Scilit]
- Yuan, Y.; Rezaee, R.; Al-Khdheeawi, E.A.; Hu, S.-Y.; Verrall, M.; Zou, J.; Liu, K. Impact of composition on pore structure properties in shale: Implications for micro-/mesopore volume and surface area prediction. Energy Fuels 2019, 33, 9619–9628. [Google Scholar] [CrossRef] [Scilit]
- Wang, Y.; Liu, L.; Zheng, S.; Luo, Z.; Sheng, Y.; Wang, X. Full-scale pore structure and its controlling factors of the Wufeng-Longmaxi shale, southern Sichuan Basin, China: Implications for pore evolution of highly overmature marine shale. J. Nat. Gas Sci. Eng. 2019, 67, 134–146. [Google Scholar] [CrossRef] [Scilit]
- Feng, D.; Li, X.; Wang, X.; Li, J.; Sun, F.; Sun, Z.; Zhang, T.; Li, P.; Chen, Y.; Zhang, X. Water adsorption and its impact on the pore structure characteristics of shale clay. Appl. Clay Sci. 2018, 155, 126–138. [Google Scholar] [CrossRef] [Scilit]

Disclaimer/Publisher’s Note: The statements, opinions and data contained in all publications are solely those of the individual author(s) and contributor(s) and not of MDPI and/or the editor(s). MDPI and/or the editor(s) disclaim responsibility for any injury to people or property resulting from any ideas, methods, instructions or products referred to in the content. |
© 2026 by the authors. Licensee MDPI, Basel, Switzerland. This article is an open access article distributed under the terms and conditions of the Creative Commons Attribution (CC BY) license.