


Abstract
Cross-cultural reasoning and alignment have been identified as key weaknesses of large language models (LLMs), but the architectural or cognitive features underlying these failures have not been adequately examined. In addition, previous studies rely almost exclusively on datasets and benchmarks constructed under the WEIRD (Western, Educated, Industrialized, Rich, and Democratic) bias. To address this data bias issue, we prepare a dataset with substantial coverage of non-WEIRD cultures and five-dimensional (W, E, I, R, and D) annotations. This dataset supports an interpretable approach to examining weaknesses in LLMs’ cross-cultural alignment. We adopt the Chinese–Foreign Cultural Differences Case Repository at Xiamen University, which contains 9342 cases across 151 countries, 6 continents, and 10 cultural domains. These cases are processed and transformed into benchmark-ready structured data through topic normalization, structured metadata cleaning, continent correction, and country-level WEIRD annotation along five dimensions. Each case is converted into a six-option cultural attribution question with five cognitive-trap distractors grounded in cognitive reasoning and pragmatic interpretation. Evaluation of 6 mainstream large language models shows that their dominant failures do not involve explicit stereotypes. Instead, 61% of all errors arise from oversimplifying complex cultural phenomena or applying familiar cultural frames. The proportion of errors that explain specific cultural conflicts through seemingly universal value frames increases from 11% at the low-WEIRD end to 20% at the high-WEIRD end of the dataset. These results suggest that WEIRD data bias reflects both the underrepresentation of low-WEIRD cultures and the overactivation of dominant value frames in high-WEIRD contexts.
1. Introduction
Cross-cultural understanding has become a central challenge for large language models (LLMs) deployed in multilingual and multicultural settings. As users rely on these systems to obtain information and formulate ideas, models need not only cultural knowledge but also the ability to interpret behavioral differences, institutional norms, and communicative expectations in context. Diagnostic benchmarks are therefore needed to turn cross-cultural scenarios into structured evaluation items. Intercultural Communicative Competence (ICC) conceptualizes intercultural competence as a combination of knowledge, skills, and attitudes for appropriate and effective understanding and communication in intercultural situations [1,2]. In this sense, factual knowledge is only the basic layer of cross-cultural competence. A further ability is to explain behaviors, norms, and meanings appropriately when cultural differences arise. We define this ability as cultural attribution reasoning.
Taken together, uneven cultural coverage and limited error diagnosis constitute two connected problems in existing evaluations of cross-cultural understanding. If data coverage is concentrated in a small number of highly visible cultures, evaluation cannot observe error patterns in low-WEIRD contexts. If questions only record whether an answer is right or wrong, errors with different meanings across cultural contexts are compressed into the same score.
This study addresses two questions. First, how can cases from the Chinese–Foreign Cultural Differences Case Repository be transformed into a benchmark-ready evaluation resource that uses Chinese cultural contact experience as an explicit evaluation standpoint while preserving systematic coverage of low-WEIRD national contexts? Second, can an interpretable multiple-choice design not only produce accuracy scores but also differentiate the types of errors models make in cross-cultural understanding? To answer these questions, we use the Chinese–Foreign Cultural Differences Case Repository as source material, normalize its topic and metadata fields, correct inconsistent continent labels, add country-level WEIRD annotations along five dimensions, and convert each scenario into a six-option cultural attribution question. In this way, source coverage, model performance, and error distributions can all be analyzed along cultural gradients.
This study makes three contributions:
- (1)
- It proposes a generalizable diagnostic evaluation framework for cross-cultural understanding, centered on cultural attribution reasoning and cognitive attribution error diagnosis. By using cognitively informative distractors, the framework not only produces accuracy scores but also differentiates the types of errors models make and supports the analysis of model performance and error distributions across cultural contexts.
- (2)
- It instantiates this framework by transforming cases from the Chinese–Foreign Cultural Differences Case Repository into six-option multiple-choice questions. Each question pairs one correct answer derived from the source case analysis with five cognitively informative distractors, turning the original cases into a benchmark for both performance evaluation and error diagnosis. Topic normalization, structured metadata cleaning, continent-label correction, and country-level WEIRD annotation along five dimensions further enable stratified comparison across cultural contexts.
- (3)
- It evaluates six large language models and analyzes their performance and blind spots across cultural domains, geographic regions, WEIRD gradients, and error types. The results show that cross-cultural errors are not a single form of model deficiency but exhibit systematic patterns associated with cultural complexity, uneven data accessibility, and related factors.
2. Related Works
2.1. Cultural Evaluation of Large Language Models
Recent work has produced a growing number of resources and benchmarks for evaluating the cultural understanding of large language models. These studies can be grouped into three broad lines of research: cultural value orientations, cultural knowledge and norms, and contextual cultural reasoning.
The first line evaluates cultural value orientations. These studies use social science instruments such as the World Values Survey (WVS) to compare model outputs with the value distributions of different populations. WorldValuesBench was used to construct a multicultural value-prediction task from WVS responses, and the results showed that models approach human response distributions for only a subset of value questions [3]. AlKhamissi et al. [4] simulated WVS responses in Egypt and the United States (US) and found that the evaluated models aligned more closely with US respondents. They also showed that response language and pretraining-data composition affect cultural alignment. The authors of CDEval extended this approach by evaluating model behavior across six cultural dimensions and seven application domains [5]. These studies reveal broad cultural tendencies but primarily measure population-level statistical alignment rather than how models explain particular cross-cultural situations.
The second and most extensive line evaluates cultural knowledge, norms, and everyday commonsense. These studies convert holidays, food, etiquette, social norms, and daily practices into question-answering, classification, or generation tasks, making model performance comparable across cultures and languages [6,7,8,9]. CulturalBench reported lower average performance in regions such as South America, Eastern Europe, and the Middle East and West Asia [9]. BLEnD showed that the best model can differ by as much as 57.34 percentage points between highly represented cultures such as the US and less represented cultures such as Ethiopia on short-answer questions. For low-resource language cultures, models perform better in English than in the local language [7].
Other studies have shown that cultural knowledge is jointly affected by cultural context, response language, and data source. Shen et al. [10] found substantial cross-cultural differences in cultural commonsense performance and showed that the language used to query a model can change its results. AMAMMER, whose multiple-choice questions were constructed and validated by participants from Ghana and the US, showed that models consistently prefer answers endorsed by US participants [11]. Wang et al. [12] further showed that models prompted in non-English languages may still generate content associated with English culture, indicating English cultural dominance. The developers of CultureBank took a different approach by extracting cultural descriptors and contextualized cultural knowledge from the self-narratives of TikTok and Reddit users [13]. These studies identify which cultures models know better but mainly evaluate the accuracy of cultural knowledge, conformity to local norms, or agreement with particular populations.
The third line focuses on contextual cultural reasoning and adaptation. NormAd was designed to evaluate whether models can judge the social acceptability of situations from 75 countries when provided with abstract values, country information, or explicit cultural norms. Model performance fell substantially when the relevant norms needed to be inferred from abstract values or national context, and remained below human performance even when explicit norms were provided [14]. Other studies have constructed contextual tasks for detecting cross-cultural communication gaps, evaluating culturally appropriate conversations, and assessing intercultural competence [15,16,17].
Edward T. Hall’s cultural iceberg metaphor distinguishes visible cultural artifacts and practices from less visible values, assumptions, norms, and communicative expectations [18]. Existing findings are broadly consistent with this distinction: models continue to struggle when culturally appropriate judgments require them to infer unstated norms and communicative assumptions from context [14,15]. Cultural evaluation has therefore progressed from factual knowledge to norms and contextual reasoning. Nevertheless, most analyses still focus on performance differences across models, tasks, and regions.
2.2. Diagnostic Evaluation of Cross-Cultural Errors
NLP research has long recognized that aggregate accuracy cannot fully characterize model capabilities. CheckList uses capability-specific behavioral tests to show that models with strong standard test-set performance may still exhibit systematic and actionable failures [19]. Contrast Sets determines whether model predictions respond appropriately to small but meaningful changes in test instances, thereby revealing whether models have learned the intended capability or relied on surface regularities [20]. These approaches move evaluation from aggregate scores toward more detailed analyses of model behavior.
Bias evaluation has also adopted partially diagnostic designs. BBQ uses under-informative and adequately informative contexts to distinguish stereotypical responses from errors that persist despite sufficient evidence [21]. KoBBQ shows that a US-centered bias benchmark cannot be transferred to Korean culture through direct translation. Its target groups, bias categories, and scenarios must be culturally adapted and revalidated [22]. These benchmarks identify whether particular errors are associated with ambiguity or social stereotypes, but they primarily concern demographic bias rather than models’ explanations of cross-cultural conflicts.
Recent cultural benchmarks have begun to provide more disaggregated diagnostic information. GaoYao compares model performance across cultural layers, cognitive tasks, languages, and geographic regions, revealing distinct gaps between tasks and regions [23]. Such analyses move beyond a single aggregate score, but their diagnostic results generally remain at the level of tasks, regions, languages, or broad bias measures. They rarely map each incorrect response to a specific cross-cultural attribution path.
Cross-cultural psychology provides a theoretical basis for distinguishing such attribution errors. Morris and Peng [24] showed that American and Chinese participants differ in the extent to which they emphasize individual dispositions or situational factors when explaining social behavior. Choi et al. [25] further demonstrated that causal attribution contains both cross-cultural regularities and systematic cultural variation. Research on cross-cultural pragmatics has similarly shown that communication failures often arise not from misunderstanding literal meaning but from using different norms and contextual assumptions to infer communicative intentions [26]. People may also transfer pragmatic knowledge and interpretive frames from their own culture to another cultural context, producing inappropriate interpretations [27].
Existing works can therefore identify the tasks, languages, and cultures in which models perform poorly and have begun to detect particular biases and reasoning defects. However, systematic and quantifiable diagnosis of cross-cultural attribution errors remains limited. The same incorrect answer may result from failing to recognize a cultural factor, projecting apparently universal values, relying on a shallow stereotype, reducing a complex phenomenon to a single cause, or interpreting an unfamiliar practice through a familiar cultural analogy. These errors reflect different attribution paths and require different explanations and improvement strategies.
2.3. WEIRD Bias and Cultural Coverage
Beyond task type, cultural evaluation exhibits structural imbalances in its data sources and geographic coverage. Pawar et al. [28] showed that existing research has disproportionately focused on WEIRD (Western, Educated, Industrialized, Rich, Democratic) countries, while Africa, Central and South America, Eastern Europe, and Central Asia remain less represented. Cultural evaluation resources also frequently rely on global surveys such as WVS, public platforms such as Wikipedia, English-dominant web text, and existing commonsense question-answering datasets [28].
Recent resources such as NormAd, CulturalBench, and SeeGULL have substantially expanded country and regional coverage. SeeGULL, for example, covers identity groups across 178 countries, eight geopolitical regions, and six continents [29]. However, broader country coverage does not necessarily ensure balanced representation of cultural perspectives. A survey of 105 cultural-alignment benchmarks found that existing resources remain concentrated in particular cultural groups and elements and that the overwhelming majority adopt a majority-focused approach with limited attention to within-culture diversity and minority perspectives [30]. The problem is therefore not a complete absence of non-WEIRD cultures but the continuing imbalance in the representation of cultures, languages, and locally grounded perspectives.
This imbalance is connected to broader inequalities in language resources. Joshi et al. [31] showed that only a small proportion of the world’s more than 7000 languages receive substantial technological support and research attention. Blasi et al. [32] identified systematic inequalities in NLP performance across languages, while Kreutzer et al. [33] found substantial differences in the quality and usability of web-crawled multilingual corpora. Some cultures are therefore underrepresented, not only in evaluation datasets but also in the digital materials from which models acquire cultural knowledge.
This concentration is not unique to LLM evaluation. Henrich et al. [34] showed that behavioral science has long relied disproportionately on samples from WEIRD societies, and Linxen et al. [35] documented the persistence of similar sampling bias in human–computer interaction research. Such underrepresentation affects not only sample size but also how cultural behavior is interpreted and compared.
Bennett’s Developmental Model of Intercultural Sensitivity describes intercultural understanding as a progression from ethnocentric toward ethnorelative orientations [36]. This suggests that cultural behavior must be interpreted within its context and that the same foreign practice may produce different yet plausible misunderstandings when viewed from different cultural backgrounds. Cultural evaluation cannot therefore be entirely separated from the perspective from which cultural behavior is observed.
Chinese and Confucian contexts occupy an important comparative position in recent discussions of WEIRD bias and cultural distance. Through WEIRD–Confucian comparisons, Krys et al. [37] showed that psychological research is disproportionately concentrated on WEIRD and Confucian societies, while many other non-WEIRD societies remain severely underrepresented. Muthukrishna et al. [38] further demonstrated that cultural and psychological distances between WEIRD societies and other populations, including China, can be measured and should not be treated as negligible. Findings based on a limited range of cultural contexts cannot therefore be assumed to represent universal patterns. Cases of cultural contact between China and other countries provide a complementary basis for examining whether model performance and attribution errors vary systematically along WEIRD gradients.
Existing research has evaluated cultural value alignment, cultural knowledge, and contextual reasoning while progressively expanding the coverage of non-Western regions and providing more detailed analyses across tasks, languages, regions, and biases. However, cultural and linguistic representation remains uneven, and existing diagnostic analyses rarely identify the specific attribution errors models make when explaining cross-cultural conflicts. This study transforms source cases into diagnostic multiple-choice questions in which different distractors represent different cultural attribution errors, enabling error-type analysis across cultural domains, geographic regions, and WEIRD gradients.
3. Materials and Methods
3.1. Source Repository and Benchmark Construction
3.1.1. Overview of the Source Repository
The source cases were drawn from the Chinese–Foreign Cultural Differences Case Repository at Xiamen University (case repository website: https://difculcase.xmu.edu.cn/) (accessed on 23 January 2026). The repository contains 9342 cases across six continents and 151 countries, covering 10 categories, including architecture, law, language and writing, daily life, customs, religion, education, economy, and institutions. Each case includes three core text fields: case narrative, analytic commentary, and description of cultural differences. It also provides structured annotations, such as domain, continent, country, topic tags, and information source. These fields provide a large, richly annotated resource for benchmark construction.
Most texts in the repository describe cultural differences encountered by Chinese actors in international communication, educational exchange, everyday interaction, or institutional contact. This source differs from survey data that aggregate individual opinions and from web-extracted cultural texts whose coverage varies greatly across target cultures. It provides a comparatively consistent observational standpoint: foreign cultural practices are selected because they become visible in Chinese–foreign contact and require explanation within that contact experience. This makes the repository suitable as source material for constructing a standpoint-explicit benchmark of cross-cultural attribution reasoning.
3.1.2. Source Preprocessing
Although the raw repository is large, it is not fully standardized. We therefore normalized and corrected the source cases before constructing the benchmark items. Continent labels were originally provided at the case level by contributors. A small number of countries have been assigned to different continents across cases; for example, Cape Verde appears with both African and North American labels, and Kazakhstan appears with both Asian and European labels. These inconsistencies arise from contributor judgments about the geographic affiliations of some transregional countries. We used country names as keys and remapped continent labels according to authoritative geographic affiliations. All subsequent analyses involving continent used the corrected labels. Topic tags were also freely entered by contributors, so synonymous variants dispersed semantically similar cases across many surface forms. We therefore normalized this field before analysis.
Specifically, topic tag normalization proceeded in three steps: we divided compound tags using common delimiters; removed leading and trailing punctuation and filtered out one-character fragments; and merged synonymous tags into unified categories using keyword rules, regular expressions, and exclusion rules. A single tag may be mapped to multiple categories.
The normalized categories were derived mainly from high-frequency patterns in the raw tags, covering topics such as food, etiquette, religion, education, marriage and dating, taboos, values, time orientation, transportation, and festivals. Before normalization, the most frequent raw tag appeared only 177 times. After normalization, food aggregated 775 mentions and etiquette aggregated 704 mentions, producing a clearer topic hierarchy. In total, 30 high-frequency topic categories met the sample-size threshold for later statistical analysis.
3.2. Source Coverage and Benchmark Item Distribution
3.2.1. Geographic Coverage
The source cases were originally classified into six continents: Asia, Europe, North America, South America, Oceania, and Africa. Because the US and Canada differ substantially from Mexico, Central America, the Caribbean, and South America in training-data accessibility and institutional context, we further divided the original Americas into North America and Latin America. North America refers only to the US and Canada, while Latin America includes other countries originally labeled North America and all countries originally labeled South America. Under this coding scheme, Asia (2612), Europe (2222), and Africa (2030) account for most benchmark items, followed by North America (1168) and Latin America (1011), with Oceania (299) being the smallest group. This distribution better reflects the actual pattern of China’s international engagement than an idealized globally uniform sample.
3.2.2. Content Structure
In terms of cultural domains, the source repository covers architecture, law, language and writing, daily life, customs, religion, education, economy, institutions, and other topics. Daily life accounts for the largest share. Customs, education, religion, institutions, language and writing, and law together provide broad coverage of cross-cultural scenarios. The resulting benchmark therefore includes high-frequency everyday interactions while also preserving more specialized cultural issues involving institutional norms, religious practices, legal rules, and linguistic signs (Table 1).
Table 1.
Source repository content structure: cultural domains and high-frequency topic tags.
Cultural domains describe the broad scenario to which a case belongs, while topic tags further specify the issues within each domain. Because a single case may involve multiple cultural factors, one normalized case can correspond to multiple topic tags. For example, a daily-interaction case may involve food, etiquette, and taboos, whereas an institutional or legal case may also involve religion, marriage, or values. This two-level structure of cultural domain and topic tag allows us to compare model performance across broad cultural scenarios and to analyze fine-grained differences in the difficulty of specific cultural issues. Thirty high-frequency topics meet the sample-size threshold for later statistical analysis ().
3.3. Country-Level WEIRD Annotation
Country or continent labels alone indicate where a case comes from, but they do not capture the relative position of a country in terms of cultural representativeness and social structure. We therefore added WEIRD annotations to the 151 countries and supplemented the geographic labels with a set of comparable cultural-gradient variables. WEIRD is a classic framework in behavioral science for describing sample-representation bias and refers to Western, Educated, Industrialized, Rich, and Democratic dimensions [34]. The WEIRD values are not inferred from the Chinese case texts themselves; they are external country-level labels attached to the target countries represented in the benchmark. This design combines a source of cross-cultural scenarios grounded in Chinese cultural contact experience with independently defined country-level variables. In this study, the framework is used to examine whether these variables help explain model performance and error patterns within this standpoint-explicit benchmark design. Together, the five dimensions describe countries’ relative positions in value traditions, rule acquisition, institutional organization, resource constraints, and political rights, all of which may affect cultural understanding.
The WEIRD annotation serves two purposes. It tests whether the benchmark truly covers low-WEIRD countries that are underrepresented in existing cultural evaluations, and it allows us to analyze whether model accuracy and error types vary systematically along the WEIRD gradient.
3.3.1. Operationalizing the Five Dimensions
We operationalized the five dimensions, primarily following the country-level approach to WEIRD annotation developed by Linxen et al. [35], with updates based on the latest available public data. For a small number of countries that lack the latest data in one dimension, we backfilled using the most recent available year to ensure that all 151 countries had values for all five dimensions.
The W (Western) dimension uses Huntington’s civilization classification and assigns countries to two categories: Western and non-Western [39].
The E (Educated) dimension uses mean years of schooling from the United Nations Development Programme (UNDP) Human Development Reports Data Center as a proxy for educational level [40]. Because this indicator has no official universal bins, we computed the tertile thresholds from the global UNDP country sample and mapped the 151 countries to three levels. We also considered the Organisation for Economic Co-operation and Development (OECD) Programme for International Student Assessment (PISA) index as an alternative proxy, but PISA covers only 70 countries in the benchmark coverage and is itself skewed toward WEIRD countries. We therefore did not use it as the main analysis measure.
The I (Industrialized) dimension uses the World Bank indicator gross domestic product (GDP) per capita, purchasing power parity (PPP) (current international $), as a proxy for industrialization [41]. We computed the quartile thresholds from the latest available global country values and mapped the 151 countries to four levels.
The R (Rich) dimension uses the World Bank’s official income groups, which are based on GNI per capita calculated using the Atlas method [42]. These groups correspond to low income, lower-middle income, upper-middle income, and high income. For a very small number of countries not listed separately in the official income group table, we manually annotated them using the GNI levels of comparable economies to ensure complete coverage of all 151 countries.
The D (Democratic) dimension uses Freedom House’s Freedom Status, which is derived from Political Rights and Civil Liberties scores, and retains its three categories: not free, partly free, and free [43].
3.3.2. Composite Score and Bin Distribution
To combine the five dimensions into a single ordered gradient, we first normalized each dimension by its maximum level and then constructed the composite WEIRD score. The denominators correspond to the maximum level of each dimension rather than substantive weights. This normalization mapped each dimension to a common scale before summation, so that the five WEIRD dimensions had the same maximum contribution to the composite score despite having different numbers of categorical levels. The composite score is used as a stratification variable for bin-level trend analysis, while the conceptual heterogeneity of the five dimensions is examined through dimension-specific analyses in Section 4.2.
Thus, . Because the score is a sum rather than an average, its upper bound is 5 rather than 1. We then take the floor of the composite score to obtain six WEIRD bins from 0 to 5:
This discrete variable was used in subsequent trend tests and group comparisons. Table 2 reports the distribution of countries and cases across the six bins.
Table 2.
WEIRD composite score bins.
At the country level, the lower WEIRD bins () included 106 countries, accounting for 70.20% of all 151 countries. All six bins have analyzable country and case counts, supporting systematic analysis along the WEIRD gradient. We also manually inspected the resulting country rankings and representative countries in each bin. The distribution was broadly consistent with common understandings of WEIRD and non-WEIRD country positions, with the US, the United Kingdom, and Germany in the highest bin and Burundi, Kenya, and Myanmar in the lowest bin.
3.4. Benchmark Construction
3.4.1. Task Design
The core task of the benchmark is contextualized cultural attribution. Given a cross-cultural conflict narrative, the model must identify the root cause of the conflict and distinguish it from alternative attribution paths. We designed the task as a six-option multiple-choice question. Compared with open-ended generation, multiple-choice questions reduce subjectivity in scoring, produce clearer and more quantifiable results, and are better suited for large-scale cross-model comparison.
Distractor Design
The distractors have two design goals. First, they should be plausible enough to prevent models from bypassing substantive reasoning through surface cues. Second, each wrong option should carry diagnostic information about the error type. In a conventional multiple-choice benchmark, an incorrect answer yields only a binary right-or-wrong signal. In our benchmark, the selected distractor also indicates the attribution path underlying the error, allowing evaluation to move from ability measurement to error diagnosis.
To achieve this goal, we designed the distractors around possible errors in cognitive reasoning and pragmatic interpretation. The former concerns simplification, generalization, analogy, and frame transfer in cultural attribution, while the latter concerns presupposition, context dependence, and meaning interpretation across cultures. We operationalized these ideas into five error types (Table 3). Type A misclassifies a cultural conflict as a non-cultural problem. Types B and C replace specific cultural attribution with generalized value judgments or shallow group impressions. Types D and E recognize cultural factors but oversimplify the cause or apply one’s own experiential frame to others’ behavior. Together, the five types form a continuum from failing to recognize the cultural nature of the conflict to misusing one’s own cultural frame in attribution.
Table 3.
Option-type design.
Quality Control
To prevent models from exploiting surface cues, all distractors are required to have reasoning depth comparable to that of the correct answer. The correct answer must specifically identify the local cultural logic underlying the behavior and avoid vague metalanguage such as cultural difference or lack of familiarity with customs.
3.4.2. Question Construction
For each case, the case narrative, analytic commentary, and description of cultural differences are used as input. We used deepseek-reasoner as an item-construction assistant to convert each source case into a draft question and six draft options according to the option type design described above. The correct option is not treated as an independent model judgment; it is anchored in the analytic commentary and cultural-difference description provided by the source repository. In this sense, deepseek-reasoner supports the textual drafting and structuring of benchmark items, while the source case analysis provides the semantic basis for the gold answer.
3.5. Experimental Design
3.5.1. Experimental Setup
Evaluated Models
We evaluated six mainstream large language models (Table 4), covering major providers in China and abroad. The set included both strong general-purpose models and relatively lightweight models, allowing us to observe cross-cultural performance across different training sources and capability levels.
Table 4.
Evaluated models.
Inference Setting
The evaluation used a zero-shot chain-of-thought setting. No examples are provided, but the system prompt instructs the model to reason step by step. The generation parameter is set to temperature = 0 to ensure deterministic output. Each evaluation input consists of a system prompt and a user prompt, with the following structure:
- System prompt:
- Please analyze the root cause of the conflict based on the provided case background and select the most accurate option from the six options by following these steps:
- Step 1. Identify the behavioral differences between the Chinese and foreign parties in the case.
- Step 2. Based on the specific legal or customary background of the target country, summarize in one sentence each cultural difference reflected by the target country and by China in this case.
- Step 3. Exclude distractors that are inconsistent with the facts and provide the final answer.
- User prompt:
- Case background: {context}
- Question: {question}
- Options: A. {option_a} B. {option_b}… F. {option_f}
- Please output in the following JSON format:
- {"comparison": {"foreign": "...", "china": "..."},
- "selection": "option letter"}
The final score is based only on the answer letter in the selection field. The reasoning process in comparison is not used for scoring.
Option Shuffling
To remove positional cues, the evaluation script reshuffles the six options with a fixed random seed before presenting them to each model. The resulting position distribution is uniform (≈16.67%).
Robustness Check
To verify reproducibility, we used two random seeds (60 and 40) to reshuffle options and run full evaluations on deepseek-chat, doubao-seed-2.0-lite-260215, and kimi-k2-0905-preview. The maximum accuracy difference between the two runs was 0.51 pp, far below the preset threshold of 2 pp, which supports the reproducibility of the evaluation results.
3.5.2. Evaluation Metrics
Overall Evaluation Metrics
Overall performance was measured by case-level accuracy. Let be the prediction of model m on the i-th response record, and let be the gold-standard answer. For N response records,
Table 5 reports the full-sample accuracy for each model, and Wilson 95% confidence intervals (CIs) are used to quantify uncertainty in proportion estimates. For analyses by cultural domain, continent, topic tag, or other groups, group-specific accuracy is computed by the same formula on the corresponding subset. When needed, we also compute macro-average accuracy by assigning equal weight to the 10 cultural domains:
This metric provides a robustness check when group sizes are uneven. Unless otherwise stated, the overall model ranking in the main text is based on full-sample accuracy. When cross-model variation is reported, standard deviation (SD) denotes variation across model accuracies within the corresponding group.
Table 5.
Full-sample accuracy and 95% confidence interval for each model.
Diagnostic Metrics
Diagnostic metrics were used to examine where models fail and whether errors vary systematically along country-level cultural gradients. We mainly used error-type shares and WEIRD-related statistics.
Error-type share: Each wrong option corresponds to one of five distractor types, A through E. For an analysis unit g, such as a model, continent, cultural domain, or WEIRD bin, let be the total number of error records in that unit, and let be the number of error records of type t. The error-type share is
Thus, each row in the error-type heatmaps uses all errors in that row as the denominator. For example, a B-type share of 19.75% means that 19.75% of all errors in that group are B-type errors, not that 19.75% of all questions in the group are answered with a B-type option.
WEIRD trend test: Analyses involving WEIRD use and , as defined in Section 3.3. For accuracy trends, denotes all response records in bin b, and denotes the number of correct records. For error-type trends, denotes all error records in bin b, and denotes the number of records belonging to the target error type. We use the Cochran–Armitage (CA) trend test for ordered-bin analyses. With weights , the overall proportion is
and the Cochran–Armitage trend statistic is
where indicates an increasing trend along the WEIRD gradient and indicates a decreasing trend. To make the endpoint contrast easier to interpret, the main text also reports
where and the unit is percentage points. Bin 0, bin 5, and are used only to display endpoint differences; the trend test itself uses all six ordered bins.
Single-dimension WEIRD regression: To examine how the odds of B-type errors change when a single WEIRD dimension increases by one level, we fit logistic regressions using error records as the sample. Let indicate whether the i-th error is a B-type error, and let denote the corresponding level of a WEIRD dimension:
and define the odds ratio (OR) as
An means that the odds of a B-type error increase when the dimension rises by one level. To test whether the signal is independent of continent distribution, we further include continent fixed effects:
where is the reference continent. The controlled WEIRD effect is also reported as . If the controlled OR remains significant, the effect of the dimension is not merely a projection of continent differences. For each family of parallel tests, p values are corrected using the Benjamini–Hochberg false discovery rate (FDR) procedure.
4. Results
This section reports the results from five perspectives: overall accuracy, cultural domain, continent, error type, and WEIRD gradient. Overall accuracy captures basic capability differences across models. Cultural domain and continent reveal content-based and geographic patterns in model performance. Error types diagnose the cognitive traps that models fall into when answering incorrectly. WEIRD analysis further tests whether performance and error types vary systematically along country-level cultural gradients.
4.1. Overall Results
The six models form two clear tiers. The top five models reach accuracies between 87.37% and 92.44%. gpt-5-mini is separated from the fifth-ranked model by about 11.2 pp. gemini-3-flash-preview ranks first, with an accuracy of 92.44% (Table 5).
These results show relatively strong baseline performance, but stable model differences remain. The following analyses examine whether these accuracy scores conceal deeper structural patterns.
4.2. Multidimensional Analysis
This section analyzes model performance across four dimensions: cultural domain, continent, error type, and WEIRD gradient.
4.2.1. Cultural Domains
Figure 1 places cultural domains and topic tags in a two-level view. Domains show the broad ordering of cross-cultural scenarios, while tags reveal difficulty variation within scenarios. Overall, the domain-level range is about 4.5 pp (from architecture at 89.4% to law at 84.9%), while the tag-level range reaches 6.5 pp (from festivals at 91.3% to work at 84.8%), making the latter clearly larger.
Figure 1.
Two-level view of cultural domains and high-frequency topic tags. Panel (a) reports domain accuracy. Dark-blue bars show means across all 6 models, while light-blue hatched bars show means across 5 models excluding gpt-5-mini; error bars show standard deviation (SD). Panel (b) ranks 30 high-frequency topic tags by mean accuracy; the red-to-blue gradient indicates lower-to-higher accuracy, the dashed line marks the overall mean, and only the 10 highest and 10 lowest tags are labeled.
The distribution suggests three difficulty structures.
Explicit symbolic cues include festivals, language, architecture, etiquette, and religion, which appear at the high end of the tag ranking and correspond to high-performing domains such as architecture and religion. These topics tend to enter text as identifiable objects, describable rules, or high-frequency cultural signs. Religion has relatively high inter-model agreement and the highest average accuracy among the five models excluding gpt-5-mini, indicating that explicit symbolic knowledge is generally easier and relatively consistent across models.
Tacit contextual cues include work, taboos, gestures, colors, and animals, which appear at the low end of the tag ranking. These topics are not necessarily rarer, but they depend on interactional contexts, social relations, local practices, or tacit boundaries that are hard to reduce to a stable rule.
Two close contrasts illustrate this pattern. Food (86.6%) depends on diverse, country-specific dishes and dietary habits that vary greatly across cultures, whereas social dining (90.1%) involves more recognizable and repeatedly described conventions such as seating order and toasting practices, creating a 3.5 pp gap within dining-related topics. Religion (90.4%) often appears through relatively explicit objects, rituals, or rules, while taboos (85.4%) are embedded in tacit rules about when something should not be done, producing a 5.0 pp gap. Models more reliably capture cultural rules that can be stated explicitly but have more difficulty with boundaries embedded in practice.
Non-transferable rules are represented by law, which is also rule-based but has the lowest accuracy. Law is strongly country-specific and weakly transferable across countries, showing that explicitness alone is insufficient. Economy shows a similar pattern: low average accuracy and the largest model disagreement among the five models excluding gpt-5-mini, suggesting uneven coverage of country-specific economic knowledge, local economic practices, and related data accessibility.
The results also reveal structural differences between gpt-5-mini and the other five models. Religion is the easiest domain and shows relatively high agreement among the other five models, but it is the weakest domain for gpt-5-mini (73.1%). Economy is the most divisive domain among the other five models, but it is the strongest domain for gpt-5-mini (82.6%). This contrast indicates that gpt-5-mini is not simply a weaker version of the other models. Its strengths and weaknesses differ qualitatively, not only quantitatively. We therefore treat the six-model results as the main estimates and use the five-model results excluding gpt-5-mini only as sensitivity estimates when group means or model-level standard deviations may be strongly affected by this model.
Overall, models handle explicit, stable, and readily identifiable cultural signs more reliably than cultural boundaries embedded in local practice or highly country-specific rules. Difficulty is therefore shaped by how explicit, textually available, context-dependent, and transferable a cultural cue is.
4.2.2. Continent Dimension
Figure 2 combines mean accuracy by continent (paired bars), model-level SD (error bars), and individual model scores (points). The fine-grained distribution reveals three spatial structures.
Figure 2.
Accuracy comparison across continents. Paired bars report means across 6 models and across 5 models excluding gpt-5-mini; error bars show standard deviation (SD) across models, and points show individual model scores.
North America and Europe form a model-consensus area. Under both reporting schemes, they are among the continents with the lowest standard deviations, and the points cluster closely around the bar tops. This indicates that models perform relatively similarly in these two regions. This consistency may be related to the high exposure of European and North American content in mainstream training data. Yet low disagreement does not imply high accuracy. The strongest model overall, gemini-3-flash-preview, ranks North America as its weakest continent (90.75%), while the weakest model overall, gpt-5-mini, ranks North America as its strongest continent (81.59%). These opposite patterns at the two capability extremes further compress cross-model variation.
Africa shows structural disadvantage. It has the lowest mean under both reporting schemes, and four of the six models rank Africa as their weakest continent. This result is insensitive to whether gpt-5-mini is included, suggesting that Africa’s low score is not driven by a single weak model. It is better characterized as a structural disadvantage shared across models, possibly reflecting systematic scarcity of Africa-related cultural representations in training data.
Asia shows heterogeneous disagreement. After removing gpt-5-mini, Asia is the only continent whose standard deviation still exceeds 2% (2.46%), and the range among mainstream models remains 6.8 pp (doubao-seed-2.0-lite-260215 at 86.28% versus gemini-3-flash-preview at 93.10%). This suggests substantial disagreement among models on Asian cultural content. Asia covers East Asia, Southeast Asia, South Asia, Central Asia, and West Asia, with large differences in legal traditions, religious structures, political systems, language ecologies, and social norms. Different models may vary in data coverage, knowledge organization, and reasoning paths across these subregions, making Asian cases more unstable across models. The main difficulty of Asia is therefore not simply low average performance but model disagreement caused by internal heterogeneity.
Continent × Domain Cross-Analysis
The continent × domain cross-analysis in Figure 3 and Figure 4 further shows that continent-level differences are not evenly distributed across all cultural domains but are concentrated in several specific region–domain combinations.
Figure 3.
Mean accuracy heatmaps for continent × domain. Panel (a) includes gpt-5-mini (6 models), and panel (b) excludes it (5 models). Rows and columns follow the original ordering. Cells marked with * indicate small samples (); these cells are shown for transparency but not used as primary evidence in mechanism-level interpretation. n/a indicates that no cases are available for the corresponding continent–domain cell. The same convention applies to subsequent cross-cell analyses.
Figure 4.
Inter-model standard deviation heatmaps for continent × domain. Panel (a) includes gpt-5-mini (6 models), and panel (b) excludes it (5 models). Rows and columns follow Figure 3. Cells marked with * have small samples (), and n/a indicates that no cases are available for the corresponding continent–domain cell.
The first pattern is structural disadvantage. Asia × law has the lowest mean among the 60 cells, and Asia × institutions is also about 4 pp below the global mean. This result is mainly related to the cultural complexity of Asian legal and institutional scenarios. At the legal level, civil law, common law, Islamic law, and customary law coexist. At the institutional level, socialist systems, parliamentary democracies, constitutional monarchies, and theocratic regimes coexist and are strongly intertwined with religious, linguistic, and ethnic boundaries. Another structural disadvantage appears in Africa × economy. All six models score below their own means in this cell, and a stable cross-continent gradient emerges: Africa → Asia → Oceania → Latin America → North America → Europe. This pattern is difficult to explain by cultural complexity alone, because Asian economic systems are no less internally diverse than African ones, yet Asia × economy scores higher. The stronger factor here is likely data accessibility. Local African economic issues are marginal in both coverage and narrative perspective in training data. Related texts often appear from external perspectives such as development, aid, and poverty governance, while local perspectives are scarce.
The second pattern is heterogeneous disagreement. After excluding gpt-5-mini, cells such as Asia × law, Africa × economy, Asia × economy, and Africa × language and writing still show high standard deviations in Figure 4. These cells are therefore not outliers caused by one weak model but areas where mainstream models show substantive disagreement. They often combine high cultural complexity with uneven data accessibility, exposing differences in model data coverage and knowledge structure.
At the single-model level, two contrastive signals are notable. When the cross-tabulation is further disaggregated by model, the direction of training bias does not vary monotonically with overall model strength. gpt-5-mini, the weakest model overall, is the only one that ranks North America as its strongest continent. Among the 54 cross cells with , it ranks first only in North America × economy (96.8%), exceeding doubao-seed-2.0-lite-260215 by 3.2 pp. The opposite contrast appears for gemini-3-flash-preview, the strongest model overall. Its lowest cell among all cells is North America × language and writing (80.0%), 12.5 pp lower than doubao-seed-2.0-lite-260215 in the same cell. This is inconsistent with the simple assumption that Anglo-American models should be more familiar with North America.
In summary, the continent dimension shows three spatial structures: North America and Europe form a model-consensus area, Africa shows systematic disadvantage, and Asia produces the largest cross-model disagreement. These differences interact with cultural domains: Asia × law points more to cultural complexity, while Africa × economy points more to data accessibility. Model performance should therefore be understood through a region × domain structure rather than by treating continents as self-contained cultural partitions.
4.2.3. Error-Type Dimension
This section examines the distribution of the five distractor types at the overall, continent, and cultural-domain levels. Because each wrong option carries an error-type label, the design directly addresses two questions: which types of errors dominate overall, and how do error structures differ across continents and domains?
Overall Error-Type Distribution
Figure 5 shows the error-type distribution for each model. The overall distribution has a clear two-peak shape. Type D, single cultural attribution (30.28%), and Type E, cross-cultural analogy (31.08%), together account for about 61.4% of all errors and constitute the two main forms of cross-cultural failure. Type C, shallow stereotype (10.21%), has the lowest share of the five, suggesting that contemporary mainstream LLMs are relatively effective at suppressing explicit stereotype labels during training. Instead, subtler simplification and analogy errors predominate. Yet the six models do not share the same error structure. Except for gpt-5-mini, the five other models maintain a stable D/E two-peak pattern, with D ranging from 32.8% to 38.7% and E from 25.8% to 31.6%. By contrast, gpt-5-mini has a D share of only 18.4%, much lower than the others, while Types A and B rise to 19.1% and 18.1%, respectively. It therefore shows a stronger tendency toward objectifying and universalizing attributions.
Figure 5.
Model × error-type heatmap. Rows show each model’s distribution of wrong options across error types A–E. Rows are ordered by overall model accuracy, and columns by each error type’s overall share among all errors. A denotes logical or technical attribution; B, false consensus; C, shallow stereotype; D, single cultural attribution; and E, cross-cultural analogy.
Error Structure by Continent
The error structures across continents (Figure 6) can be summarized into three patterns.
Figure 6.
Continent × error-type heatmap. Rows show each continent’s distribution of wrong options across error types A–E, and columns are ordered by each error type’s overall share among all errors. A denotes logical or technical attribution; B, false consensus; C, shallow stereotype; D, single cultural attribution; and E, cross-cultural analogy.
Type B clusters in Europe, Oceania, and North America. Europe (20.1%) and Oceania (19.2%) have the highest B-type shares, followed by North America (16.2%); all three clearly have higher shares than the other continents. B-type options use specific universal value claims, such as human rights, environmental protection, privacy, and safety. In cultural conflict questions set in Europe, Oceania, and North America, models more often misidentify these value claims as the root cause of the conflict.
Type D is led by Asia and North America. Asia (38.2%) and North America (34.8%) have substantially higher shares of single cultural attribution than the other four continents. This indicates that models more readily compress complex cultural phenomena in these regions into a single tradition, institutional label, or cultural symbol. For Asia, this may be related to its high internal heterogeneity in culture, religion, law, and institutional structure. For North America, it may stem from models’ overreliance on certain dominant narratives or typical labels. Although both show high D-type shares, their structural sources may differ.
Type E is most prominent in Oceania, Latin America, and Africa. Oceania (41.3%), Latin America (36.3%), and Africa (33.1%) have the highest E-type shares, and Type E is the largest error type within each of the three continents. Models are more likely to interpret cultural behavior in these regions by analogy with more familiar situations. When cultural practices are less fully textualized or enter training data mainly through external observers, models may use analogy to fill explanatory gaps. Africa also has the highest Type A share, logical or technical attribution, among the continents (16.4%). In Africa × economy, the lowest cell in the continent × domain table (78.8%), Type A accounts for as much as 50.0% of errors.
Error Structure by Cultural Domain
Error structures differ substantially across domains (Figure 7).
Figure 7.
Domain × error-type heatmap. Rows show each domain’s distribution of wrong options across error types A–E. Rows are ordered by overall domain accuracy, and columns by each error type’s overall share among all errors. A denotes logical or technical attribution; B, false consensus; C, shallow stereotype; D, single cultural attribution; and E, cross-cultural analogy.
Architecture and economy are dominated by Type D. Type D is much higher in architecture (51.7%) and economy (42.0%) than in other domains. In both domains, models tend to reduce complex phenomena to a single tradition, aesthetic preference, resource condition, or economic logic, while ignoring factors such as history, institutions, religion, class, and local practice that may operate together. Economy also has a relatively high Type A share and a low Type C share, indicating that model errors on economic issues tend more toward objectifying or technical explanations and less toward explicit stereotypes.
Law has high Type B and Type C shares. It has the highest B-type share (18.8%) and the highest C-type share (17.7%) among all domains. Legal scenarios are often closely tied to normative concepts such as rights, fairness, order, security, and freedom, and are therefore more likely to trigger universal-value explanations. Legal conflicts can also activate broad judgments about countries or groups, increasing the risk of shallow stereotypes. Law is thus one of the most complex domains in terms of error type.
Overall, the error-type dimension reveals structures that accuracy cannot show directly. The main failures are not explicit stereotypes but subtler errors such as compressing cultural complexity, explaining unfamiliar cultures through familiar frames, and treating universal value claims as specific causes. Error distributions vary by continent and domain, linking model errors to cultural explicitness, local complexity, data accessibility, and dominant explanatory frames.
4.2.4. WEIRD Dimension
The previous subsections characterize the heterogeneity of model performance across cultural domains, continents, and error types. This subsection introduces the WEIRD framework to examine whether these patterns vary systematically along country-level cultural gradients. The analysis has two levels. It first tests whether accuracy changes monotonically with the composite WEIRD bin and then examines whether the structure of model errors changes along the WEIRD gradient.
Accuracy Gradient: Directional Divergence and Reverse Effects
At the domain level, the Cochran–Armitage trend test (Table 6) uses all six ordered WEIRDBin = 0–5 groups and shows significant monotonic associations between accuracy and the composite WEIRD bin in four domains. Economy (, FDR ) and daily life (, FDR ) show positive trends, meaning that questions about higher-WEIRD countries are easier for models to answer correctly. In contrast, religion shows a significant negative trend (, FDR ). This reverse effect is robust: all six models show a negative trend, and endpoint differences are also negative across the W, D, R, E, and I dimensions ( to ).
Table 6.
Cochran–Armitage (CA) trend tests for domain accuracy across WEIRD composite-score bins (false discovery rate (FDR)-significant items only).
Similar divergence appears at the topic-tag level. Values (, FDR ) and festivals (, FDR ) show positive trends in all six models. In contrast, Clothing () and Gifts () show stable reverse WEIRD effects. Although they do not remain significant after FDR correction ( and ), all six models show negative trends, suggesting that the pattern is not model-specific.
The coexistence of positive and negative effects indicates that the WEIRD gradient is not a single-direction difficulty axis. Reverse effects may reflect different mechanisms: secularized standpoints in high-WEIRD religious contexts, or high intra-country complexity in topics such as clothing and gifts. These patterns point to both data standpoint and topic complexity as possible sources of difficulty.
Systematic Change in Error Structure
Compared with accuracy, the WEIRD gradient has a stronger effect on error types. Table 7 shows that the most prominent trend is Type B, false consensus. It increases monotonically from 11.31% in bin 0 to 19.75% in bin 5 (, FDR ), and is the only error type with a significant upward trend. Types D and E decrease by 2.85 pp and 3.19 pp, respectively, and remain significant at the 0.05 threshold only marginally after FDR correction. Types A and C are not significant.
Table 7.
Cochran–Armitage (CA) trend tests for WEIRD composite score × error type; p values are adjusted using the false discovery rate (FDR).
This result shows that the WEIRD gradient affects not only whether a model answers correctly but also how it answers incorrectly. As the WEIRD bin rises, models are more likely to invoke normative claims such as human rights, environmental protection, privacy, and safety. In high-WEIRD country scenarios, model errors therefore more often take the form of universal-value projection. This extends the usual account of WEIRD bias: beyond the underrepresentation of low-WEIRD cultures, the high visibility of high-WEIRD value frames may also make them easier for models to activate, flattening local differences within high-WEIRD contexts.
The topic-tag results reinforce this point. Among tags that remain significant after FDR correction, the increase in Type B share is much larger than the changes observed for accuracy: religion (, FDR ), law (, FDR ), social dining (, FDR ), language (, FDR ), and animals (, FDR ). Only two tags remain significant after FDR correction at the accuracy level, whereas ten do so at the B-type error level. WEIRD effects therefore appear more clearly in the structure of errors than in accuracy alone.
Dominance of the W Dimension
To identify the dimensional source of the Type B increase, we test the effect of each WEIRD dimension on B-type errors (Table 8). All five dimensions show significant positive trends. The W dimension, Western versus Non-Western, is strongest (OR = 1.86, ), followed by D (1.34) and R (1.27), while E and I are weaker. In terms of endpoint B-type error rates, W has the largest range (11.69% → 19.79%, ), followed by R (), while E has the smallest range ().
Table 8.
Odds-ratio (OR) and Cochran–Armitage (CA) trend tests for the effect of the five WEIRD dimensions on Type B errors (per one-level increase).
The controlled results are summarized in Table 9. After continent fixed effects are added, the effect of W increases rather than decreases. The Western dimension therefore cannot be reduced to continent differences or to the higher share of Europe and North America. Even after geographic controls, the Western versus Non-Western distinction remains an explanatory factor for B-type errors.
Table 9.
Supplementary odds-ratio (OR) tests after controlling for continent fixed effects.
The E and I dimensions show the opposite pattern. Their ORs fall to 1.04 and 1.08, respectively, and both lose significance (shrinkage rates of 87.1% and 63.1%). This indicates that the effects of education and industrialization on Type B errors are largely reducible to continent-level development gradients. R (OR 1.17, ) and D (OR 1.17, ) remain moderately significant after control, retaining signals that are independent of geographic distribution.
Overall, the five WEIRD dimensions are not homogeneous. W is more directly linked to cultural and value reference frames. E and I mainly reflect development gradients, while R and D lie between socioeconomic structure and institutional value discourse.
5. Discussion
Section 4.2 identifies empirical structures in models’ cross-cultural performance across domains, continents, error types, and WEIRD gradients. This section interprets these structures through cultural complexity, data accessibility, and the standpoint of the benchmark, then discusses their implications for cross-cultural evaluation.
5.1. Observations Under a Two-Dimensional Framework
Most contrasts in Section 4.2 can be organized by two interacting dimensions: cultural complexity and data accessibility.
Cultural complexity refers to cultural phenomena comprising structural layers that cannot be reduced to one another. It includes inter-system heterogeneity, as in Asia × law, where civil law, common law, Islamic law, and customary law coexist, and intra-system complexity, where a single practice involves multiple contextual factors. Topics such as clothing and gifts are highly differentiated across subcultures within WEIRD countries, and even abundant data may not support a single stable pattern. In the error analysis, Asia has the highest Type D share, single cultural attribution, among the continents (38.17%). Both forms of complexity make models prone to compressing multi-factor phenomena into a single symbol.
Data accessibility refers to whether relevant cultural content enters model training data in a sufficient, balanced, and learnable way. It includes data scale, the unevenness of global digital corpora across languages and regions, and data standpoint, whereby available texts may come from external observers rather than local participants. The weakness of Africa × economy (78.8%) reflects both dimensions. The economy domain provides the clearest within-domain comparison: accuracy across continents ranges from Africa at 78.8% to Europe at 91.1%, a 12.3 pp gap that is much larger than the between-model standard deviation (3.75 pp). In the error analysis, Africa has the highest Type A share, logical or technical attribution, among continents (16.39%), indicating that models tend to avoid cultural explanations and instead attribute conflicts involving African economic topics to objective factors. The split of the Americas provides a supplementary case: North America’s B-type share is 16.20%, close to Europe, while Latin America’s E-type share is 36.26%, close to Oceania and Africa. Geographic adjacency therefore does not imply the same mechanism of corpus visibility.
Cultural complexity and data accessibility therefore describe two related sources of difficulty. Complexity makes models simplify layered cultural structures, while limited or one-sided data accessibility makes them rely on external explanatory frames. Type D, Type E, Type A, and Type B are different attribution paths taken under these conditions.
5.2. A Cultural-Power Interpretation of Error Patterns
If cultural complexity and data accessibility organize error distributions, a broader question remains: how should these patterns be interpreted in relation to cultural knowledge and power? This section discusses this question through three theoretical lenses.
5.2.1. Cultural Colonialism as an Interpretive Lens
Knowledge hierarchies formed during the colonial era, concerning whose experience counts as knowledge and whose values count as universal, persist in academic publishing, international media, and digital content. In NLP, this imbalance appears as structural differences in language-technology coverage and web-corpus quality [32,33]. Since most LLM training data come from internet text, models may inherit part of this unequal visibility. The B-type evidence is compatible with this interpretation: model-generated universal-value options increase along the WEIRD gradient from 11.31% to 19.75%. This pattern suggests a possible link between unequal cultural visibility in digital corpora and model attribution behavior.
5.2.2. Orientalism as an Interpretive Lens
Said [44] describes Orientalism as a Western discourse that constructs the Orient as an object of knowledge and representation, often reducing diverse societies to externally defined categories. The error patterns can be interpreted in relation to this account. At the low-WEIRD end, Type E is highest in Africa, Latin America, and Oceania, indicating that models tend to explain cultural behavior in these regions using familiar frames. Type A is highest in Africa and is especially concentrated in Africa × economy, where it reaches 50.0% of errors. At the high-WEIRD end, a different form of flattening may appear: when dominant narratives are highly available, internal cultural differences may be compressed into an unmarked universal presupposition.
5.2.3. From Discourse Patterns to Model Behavior
The continuation of colonial knowledge hierarchies and othering perspectives may be reflected in model behavior after training. Once asymmetrical cultural discourse enters training data, it can influence the patterns that models learn and reproduce. The coupling between Type B errors and the WEIRD gradient provides a quantitative pattern compatible with this interpretation, although it does not by itself identify the training-data pathway. Models do not create cultural bias from nothing; they may encode and redistribute existing asymmetries in human knowledge systems. If model-generated content re-enters the internet and becomes training data for later models, these discourse structures may be further amplified.
5.3. Methodological Reflections on Cross-Cultural Evaluation
These results also invite a reconsideration of cross-cultural evaluation itself. Cultural evaluation does not measure a model’s objective mastery of world cultures from a neutral position. It always has a starting standpoint, a set of questions, and an explanatory frame. The question is whether that standpoint is explicit, analytically tractable, and open to different cultural experiences.
Cross-cultural evaluation therefore needs to advance in at least two directions: breadth of coverage and depth of diagnosis.
Breadth of coverage means more than including more countries or languages. It also concerns which cultural experiences are evaluated, which conflicts require explanation, and what counts as a correct explanation. Improving coverage therefore requires both bringing low-WEIRD cultures into measurable view and reflecting on the cultural standpoint of the evaluation reference frame.
Depth of diagnosis determines how finely evaluation understands model failure. In current paradigms, improvement is often framed as raising accuracy on non-WEIRD questions. The findings of this study suggest that the deeper issue is how models make errors. The five distractor types organize wrong answers into interpretable cognitive and pragmatic mismatches, linking a binary error signal to mechanisms such as oversimplification, frame transfer, and presupposition conflict. The monotonic increase of Type B errors along the WEIRD gradient shows that errors in high-WEIRD scenarios differ in nature from errors in low-WEIRD scenarios. Accuracy alone compresses this structure into a single number.
The two directions depend on each other. Breadth without depth makes non-WEIRD questions contribute only a low score. Depth without breadth lets diagnostic tools operate mainly on WEIRD samples, leaving low-WEIRD error patterns undermeasured.
5.4. Limitations
- (1)
- The evaluation data come from the context of international Chinese education and are organized around contrasts between Chinese and foreign cultures. Model performance from other starting standpoints, such as Europe versus Africa, is outside the scope of this study. The Chinese standpoint represents one of several possible evaluation standpoints, and future work can compare it with benchmarks organized from other cultural starting points.
- (2)
- The geographic distribution reflects China’s actual map of international contact, so sample sizes differ substantially across countries.
- (3)
- The multiple-choice format enables quantification and comparison, but it limits fine-grained observation of reasoning processes in open-ended generation.
- (4)
- The five WEIRD dimensions use mixed operational schemes: W and D are discrete categories, while E, I, and R are based on global quantiles or official groupings. They remain proxy measures of complex sociocultural structures, and cross-benchmark comparisons should consider differences in measurement schemes and years.
- (5)
- Data standpoint is introduced as an organizing concept. This study provides compatible empirical evidence, including the position of Africa × economy, the share of Type A errors, and the independent increase of Type B along W, R, and D; however, a rigorous test of this interpretation requires corpus-side evidence beyond the scope of this paper.
6. Conclusions
Using the Chinese–Foreign Cultural Differences Case Repository at Xiamen University, this study develops an interpretable diagnostic benchmark for cross-cultural understanding, centered on cultural attribution reasoning and cognitive attribution error diagnosis. The repository covers 151 countries and contains 9342 cases. Our contribution lies in transforming these cases into benchmark-ready structured data through topic normalization, metadata cleaning, continent-label correction, country-level WEIRD annotation, and five types of cognitively informative distractors. These steps enable geographic comparison, cultural-gradient analysis, and diagnostic classification of errors.
Evaluation of six mainstream LLMs shows relatively strong baseline performance in cultural attribution but uneven error structures. Models handle explicit, stable, and textually available cultural signs better and are more prone to errors in implicit contexts, country-specific rules, and local practices. Continent-level analysis shows three spatial patterns: North America and Europe show greater inter-model consensus, Africa shows consistently lower performance across models, and Asia produces greater cross-model disagreement. The continent × domain analysis further identifies Asia × law, Asia × institutions, and Africa × economy as key difficulty points, pointing to cultural complexity and data accessibility as two sources of constraint.
Error-type analysis shows that models already suppress explicit stereotypes relatively well. Single cultural attribution and cross-cultural analogy are the main sources of failure, together accounting for more than 60% of all errors, with systematic variation across continents and domains. From cognitive and pragmatic perspectives, these errors correspond to mismatches such as single-cause simplification of complex cultural phenomena, cross-cultural pragmatic transfer, and pragmatic presupposition conflict. False-consensus errors have a relatively small overall share, but their monotonic increase along the WEIRD gradient is the strongest structural finding of this study. The signal is centered on the Western dimension and becomes stronger after controlling for continent, indicating that the universal values internalized by models are statistically coupled with values from high-WEIRD societies.
These findings show that cross-cultural errors in LLMs cannot be reduced to individual model weakness. They are associated with cultural complexity, uneven data accessibility, and asymmetries in cultural visibility. The WEIRD analysis further suggests that these asymmetries involve both the underrepresentation of low-WEIRD cultures and the stronger activation of dominant value frames in high-WEIRD contexts.
Based on these findings, this study proposes two methodological claims. First, cross-cultural evaluation needs breadth of coverage: low-WEIRD cultures must be brought into measurable view, and the cultural standpoint of the evaluation frame must be explicit. Second, it needs depth of diagnosis: errors should be transformed from binary signals into identifiable cognitive and pragmatic mechanisms.
Future work could adopt multiple cultural starting standpoints and test whether error mechanisms differ across reference frames. It could also introduce open-ended generation tasks to examine errors such as single-cause simplification and cross-cultural analogy with finer-grained access to reasoning processes.
Author Contributions
Conceptualization, M.G., W.Z., G.R., and C.-R.H.; methodology, M.G., W.Z., G.R., and C.-R.H.; software, M.G. and L.G.; validation, M.G. and L.G.; formal analysis, M.G. and L.G.; investigation, M.G. and L.G.; data curation, M.G. and L.G.; writing—original draft preparation, M.G.; writing—review and editing, M.G., L.G., W.Z., G.R., and C.-R.H.; visualization, M.G. and L.G.; supervision, W.Z., G.R., and C.-R.H.; project administration, G.R.; funding acquisition, W.Z. and G.R. All authors have read and agreed to the published version of the manuscript.
Funding
This research was funded by the Leading Projects in Key Research Fields of Language Funded by the National Language Commission (LH24TD02).
Institutional Review Board Statement
Not applicable.
Informed Consent Statement
Not applicable.
Data Availability Statement
The source cases are drawn from the Chinese–Foreign Cultural Differences Case Repository at Xiamen University, which is publicly accessible at https://difculcase.xmu.edu.cn/ (accessed on 23 January 2026). The benchmark items and annotations generated in this study are available from the corresponding authors upon reasonable request. The full benchmark dataset has not been deposited in a public repository because the benchmark items are closely linked to the original source cases. Controlled access is provided to encourage users to consult the source repository directly for the original case texts, rather than accessing them indirectly through the benchmark dataset.
Acknowledgments
During the preparation of this manuscript, the authors used GPT-5.6 and Claude Opus 4.6 for language editing and polishing. The authors have reviewed and edited all AI-generated content and take full responsibility for the final published version of this manuscript.
Conflicts of Interest
The authors declare no conflicts of interest. The funders had no role in the design of the study; in the collection, analysis, or interpretation of data; in the writing of the manuscript; or in the decision to publish the results.
Abbreviations
| BLEnD | Benchmark for LLMs on Everyday Knowledge in Diverse Cultures and Languages |
| CA | Cochran–Armitage |
| CI | Confidence Interval |
| FDR | False Discovery Rate |
| GDP | Gross Domestic Product |
| GNI | Gross National Income |
| ICC | Intercultural Communicative Competence |
| LLM | Large Language Model |
| NLP | Natural Language Processing |
| OECD | Organisation for Economic Co-operation and Development |
| OR | Odds Ratio |
| PISA | Programme for International Student Assessment |
| PPP | Purchasing Power Parity |
| SD | Standard Deviation |
| UNDP | United Nations Development Programme |
| US | United States |
| WEIRD | Western, Educated, Industrialized, Rich, Democratic |
| WVS | World Values Survey |
References
- Byram, M. Teaching and Assessing Intercultural Communicative Competence; Multilingual Matters: Philadelphia, PA, USA, 1997. [Google Scholar]
- Deardorff, D.K. Identification and Assessment of Intercultural Competence as a Student Outcome of Internationalization. J. Stud. Int. Educ. 2006, 10, 241–266. [Google Scholar] [CrossRef] [Scilit]
- Zhao, W.; Mondal, D.; Tandon, N.; Dillion, D.; Gray, K.; Gu, Y. WORLDVALUESBENCH: A Large-Scale Benchmark Dataset for Multi-Cultural Value Awareness of Language Models. In Proceedings of the 2024 Joint International Conference on Computational Linguistics, Language Resources and Evaluation (LREC-COLING), Torino, Italy, 20–25 May 2024; pp. 17696–17706. [Google Scholar]
- AlKhamissi, B.; ElNokrashy, M.; AlKhamissi, M.; Diab, M. Investigating Cultural Alignment of Large Language Models. In Proceedings of the 62nd Annual Meeting of the Association for Computational Linguistics (Volume 1: Long Papers), Bangkok, Thailand, 11–16 August 2024; pp. 12404–12422. [Google Scholar] [CrossRef] [Scilit]
- Wang, Y.; Zhu, Y.; Kong, C.; Wei, S.; Yi, X.; Xie, X.; Sang, J. CDEval: A Benchmark for Measuring the Cultural Dimensions of Large Language Models. In Proceedings of the 2nd Workshop on Cross-Cultural Considerations in NLP, Bangkok, Thailand, 16 August 2024; pp. 1–16. [Google Scholar] [CrossRef] [Scilit]
- Wang, B.; Liu, Z.; Huang, X.; Jiao, F.; Ding, Y.; Aw, A.; Chen, N.F. SeaEval for Multilingual Foundation Models: From Cross-Lingual Alignment to Cultural Reasoning. In Proceedings of the 2024 Conference of the North American Chapter of the Association for Computational Linguistics: Human Language Technologies (Volume 1: Long Papers), Mexico City, Mexico, 16–21 June 2024; pp. 370–390. [Google Scholar] [CrossRef] [Scilit]
- Myung, J.; Lee, N.; Zhou, Y.; Jin, J.; Putri, R.A.; Antypas, D.; Borkakoty, H.; Kim, E.; Perez-Almendros, C.; Ayele, A.A.; et al. BLEnD: A Benchmark for LLMs on Everyday Knowledge in Diverse Cultures and Languages. In Proceedings of the 38th Conference on Neural Information Processing Systems; Neural Information Processing Systems Foundation, Inc.: San Diego, CA, USA, 2024; Volume 37, pp. 78104–78146. [Google Scholar] [CrossRef] [Scilit]
- Bhatt, S.; Diaz, F. Extrinsic Evaluation of Cultural Competence in Large Language Models. In Proceedings of the Findings of the Association for Computational Linguistics: EMNLP 2024, Miami, FL, USA, 12–16 November 2024; pp. 16055–16074. [Google Scholar] [CrossRef] [Scilit]
- Chiu, Y.Y.K.; Jiang, L.; Lin, B.Y.; Park, C.Y.; Li, S.S.; Ravi, S.; Bhatia, M.; Antoniak, M.; Tsvetkov, Y.; Shwartz, V.; et al. CulturalBench: A Robust, Diverse and Challenging Benchmark for Measuring LMs’ Cultural Knowledge Through Human-AI Red-Teaming. In Proceedings of the 63rd Annual Meeting of the Association for Computational Linguistics (Volume 1: Long Papers), Vienna, Austria, 27 July–1 August 2025; pp. 25663–25701. [Google Scholar] [CrossRef] [Scilit]
- Shen, S.; Logeswaran, L.; Lee, M.; Lee, H.; Poria, S.; Mihalcea, R. Understanding the Capabilities and Limitations of Large Language Models for Cultural Commonsense. In Proceedings of the 2024 Conference of the North American Chapter of the Association for Computational Linguistics: Human Language Technologies (Volume 1: Long Papers), Mexico City, Mexico, 16–21 June 2024; pp. 5668–5680. [Google Scholar] [CrossRef] [Scilit]
- Acquaye, C.; An, H.; Rudinger, R. Susu Box or Piggy Bank: Assessing Cultural Commonsense Knowledge between Ghana and the US. In Proceedings of the 2024 Conference on Empirical Methods in Natural Language Processing, Miami, FL, USA, 12–16 November 2024; pp. 9483–9502. [Google Scholar] [CrossRef] [Scilit]
- Wang, W.; Jiao, W.; Huang, J.; Dai, R.; Huang, J.t.; Tu, Z.; Lyu, M. Not All Countries Celebrate Thanksgiving: On the Cultural Dominance in Large Language Models. In Proceedings of the 62nd Annual Meeting of the Association for Computational Linguistics (Volume 1: Long Papers), Bangkok, Thailand, 11–16 August 2024; pp. 6349–6384. [Google Scholar] [CrossRef] [Scilit]
- Shi, W.; Li, R.; Zhang, Y.; Ziems, C.; Yu, S.; Horesh, R.; Paula, R.A.D.; Yang, D. CultureBank: An Online Community-Driven Knowledge Base Towards Culturally Aware Language Technologies. In Proceedings of the Findings of the Association for Computational Linguistics: EMNLP 2024, Miami, FL, USA, 12–16 November 2024; pp. 4996–5025. [Google Scholar] [CrossRef] [Scilit]
- Rao, A.; Yerukola, A.; Shah, V.; Reinecke, K.; Sap, M. NormAd: A Framework for Measuring the Cultural Adaptability of Large Language Models. In Proceedings of the 2025 Conference of the Nations of the Americas Chapter of the Association for Computational Linguistics: Human Language Technologies (Volume 1: Long Papers), Albuquerque, NM, USA, 29 April–4 May 2025; pp. 2373–2403. [Google Scholar] [CrossRef] [Scilit]
- Saha, S.; Pandey, S.K.; Gupta, H.; Choudhury, M. Reading between the Lines: Can LLMs Identify Cross-Cultural Communication Gaps? In Proceedings of the 2025 Conference of the Nations of the Americas Chapter of the Association for Computational Linguistics: Human Language Technologies (Volume 1: Long Papers), Albuquerque, NM, USA, 29 April–4 May 2025; pp. 8043–8067. [Google Scholar] [CrossRef] [Scilit]
- Havaldar, S.; Cho, Y.M.; Rai, S.; Ungar, L. Culturally-Aware Conversations: A Framework & Benchmark for LLMs. In Proceedings of the Fourth Workshop on Bridging Human-Computer Interaction and Natural Language Processing (HCI+NLP), Suzhou, China, 9 November 2025; pp. 220–229. [Google Scholar] [CrossRef] [Scilit]
- Huang, G.; Wu, Y. Research on Intercultural Competence Evaluation of Large Language Models. J. Int. Chin. Teach. 2025, 4, 71–79. (In Chinese) [Google Scholar] [CrossRef]
- Hall, E.T. Beyond Culture; Anchor Books: New York, NY, USA, 1976. [Google Scholar]
- Ribeiro, M.T.; Wu, T.; Guestrin, C.; Singh, S. Beyond Accuracy: Behavioral Testing of NLP Models with CheckList. In Proceedings of the 58th Annual Meeting of the Association for Computational Linguistics, Online, 5–10 July 2020; pp. 4902–4912. [Google Scholar] [CrossRef] [Scilit]
- Gardner, M.; Artzi, Y.; Basmov, V.; Berant, J.; Bogin, B.; Chen, S.; Dasigi, P.; Dua, D.; Elazar, Y.; Gottumukkala, A.; et al. Evaluating Models’ Local Decision Boundaries via Contrast Sets. In Proceedings of the Findings of the Association for Computational Linguistics: EMNLP 2020, Online, 16–20 November 2020; pp. 1307–1323. [Google Scholar] [CrossRef] [Scilit]
- Parrish, A.; Chen, A.; Nangia, N.; Padmakumar, V.; Phang, J.; Thompson, J.; Htut, P.M.; Bowman, S.R. BBQ: A Hand-Built Bias Benchmark for Question Answering. In Proceedings of the Findings of the Association for Computational Linguistics: ACL 2022, Dublin, Ireland, 22–27 May 2022; pp. 2086–2105. [Google Scholar] [CrossRef] [Scilit]
- Jin, J.; Kim, J.; Lee, N.; Yoo, H.; Oh, A.; Lee, H. KoBBQ: Korean Bias Benchmark for Question Answering. Trans. Assoc. Comput. Linguist. 2024, 12, 507–524. [Google Scholar] [CrossRef] [Scilit]
- Liu, Y.; Zhao, C.; Piao, M.; Miao, L.; Tao, S.; He, M.; Liu, C.; Li, Z.; Ma, H.; Guo, J.; et al. The GaoYao Benchmark: A Comprehensive Framework for Evaluating Multilingual and Multicultural Abilities of Large Language Models. In Proceedings of the 64th Annual Meeting of the Association for Computational Linguistics (Volume 1: Long Papers), San Diego, CA, USA, 2–7 July 2026; pp. 21364–21384. [Google Scholar] [CrossRef] [Scilit]
- Morris, M.W.; Peng, K. Culture and Cause: American and Chinese Attributions for Social and Physical Events. J. Personal. Soc. Psychol. 1994, 67, 949–971. [Google Scholar] [CrossRef]
- Choi, I.; Nisbett, R.E.; Norenzayan, A. Causal Attribution across Cultures: Variation and Universality. Psychol. Bull. 1999, 125, 47–63. [Google Scholar] [CrossRef]
- Thomas, J. Cross-Cultural Pragmatic Failure. Appl. Linguist. 1983, 4, 91–112. [Google Scholar] [CrossRef] [Scilit]
- Kasper, G. Pragmatic Transfer. Second. Lang. Res. 1992, 8, 203–231. [Google Scholar] [CrossRef] [Scilit]
- Pawar, S.; Park, J.; Jin, J.; Arora, A.; Myung, J.; Yadav, S.; Haznitrama, F.G.; Song, I.; Oh, A.; Augenstein, I. Survey of Cultural Awareness in Language Models: Text and Beyond. Comput. Linguist. 2025, 51, 907–1004. [Google Scholar] [CrossRef] [Scilit]
- Jha, A.; Davani, A.; Reddy, C.K.; Dave, S.; Prabhakaran, V.; Dev, S. SeeGULL: A Stereotype Benchmark with Broad Geo-Cultural Coverage Leveraging Generative Models. In Proceedings of the 61st Annual Meeting of the Association for Computational Linguistics (Volume 1: Long Papers), Toronto, ON, Canada, 9–14 July 2023; pp. 9851–9870. [Google Scholar] [CrossRef] [Scilit]
- Wu, M.C.; Chin, S.C.; Wood, T.; Goyal, A.; Sadagopan, N. Incorporating Diverse Perspectives in Cultural Alignment: Survey of Evaluation Benchmarks through a Three-Dimensional Framework. In Proceedings of the 2025 Conference on Empirical Methods in Natural Language Processing, Suzhou, China, 4–9 November 2025; pp. 17026–17061. [Google Scholar] [CrossRef] [Scilit]
- Joshi, P.; Santy, S.; Budhiraja, A.; Bali, K.; Choudhury, M. The State and Fate of Linguistic Diversity and Inclusion in the NLP World. In Proceedings of the 58th Annual Meeting of the Association for Computational Linguistics, Online, 5–10 July 2020; pp. 6282–6293. [Google Scholar] [CrossRef] [Scilit]
- Blasi, D.E.; Anastasopoulos, A.; Neubig, G. Systematic Inequalities in Language Technology Performance across the World’s Languages. In Proceedings of the 60th Annual Meeting of the Association for Computational Linguistics (Volume 1: Long Papers), Dublin, Ireland, 22–27 May 2022; pp. 5486–5505. [Google Scholar] [CrossRef] [Scilit]
- Kreutzer, J.; Caswell, I.; Wang, L.; Wahab, A.; van Esch, D.; Ulzii-Orshikh, N.; Tapo, A.; Subramani, N.; Sokolov, A.; Sikasote, C.; et al. Quality at a Glance: An Audit of Web-Crawled Multilingual Datasets. Trans. Assoc. Comput. Linguist. 2022, 10, 50–72. [Google Scholar] [CrossRef] [Scilit]
- Henrich, J.; Heine, S.J.; Norenzayan, A. The Weirdest People in the World? Behav. Brain Sci. 2010, 33, 61–83. [Google Scholar] [CrossRef] [Scilit]
- Linxen, S.; Sturm, C.; Brühlmann, F.; Cassau, V.; Opwis, K.; Reinecke, K. How WEIRD is CHI? In Proceedings of the 2021 CHI Conference on Human Factors in Computing Systems, New York, NY, USA, 8–13 May 2021; pp. 1–14. [Google Scholar] [CrossRef] [Scilit]
- Bennett, M.J. Towards Ethnorelativism: A Developmental Model of Intercultural Sensitivity. In Education for the Intercultural Experience, 2nd ed.; Paige, R.M., Ed.; Intercultural Press: Yarmouth, ME, USA, 1993; pp. 21–71. [Google Scholar]
- Krys, K.; de Almeida, I.; Wasiel, A.; Vignoles, V.L. WEIRD–Confucian Comparisons: Ongoing Cultural Biases in Psychology’s Evidence Base and Some Recommendations for Improving Global Representation. Am. Psychol. 2025, 80, 247–263. [Google Scholar] [CrossRef] [Scilit]
- Muthukrishna, M.; Bell, A.V.; Henrich, J.; Curtin, C.M.; Gedranovich, A.; McInerney, J.; Thue, B. Beyond Western, Educated, Industrial, Rich, and Democratic (WEIRD) Psychology: Measuring and Mapping Scales of Cultural and Psychological Distance. Psychol. Sci. 2020, 31, 678–701. [Google Scholar] [CrossRef] [Scilit]
- Huntington, S.P. The Clash of Civilizations and the Remaking of World Order; Simon & Schuster: New York, NY, USA, 1996. [Google Scholar]
- United Nations Development Programme. Human Development Reports Data Center: Documentation and Downloads. 2025. Available online: https://hdr.undp.org/data-center/documentation-and-downloads (accessed on 17 April 2026).
- The World Bank Group. GDP Per Capita, PPP (Current International $). 2024. Available online: https://data.worldbank.org/indicator/NY.GDP.PCAP.PP.CD (accessed on 17 April 2026).
- The World Bank Group. World Bank Country and Lending Groups. 2025. Available online: https://datahelpdesk.worldbank.org/knowledgebase/articles/906519-world-bank-country-and-lending-groups (accessed on 17 April 2026).
- Freedom House. Freedom in the World 2025: Countries and Territories Scores. 2025. Available online: https://freedomhouse.org/countries/freedom-world/scores (accessed on 17 April 2026).
- Said, E.W. Orientalism; Pantheon Books: New York, NY, USA, 1978. [Google Scholar]
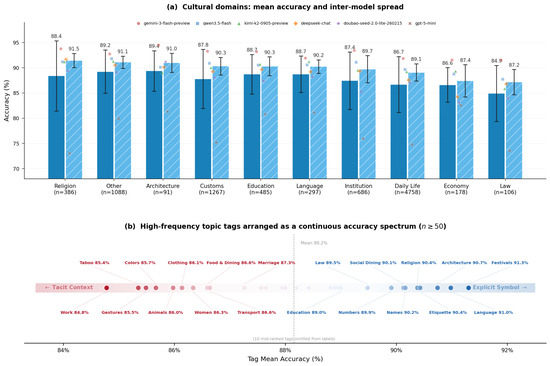
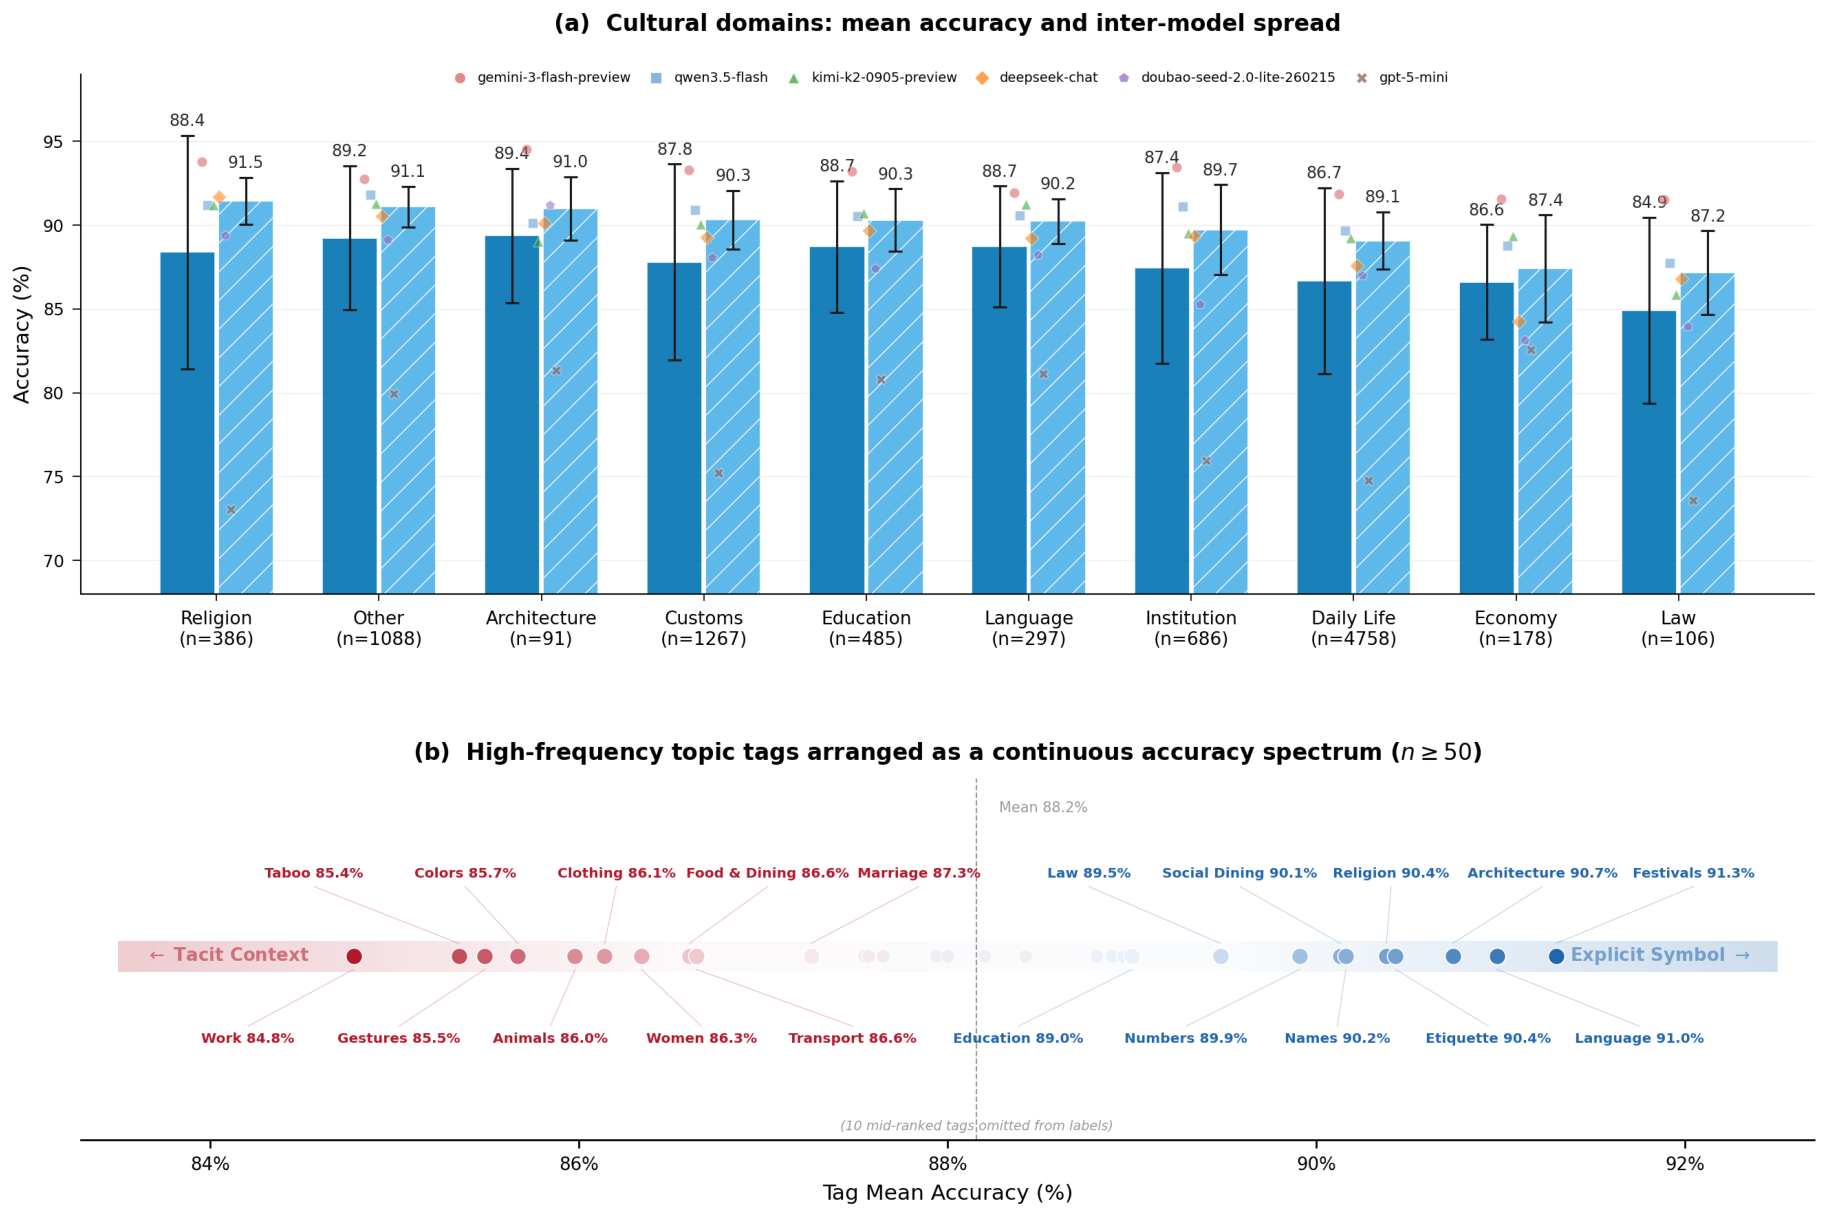
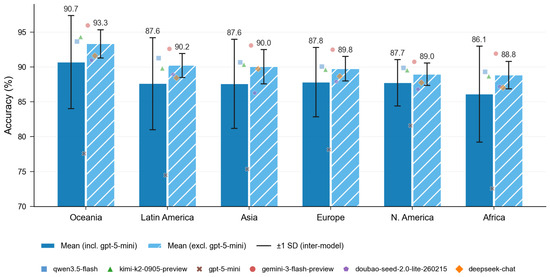
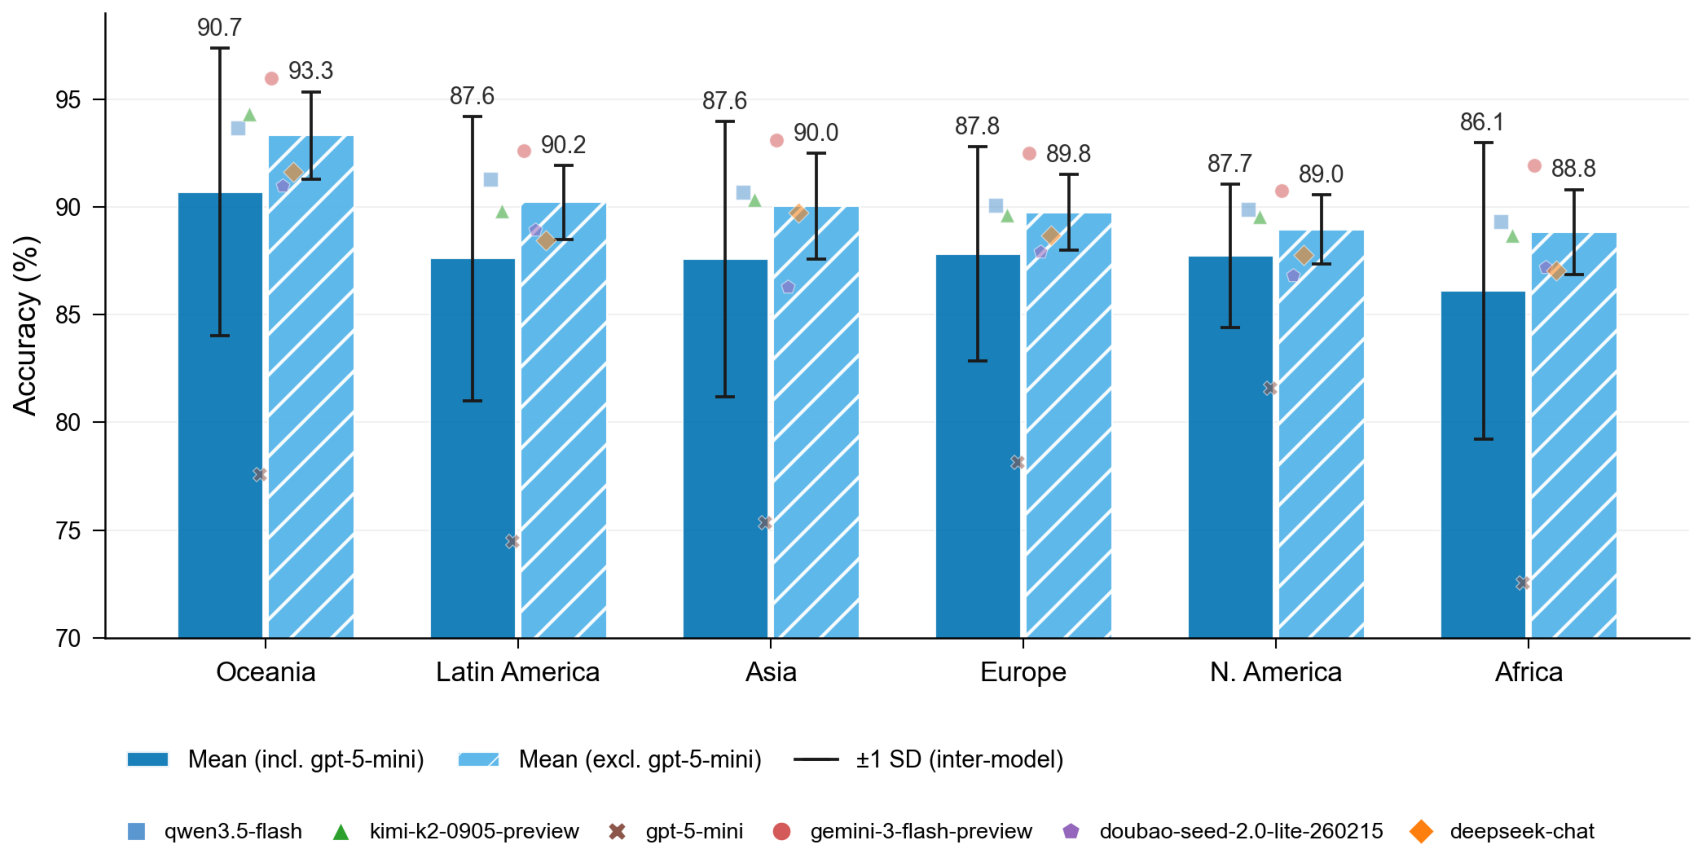
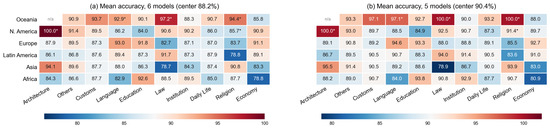
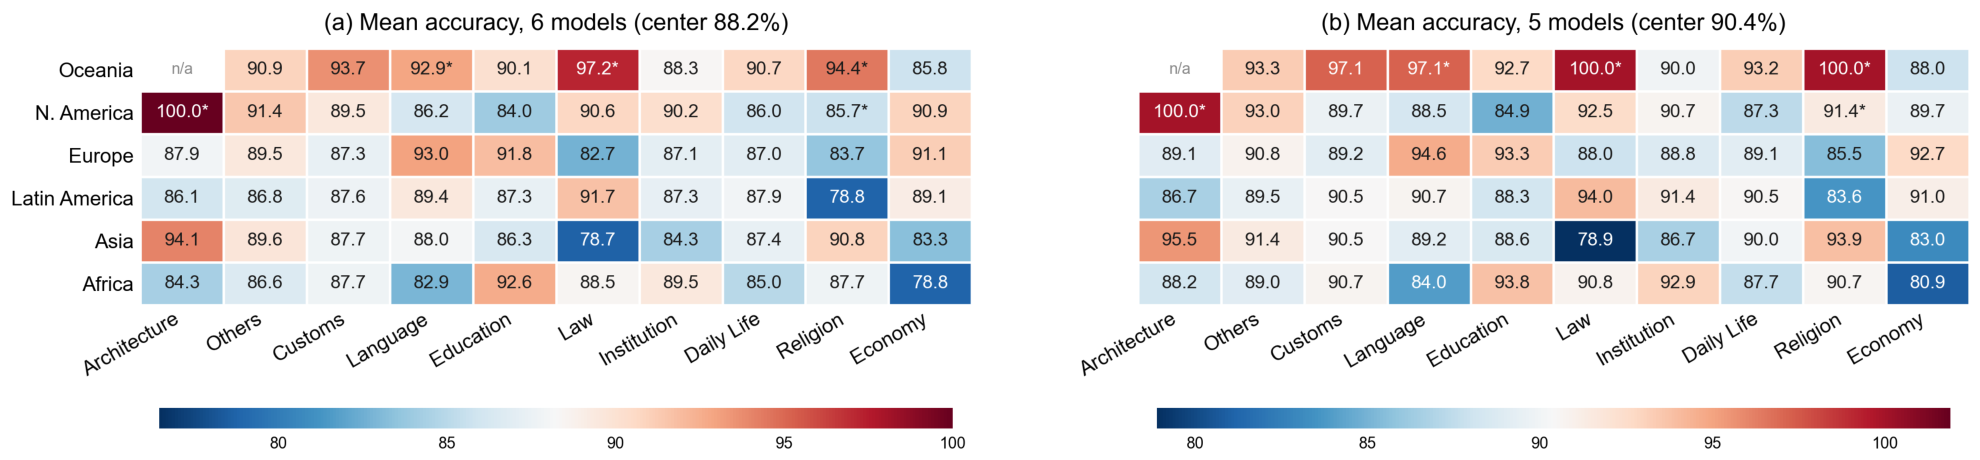
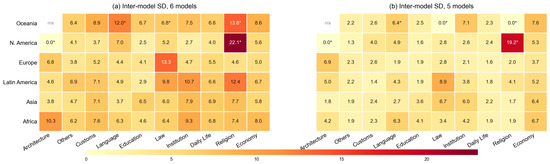
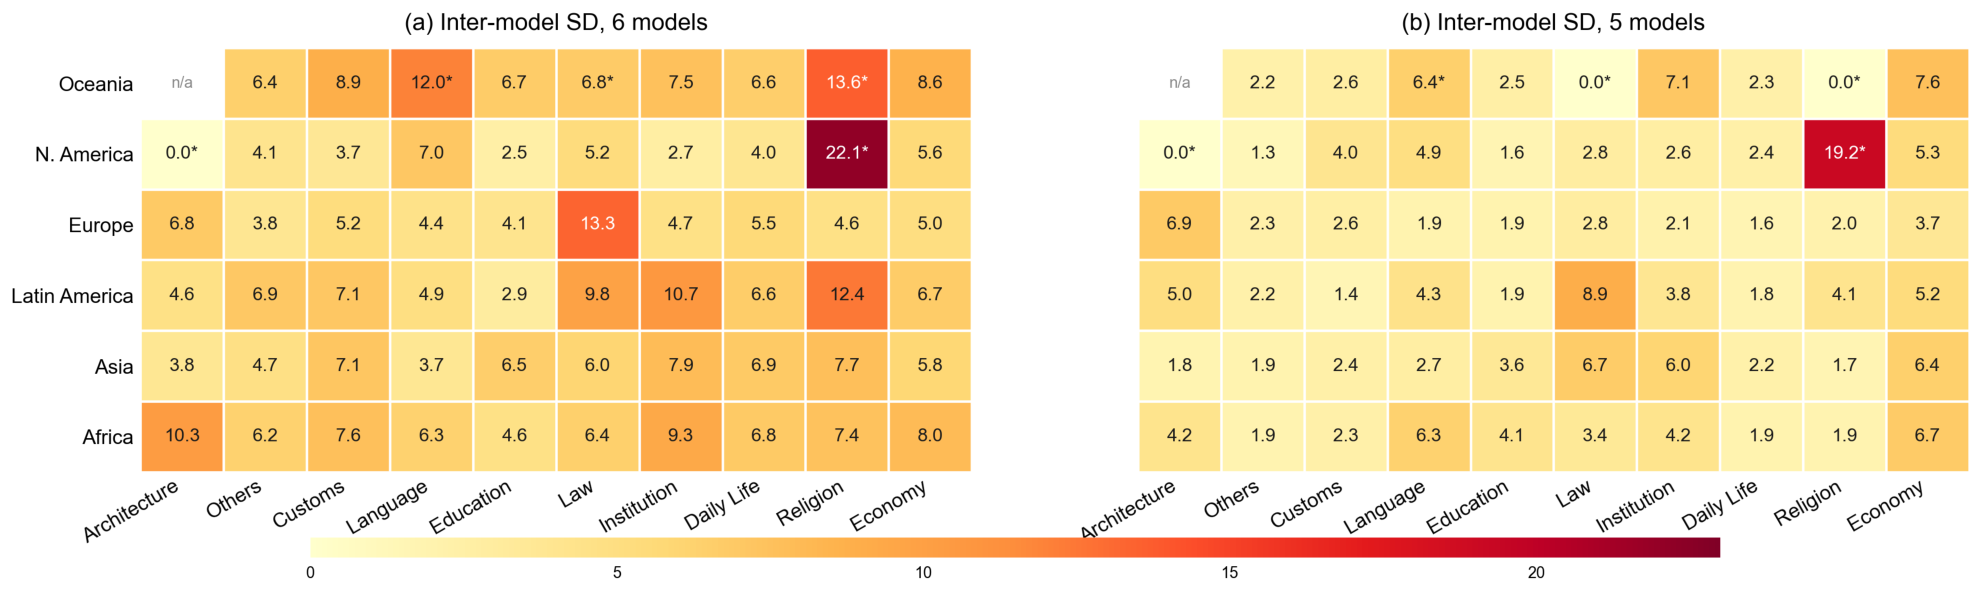
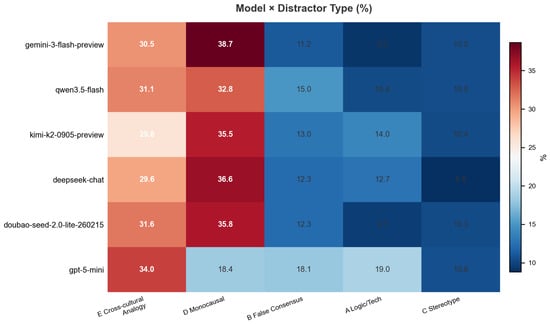
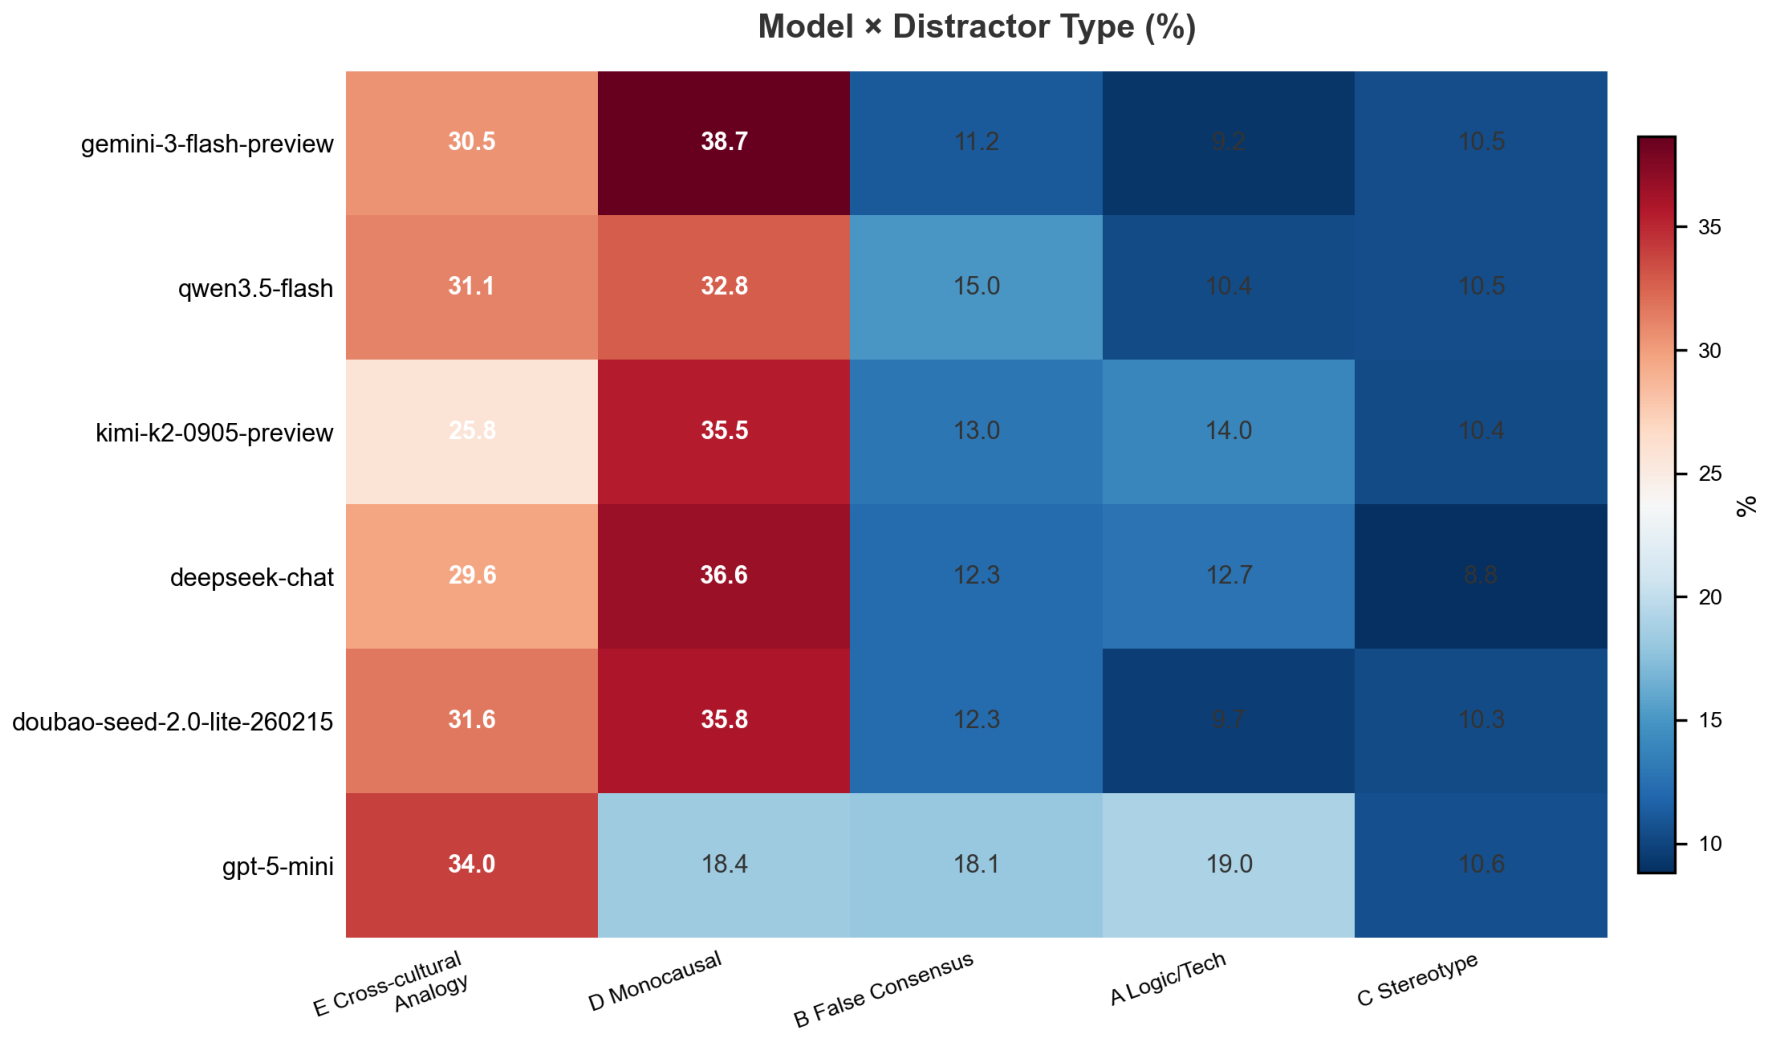
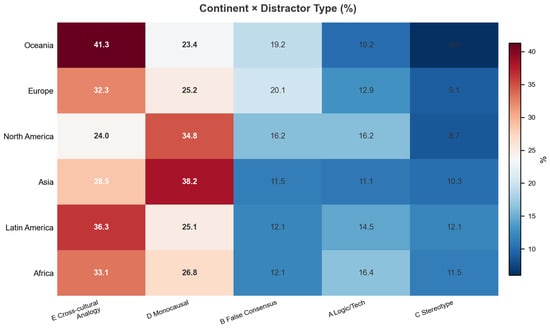
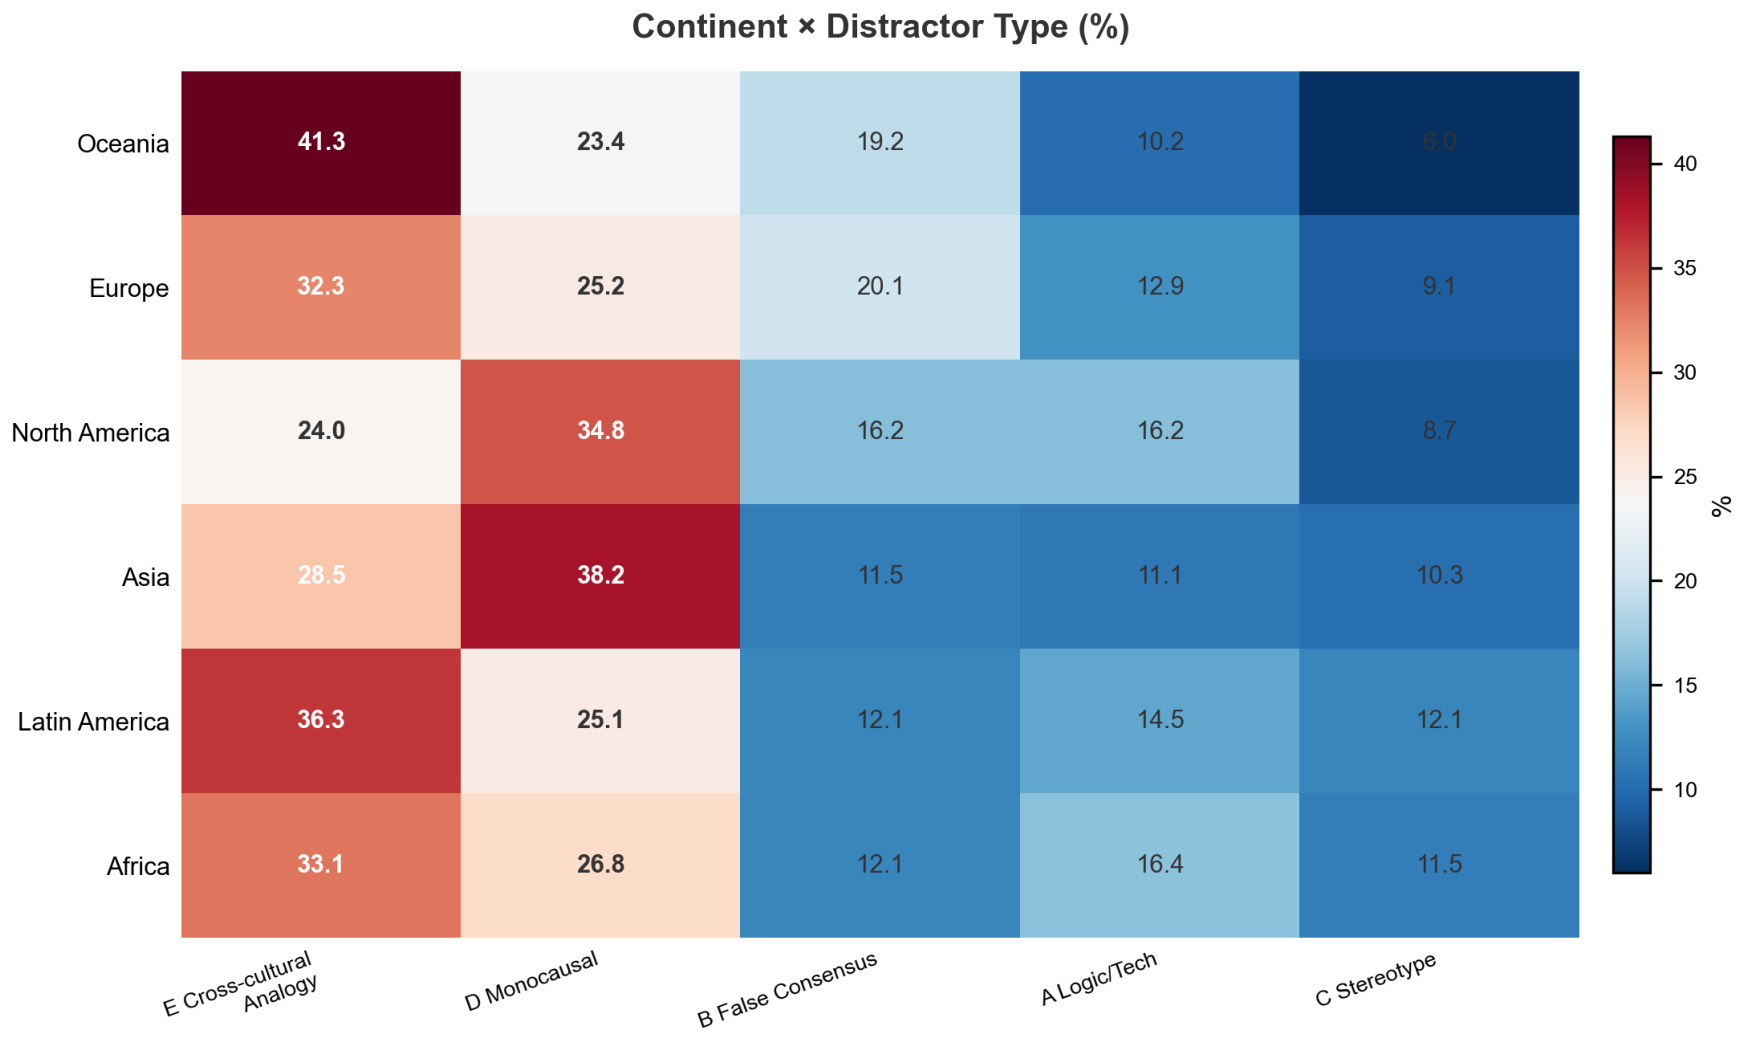
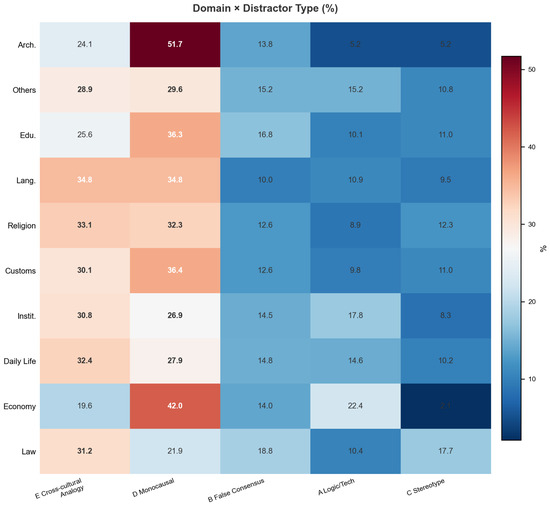
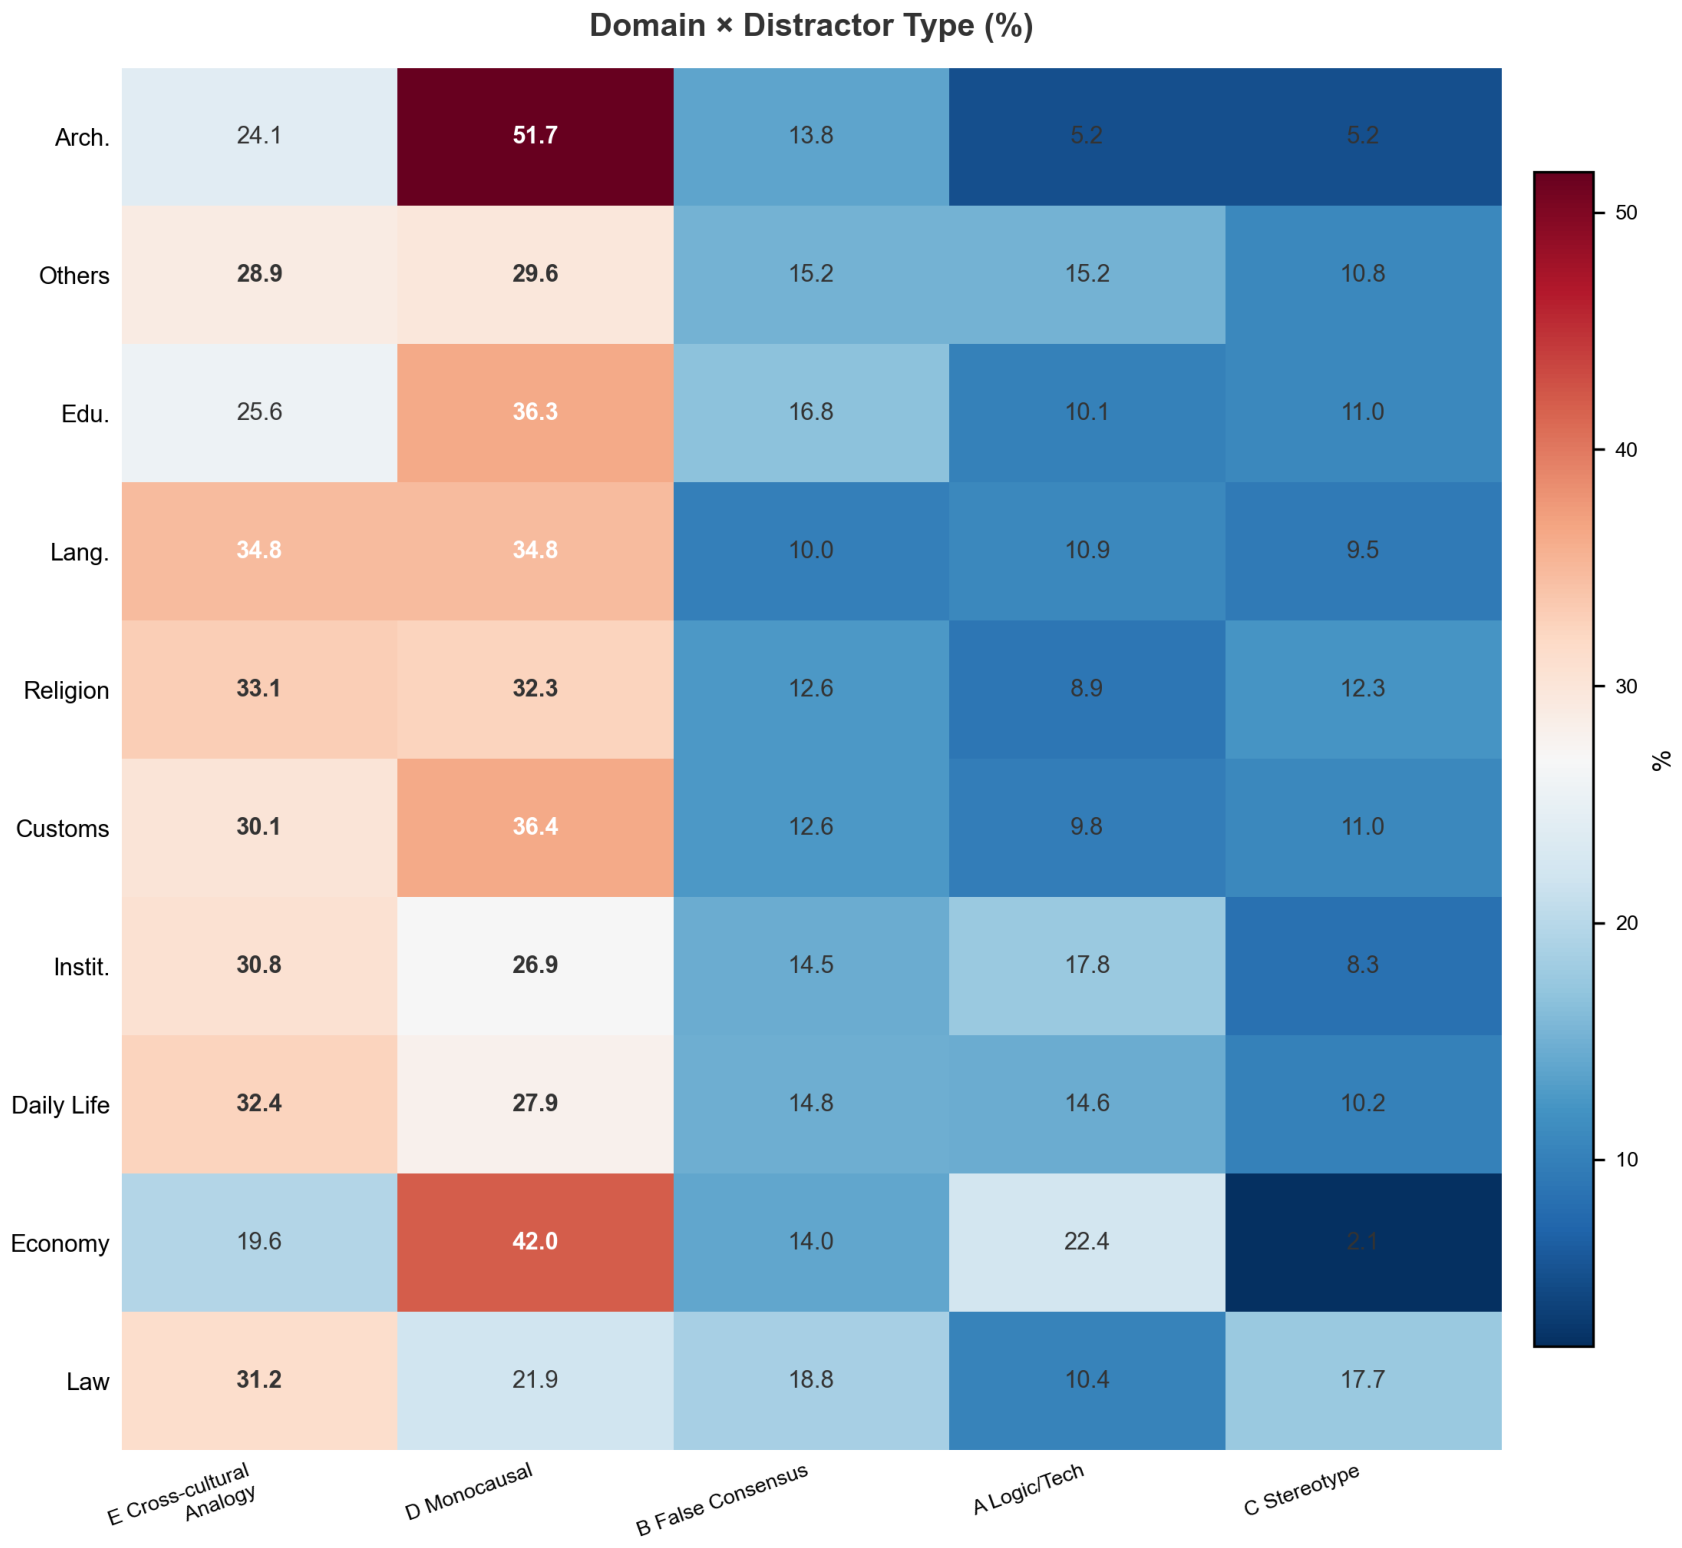

Disclaimer/Publisher’s Note: The statements, opinions and data contained in all publications are solely those of the individual author(s) and contributor(s) and not of MDPI and/or the editor(s). MDPI and/or the editor(s) disclaim responsibility for any injury to people or property resulting from any ideas, methods, instructions or products referred to in the content. |
© 2026 by the authors. Licensee MDPI, Basel, Switzerland. This article is an open access article distributed under the terms and conditions of the Creative Commons Attribution (CC BY) license.