1. Introduction
Technological innovation is the fundamental driving force of high-quality economic development, with emerging technologies serving as a critical manifestation now central to national strategic planning. In the context of a new wave of scientific and technological revolution and accelerating industrial transformation, these forward-looking, strategic technologies possess the potential to both guide industrial innovation and shape a nation’s future competitiveness. As global technological competition intensifies and monopolization in key domains grows, the accurate identification of emerging technologies is essential for securing a strategic advantage. However, the intrinsic uncertainty and complexity of these technologies pose substantial challenges to the assessment and prediction of their developmental trajectories.
The rapid advancement of computer science, electronics, and information technologies has introduced new paradigms for technology identification, particularly those grounded in big data analytics and artificial intelligence. Patents, an extensive and information-intensive corpus, are critical carriers of innovation, yet their sheer volume and informational density make identifying emerging technologies akin to locating a needle in a haystack. Furthermore, existing research often remains focused on macro- and meso-levels, offering limited insight into the intrinsic technological attributes needed for accurate characterization and identification of developmental dynamics.
Against this backdrop, the primary goals of this research are explicitly defined:
Construct a comprehensive high-value patent screening system that integrates multi-dimensional text and indicator features to establish a robust foundation for emerging technology identification.
Develop an interpretable identification framework that leverages high-value patents to build a patent knowledge graph and, through the incorporation of social network analysis, uncovers concept-level technological relationships beyond conventional lexical representations.
Empirically apply and validate the proposed framework in the new energy vehicle sector to reveal potential emerging technologies and provide evidence-based insights to inform technological innovation and policy development.
The subsequent sections of this paper are structured as follows.
Section 2 briefly reviews relevant research on high-value patent identification, patent knowledge graphs, and emerging technology identification.
Section 3 describes the details of the proposed analytical framework and its validation methods.
Section 4 conducts experiments using new energy vehicle as an exemplar field.
Section 5 discusses theoretical and practical implications, and suggests future research directions, followed by the conclusion in
Section 6.
2. Related Work
2.1. High-Value Patent Identification
Patent literature, serving as a critical repository of technical information, is characterized by inherent legal, technical, and economic attributes, which renders the valuation of patent assets a complex and challenging endeavor. Current research endeavors typically evaluate patent value through the establishment of multi-dimensional indicator systems, utilizing methodologies such as the Analytic Hierarchy Process [
1], Factor Analysis [
2], and the Entropy Weight Method [
3]. These methods construct multi-dimensional indicator frameworks, calculating a comprehensive value score based on various aspects, including technology, law, market, economics, strategy, and management. Nevertheless, these indicator systems suffer from a significant reliance on external metrics, thus exhibiting notable limitations in terms of objectivity, scalability, and their capacity to capture the intrinsic technical innovativeness and complexity embedded within the patent itself.
With the rapid development of natural language processing and machine learning techniques, an increasing number of studies have focused on applying these methods to text-based analysis of patent value. By leveraging text vectorization, topic modeling, and other approaches, latent value information within patent texts can be effectively extracted. For instance, Lee et al. [
4] trained a Doc2Vec model to vectorize patent documents and employed methods such as the interquartile range, three-sigma rule, and isolation forest to identify outlier patents. Deng et al. [
5] proposed a patent novelty evaluation method that combines Sentence-BERT with the isolation forest algorithm, integrating text vectorization, anomaly detection, and technical metrics for comprehensive assessment of patent novelty. Song and Ran [
6] utilized topic models to extract the technological themes covered by patents for clustering, and identified high-value and outlier patents based on the Catastrophe Progression Method and outlier factor algorithm.
However, the identification of high-value patents essentially involves the evaluation and prediction of a patent’s potential value. Assessing this potential requires not only the analysis and judgment of a patent’s intrinsic indicator attributes but also the examination of its text features [
7]. This is because the patent text itself contains the most critical information regarding its technological value, legal and market information, and commercial worth. Current research into the identification of high-value patents predominantly concentrates on two distinct approaches: data measurement based on indicator attributes or semantic mining directed at the patent text content. Although some existing literature has attempted to integrate both the indicator features and the text features for a comprehensive value assessment, such combined studies remain relatively scarce.
2.2. Patent Knowledge Graphs
The concept of a knowledge graph was proposed by Google in 2012. Essentially, it is a structured semantic network that connects different entities and their relationships in the form of “entity–relation–entity” triples, thereby constructing a large and complex knowledge network. Existing studies have explored the integration of patent data with knowledge graphs. Some patent knowledge graphs focus on external features of patents. Li et al. [
8] constructed a patent knowledge graph using patent citations, inventors, applicants, and classification information to measure knowledge proximity. Chen and Deng [
9] developed a domain-specific knowledge graph based on patent assignees, inventors, categories, and countries, and proposed an interpretable patent recommendation method. Other knowledge graphs emphasize the deep semantic mining of patent content. Siddharth et al. [
10] extracted engineering fact triples from the syntactic characteristics of patent claims and integrated them into a large-scale engineering knowledge graph, which supports retrieval, representation, reasoning, and inference in engineering design. At present, entity recognition and relation extraction from patent texts have been widely studied [
11,
12,
13], providing a theoretical and technical foundation for the construction of patent knowledge graphs.
2.3. Emerging Technology Identification
A unified consensus on the definition of emerging technologies has yet to be established, and scholars have analyzed and interpreted the concept from different perspectives. Day and Reibstein [
14] first proposed the term “emerging technology” emphasizing its innovativeness and disruptive impact on traditional industries, often leading to the creation of new sectors. Cozzens et al. [
15] argued that emerging technologies are those that demonstrate great potential but have not yet manifested their value or reached any consensus regarding their impact.
Research on emerging technology identification methods generally falls into three categories: qualitative analysis, quantitative analysis, and a combination of both. In terms of qualitative analysis, commonly used methods include the Delphi method [
16], scenario analysis [
17], and the Analytic Hierarchy Process [
18]. These approaches primarily rely on experts’ subjective judgments as criteria for identifying emerging technologies, which may introduce cognitive biases and are less suitable for emerging technology identification in the era of big data.
Quantitative methods, on the other hand, include bibliometrics, patent analysis, and other data-driven approaches. Quantitative approaches can complement the limitations of qualitative methods by providing objective results based on large-scale data. Among them, patent analysis is a representative quantitative method for emerging technology identification and has become a mainstream approach in the field. Other quantitative techniques, such as text mining and network analysis, are increasingly being integrated with patent-based methods.
The application of text mining in emerging technology identification primarily focuses on extracting semantic information from textual data. The two most commonly used approaches are topic model-based methods and structure-semantic analysis-based methods. Hu et al. [
19] developed an LDA2Vec-BERT topic mining model to identify and analyze the evolution of fine-grained emerging and hot technology topics in the blockchain domain. Yun et al. [
20] integrated SAOx extraction, clustering for standardization, sequential pattern mining, and comparative analysis to predict new technology opportunities.
Network analysis methods explore the interaction patterns and development trajectories of technological elements by constructing networks either among patents or among technological features. These networks can be classified into citation networks (including citations, co-citations, and bibliographic coupling), co-occurrence networks, and similarity networks, among others. Ning et al. [
21] constructed a patent citation network and combined the KeyGraph algorithm with CPM analysis to identify emerging technologies. Li et al. [
22] constructed a temporal heterogeneous network, combined with structural and semantic features, to dynamically identify technology opportunities. Zhou et al. [
23] constructed a patent citation coupling matrix and employed cosine similarity to measure patent similarity, further identifying outlier patents within the network as candidate emerging technologies.
Given the potential of knowledge graphs in integrating multi-source information, some researchers have begun to adopt knowledge graph-based approaches combined with deep learning for emerging technology identification, aiming to address the limitations arising from neglecting the semantic information in patent texts, which can affect both the accuracy and interpretability of identification. Lee et al. [
24] constructed a knowledge graph encompassing technologies, new technology-based enterprises, and their investors to reveal the interrelations among these elements in technology opportunity discovery, and proposed a Technology Opportunity Discovery Index to quantify technological potential. Wei et al. [
25] combined knowledge graph techniques with deep neural network algorithms to train an industrial emerging technology identification model, achieving precise identification of emerging technologies in industry. However, the data used in most knowledge graph applications related to emerging technology identification are limited to external patent attributes such as patent titles, types, applicants, inventors, classification codes, or keywords. These studies primarily focus on exploring relationships among patents through knowledge graphs, supplemented by keywords, without deeply mining the fine-grained content of patent documents. From this perspective, there remains substantial research potential for the application of knowledge graphs in this field.
In summary, this study introduces a method that combines indicator-based evaluation with text vectorization for patent value assessment, enabling the selection of high-value patents. A knowledge graph of these high-value patents is then constructed and integrated with social network analysis to identify emerging technologies. By semantically reconstructing patent data, the representation of patent texts shifts from a lexical to a conceptual level, strengthening the semantic associations and logical connections among technological concepts. This method enhances the interpretability of emerging technology identification and provides a solid knowledge foundation for the discovery of prospective technology pathways and the formulation of strategic science and technology decisions.
3. Research Framework
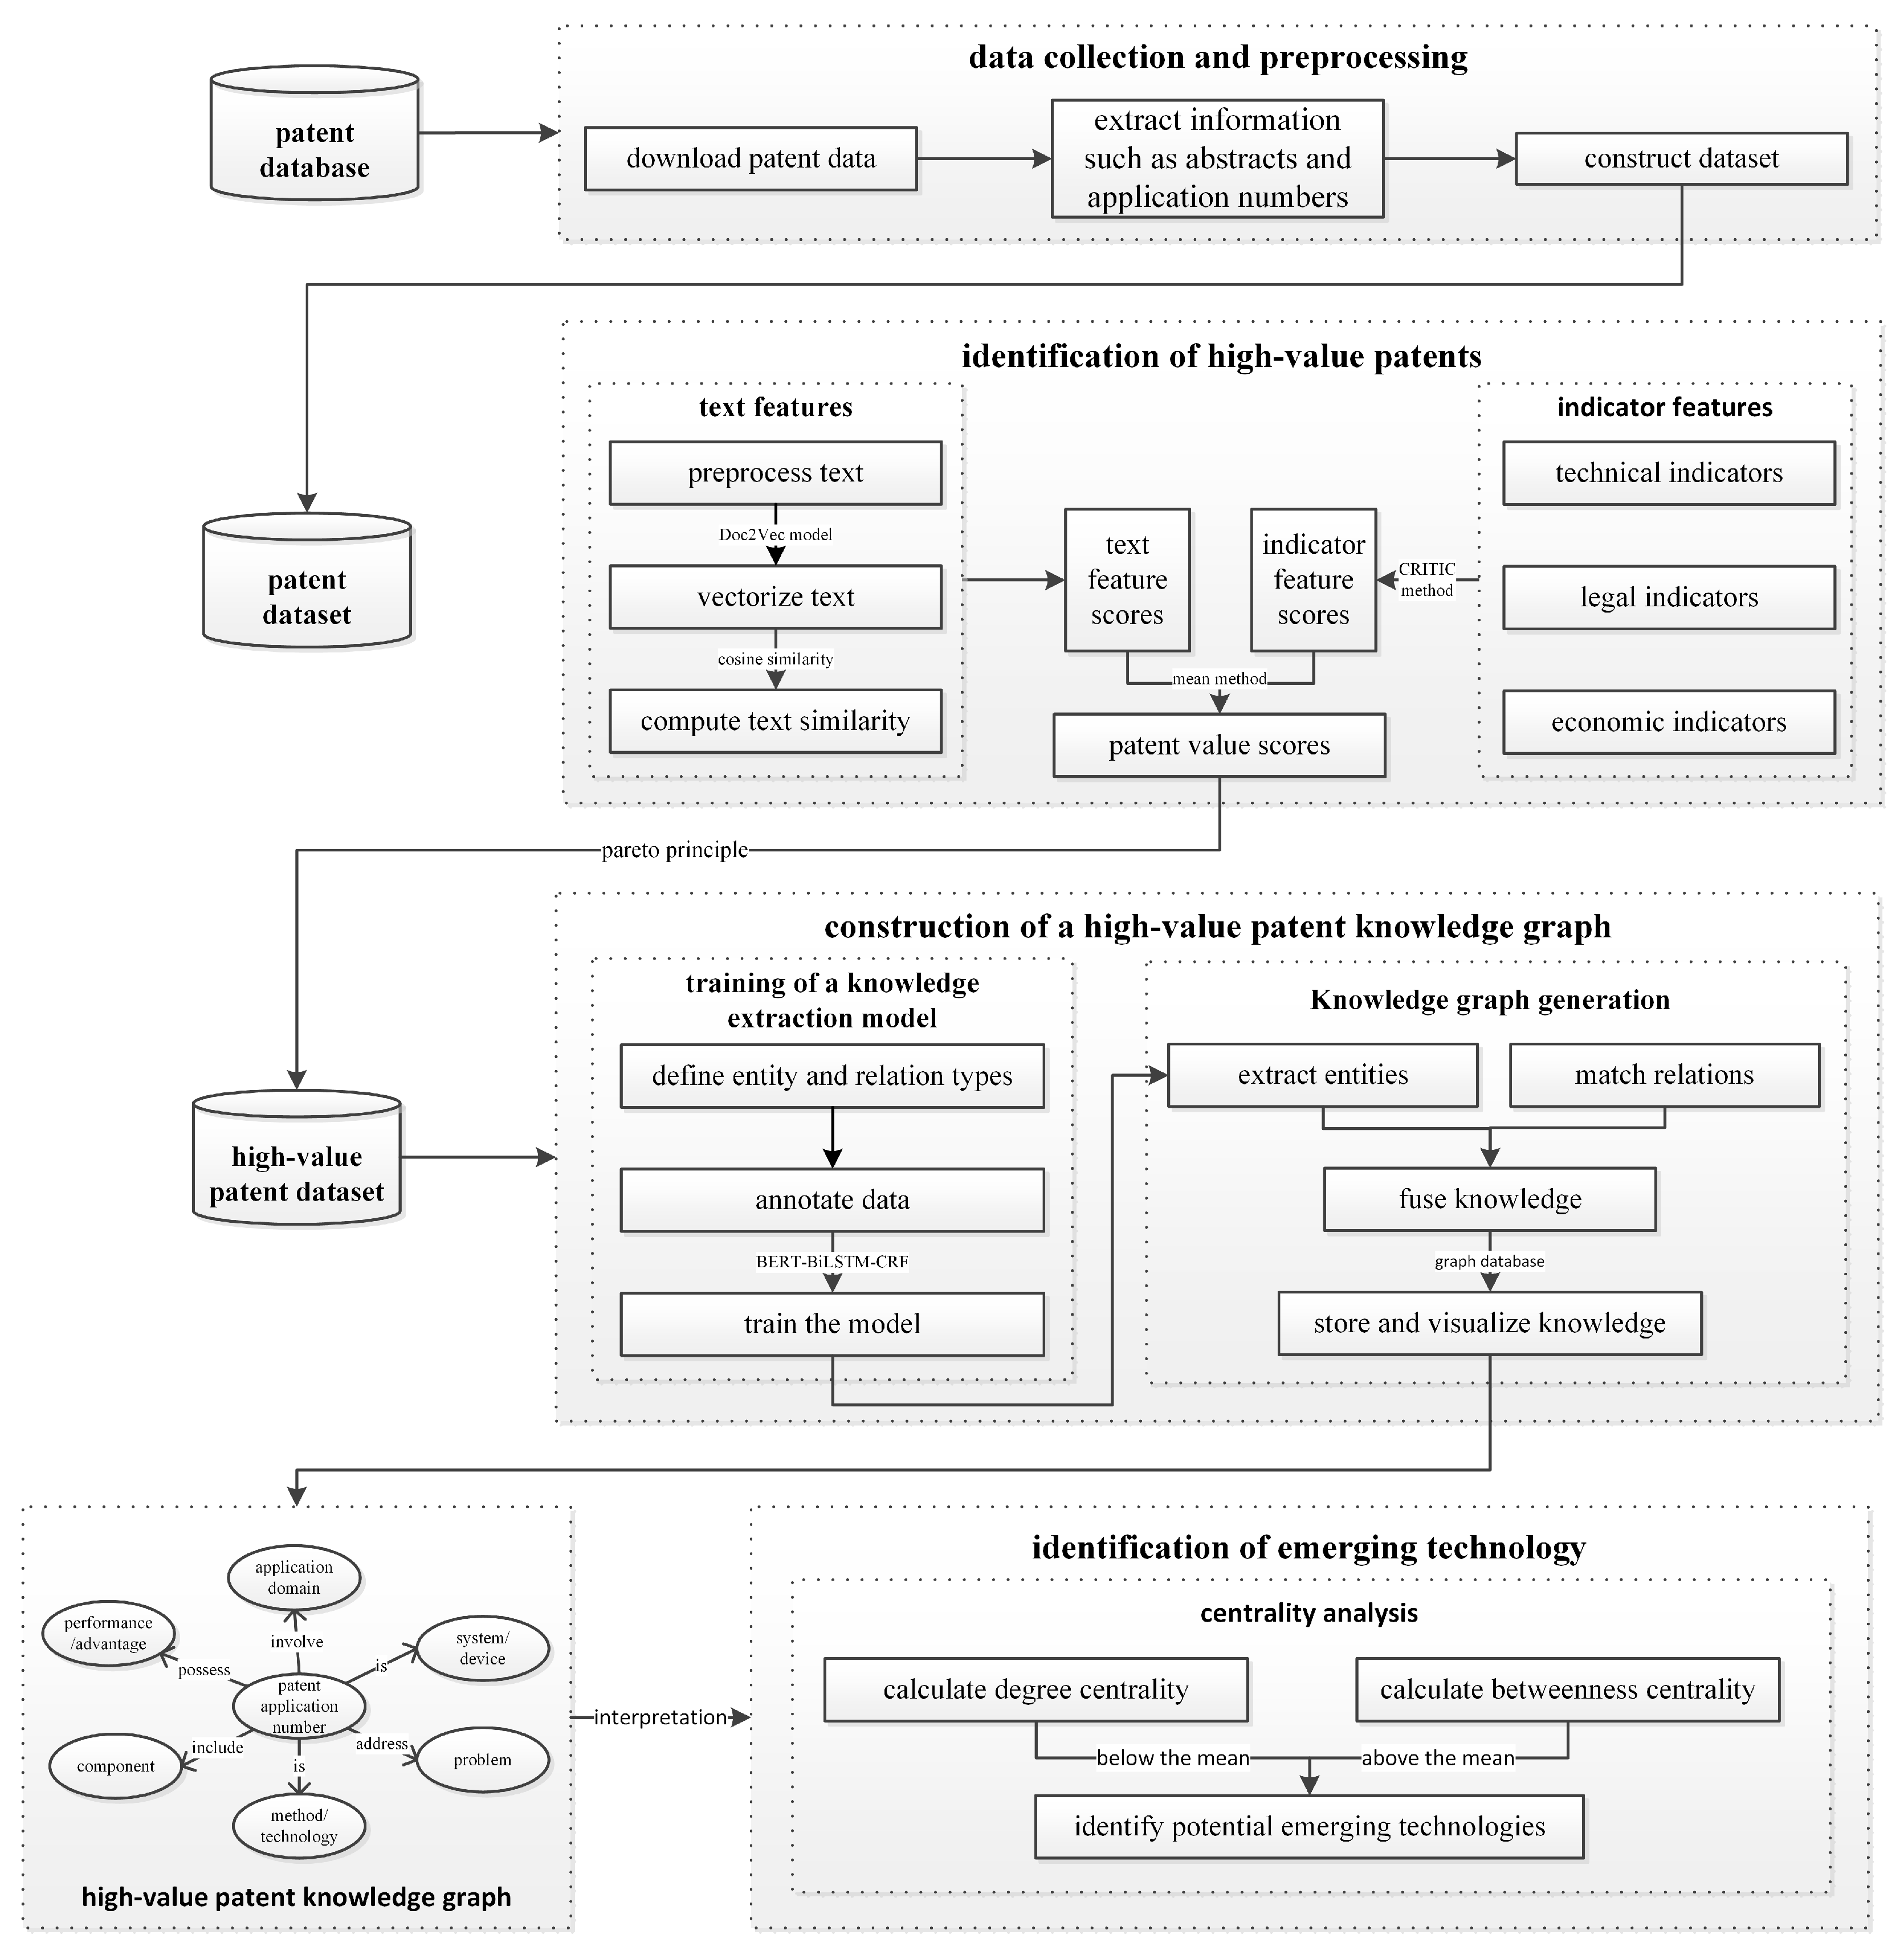
This research framework is divided into four phases—data collection and preprocessing, identification of high-value patents, construction of a high-value patents knowledge graph, and identification of emerging technology—as shown in
Figure 1. Initially, patent data for the target domain is collected. For high-value patent identification, both text features (measuring novelty using Doc2Vec) and indicator features (weighted by the CRITIC method across technical, legal, and economic dimensions) are synthesized, and the Pareto principle is used to select high-value patents. Subsequently, a high-value patent knowledge graph is built using the BERT-BiLSTM-CRF model and rule-based methods, and stored in Neo4j. Finally, through centrality analysis of the knowledge graph, nodes exhibiting low degree centrality but high betweenness centrality are regarded as potential technological opportunities, thereby identifying emerging technologies.
3.1. Multi-Feature-Based High-Value Patent Identification
3.1.1. Text-Based Identification
The Doc2Vec model is a distributed document representation method that can directly transform sentences or paragraphs into fixed-dimensional vectors. It captures contextual semantics and situational information at the levels of words, sentences, and even entire paragraphs. In recent years, some scholars have explored the application of the Doc2Vec model in patent text analysis, such as identifying technological topics [
26,
27,
28] and analyzing patent similarity [
29,
30,
31]. In this study, the Doc2Vec model is employed to vectorize patent abstract texts, after which cosine similarity is used to calculate the similarity between patent abstracts:
where
represents the semantic similarity between patent text
A and the
i-th patent text
;
A and
denote the corresponding semantic vectors of the two patent texts being compared; and
is the angle between these two semantic vectors.
The value of a patent can be measured by its novelty [
32]. Zhang and Tsai [
33] argued that the novelty of a paper is closely related to its most similar paper; the higher the similarity between the two papers, the lower the novelty. This study adopts their proposed method for calculating a novelty index. If a patent is highly similar in textual content to another patent under evaluation, it indicates that the evaluated patent has relatively weak novelty, which may affect its market competitiveness and technological leadership. The maximum similarity can intuitively reflect potential technological overlap or content redundancy and has strong interpretability. Therefore, this study adopts an indicator based on the maximum cosine similarity of patent texts to quantify the value of patent text features:
where
denotes the text feature score of the patent, and
represents the
i-th patent to be compared.
3.1.2. Indicator-Based Identification
The selection of patent value evaluation indicators is a critical step in the assessment model, as their rationality directly affects the accuracy and reliability of the evaluation. Since 1 September 2023, the Recommended National Standard “Guidelines for Patent Evaluation”, formulated by the China National Intellectual Property Administration and relevant organizations, has been implemented, providing an extensible and operational set of indicators for patent value analysis. Drawing on the indicators outlined in the Guidelines and the framework proposed in reference [
34], which encompasses the dimensions of legal value, technical value, and economic value, this study constructs a patent value evaluation indicator system, as shown in
Table 1.
The weights of the indicators were determined using the CRITIC method, and the indicator data were subsequently normalized. The normalized values were then multiplied by their corresponding weights, and the sum of these weighted values was calculated to obtain the final indicator feature score:
where
is the indicator feature score of the patent,
denotes the normalized value of the
j-th evaluation indicator for the
i-th patent,
represents the weight of the
j-th indicator, and
m is the total number of indicators.
3.1.3. Multi-Dimensional Fusion Identification
After calculating scores from both text features and indicator features, this study employs the arithmetic mean to integrate the two types of feature scores, resulting in the final patent value score:
In accordance with the Pareto principle [
35], patents ranking within the top 20% are considered to possess high value.
3.2. High-Value Patent Knowledge Graph
The patent abstract serves as the core of a patent document. Reference [
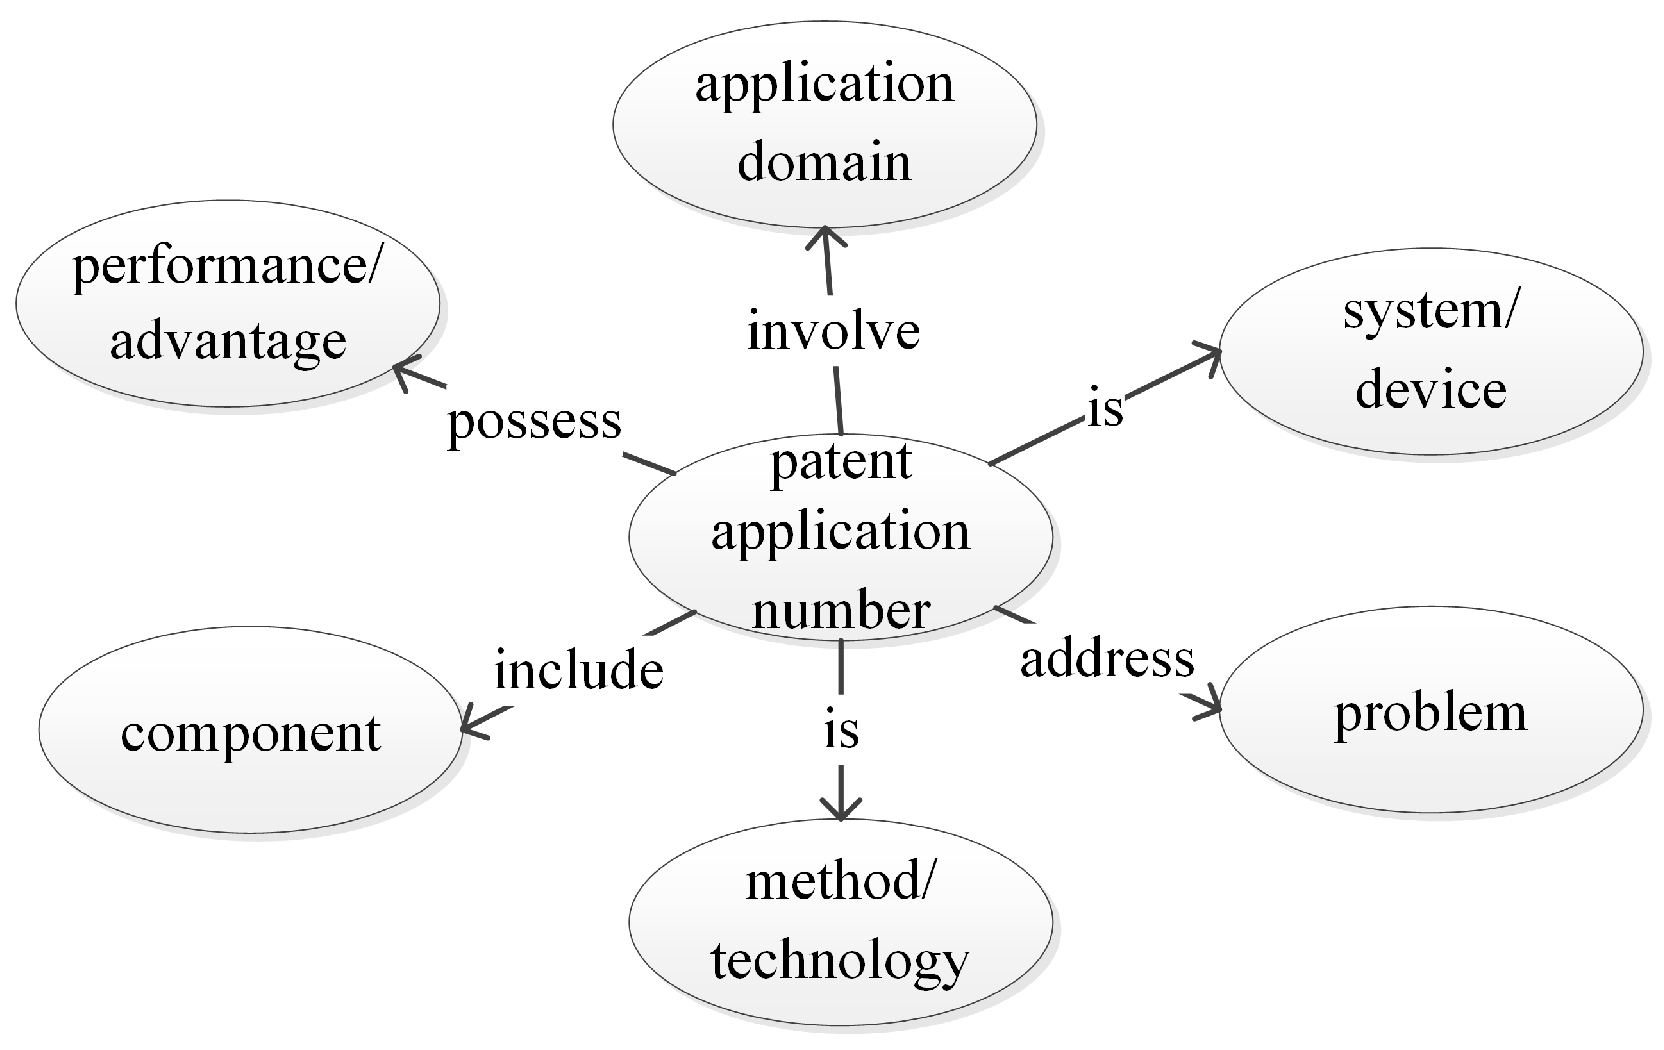
36] summarized that patent abstracts primarily provide a concise description of technical features, including the technical structure, application domains, performance characteristics, and constituent components. Accordingly, this study focuses on extracting four types of knowledge from patent abstracts: technical structure knowledge, application domain knowledge, performance knowledge, and component knowledge. Based on these four categories, seven types of patent entities are defined: patent application number, system/device, method/technology, application domain, performance/advantage, problem, and component. The relationships among these patent entities are categorized as is, involves, possesses, solves, and includes. Building on this framework, this study constructs a conceptual patent knowledge graph from the entities and relationships embedded in patent abstracts, as shown in
Figure 2.
Moreover, the most critical step in constructing a knowledge graph is knowledge extraction. Knowledge extraction from unstructured text typically involves entity recognition and relation extraction. Patent abstract texts are highly specialized, and entity names often exhibit semantic similarity. Therefore, this study employs a BERT-BiLSTM-CRF model for the entity recognition task [
37]. After selecting the entity recognition model, a subset of the corpus is manually annotated for training, and the trained model is subsequently applied to extract entities from unannotated texts. For relation extraction, given that the entity types and relation types in this study are predefined and the relation patterns are relatively fixed, a rule-based approach is adopted to classify the relationships between entity pairs.
After the completion of knowledge extraction, knowledge fusion is conducted. Finally, using Python packages such as pandas and py2neo, all entity–relation data are imported into the Neo4j graph database for storage, thereby completing the construction of the high-value patent knowledge graph.
3.3. Network-Based Emerging Technology Identification
Social network analysis can intuitively reveal knowledge units or knowledge clusters, as well as their structural characteristics and evolutionary patterns, and can be employed to track technological development trends and identify frontier hotspots within specific technological domains [
38]. When combined with the advantages of knowledge graphs in terms of visual representation and semantic association, this approach enables a more systematic elucidation of the network structure among technological knowledge and its evolutionary features. Within this framework, centrality, as a key metric in network analysis, is widely used to assess the significance and influence of knowledge nodes within the graph. By quantitatively analyzing centrality measures, it becomes possible to identify knowledge nodes that occupy critical hub positions in the technological network, thereby facilitating the discovery of potential emerging technologies [
39].
Common centrality measures include degree centrality and betweenness centrality. Degree centrality quantifies the number of immediate neighboring nodes directly connected to a given node. A higher degree centrality indicates that the node is more active within the network, with a greater number of direct connections, and may represent a current research hotspot:
where
denotes the number of edges connecting node
i to existing nodes, and
denotes the total number of edges connecting node
i to all other nodes.
Betweenness centrality measures the position of a node along the shortest paths between other nodes, reflecting its role as a bridge in the flow of information. Nodes with high betweenness centrality may serve as critical intermediaries within the network, controlling the flow of information and knowledge:
where
denotes the number of shortest paths between nodes
s and
t that pass through node
i, and
denotes the total number of shortest paths connecting nodes
s and
t.
In the identification of emerging technologies, these two metrics offer complementary perspectives. Nodes with high degree centrality typically represent current research hotspots that attract widespread attention. In contrast, nodes with high betweenness centrality but low degree centrality may indicate potential emerging technologies [
40]. Such technologies have not yet received broad attention but play a critical bridging role within the knowledge network, potentially exerting significant influence in the future. To establish a quantitative criterion, the mean value of each metric is utilized as the threshold. Nodes scoring above the mean are classified as high centrality, while those below are designated as low centrality, thereby enabling the systematic identification of potential emerging technology nodes.
4. Experiment
4.1. Data Collection and Preprocessing
As one of the representative emerging industries, the new energy vehicle (NEV) sector has experienced rapid development under the strong support of relevant policies and the acceleration of technological advancement. Its market scale continues to expand, and technological pathways are constantly evolving, making it a key domain in global technological competition and industrial upgrading. Therefore, conducting research on emerging technology identification within the NEV sector is highly representative and practically significant, as it helps validate the scientific rigor and practical applicability of the identification methodology.
Using the Innojoy patent database as the data source, and following consultations with domain experts, the specific search formula was determined as: (TA = “New Energy Vehicle”) OR (TA = “Hybrid Vehicle”) OR (TA = “Electric Vehicle”). The retrieval period was set from January 2022 to June 2025, with the search conducted in June 2025. The patent types included Chinese invention patents and utility model patents. After removing duplicate records and patents not relevant to the NEV sector, a total of 17,497 valid patents were obtained.
4.2. High-Value Patent Identification (NEV)
4.2.1. Text Scoring
During the text vector training process, Doc2Vec can be implemented in two modes: DM and DBOW. In the present study, considering factors such as storage efficiency and the relatively short length of the abstract texts after noise reduction, the DBOW mode was selected for training. The experiments were conducted in a Python 3.8 environment using Gensim 4.3.3, with the model parameters summarized in
Table 2.
The trained Doc2Vec model was employed to convert textual documents into vector representations, thereby achieving text vectorization, computing similarities between abstracts, and transforming them using the textual feature scoring formula. Due to space limitations, only the top five patent text feature scores are presented, as shown in
Table 3.
4.2.2. Indicator Scoring
Value-related indicators across the legal, technological, and economic dimensions can be directly obtained from the Innojoy database. A total of 11 indicators were selected to evaluate the patent indicator features. The CRITIC method was employed to calculate objective weights, yielding the weight coefficients of each indicator within the evaluation system shown in
Table 4 and thereby obtaining the patent indicator feature scores.
The results indicate that the weights of different dimensions in patent indicator value assessment differ significantly. The technical dimension dominates, with number of backward citations and number of specification pages as core indicators, reflecting the patents’ innovativeness and technological depth; the legal dimension is represented primarily by the number of claims, reflecting the breadth of protection; and the economic dimension is mainly characterized by the number of inventors, suggesting that team size or collaboration intensity is associated with commercialization potential.
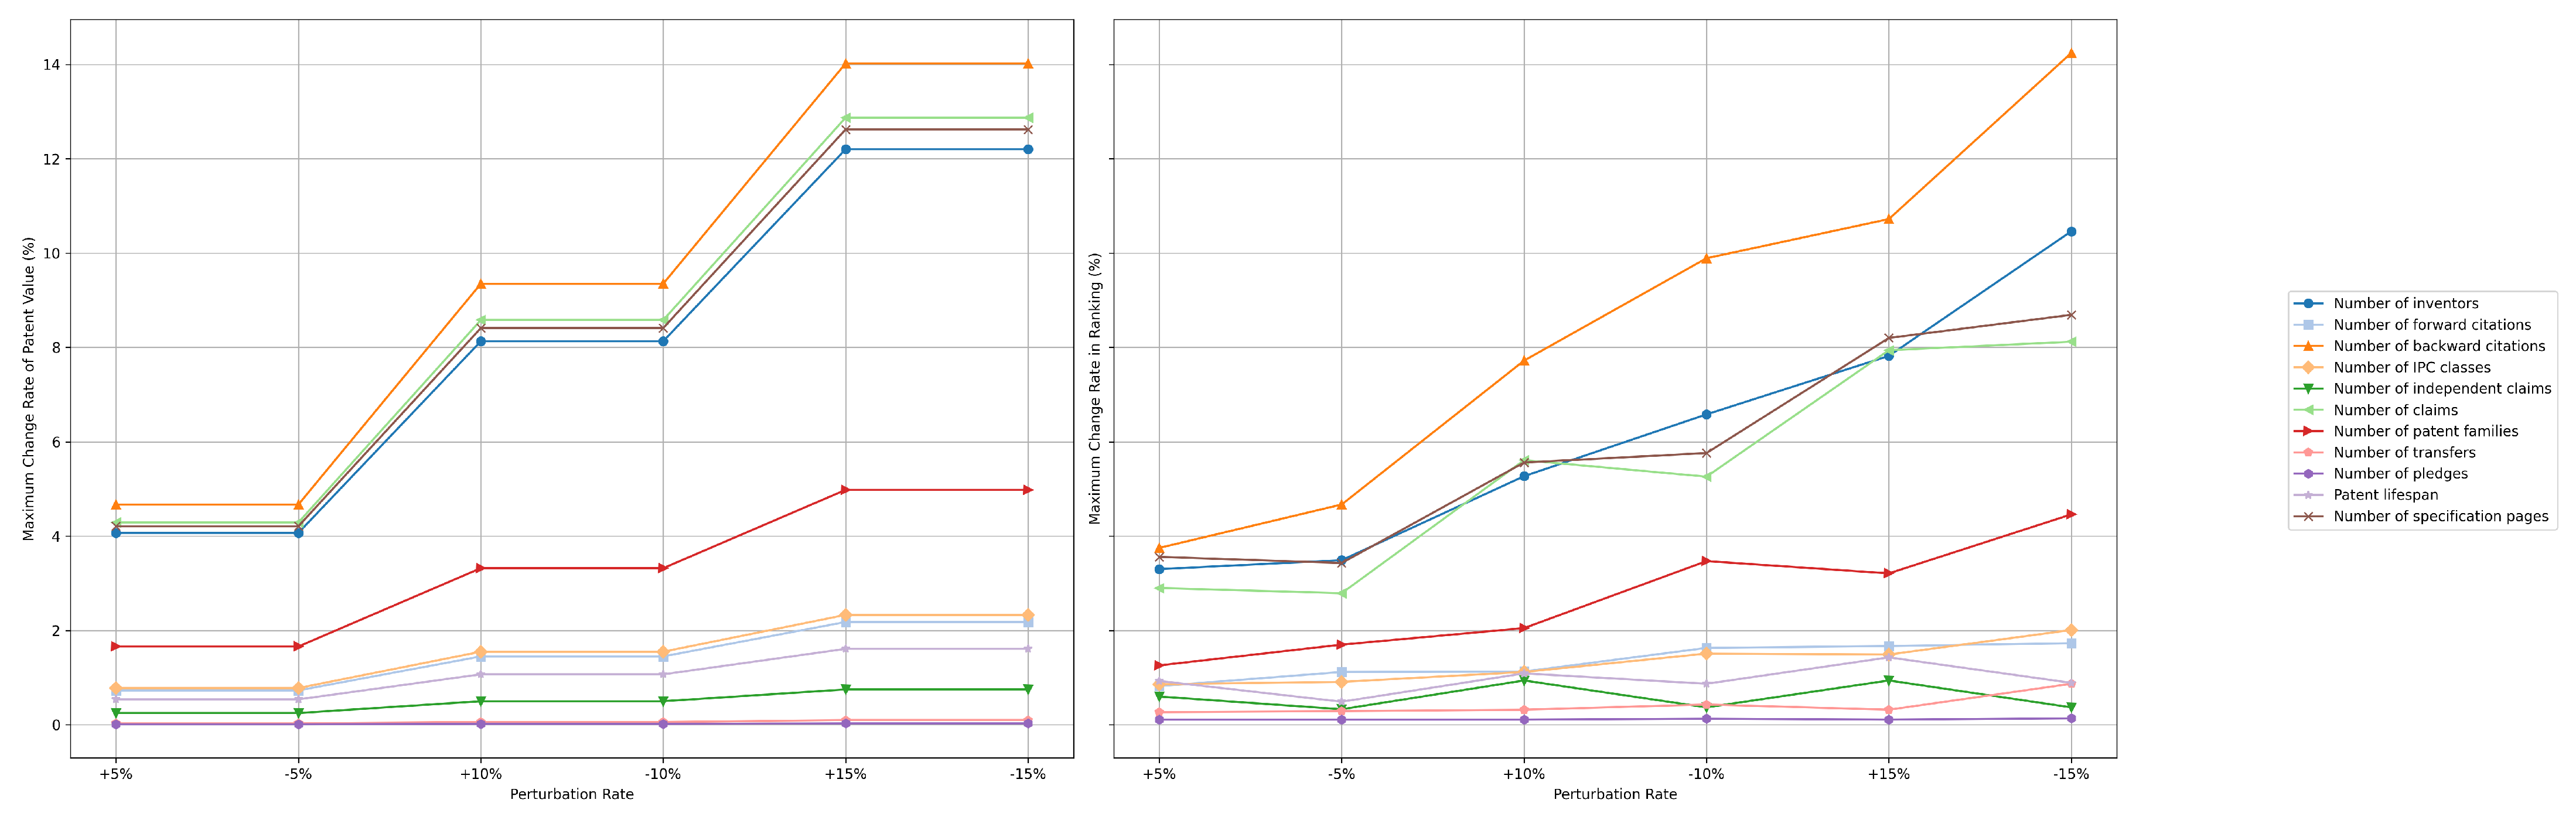
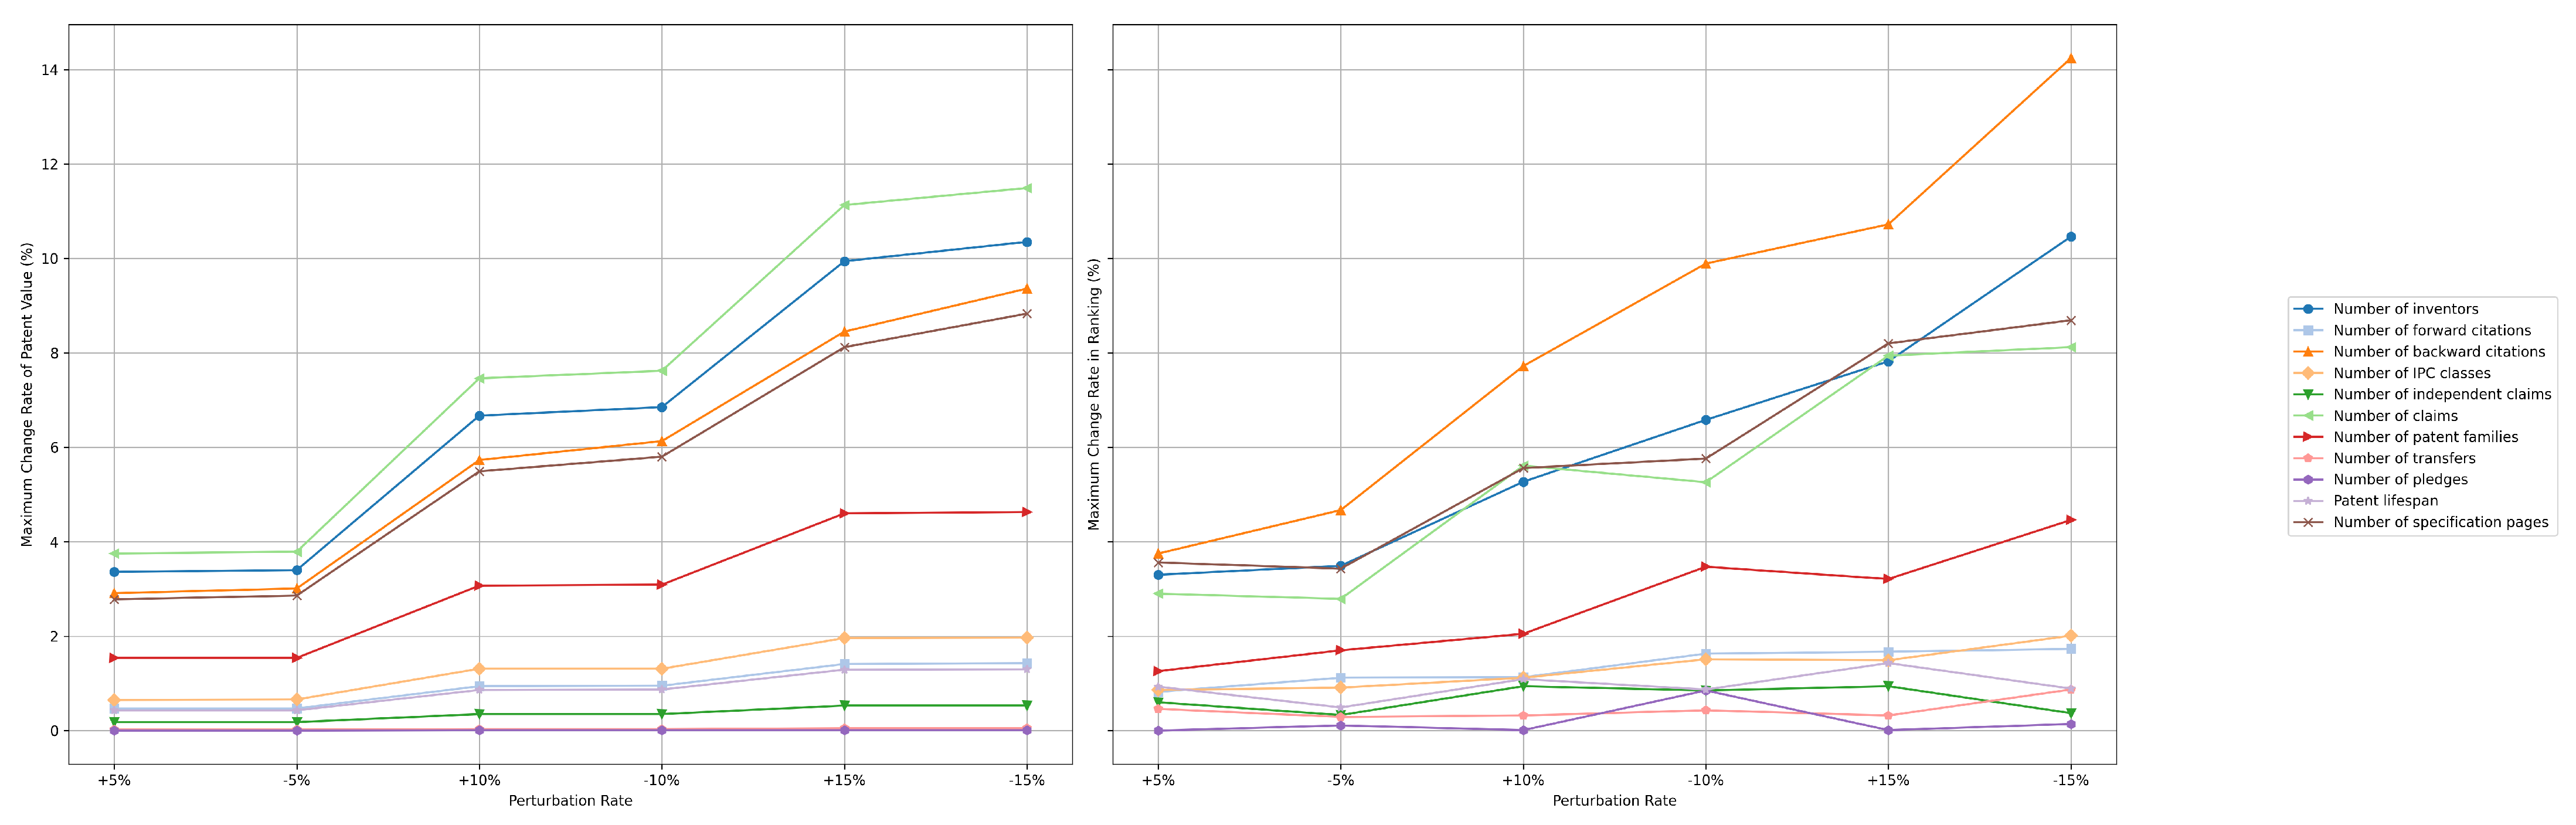
To further verify the robustness of the model, this study conducted a sensitivity analysis of the measurement results from two dimensions: perturbations in indicator data and perturbations in indicator weights. Regarding the perturbation of indicator data, while keeping the indicator weights unchanged, each individual indicator was perturbed by ±5%, ±10%, and ±15% to assess the changes in individual patent values and their rankings. The results show that the Pearson correlation coefficients of patent values and the Spearman correlation coefficients of rankings before and after perturbation were all above 0.99, with the maximum change rate of patent value reaching 14.02% and the maximum change rate in ranking reaching 14.24%, as shown in
Figure 3. Regarding the perturbation of indicator weights, while keeping the indicator data unchanged, the weight of each indicator was perturbed by ±5%, ±10%, and ±15%. The analysis indicates that the Pearson and Spearman correlation coefficients remained above 0.99, with the maximum change rate of patent value at 11.49% and the maximum change rate in ranking at 14.24%, as shown in
Figure 4. Overall, whether perturbing the indicator data or the indicator weights, the calculated patent values and their rankings exhibit high robustness.
4.2.3. Patent Selection
After calculating the scores based on the text features and the indicator features of the patents separately, the comprehensive patent value score was obtained using the averaging method, with a portion of the results presented in
Table 5.
The patents were ranked in descending order according to their comprehensive scores, and, following the Pareto principle, a total of 3500 high-value patents were selected.
4.3. NEV Patent Knowledge Graph
4.3.1. Entities and Relations
This study defines the types of entities and relations to be extracted by considering the technical terms and semantic relationships present in patent abstracts within the field of new energy vehicles, resulting in a total of seven entity categories and six relation types, as shown in
Table 6.
4.3.2. Annotation and Extraction
After identifying 3500 novel high-value patents, 1000 abstracts were selected for manual annotation and verified by domain experts. The annotation corpus employed the “BIO + Named Entity” scheme, where B indicates the beginning of an entity segment, I represents the interior of an entity segment, and O denotes a character that does not belong to any entity. Finally, the manually annotated data were stored in JSON format.
The BERT-BiLSTM-CRF entity extraction model was implemented using the PyTorch deep learning framework and Python 3.8. The parameter settings of the experimental model are presented in
Table 7. During training, the annotated data were split into training and validation sets with a ratio of 8:2.
The model achieved a precision of 0.77, a recall of 0.72, and an F1-score of 0.74 during training. Finally, the trained model was employed to extract entities from unannotated sentences, and a rule-based approach was subsequently used to classify the relationships between entities according to their respective categories, resulting in the generation of high-value patent triplet data.
4.3.3. Integration and Storage
After extracting entities using the BERT-BiLSTM-CRF deep learning model, knowledge integration is required. Knowledge integration refers to the alignment of data to solve the problem where different entity names represent the same entity [
41]. For example, “technical field of new energy vehicle charging” and “new energy vehicle charging technical field” both denote the same entity. In this study, the Jaccard similarity coefficient between entities was calculated to determine whether merging should be performed, thereby avoiding the issue of duplicate nodes representing the same attributes in the construction of the knowledge graph.
Currently, knowledge graphs are primarily stored using RDF-based triple stores or graph databases [
42]. The former excels at managing and publishing large-scale RDF data; however, the presence of extensive redundant descriptions among data can lead to inefficiencies. In contrast, Neo4j, as the most widely used graph database, employs an optimized storage mechanism specifically designed for graph-structured data, enabling both efficient storage and significantly enhanced query performance. Moreover, Neo4j provides a more intuitive visualization of entities and their relational structures within a knowledge graph. Therefore, in this study, the high-value patent data were stored using the Neo4j graph database. Based on the entity and relation types defined in
Table 6, a high-value patent knowledge graph was ultimately constructed, comprising 23,390 entity nodes and 25,611 relationships.
4.4. Emerging Technology Identification (NEV)
A knowledge graph is represented in the form of knowledge triples consisting of nodes and edges. Nodes, representing entities, include information such as patent application number, system/device, application domain, method/technology, component, performance/advantage, and problem. The edges, as a representation of relational structure, delineates the diverse associations among nodes, including is, involve, include, possess, and address. After constructing a high-value patent knowledge graph, social network analysis can be applied using node-level metrics as the analytical entry point. This approach enables the examination of relationships between nodes and external entities, thereby assessing the influence of nodes within the network.
The Neo4j Community Edition version 5.26.0 was used, with the GDS plugin version 2.13.2. Both betweenness centrality and degree centrality algorithms were executed, and centrality values were computed for all nodes. Here, system/device and method/technology entities with betweenness centrality above the mean and degree centrality below the mean are selected for presentation, as shown in
Table 8.
In subsequent analyses, conditional queries were performed using Neo4j’s query language. For example: MATCH (a)-[rel*1..2]-(b) WITH [‘wireless charging method’, ‘charging method’, ‘dynamic wireless charging system’, ‘charge–discharge scheduling method’] AS nodeNames, a, rel, b WHERE a.name IN nodeNames RETURN a, rel, b. This approach enables the retrieval of the high-value patent knowledge graph and, by leveraging its rich semantic information, facilitates the analysis of potential technological opportunities, thereby enhancing the interpretability of emerging technology identification.
4.5. Result Evaluation
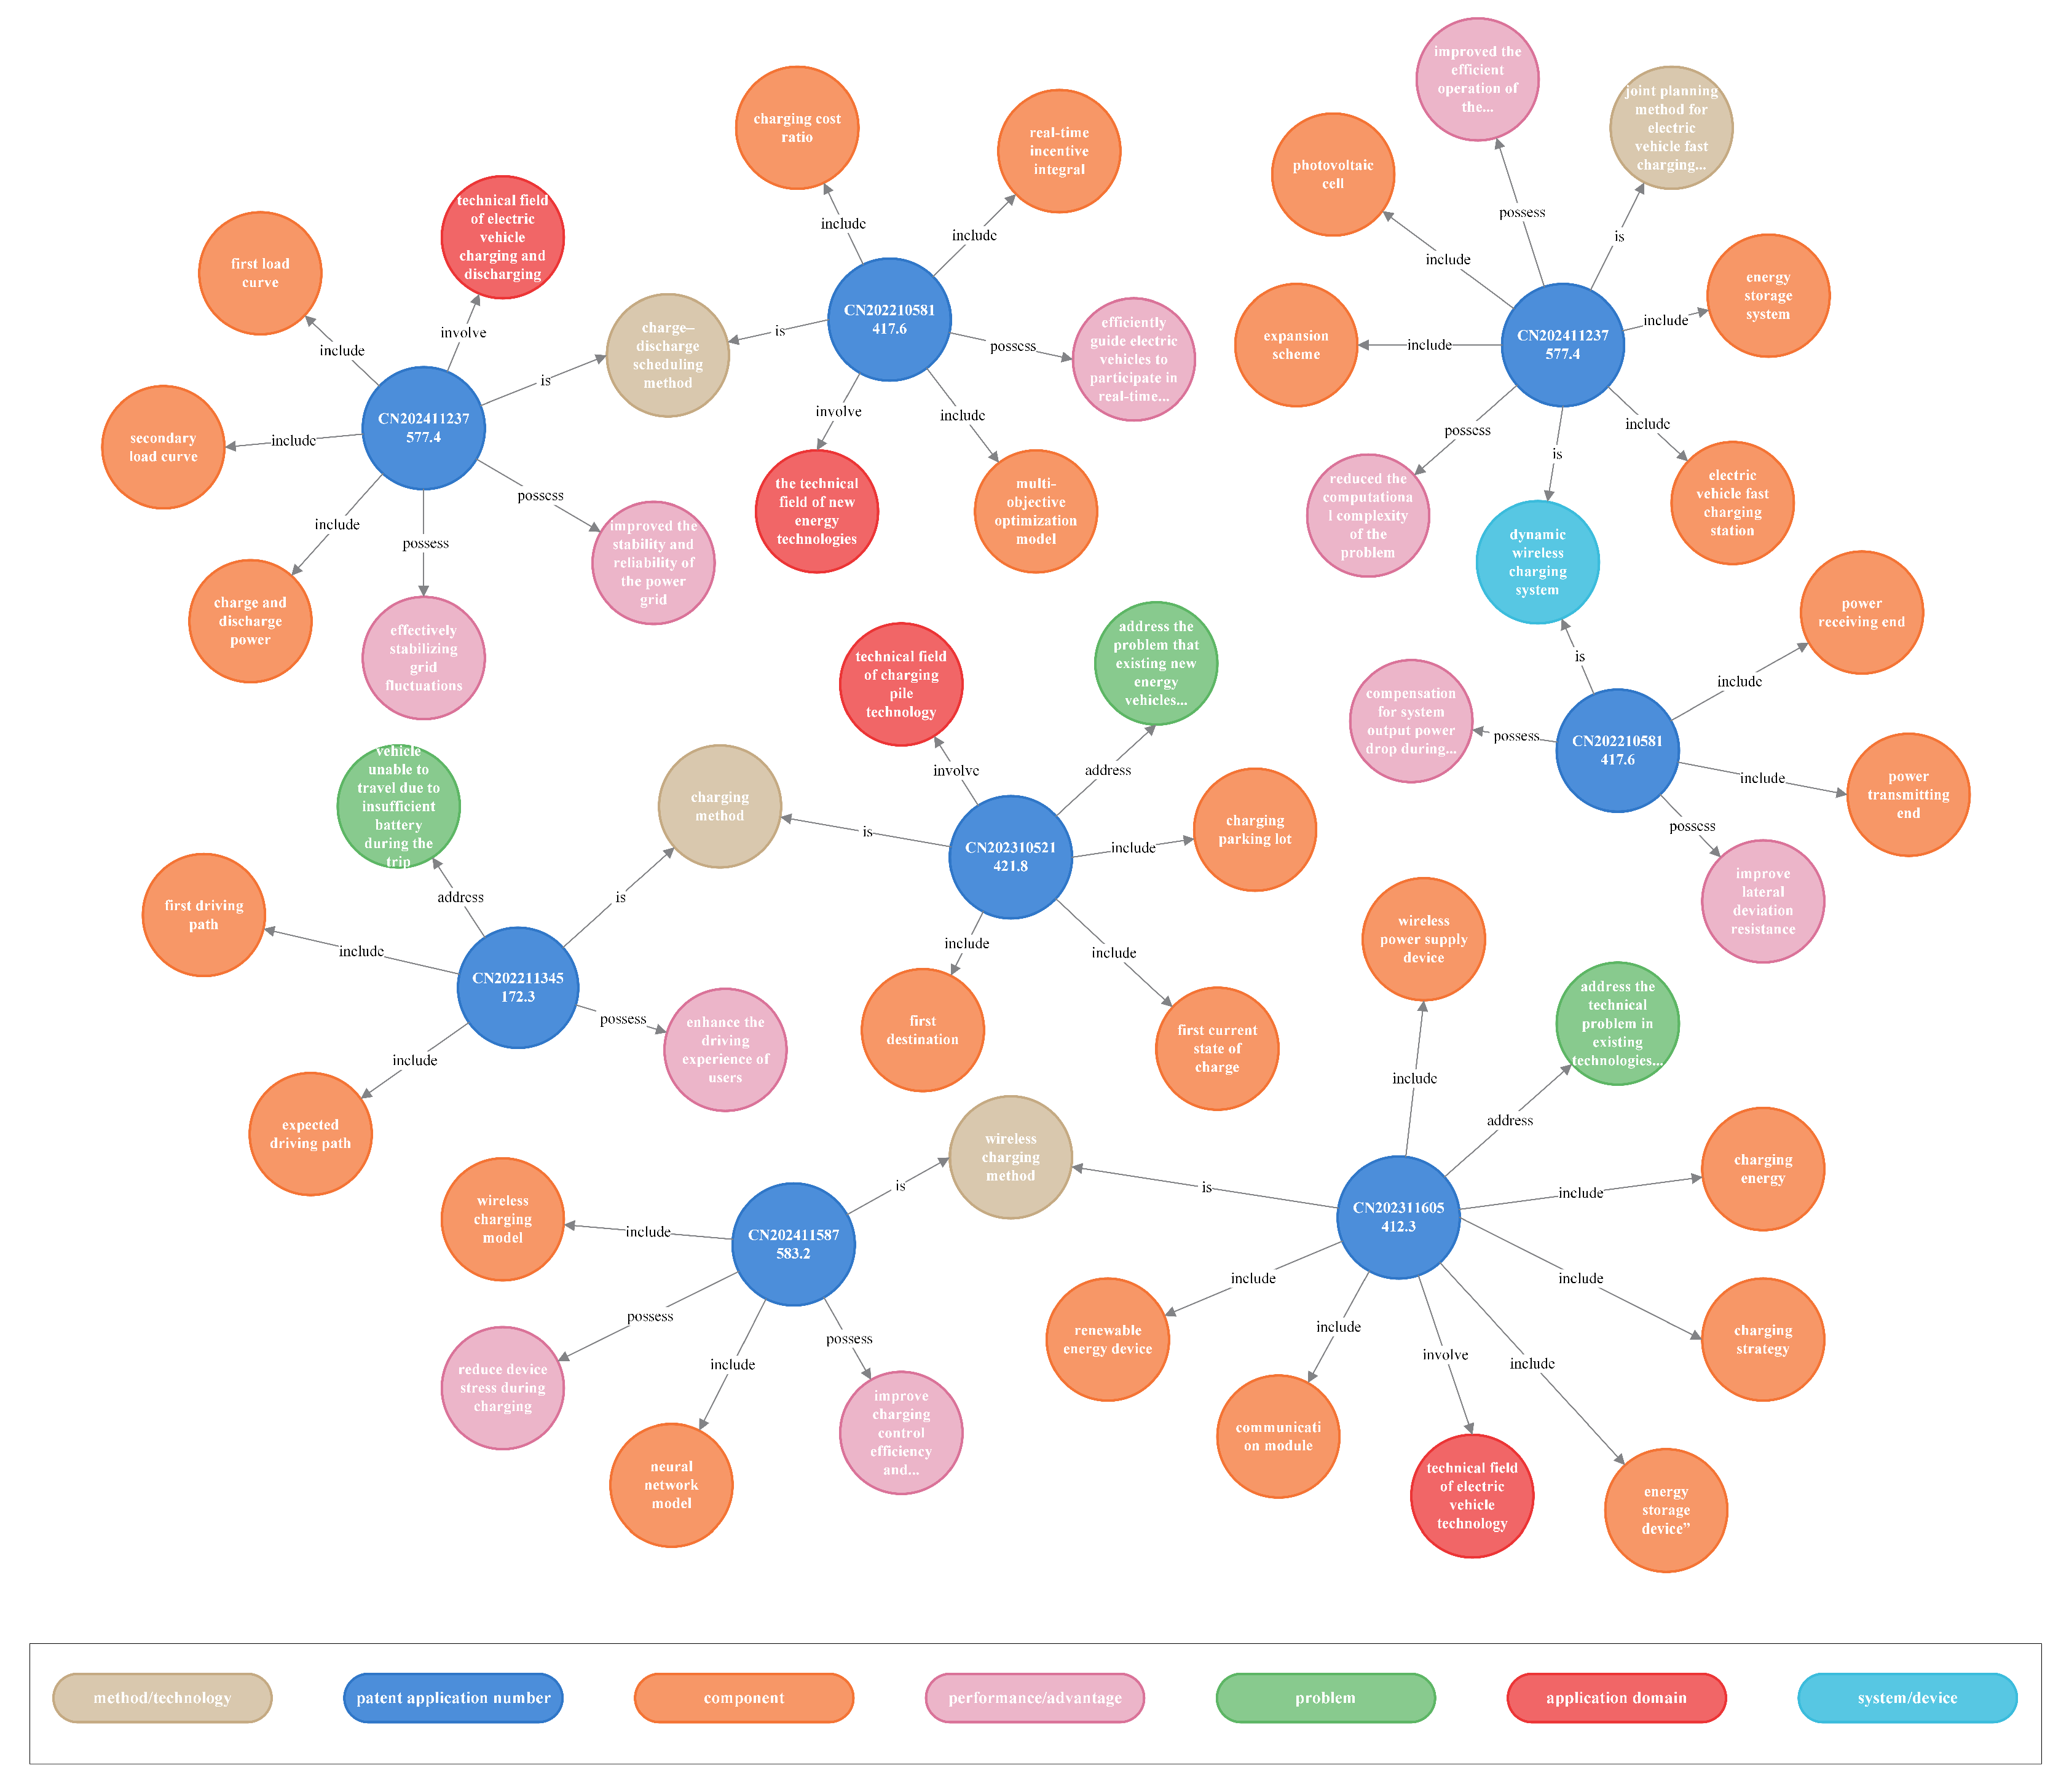
Taking the nodes “wireless charging methods,” “charging methods,” “dynamic wireless charging systems,” and “charge–discharge scheduling methods” as examples, the conditional query results are shown in
Figure 5. The nodes presented in the figure not only cover these core technologies but also include related auxiliary technologies, such as “neural network model,” “joint planning methods for electric vehicle fast-charging stations and dynamic wireless charging systems,” and “load curve.” This suggests that the future development of charging technologies for new energy vehicles is trending toward higher efficiency and wireless solutions. Specifically, wireless charging technology, combined with neural network models, optimizes charging control to enhance charging efficiency and reduce voltage and current fluctuations, achieving smoother energy transfer. Dynamic wireless charging systems, coordinated with fast-charging station planning, optimize the layout of charging infrastructure, improving charging flexibility and energy utilization. Intelligent charge–discharge scheduling methods, based on grid load data and vehicle status, guide vehicles to charge during off-peak periods, achieving peak shaving and valley filling, and thereby stabilizing grid operation.
To validate the effectiveness of the above results, this study retrieved authoritative national-level policy documents and industry reports to provide objective and reliable references for verifying the identified emerging technologies, as show in
Table 9, thereby minimizing subjective bias.
5. Discussions
This study develops an emerging technology identification model following the logical process of “data collection and preprocessing— identification of high-value patents—construction of a high-value patent knowledge graph—identification of emerging technology.” During the research, a standardized workflow from high-value patent screening to potential emerging technology recognition was established by leveraging Doc2Vec for text modeling, the CRITIC method, the BERT-BiLSTM-CRF entity extraction model, and centrality calculations. This approach provides both theoretical support and practical guidance for enterprises in formulating technology innovation strategies, as well as for national-level planning of scientific and technological development and the formulation of industrial policies.
Theoretically, this study advances the understanding and methodology of technology identification. A significant achievement is the successful development and application of a comprehensive high-value patent screening system. This system is robust because it integrates both text features and indicator features, moving beyond the reliance on single metrics to provide a more holistic and authoritative measure of patent value, which is crucial for building a foundation for subsequent analysis. The most notable theoretical innovation is the proposed methodology that leverages high-value patents to construct a knowledge graph followed by social network analysis for identifying emerging technologies. This approach achieves semantic reconstruction of patent data, elevating the representation from a mere lexical level to a conceptual level. By utilizing the rich semantic relationships captured within the knowledge graph, the model significantly enhances the semantic correlations and logical connections between technical concepts. This directly mitigates the weak interpretability inherent in many existing black-box or purely statistical methods. Specifically, the mechanism of identifying nodes with low degree centrality but high betweenness centrality as potential technological opportunities is theoretically sound, as it spots niche but highly connective concepts that are often indicative of emergent areas.
In practical terms, the established workflow offers immediate and valuable utility for various stakeholders. For enterprises, the model provides a structured and systematic tool for monitoring their competitive technological landscape. By identifying high-value patents, the system helps R&D departments focus resources on the most promising areas. The final recognition of potential emerging technologies allows companies to proactively adjust their technology roadmap, leading to informed decisions regarding investment and long-term strategic planning. Furthermore, this study took the new energy vehicle sector as its empirical object, and the results show that potential emerging technologies in this field are mainly concentrated in charging technologies, battery management technologies, vehicle control, power systems, manufacturing equipment and inspection tooling, and battery swapping facilities. All the above research findings are supported by existing policies. The findings offer direct, evidence-based guidance for national-level planning of scientific and technological development. Government agencies can utilize the identified clusters to formulate targeted industrial policies, providing significant reference value for technological innovation in this field.
Certainly, the emerging technology identification model proposed in this study has several limitations. Regarding the comprehensiveness of data sources and the control of potential biases, this study relies primarily on patent data and does not incorporate non-patent sources such as academic publications, industry reports, or policy documents. Consequently, the model may lag in identifying frontier technologies that are still at the basic research stage and have not yet been reflected in patent portfolios. Moreover, the distribution of patent data across institutions is uneven, with large enterprises often dominating due to their financial resources and intellectual property strategies, potentially reducing the model’s sensitivity to innovations from smaller companies or research institutions. In addition, as the sample data are predominantly derived from Chinese patents, the study may be subject to geographic and language biases, limiting its ability to fully capture global technological dynamics. With respect to the generalizability of the research framework, this study focuses solely on the field of new energy vehicles, and the selection of the domain is not sufficiently comprehensive. Future work should integrate multi-source data, mitigate biases, and broaden the methodology across technological fields to enhance the accuracy and generalizability of emerging technology identification.
6. Conclusions
Technology identification is crucial for maintaining a leading position in a rapidly evolving technological environment. This study constructs an emerging technology identification framework that identifies potential emerging technologies through the systematic analysis of patents. The framework achieves methodological innovation by integrating textual features and indicator-based features at the patent screening stage, and by constructing a knowledge graph based on high-value patents, further incorporating social network analysis methods to identify emerging technology nodes. To ensure the feasibility and stability of the framework in practical applications, this study adopts a modular, step-by-step analytical strategy, thereby efficiently supporting the in-depth processing of large-scale patent data. At the same time, through a high-value patent screening mechanism, the computational complexity of knowledge graph construction and network analysis is effectively reduced, improving overall computational efficiency. An empirical study in the field of new energy vehicles shows that the emerging technologies identified by this framework are highly consistent with current policy orientations and industrial development practices, verifying the effectiveness and practicality of the proposed method. This research contributes both theoretically, advancing technology identification methodology, and practically, offering valuable guidance for enterprises and national planning.