


Abstract
The rapid development of online learning platforms has made human–computer interaction increasingly important in modern educational and work environments. However, task-oriented interactive experiences remain underexplored, particularly slide-presentation tasks involving university students acting as presenters. In this study, 61 university students (aged 19–23) completed three eye-tracking sub-experiments embedded in online slide-presentation and speaking tasks; eye-movement and questionnaire data were collected to investigate interface layout, emoji use, visualization of audience feedback, and personal status assessment design. Results show that the horizontal layout enabled rapid capture of text and image information; people prefer detailed explanations when making a choice; emoji do not lead to faster attention to the text but did not produce measurable differences in emotional or attentional indices; adding a feedback module does not necessarily promote positive emotions; however, positive feedback can. Combining physiological measures with reflective feedback is essential for understanding emotional experience. These findings provide quantitative evidence for designing interactive interfaces and emotional support in online learning, aiming to improve interaction efficiency, deepen the understanding of users’ emotional experiences, and promote engagement and user retention among online meeting users.
1. Introduction
With the development of information technology, working through online meetings has become increasingly common. Online video communication tools such as Zoom, used to publish and acquire information remotely and in real time, have become an indispensable part of modern learning and work. However, the exploration of emotional experiences on online meeting platforms remains insufficient [1], particularly regarding interaction modes [2,3], the design of visual elements in interfaces [4], systematic support for presenters’ experiences [5], and the user experience of technical functions [6].
With Cognitive Load Theory (CLT) and user-centered design (UCD) as theoretical frameworks, this study explores presenters’ interactive experience in online teaching environments. CLT helps us understand how the way information is presented affects learners’ cognitive processing, while UCD principles guide us in optimizing interactive interfaces based on users’ actual needs and emotional feedback. Although young people are increasingly becoming creators and contributors of online content [6,7], empirical research on online presenters’ emotional states and cognitive load in teaching tasks remains insufficient. Online video communication works, such as online learning, are considered a very promising research field [8]. However, there has been little research on the experience of using online meeting tools and on how to provide technical support for user groups who need to share information and present. For online presenters, the shift to online work after the COVID-19 pandemic represents a new opportunity and equally new obstacles. Prior research on emotional design and cognitive patterns in teleconferencing interaction has pointed out that the quality of the content speakers deliver in online video communication is closely related to audiences’ learning outcomes [9]. However, facing new forms of work and new technologies, online presenters need and lack more emotional care and technical support during the transition of work scenarios [10,11]. Users’ negative emotions about online presentation work mean that preparation and audience interaction, similar to traditional presentations, require external assistance [12]. Solutions require enhanced interactive software support, emotional design optimization, and user-friendly interfaces. To address these issues, this study combines an eye-tracking experiment with questionnaires to systematically analyze presenters’ emotional investment and cognitive behavior on online teaching platforms along the two dimensions of cognitive load and user experience. The findings aim to provide quantitative evidence for the human–computer interaction design of online presentation tasks, improve system usability, reduce users’ resistance to technology use, and ultimately promote engagement and user retention among online meeting users.
Specifically, this study addresses three questions: how do slide text–image layout and the transparency of interactive option text shape presenters’ visual attention and cognitive load? Do anthropomorphic emoji of different emotional valences alter attention allocation and emotional response? And how do the presence and valence of performance feedback influence presenters’ emotional experience?
University students were recruited as presenters because they are both the primary users of online presentation platforms and the population most frequently required to deliver assessed online presentations; they therefore provide an appropriate initial sample for examining the presenter-side interaction experience.
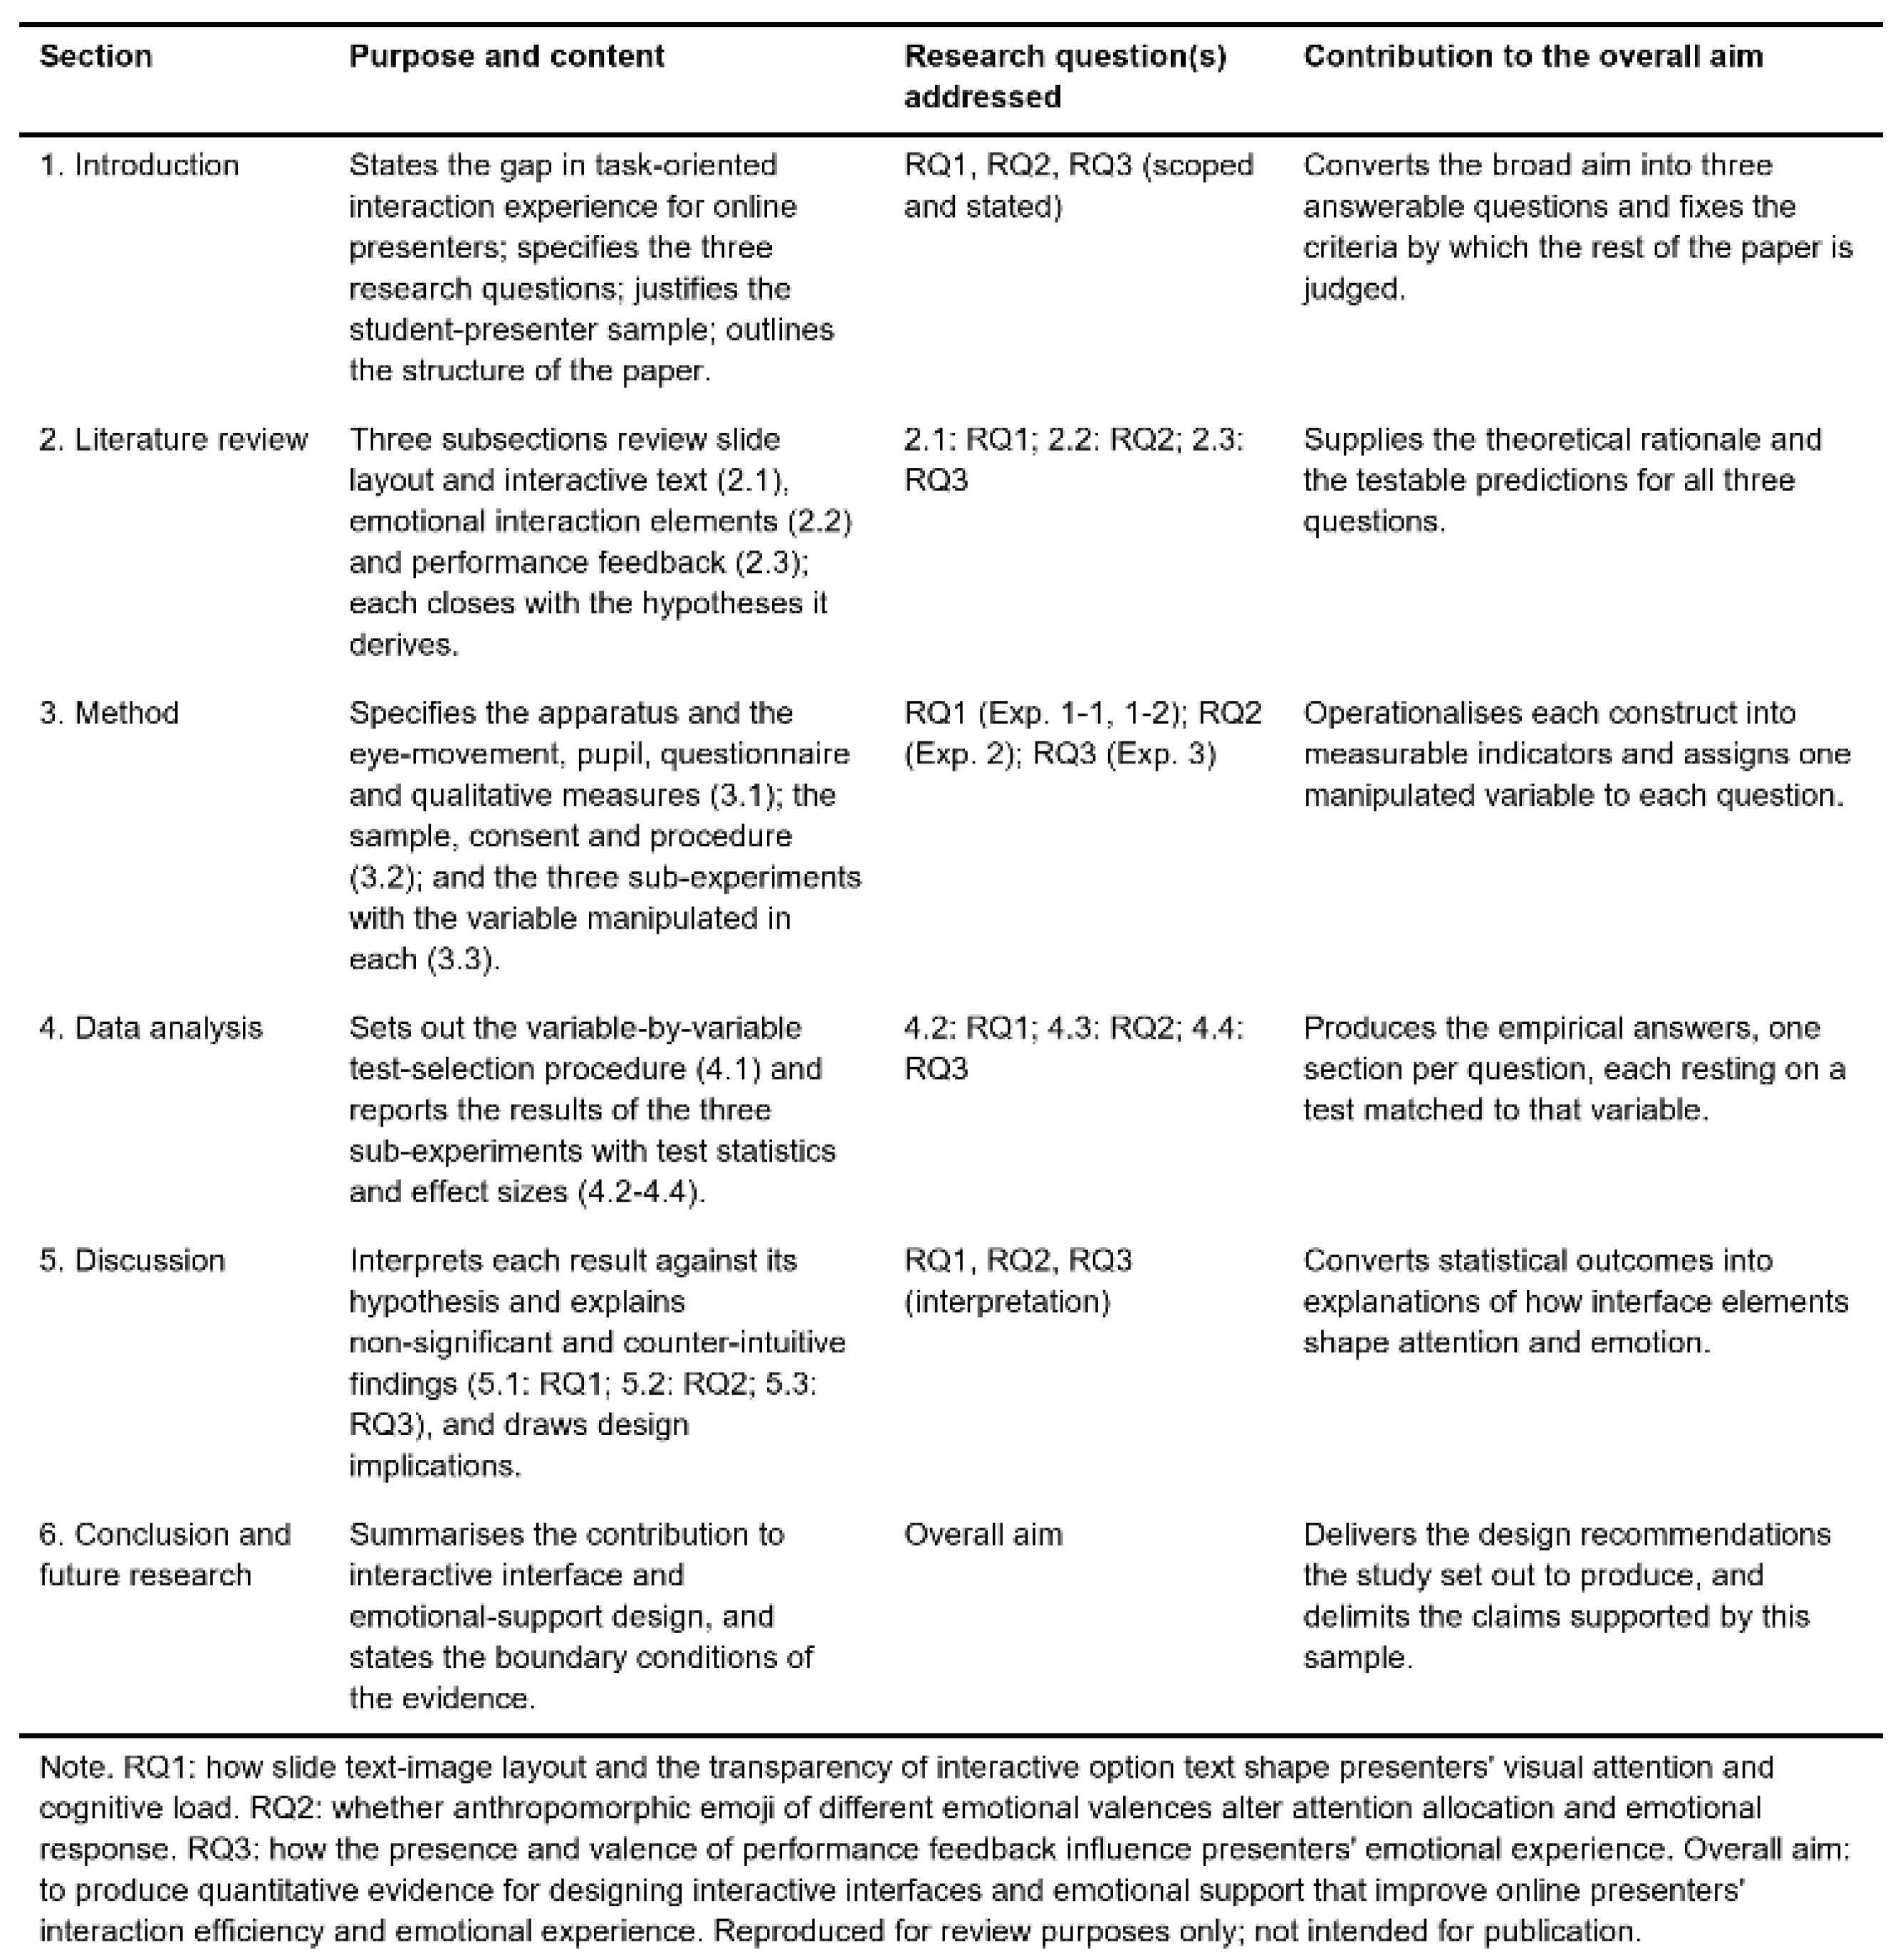
The remainder of this paper is organized as follows. Section 2 reviews prior work on slide layout, emotional interaction elements and performance feedback and derives the hypotheses; Section 3 describes the apparatus, measures, participants and the design of the three sub-experiments; Section 4 reports the analysis strategy and results; Section 5 discusses the findings against the hypotheses; and Section 6 concludes with design implications, limitations and future research. The roadmap of this article is provided in the Appendix A (see Figure A1).
2. Literature Review
Online video communication software is an online tool for remote, multiuser, real-time interaction. It spread rapidly during the COVID-19 pandemic and has continued to be promoted and developed. In recent years, research interest in the interaction design of online video communication software has risen quickly [13,14,15,16]. Users typically need to present and explain their prepared content in online video meetings. In traditional face-to-face presentations, presenters express their ideas through slide presentations, verbal delivery with body movements, and interaction with the audience (e.g., question-and-answer, eye contact, and physical contact), so as to gauge the audience’s state and adjust the pace of the presentation to attract attention and interest [17,18,19]. This indicates that presenters need access to three types of information to successfully complete teaching tasks: the slides, the audience’s state and reactions, and self-performance assessment. In online environments, obtaining this information must be achieved through human–computer interaction. Based on CLT and user-centered design principles, this study systematically examines interface designs related to the presenter experience, including slide content layout, visual elements that may evoke emotions, and feedback information.
2.1. Visual Information and Page Layout in Online Presentations
For presenters, quickly retrieving information from slides is essential, and the text–image content on a page is a key factor affecting user experience and imposing cognitive load. Sweller proposed Cognitive Load Theory (CLT) and its three-component model [20], indicating that three distinct measures can independently assess three hypothesized types of cognitive load—intrinsic, extraneous, and germane—and that the three types can be additive. Intrinsic cognitive load refers to the complexity of the learning material itself and the difficulty learners face in processing that information; it depends on learners’ prior knowledge and the complexity of the material. Extraneous cognitive load is the additional load beyond intrinsic load, mainly caused by poorly designed presentation content, such as excessive information that is difficult to comprehend [21]. Germane cognitive load refers to the load associated with facilitating knowledge acquisition; an appropriate level of germane load benefits learning. Among these, extraneous and germane cognitive load are both directly controlled by the designer of the presentation content and are the parts mainly involved in this study [22].
To facilitate speaking, most users choose to create slides to support their presentations. Shared slides containing meeting-related text, images, video, and audio are therefore crucial in this process, where text is directly related to the presented content and also serves as a prompt for the speech. Slides profoundly influence presenters’ experiences and audiences’ perception [23], comprehension and reflection [24,25], and engagement [26]. However, inappropriate visual design can also negatively affect presenters’ attention, complicating online presentations and demanding substantial cognitive effort. Cognitive Load Theory indicates that optimizing the quality of visual attention—including attention span, maintenance, allocation, and shifting—is essential for reducing cognitive load [27]. Researchers emphasize that understanding visual search behavior is critical for improving task performance in online environments. Tsai et al. found that different user groups adopt different information selection and attention control strategies when performing online tasks, but the characteristics of teacher groups remain unexplored [28]. This also underscores the importance of in-depth research on presenters’ performance and experience in online meetings.
First is the layout of the slide page. Fluent visual behavior and emotional experience are essential for reducing cognitive load and improving human–computer interaction efficiency. Zhang et al. conducted an empirical study of user interface design schemes for online learning platforms (covering orientations such as design, methods, and layout styles), finding that interface layout significantly affects users’ learning efficiency, usability, and cognitive load, and that, compared with the horizontal layout, the vertical layout effectively reduces information processing difficulty [29]. In real-world contexts, presenters’ slide-based teaching tasks are mostly performed while reading aloud, so it is necessary to ensure that browsing is more fluent when text and images are integrated in the layout. This issue is more closely tied to real-world usage scenarios. Online presenters must manage complex interfaces effectively to sustain attention [30,31]. Scholars have found that a “Z-shaped” browsing pattern improves users’ comprehension of content [32]. Interference from irrelevant elements, such as image advertisements, affects attentional behavior and complicates comprehension [33]. The horizontal layout is considered the optimal layout, improving browsing fluency [34]. Evidently, current research focuses on how to design interfaces that enable fluent reading for a broad user base, concentrating on the exploration of visual patterns and emotional experience. This is crucial for helping presenters improve their feelings and performance during online presentations.
It follows that users need a scientifically grounded layout design that allows reasonable attention allocation when acquiring visual content while accommodating reading habits in the read-aloud state of presenting—an issue more closely tied to real-world usage scenarios. For slides used in online learning, reducing cognitive load and stabilizing users’ emotions are vital. However, previous studies have mostly been based on conventional pages and have not examined specific scenarios, information carriers, or tasks established in specific scenarios. Therefore, this study focuses on the layout of text and image information on slides (in this paper, “layout” refers to the arrangement and organization of image and text elements on a slide) and investigates it within the reading-aloud task of online presentation scenarios.
In this study, we use an eye-tracking experiment to examine how different slide text–image arrangements affect reading behavior and emotional experience while users read aloud. The following hypotheses are proposed:
H1-1.
In reading-aloud tasks, compared with the vertically interleaved and horizontal layouts, the vertical layout (text above and image below) is expected to direct readers’ attention to the text first and, as a separate prediction, to produce the lowest cognitive load. (This hypothesis will be tested in Experiment 1-2.)
H1-2.
In human–computer interaction, interactive text that is difficult to understand increases speakers’ cognitive load and triggers negative emotions; when the presentation is simpler, adding supportive descriptions can increase its appeal. (This hypothesis will be tested in Experiment 1-1).
2.2. Presenters’ Emotional Interaction Elements
For presenters, emotional feelings during the presentation are a key factor influencing presentation performance and interaction behavior [35], especially in online environments that allow real-time interaction. Emoji, as a form of non-verbal cue, help people intuitively express and understand emotions in online settings; they can facilitate digital interaction, and their other effects are still being explored [36]. Previous research has found that, in multimedia learning environments, emotional arousal can enhance memory and positively influence the direction of attention [37].
Existing research has found that emoji can strengthen users’ willingness to work online [4,38]. Researchers have studied text-based emoji chat interaction in depth and found that clear emotional cues in text lead to better information delivery [23]. Moreover, some scholars argue that although emoji facilitate emotional interaction, they may distract attention: for example, one study reported that placing emoji at the end of sentences prolongs reading time [39]. Eye-tracking research has shown that face-like emoji receive more attention [40]. Beyond behavioral measures, electrophysiological evidence has further confirmed the emotional impact of virtual expressions: ERP analysis of smart agent appearance showed that anthropomorphic expressions evoke measurable emotional response [41]. Further studies found that, compared with text, object-representing emoji pose comprehension challenges, whereas face-mimicking emoji improve interaction efficiency [36,42]. Regarding emotion cognition, some argue that emoji valence does not affect sentence emotion judgment [39], while others contend that positive or negative emoji reinforce the emotional experience of text [43], with negative emoji exerting a stronger influence [36,43].
Given the gap in social affordances between online and offline presentations—such as limited online communication modes, lack of feedback, and a tendency to provoke anxiety [11]—the social functions of online presentations deserve attention and research [44]. Consistent with this, text chat using emoji is widely used on interactive digital platforms, enhancing digital interaction experience and efficiency by effectively conveying emotional information [36,39].
Previous research has mainly focused on the effects of short texts and emoji on information delivery, attention, and emotion; research on the role of emoji in the specific scenario of online presentations is still lacking. Because presenters often need to process large amounts of textual information at work, including prompt text on slides, the role of emoji in reading longer and more complex texts remains unclear. This paper investigates in depth how emoji shape emotional perception and cognitive processes in complex information environments. Therefore, building on prior work, questions on which views differ—whether emoji affect attention allocation and how they influence emotional perception—should be further examined within specific interaction scenarios and tasks. Hence, the following hypotheses are proposed:
H2-1.
While reading articles, the appearance of anthropomorphic emoji will evoke emotional tendencies corresponding to their emotional valence. (This hypothesis will be tested in Experiment 2).
H2-2.
While reading articles, people will notice negative anthropomorphic emoji faster, but negative valence does not affect people’s judgment of the emotion expressed in the article. (This hypothesis will be tested in Experiment 2).
2.3. Feedback Information in Online Presentations
Online presenters likewise face challenges in accurately assessing audience reactions and their own performance; optimizing feedback platforms and integrating emotional support can be expected to strengthen self-monitoring and improve online communication dynamics. Cheng et al. found that the integration and visualization of data information significantly improves learning performance and data understanding [45]. Presenters in online presentations rely not only on timely audience feedback but also need an objective awareness of their own performance—a psychological capacity known as self-monitoring [46]. Research shows that self-monitoring positively affects self-management and presenters’ conscious behavior, thereby improving online presentations [11,47]. However, presenters often find it difficult to judge the effectiveness of their efforts in online environments, which hinders their ability to engage audiences objectively [48]. DAVALOS et al. provided participants with visualized annotated data and found that helping users perceive their own states through visualization enhanced their self-awareness, interest, and engagement in online tasks [49]. Limited online cues impede accurate assessment of audience reactions and affect emotional, performance, and self-monitoring dimensions such as attention and engagement [47]. Therefore, optimizing integrated feedback and interaction analytics platforms can reinforce speakers’ self-supervision and improve online communication dynamics. In addition, professional feedback fosters presenters’ reflection and better performance, and personal data feedback has proven beneficial in practice [50]. Feedback promotes rational and objective judgment and enhances online platform experience and satisfaction [51]. Positive emotions gained at work can sustain presenters’ work and influence their well-being and loyalty.
For presenters, therefore, obtaining feedback information and emotional support from the feedback is indispensable; which feedback visual designs better support these needs can be concluded from presenters’ emotional reactions and their preferences for feedback modules. This is verified through the two aspects of subjective feedback. Hence the hypotheses:
H3-1.
Adding a feedback function can produce positive emotions. (This hypothesis will be tested in Experiment 3).
H3-2.
Users are more inclined to choose positive feedback. (This hypothesis will be tested in Experiment 3).
3. Method
From a cognitive perspective, scholars have affirmed the necessity of using eye-tracking methods to examine attention and cognitive states [52]. This study designs eye-tracking experiments to verify the hypotheses presented in Section 2, echoing the hypotheses distilled there. Eye-tracking experiments are used for data collection, presenting interaction design elements such as the text–image layout of interactive interfaces, emoji and text information design, and the feedback module in the form of picture materials, while recording physiological data during the experiments and adding questionnaire materials at the required steps.
3.1. Apparatus and Measures
In the experiments of this study, a Tobii X2-60 eye tracker (Tobii Technology AB, Danderyd, Sweden) with a sampling rate of 60 Hz was used. The display was 15.5 inches (resolution 1366 × 768), viewing distance: 0.5 m. According to the device specifications, the standard interval for fixation point acquisition was 75 ms at an angle of 0.5°. For data analysis, we analyzed participants’ eye movements based on areas of interest (AOIs). For questionnaire collection, participants were asked to complete questionnaires related to the experiment immediately after the eye-tracking experiment to ensure the authenticity and validity of responses.
The experiment combined quantitative and qualitative analyses. The main quantitative measures involved were as follows:
Time to first fixation (TTFF): the time from the onset of the stimulus material until the user first fixates on a specific area of interest (AOI). In this study, a shorter TTFF for a module indicates that its visual design is more attractive or clearer in emphasis and easier for users to capture.
Total fixation duration (TFD): the total duration of users’ fixations within an AOI, reflecting the depth of information processing in a specific area. A larger TFD may indicate that the information in the area is more complex and requires more cognitive resources to understand and vice versa. In this study, TFD is used to indicate that users invested more cognitive resources in certain content, such as when feeling confused or having greater interest [31].
Fixation count (FC): the total number of fixations within a specific AOI over a period of time, mainly related to two aspects—the importance of the content in the AOI/the user’s level of interest, and the cognitive difficulty of the content [53].
Pupil size: computed from the pupil diameter. Previous research has confirmed that pupil size can generally serve as auxiliary evidence of emotional fluctuation [54,55] and changes in cognitive load [56]; these measures are used in the experiment to help explain the causes of data differences. Regarding cognitive load, in many studies, changes in pupil size have been regarded as an indicator of cognitive load. In previous research, an increase in pupil size implied an increase in cognitive load [57,58,59].
The qualitative measures of the experiment include:
(1) Heatmap: a visual presentation scheme of eye movements and gaze information that can be overlaid and analyzed, visualized according to the number of gaze points at different positions (the longer the gaze time, the closer to red; otherwise, the closer to green).
(2) Scanpath: a visual means of reflecting transitions in participants’ fixation behavior. The chronological connection of all gaze points allows observation of participants’ browsing trajectories.
Both visualizations were produced with Tobii Studio from the raw gaze data of the participants assigned to each material condition. Heatmaps aggregate fixation duration across all participants within a condition; scanpaths plot the fixation sequence of individual participants, with node size proportional to fixation duration and node number indicating fixation order. Only fixations inside the predefined AOIs are included. Cognitive load was assessed through self-reported ratings, whereas emotional responses were measured using the PANAS questionnaire. Eye-tracking and pupil-size measures were used as behavioral and physiological indicators, respectively, to provide complementary evidence rather than direct substitutes for these subjective measures.
3.2. Participant Recruitment and Experimental Procedure
This paper aims to study the effects of different interactive interfaces, slide content design methods, and interaction on users’ emotions and cognitive behavior, recording participants’ physiological data through eye-tracking experiments and collecting questionnaire data to interpret users’ emotional reactions, preferences, cognitive load, and other measures. A total of 61 participants [60] were recruited, who were all students from a university in Guangdong, all with multiple experiences of presenting in online classes, aged 19–23 (41 female, 20 male). All participants took part voluntarily and received corresponding compensation. The experiments in this study were between-subjects experiments, detailed later in the specific experimental designs: in the between-subjects experiments, different experimental groups were formed according to different experimental materials, and participants were evenly assigned to any one group and participants were allocated to one of the material conditions by simple randomization with equal allocation (20–21 participants per condition); the allocation sequence was generated by a random number sequence. To ensure a single variable in each group’s experimental materials, participants were controlled for no markedly different prior knowledge, and materials identical except for the variable elements were used.
All participants provided written informed consent before taking part and were free to withdraw at any time; approval No. GDUTXS2026060.
3.3. Experimental Design and Tasks
In this study, we selected task user interfaces closely related to presentation functions and empirically examined different user interface design schemes. These tasks included audio settings, slide playback and reading aloud, interaction and commenting, and personal status confirmation. The variables and experimental designs related to these tasks are described in detail in the following sections.
3.3.1. Experiment 1—Interactive Information and Cognitive Load
(1) Interactive information
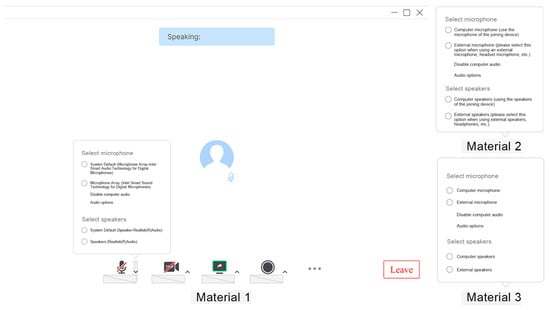
This experiment aimed to test H1-2. The experiment was set as a between-subjects experiment, in which every participant viewed all materials of this experiment. Taking the audio settings window commonly seen in online meeting software as an example, the independent variable was set as different degrees of information transparency of the audio option text—that is, options with different levels of explanatory information. There were three experimental materials, presented randomly to all participants: original options (professional vocabulary with explanations using professional terms—Material 1), explanatory options (conventional vocabulary with plain-language explanations—Material 2), and minimalist options without additional explanation (Material 3). All materials were presented sequentially as static images, each displayed for 10 s. Participants were asked to complete a preference questionnaire immediately after the experiment to choose their most preferred text description form among the above materials, with a single-choice format. The picture materials used in the experiment are shown in Figure 1, where “Material 1” shows the complete material and “Material 2” and “Material 3” show only the variable parts. Apart from the displayed variable elements, the three pictures were identical.
Figure 1.
Material design of Experiment 1-1: Different interactive texts in the audio settings dialog.
(2) Text–image layout in reading-aloud tasks
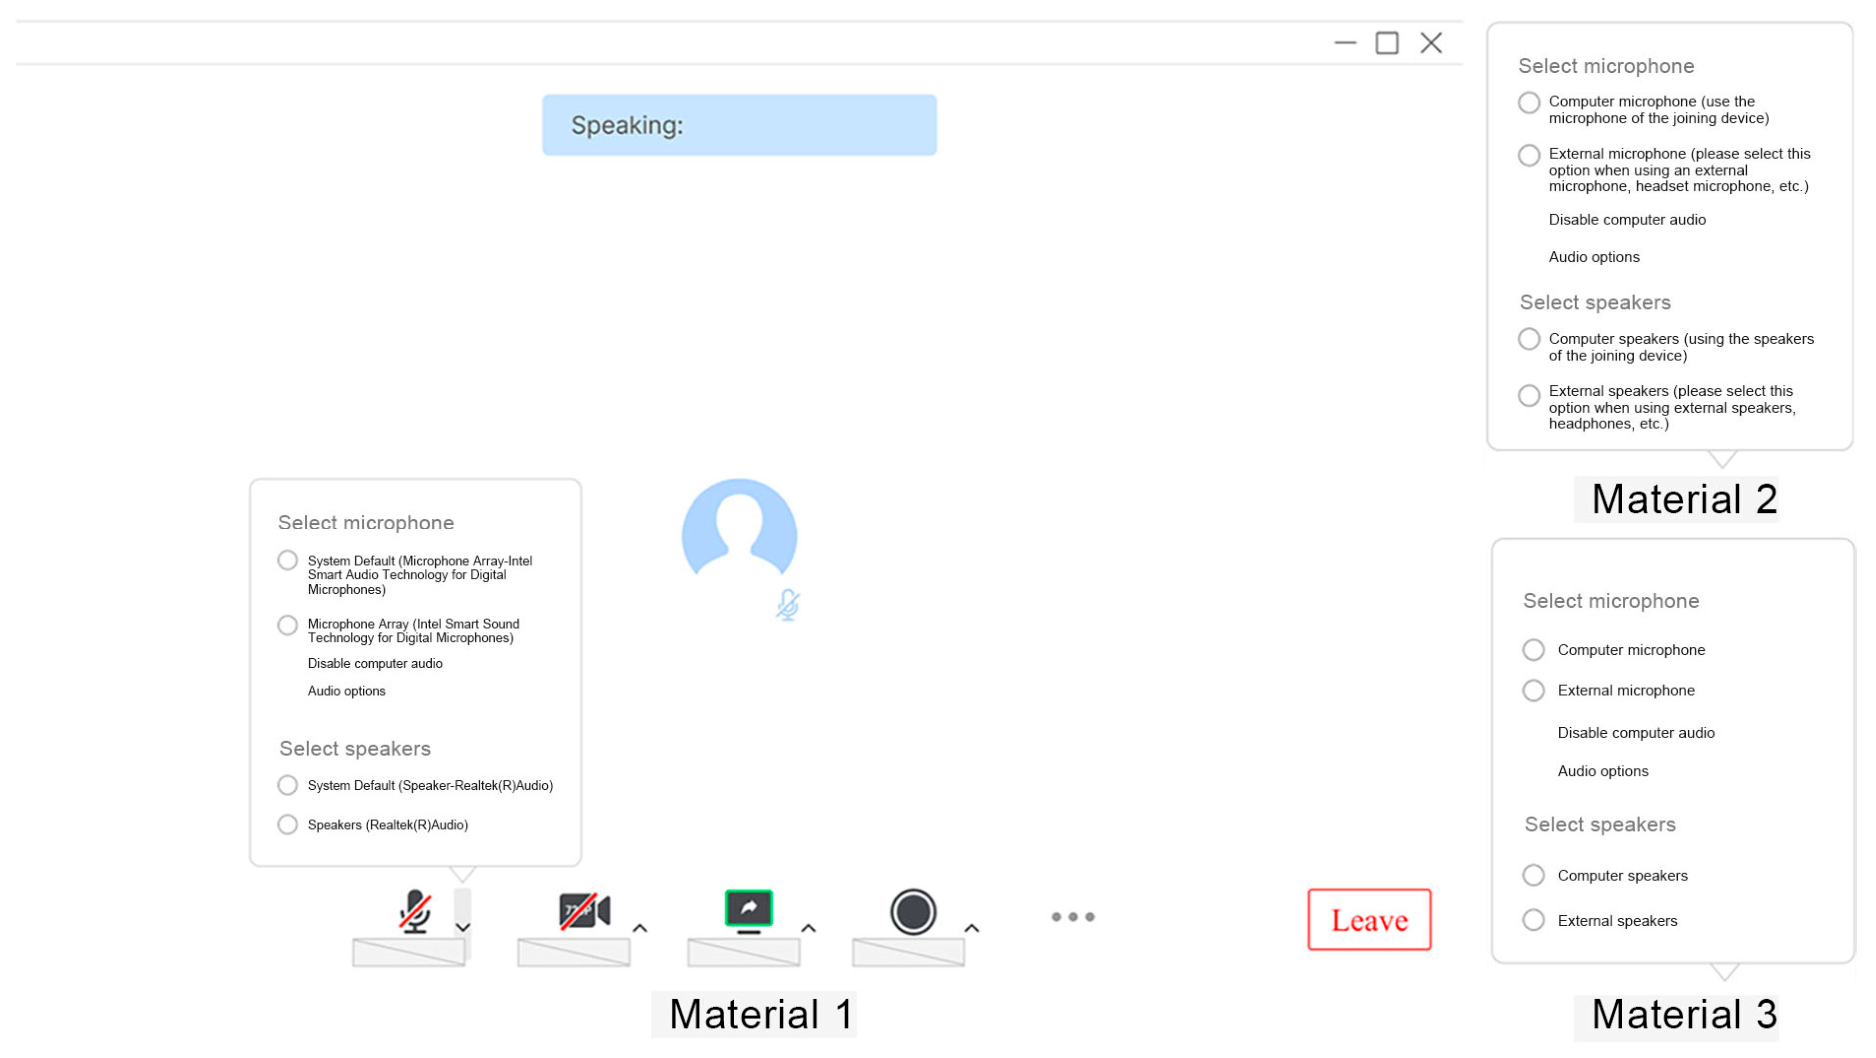
This experiment aimed to test H1-1. The text–image layout experiment was set as a between-subjects experiment with three experimental materials; all participants were randomly assigned to one layout, with equal numbers of participants per group. The three text–image layouts were: Group 1—vertical layout (Material 1), Group 2—vertically interleaved layout (Material 2), and Group 3—horizontal layout (Material 3). In this experiment, different text–image layouts served as the between-subjects factor, and all materials were presented as pictures to ensure identical images, text, and background. Before the experiment began, participants were informed in the instructions that the task required them to read the text in the materials aloud and press the spacebar immediately after finishing to end the material playback, this experimental part ended, and data recording stopped. The text content in each picture belonged to the same declarative domain with no obvious emotional tendency and was therefore not considered likely to cause emotional disturbance. The experiment recorded participants’ eye movement data within the AOIs and pupil data for subsequent evaluation. The picture materials used in the experiment are shown in Figure 2.
Figure 2.
Material design of Experiment 1-2: Different text–image layouts of slides.
3.3.2. Experiment 2—Emotional Interaction Elements
This experiment aimed to test H2-1 and H2-2. The emotional interaction elements experiment selected anthropomorphic emoji of different emotional valences [61] as the independent variable to explore the influence of emoji on reading behavior and was set as a between-subjects experiment to examine the effect of emoji feedback on the understanding of text emotion. The initial material consisted of one picture displayed for 5 s, showing neutral, declarative text in the middle of the screen. After this picture was played, an emoji icon appeared directly below the text passage; the emoji remained in this state and was displayed for 5 s before the projection ended, the metrics for emoji AOI were calculated within a 5–10 s window. Participants were asked to judge the emotion conveyed by the text during the projection of the materials. The experimental variable was the emotional type of the emoji: the emotion types of the Group 1, Group 2, and Group 3 emoji icons were neutral (Material 1), positive (Material 2), and negative (Material 3), respectively. The emoji element was positioned outside the text passage to ensure that participants were unaffected by other factors while reading. The picture materials used in the experiment are shown in Figure 3.
Figure 3.
Material design of Experiment 2: Emotional interaction elements of different emotional valences—positive, negative, and neutral.
3.3.3. Experiment 3—Performance Feedback
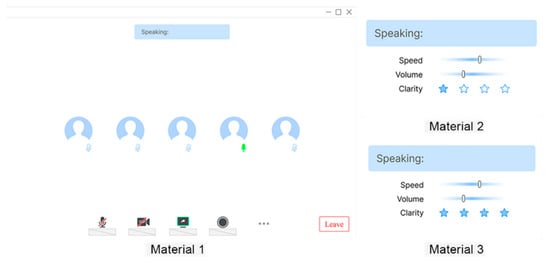
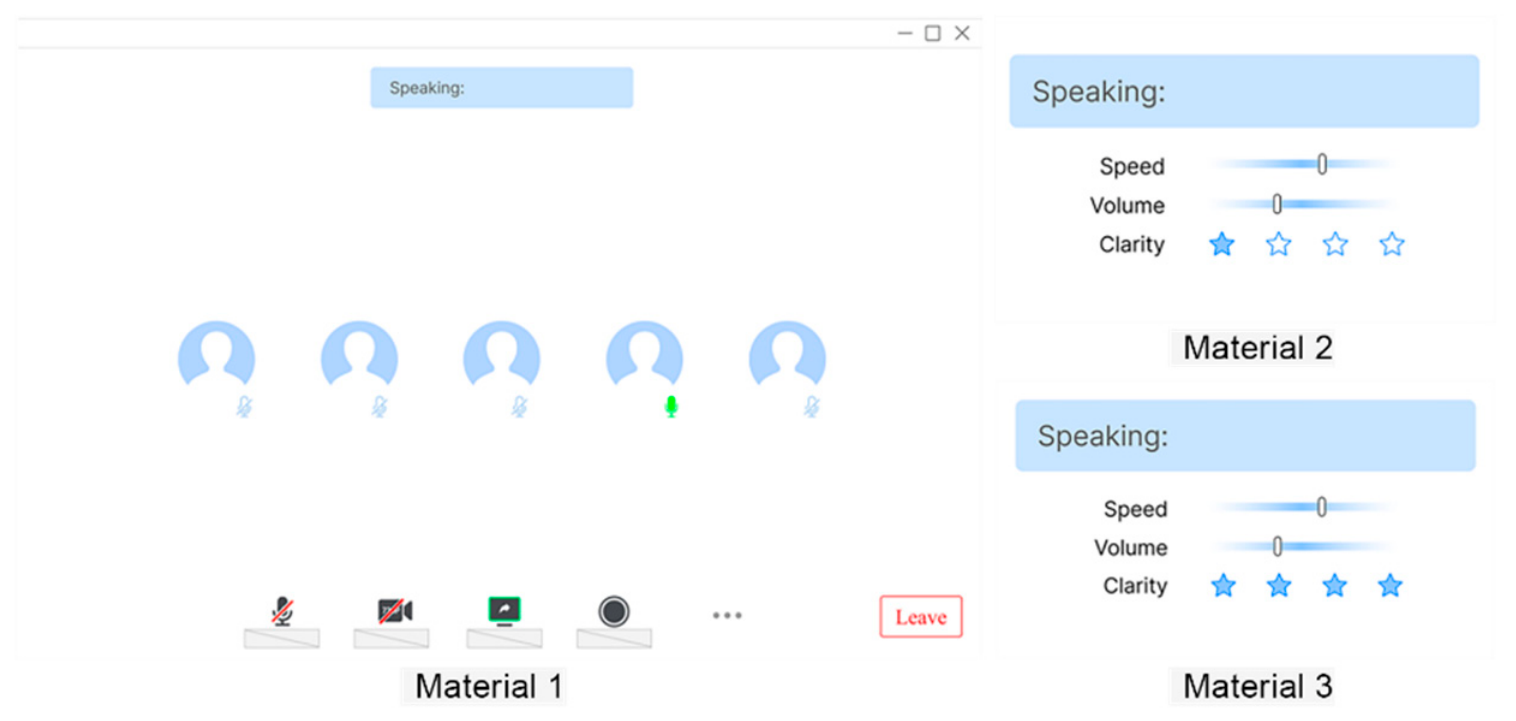
This experiment aimed to test H3-1 and H3-2. The feedback experiment was set as a between-subjects experiment to examine speakers’ responses to system feedback. Material 1 was the non-feedback: without system feedback information; Materials 2 and 3 contained system feedback of the same form, covering volume, speed, and other speaker performance indicators; Material 2 contained negative feedback and Material 3 positive feedback. Participants viewed the three sets of materials in different orders and made a preference choice in the questionnaire at the end of the experiment, with a single-choice format. The picture materials used in the experiment are shown in Figure 4, where “Material 1” shows the complete material and “Material 2” and “Material 3” show only the variable parts. Apart from the displayed variable elements, the three pictures were identical.
Figure 4.
Material design of Experiment 3: Feedback and emotional support for online presenters.
4. Data Analysis
The experiment was conducted in a normally lit, sound-attenuated laboratory with constant ambient illumination. All stimuli were presented at the same brightness to minimize luminance-driven pupil artifacts. Before the experiment, participants were told to minimize blinking, especially while the stimulus materials were displayed; blink-related data were therefore not excluded. Pupil size was normalized according to each participant’s pupil dynamic range in the task. Baseline correction was performed trial by trial by subtracting the mean pupil size during the 100-ms prestimulus baseline window (−100 to 0 ms relative to stimulus onset) from subsequent pupil measurements.
Calibration was performed using the built-in 9-point calibration procedure of the Tobii Pro X2-60; after calibration, the mean offset error across all fixation points was below 1°. For blinks, blink segments were identified directly from the pupil-loss marker output by the eye tracker, and during preprocessing the data 100 ms before and after each blink were marked as missing and excluded from subsequent analysis. To control for order and fatigue effects, a Latin square design was adopted. Experimental conditions were coded (e.g., A, B, C), and the resulting order sequences were evenly distributed across participants.
Participants with tracking rates below 80% were excluded, as this threshold is generally considered insufficient to support reliable analysis; pupil values outside the plausible range of 1–9 mm were also removed. In addition, qualitative analyses of pupil size, heatmaps, and scanpaths were used to support the discussion of data differences.
4.1. Data Analysis Strategy
SPSS 25.0 was used for statistical data analysis. Before the formal analysis, the raw data were preprocessed, excluding samples from participants who withdrew midway or whose data samples were too few due to collection problems; a total of 61 valid datasets were included in this experiment. For the experiments using between-subjects testing, the data were divided into three groups of 20–21 datasets each. Due to the presence of multiple experimental designs and correspondingly different data conditions in this study, different statistical tests may need to be applied in the data analysis. Therefore, the following decision procedure was adopted for analyzing the experimental data: first, the Shapiro–Wilk test was used to test the normality of the data. If the data met the normality assumption, Levene’s test was then used to check homogeneity of variance. If homogeneity of variance also held, a one-way ANOVA was used for data analysis. If the data did not follow a normal distribution, non-parametric tests were used instead. These details are therefore not repeated below.
Because the decision procedure was applied to each dependent variable separately, a single experiment may report both parametric and non-parametric results; the test used for each variable is stated in the note beneath the corresponding table. All tests were two-tailed with α = 0.05, and effect sizes are reported alongside test statistics.
4.2. Results of Experiment 1—Interactive Information and Cognitive Load in Online Presentations
To analyze the eye-tracking data, we predefined areas of interest (AOIs) on the visual stimulus materials; these regions contained the variables of the visual stimuli. For example, in the data analysis, the different text–image layouts of the materials served as the between-subjects factor, and the AOIs were divided into two types of elements (text or image), and the eye-tracking data in the AOIs was the dependent variable. Fixation count (FC), total fixation duration (TFD), time to first fixation (TTFF) and first fixation duration (FFD) were measured.
4.2.1. Interactive Information
Experiment 1 was a between-subjects experiment. Different interactive text description formats in the materials served as the independent variable, and eye-tracking data were analyzed as dependent variables, combined with questionnaire and pupil data, to determine the effect of different degrees of information transparency of the option explanations (independent variable) on the eye-tracking data (dependent variables). The fixation count (FC) and total fixation duration (TFD) did not follow a normal distribution (p < 0.05). The results showed that fixation count (FC) and total fixation duration (TFD) within the AOIs differed significantly across the three materials (p < 0.05). Data are presented as mean ± standard deviation (M ± SD). The specific values are compared as follows:
(1) Fixation count (FC):
There were significant differences in fixation count (FC) between Material 1 (original options—conventional option) and Material 2 (explanatory options) and between Material 1 and Material 3 (minimalist options) (p < 0.05). The fixation counts of Materials 1, 2, and 3 were 5.95 ± 5.15, 15.97 ± 7.26, and 14.81 ± 6.87, respectively; Material 2 had the most fixations, followed by Material 3, and Material 1 the fewest.
(2) Total fixation duration (TFD):
Total fixation duration differed significantly between Material 1 and Material 2 and between Material 1 and Material 3 (p < 0.05). The total fixation durations were 1.78 ± 1.96, 4.20 ± 2.42, and 3.73 ± 2.13, respectively; Material 2 had the longest total fixation duration and Material 1 the shortest—that is, the explanatory options received the greatest fixation investment and the original options the least.
(3) Questionnaire data:
The questionnaire consisted of a cognitive load question—asking participants not only to rate mental effort but to rate how difficult they perceived the task to be by using a 5-point Likert scale [62]—and a preference choice. After the experiment, participants chose their preferred material and immediately completed the scale. A total of 61 scales were collected: the preference choices were 5 for Material 1, 34 for Material 2, and 22 for Material 3. The questionnaire data were used to determine the effect of different ways of describing interactive text (independent variable) on cognitive load and preference (dependent variables). The questionnaire used a 5-point Likert scale for cognitive load. The cognitive load data were analyzed with Kruskal–Wallis tests. The data showed that more participants chose the minimalist options as the material with the lowest cognitive load, but they prefer the detailed explanatory options. Cognitive load was assessed using a single-item, five-point self-report rating [62]. The preference measure was a separate single-choice question asking participants to select their preferred material. All data are organized as shown in Table 1.
Table 1.
Eye-tracking and questionnaire data of the interactive information experiment.
(4) Pupil data:
Boxplot inspection showed a few extreme values in the raw data; each participant’s pupil data was very large in volume, and removing the extreme values had almost no effect on the distribution of the raw data, so the extreme values were deleted. The Shapiro–Wilk test showed that the pupil data followed a normal distribution (p > 0.05). After Levene’s test of equality of error variances, the error variances of the pupil data for each material were equal across materials (p > 0.05). But the one-way ANOVA tests showed that there was no significant difference among the three materials (p > 0.05). This indicates that, in terms of pupil data, the changes in description did not cause significant emotional changes. All data are organized as shown in Table 2.
Table 2.
Pupil data of the interactive information experiment.
4.2.2. Text–Image Layout in Reading-Aloud Tasks
This experiment took different text–image layouts as the between-subjects factor and the eye-tracking data of the two element types—text and image—in the materials as dependent variables, measuring time to first fixation (TTFF) and first fixation duration (FFD). During the read-aloud task, the display ended when the participant pressed the spacebar. After the Shapiro–Wilk test of normality, the TTFF and FFD data for images and text did not follow a normal distribution (p < 0.05). Kruskal–Wallis tests on these data showed that the TTFF and FFD measures differed statistically significantly across the three groups (p < 0.05).
(1) Time to first fixation (TTFF):
The time to first fixation (TTFF) for text differed significantly across layouts 1, 2 and 3 (p < 0.05), with values of 0.03 ± 0.05, 0.43 ± 0.55, and 0.21 ± 0.31, respectively; layout 2 had the longest TTFF and layout 1 the shortest. The TTFF for images differed significantly between layouts 1, 2 and 3 (p < 0.05); the values for layouts 1, 2, and 3 were 26.93 ± 8.90, 20.92 ± 24.51, and 10.26 ± 14.77, respectively—layout 1 had the longest time before first fixation, followed by layout 2, and layout 3 the shortest.
(2) First fixation duration (FFD):
For FFD, there were significant differences between layouts 2 and 3 for images and between layouts 1 and 2 for text (p < 0.05). For images, the values for Groups 2 and 3 were 0.23 ± 0.097 and 0.14 ± 0.11, respectively—layout 2 had a longer first fixation duration than layout 3. For text, the values for Groups 1 and 2 were 0.19 ± 0.08 and 0.31 ± 0.20, respectively—layout 2 had a longer first fixation duration than layout 1.
For the vertically interleaved layout, text received the longest fixation time, but the first fixation duration was longer; with the horizontal layout, participants noticed the text first, and the time to first fixation on the image was also shorter. All data are organized as shown in Table 3 and Table 4.
Table 3.
Pairwise comparisons of first Fixation Duration (FFD) data.
Table 4.
Data summary of text–image layouts and visual attention effects.
(3) Pupil data (pupil size):
Pupil-size data analysis. A Shapiro–Wilk test showed that the pupil data (pupil size) followed a normal distribution (p > 0.05). Levene’s test of homogeneity of variance showed that the error variances of the pupil data were equal across groups (p > 0.05). One-way ANOVA of the pupil data therefore showed no statistically significant difference among the three groups (p > 0.05). The pupil data for Groups 1, 2, and 3, presented as M ± SD, were 3.35 ± 0.43, 3.46 ± 0.35, and 3.45 ± 0.40, respectively. The pupil data indicate that the pupil size did not differ significantly across the three layouts. All data are organized as shown in Table 5.
Table 5.
Pupil data of text–image layouts and visual attention effects.
4.3. Results of Experiment 2—Emotional Interaction Elements
(1) AOI data
This experiment was set as a between-subjects experiment, with AOIs divided into text and emoji AOIs. Eye-tracking data within the AOIs served as dependent variables, measuring the effect of emoji presence on participants’ fixation count (FC), total fixation duration (TFD), and fixation duration (FD) within the areas of interest. Groups 1, 2, and 3 viewed neutral, positive, and negative emoji, respectively. Qualitative analyses of pupil size, heatmaps, and scanpaths were also combined to help explain the causes of the differences in the results. Normality tests were performed on the data, and the Shapiro–Wilk test results showed that the FC, TFD, and FD data did not follow a normal distribution (p < 0.05). Kruskal–Wallis tests were performed on the data, and no significant differences were found among the data for any of the indicators. All data are organized as shown in Table 6.
Table 6.
Eye-tracking experiment data of the emotional interaction elements.
(2) Pupil data
To better illustrate between-group differences, the pupil data were grouped and analyzed [63]. A Shapiro–Wilk test was performed: the pupil data followed a normal distribution, p = 0.2 (p > 0.05), and the error variances of the pupil data were equal across groups (p > 0.05). One-way ANOVA showed that there were no significant differences in pupil data between groups (p > 0.05). All data are organized as shown in Table 7.
Table 7.
Pupil data of the emotional interaction elements.
4.4. Results of Experiment 3—Performance Feedback
(1) AOI data
In this experiment, Material 1 has no feedback information, and the AOI data focused mainly on the differences between Materials 2 (negative feedback with low evaluations) and 3 (positive feedback with high evaluations) to investigate participants’ acceptance of the feedback; the AOI physiological data analysis concentrated on the differences between Materials 2 and 3. For Materials 2 and 3, the independent variable was set as good or bad evaluations. The Shapiro–Wilk test of normality showed that fixation count (FC) and total fixation duration (TFD) data did not follow a normal distribution (p < 0.05), so the raw data were analyzed with Kruskal–Wallis tests; total fixation duration (TFD) and fixation count (FC) differed significantly across the three materials (p < 0.05). Pairwise comparisons of the three sets of data were used to analyze the main effects, with the following results: for fixation count (FC), significant differences existed between Materials 1 and 2 and between Materials 1 and 3 (p < 0.05); Material 2 had the most fixations, followed by Material 3, and Material 1 the fewest. For total fixation duration (TFD), significant differences existed between Materials 1 and 2 and between Materials 1 and 3 (p < 0.05); Material 2 had the longest total fixation duration within the AOI, followed by Material 3, and Material 1 the shortest. The data is reported in Table 8.
Table 8.
Pairwise comparisons of the eye-tracking data of the presenter performance feedback.
(2) Pupil data:
A Shapiro–Wilk test indicated that the pupil data met the normality assumption (p > 0.05), and Levene’s test indicated homogeneity of variance (p > 0.05). A one-way ANOVA showed no significant difference in pupil size across the three feedback conditions, F(2, 58) = 2.160, p = 0.340, = 0.012. The data is reported in Table 9.
Table 9.
Pupil-size data of the presenter performance feedback.
(3) Questionnaire data:
In a preference questionnaire, participants were asked which feedback they preferred. The results showed that the vast majority of participants (45 people) preferred positive feedback, 11 preferred the non-feedback, and five preferred negative feedback. In other words, the most popular feedback was the positive feedback with a high score, followed by no feedback. Negative feedback is excluded because only 5 of 61 participants chose it. As so few participants selected this option, we have deliberately given it lower priority as a subject for further discussion and treat it as a matter of user preference rather than as an experimental condition for further analysis.
Based on the results of the preference questionnaire, the subjective emotional feelings of the non-feedback and the positive feedback were further compared. The PANAS scale [64] was used to collect statistics on participants’ positive and negative emotions. Through the Shapiro–Wilk test, the questionnaire data did not follow a normal distribution (p < 0.05) and were therefore analyzed with Kruskal–Wallis test. The results showed significant differences between the non-feedback and positive feedback in both positive and negative emotions. Compared with the non-feedback, participants showed higher positive and lower negative emotions for the material with positive feedback—Material 3. All data are shown in Table 10.
Table 10.
PANAS scale positive emotion (P) and negative emotion (N) questionnaire data.
5. Discussion
The experimental results of this study partially supported some hypotheses, while others were not confirmed. The data analysis showed that different text–image layouts significantly affected users’ attention distribution: the horizontal layout enabled faster capture of visual information**, whereas the vertically interleaved layout showed the slowest first fixation on the text. Moreover, no evidence showed that presenting positive feedback to presenters promoted positive emotions. Synthesizing the experimental data with qualitative results such as heatmaps and scanpaths, this study provides quantitative evidence and design optimization recommendations for interactive interface design, specifying how visual information and emotional support strategies can build a more efficient and emotionally friendly online presentation environment. In summary, H1-1 was partially supported (attention allocation), and H1-2 and H3-2 were supported.
5.1. Interactive Information and Cognitive Load in Online Presentations
Text layout significantly affected reading behavior, and the experimental results partially supported H1-1. The vertically interleaved layout showed the slowest first fixation on the text, whereas the horizontal layout enabled the fastest capture of images (the shortest TTFF-I) and the briefest first fixations on images (the shortest FFD-I); the vertical layout drew attention to the text first (the shortest TTFF-T), consistent with the attention clause of H1-1, but the predicted lowest cognitive load was not observed. Because Material 2 contained more explanatory text than Materials 1 and 3, its higher FC and TFD may partly reflect the greater amount of text available rather than greater interest per se; the two accounts cannot be separated with the present design. A similar trade-off was observed between preference and self-reported cognitive load. Although Material 2 received the highest preference (34 out of 61 participants), it also resulted in the highest cognitive load rating (2.59 ± 0.82), compared with Material 3 (1.86 ± 0.64). This suggests that users’ preference does not necessarily correspond to the lowest cognitive effort. The additional explanatory information in Material 2 may increase information-processing demands while providing greater clarity and informativeness, making the interface more appealing despite the higher perceived effort. In contrast, the minimalist design may reduce cognitive effort but provide insufficient explanatory support for some users. This trade-off may help explain the different patterns of preference and cognitive load. However, the single-item self-report measure used in this study does not allow us to distinguish intrinsic, extraneous, and germane cognitive load separately. In addition, the results supported H1-2, indicating that different explanatory texts significantly affected cognitive load. The questionnaire data showed that people prefer the detailed explanatory options, implying that post hoc questionnaires help explore deeper user needs. Notably, the generation of cognitive load does not directly induce negative emotions; however, the reflection process suggests this possibility. Previous research emphasizes that self-reflection behavior positively predicts students’ course performance, and students’ selection and adjustment of strategies through reflection positively affect academic achievement—for example, demonstrating self-reflection by interacting with others, including asking or answering questions online. Adding explanations to ambiguous interactive information is an interaction solution that affects users’ cognitive processes and yields more sophisticated insights from extended exploration. This demonstrates the importance of adding explanatory information to options, which benefits self-reflection or remote online interaction [65]. In a related vein, research on intelligent driving interfaces has explored dynamic design strategies for explanatory information tailored to users’ real-time cognitive state [66], suggesting that explanatory information design grounded in users’ cognitive states may generalize across human–computer interaction scenarios. However, classic online learning platforms such as MOOCs are designed in a more traditional way, with limited attention to users’ self-reflection [67]. This suggests that future human–computer interaction research should pay more attention to users’ reflective behavior and post hoc feedback.
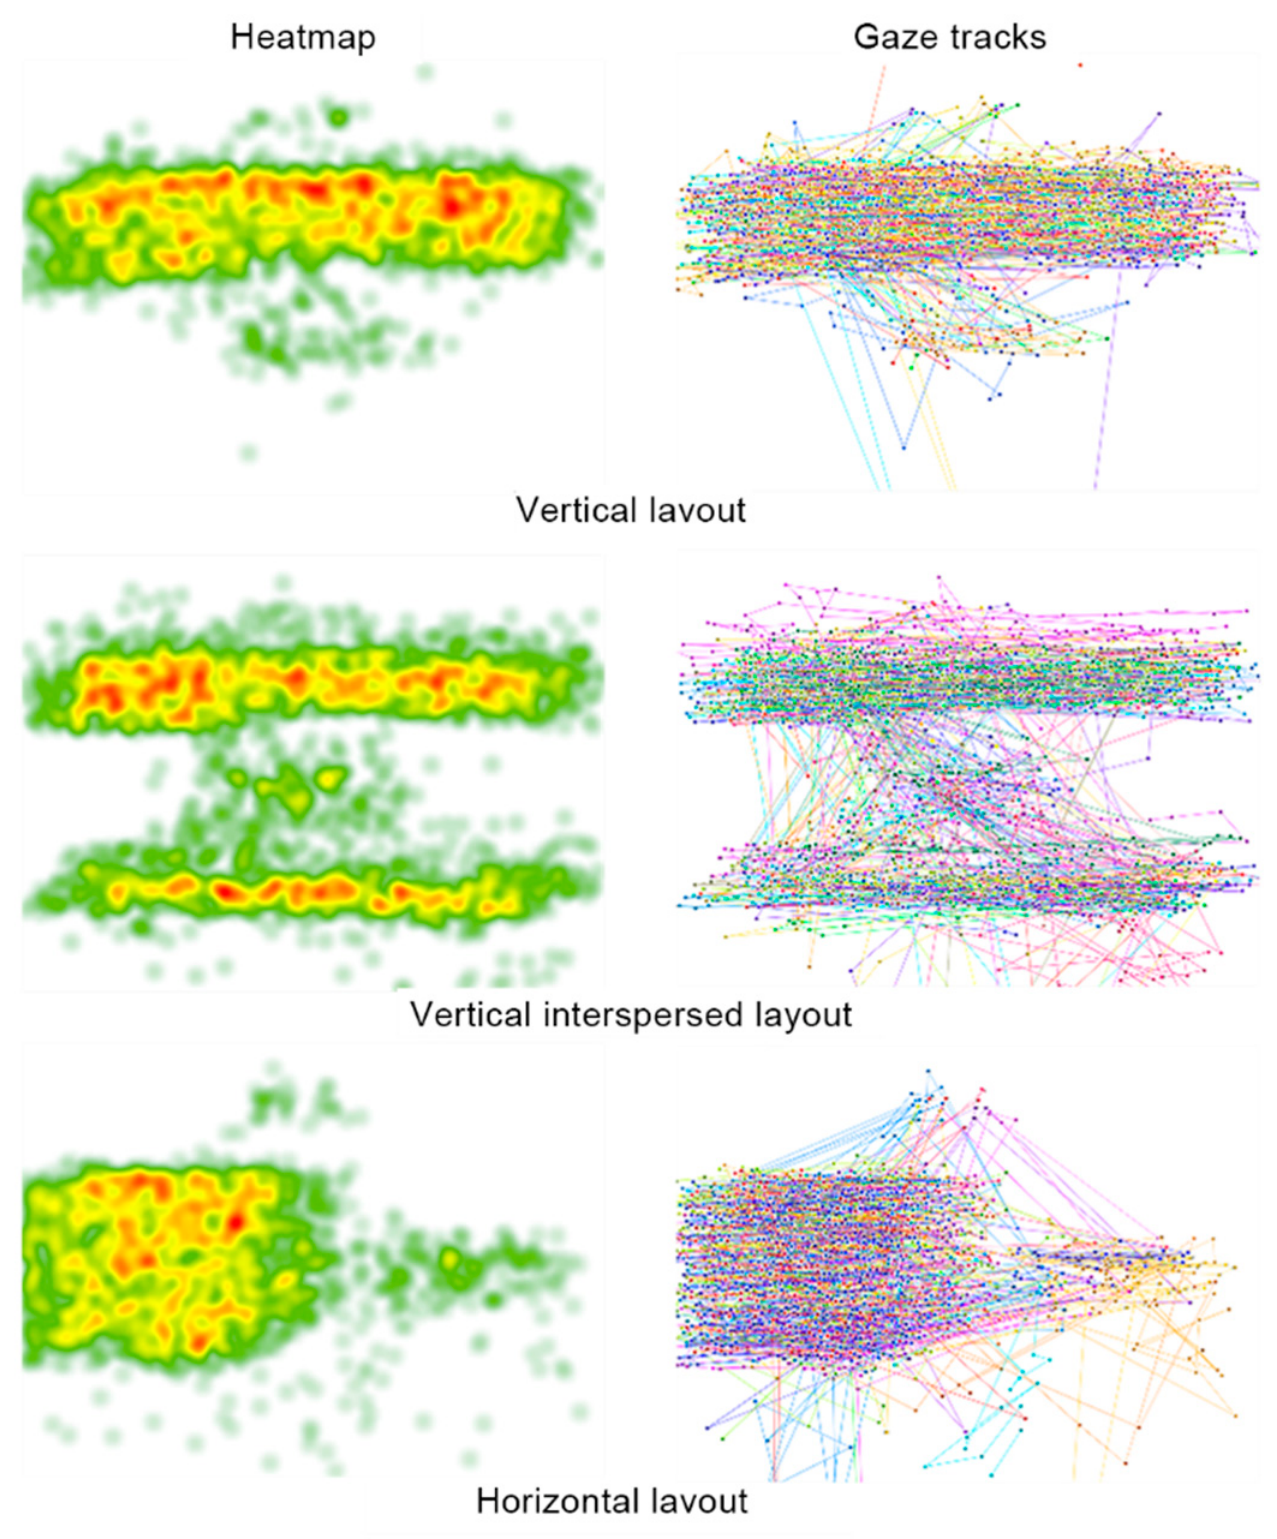
The combination of heatmaps and scanpath plots helps confirm the above findings, as shown in Figure 5. The study found that layouts 1 and 3 focused more on text during reading, whereas layout 2 focused more on images, with more scanning activity between images and text (layout 1-N = 20; layout 2-N = 20; layout 3-N = 21). Although image elements tend to be more attractive, reading and understanding textual information usually consumes more mental resources [68]; at work, people always wish to focus more on text [69]. Therefore, online presenters are advised to use the horizontal layout in slide design where possible, which enables quick capture of key information without dispersing too much attention. Building on previous research, this experiment further explored visual attention behavior and cognitive load under different slide layouts in a simulated online presentation scenario, enriching research on text–image layout and visual behavior in online video communication software.
Figure 5.
Comparison of heatmaps and scanpaths across the three text–image layout materials. Note: The heatmap (left) illustrates fixation density aggregated across trials, with warmer colors indicating higher attentional intensity and cooler colors denoting lower density; The gaze tracks (right) depict individual scanpaths, where colored dots represent discrete fixation points and connecting lines denote saccadic eye movements between them, with distinct colors distinguishing individual trials or participants.
5.2. Online Presenters’ Emotional Interaction Elements
The experimental results support neither H2-1 nor H2-2. H2-2 stated that negative anthropomorphic emoji are more easily noticed than emoji of other emotions, however, there is no eye-tracking data supporting this. H2-1 stated that emoji can evoke emotional tendencies corresponding to their emotional valence. In previous research, pupil size was seen as a sign of emotional arousal, and negative emotions affect pupil changes more strongly [70,71]; meanwhile, pupil dilation may also be a manifestation of increased cognitive load [57,58,59]. So, such problems need to be analyzed in light of the actual situation. Because the experimental variable settings limited the impact of cognitive load that might be introduced by the text, based on the meaning of pupil size and the data, the emotional valence of emoji does indeed influence participants’ emotional perception. Because pupil size did not differ significantly across the three emoji conditions and none of the fixation indices reached significance, the present data do not provide evidence that emoji valence altered emotional experience or processing depth.
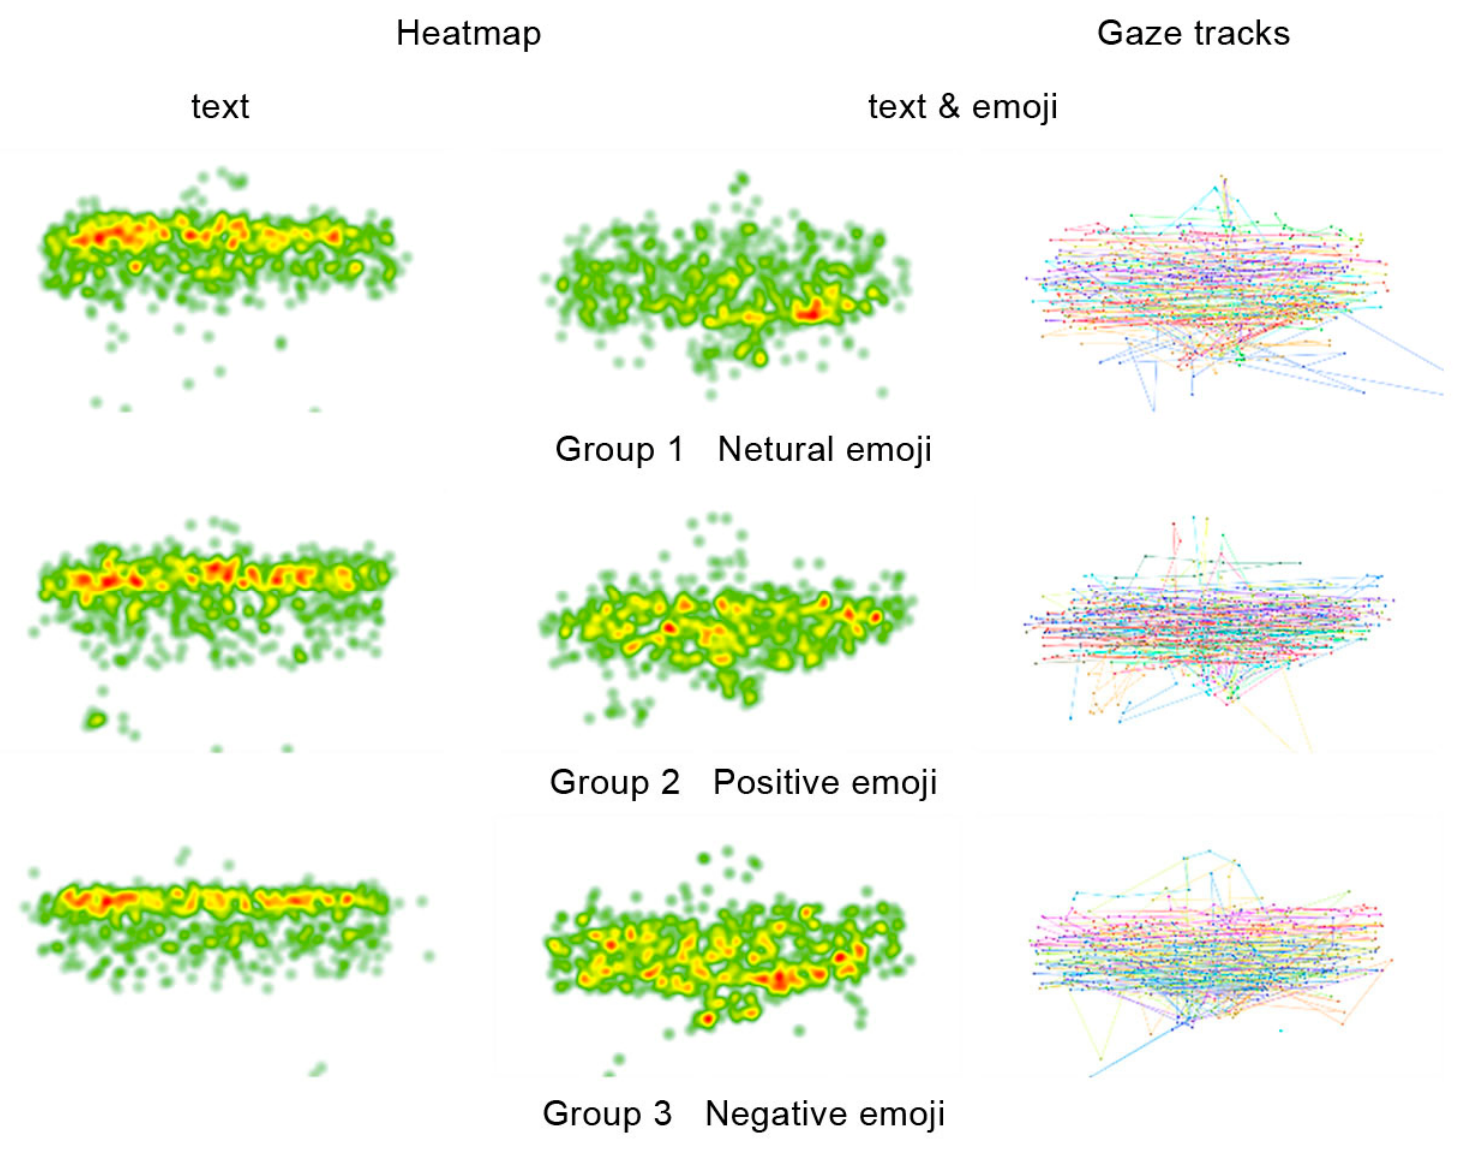
As shown in the grouped heatmaps in Figure 6, after the emoji appeared, participants in the positive and negative emoji group paid increasingly strong attention to both the emoji area and the text area (Group 1-N = 20; Group 2-N = 20; Group 3-N = 21). Combined with the pupil data results, it can be inferred that, under the influence of the emotional emoji, participants engaged in more thinking about the text understanding, producing more scanning. Overall, compared with short sentences, emoji play a slightly different role when reading complex texts. However, our experiment provides no clear evidence that people will notice negative anthropomorphic emoji faster.
Figure 6.
Comparison of heatmaps and gaze tracks across the three materials. Note: The heatmap illustrates fixation density aggregated across trials, with warmer colors indicating higher attentional intensity and cooler colors denoting lower density; The gaze tracks depict individual scanpaths, where colored dots represent discrete fixation points and connecting lines denote saccadic eye movements between them, with distinct colors distinguishing individual trials or participants.
5.3. Performance Feedback
The experimental results did not support H3-1, as the presence of a feedback module alone did not produce measurable positive emotional changes. H3-2 was supported, as participants showed a clear preference for positive feedback. The PANAS results indicated higher self-reported positive affect and lower negative affect under positive feedback. However, the pupil-size data showed no significant differences across the feedback conditions. Therefore, the observed emotional differences were supported by subjective questionnaire responses rather than by the physiological measures. The questionnaire results showed that most participants tended toward the high-feedback option, followed by the control group, and last the low-feedback option, indicating that participants held positive attitudes toward high feedback even though feedback on personal performance should be as objective as possible. This experiment shows that participants generally prefer positive feedback. Therefore, users of online presentations need more incentive from positive feedback mechanisms. Meanwhile, in online presentations, users can enhance positive experiences through visual element support such as feedback information and emoji. That is, to cultivate positivity and confidence, positive incentives and euphemistic phrasing are recommended. This study further explored presenters’ preference for higher feedback regardless of performance, suggesting an intervention for anxiety and avoidance in the online presentation format. This can provide concrete and reliable emotional design evidence for addressing problems such as the lack of emotional connection brought by the rapid development of AI products, helping improve user stickiness and user experience [72]. As online video communication technology develops, users need platforms that enable self-monitoring, self-management, and self-motivation [11]. The experimental results confirm that adding a feedback module to the interface can indeed satisfy user preferences; therefore, when using feedback to motivate presenters, a positively biased feedback scheme should be adopted.
6. Conclusions and Future Research
Recognizing the importance of emotional experience for presenters working online, this study adopted Cognitive Load Theory and user-centered design as its theoretical frameworks to systematically examine how human–computer interaction elements affect presenters’ eye movements and emotional states. The findings provide empirical insights into the design of online presentation interfaces and may inform the development of online video communication and classroom platforms. Focusing on the cognitive perspective and emotional experience, it studies how to optimize interaction efficiency and enhance positive emotions. Through eye-tracking experiments and questionnaires, data on interactive information, cognitive load, and performance feedback were collected. The results show that text–image layout significantly affects reading behavior, with the horizontal layout reducing gaze time on images and enabling rapid capture of visual information. Emotional emoji do not lead to faster attention to the text but did not produce measurable differences in emotional or attentional indices. Positive feedback was associated with greater user preference and more positive self-reported emotional responses. Combining physiological measures and feedback is essential for exploring online speakers’ emotional experience.
Limitations of this study: this study has several limitations. First, the sample was relatively small and consisted of 61 undergraduate students aged 19–23 recruited from a single university in Guangdong. Therefore, the findings should be interpreted as evidence about this population rather than online presenters in general. Further research with larger and more diverse samples is needed to examine their applicability across different age groups, educational contexts, and presentation settings. Second, the study materials focused on graphics and text and did not include other interaction modes, such as audio and video, which may limit the generalizability of the findings. Third, cognitive load was assessed using a single-item self-report measure, which does not distinguish between different types of cognitive load. Future studies could adopt more comprehensive measures to examine these dimensions separately. They could also incorporate richer multimodal materials and use research designs that better distinguish emotional and cognitive mechanisms, allowing physiological changes to be interpreted more cautiously.
Author Contributions
Conceptualization, L.M. and X.M.; methodology, L.M.; software, L.M. and Z.W.; validation, L.M., Z.W. and X.M.; formal analysis, L.M.; investigation, L.M.; resources, X.M.; data curation, L.M. and Z.W.; writing—original draft preparation, L.M.; writing—review and editing, X.M.; visualization, L.M.; supervision, X.M.; project administration, X.M.; funding acquisition, X.M. All authors have read and agreed to the published version of the manuscript.
Funding
This study was supported by the Guangdong Province Social Science Planning Project (Youth Project) under Grant GD25YYS52.
Data Availability Statement
The raw data supporting the conclusions of this article will be made available by the authors on request.
Conflicts of Interest
The authors declare no conflict of interest.
Appendix A
Figure A1.
The roadmap of this article.
References
- Babiker, A.; Faye, I.; Malik, A.; IEEE. Pupillary Behavior in Positive and Negative Emotions. In Proceedings of the 3rd IEEE International Conference on Signal and Image Processing Applications (IEEE ICSIPA 2013); IEEE: New York, NY, USA, 2013; pp. 379–383. [Google Scholar]
- Badam, S.K.; Chandrasegaran, S.; Elmqvist, N. Integrating annotations into multidimensional visual dashboards. Inf. Vis. 2022, 21, 270–284. [Google Scholar] [CrossRef] [Scilit]
- Bennett, L. Putting in more: Emotional work in adopting online tools in teaching and learning practices. Teach. High. Educ. 2014, 19, 919–930. [Google Scholar] [CrossRef] [Scilit]
- Beyersmann, E.; Wegener, S.; Kemp, N. That’s Good News Semantic Congruency Effects in Emoji Processing. J. Media Psychol.-Theor. Methods Appl. 2023, 35, 17–27. [Google Scholar] [CrossRef] [Scilit]
- Biondi, F.N.; Saberi, B.; Graf, F.; Cort, J.; Pillai, P.; Balasingam, B. Distracted worker: Using pupil size and blink rate to detect cognitive load during manufacturing tasks. Appl. Ergon. 2023, 106, 103867. [Google Scholar] [CrossRef] [Scilit] [PubMed]
- Biondi, F.; Balasingam, B.; Ayare, P. On the Cost of Detection Response Task Performance on Cognitive Load. Hum. Factors J. Hum. Factors Ergon. Soc. 2020, 63, 804–812. [Google Scholar] [CrossRef] [Scilit] [PubMed]
- Bonfert, M.; Reinschluessel, A.V.; Putze, S.; Lai, Y.; Alexandrovsky, D.; Malaka, R.; Doering, T. Seeing the faces is so important-Experiences from online team meetings on commercial virtual reality platforms. Front. Virtual Real. 2023, 3, 945791. [Google Scholar] [CrossRef] [Scilit]
- Boutet, I.; LeBlanc, M.; Chamberland, J.A.; Collin, C.A. Emojis influence emotional communication, social attributions, and information processing. Comput. Hum. Behav. 2021, 119, 106722. [Google Scholar] [CrossRef] [Scilit]
- Brucker, B.; Broemme, R.; Ehrmann, A.; Edelmann, J.; Gerjets, P. Touching digital objects directly on multi-touch devices fosters learning about visual contents. Comput. Hum. Behav. 2021, 119, 106708. [Google Scholar] [CrossRef] [Scilit]
- Cajar, A.; Engbert, R.; Laubrock, J. How spatial frequencies and color drive object search in real-world scenes: A new eye-movement corpus. J. Vis. 2020, 20, 8. [Google Scholar] [CrossRef] [Scilit] [PubMed]
- Chandran, P.; Huang, Y.; Munsell, J.; Howatt, B.; Wallace, B.; Wilson, L.; D’Mello, S.; Hoai, M.; Rebello, N.S.; Loschky, L.C. Characterizing Learners’ Complex Attentional States During Online Multimedia Learning Using Eye-tracking, Egocentric Camera, Webcam, and Retrospective recalls. In Proceedings of the 2024 Symposium on Eye Tracking Research and Applications, Glasgow, UK, 4–7 June 2024. [Google Scholar]
- Chen, C.H. Impacts of augmented reality and a digital game on students’ science learning with reflection prompts in multimedia learning. Etr&D-Educ. Technol. Res. Dev. 2020, 68, 3057–3076. [Google Scholar] [CrossRef] [Scilit]
- Cheng, C.; Yang, F. Analyzing visual attention during TAP learning and the effect of epistemic beliefs on the understanding of argument components. Int. J. Sci. Educ. 2022, 44, 1336–1355. [Google Scholar] [CrossRef] [Scilit]
- Coi, L. Educators’ Preparation to Teach, Perceived Teaching Presence, and Perceived Teaching Presence Behaviors in Blended and Online Learning Environments. Online Learn. 2018, 22, 197–220. [Google Scholar] [CrossRef] [Scilit]
- Davalos, E. GazeViz: A Web-Based Approach for Visualizing Learner Gaze Patterns in Online Educational Environment. In Proceedings of the International Conference On Computers in Education 2024, Quezon City, Philippines, 25–29 November 2024. [Google Scholar] [CrossRef] [Scilit]
- Genc Aksaray, S.; Ozcelik, E. Attention mediates the effect of emotional arousal on learning outcomes in multimedia learning: An eye-tracking study. Educ. Psychol. 2023, 43, 38–56. [Google Scholar] [CrossRef] [Scilit]
- Goldenberg, A.; Weisz, E.; Sweeny, T.D.; Cikara, M.; Gross, J.J. The Crowd-Emotion-Amplification Effect. Psychol. Sci. 2021, 32, 437–450. [Google Scholar] [CrossRef] [Scilit] [PubMed]
- Gonzalez, C. The relationship between approaches to teaching, approaches to e-teaching and perceptions of the teaching situation in relation to e-learning among higher education teachers. Instr. Sci. 2012, 40, 975–998. [Google Scholar] [CrossRef] [Scilit]
- Heidig, S.; Müller, J.; Reichelt, M. Emotional design in multimedia learning: Differentiation on relevant design features and their effects on emotions and learning. Comput. Hum. Behav. 2015, 44, 81–95. [Google Scholar] [CrossRef] [Scilit]
- Hsieh, Y.; Chen, K. How different information types affect viewer’s attention on internet advertising. Comput. Hum. Behav. 2011, 27, 935–945. [Google Scholar] [CrossRef] [Scilit]
- Hung, J.C.; Wang, C. Exploring the website object layout of responsive web design: Results of eye tracking evaluations. J. Supercomput. 2021, 77, 343–365. [Google Scholar] [CrossRef] [Scilit]
- Hwang, G.J.; Hsu, T.C.; Hsieh, Y.H. Impacts of Different Smartphone Caption/Subtitle Mechanisms on English Listening Performance and Perceptions of Students with Different Learning Styles. Int. J. Hum.-Comput. Interact. 2019, 35, 333–344. [Google Scholar] [CrossRef] [Scilit]
- Ke, F. Examining online teaching, cognitive, and social presence for adult students. Comput. Educ. 2010, 55, 808–820. [Google Scholar] [CrossRef] [Scilit]
- Kim, H.; Lim, Y.K.; ACM. Teaching-Learning Interaction: A New Concept for Interaction Design to Support Reflective User Agency in Intelligent Systems. In Proceedings of the 2021 ACM Designing Interactive Systems Conference (Dis 2021); ACM: New York, NY, USA, 2021; pp. 1544–1553. [Google Scholar]
- Kinner, V.L.; Kuchinke, L.; Dierolf, A.M.; Merz, C.J.; Otto, T.; Wolf, O.T. What our eyes tell us about feelings: Tracking pupillary responses during emotion regulation processes. Psychophysiology 2017, 54, 508–518. [Google Scholar] [CrossRef] [Scilit] [PubMed]
- Kirtley, C.; Murray, C.; Vaughan, P.B.; Tatler, B.W. Navigating the narrative: An eye-tracking study of readers’ strategies when Reading comic page layouts. Appl. Cogn. Psychol. 2023, 37, 52–70. [Google Scholar] [CrossRef] [Scilit]
- Kret, M.E.; Sjak-Shie, E.E. Preprocessing pupil size data: Guidelines and code. Behav. Res. Methods 2019, 51, 1336–1342. [Google Scholar] [CrossRef] [Scilit] [PubMed]
- Kutsuzawa, G.; Umemura, H.; Eto, K.; Kobayashi, Y. Classification of 74 facial emoji’s emotional states on the valence-arousal axes. Sci. Rep. 2022, 12, 398, Correction in Sci. Rep. 2024, 14, 8935. [Google Scholar] [CrossRef] [Scilit] [PubMed]
- Lee, C.; Pei, W.; Lin, Y.; Granmo, A.; Liu, K. Emotion Detection Based on Pupil Variation. Healthcare 2023, 11, 322. [Google Scholar] [CrossRef] [Scilit] [PubMed]
- Lenhart, A. Social Media & Technology Overview Teens; Pew Research Center: Washington, DC, USA, 2015. [Google Scholar]
- Lu, X.; Ai, W.; Chen, Z.P.; Cao, Y.B.; Mei, Q.Z. Emojis predict dropouts of remote workers: An empirical study of emoji usage on GitHub. PLoS ONE 2022, 17, e0261262. [Google Scholar] [CrossRef] [Scilit] [PubMed]
- Majooni, A.; Masood, M.; Akhavan, A. An eye-tracking study on the effect of infographic structures on viewer’s comprehension and cognitive load. Inf. Vis. 2018, 17, 257–266. [Google Scholar] [CrossRef] [Scilit]
- Mason, L.; Scheiter, K.; Tornatora, M.C. Using eye movements to model the sequence of text-picture processing for multimedia comprehension. J. Comput. Assist. Learn. 2017, 33, 443–460. [Google Scholar] [CrossRef] [Scilit]
- Mayer, R.E.; Estrella, G. Benefits of emotional design in multimedia instruction. Learn. Instr. 2014, 33, 12–18. [Google Scholar] [CrossRef] [Scilit]
- Meng, L.; Tang, C.; Yang, X. Evaluating the emotional impact of virtual expressions: ERPs analysis of smart agent appearance. Behav. Inf. Technol. 2026, 45, 902–917. [Google Scholar] [CrossRef] [Scilit]
- Meng, L.; Wang, Z.; Zhou, J.; Tang, C.; Yang, X. Research on dynamic design strategies for explanatory information in intelligent driving based on user cognitive state. Transp. Res. Part F Traffic Psychol. Behav. 2026, 120, 103656. [Google Scholar] [CrossRef] [Scilit]
- Moore-Adams, B.L.; Jones, W.M.; Cohen, J. Learning to teach online: A systematic review of the literature on K-12 teacher preparation for teaching online. Distance Educ. 2016, 37, 333–348. [Google Scholar] [CrossRef] [Scilit]
- Moreno, R.; Mayer, R. Interactive Multimodal Learning Environments. Educ. Psychol. Rev. 2007, 19, 309–326. [Google Scholar] [CrossRef] [Scilit]
- Mudambi, S.M.; Schuff, D. What makes a helpful online review? A study of customer reviews on amazon.com. Mis Q. 2010, 34, 185–200. [Google Scholar] [CrossRef] [Scilit]
- Nacu, D.; Martin, C.K.; Pinkard, N. Designing for 21st century learning online: A heuristic method to enable educator learning support roles. Educ. Technol. Res. Dev. 2018, 66, 1029–1049. [Google Scholar] [CrossRef] [Scilit]
- Namoun, A. Three Column Website Layout vs. Grid Website Layout: An Eye Tracking Study. In Design, User Experience, and Usability: Designing Interactions, DUXU 2018, Pt II—7th International Conference on Design, User Experience, and Usability (DUXU) Held as Part of 20th International Conference on Human-Computer Interaction (HCI International); Marcus, A., Wang, W., Eds.; Springer: Berlin/Heidelberg, Germany, 2018; Volume 10919, pp. 271–284. [Google Scholar]
- Naylor, D.; Nyanjom, J. Educators’ emotions involved in the transition to online teaching in higher education. High. Educ. Res. Dev. 2021, 40, 1236–1250. [Google Scholar] [CrossRef] [Scilit]
- Olesova, L.; Sadaf, A. Exploring differences between students’ interactions, online presence, and cognitive presence. Distance Educ. 2024, 45, 297–314. [Google Scholar] [CrossRef] [Scilit]
- Paggio, P.; Tse, A.P.P. Are Emoji Processed Like Words? An Eye-Tracking Study. Cogn. Sci. 2022, 46, e13099. [Google Scholar] [CrossRef] [Scilit] [PubMed]
- Pandita, D.; Kumar, V.V.R. Online teaching and its impact on self-monitoring of faculty members: Learnings for the future from a pandemic. In Higher Education Skills and Work-Based Learning; Emerald Publishing: Leeds, UK, 2022. [Google Scholar] [CrossRef] [Scilit]
- Pazhoman, H.; Sarkhosh, M. The Relationship between Iranian English High School Teachers’ Reflective Practices, Their Self-Regulation and Teaching Experience. Int. J. Instr. 2019, 12, 995–1010. [Google Scholar] [CrossRef] [Scilit]
- Ramakrishnan, P.; Balasingam, B.; Biondi, F. Chapter 2—Cognitive load estimation for adaptive human–machine system automation. In Learning Control; Zhang, D., Wei, B., Eds.; Elsevier: Amsterdam, The Netherlands, 2021; pp. 35–58. [Google Scholar] [CrossRef] [Scilit]
- Robus, C.M.; Hand, C.J.; Filik, R.; Pitchford, M. Investigating effects of emoji on neutral narrative text: Evidence from eye movements and perceived emotional valence. Comput. Hum. Behav. 2020, 109, 106361. [Google Scholar] [CrossRef] [Scilit]
- Rosch, J.L.; Vogel-Walcutt, J.J. A review of eye-tracking applications as tools for training. Cogn. Technol. Work 2013, 15, 313–327. [Google Scholar] [CrossRef] [Scilit]
- Skultety, F.; Rostas, J. Implementation process of Performance Based Navigation within the instrument rating pilot training. In Proceedings of the 23rd International Scientific Conference, Transport Means 2019, Palanga, Lithuania, 2–4 October 2019. [Google Scholar]
- Škvareková, I.; Pecho, P.; Ažaltovič, V.; Kandera, B. Number of Saccades and Fixation Duration as Indicators of Pilot Workload. Transp. Res. Procedia 2020, 51, 67–74. [Google Scholar] [CrossRef] [Scilit]
- Snell, J.; Theeuwes, J. A story about statistical learning in a story: Regularities impact eye movements during book reading. J. Mem. Lang. 2020, 113, 104127. [Google Scholar] [CrossRef] [Scilit]
- Stark, L.; Brünken, R.; Park, B. Emotional text design in multimedia learning: A mixed-methods study using eye tracking. Comput. Educ. 2018, 120, 185–196. [Google Scholar] [CrossRef] [Scilit]
- Steinhauer, S.R.; Bradley, M.M.; Siegle, G.J.; Roecklein, K.A.; Dix, A. Publication guidelines and recommendations for pupillary measurement in psychophysiological studies. Psychophysiology 2022, 59, e14035. [Google Scholar] [CrossRef] [Scilit] [PubMed]
- Stickney, L.T.; Bento, R.F.; Aggarwal, A.; Adlakha, V. Online Higher Education: Faculty Satisfaction and Its Antecedents. J. Manag. Educ. 2019, 43, 509–542. [Google Scholar] [CrossRef] [Scilit]
- Sweller, J. Cognitive load during problem solving: Effects on learning. Cogn. Sci. 1988, 12, 257–285. [Google Scholar] [CrossRef] [Scilit]
- Sweller, J. Element Interactivity and Intrinsic, Extraneous, and Germane Cognitive Load. Educ. Psychol. Rev. 2010, 22, 123–138. [Google Scholar] [CrossRef] [Scilit]
- Tang, H. Understanding self-regulated learning and learner performance in MOOCs. Distance Educ. 2024, 45, 244–259. [Google Scholar] [CrossRef] [Scilit]
- Tsai, M.; Wu, A. Visual search patterns, information selection strategies, and information anxiety for online information problem solving. Comput. Educ. 2021, 172, 104236. [Google Scholar] [CrossRef] [Scilit]
- van Gog, T.; Paas, F. Instructional Efficiency: Revisiting the Original Construct in Educational Research. Educ. Psychol. 2008, 43, 16–26. [Google Scholar] [CrossRef] [Scilit]
- Van Thinh, L.; Ngan, H.N.; Tran, L.N.T.; Luan, T.N.; Thi, A.N.; Minh, T.N. The interaction patterns of pandemic-initiated online teaching: How teachers adapted. System 2022, 105, 102755. [Google Scholar] [CrossRef] [Scilit]
- Veugen, M.J.; Gulikers, J.T.M.; den Brok, P. Secondary school teachers’ use of online formative assessment during COVID-19 lockdown: Experiences and lessons learned. J. Comput. Assist. Learn. 2022, 38, 1465–1481. [Google Scholar] [CrossRef] [Scilit] [PubMed]
- Volkov, A.; Rishko, Y.; Kostyukhin, Y.; Sidorova, E.; Boboshko, D.; Savinova, D.; Ershova, V. Using Digital Tools to Teach Soft Skill-Oriented Subjects to University Students during the COVID-19 Pandemic. Educ. Sci. 2022, 12, 335. [Google Scholar] [CrossRef] [Scilit]
- Wang, A.; Yu, S.; Wang, M.; Chen, L. Effects of a visualization-based group awareness tool on in-service teachers’ interaction behaviors and performance in a lesson study. Interact. Learn. Environ. 2019, 27, 670–684. [Google Scholar] [CrossRef] [Scilit]
- Wang, M.; Zhao, Z. A Cultural-Centered Model Based on User Experience and Learning Preferences of Online Teaching Platforms for Chinese National University Students: Taking Teaching Platforms of WeCom, VooV Meeting, and DingTalk as Examples. Systems 2022, 10, 216. [Google Scholar] [CrossRef] [Scilit]
- Watson, D.; Clark, L.A.; Tellegen, A. Development and validation of brief measures of positive and negative affect: The PANAS scales. J. Personal. Soc. Psychol. 1988, 54, 1063–1070. [Google Scholar] [CrossRef] [Scilit] [PubMed]
- Yang, X.; Wang, R.; Tang, C.; Luo, L.; Mo, X. Emotional design for smart product-service system: A case study on smart beds. J. Clean. Prod. 2021, 298, 126823. [Google Scholar] [CrossRef] [Scilit]
- Yang, X.; Yang, B.; Tang, C.; Mo, X.; Hu, B. Visual Attention Quality Research for Social Media Applications: A Case Study on Photo Sharing Applications. Int. J. Hum.–Comput. Interact. 2023, 40, 3827–3840. [Google Scholar] [CrossRef] [Scilit]
- Zhang, H.; Miller, K.F.; Sun, X.; Cortina, K.S. Wandering eyes: Eye movements during mind wandering in video lectures. Appl. Cogn. Psychol. 2020, 34, 449–464. [Google Scholar] [CrossRef] [Scilit]
- Zhang, M.; Hou, G.; Chen, Y. Effects of interface layout design on mobile learning efficiency: A comparison of interface layouts for mobile learning platform. Libr. Hi Tech 2022, 41, 1420–1435. [Google Scholar] [CrossRef] [Scilit]
- Zhu, M.; Bonk, C.J.; Doo, M.Y. Self-directed learning in MOOCs: Exploring the relationships among motivation, self-monitoring, and self-management. Educ. Technol. Res. Dev. 2020, 68, 2073–2093. [Google Scholar] [CrossRef] [Scilit]
- Zu, T.; Hutson, J.; Loschky, L.; Rebello, N.S. Using Eye Movements to Measure Intrinsic, Extraneous, and Germane Load in a Multimedia Learning Environment. J. Educ. Psychol. 2019, 112, 1338. [Google Scholar] [CrossRef] [Scilit]


Disclaimer/Publisher’s Note: The statements, opinions and data contained in all publications are solely those of the individual author(s) and contributor(s) and not of MDPI and/or the editor(s). MDPI and/or the editor(s) disclaim responsibility for any injury to people or property resulting from any ideas, methods, instructions or products referred to in the content. |
© 2026 by the authors. Licensee MDPI, Basel, Switzerland. This article is an open access article distributed under the terms and conditions of the Creative Commons Attribution (CC BY) license.