


Abstract
This study proposes a methodology for developing an integrated risk index at municipal level, applied to the entire territory of the Lombardy region. The conceptual framework adopts a pragmatic approach based on the formula R = H × D (Risk = Hazard × Damage), integrating diverse institutional datasets—from national or regional geoportals—with empirical evidence drawn from the regional damage register (Ra.S.Da.). The methodology harmonises data relating to six types of risk: wildfires, seismic, hydraulic, hydrogeological, avalanches and adverse weather events. The main methodological steps included normalising the data to a common scale. The normalised risk values associated with each analysed phenomenon were aggregated using an additive approach, yielding a single integrated risk index for each municipality in Lombardy. The results highlight marked spatial variability in risk, enabling the identification of areas where multiple hazard factors coexist. The final output consists of a composite risk map implemented within an interactive WebGIS platform, designed as a reproducible and transparent decision-support tool to assist stakeholders in designing tailored civil protection plans. This article aims to highlight the wide range of risks considered and guide both local and regional stakeholders in the design of ad hoc civil protection plans. This work synthesises the joint efforts of researchers and decision makers, aiming to develop a reproducible, adjustable, and transparent decision support tool.
1. Introduction
According to the last report published by the World Economic Forum (WEF), the world’s population is now increasingly exposed to risk due to the interplay of multiple anthropogenic, socio-economic and environmental factors that contribute to increasing the vulnerability of regions and communities [1]. In this context, climate change often acts as a veritable risk multiplier [2], amplifying pre-existing fragilities and intensifying the frequency and intensity of extreme events [3]. Among the main factors increasing exposure and vulnerability are rapid and unplanned urbanisation processes [4], which encourage settlement in inherently hazardous areas (such as floodplains or unstable slopes) [5], and increase soil sealing [6,7], reducing natural drainage capacity [4] and raising the likelihood of hydrogeological instability [8]. At the same time, environmental degradation and biodiversity loss compromise the protective function of natural ecosystems [9]. Further critical factors include population growth, poverty and socio-economic inequalities, which often force vulnerable sections of the population to live in precarious and poorly served areas, reducing their capacity to adapt and respond [5,10]. Moreover, infrastructure is often obsolete or inadequate and was not designed to cope with current climatic conditions, as well as geopolitical dynamics and conflicts that undermine territorial stability and access to essential services [11]. Taken together, these interlinked factors make communities more fragile and increase risk at a faster rate than mitigation and prevention measures can reduce their effects [12].
In this perspective, urban areas represent critical points [13]. Cities concentrate strategic infrastructures, economic activities, and essential services, amplifying potential losses and cascading impacts during disruptive events [8,13]. At the same time, rural and remote municipalities are often characterised by limited accessibility, lower redundancy of infrastructures, and reduced emergency response capacity, which may increase vulnerability even in contexts of lower population density [4]. As a result, risk should be interpreted through an urban–regional lens, where urban cores, peri-urban areas, agricultural plains, and mountainous settlements are functionally interconnected through mobility networks and service provision systems. Under this framework, localised events—such as floods, landslides, or infrastructure failures—can generate impacts that propagate across administrative boundaries and affect the resilience of the entire territorial network [11,14].
As the world becomes increasingly exposed to risk, there has been growing interest in quantifying it, with many seeking to understand how to measure risk across a variety of contexts [15].
In the literature, the wide variety of approaches dealing with the risk assessment over recent decades can be grouped into four main categories: indices focused on individual risks, often characterised by a high degree of technical precision and applied to specific hazards such as seismic, hydro-meteorological or fire risk [16,17,18]; risk indices that work with integrated approaches, based on dimension reduction techniques enabling the combination of geophysical and socio-economic variables into a composite natural risk index [6,19,20]; multi-risk approaches, which represent the cutting edge and seek to include domino effects and interactions between socio-physical components, often requiring dynamic weightings and participatory processes with stakeholders to reflect different operational priorities depending on the context and the type of threat [21,22,23]; and finally, social vulnerability indices, which emphasise socio-demographic components and community resilience, highlighting the importance of disaggregating data to avoid underestimating vulnerable populations [24,25]. The displayed literature shows that the indices are essential tools for disaster risk management processes. For example, they enable the identification of hotspots and priorities for action at different scales [22,26,27], support early warning systems [28,29] and facilitate the integration of risk reduction into governance and planning processes [30,31,32]. However, the increasing dynamism of risk can alter hazard patterns and amplify pre-existing socio-economic vulnerabilities [2]. In this framework, both the gap between calculated risk and perceived risk, which can influence public response and the effectiveness of prevention policies [33] and the limits of institutional capacity to cope with increasingly frequent extreme events [34].
This study proposes a methodology to develop an integrated risk index that was developed combining three main categories of regional information: (i) risk data directly provided by the Lombardy region; (ii) data related to territorial hazard provided by Lombardy region and integrated with national datasets; and (iii) verified damage datasets derived from officially reviewed regional registry of damage (Ra.S.Da.) at the municipal level. In this paper, all data are harmonised at the municipal scale and standardised to ensure spatial comparability across municipalities of different sizes. Within this framework, the research was carried out using a methodological approach divided into successive stages. Starting with the collection and harmonisation of data from institutional sources, municipal indicators were developed for the various types of risk under consideration and subsequently standardised to ensure comparability. The individual indicators were then integrated into a composite index at municipal level. For this reason, in this study, the term “integrated” was used to refer specifically to the combination of multiple hazard-specific risk components within a common municipal-scale index, rather than to the explicit integration of all conventional risk dimensions (hazard, exposure, and vulnerability). The methodology is aimed at identifying a risk index that can serve as a guide for municipalities when drafting their Municipal Civil Protection Plan. To this end, the procedure integrates territorial data and hazard indicators, translating them into a synthetic index that can be compared across different risk scenarios. This index enables the Municipal Civil Protection Authority to define planning priorities, structure the operational response model, and identify prevention and mitigation measures consistent with national and regional guidelines. Within this context, this study pursued three main objectives: (i) to develop a composite municipal risk index based on heterogeneous institutional datasets, (ii) to explore spatial patterns of risk distribution and clustering across Lombardy’s municipalities through spatial statistical analysis, and (iii) to build a decision-support platform that can support local civil protection planning.
The proposed framework aims to bridge the gap between the increasing availability of spatial risk information and the practical needs of territorial governance. By providing a standardised municipal-scale assessment and an accessible visualisation environment, the approach supports local authorities and civil protection practitioners in interpreting complex risk patterns and identifying areas requiring further investigation or targeted actions. Accordingly, this study aims to develop a reproducible municipal-scale risk assessment framework capable of integrating heterogeneous risk information and translating complex spatial patterns into actionable knowledge for local risk governance.
2. Materials and Methods
The methodological workflow consists of five main phases: (i) identification of the study area, (ii) the conceptualisation of the methodological framework, (iii) the identification of relevant risk phenomena based on the regional civil protection framework, (iv) data collection, harmonisation at the municipal level and construction of hazard-specific indicators, and (v) aggregation into an integrated risk index. The phases and their outputs are synthesised in Figure 1.
Figure 1.
Schematic representation of the methodological framework adopted for the construction of the integrated municipal risk index, including data acquisition, hazard and damage assessment, normalisation procedures, and risk integration.
2.1. Study Area Identification
The study area encompasses the entire Lombardy region, located in northern Italy, as shown in Figure 2. It is the fourth-largest Italian region by area (23,844 km2) and the most populous, with 10,065,694 residents as of 1 January 2026 [35]. Lombardy comprises 1502 municipalities, ranging from sparsely populated mountain hamlets to densely inhabited metropolitan areas. The region exhibits a highly diverse physiography, encompassing several Alpine sectors, the Po Plain, and the northern Apennine units of the Oltrepò Pavese. This environmental heterogeneity, coupled with marked variations in population density, exposes Lombardy to a wide range of natural and anthropogenic risks.
Figure 2.
Location of the study area within the Lombardy Region (Northern Italy).
2.2. Conceptual Framework
This study’s conceptual framework is built on an operational approach. It aligns with planning provisions in key legal sources currently in force in Italy, such as the Civil Protection Code [36] and National [37,38] and Regional Laws [39]. By consulting these official sources, it was possible to identify the types of risk explicitly considered relevant within our institutional framework. This approach defined a scope of analysis aligned with actual planning requirements and consistent with the main event scenarios envisaged at the regional level for Lombardy.
The adopted approach for compiling the index was pragmatic and data driven. It focused on collecting and utilising available data from all sources and formats for each natural phenomenon that may pose a risk. For each identified risk, the most reliable and geographically comprehensive datasets available from official national and regional sources were selected, with a preference for datasets that offer both high spatial resolution and consistent coverage across the entire study area. When multiple data formats existed (risk, hazard, or damage), priority was given to those that are routinely used in institutional planning or that best reflect the official methodology prescribed by regulatory frameworks [21]. Particular emphasis was placed on using official and publicly verified information to ensure reproducibility and acceptance by stakeholders [40]. In situations where only partial or indirect data were available, complementary sources were integrated to fill information gaps [41]. Since these datasets are heterogeneous in nature and content, the conceptual framework assumes that the available information can describe different components of risk: (i) risk data already produced by public authorities, (ii) data on physical hazard or the probability of occurrence of the phenomenon, and (iii) empirical evidence of impact through verified damage data. All formats of data were converted to a risk value using the formula:
This formula expresses the risk (R) as a function of hazard (H) and expected damage (D), which has deep roots in disaster risk research and has been widely adopted in both policy and scientific communities [42,43].
Therefore, for each municipality, the risk values associated with individual risk-inducing phenomena were calculated separately and subsequently aggregated through an additive sum, resulting in a synthetic integrated risk index defined by the following formula:
The integrated risk index () is computed as the sum of the risk values () associated with each type of event (k) within municipality (i). The resulting value represents the cumulative contribution of all considered hazards at the municipal scale. This approach provides a concise, comparable measure of the overall territorial risk profile that can be directly interpreted for decision-making and municipal planning. This notation—where i denotes the municipality and k the hazard type—retains the same meaning in the equations that follow throughout the manuscript.
2.3. Data Sources and Classification of Calamitous Events
In constructing the integrated risk index, only the main types of natural risks relevant to Lombardy civil protection planning were considered, i.e., wildfire, seismic, hydraulic, hydrogeological, avalanche and adverse weather risks. For each phenomenon, datasets from institutional sources were collected, prioritising information already available as risk or hazard indicators. The data used in this study were obtained from national sources (e.g., “Flood risk management Plan” [44]) and the regional geoportal [45].
In some cases, the risk-related information was only partially available, which prevented a direct and comparable assessment of risk at municipal level. To address this limitation, an empirical impact score was derived from the Ra.S.Da. (Raccolta Schede Danni) database, an official damage reporting system managed by the Lombardy Region. Operational since 2003, Ra.S.Da. enables municipalities and other authorised public bodies to systematically report damage to public assets caused by natural disasters through a standardised digital platform. The system supports post-event damage assessment, emergency management, and civil protection planning by providing an institutional and continuously updated repository of verified damage records. Each report contains three main categories of information: (i) administrative and spatial metadata (e.g., municipality, province, and reporting authority), (ii) event descriptors (event type, occurrence date, and damage description), and (iii) damage-related economic information [46]. In this study, the Ra.S.Da. database was used to derive an empirical impact score for each risk category, complementing institutional datasets and enabling the construction of a consistent and comparable municipal-scale integrated risk index.
The data used in our study covers the period from 2003 to 2025. However, in 2021, a new interface was developed to align the nomenclature of Ra.S.Da model with Civil Protection Code [36] requirements and administrative changes occurred over time. Consequently, Ra.S.Da records have varied over time, necessitating a harmonisation process to ensure spatial and semantic consistency of the datasets. The harmonisation process was conducted following a structured sequence of steps.
- (1)
- Updating municipal nomenclature: all the municipal nomenclature was updated according to the most recent official register [47] to account for administrative changes that occurred during the observation period (mergers, name changes). For example, the original municipality names (Canevino, Ruino and Valverde) were harmonised and replaced with the current administrative denomination Colli Verdi, established through the merger of the three municipalities and effective since 1 January 2019.
- (2)
- Standardising event-type nomenclature based on a semantic analysis: harmonisation was achieved by aligning the terminology used in the first damage records dataset (2003–2021) with the official risk classification adopted in the Civil Protection Code [36], which was implemented in the second Ra.S.Da. dataset (2021–2025). Specific event descriptions, e.g., “frana” (landslide), were consequently reassigned to their respective institutional risk categories, e.g., “rischio idrogeologico” (hydrogeological risk), thus preserving their original meaning while ensuring comparability with the damage datasets employed in the analysis.
- (3)
- Qualitative review of ambiguous entries: records with generic classifications “altre emegenze” (other emergencies) were reviewed and reclassified through a double-blind analysis, involving two independent researchers with a third researcher resolving any disagreements [48]. The re-labelling was done by reading the description of each Ra.S.Da. record and manually assigning it to a different category wherever possible.
Once the data from Ra.S.Da. registry was cleaned and harmonised, the damage data were aggregated at the municipal level and transformed into a specific damage score (D) for each risk, thus obtaining a set of indicators that are comparable and can be integrated with other available datasets. Specifically, for each municipality i and each event type k, the D was defined as:
where represents the number of Ra.S.Da. records in which the municipality is identified as i and the event type is classified as k, while indicates the total number of Ra.S.Da. records associated with municipality i, regardless of the event type. The damage score was initially calculated as the relative frequency of reports associated with the event in question. Subsequently, municipalities with no reports were assigned a baseline value, whilst positive values were normalised using a min–max transformation within the interval [a,b].
where Dk,norm represents the normalised damage index for the municipality i, Dk max and Dk min are the minimum and maximum positive damage values observed in the dataset, and (a) and (b) are the lower and upper bounds of the normalisation interval, respectively. Formula (4) was designed to preserve the distinction between the absence and presence of the analysed phenomenon. Municipalities with a raw score equal to zero were automatically assigned a baseline value . In our case, all positive observations were subsequently rescaled using min–max normalisation over the chosen interval [0.02, 0.99]. This approach ensures that the value 0.01 is uniquely associated with the absence of the phenomenon, while all observed occurrences are mapped onto a continuous and strictly higher range.
Table 1 summarises the dataset used for each event type; the nature of the information (risk, danger, or damage), and the institutional source are also specified to ensure the maximum transparency and replicability of the process. A more detailed table containing all the links to the sources is included as Appendix A. In addition, a GeoPackage containing the geospatial datasets that can be redistributed under their original licences, the derived hazard-specific layers, the final integrated risk index, and the associated QGIS project is provided as Supplementary Material to facilitate the reproducibility and further exploration of the analysis.
Table 1.
Overview of the datasets used in the study, including the hazard type considered, data format, and source (see the complete list in Appendix A).
2.4. Calculation of Risk Values for Each Event Type
The methodological workflow adopted for the development of the integrated risk index was based on the OECD guidelines for the construction of composite indicators, which include the harmonisation, normalisation, and aggregation of heterogeneous variables [49]. As shown before in Table 1 (Section 2.3), the sources provided varied information: sometimes expressed as risk values, sometimes as hazard levels, or as historical damage data. A differentiated methodological procedure was defined according to the type of source data to ensure the harmonisation between the risk values of each event type. All variables were standardised to a comparable scale using different types of monotonic linear transformations, preserving the ordinal structure of the data and ensuring invariance with respect to the original unit of measurement.
The following subsections describe the methodological procedures adopted for each of the data scenarios identified. Each subsection begins with a general description of the processing strategy applied to that specific data typology, followed by a detailed account of the operations performed for each of the risk categories considered in this study.
2.4.1. Risk Data
The risk information was expressed through ordinal qualitative classes representing progressively increasing levels of risk. Values were rescaled within a predefined interval to ensure consistency and comparability with the other risk indicators included in the integrated index, following the principle of transforming heterogeneous variables onto a common measurement scale [49]. The adoption of predefined normalisation bounds represents a methodological choice supported by the composite indicator literature, which recognises the use of fixed reference values to harmonise variables originating from different datasets and measurement systems [50]. Furthermore, adopting harmonised numerical scales reduces the risk of implicit weighting effects that may arise from heterogeneous scaling procedures, ensuring that each risk component contributes to the final integrated index according to its intrinsic variability rather than differences in the normalisation process [51].
To preserve the original classification schemes, the normalisation was based on the theoretical minimum and maximum classes defined by the institutional datasets rather than on the classes effectively observed in the study area. This approach ensures methodological consistency across all municipalities and maintains the relative significance of each risk category, even when some classes are not represented within the analysed dataset.
The normalisation was performed according to the following equation:
where is the normalised risk value associated with municipality , is the corresponding ordinal risk class, and denote the theoretical minimum and maximum classes of the original classification, and a and b represent the lower and upper bounds of the normalised scale. Normalisation bounds were predefined as part of the harmonisation procedure to place heterogeneous indicators on numerically comparable scales. In particular, the bounds were selected to prevent variables derived through different processing pathways from acquiring disproportionately different numerical ranges and, consequently, from exerting unintended implicit weights during additive aggregation. This was particularly relevant for the event type, which data were directly available as a risk indicator, unlike the other components derived through the two-step combination of hazard and damage. In our case, the values were set to 0.0001 and 0.55. This procedure was applied to the wildfire risks dataset. The reclassification, normalisation and assessment procedures were carried out directly within the GIS environment using Python code. All scripts developed for the analysis are provided as Supplementary Material.
Wildfire risk. The dataset for the wildfire risk was derived from the vector layer “Rischio_AIB_Comuni” (cf. Table 1, Section 2.3). The vector layer is distributed by the regional geoportal under the CC-BY 4.0 license. The qualitative risk classes were converted into ordinal numerical values that reflect increasing levels of risk, as shown in Table 2. Then, the quantitative score was linearly normalised with Equation (5).
Table 2.
Reclassification scheme adopted for wildfire risk classes and corresponding normalised scores.
2.4.2. Hazard Data
The original hazard layers—shown in Table 1, Section 2.3—were processed using geoprocessing procedures developed in Python, designed to aggregate the data at the municipal administrative level and subsequently normalise the resulting values. The hazard datasets were provided in two different formats. Some indicators, such as seismic hazard, were characterised by a single value assigned to the entire municipal territory, whereas others represented hazard conditions through spatially distributed classes or hazard zones, with different levels of intensity associated with specific areas within the municipality.
For hazard datasets provided as a single value associated with the entire municipal territory, the hazard component was directly derived from the value assigned to each municipality. Since the original hazard information was expressed through ordinal classes, these classes were first converted into quantitative scores according to their relative severity, ensuring that higher values corresponded to increasing hazard conditions. The resulting raw hazard values were subsequently normalised using Equation (6) to obtain comparable municipal hazard indicators.
where is the normalized hazard value associated with municipality , is the corresponding ordinal hazard class, and denote the theoretical minimum and maximum classes of the original classification, and a and b represent the lower and upper bounds of the normalised scale. This procedure was applied to the seismic data.
Seismic hazard. The dataset for the seismic risk was derived from the vector layer “Classificazione_sismica_dei_comuni” (cf. Table 1, Section 2.3). The vector layer is distributed by the regional geoportal under the CC-BY 4.0 license. In accordance with national legislation, the region provides a list of municipalities, together with their classification into one of the four zones—in descending order of hazard—into which the national territory has been reclassified. Hazard classes were first reclassified so that higher numerical values corresponded to higher risk levels, as Zone 1 indicates the highest seismic risk zone and Zone 4 the lowest risk area. Specifically, the original qualitative classes were reassigned to a quantitative score as shown in Table 3. The municipal hazard score was calculated by applying Formula (6).
Table 3.
Reclassification scheme adopted for seismic hazard classes and corresponding normalised scores used in the analysis.
For hazard datasets provided as spatially distributed information, the hazard component was calculated by processing the geographic layers containing the spatial distribution of hazard classes within the municipal boundaries. Specifically, for each municipality, identified by the national municipality identifier (ISTAT code), the area values are aggregated, distinguishing them by hazard class c and assigning increasing weights corresponding to hazard severity. In this way, a weighted index is calculated relative to the total municipal value. The formula applied in this study is summarised below:
where represents the raw hazard score associated with hazard type in municipality , computed as the weighted contribution of the areas exposed to the different hazard classes. In this formulation, denotes the municipal subarea affected by the hazard class under consideration, is the total municipal area, and Kc is the weight assigned to the corresponding hazard class according to its relative severity.
Then, the values normalisation was done using the following formula:
where is the normalised hazard value. Municipalities for which no hazard is observed are assigned the baseline value = 0.01, while all positive hazard values are rescaled within the interval [a, b] through a min–max transformation [0.02, 0.99]. The terms and identify the minimum and maximum positive hazard values observed across the study area for the k event type and are used to preserve the relative differences among municipalities while ensuring comparability with the other indicators included in the integrated risk assessment.
The previously described steps are executed sequentially by a Python code, and only the final value is automatically written to a new field within the GIS layer. All scripts developed for the analysis are provided as Supplementary Material. This procedure was applied to flood, hydrogeological, and avalanche risk data.
Hydraulic hazard. The dataset for flood hazard was derived from the PGRA documentation, distributed through the regional geoportal under the CC-BY 4.0 license. The vector layer used was “Pericolosità_RP_CR” (cf. Table 1, Section 2.3). Since overlapping polygons associated with different hazard scenarios were present in the original dataset, a hierarchical prioritisation clipping procedure was applied based on the classes reported in the CODSCENAR attribute field. So, in cases of spatial overlap, polygons associated with higher hazard levels were given precedence over those with lower hazard levels. The clipping procedures were implemented through a Python script within QGIS environment. The resulting hazard layer was then spatially associated with municipal boundaries to identify the portions of municipal territory affected by flood hazard. Municipal hazard values were subsequently calculated as a weighted function of the extent and severity of the hazard classes using Equation (7) and were finally normalised using Equation (8) to obtain the hazard component employed in the integrated risk assessment. Table 4 shows the correspondence between hazard classes and their assigned weights. The weights were assigned in proportion to the return periods to which the hazard categories refer.
Table 4.
Hydraulic hazard classes and corresponding weights adopted for the calculation of the municipal hazard component.
Hydrogeological hazard. The dataset for hydrogeological hazard was derived by integrating the regional hydrogeological instability inventory—contained in PAI documentation distributed through the regional geoportal under the CC-BY 4.0 license in the vector layer “Dissesti_poligonali” (cf. Table 1, Section 2.3).—with information from the Italian Landslide Inventory (IFFI)—maintained by ISPRA. A spatial join was performed to link ISPRA hazard data to Lombardy regional polygons, enabling the use of consistent hazard classes across the Italian territory. Features unrelated to landslide processes were excluded from the original dataset, while the remaining landslide polygons were spatially associated with the corresponding IFFI records and subsequently linked to municipal administrative boundaries. The hazard classes reported in the “per_fr_ita” attribute field were converted into numerical weights that reflect increasing severity levels. Municipal hazard values were then computed as the weighted contribution of landslide-affected areas relative to the total municipal area using Equation (7) and subsequently normalised following Equation (8) to obtain the hazard component used in the risk assessment framework. Table 5 shows the correspondence between hazard classes and their assigned weights. The weights are assigned following a semantic logic.
Table 5.
Hazard classes considered for hydrogeological instability and associated weights used for the computation of the municipal hazard index.
Avalanche hazard. The avalanche hazard was assessed using the same datasets and the procedure as the hydrogeological hazard assessment. Since both indicators originate from the regional hydrogeological instability inventory, the only methodological difference concerns the selection of the hazard features: in this case, only the polygons belonging to avalanches were selected.
To obtain the corresponding risk indices at the municipal level, each hazard value was multiplied by the damage score in accordance with Formula (1) in Section 2.3. This made it possible to obtain a municipal-level risk index for each event type.
Once the final integrated risk index had been obtained, two complementary analyses were performed to assess, respectively, the robustness of the methodological choices and the spatial structure of the resulting index. As the hydraulic, hydrogeological and avalanche hazard components rely on numerical weights assigned to ordinal hazard classes, the influence of these weights on the resulting municipal values was tested through a sensitivity analysis. The effect of weighting represents an important source of uncertainty in composite indicators and spatial multi-criteria models, and testing alternative weighting configurations can therefore provide useful information on the robustness of the resulting outputs [52,53,54]. First, a Monte Carlo approach was used to generate 1000 alternative weighting configurations by randomly varying the non-reference weights within ±20% of their baseline values, while maintaining the weight associated with the highest hazard class as the reference and preserving the original ordinal hierarchy among classes. For each simulation, the municipal hazard values were recalculated and re-normalised using the same procedure adopted for the baseline analysis. Variability was assessed through the coefficient of variation and mean absolute difference from the baseline, while Spearman’s rank correlation coefficient was used to evaluate the stability of the municipal ranking. Second, an equal-weight scenario was used as a stress test to assess the dependence of the municipal ranking on the adopted weighting structure by removing the prioritisation among hazard classes. Spearman’s rank correlation coefficient and the mean absolute difference from the baseline were used to compare the two configurations. Both analyses were implemented through a dedicated Python script, which is provided as Supplementary Material to ensure reproducibility.
2.4.3. Damage Data
For events without institutional datasets describing hazard or risk levels on a coherent scale, the risk is calculated by assuming a uniform hazard value across the entire study area. In methodological terms, the hazard component was set equal to 1 for all municipalities, under the assumption that the available information only allowed the reconstruction of the territorial distribution of observed impacts rather than the physical probability of occurrence of the phenomenon itself. Under this assumption, the final risk value coincides with the municipal damage score derived from the Ra.S.Da. records:
represents the risk value for the hazard type k associated with the municipality , while corresponds to the normalised damage score calculated from the frequency of recorded damage events. This methodological approach was applied exclusively to adverse weather phenomena.
Adverse weather phenomena. The damage score data were directly spatially associated with the municipalities in which the reported impacts occurred, ensuring a consistent spatial linkage between recorded damage and administrative units. This procedure enables the coherent integration of this hazard category within the composite risk index, while maintaining methodological consistency and comparability with all other hazard types considered in the study.
Given the heterogeneity of the available regional datasets, different processing procedures were required to derive comparable risk values for each hazard category. Although the original data sources differed in terms of structure and information content (hazard, risk, or damage data), all indicators were ultimately transformed into standardised municipal-level risk values. A summary of the adopted processing workflow is provided in Table 6.
Table 6.
Summary of the methodological framework adopted for the calculation of municipal risk indices, including the hazard component, damage indicator, normalisation procedure, and final risk formulation for each hazard type.
2.5. Aggregation of Risks Value
Prior normalisations ensure that the indicators are standardised on a common scale, the order is maintained, heterogeneous phenomena can be compared, and a clear distinction is made between the presence and absence of a phenomenon, as shown in Formulas (4) and (8) presented in the subchapters before. The final integrated risk index was constructed through an additive aggregation procedure following Formula (2) in Section 2.2. The aggregation was performed at the municipal scale, assuming that each hazard contributes independently to the overall territorial risk profile. The derived expression is:
The additive aggregation approach was selected to preserve the contribution of each individual hazard while generating a synthetic, easily interpretable indicator suitable for territorial comparison and civil protection planning. Unlike multi-hazard approaches based on cascading or interacting effects, the proposed methodology does not model interdependencies among hazards; instead, it provides an integrated representation of the cumulative territorial criticalities affecting each municipality.
Since numerical risk indices may be difficult to interpret for non-technical users, the continuous risk values were subsequently transformed into five qualitative risk classes. The classification was performed using the Natural Breaks (Jenks) method, which identifies class boundaries by maximising differences between groups while minimising variability within each class [55]. This approach facilitates the communication of risk patterns and supports decision-making activities by providing an intuitive representation of the spatial distribution of risk levels [56].
Once the final integrated risk index had been obtained, two complementary analyses were performed to assess, respectively, the robustness of the methodological choices and the spatial structure of the resulting index. First, a sensitivity analysis, aimed at verifying the potential implicit weighting resulting from the specific normalisation applied to the datasets for which risk data were directly available (Section 2.4.1). Second, a spatial autocorrelation analysis. The sensitivity analysis was carried out using Monte Carlo approach, by perturbing the contribution of the relevant risk component by ±20% across 1000 simulations and assessing the stability of the ranking of the municipalities relative to the reference configuration using Spearman’s rank correlation coefficient. Spatial autocorrelation analysis was performed to determine whether its geographical distribution showed a statistically significant spatial structure rather than a random pattern. Global Moran’s I was first calculated to assess overall spatial autocorrelation, using a first-order Queen contiguity matrix and row-standardised spatial weights. A first-order Queen contiguity spatial weights matrix was adopted, defining municipalities as neighbours when sharing either a boundary or a vertex. This approach is widely used to investigate spatial dependence among administrative units and has been applied in studies addressing natural hazards, disaster vulnerability, and spatial risk patterns [57,58]. In particular, Queen contiguity was considered appropriate for the present analysis because the objective was to identify spatial clustering among directly adjacent municipalities rather than to model the distance-dependent propagation of a specific physical process. No distance-decay function was therefore applied. As with other spatial analyses conducted within geographically bounded study areas, potential boundary effects may occur because municipalities located along the regional border have a necessarily truncated neighbourhood structure [59]. Nevertheless, the spatial weights matrix was intentionally restricted to Lombardy municipalities to maintain consistency with the regional scope of the analysis. The statistical significance of the spatial autocorrelation was evaluated through 999 random permutations of the municipal index values. Local spatial clustering was subsequently investigated using the Getis-Ord Gi* statistic, which identifies statistically significant concentrations of high values (hotspots) and low values (coldspots). Gi* results were classified at the 90%, 95% and 99% confidence levels according to their z-scores. The combined use of spatial autocorrelation and local clustering statistics is widely applied to distinguish global spatial dependence from geographically localised concentrations of high and low values, including in natural-hazard applications [60]. Campione d’Italia was excluded exclusively from these analyses because it has no contiguous neighbours within the Lombardy municipal dataset; consequently, 1501 municipalities were analysed. The analyses were implemented through a dedicated Python script, provided as Supplementary Material to ensure reproducibility.
2.6. The WebGIS
To enhance the practical applicability of the proposed framework and support local governance processes, the results were implemented within a WebGIS platform designed for the interactive exploration of risk information at the municipal scale. In addition to the qualitative risk classes, the WebGIS interface provides a graphical summary of the individual risk components contributing to the overall risk index for each municipality. Specifically, the relative contribution of each hazard category is displayed through a histogram, allowing users to immediately identify the dominant risk factors within the selected administrative unit and facilitating a more comprehensive interpretation of the results.
3. Results
3.1. Risk-Specific Municipal Risk Maps
The hazard-specific risk assessment revealed marked spatial differences across Lombardy. Figure 3 illustrates the municipal-scale distribution of risk values for the six analysed hazard categories, highlighting how different processes contribute to territorial risk patterns.
Figure 3.
Spatial distribution of the normalised municipal risk indices for the hazard categories considered in the study: (a) wildfire risk, (b) seismic risk, (c) flood risk, (d) hydrogeological risk, (e) avalanche risk, and (f) adverse weather phenomena risk. All indicators were normalised to ensure comparability among heterogeneous datasets and support the construction of the integrated risk framework.
The spatial distribution of hazard components reveals marked heterogeneity across the study area, with significant differences among municipalities depending on a multitude of environmental and anthropogenic factors (Figure 3). The observed patterns reflect the influence of the specific drivers underlying each risk category. Some risk categories are primarily controlled by different environmental factors. The spatial distribution of seismic risk (Figure 3b) reflects the regional geological and tectonic setting, including proximity to seismogenic structures and local site effects related to the capacity of geological formations to amplify seismic waves. Meanwhile, wildfire risk (Figure 3a) is closely linked to the distribution of vegetated and forested areas, in which fuel availability is a key predisposing factor for fire occurrence and propagation.
On the other hand, physiographic conditions play a primary role in shaping the distribution of hydraulic, hydrogeological and avalanche-related risks. Hydraulic risk (Figure 3c) is mainly concentrated along major river corridors and lowland areas, where hydrological dynamics interact with extensive urbanisation processes, increasing both exposure and the potential severity of impacts. Similarly, hydrogeological risk (Figure 3d) is strongly influenced by terrain morphology, slope conditions and geomorphological instability, resulting in higher values in mountainous and foothill municipalities. Avalanche risk (Figure 3e) exhibits the most spatially constrained distribution, being almost exclusively associated with high-altitude municipalities where topographic and climatic conditions favour avalanche occurrence.
Anthropogenic factors also contribute significantly to the spatial variability of risk. The highest values associated with adverse weather phenomena (Figure 3f) are predominantly observed in the densely urbanised lowland sector of the region, where the concentration of population, infrastructure and economic activities increases the likelihood of damage and disruption following extreme meteorological events. Urbanisation likewise contributes to the spatial pattern of flood risk, amplifying the consequences of hazardous processes in areas characterised by high levels of soil sealing and land-use transformation. Overall, the results highlight how the spatial patterns of risk emerge from the interaction among multiple natural and anthropogenic drivers, whose relative importance varies with the hazard process considered.
The sensitivity analysis indicated a high robustness of the hydraulic, hydrogeological and avalanche hazard components to variations in the weights assigned to the hazard classes. For each component, all 1000 Monte Carlo simulations produced valid weighting configurations while preserving the predefined ordinal hierarchy among hazard classes.
The hydraulic component, calculated for 702 municipalities with mapped hazard areas, showed a mean coefficient of variation (CV) of 0.96% and a mean absolute difference from the baseline of 0.0011. The hydrogeological component, involving 668 municipalities, showed even lower variability, with a mean CV of 0.37% and a mean absolute difference of 0.0001. Similarly, the avalanche component, affecting 162 municipalities, showed a mean CV of 0.18% and a mean absolute difference of 0.0002. These results indicate that the normalised municipal hazard values were only marginally affected by the tested variations in the weighting schemes.
The stability was particularly evident when considering the relative ranking of municipalities. For the hydraulic component, the mean Spearman’s rank correlation coefficient between the baseline and simulated results was ρ = 0.99995, with values ranging from 0.99984 to 1.00000. Similarly, the hydrogeological component showed a mean ρ = 0.99996 (range: 0.99988–1.00000), while the avalanche component showed an almost invariant ranking, with a mean ρ = 1.00000 and a minimum value of 0.99999. Therefore, despite the random perturbation of the class weights, the relative ordering of municipalities remained essentially unchanged across the simulations. As summarised in Table 7, the performed analysis indicates that the results are highly robust within the tested parameter ranges. Variations in the weighting schemes produced only minor changes in the normalised hazard values and had a negligible effect on the relative prioritisation of municipalities. The particularly high Spearman coefficients show that the spatial ranking is not driven by the exact numerical values assigned to the hazard classes, but remains stable under alternative plausible weighting configurations. These results support the use of the adopted weighting schemes within the proposed framework, while not implying that they represent the only possible parameterisation.
Table 7.
Summary of the Monte Carlo-based sensitivity analysis and equal-weight stress test for the hydraulic, hydrogeological and avalanche hazard components. CV indicates the mean coefficient of variation in simulated municipal values; Spearman’s ρ measures the stability of municipal rankings relative to the baseline configuration.
The complementary equal-weight stress test further confirmed the stability of the three hazard components when the baseline prioritisation among hazard classes was completely removed. The hydraulic component showed Spearman’s rank correlation of ρ = 0.98958 between the baseline and equal-weight configurations, with a mean absolute difference of 0.06497. An even higher stability was observed for the hydrogeological component (ρ = 0.99940; mean absolute difference = 0.00100) and the avalanche component (ρ = 1.00000; mean absolute difference = 0.00047). Municipal rankings therefore remained highly consistent even under the deliberately restrictive assumption of equal weights. Although the hydraulic component showed a comparatively larger change in absolute values, its very high rank correlation indicates that removing the original hazard-class prioritisation had only a limited effect on the relative ordering of municipalities.
The two complementary sensitivity analyses supported the robustness of the adopted weighting scheme, with municipal rankings remaining highly stable under both moderate weight perturbations and an equal-weight configuration.
3.2. Integrated Risk Index
The aggregation procedure—obtained following Formula (10)—produced a municipal integrated risk index. The spatial distribution of the integrated risk index reveals marked variation, with some areas characterised by significantly different levels of risk, as shown in Figure 4.
Figure 4.
Integrated municipal risk index resulting from the aggregation of hazard-specific risk components. Higher values indicate municipalities characterised by a greater combined contribution of multiple hazard sources and associated damage records. (a) Map of the Lombardy Region; (b) focus on municipalities in central-western Lombardy; and (c) focus on municipalities in central-eastern Lombardy.
The spatial distribution of the integrated risk index highlights a clear and structured pattern across the study area, with the highest values concentrated in specific and geographically coherent zones. In fact, higher values tend to cluster in municipalities characterised by the coexistence of multiple relevant hazard conditions, as shown in Figure 4b,c. Although both areas display similarly high values of the integrated risk index, the underlying risk composition differs substantially. In the area shown in Figure 4b, elevated index values are primarily driven by the adverse weather phenomena risk and wildfire components. Conversely, the hotspot identified in Figure 4c is mainly characterised by the combined contribution of wildfire, adverse weather, and hydrogeological risk. These differences highlight how comparable integrated risk levels may result from distinct combinations of phenomenon-specific risk factors across municipalities.
In order to complement the spatial analysis with a quantitative assessment of the distribution of the values obtained, Table 8 shows the number of municipalities and the corresponding percentage falling into each of the five risk classes identified.
Table 8.
Distribution of municipalities across the five integrated risk classes, reporting the number and percentage of regional area associated with each category.
The classification of the integrated index into five qualitative categories made the results easier to interpret for urban planning and civil protection purposes. Most municipalities fall within the intermediate classes, with 347 municipalities classified as moderate and 371 as medium risk, corresponding respectively to 24.44% and 28.20% of the regional area. A further 441 municipalities belong to the medium-high class, covering 26.99% of Lombardy, while 226 municipalities are classified as low risk, accounting for 14.95% of the regional territory. The highest risk class includes 117 municipalities and represents 5.44% of the total regional area.
The sensitivity analysis showed high robustness of the integrated index to variations in the wildfire risk contribution, with a mean Spearman correlation of 0.9899 (minimum = 0.9695), a mean CV of 4.19%, and a mean absolute difference from the baseline of 0.0151. Although the normalisation bounds represent predefined methodological choices aimed at harmonising indicators derived through different processing pathways, they may potentially introduce implicit weighting effects. However, the sensitivity analysis showed that variations in the wildfire risk contribution had only a limited influence on the integrated index, indicating that the adopted normalisation bounds did not substantially affect the municipal ranking or introduce a dominant implicit weighting effect.
Furthermore, the spatial autocorrelation analysis showed that the geographical distribution of the integrated risk index is not random. Global Moran’s I was positive and statistically significant (I = 0.271; expected I = −0.001; permutation z-score = 17.182; pseudo-p = 0.001), indicating that municipalities with similar integrated risk values tend to be located close to one another. In other words, the municipal risk values show a significant clustered spatial pattern rather than being randomly distributed across Lombardy.
The Getis-Ord Gi* analysis allowed these local spatial concentrations to be identified more precisely. A total of 182 municipalities (12.12%) were included in statistically significant clusters of high integrated risk values: 38 municipalities (2.53%) were classified as hotspots at the 99% confidence level, 79 (5.26%) at the 95% level, and 65 (4.33%) at the 90% level. Conversely, 209 municipalities (13.92%) were associated with statistically significant concentrations of low values, including 100 coldspots (6.66%) at the 99% confidence level, 59 (3.93%) at the 95% level, and 50 (3.33%) at the 90% level. The remaining 1110 municipalities (73.95%) did not belong to statistically significant local clusters.
These results complement the integrated risk map by distinguishing municipalities with high or low index values from statistically significant spatial clusters. In fact, an individual municipality with a high integrated risk value is not necessarily a hotspot: Getis-Ord Gi* identifies a hotspot only when high values are spatially concentrated in a municipality and its neighbouring municipalities. Similarly, coldspots represent significant spatial concentrations of low values. The results therefore confirm that the integrated risk pattern has a significant regional spatial structure, while also identifying the specific areas where concentrations of high and low municipal risk values are statistically significant. This spatial organisation is consistent with the geographical behaviour of natural hazards, which are governed by environmental controls that extend beyond municipal boundaries. Natural hazards are intrinsically controlled by physical and environmental factors, such as geology, topography, hydrology and climate, which are spatially continuous and therefore do not conform to administrative boundaries [61,62]. Consequently, neighbouring municipalities frequently share similar territorial characteristics and may exhibit comparable levels of hazard and integrated risk. The presence of statistically significant hotspots and coldspots is consistent with the geographically coherent distribution of the environmental factors underlying the analysed phenomena, indicating that the resulting index retains a significant spatial structure at the regional scale. In this sense, the observed spatial autocorrelation suggests that the integrated index preserves the underlying spatial organisation of the analysed natural processes.
3.3. WebGIS Operational View and Municipal Profiles
To support the interpretation and operational use of the results, the integrated risk index was implemented within a WebGIS environment designed to provide interactive access to both the synthetic indicator and its underlying components. The WebGIS application is freely accessible at the following link: https://arcg.is/18nD9X3 (accessed on 1 September 2026).
As shown in Figure 5, the WebGIS viewer allows users to explore risk conditions at the municipal scale through dynamic cartographic visualisations, facilitating the consultation of both the overall integrated risk index and the individual hazard-specific indicators. This approach improves the transparency of the methodology by allowing users to understand which factors most significantly contribute to the final risk score in different areas.
Figure 5.
Interface of the WebGIS viewer developed for the dissemination and interactive visualisation of the municipal risk assessment. The platform allows users to explore the integrated risk index and the contribution of individual hazard components for each municipality through interactive maps and graphical summaries.
The WebGIS was developed to overcome some of the limitations of traditional static maps, enabling users to interact directly with spatial data through zoom, filtering and query functions [63]. The employment of a web-based interactive framework also enhances the usability of the results for decision-makers and civil protection practitioners [64]. By integrating multiple datasets into a single geospatial environment, the WebGIS facilitates the identification of spatial patterns, supports comparative analyses among municipalities and enables a more immediate interpretation of territorial risk conditions. Consequently, the platform represents not only a dissemination tool but also a valuable support for evidence-based decision-making in risk assessment, emergency planning, and territorial monitoring [65].
4. Discussion
4.1. An Integrated Approach to Risk Assessment to Support Decision-Making
In recent years, several studies have proposed approaches based on composite indicators to support natural risk assessment and spatial planning. Among these, Anelli et al. (2022) [6] developed a composite index for assessing urban resilience in the Rome metropolitan area, whilst Tocchi et al. (2025) [21] proposed an integrated framework for identifying spatial hotspots by combining different risk components. Similarly, Shi et al. (2026) [22] used aggregated indicators to assess risk in over 4000 schools in the Shanghai metropolitan area. Other studies have further demonstrated the applicability of indicator-based approaches for operational planning. For example, Pilone et al. (2019) [66] proposed a semi-quantitative framework to support local authorities in territorial resilience planning, while Skoulidou and Kazantzi (2024) [67] developed an indicator-based methodology for urban hazard resilience, highlighting the importance of transparent and reproducible assessment procedures for decision support. Likewise, recent research by Parizi et al. (2024) [68] emphasises the need for integrated and spatially explicit methodologies to strengthen disaster risk management and recovery planning.
Our work proposes an approach aimed at developing an integrated risk index at the municipal level, designed not to model the interactions among different phenomena, but rather to synthesise heterogeneous information into a single decision-support tool. Unlike many existing frameworks, which integrate hazard, exposure and vulnerability dimensions or explicitly analyse multi-risk interactions, the proposed methodology focuses on harmonising official institutional datasets into a single municipal-scale indicator that can be readily interpreted and periodically updated within the context of civil protection planning. The main objective is to provide a spatial representation of risk that is easily interpretable and directly applicable in the context of civil protection and local planning activities. In particular, the integrated representation allows municipalities characterised by similar overall risk levels but driven by different combinations of risk-generating phenomena to be distinguished, thereby providing additional information to support the prioritisation of mitigation and preparedness measures.
The results highlight how combining the various components considered makes it possible to identify spatial patterns that would be unlikely to emerge from a separate analysis of the individual phenomena. In this sense, the integrated index can serve as a useful tool for spatial screening, aimed at the preliminary identification of areas requiring specific further analysis or priority action. The robustness analyses indicate a high methodological stability of the framework, while the spatial autocorrelation analysis shows that the resulting integrated index exhibits a statistically significant regional spatial structure, supporting its application for municipal-scale territorial planning and Civil Protection activities. However, the distribution of the index must also be interpreted in the light of the specific characteristics of the study area. The risk values obtained reflect a combination of phenomena whose distribution is closely linked to the climatic, morphological, hydrological and environmental characteristics of the territory. Consequently, the Integrated Risk Index has an intrinsically regional component, and its values must be interpreted primarily in relative terms within the area under analysis. In this sense, analysing the integrated index alongside the individual standardised municipal indicators makes it possible not only to identify the areas characterised by the highest overall values, but also to understand which components contribute most significantly to the local risk profile. The numerical value of the index should not be interpreted as an absolute measure that can be directly transferred between different geographical contexts; any inter-regional comparisons would require the application of consistent standardisation criteria and the availability of comparable datasets. Furthermore, the use of official datasets, an entirely open-source workflow and a reproducible methodological framework enhance the operational applicability of the proposed approach and facilitate its transferability to other regional contexts where comparable institutional data are available.
4.2. Potential Applications for Civil Protection Planning
One of the most interesting aspects of the proposed methodology concerns its operational applicability. Unlike approaches that rely heavily on complex models or hard-to-obtain datasets, the framework developed makes use primarily of information already available from public bodies and local authorities. This feature makes the approach particularly well-suited to support the planning activities required by the Italian civil protection system, which assigns municipalities a central role in forecasting, prevention and emergency management. Using the municipality as the territorial unit of analysis enables the results to be directly aligned with the administrative levels at which civil protection plans are developed. The integration of the results within a WebGIS platform also enables the processed dataset to be transformed into an operational tool to support public administrations [69]. From this perspective, the index should not be interpreted solely as a cartographic product, but as an integrated knowledge base useful for guiding processes relating to the prioritisation of interventions, the allocation of resources and the updating of planning tools.
4.3. Limitations, Replicability and Future Developments
As with any approach based on integrating multiple indicators, the proposed methodology has certain limitations. Firstly, the datasets used are drawn from different sources and do not always have consistent levels of detail, scales of measurement or classifications. This has required specific harmonisation and standardisation procedures which, whilst necessary to ensure the comparability of the data, inevitably involve a simplification of the actual complexity of the phenomena. A second issue concerns the very nature of the index, which is based primarily on a combination of hazard-related information and historically observed damage. Components such as social vulnerability and response capacity have not been explicitly considered and represent possible avenues for future development. A further limitation concerns the application of the methodology to municipalities with large territorial extents. In these cases, using a single municipal-scale risk value may reduce the model’s ability to represent the internal spatial variability of hazard conditions, potentially leading to a less accurate assessment. In the end, the adopted approach does not account for possible interactions among different phenomena and therefore does not constitute a multi-hazard assessment in the strict sense. The results should be interpreted as a summary measure of integrated risk, obtained by aggregating different risk components. Although these relationships are not directly modelled in the current approach, the use of observed damage data may indirectly incorporate some effects resulting from interconnected processes, without allowing their individual contributions to be distinguished. Future developments could therefore explicitly model such interactions, extending the proposed integrated framework towards a more comprehensive multi-risk perspective.
Despite these limitations, one of the framework’s main strengths lies in its replicability. The methodology is, in fact, based on standardised procedures for processing, classification and aggregation that can be easily applied to other geographical contexts or updated by integrating new datasets. This feature is particularly relevant in a context where regional information bases are subject to continuous updates and expansion. Future research activities could therefore focus on the automatic integration of regional information flows, the inclusion of vulnerability indicators, and the development of dynamic risk monitoring systems capable of periodically updating the cartographic outputs and summary indicators produced.
5. Conclusions
This study developed an integrated municipal-scale risk index for Lombardy Region to support civil protection planning and territorial risk assessment. By combining heterogeneous institutional datasets with historical damage information derived from the Regional Damage Assessment Database (Ra.S.Da.), the proposed framework provides a synthetic representation of multiple natural hazards within a common analytical framework. The results highlighted a marked spatial variability in risk conditions across Lombardy. Although several municipalities exhibited similar integrated risk levels, the analysis revealed that these values often originated from different combinations of hazard-specific components, reflecting the region’s diverse physiographic and environmental characteristics. This confirms the importance of complementing synthetic indicators with the analysis of their constituent risk factors.
From a methodological perspective, the proposed framework demonstrates how heterogeneous geospatial datasets characterised by different formats, classifications and levels of completeness can be harmonised into a coherent risk assessment workflow. The reliance on institutional datasets and reproducible GIS-based procedures makes the methodology easily transferable to other territorial contexts and suitable for periodic updates as new information becomes available. Beyond its scientific contribution, the proposed index provides an operational decision-support tool capable of assisting public authorities in identifying priority areas for risk reduction, emergency planning and resource allocation. The integration of the results within a WebGIS environment further enhances accessibility and facilitates the communication of complex risk information to planners and decision-makers. For this reason, the results should not be interpreted as an engineering assessment, but rather as a synthetic representation of integrated risk derived from the aggregation of multiple risk components. The proposed framework is intended as a planning-support tool, balancing the need for effective communication of complex risk information with methodological rigour.
As said before, the proposed framework presents some limitations. In particular, the current version does not explicitly incorporate exposure variables or social vulnerability indicators and does not account for cascading interactions among hazards. Future research could address these aspects through the integration of demographic, socio-economic and infrastructural datasets. A further development of the proposed framework concerns the possibility of explicitly taking into account the interactions between different types of risk. In the current approach, individual phenomena are analysed separately and incorporated into the overall index, without modelling any causal relationships between them. However, natural hazards are not necessarily independent, and one event may trigger, facilitate or amplify other phenomena, giving rise to cascade or chain reactions. The future integration of such interactions would therefore enable the proposed framework to be expanded towards a more comprehensive representation of multi-risk dynamics. Furthermore, the adoption of automated data-update procedures could support the development of dynamic risk monitoring systems capable of providing continuously updated information for civil protection activities. Overall, the proposed methodology demonstrates that institutional datasets and historical damage records can be effectively transformed into an integrated, transparent and replicable risk assessment framework, supporting evidence-based territorial planning and strengthening risk-informed decision-making processes.
Supplementary Materials
The following supporting information can be downloaded at: https://www.mdpi.com/article/10.3390/urbansci10090538/s1.
Author Contributions
Conceptualization, L.F. (Laura Franceschi) and M.D.A.; methodology, L.F. (Laura Franceschi), L.F. (Laura Ferigato), A.B., A.Z., S.E., M.B., A.C., G.Y.L., V.B., M.C. and M.D.A.; formal analysis, L.F. (Laura Franceschi); writing—original draft preparation, L.F. (Laura Franceschi); writing—review and editing, L.F. (Laura Franceschi) and A.B.; funding acquisition, M.D.A. All authors have read and agreed to the published version of the manuscript.
Funding
This research was supported by a research agreement between the University of Milano-Bicocca (Department of Earth and Environmental Sciences) and Regione Lombardia—Directorate General for Security and Civil Protection, established pursuant to Article 15 of Italian Law No. 241/1990.
Institutional Review Board Statement
Not applicable.
Informed Consent Statement
Not applicable.
Data Availability Statement
All spatial datasets used in this study are publicly available from official institutional geospatial portals and are distributed under the respective licences of the original data providers. The Ra.S.DA. (Regional Damage Database) records used for the damage component were provided by Regione Lombardia. A complete list of the data sources, access links, and licensing information is reported in Appendix A. A GeoPackage containing the geospatial data that can be redistributed under their original licences, the derived hazard-specific layers, the final integrated risk index, and the QGIS project used for their visualisation is also provided as Supplementary Material. The Python scripts developed to reproduce the complete methodological workflow, including hazard processing, integrated risk index calculation, sensitivity analysis, and spatial autocorrelation analysis, are openly available on Zenodo at https://doi.org/10.5281/zenodo.22307071. Together, these resources provide the data, code, and geospatial outputs required to reproduce and further explore the proposed workflow.
Acknowledgments
The authors would like to thank Valeria Zuccoli for the technical support she provided during the setup of the GitHub repository. The authors would like to thank the three anonymous reviewers for their valuable comments and suggestions, which significantly contributed to improving the quality and clarity of the manuscript.
Conflicts of Interest
The authors declare no conflicts of interest.
Software and Computational Environment
All GIS processing, spatial analyses, and map production were performed using QGIS 3.34.3 “Prizren” (QGIS Development Team). Python scripts developed for data processing and analysis were executed within the QGIS Python environment using Python 3.9.18 and the corresponding PyQGIS API. GitHub.com was used solely as a web-based platform for hosting and sharing the scripts and associated materials; the repository release used for the present study was version 2.0 (v2.0).
Abbreviations
The following abbreviations are used in this manuscript:
| Ra.S.Da | Regional registry of damage (Raccolta Schede Danni) |
| GIS | Geographic Information System |
| WEF | World economic forum |
| PGRA | Flood risk management plan (Piano di Gestione del Rischio Alluvioni) |
| IFFI | Italian landslides inventory (Inventario dei Fenomeni Franosi in Italia) |
| ISTAT | Italian National Institute of Statistics (Istituto nazionale di statistica) |
| ISPRA | Institute for Environmental Protection and Research (Istituto Superiore per la Protezione e la Ricerca Ambientale) |
Appendix A
Table A1.
Data sources used in the study, including the corresponding providers, and web links for data access and download.
References
- World Economic Forum the Global Risks Report 2026. Available online: https://www.weforum.org/publications/global-risks-report-2026/digest/ (accessed on 13 April 2026).
- Sultana, F.; Scheffran, J. Climate Change as a Threat Multiplier: Expert Perspectives on Human Security in Bangladesh. Geographies 2025, 5, 77. [Google Scholar] [CrossRef] [Scilit]
- Ilba, M.; Alexandru, D.-E.; Zotic, V.; Hołuj, A.; Lityński, P.; Semczuk, M.; Serafin, P. Planning for Urban Development in the Context of Climate Change. Evidence from Poland and Romania. J. Settl. Spat. Plan. 2022, 13, 75–87. [Google Scholar] [CrossRef] [Scilit]
- Tiwari, P.C.; Joshi, B. Challenges of Urban Growth in Himalaya with Reference to Climate Change and Disaster Risk Mitigation: A Case of Nainital Town in Kumaon Middle Himalaya, India. In Himalayan Weather and Climate and Their Impact on the Environment; Dimri, A.P., Bookhagen, B., Stoffel, M., Yasunari, T., Eds.; Springer International Publishing: Cham, Switzerland, 2019; pp. 473–491. [Google Scholar]
- Saha, F.; Nkemta, D.T.; Tchindjang, M.; Voundi, É.; Fendoung, P.M. Production des risques dits « naturels » dans les grands centres urbains du Cameroun. Nat. Sci. Soc. 2018, 26, 418–433. [Google Scholar] [CrossRef] [Scilit]
- Anelli, D.; Tajani, F.; Ranieri, R. Urban Resilience against Natural Disasters: Mapping the Risk with an Innovative Indicators-Based Assessment Approach. J. Clean. Prod. 2022, 371, 133496. [Google Scholar] [CrossRef] [Scilit]
- Maleki, M.; Esmailzadeh, A.; Ranjbar, M.E.; Derakhshesh, P.; Hosseini, J.; Rahmati, M.; Wang, J.; Khanmohammadidoustani, S.; Rustum, R. Urban Resilience to Urbanisation, Climate Change and Natural Risk in Urban Historic Areas of Developing Countries: A Systematic Review. Adv. Space Res. 2026, 77, 8538–8558. [Google Scholar] [CrossRef] [Scilit]
- D’Onofrio, A.; Ceres, R.; Gargiulo, F. A Multi-Hazard Perspective in the Analysis of Earthquake-Induced Landslides: The Case of Ischia Island. Riv. Ital. Geotec. LVIII 2024, 1286, 14–37. [Google Scholar] [CrossRef]
- Mazzeo, G.; Polverino, S. Nature-Based Solution for Climate Change Adaptation and Mitigation in Urban Areas with High Natural Risk Proposals of Possible Measures for a Municipality in the Vesuvius Area. TeMA J. Land Use Mobil. Environ. 2023, 16, 47–65. [Google Scholar] [CrossRef] [PubMed]
- Butcher-Gollach, C. Planning, the Urban Poor and Climate Change in Small Island Developing States (SIDS): Unmitigated Disaster or Inclusive Adaptation? Int. Dev. Plan. Rev. 2015, 37, 225–248. [Google Scholar] [CrossRef] [Scilit]
- Novakovska, I.; Datsenko, L.; Kustovska, O.; Titova, S.; Dubnytska, M.; Groza, V. Spatial Planning and Natural Risks: Synergy for Sustainable Development. In Studies in Big Data; Springer Science and Business Media Deutschland GmbH: Berlin/Heidelberg, Germany, 2024; Volume 159, pp. 327–336. [Google Scholar]
- Borrego, J.B. Outdated Regulations and Institutional Vulnerability: Hydrological Risk Management in Málaga’s Municipal Planning. Heliyon 2023, 9, e18691. [Google Scholar] [CrossRef] [Scilit] [PubMed]
- Pirlone, F.; Spadaro, I.; Candia, S. More Resilient Cities to Face Higher Risks. The Case of Genoa. Sustainability 2020, 12, 4825. [Google Scholar] [CrossRef] [Scilit]
- Martínez, C.; Vicuña, M.; Guerrero, N.; Orellana, V. Natural Risks in Chile: History, Approaches and Future Challenges. In Chile Environmental History, Perspectives and Challenges; Alaniz, A.J., Ed.; Nova Science Publishers, Inc.: Hauppauge, NY, USA, 2019; pp. 209–239. [Google Scholar]
- White, C.J.; Adnan, M.S.G.; Arosio, M.; Buller, S.; Cha, Y.; Ciurean, R.; Crummy, J.M.; Duncan, M.; Gill, J.; Kennedy, C.; et al. Review Article: Towards Multi-Hazard and Multi-Risk Indicators—A Review and Recommendations for Development and Implementation. Nat. Hazards Earth Syst. Sci. Discuss. 2024, 25, 4263–4281. [Google Scholar] [CrossRef] [Scilit]
- Dolce, M.; Prota, A.; Borzi, B.; Da Porto, F.; Lagomarsino, S.; Magenes, G.; Moroni, C.; Penna, A.; Polese, M.; Speranza, E.; et al. Seismic Risk Assessment of Residential Buildings in Italy. Bull. Earthq. Eng. 2021, 19, 2999–3032. [Google Scholar] [CrossRef] [Scilit]
- Ceppi, A.; Chaves González, N.A.; Davolio, S.; Ravazzani, G. Can Meteorological Model Forecasts Initialize Hydrological Simulations Rather than Observed Data in Ungauged Basins? Meteorol. Appl. 2023, 30, e2165. [Google Scholar] [CrossRef] [Scilit]
- Ferreira, T.M.; Vicente, R.; Raimundo Mendes Da Silva, J.A.; Varum, H.; Costa, A.; Maio, R. Urban Fire Risk: Evaluation and Emergency Planning. J. Cult. Herit. 2016, 20, 739–745. [Google Scholar] [CrossRef] [Scilit]
- Chelariu, O.-E.; Minea, I.; Iațu, C. Integrated Assessment of Geophysical and Social Vulnerability to Natural Hazards in North-East Region, Romania. Geomat. Nat. Hazards Risk 2024, 15, 2384607. [Google Scholar] [CrossRef] [Scilit]
- Kuzmin, S.B. Global Disaster Risk Index for Analyzing Multiple Risks in the Earth’s Changing Climate. Geogr. Nat. Resour. 2025, 46, 241–248. [Google Scholar] [CrossRef] [Scilit]
- Tocchi, G.; Cremen, G.; Galasso, C.; Polese, M. Integrating Multi-Hazard, Socio-Physical Information in a Holistic Index for Decision Making on Disaster Risk Reduction. Int. J. Disaster Risk Reduct. 2025, 124, 105494. [Google Scholar] [CrossRef] [Scilit]
- Shi, Z.; Yan, J.; Li, L.; Liao, B.; Tian, T.; Wen, J.; Chen, Y. A Framework of Evidence-Based Multi-Hazard Risk Screening for Disaster Risk Reduction and Resilience Planning. Geomat. Nat. Hazards Risk 2026, 17, 2605119. [Google Scholar] [CrossRef] [Scilit]
- Zuzak, C.; Mowrer, M.; Goodenough, E.; Burns, J.; Ranalli, N.; Rozelle, J. The National Risk Index: Establishing a Nationwide Baseline for Natural Hazard Risk in the US. Nat. Hazards 2022, 114, 2331–2355. [Google Scholar] [CrossRef] [Scilit]
- Gu, H.; Du, S.; Liao, B.; Wen, J.; Wang, C.; Chen, R.; Chen, B. A Hierarchical Pattern of Urban Social Vulnerability in Shanghai, China and Its Implications for Risk Management. Sustain. Cities Soc. 2018, 41, 170–179. [Google Scholar] [CrossRef] [Scilit]
- Maantay, J.; Maroko, A. Mapping Urban Risk: Flood Hazards, Race, & Environmental Justice in New York. Appl. Geogr. 2009, 29, 111–124. [Google Scholar] [CrossRef] [Scilit] [PubMed]
- Tocchi, G.; Ottonelli, D.; Rebora, N.; Polese, M. Multi-Risk Assessment in the Veneto Region: An Approach to Rank Seismic and Flood Risk. Sustainability 2023, 15, 12458. [Google Scholar] [CrossRef] [Scilit]
- Antofie, T.-E.; Luoni, S.; Tilloy, A.; Sibilia, A.; Salari, S.; Eklund, G.; Rodomonti, D.; Bountzouklis, C.; Corbane, C. Spatial Identification of Regions Exposed to Multi-Hazards at the Pan-European Level. Nat. Hazards Earth Syst. Sci. 2025, 25, 287–304. [Google Scholar] [CrossRef] [Scilit]
- Pappenberger, F.; Cloke, H.L.; Parker, D.J.; Wetterhall, F.; Richardson, D.S.; Thielen, J. The Monetary Benefit of Early Flood Warnings in Europe. Environ. Sci. Policy 2015, 51, 278–291. [Google Scholar] [CrossRef] [Scilit]
- Carabella, C.; Boccabella, F.; Buccolini, M.; Ferrante, S.; Pacione, A.; Gregori, C.; Pagliani, T.; Piacentini, T.; Miccadei, E. Geomorphology of Landslide–Flood-Critical Areas in Hilly Catchments and Urban Areas for EWS (Feltrino Stream and Lanciano Town, Abruzzo, Central Italy). J. Maps 2021, 17, 40–53. [Google Scholar] [CrossRef] [Scilit]
- Rana, I.A.; Asim, M.; Aslam, A.B.; Jamshed, A. Disaster Management Cycle and Its Application for Flood Risk Reduction in Urban Areas of Pakistan. Urban Clim. 2021, 38, 100893. [Google Scholar] [CrossRef] [Scilit]
- Zhou, S.; Zhai, G. A Multi-Hazard Risk Assessment Framework for Urban Disaster Prevention Planning: A Case Study of Xiamen, China. Land 2023, 12, 1884. [Google Scholar] [CrossRef] [Scilit]
- Turchi, A.; Di Traglia, F.; Fanti, R. Risk Awareness Characterisation in Multi-Hazard, High-Tourist-Interest Sites: The Case of Stromboli Volcano during the 2019 Eruptive Crisis (Aeolian Islands UNESCO Site, Italy). Nat. Hazards 2026, 122, 249. [Google Scholar] [CrossRef] [Scilit]
- Salvati, P.; Bianchi, C.; Fiorucci, F.; Giostrella, P.; Marchesini, I.; Guzzetti, F. Perception of Flood and Landslide Risk in Italy: A Preliminary Analysis. Nat. Hazards Earth Syst. Sci. 2014, 14, 2589–2603. [Google Scholar] [CrossRef] [Scilit]
- Wamsler, C.; Brink, E. Interfacing Citizens’ and Institutions’ Practice and Responsibilities for Climate Change Adaptation. Urban Clim. 2014, 7, 64–91. [Google Scholar] [CrossRef] [Scilit]
- Popolazione Residente. Available online: https://demo.istat.it/app/?i=POS&l=it (accessed on 29 June 2026).
- Gazzetta Ufficiale. Available online: https://www.gazzettaufficiale.it/dettaglio/codici/protezioneCivile (accessed on 29 June 2026).
- Decreto del Capo Dipartimento n. 265 del 29 Gennaio 2024. Available online: https://www.protezionecivile.gov.it/it/normativa/decreto-del-capo-dipartimento-n-265-del-29-gennaio-2024/ (accessed on 29 June 2026).
- Indicazioni Operative CD Pianificazione Interventi pc a Favore di Persone con Specifiche Necessità. Available online: https://www.protezionecivile.gov.it/it/normativa/indicazioni-operative-cd-pianificazione-interventi-pc-favore-di-persone-con-specifiche-necessita/ (accessed on 29 June 2026).
- Banca Dati Del Consiglio Regionale Della Lombardia. Available online: https://normelombardia.consiglio.regione.lombardia.it/normelombardia/accessibile/main.aspx?view=showdoc&iddoc=lr002021122900027 (accessed on 1 September 2026).
- Antofie, T.; Salvi, A.; Sibilia, A.; Salari, S.; Rodomonti, D.; Eklund, G.; Zucca, N.; Corbane, C. Evidence for Disaster Risk Management from the Risk Data Hub; Publications Office of the European Union: Luxembourg, 2023. [Google Scholar] [CrossRef] [PubMed]
- Marin, G.; Modica, M.; Paleari, S.; Zoboli, R. Assessing Disaster Risk by Integrating Natural and Socio-Economic Dimensions: A Decision-Support Tool. Socio-Econ. Plan. Sci. 2021, 77, 101032. [Google Scholar] [CrossRef] [Scilit]
- Cerase, A. Rischio e Comunicazione. Teorie, Modelli, Problemi; EGEA: Milan, Italy, 2017. [Google Scholar]
- Sturloni, G. La Comunicazione del Rischio per la Salute e l’Ambiente; Mondadori Educatio: Milan, Italy, 2018. [Google Scholar]
- Piano di Gestione Rischio Alluvioni nel Bacino del Fiume Po (PGRA). Available online: https://www.regione.lombardia.it/ambiente-e-territorio/pianificazione-territoriale/pianificazione-di-bacino/piano-di-gestione-rischio-alluvioni-nel-bacino-del-fiume-po-pgra (accessed on 6 July 2026).
- Home. Available online: https://www.geoportale.regione.lombardia.it (accessed on 6 July 2026).
- Servizi Online Di Protezione Civile. Available online: https://www.protezionecivile.servizirl.it/servizi/servizi/dettaglio?id=68 (accessed on 6 July 2026).
- Limiti Amministrativi Comunali 2019 Con Aggiornamenti DbT/PGT Line|Open Data Regione Lombardia. Available online: https://www.dati.lombardia.it/Territorio/Limiti-amministrativi-Comunali-2019-con-aggiorname/6tpi-927s/about_data (accessed on 3 July 2026).
- Bláha, J.D.; Trahorsch, P.; Bartůněk, M.; Hladík, P. Critical Issues in Undergraduate Cartographic Education: Analysis of Final Tests and Oral Examinations. AUC Geogr. 2024, 60, 61–74. [Google Scholar] [CrossRef] [Scilit]
- Nardo, M.; Saisana, M.; Saltelli, A.; Tarantola, S.; Hoffman, A.; Giovannini, E. Handbook on Constructing Composite Indicators: Methodology and User Guide; OECD, European Union, Joint Research Centre—European Commission, Eds.; OECD: Paris, France, 2008. [Google Scholar]
- Mazziotta, M.; Pareto, A. Normalization Methods for Spatio-temporal Analysis of Environmental Performance: Revisiting the Min–Max Method. Environmetrics 2022, 33, e2730. [Google Scholar] [CrossRef] [Scilit]
- Kelemen, A.; Szabó, Z.K.; Bozóki, S.; Szádoczki, Z.; Hartvig, Á.D. A Sensitivity Analysis of Composite Indicators: Min/Max Thresholds. Environ. Sustain. Indic. 2024, 23, 100453. [Google Scholar] [CrossRef] [Scilit]
- Fildes, S.G.; Bruce, D.; Clark, I.F.; Raimondo, T.; Keane, R.; Batelaan, O. Integrating Spatially Explicit Sensitivity and Uncertainty Analysis in a Multi-Criteria Decision Analysis-Based Groundwater Potential Zone Model. J. Hydrol. 2022, 610, 127837. [Google Scholar] [CrossRef] [Scilit]
- Ghorbanzadeh, O.; Feizizadeh, B.; Blaschke, T. Multi-Criteria Risk Evaluation by Integrating an Analytical Network Process Approach into GIS-Based Sensitivity and Uncertainty Analyses. Geomat. Nat. Hazards Risk 2018, 9, 127–151. [Google Scholar] [CrossRef] [Scilit]
- Becker, W.; Saisana, M.; Paruolo, P.; Vandecasteele, I. Weights and Importance in Composite Indicators: Closing the Gap. Ecol. Indic. 2017, 80, 12–22. [Google Scholar] [CrossRef] [Scilit] [PubMed]
- Joshi, B.R.; Bhandary, N.P.; Acharya, I.P.; Niraj, K.C.; Bhandari, C. Integration of Information Value with Machine Learning Method for an Enhanced Predictive Performance in Landslide Susceptibility Mapping. Discov. Geosci. 2026, 4, 152. [Google Scholar] [CrossRef] [Scilit]
- Papathoma-Köhle, M.; Schlögl, M.; Fuchs, S. Vulnerability Indicators for Natural Hazards: An Innovative Selection and Weighting Approach. Sci. Rep. 2019, 9, 15026. [Google Scholar] [CrossRef] [Scilit] [PubMed]
- Spangler, K.R.; Manjourides, J.; Lynch, A.H.; Wellenius, G.A. Characterizing Spatial Variability of Climate-Relevant Hazards and Vulnerabilities in the New England Region of the United States. GeoHealth 2019, 3, 104–120. [Google Scholar] [CrossRef] [Scilit] [PubMed]
- Jeong, S.; Yoon, D.K. Examining Vulnerability Factors to Natural Disasters with a Spatial Autoregressive Model: The Case of South Korea. Sustainability 2018, 10, 1651. [Google Scholar] [CrossRef] [Scilit]
- Anselin, L.; Rey, S. Properties of Tests for Spatial Dependence in Linear Regression Models. Geogr. Anal. 1991, 23, 112–131. [Google Scholar] [CrossRef] [Scilit]
- Memisoglu Baykal, T. Performance Assessment of GIS-Based Spatial Clustering Methods in Forest Fire Data. Nat. Hazards 2025, 121, 8445–8477. [Google Scholar] [CrossRef] [Scilit]
- Reichenbach, P.; Rossi, M.; Malamud, B.D.; Mihir, M.; Guzzetti, F. A Review of Statistically-Based Landslide Susceptibility Models. Earth-Sci. Rev. 2018, 180, 60–91. [Google Scholar] [CrossRef] [Scilit]
- Kappes, M.S.; Keiler, M.; von Elverfeldt, K.; Glade, T. Challenges of Analyzing Multi-Hazard Risk: A Review. Nat. Hazards 2012, 64, 1925–1958. [Google Scholar] [CrossRef] [Scilit]
- Skarlatidou, A.; Cheng, T.; Haklay, M. Guidelines for Trust Interface Design for Public Engagement Web GIS. Int. J. Geogr. Inf. Sci. 2013, 27, 1668–1687. [Google Scholar] [CrossRef] [Scilit]
- Alberico, I.; Petrosino, P. The Hazard Indices as a Tool to Support the Territorial Planning: The Case Study of Ischia Island (Southern Italy). Eng. Geol. 2015, 197, 225–239. [Google Scholar] [CrossRef] [Scilit]
- Aschieri, D.L.D.; Sobrino, N.; Macii, E. Web-GIS Application for Hydrogeological Risk Prevention: The Case Study of Cervo Valley. Sustainability 2024, 16, 9833. [Google Scholar] [CrossRef] [Scilit]
- Pilone, E.; Demichela, M.; Baldissone, G. The Multi-Risk Assessment Approach as a Basis for the Territorial Resilience. Sustainability 2019, 11, 2612. [Google Scholar] [CrossRef] [Scilit]
- Skoulidou, D.; Kazantzi, A.K. Indicator-Based Risk Assessments for Urban Hazard Resilience: An Application for Flash Floods. Environ. Hazards 2025, 24, 339–364. [Google Scholar] [CrossRef] [Scilit]
- Parizi, S.M.; Taleai, M.; Sharifi, A. A Spatial Evaluation Framework of Urban Physical Resilience Considering Different Phases of Disaster Risk Management. Nat. Hazards 2024, 120, 13041–13076. [Google Scholar] [CrossRef] [Scilit]
- Zazzeri, M.; MOVIDA Team. The MOVIDA Platform: A WebGIS Tool for the Assessment of Flood Risk–Related Impacts. In Proceedings of the EGU General Assembly 2026, Vienna, Austria, 3–8 May 2026. [Google Scholar]
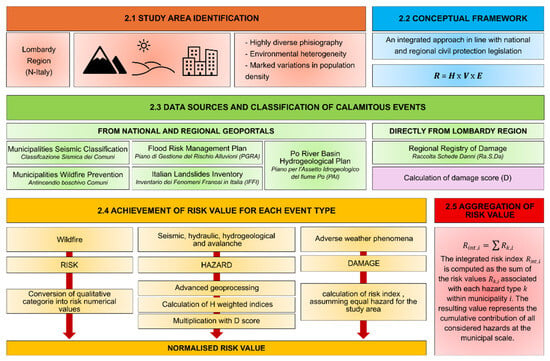
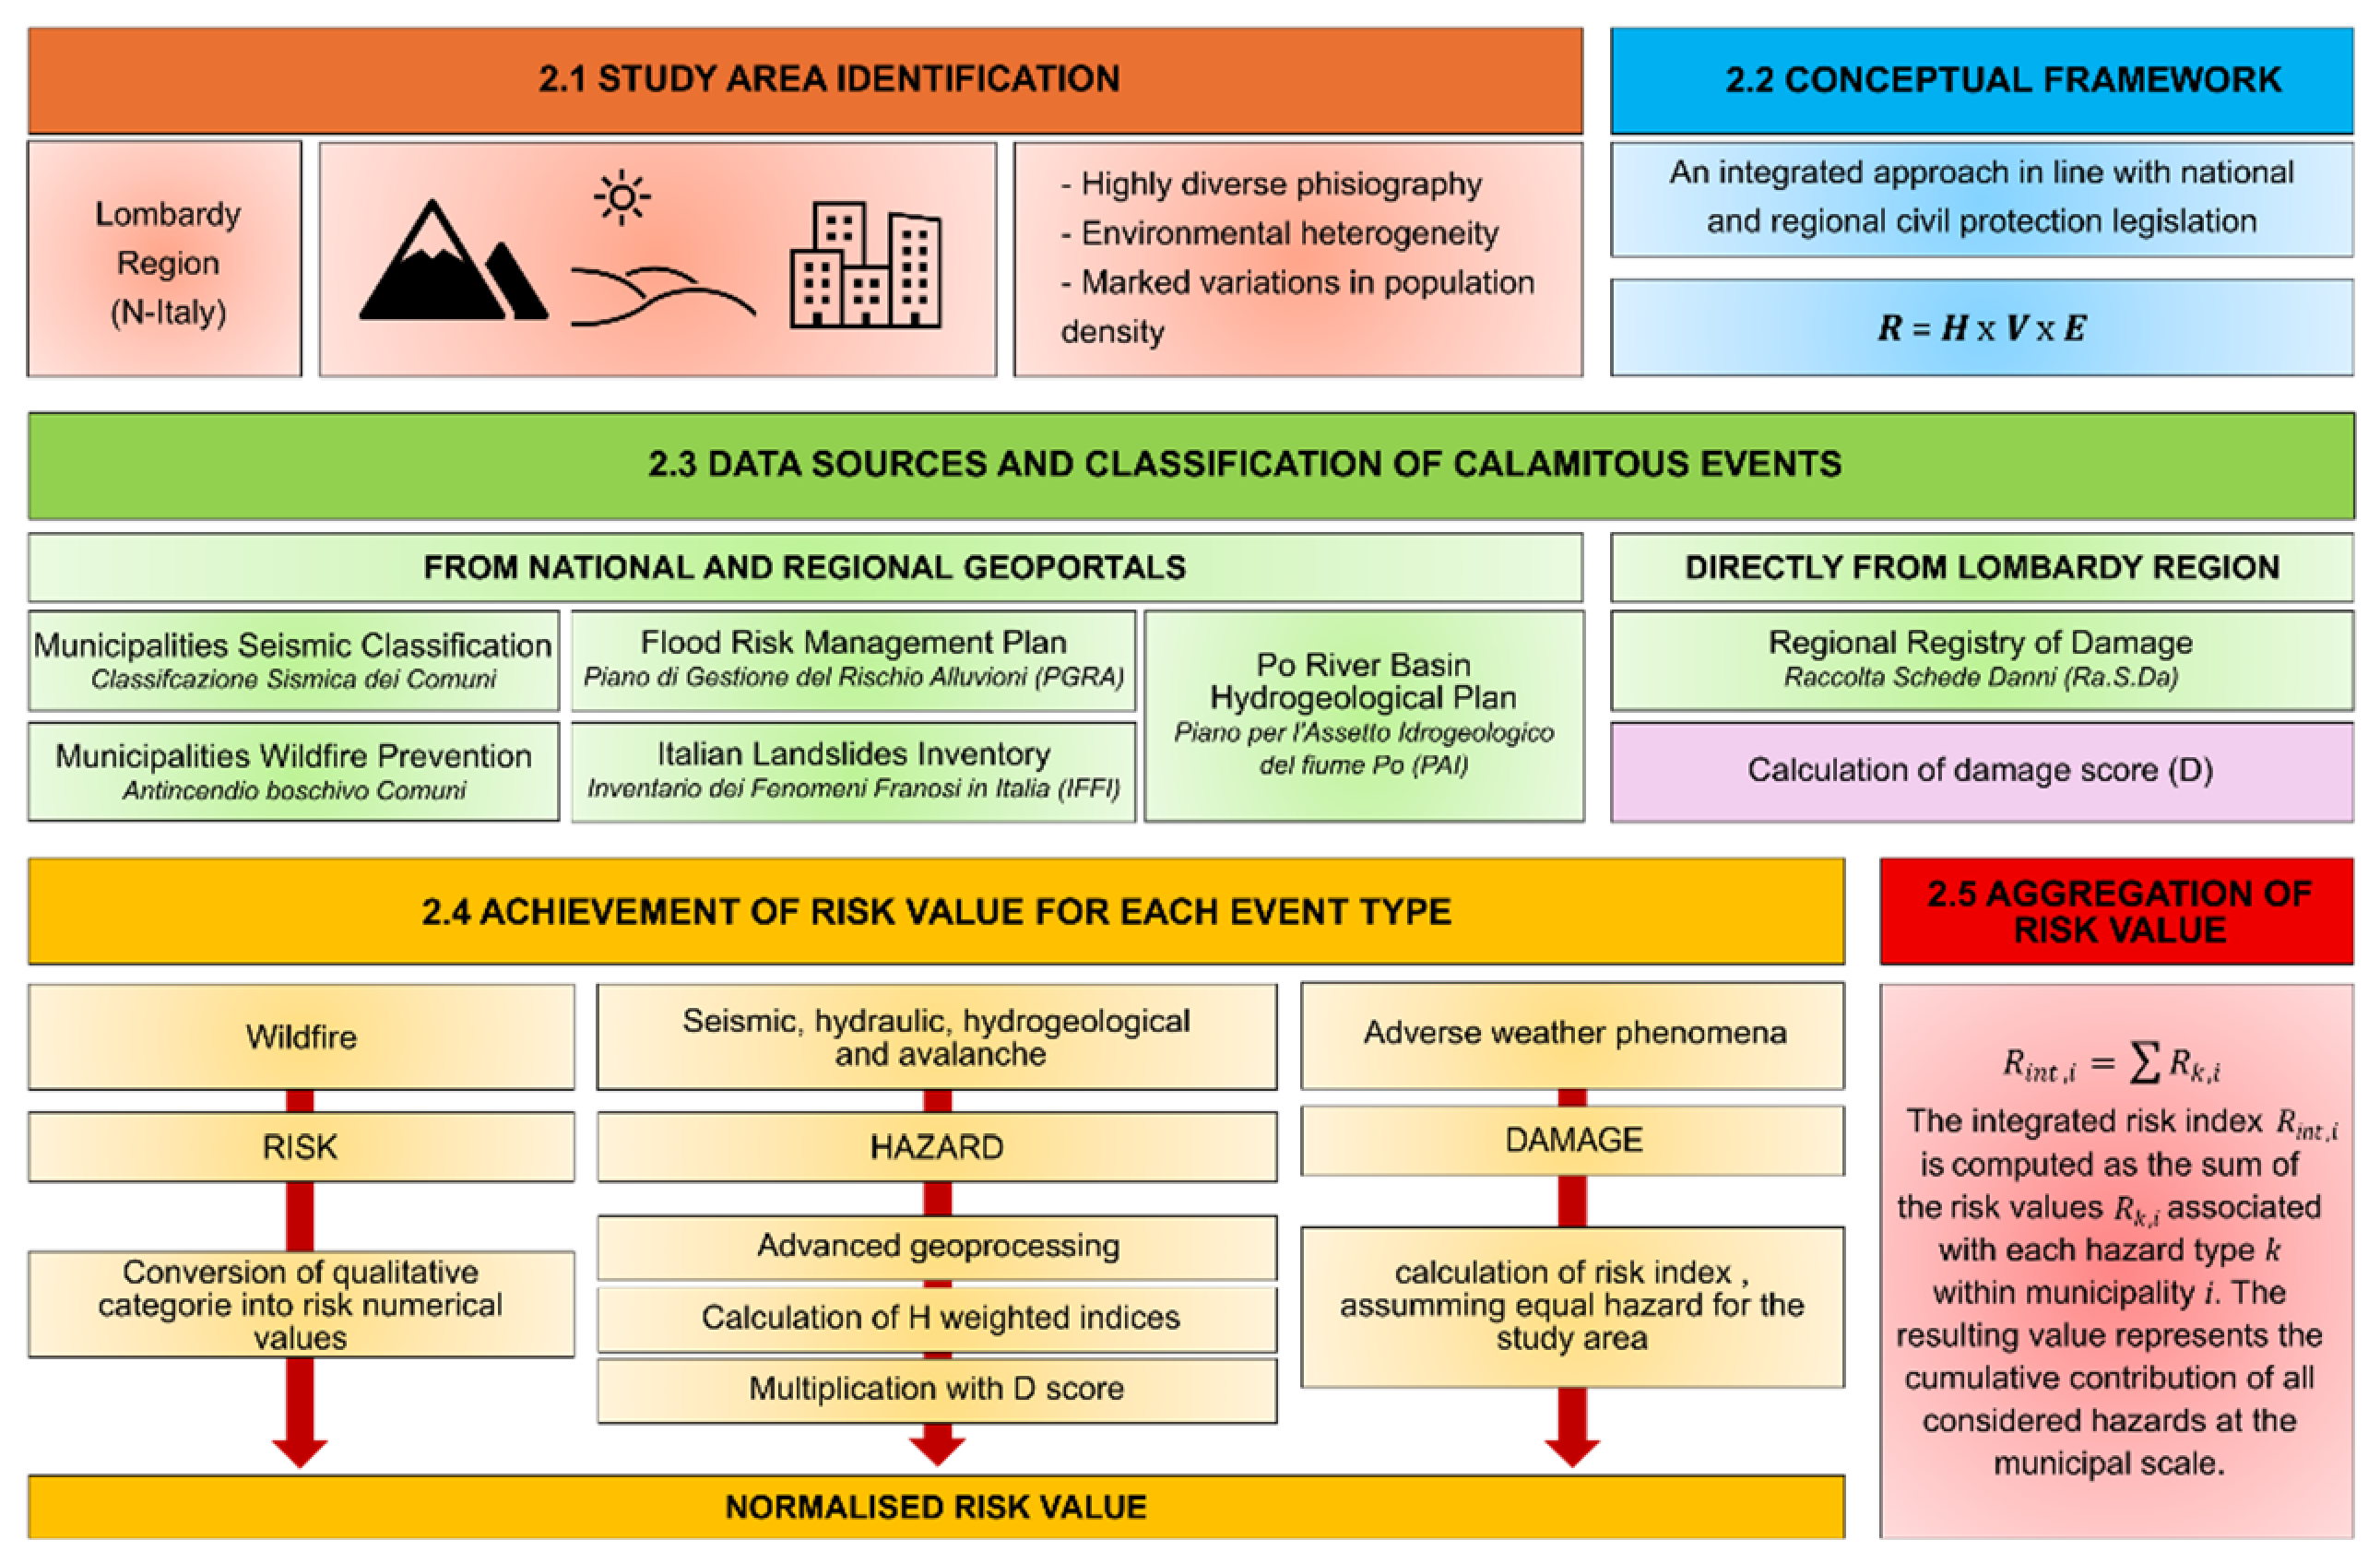
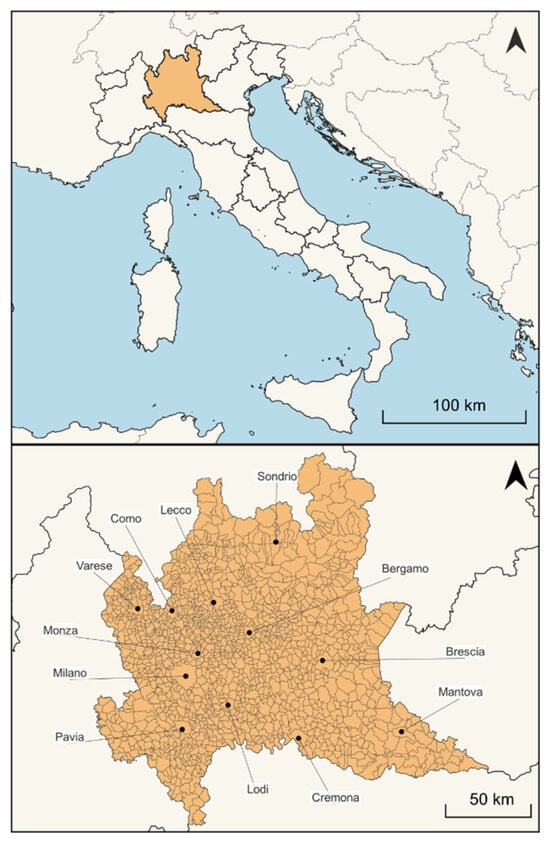
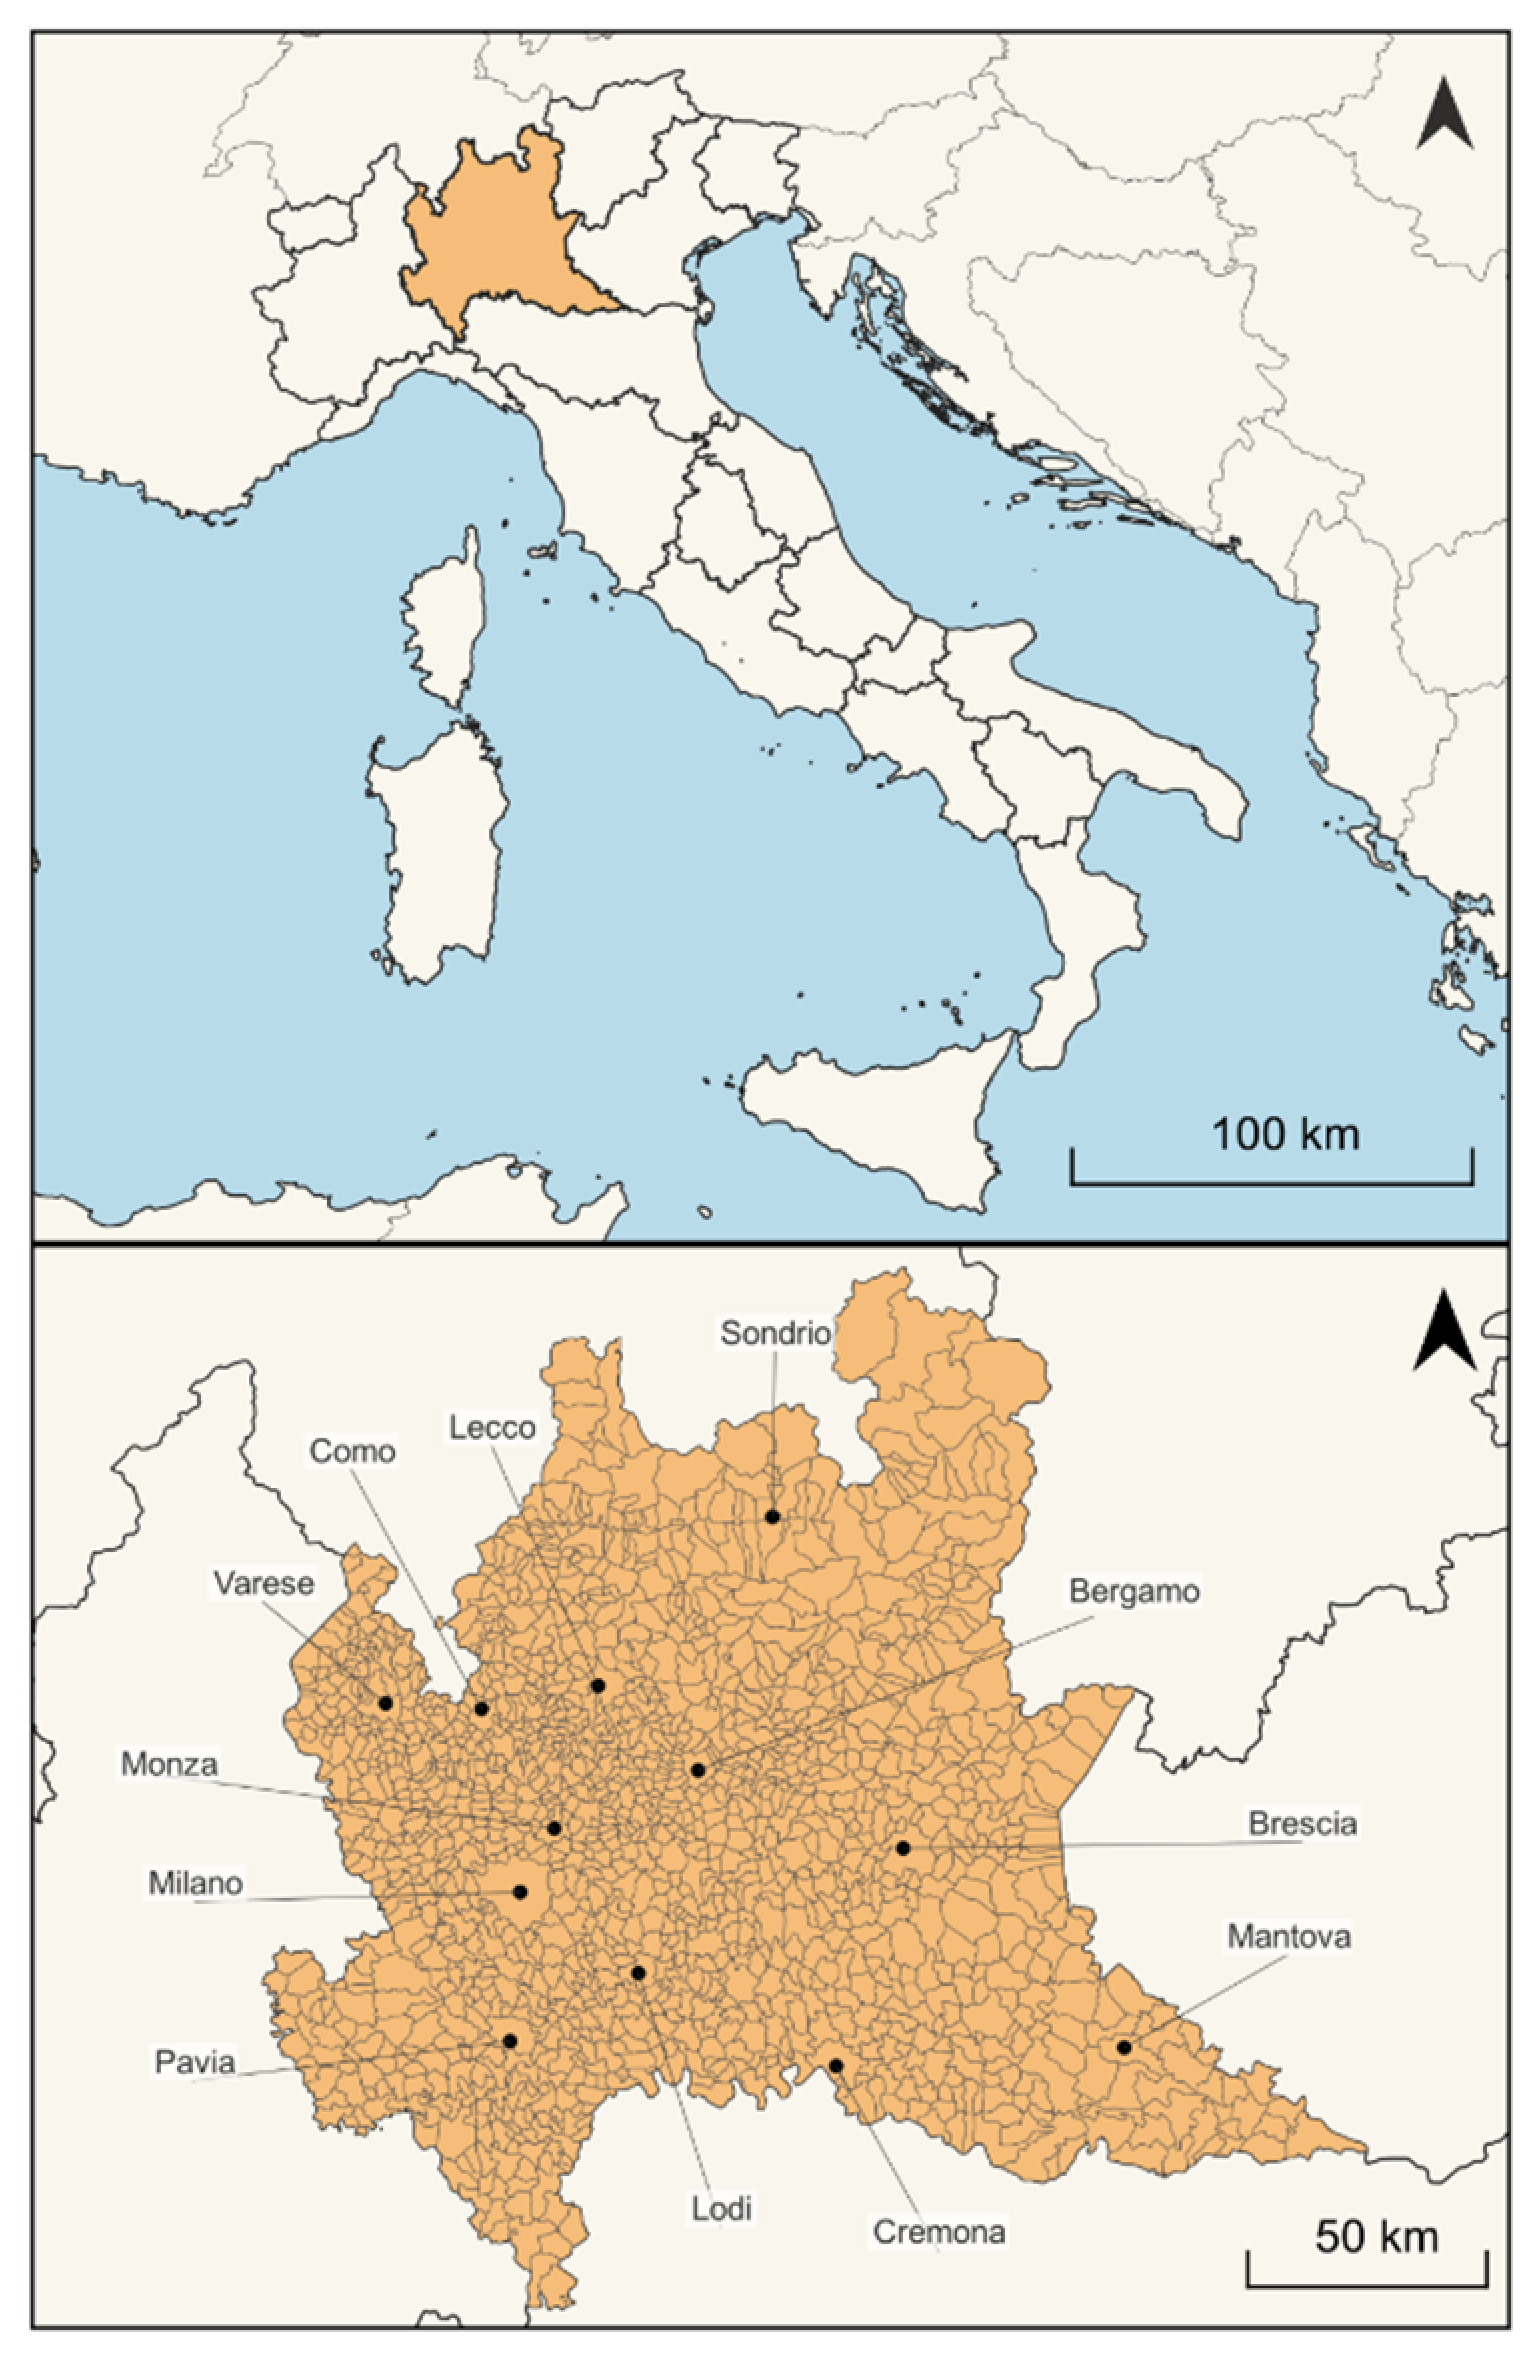
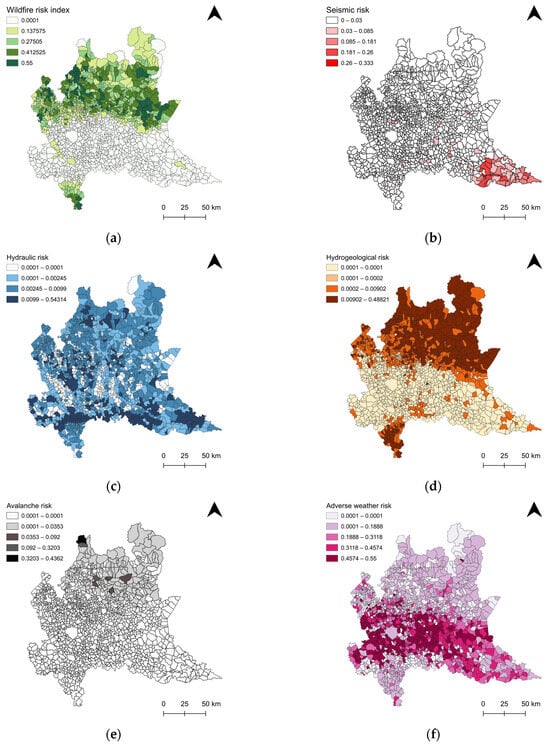
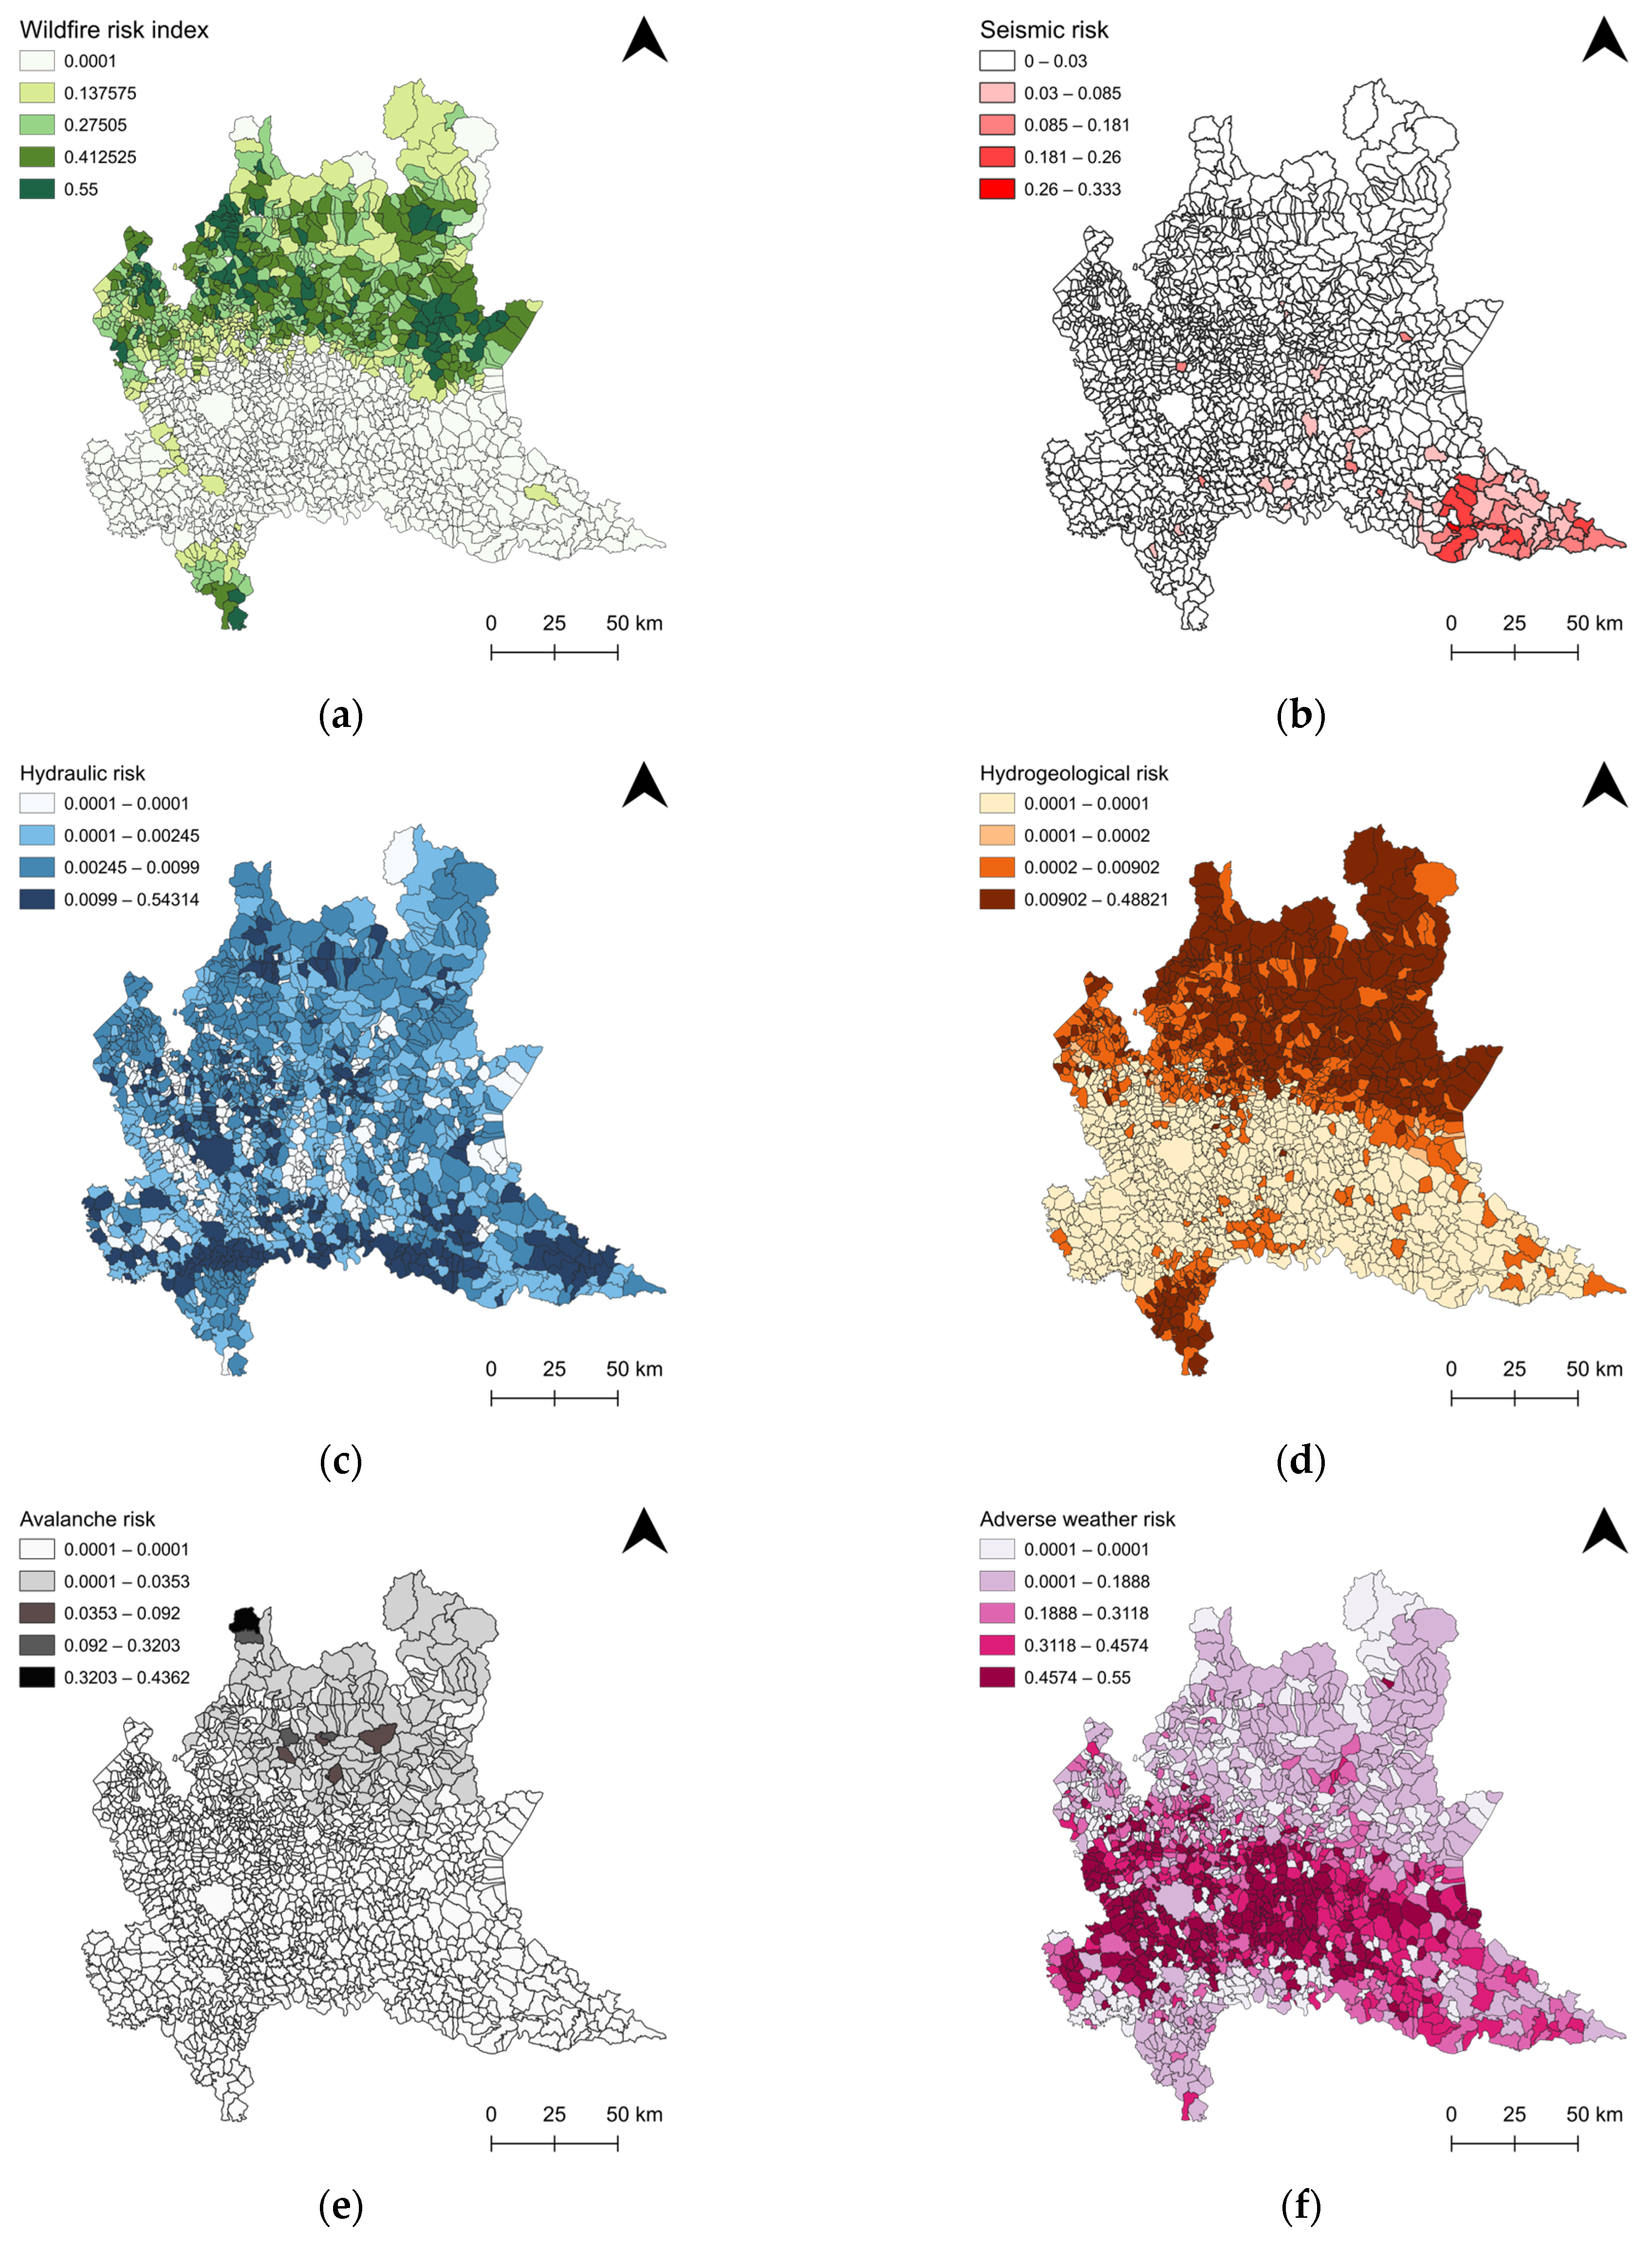
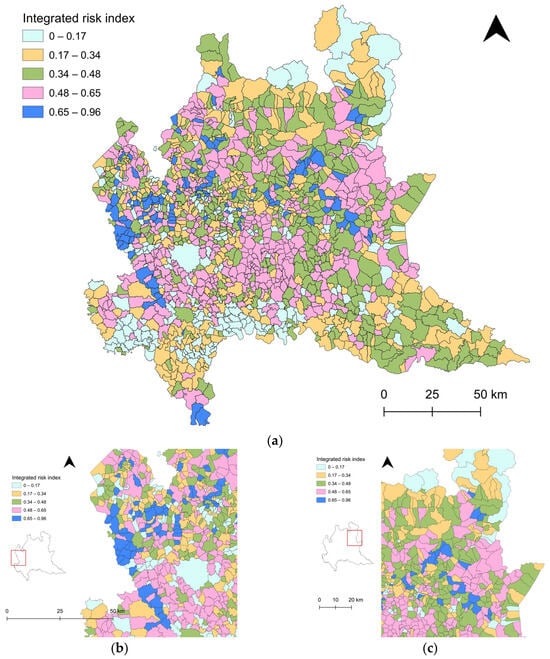
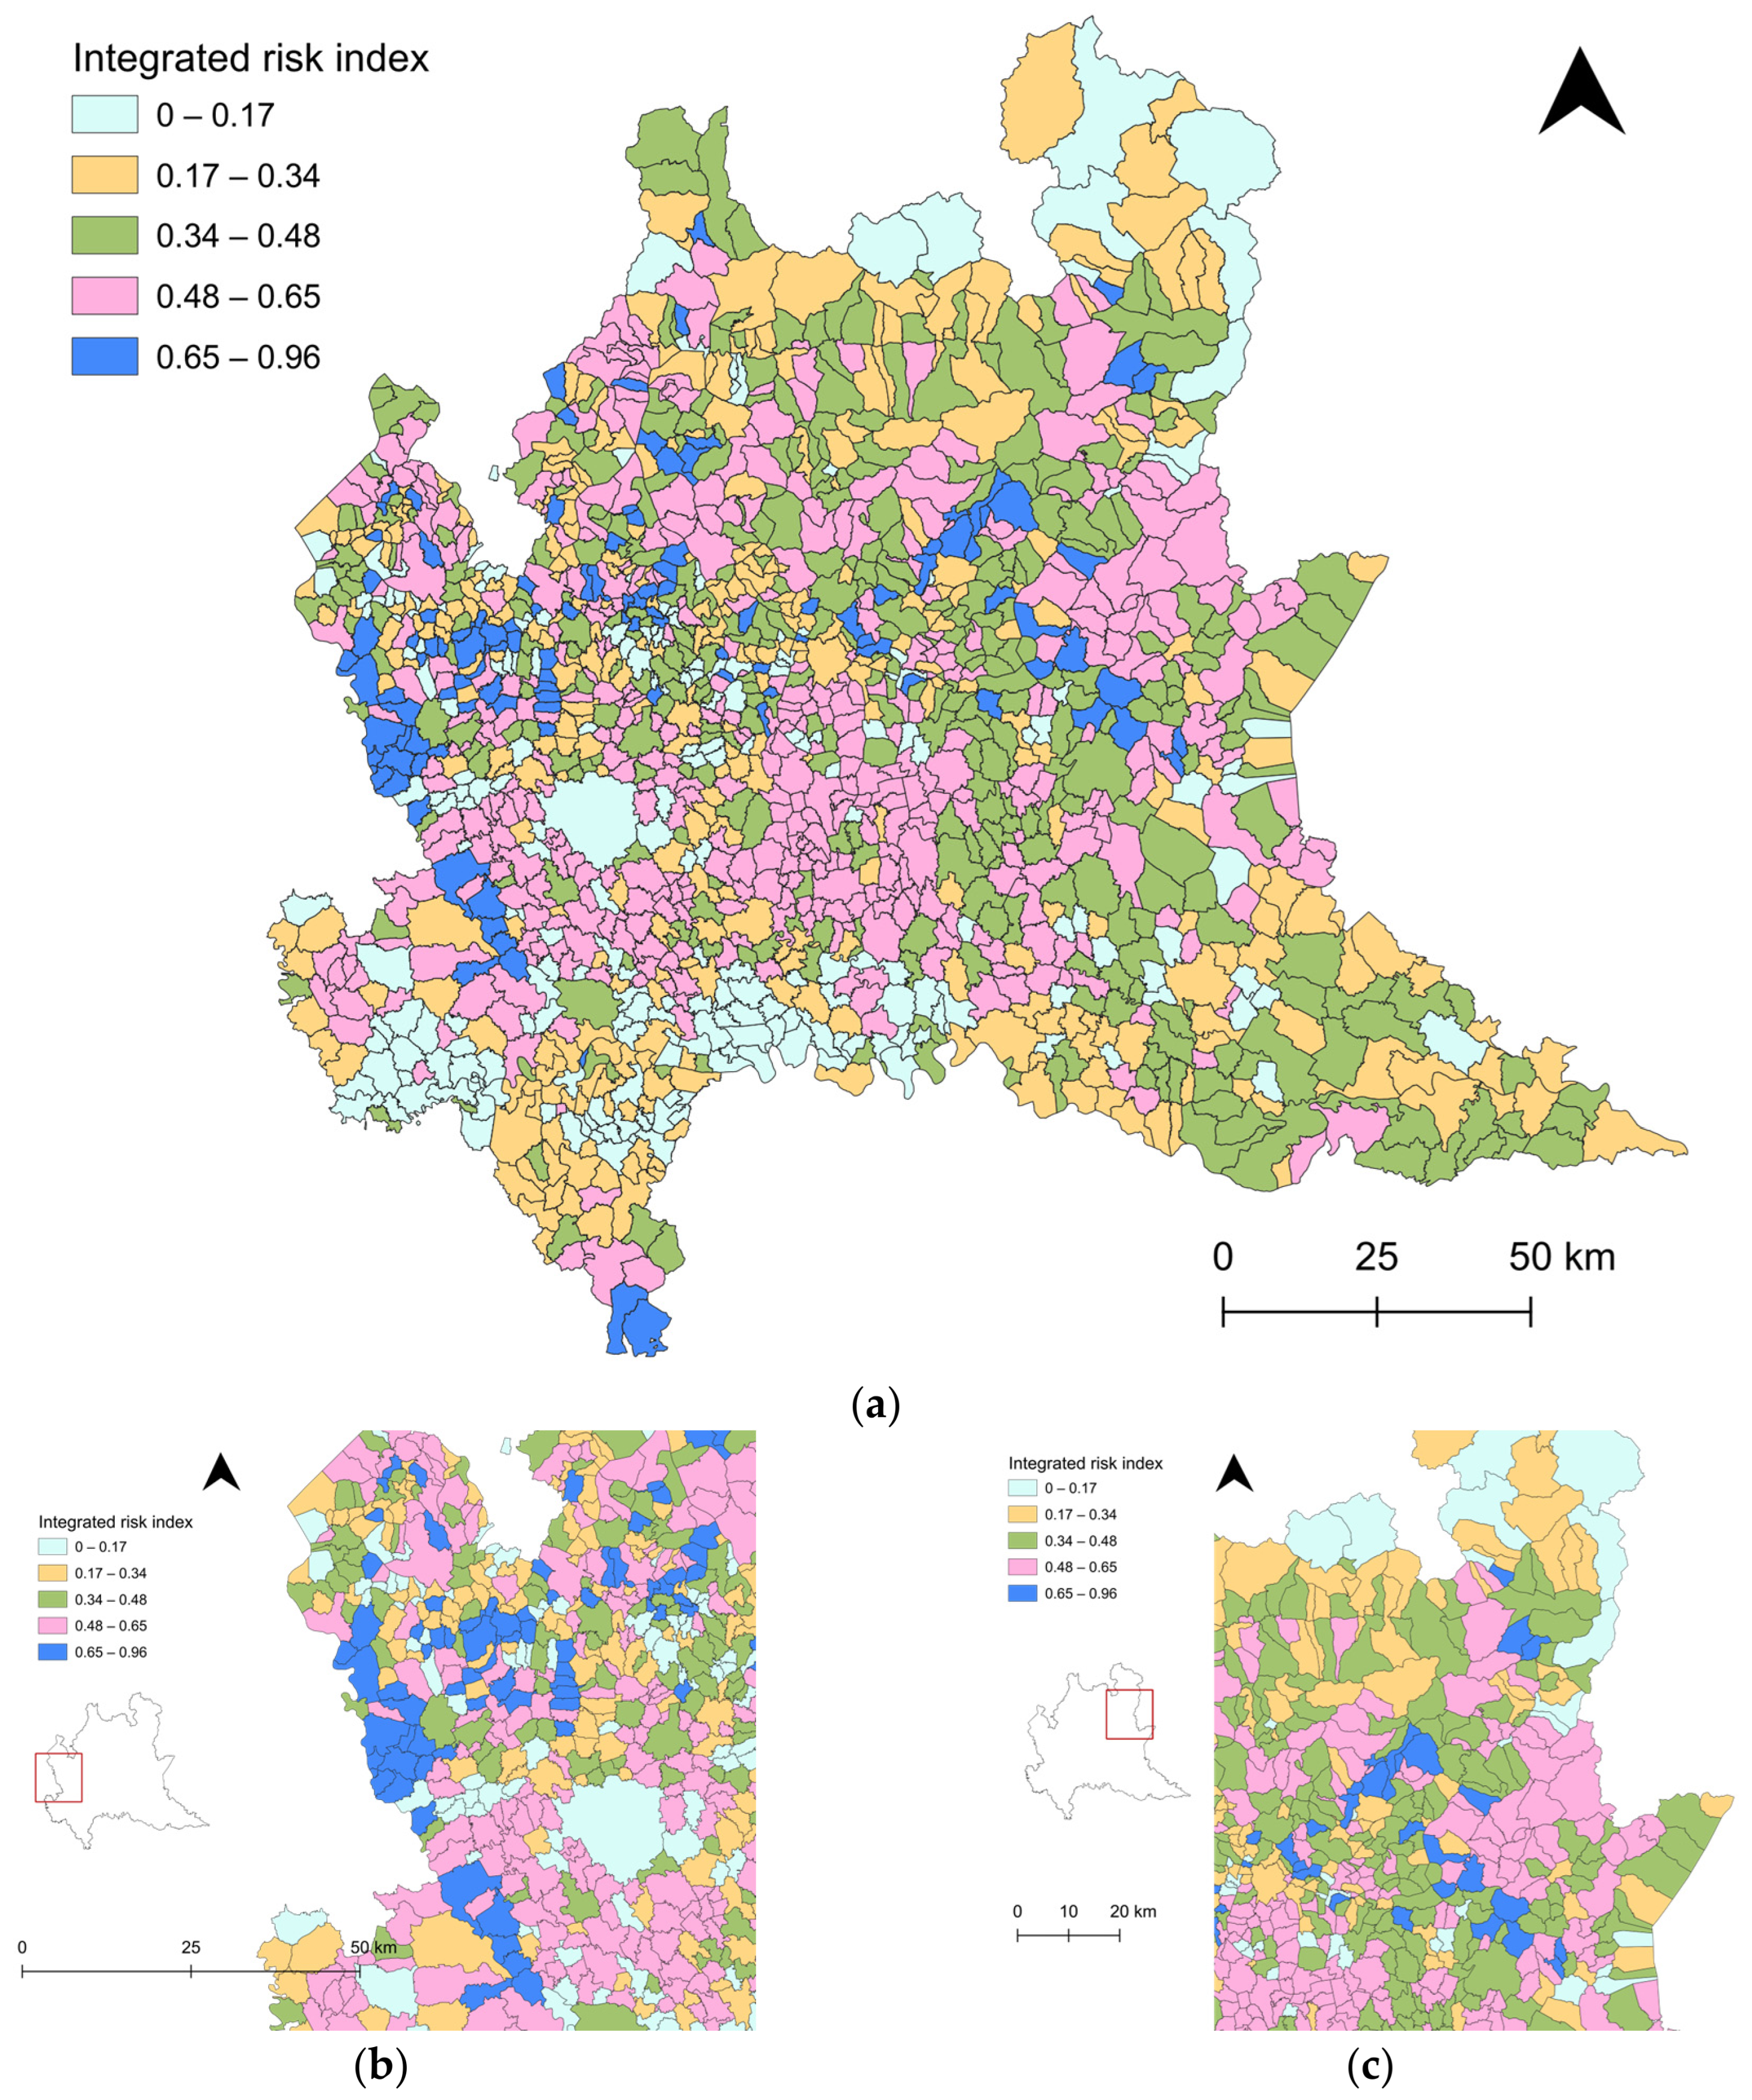
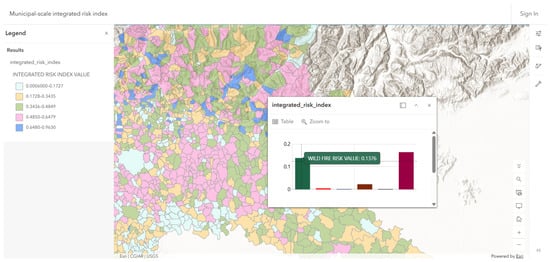
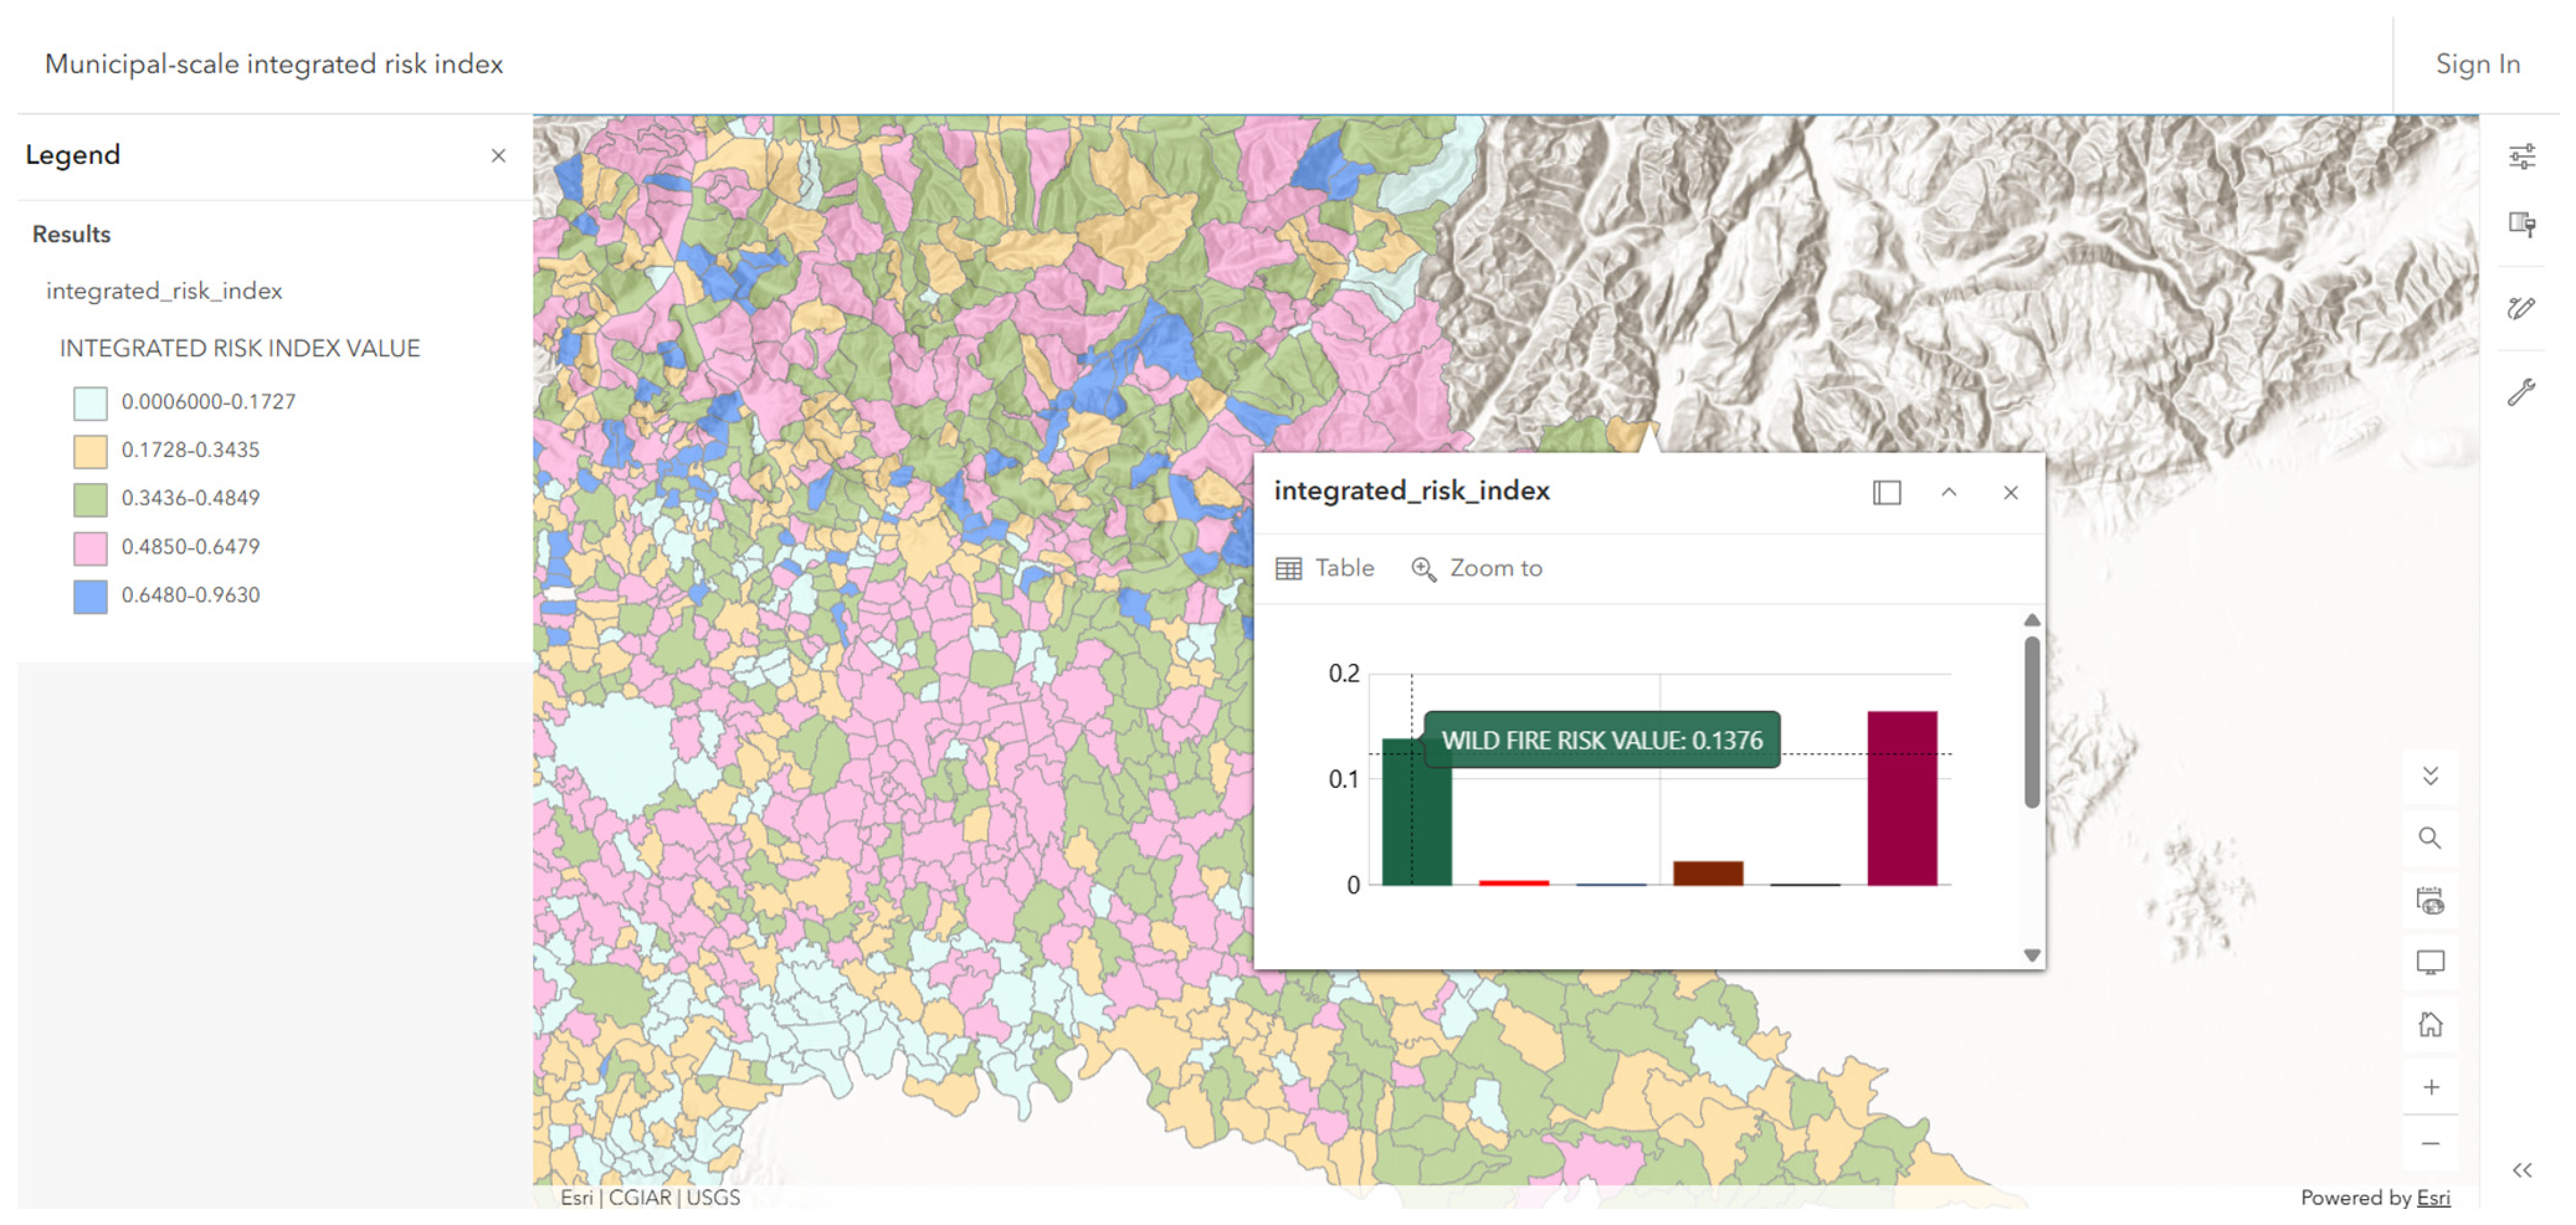

Disclaimer/Publisher’s Note: The statements, opinions and data contained in all publications are solely those of the individual author(s) and contributor(s) and not of MDPI and/or the editor(s). MDPI and/or the editor(s) disclaim responsibility for any injury to people or property resulting from any ideas, methods, instructions or products referred to in the content. |
© 2026 by the authors. Licensee MDPI, Basel, Switzerland. This article is an open access article distributed under the terms and conditions of the Creative Commons Attribution (CC BY) license.