


Abstract
Accurate prediction of droplet impact behavior is essential for applications including spray cooling, coating technologies, additive manufacturing, and inkjet printing. Conventional analytical and empirical models often have limited predictive capability because of the nonlinear interactions among liquid properties, impact conditions, and surface wettability. This study develops machine learning models to predict the maximum spreading coefficient and the critical spreading–splashing threshold velocity using an experimental dataset of more than 700 droplet impacts spanning multiple liquids and hydrophilic, hydrophobic, and superhydrophobic surfaces. Gaussian process regression (GPR) achieved the highest predictive accuracy, predicting the maximum spreading coefficient with coefficients of determination exceeding 0.99 and outperforming widely used empirical correlations. Evaluation using an externally sourced dataset demonstrated satisfactory model transferability, while a second GPR model accurately predicted the critical spreading–splashing threshold velocity within the investigated parameter space. Shapley Additive Explanations (SHAP) and Individual Conditional Expectation (ICE) analyses showed that impact velocity is the dominant predictor of maximum spreading, whereas surface tension primarily governs splash onset, consistent with established droplet-impact physics. These results demonstrate that interpretable machine learning models provide accurate, physically meaningful predictions across diverse liquid–surface systems, in regimes where the input parameters are not scarcely populated, and offer an alternative to conventional empirical correlations.
1. Introduction
Droplet impact dynamics on solid surfaces has attracted extensive attention because of its importance in numerous natural and industrial processes, including spray cooling, inkjet printing, fuel injection, pesticide deposition, additive manufacturing, coating technologies, and thermal management systems. The interaction between a liquid droplet and a solid substrate is governed by the coupled effects of inertia, viscosity, surface tension, wettability, and the surrounding gas, leading to different impact outcomes such as deposition, spreading, rebound, and splashing. Understanding and accurately predicting these phenomena is essential for optimizing processes in which liquid coverage, heat transfer, coating quality, or droplet retention directly influence system performance.
Much of the current understanding of droplet impact was established through comprehensive reviews and theoretical developments by Yarin [1] and Josserand et al. [2], who consolidated the governing physical mechanisms and identified the key dimensionless parameters controlling impact dynamics. Among the quantities used to characterize droplet impact, the maximum spreading coefficient, βmax, remains one of the most important because it directly quantifies the maximum wetted area reached during the spreading stage. Consequently, numerous analytical and semi-empirical models have been proposed to predict βmax as a function of the Weber, Reynolds, and Ohnesorge numbers, often incorporating equilibrium or dynamic contact angles to account for surface wettability. Classical energy-balance and scaling approaches developed by Clanet et al. [3], Roisman [4], and Pasandideh-Fard et al. [5] established the foundations for predicting maximum spreading, while subsequent studies refined these formulations by incorporating viscous dissipation, contact-line dynamics, and surface wetting effects.
Although these models successfully capture the dominant physical mechanisms under many conditions, their applicability remains limited because droplet spreading is governed by the nonlinear interaction of fluid properties, impact conditions, and surface characteristics. Experimental studies have shown that wettability influences both the maximum spreading diameter and spreading time primarily at moderate Weber numbers, whereas inertial forces dominate at sufficiently high Weber numbers, reducing the influence of contact angle [6,7]. Similarly, investigations involving liquids with different viscosities impact surfaces of different wettability demonstrated that none of the existing theoretical models consistently predict maximum spreading over a wide range of operating conditions, highlighting the need to account for the combined effects of viscosity and wettability [8]. Recent work has further shown that empirical energy-based models can be improved by incorporating additional physical mechanisms, including gravitational effects through the Bond number and refined estimates of viscous dissipation, resulting in improved prediction accuracy over a wider range of impact conditions [9]. These findings collectively indicate that droplet spreading cannot be fully described by simple scaling laws because multiple coupled physical mechanisms contribute simultaneously to the spreading dynamics.
Similar challenges arise when predicting the transition from spreading to splashing. Early empirical criteria based primarily on Reynolds and Ohnesorge numbers [10,11,12] successfully identified approximate regime boundaries but were later shown to possess limited generality. Subsequent investigations demonstrated that splashing is influenced not only by impact velocity but also by substrate surface roughness, wettability, liquid viscosity, ambient gas pressure, and substrate surface morphology [13]. Xu et al. [14] demonstrated that reducing ambient pressure can suppress splashing entirely, revealing the crucial role of the surrounding gas layer during the earliest stages of impact. Mandre et al. [15] further explained how the formation of an ultrathin gas film beneath the droplet affects lamella formation and instability development, while Riboux et al. [16] introduced an aerodynamic lifting mechanism acting on the expanding lamella that substantially improved theoretical prediction of splash initiation.
Recent experimental studies have further emphasized the complexity of splashing by demonstrating that its onset depends on strongly coupled interactions between liquid properties and substrate characteristics. Surface roughness promotes earlier splash formation by modifying contact-line dynamics and lamella instability [17,18], while the influence of wettability becomes particularly significant for highly hydrophilic and highly hydrophobic surfaces, although its effect is less pronounced under intermediate wetting conditions [19,20]. Likewise, textured and superhydrophobic surfaces modify lamella motion by trapping air beneath the spreading liquid, thereby altering splash thresholds and rebound dynamics [21,22,23]. Surface temperature introduces an additional degree of complexity, as increasing temperature can either suppress or promote splashing depending on whether the transition to rebound has occurred [24]. Recent investigations have also distinguished between prompt and corona splashing regimes and clarified the instability mechanisms responsible for secondary droplet formation at high impact velocities [25]. These studies clearly demonstrate that splashing cannot be represented by a single universal criterion, but instead emerges from highly coupled interactions that depend on fluid inertia, viscous dissipation, wetting dynamics, aerodynamic forces, and surface morphology.
Increasing attention has therefore shifted toward engineered and functional surfaces designed to influence droplet impact behavior. Hydrophobic, superhydrophobic, textured, and microstructured substrates have been shown to alter spreading dynamics, rebound characteristics, and contact time. Richard et al. [26] investigated droplet spreading and rebound on partially wetting surfaces, while Bird et al. [27] demonstrated that microscopic surface texture can substantially reduce droplet contact time. Subsequent studies have shown that macrotextures and microstructures can further modify rebound modes, induce asymmetric spreading, reduce contact time, or promote droplet fragmentation depending on impact conditions [22,28,29]. Investigations involving nanofluids and particle-laden droplets have introduced additional complexity associated with changes in viscosity, wetting behavior, and lamella dynamics. For example, Aksoy et al. [30] experimentally investigated the spreading-to-splashing transition of nanofluid droplets and proposed generalized splashing threshold correlations incorporating nanoparticle concentration effects, demonstrating that even relatively small particle concentrations can significantly influence splash initiation.
The growing recognition that droplet impact behavior results from strongly nonlinear interactions between numerous governing parameters has highlighted the limitations of conventional analytical and empirical models. Most existing correlations are found for specific fluids, substrates, or operating conditions and therefore exhibit limited predictive capability outside their calibration range. This limitation has motivated the application of machine learning (ML), which can identify complex nonlinear relationships directly from experimental data without requiring explicit assumptions regarding the governing physical equations. In recent years, ML methods have been increasingly adopted in fluid mechanics and multiphase flows because of their ability to improve predictive accuracy while reducing computational cost.
Recent studies have demonstrated the considerable potential of machine learning for predicting droplet impact dynamics. Tembely et al. [31] developed supervised learning models for predicting the maximum spreading coefficient across a broad range of Weber numbers, Reynolds numbers, and surface wettability, with gradient boosting providing the highest predictive accuracy. Choudhury et al. [32] applied artificial neural networks to predict βmax from Reynolds number, Weber number, contact angle, and surface roughness, achieving improved agreement with experiments compared to several established empirical correlations. Yancheshme et al. [33] combined experiments, theoretical modeling, and random forest regression to investigate spreading on hydrophobic and superhydrophobic silicone surfaces, identifying a critical Weber number above which the influence of contact angle becomes relatively weak. Beyond droplet impact, Mahendru et al. [34] demonstrated the usefulness of machine learning for relating suspension plasma spray parameters to coating properties such as roughness and wettability, illustrating the broader applicability of data-driven approaches for designing functional surfaces. Machine learning has also been applied to related droplet-impact problems, including prediction of spreading dynamics and icing patterns on supercooled surfaces using neural-network and deep-learning models [35]. Nevertheless, the predictive capability and generalizability of these approaches remain strongly dependent on the diversity and quality of the underlying experimental datasets.
Jereb et al. [36] further demonstrated that Gaussian process regression trained on approximately 1500 experimental impacts accurately predicts both the maximum spreading coefficient and rebound efficiency on superhydrophobic surfaces while outperforming several conventional empirical models. Beyond improving predictive accuracy, such data-driven approaches also provide opportunities to identify the relative importance of governing parameters and reveal nonlinear interactions that are difficult to extract from traditional empirical formulations.
In the present work, such data-driven framework is extended to a comprehensive experimental dataset encompassing multiple liquids and solid surfaces spanning a wide range of wettabilities. The dataset includes deionized water, water–glycerol mixtures, water–ethanol mixtures, ethylene glycol, ethanol, and isopropyl alcohol impacting aluminum, titanium, PEEK, PETG, stainless steel, glass, gold-coated surfaces, polymer coatings, and laser-textured hydrophobized aluminum. The contact angles range was from approximately 7.5° to 167°, covering hydrophilic, hydrophobic, and superhydrophobic regimes. The objectives of this study are twofold. First, machine learning regression models are developed to predict the maximum spreading coefficient over a broad range of liquid properties, impact conditions, and surface wettabilities. Second, a machine learning model is developed to predict the critical impact velocity corresponding to the transition from spreading to splashing. By comparing these data-driven predictions with established analytical and empirical models, the present study evaluates the potential of machine learning to provide accurate, robust, and transferable predictive tools for droplet-impact dynamics across a substantially broader range of experimental conditions than previously considered.
2. Materials and Methods
2.1. Surface Preparation and Characterization
Several substrate materials were used in this study, including 1050 aluminum (H24 temper), titanium (Grade 2), polyether ether ketone (PEEK), polyethylene terephthalate glycol (PETG), stainless steel (AISI 304), and glass. Aluminum substrates were additionally used for further surface modifications owing to their good processability and compatibility with different coating and texturing techniques.
To obtain surfaces with a wide range of wettability characteristics, several surface modification approaches were employed. These included gold ion sputter coating, spin coating of polymer solutions, and laser surface texturing followed by chemical hydrophobization. Through these treatments, surfaces with apparent water contact angles ranging from approximately 7.5° to 167° were produced, covering hydrophilic, hydrophobic, and superhydrophobic regimes. Gold-coated surfaces were fabricated using sputter deposition, resulting in thin chemically inert layers with relatively homogeneous surface morphology. Polymer coatings were prepared using two hybrid formulations, one non-fluorinated and one fluorinated with lower surface energy. The coatings were deposited onto cleaned aluminum substrates by spin coating and subsequently dried at 180 °C for 15 min. Laser-textured samples were fabricated using a nanosecond fiber laser system (FL Mark-C equipped with a JPT Opto-electronics “M7 30W” MOPA source) (JPT Opto-electronics Co., Ltd., Shenzhen, China). The laser beam was scanned across the substrate in a crosshatch pattern. The scanning speed was 1600 mm/s, laser power was 15 W, pulse repetition frequency was 110 kHz, pulse duration was 45 ns, and the center-to-center spacing between adjacent laser tracks was 25 μm. After laser texturing, the samples were chemically modified by exposure to chemical vapor deposition using a 1:19 v/v (heptadecafluoro-1,1,2,2-tetrahydrodecyl)trimethoxysilane (HTMS) solution in toluene at 90 °C for 1.5 h to reduce surface energy and promote (super)hydrophobicity.
The wettability of the prepared surfaces was characterized using apparent and advancing contact angle measurements. These parameters were later incorporated into the machine learning models as descriptors of surface wettability. The receding contact angle and contact angle hysteresis were excluded from the feature space, because the models specifically target the maximum spreading coefficient and splash onset during spreading, where the contact line is advancing. Consequently, receding dynamics do not physically participate in the investigated phenomena, and receding-phase fragmentation was explicitly excluded from the analysis (as detailed in Section 2.3).
2.2. Droplet Impact Experiments
Droplet impact measurements were conducted using several liquids with different thermophysical properties, including deionized water, water–glycerol mixtures (20 wt. % and 60 wt. %), water–ethanol mixtures (8.5 wt. % and 17 wt. %), ethylene glycol, ethanol, and isopropyl alcohol (IPA). The use of different liquids enabled systematic variation in density, viscosity, and surface tension.
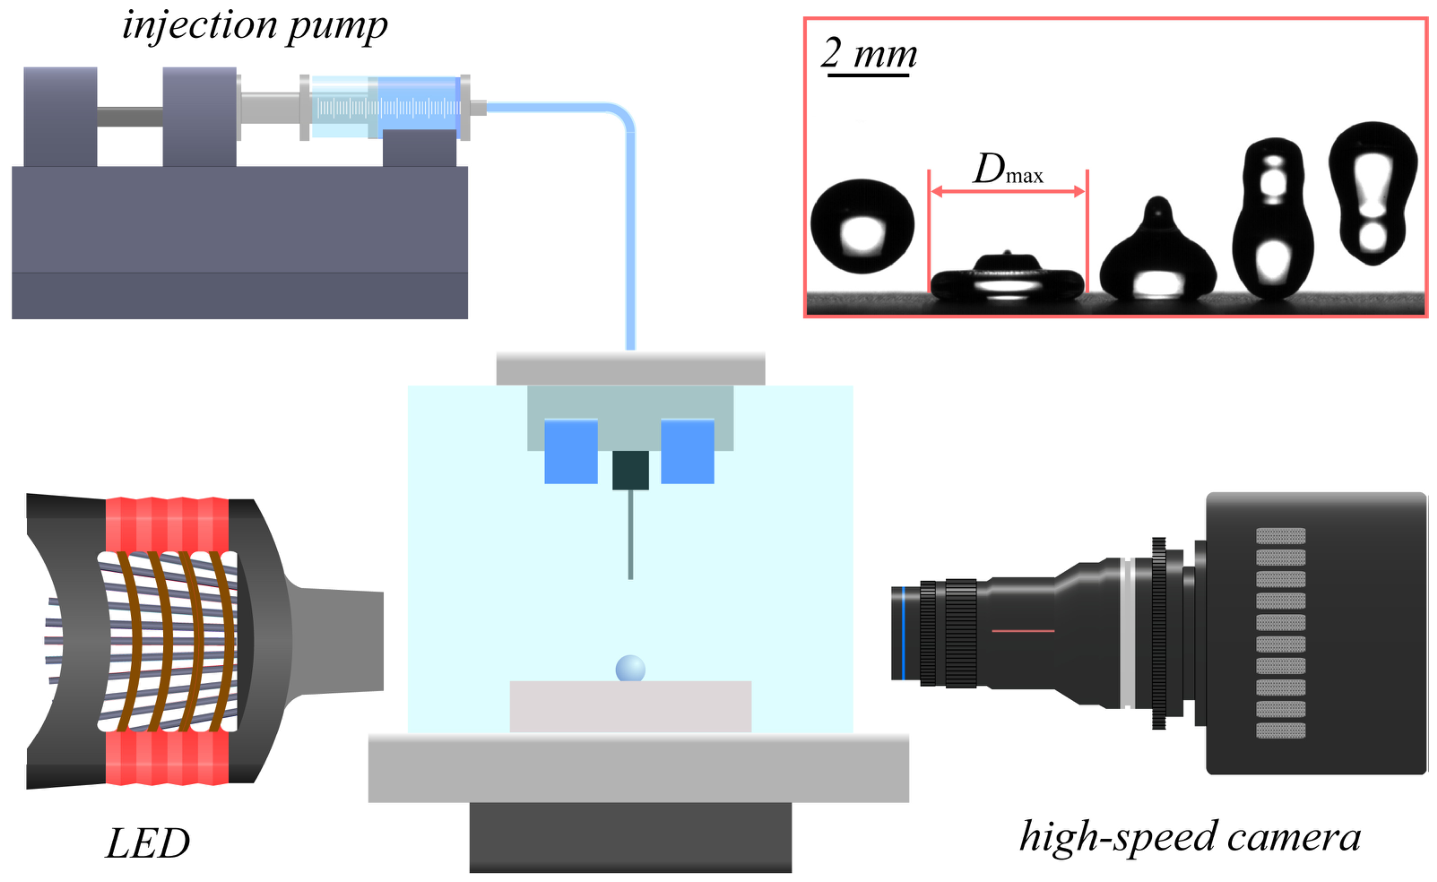
The experiments were performed using a custom-built droplet impact setup, illustrated in Figure 1. A syringe pump coupled with a blunt needle was used to generate droplets with controlled size. Droplets were released from different heights in order to vary the impact velocity. The droplet diameters ranged from 1.5 mm to 3.2 mm, while the impact velocities varied between 0.25 m/s and 4.1 m/s. The droplet impact process was recorded using a high-speed optical camera at 4000 fps combined with backside LED illumination to achieve high contrast between the droplet and the background. The experimental configuration enabled detailed observation of the spreading, receding, and splashing dynamics during droplet impact. The ranges of the investigated experimental parameters are summarized in Table 1.
Figure 1.
Schematic of the experimental setup for droplet impact measurements, with illustrated measurement of the maximum spreading diameter.
Table 1.
Experimental parameter ranges used for machine learning model development.
2.3. Image Processing and Data Reduction
The recorded high-speed videos were processed using a custom-developed image processing algorithm based on contour detection, fully described and validated in our previous work [37]. The algorithm was used to extract the key parameters describing the droplet impact dynamics for each experiment. These parameters included (i) initial droplet diameter prior to impact D0, (ii) droplet impact velocity u0 and (iii) maximum droplet radial extension Dmax.
The image processing pipeline was implemented using an in-house routine developed in MATLAB R2024b. A surface baseline (y = 0) was first defined on a representative frame showing the three-phase contact line. Each frame was then cropped below this baseline, and a droplet-free reference image was subtracted from the recorded frame. Threshold-based binarization produced a binary droplet mask, from which the droplet contour was extracted frame by frame to determine D0 and Dmax. The impact velocity u0 was obtained by tracking the vertical position of the droplet centroid over the final 15 frames before impact. A cubic polynomial was fitted to the centroid trajectory, and its derivative at the instant of contact was taken as the impact velocity.
The initial droplet diameters and impact velocities were used to obtain the non-dimensional Weber and Reynolds numbers, characterizing the properties of the droplets prior to impact, while the maximum spreading coefficient was calculated to quantify the outcome of the droplet impact. The resulting ranges of the Weber and Reynolds numbers covered by the experimental dataset are listed in Table 2.
We = ρu0 2D0/σ
Re = ρu0D0/μ
βmax = Dmax/D0
Table 2.
Ranges of the dimensionless parameters calculated from the experimental dataset.
The critical impact velocity for the transition from spreading to splashing was defined as the maximum impact velocity at which no droplet fragmentation or satellite droplet formation was observed during the spreading stage.
The experimentally determined input parameters are subject to uncertainties originating from droplet generation, image acquisition, image processing, spatial calibration, surface characterization, and local surface heterogeneity. These measurement uncertainties propagate into both the calculated target variables and the input features used for machine learning training.
The relative Type A standard uncertainty of the impact velocity determination was estimated from the covariance matrix of the polynomial regression and had a conservative upper bound of 0.5%. Type B uncertainty included spatial calibration uncertainty and temporal discretization associated with the camera frame rate of 4000 fps, corresponding to an inter frame interval of 0.25 ms. Its maximum value was 1.44% and occurred at the lowest impact velocities. Combining the Type A and Type B contributions by the root-sum-of-squares method resulted in a maximum conservative relative standard uncertainty of 1.52% for u0.
2.4. Machine Learning Model Development for Maximum Spreading Coefficient Prediction
The dataset used for prediction of the maximum spreading coefficient βmax consisted of more than 700 experimental data points collected using different liquids, substrate materials, droplet diameters, and impact velocities. The broad parameter range was selected to improve the generalizability of the developed machine learning models.
The input features used for model training included the initial droplet diameter (D0), impact velocity (u0), liquid density (ρ), dynamic viscosity (μ), surface tension (σ), and the cosine apparent and advancing contact angles (cos θ, cos θadv) of the substrate. The target variable of the machine learning models was the maximum spreading coefficient βmax.
Machine learning modeling was performed using MATLAB R2025b Regression Learner Toolbox, which provides access to a range of regression algorithms including linear regression, regression trees, support vector machines (SVM), Gaussian process regression (GPR), and neural networks. Several alternative feature representations and dataset configurations were evaluated during model development, including different representations of surface wettability, the use of dimensional and dimensionless input variables, and the inclusion or exclusion of identified outliers. For each dataset configuration, all available model families were initially evaluated using the default Regression Learner settings. After identifying the best-performing model family, its hyperparameters were further optimized to maximize predictive performance. Where applicable, predictor variables were standardized using the default z-score normalization implemented in the MATLAB Regression Learner Toolbox. This preprocessing scaled all features to a mean of zero and unit variance, neutralizing the vastly different physical scales of the fluid properties and allowing the models to evaluate all variables on an equal, dimensionless footing without requiring explicit length-scale weighting.
The dataset was additionally partitioned into superhydrophobic (SHPO) and non-superhydrophobic subsets to investigate whether separate models for distinct wettability regimes would improve predictive performance. Although models trained exclusively on the SHPO subset achieved slightly higher predictive accuracy, this partitioning strategy was used only as an exploratory analysis and was not adopted in the final model development. Instead, all subsequent analyses were performed using the complete dataset in order to develop a generalized predictive model applicable across a broad range of surface wettabilities.
Initial training was conducted using the complete set of dimensional physical parameters. Subsequently, alternative representations of surface wettability were investigated by expressing contact angles in radians and through cosine transformation. These transformations did not significantly improve predictive performance. Since cosine-based representations are commonly employed in wetting-related studies, cosine-transformed contact angles were retained in subsequent analyses. In addition, the dimensional physical parameters were replaced by dimensionless numbers, specifically the Weber and Reynolds numbers, to investigate whether physically condensed representations would improve prediction accuracy. However, replacing the original dimensional parameters with dimensionless groups resulted in slightly inferior model performance. Consequently, the original dimensional variables were retained for final model development. The experimental dataset together with the trained machine learning models developed in this study have been made publicly available through Mendeley Data [38].
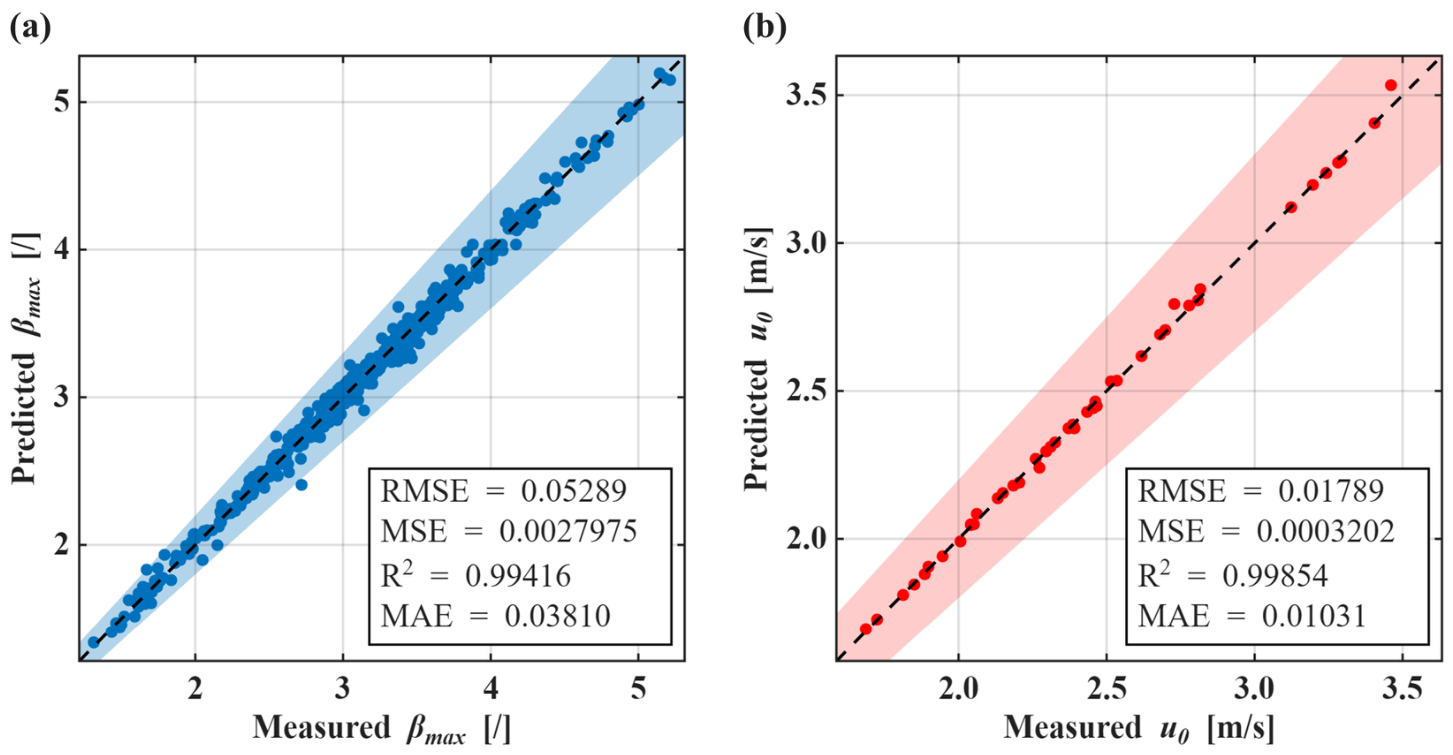
Model performance was evaluated using a randomly selected test subset comprising 10% of the original dataset. Sevenfold cross-validation was employed during training to reduce overfitting and improve model robustness. Among all evaluated models, Gaussian process regression consistently demonstrated the best predictive performance. The four best-performing configurations were all based on GPR models employing different kernel functions, including Rational Quadratic, Squared Exponential, and Matérn 5/2 kernels. Neural network models also achieved competitive performance but exhibited greater variability between training runs. The best-performing and most stable model was the GPR model with a squared exponential kernel, which achieved an R2 value of 0.99416 on the complete dataset. The predictive performance metrics of the model are shown in Figure 2a. To further evaluate model robustness, multiple models were trained and tested using different randomly selected 10% subsets of the data as test sets. In all cases, the resulting R2 value remained above 0.99. In addition, a separate validation test was performed using a manually selected subset of 110 data points, corresponding to approximately 15% of the dataset. The validation points were manually selected to provide representative coverage of the experimental parameter space by including different combinations of droplet diameter, impact velocity, liquid properties, and surface wettability, while the remaining data were used for training. The resulting GPR model predicted this independent subset with an R2 value of 0.9899, confirming that the model retained high predictive accuracy even when evaluated on a representative and deliberately diverse validation set.
Figure 2.
Predicted versus experimentally measured values for the Gaussian process regression model: (a) maximum spreading coefficient βmax, and (b) critical spreading–splashing threshold velocity u0. The dashed line represents ideal agreement between the predicted and experimentally measured values, while the shaded regions indicate the ±10% agreement bands relative to the measured values. The units of each prediction accuracy metric (with the exception of R2) correspond to the predicted parameter.
Gaussian process regression is a nonparametric probabilistic regression method in which the unknown relationship between the input variables and the predicted response is represented as a Gaussian process defined by a mean function and a covariance kernel. The kernel determines the similarity between observations in the predictor space and therefore governs how information is transferred between neighboring data points. In the present study, a squared exponential kernel was selected, which assumes a smooth variation in the predicted response. Its principal parameters are the characteristic length scale, which controls how rapidly correlation decreases with distance between observations, and the signal standard deviation, which controls the magnitude of response variations. Together with the estimated noise standard deviation, the GPR model provides both a predictive mean and a predictive variance for each input.
The GPR model was developed using a constant basis function and an isotropic squared exponential kernel. The principal component analysis was disabled. The kernel scale, signal standard deviation, and noise standard deviation were initialized automatically and estimated by optimizing the model’s numerical parameters during training.
2.5. Machine Learning Model Development for Spreading–Splashing Threshold Prediction
A similar machine learning workflow was applied for modeling the spreading–splashing threshold. In this case, the available dataset was substantially smaller, consisting of 44 data points since only one datapoint (i.e., threshold droplet velocity for splashing) corresponds to each combination of surface material and wettability, liquid and droplet diameter. The input features included the initial droplet diameter (D0), liquid density (ρ), dynamic viscosity (μ), surface tension (σ), and the apparent and advancing contact angles (θ, θadv) of the substrate. The target variable was the critical impact velocity for the spreading–splashing transition, defined as the maximum impact velocity at which no droplet fragmentation or satellite droplet formation was observed during the spreading stage, and denoted as u0.
As in the βmax analysis, 10% of the dataset was reserved for testing. Multiple training and validation sessions were conducted using fivefold cross-validation. Gaussian process regression models again demonstrated the best predictive performance, followed by neural network models. Unlike the βmax model, cosine-transformed contact angles resulted in inferior predictive performance for the spreading–splashing threshold model. Since the available threshold dataset was considerably smaller, the model was more sensitive to the representation of the input variables. Therefore, alternative representations of the contact angles, including degrees and cosine-transformed values, were systematically evaluated, and the final representation was selected based on the best and most stable cross-validated performance over multiple training iterations. Contact angles expressed in degrees consistently produced superior predictive accuracy and were therefore retained in the final model. The most stable and accurate configuration was the GPR model employing the Squared Exponential kernel, which achieved an R2 value of 0.9985. The corresponding comparison between predicted and experimentally measured critical spreading–splashing threshold velocities is presented in Figure 2b. However, due to the limited dataset size, this result should not be interpreted as definitive evidence of model generalizability. The trained model is included in the publicly available Mendeley Data repository [38].
3. Results and Discussion
3.1. Prediction of Maximum Spreading Coefficient
The maximum spreading coefficient, βmax, which represents the maximum horizontal extension of a droplet normalized by its initial diameter during impact, was investigated first. Numerous analytical and empirical models reported in the literature correlate βmax with the impact conditions and liquid properties using nondimensional numbers such as the Weber, Reynolds, and Ohnesorge numbers. While such approaches reduce the complexity of physical problems by combining multiple parameters into a limited number of dimensionless groups, they may also obscure the individual contribution of specific physical variables. In contrast, data-driven machine learning approaches, like the one described in this paper, are not constrained by simplified analytical assumptions and can independently evaluate the influence of individual predictors. This enables a more detailed investigation of the relative importance of impact velocity, viscosity, surface tension, droplet size, and surface wettability.
3.1.1. Shapley Additive Explanations Analysis
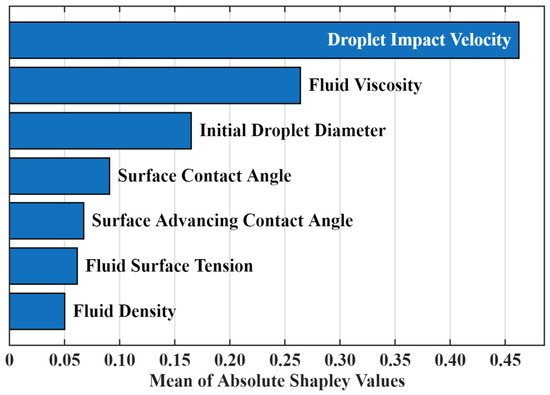
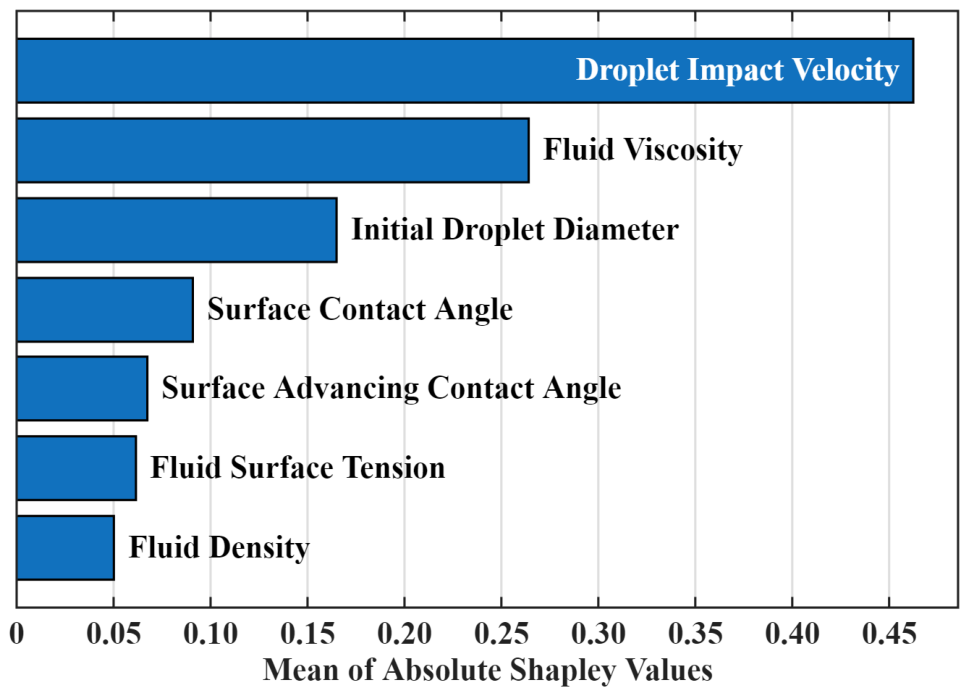
To improve interpretability of the developed machine learning models, Shapley additive explanations (SHAP) were used to evaluate the contribution of individual predictors to the model output. SHAP analysis provides a quantitative estimate of the contribution of each input parameter to a specific prediction. The relative importance of the predictors can be evaluated by averaging SHAP values over the complete dataset. SHAP analysis revealed that droplet impact velocity was the most influential parameter affecting prediction of βmax (see Figure 3). This observation is physically consistent, since higher impact velocity corresponds to increased kinetic energy available for droplet spreading. Fluid viscosity was identified as the second-most influential predictor, followed by the initial droplet diameter. Among the investigated liquid properties, viscosity exhibited the strongest influence on the predicted spreading behavior, whereas surface tension and density demonstrated comparatively smaller contributions. Surface wettability parameters, represented by apparent and advancing contact angles, showed relatively limited influence on the maximum spreading coefficient. This result suggests that during the initial spreading stage the droplet dynamics are governed primarily by inertia and viscous dissipation, while surface wettability may become more important during later receding and rebound stages. This is consistent with established droplet impact physics and demonstrates that a purely data-driven model trained on a diverse experimental dataset independently recovers these physically meaningful relationships [9,31,36].
Figure 3.
The analysis of the individual predictor importance for predicting maximum spreading coefficient.
3.1.2. Individual Conditional Expectation Analysis
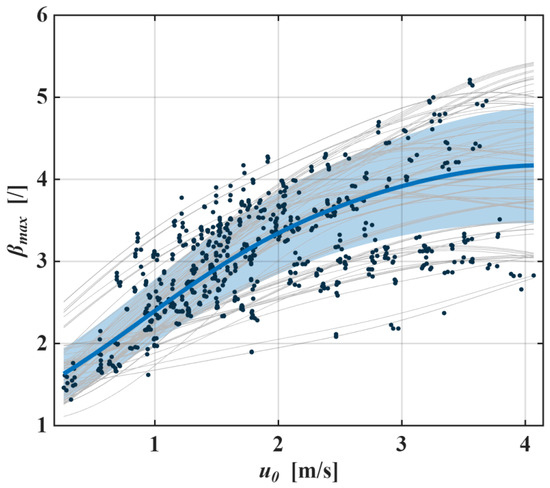
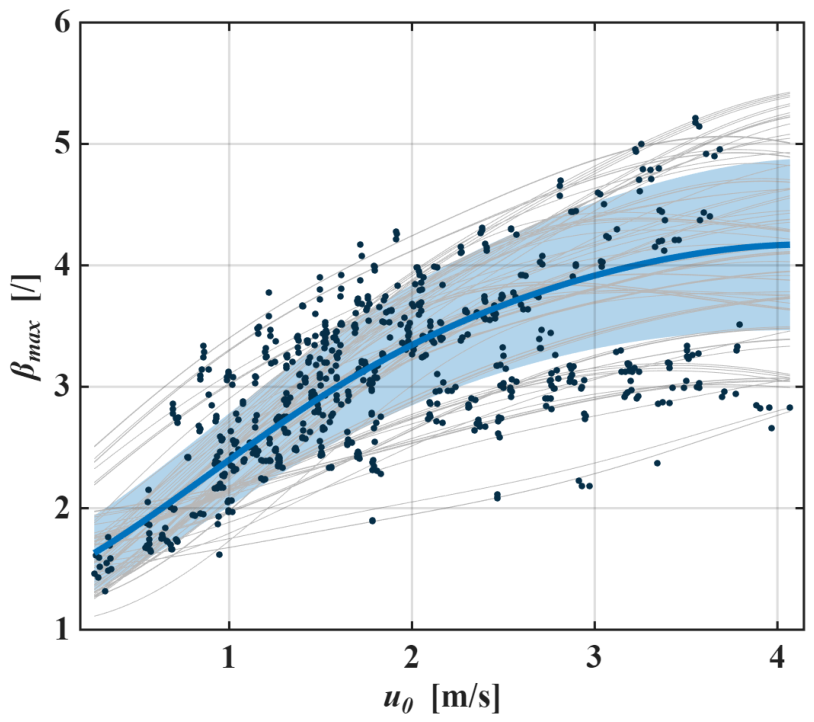
To further investigate the relationship between individual predictors and model response, individual conditional expectation (ICE) plots were computed for the most influential parameters identified through SHAP analysis [39]. ICE plots enable visualization of the local sensitivity of the model output to changes in individual input variables while keeping the remaining predictors fixed. The main bold colored line represents the averaged dependence, i.e., the partial dependence plot (PDP). The shaded region represents standard deviation from the mean to clearly map the prediction variance. The thin gray curves represent the individual conditional responses for different samples, which show specific interactions and possible divergence.
As shown in the SHAP analysis, the predicted maximum spreading factor has a strong positive dependence on the impact velocity. As shown in Figure 4, increasing u0 systematically increases βmax, although the sensitivity decreases at higher velocities. The spread among individual ICE trajectories suggests significant interaction effects between the impact velocity and other governing parameters. Owing to the relatively broad data coverage across the velocity range, the observed trend is considered physically meaningful and well supported by the training dataset. A key consideration when interpreting ICE plots is the distribution and density of the underlying training data across the feature range. Regions containing a high concentration of experimental observations generally provide more reliable and physically meaningful model behavior, since the predictions are strongly constrained by the available data. In contrast, regions with sparse data coverage should be interpreted with caution, as the model’s response in these areas is more strongly influenced by interpolation or extrapolation and may therefore be less robust. In the present velocity ICE analysis, the range between approximately 1 and 2 m/s contains a large density of data points, and the individual ICE trajectories exhibit a consistent increasing trend. This indicates a strong and reliable dependence of the predicted maximum spreading factor on the impact velocity within this regime. At higher velocities, however, the density of observations decreases substantially, and the ICE trajectories diverge more strongly between samples. Consequently, the predicted dependence in the high-velocity regime is associated with greater uncertainty and may not accurately represent the true physical relationship.
Figure 4.
ICE plot showing the influence of the impact velocity on maximum spreading coefficient, βmax. The thin gray curves represent individual conditional responses for the different observations. The bold colored line represents the mean partial dependence plot (PDP), while the shaded region denotes the one standard deviation across the ICE responses. The dots represent the experimental measurements.
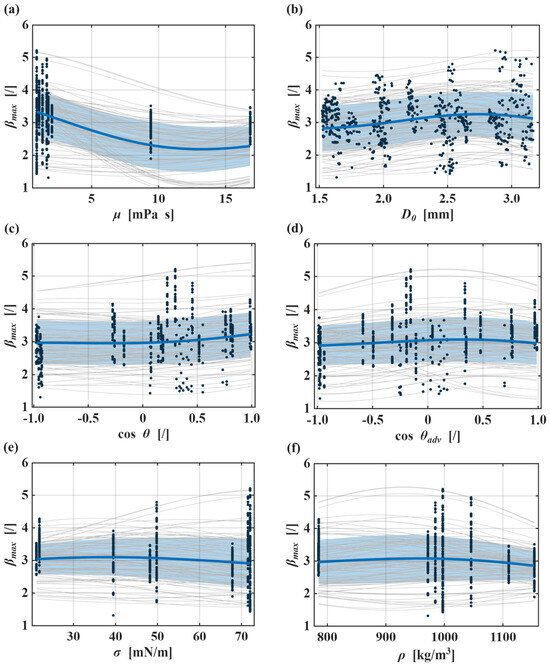
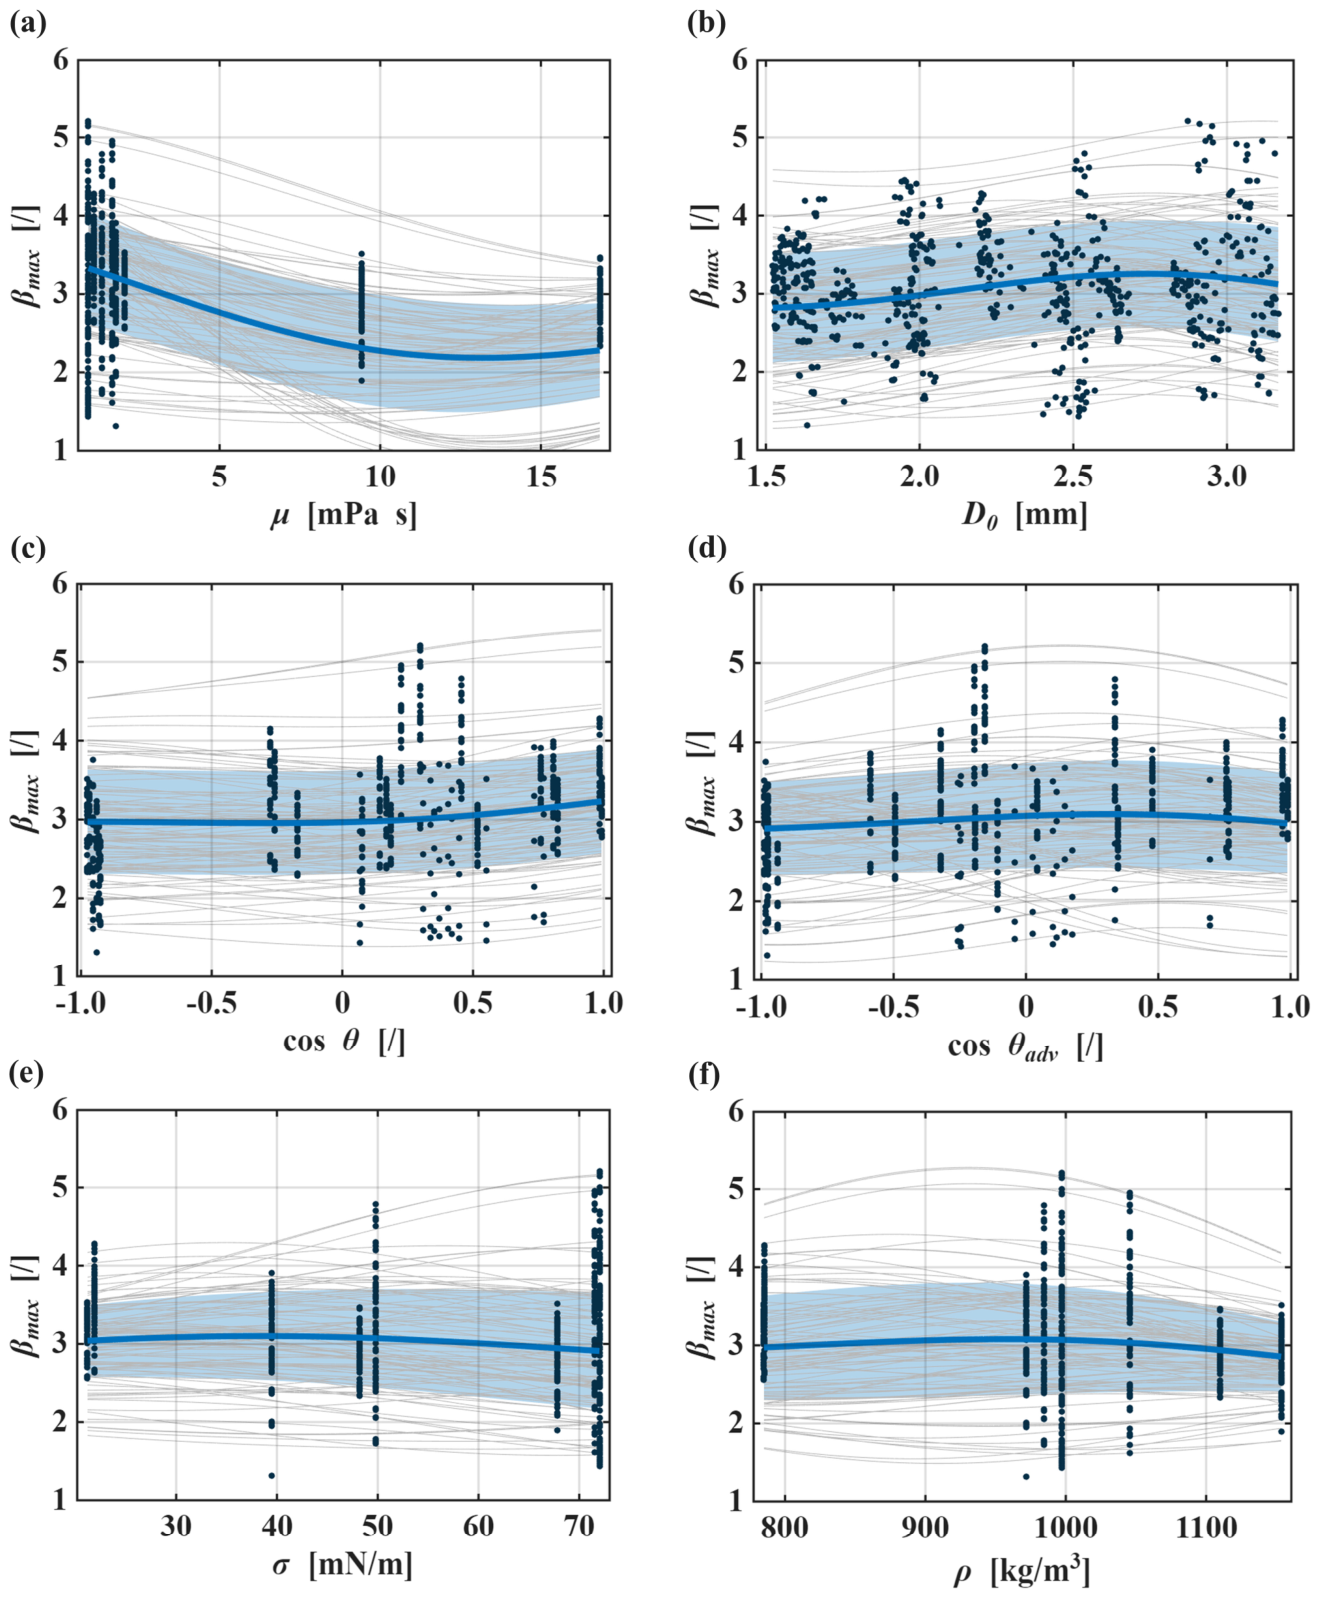
Figure 5 contains ICE graphs for all other input variables of the model. Viscosity is the second-most influential parameter of the maximum spreading coefficient. The average trend suggests that increasing viscosity reduces droplet spreading, which is physically consistent with enhanced viscous dissipation limiting radial expansion after impact. This trend is most reliable over the lower end of the investigated viscosity range, where the experimental data are densely distributed and the individual ICE trajectories show relatively consistent behavior. At higher viscosities, however, the data become sparse and the trajectories diverge more strongly, indicating increased uncertainty in the learned relationship and suggesting that the model response in this region should be interpreted cautiously. The remaining variables exhibit weaker and more interaction-dependent influences on βmax. Droplet diameter shows a moderate positive effect, with larger droplets generally associated with greater spreading, while the contact-angle-related parameters, surface tension, and density display comparatively small average effects. In these cases, the broad spread among the ICE trajectories indicates that their influence depends strongly on the accompanying fluid and impact conditions rather than acting as dominant independent parameters.
Figure 5.
ICE plots for all predictors ordered by importance: (a) fluid viscosity, (b) initial droplet diameter, (c) cosine of apparent contact angle, (d) cosine of advancing contact angle, (e) fluid surface tension, and (f) density. The bold colored line represents the mean PDP, the shaded region denotes standard deviation across the ICE responses, the thin gray curves show individual conditional responses, and the dots represent experimental measurements.
3.1.3. Evaluation Using an External Dataset
Model performance was initially evaluated using a randomly selected 10% subset of the internally generated dataset. To further assess model transferability and compare the best-performing candidate configurations, the models were additionally evaluated using an externally sourced dataset obtained from the KU Leuven HMT laboratory [40]. The KU Leuven dataset consisted of 43 data points and included measurements performed using water droplets with diameters of approximately 2.5 mm and impact velocities ranging from 1.5 m/s to 2.4 m/s. The investigated surfaces exhibited apparent water contact angles between 60° and 128°.
Although the models demonstrated excellent performance during internal validation, the predictive accuracy on the external dataset was notably lower. During model development, several candidate algorithms were repeatedly trained using the same selected predictor set and evaluated using the KU Leuven data. Exponential and rational quadratic GPR models occasionally achieved external R2 values of approximately 0.90 and 0.89, respectively, but their performance decreased to approximately 0.80–0.85 in other training sessions. Neural network models achieved values of approximately 0.83–0.88, whereas SVM models generally reached R2 values between 0.73 and 0.80 and occasionally produced negative values. In comparison, the squared exponential GPR consistently achieved an external R2 of approximately 0.86 and was therefore selected as the model providing the most stable balance between internal accuracy and performance on unseen data.
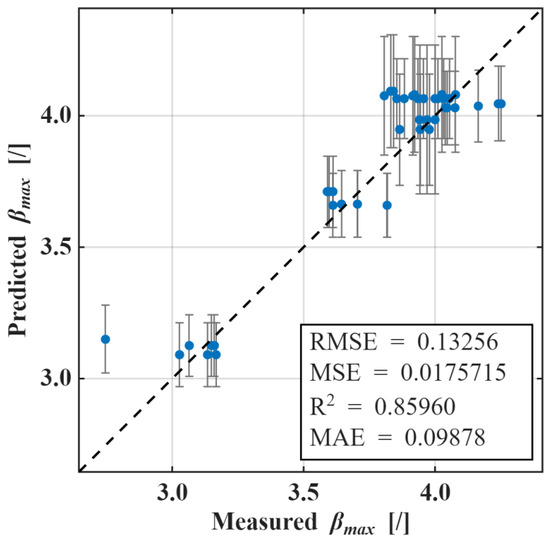
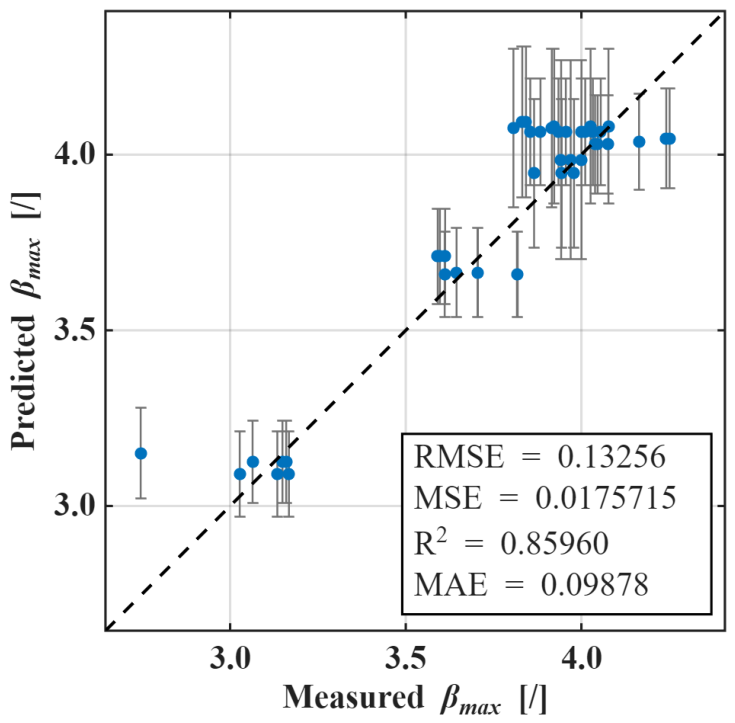
Figure 6 presents the external validation predictions together with pointwise 95% prediction intervals derived from the GPR posterior predictive distribution. The reduction in predictive accuracy likely reflects differences in experimental conditions and parameter distributions between the internally generated dataset and the external validation dataset. Wider prediction intervals were observed for several external-validation cases. Examination of the corresponding input conditions showed that these cases occurred predominantly at higher impact velocities, where the training data were less densely distributed. Together with the lower external-validation accuracy, this interval widening indicates that the model is most reliable within the densely sampled low-to-moderate velocity region, whereas predictions in the less densely sampled high-velocity region should be interpreted with greater caution.
Figure 6.
Performance of the selected GPR model on the externally sourced KU Leuven dataset. The vertical error bars represent the pointwise 95% prediction intervals obtained from the GPR model.
The performance metrics obtained for the complete dataset, the manually selected validation subset, and the external KU Leuven dataset are summarized in Table 3. Because the KU Leuven dataset was considered during candidate-model comparison, the reported performance should be interpreted as evidence of cross dataset transferability rather than as an unbiased estimate of performance on a fully independent final test set.
Table 3.
Performance metrics of each test session performed using the GPR model for droplet spreading evaluation.
3.1.4. Model Performance Using Dimensionless Input Parameters
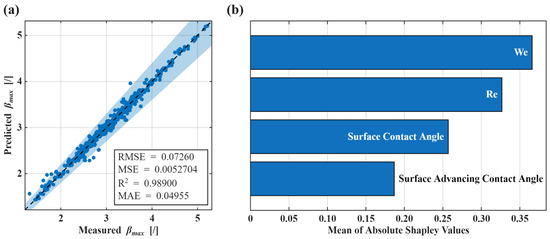
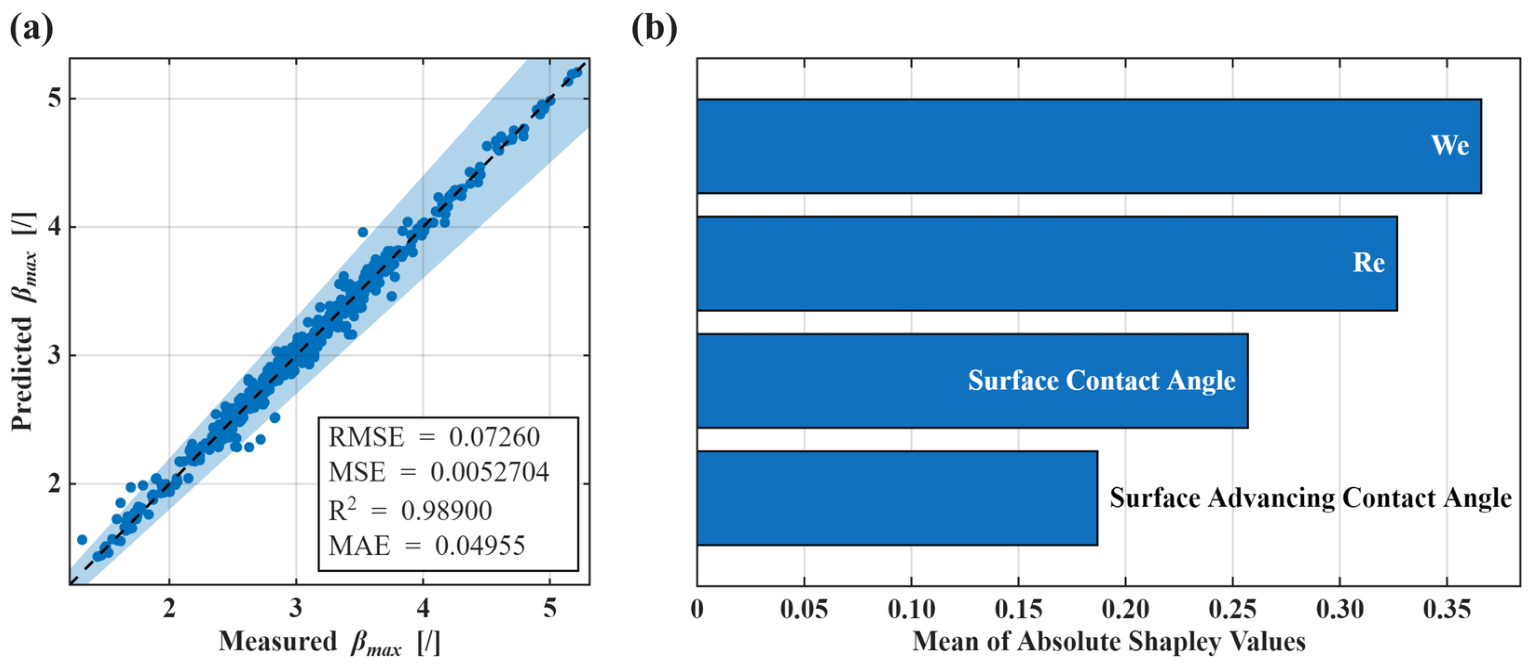
To compare the developed ML framework with conventional droplet impact correlations, an additional GPR model was trained using only Reynolds number, Weber number, and contact angle parameters. The resulting model demonstrated slightly lower predictive accuracy than the dimensional-variable-based formulation but still substantially outperformed empirical correlations (see Figure 7a).
Figure 7.
Analysis of the GPR model trained on dimensionless numbers: (a) predictive performance metrics, and (b) analysis of individual predictor importance. In graph (a) the dashed line represents ideal agreement between the predicted and measured values, while the shaded region indicates the ±10% agreement band relative to the measured values.
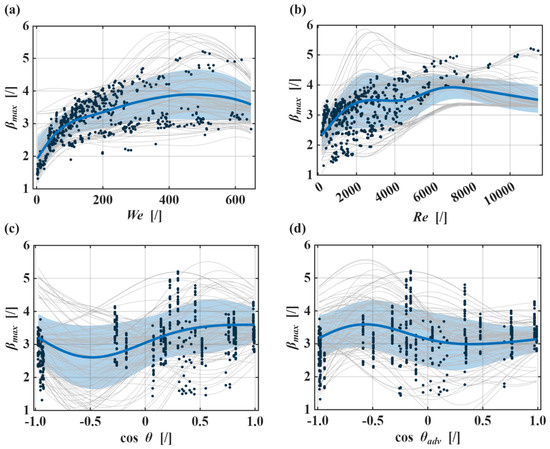
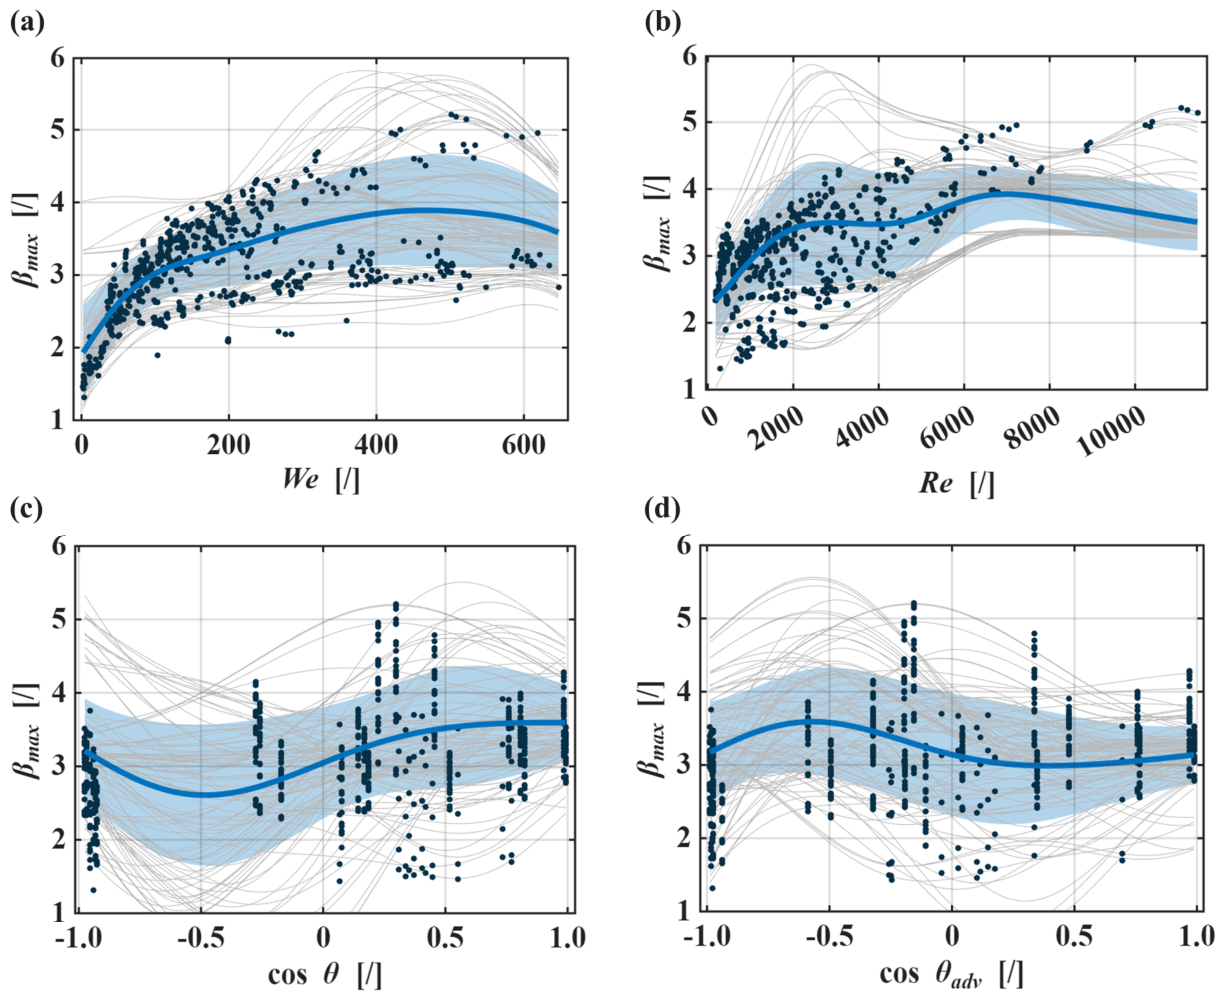
SHAP analysis of the model is shown in Figure 7b. The ICE analysis based on the reduced feature set consisting of the dimensionless numbers We and Re, together with the surface contact-angle parameters, reveals trends that are broadly consistent with the previous analysis performed using the original physical variables (see Figure 8). In particular, the Weber number exhibits the strongest influence on the predicted maximum spreading factor βmax, which can be explained with the squared impact velocity factor in Weber number formula. The PDP shows a clear increase in spreading with increasing We, especially in the low-to-intermediate range where the experimental data are densely distributed and the individual trajectories display relatively coherent behavior. This is physically expected, as larger Weber numbers correspond to stronger inertial forces relative to surface tension, promoting greater radial spreading.
Figure 8.
ICE plots for all predictors ordered by importance: (a) Weber number, (b) Reynolds number, (c) cosine surface contact angle, and (d) cosine surface advancing contact angle. The bold colored line represents the mean PDP, the shaded region denotes standard deviation across the ICE responses, the thin gray curves show individual conditional responses, and the dots represent experimental measurements.
At high We, the ICE curves separate into distinct response groups, indicating that the effect of We on βmax is conditional on other variables, most likely Re and therefore viscous dissipation. However, because the high-We region appears less densely sampled, the divergence may also reflect reduced data support or unrealistic feature combinations generated during the ICE procedure. Therefore, the PDP should be interpreted as an averaged response across heterogeneous regimes rather than as a single universal physical dependence. Similar deviations can be observed in previous studies [36].
The Reynolds number shows a more nonlinear influence. Increasing Re generally leads to larger predicted spreading factors, consistent with reduced relative viscous dissipation at high Reynolds numbers. However, the ICE trajectories display substantial variability, particularly at larger Re, where the model behavior becomes less consistent between samples. This observation aligns with the previous viscosity-based analysis, where viscosity was identified as one of the dominant governing parameters.
Interestingly, the ICE analysis indicates that the predicted βmax does not continue to increase monotonically with Re in the range of approximately 2000–5000. Instead, the response becomes weaker and more heterogeneous. A similar behavior has also been reported in previous studies [36]. The contact-angle-related parameters exhibit comparatively weak average effects on βmax, consistent with the earlier ICE analysis using the original feature space. Both contact angles produce nearly flat average ICE trends, while the large spread among the individual trajectories indicates that their influence is highly interaction-dependent and secondary relative to the inertial and viscous effects represented by We and Re.
Some individual ICE trajectories for the contact-angle predictors yield values of βmax below 1, which are not physically admissible because the maximum spreading diameter cannot be smaller than the initial droplet diameter. These predictions occur primarily when the ICE procedure varies a contact-angle predictor while holding all remaining variables fixed, thereby generating hypothetical predictor combinations that are sparsely represented or absent in the experimental dataset. Because the GPR model was not subject to an explicit physical constraint enforcing βmax above 1, its predictions may extend beyond the physically admissible range in these regions. Consequently, the individual trajectories outside the data-supported region should not be interpreted physically; the ICE plots are used primarily to assess the direction and variability of the model response within the densely populated range of the experimental data.
3.1.5. Comparison with Empirical Spreading Correlations
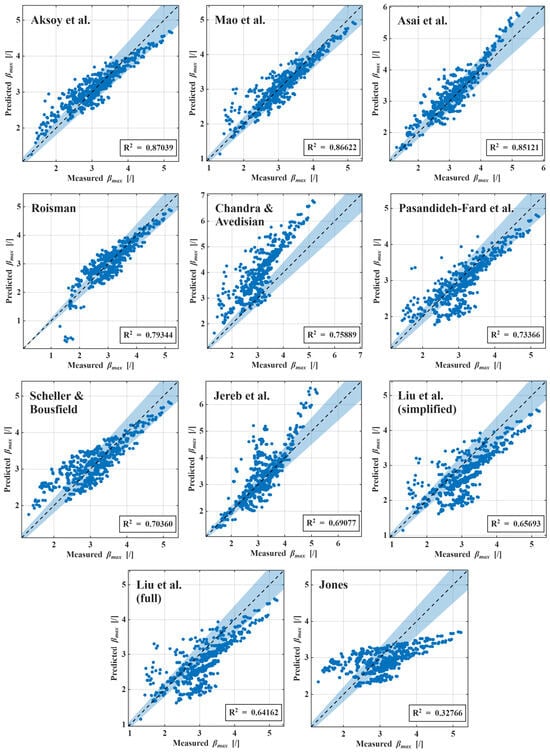
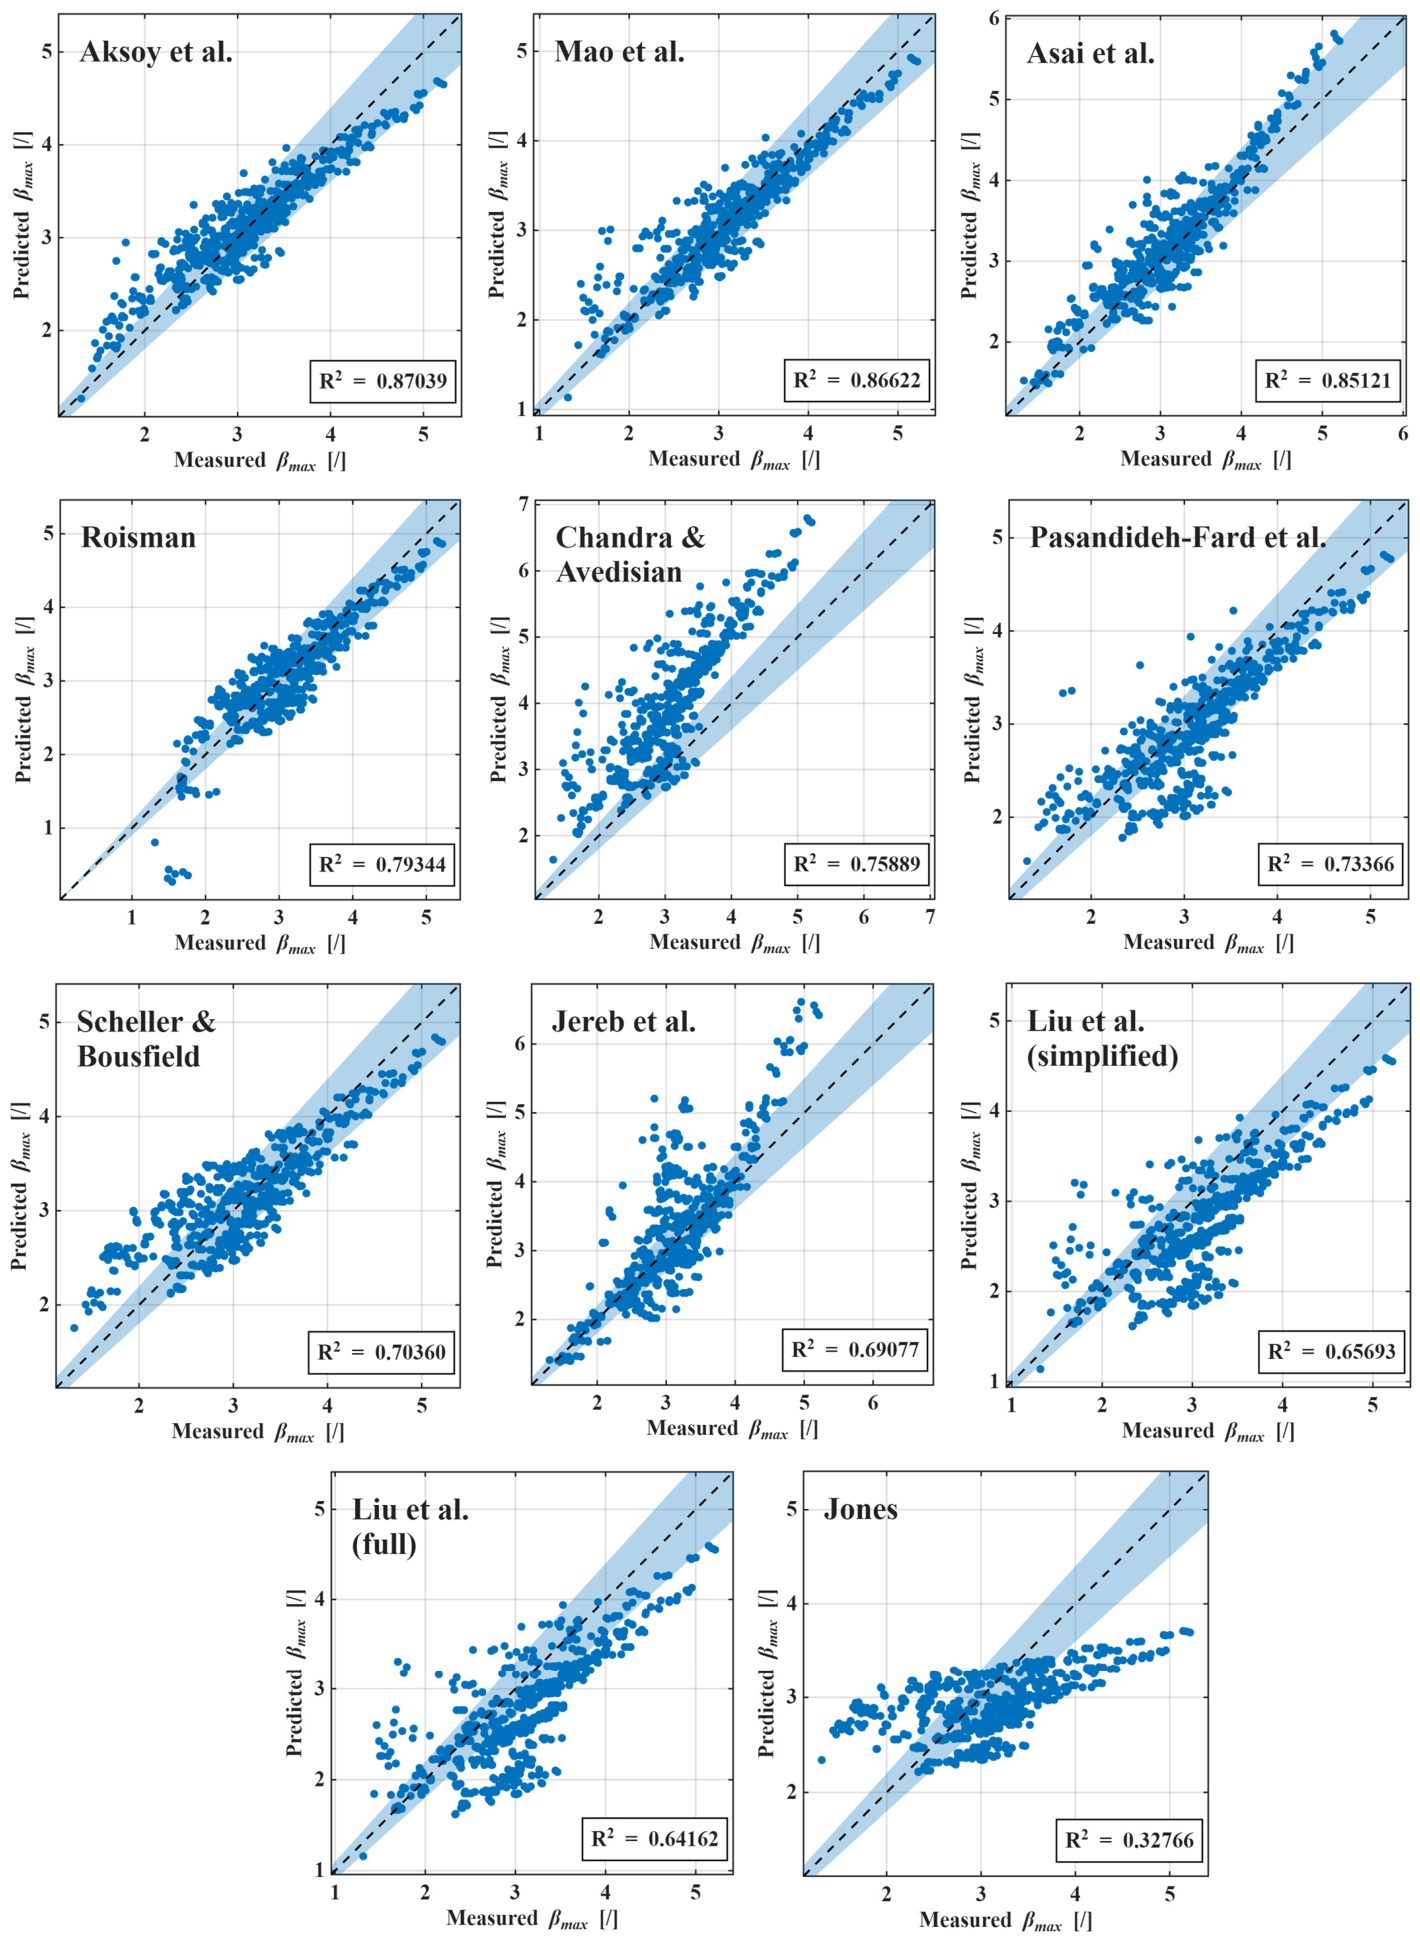
The predictive performance of several widely used empirical spreading correlations [4,5,9,36,41,42,43,44,45,46,47] was additionally evaluated using the complete experimental dataset. The best-performing literature models were those proposed by Aksoy, Mao, and Asai, which achieved R2 values of 0.870, 0.866, and 0.851, respectively. A comparison between the experimentally measured and predicted maximum spreading coefficients for all evaluated models is presented in Figure 9. Although these models performed reasonably well, their predictive capability remained substantially below that of the proposed machine learning framework. The developed GPR models achieved R2 values approaching 0.99 while simultaneously maintaining applicability across diverse fluid–surface combinations. This result highlights one of the primary contributions of the present work: the development of a generalized predictive methodology capable of outperforming traditional empirical correlations without requiring recalibration for individual fluids or surfaces.
Figure 9.
Predictive performances of empirical models on the complete dataset. The dashed line represents ideal agreement between the predicted and measured values, while the shaded region indicates the ±10% agreement band relative to the measured values.
3.2. Prediction of Spreading–Splashing Threshold Velocity
During the droplet impact experiments, splashing was observed at sufficiently high impact velocities for most fluid–surface combinations. The experimentally identified transition points between spreading and splashing regimes were therefore used to develop a predictive machine learning model for the critical spreading–splashing threshold velocity. Only splashing events occurring during the spreading stage were considered in the present analysis. Cases in which fragmentation occurred during receding were excluded because of the substantially different physical mechanisms involved. Compared with the prediction of βmax, the modeling of the spreading–splashing threshold is considerably more challenging because splashing is inherently unstable and stochastic. Furthermore, the available dataset consisted of only 44 observations, increasing susceptibility to overfitting. Despite the relatively small dataset, Gaussian process regression models demonstrated promising predictive capability and consistently outperformed alternative model families. Similarly to the βmax model, the Squared Exponential kernel yielded the best overall performance. Internal evaluation on a randomly withheld 10% test subset resulted in R2 value of 0.98636, while the whole data application resulted in R2 value of 0.99854 (see Figure 2b). The performance metrics obtained for the complete dataset and an internal test set are summarized in Table 4. Although the obtained predictive accuracy is very high, these results should be interpreted cautiously because of the limited dataset size and relatively sparse parameter coverage.
Table 4.
Performance metrics of each test session performed using the GPR model for spreading/splashing transition.
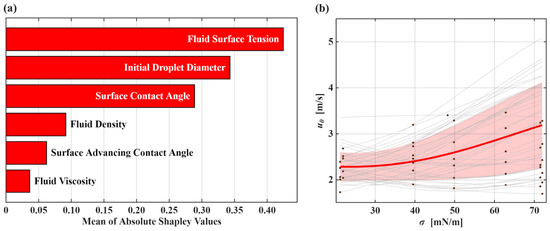
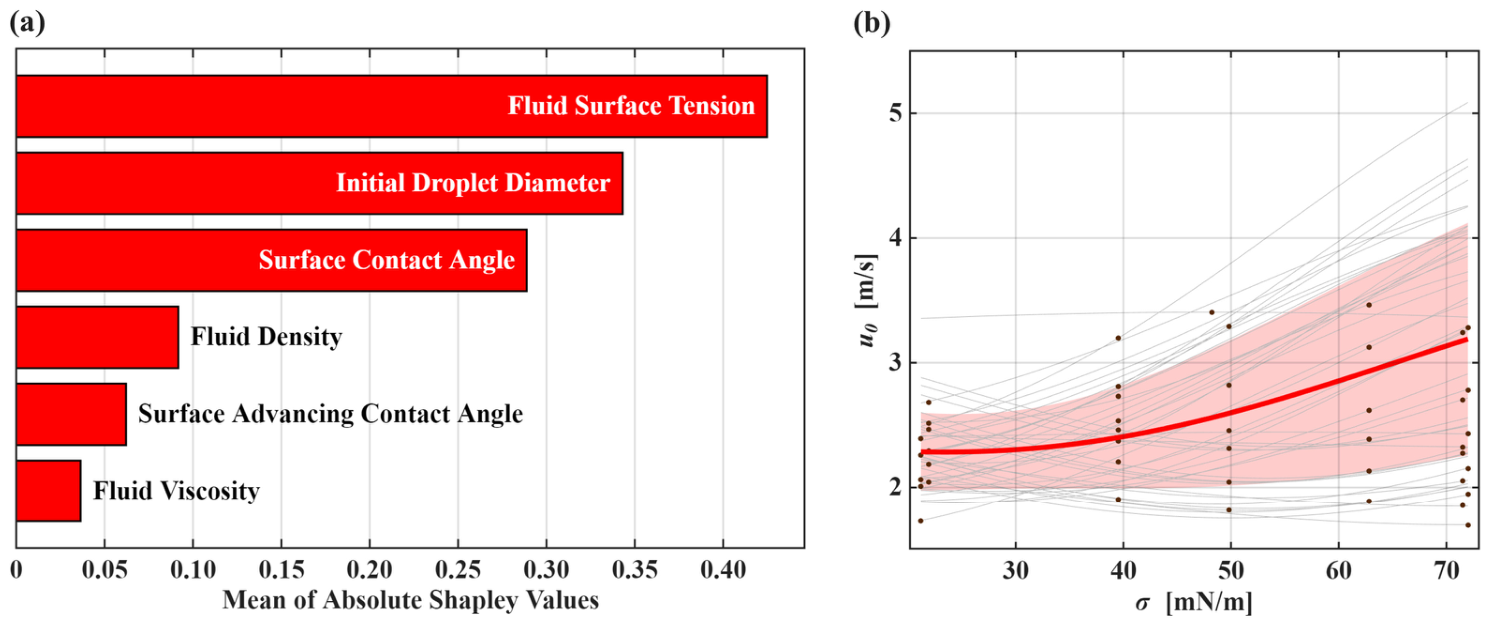
For the available limited dataset, SHAP analysis revealed that fluid surface tension is the dominant parameter influencing the predicted spreading–splashing threshold velocity (see Figure 10a). This result is physically meaningful because surface tension stabilizes the spreading lamella and suppresses fragmentation. Liquids with larger surface tension therefore require higher impact velocities to initiate splashing. Initial droplet diameter and apparent contact angle exhibited the next strongest influence on the predicted threshold velocity. In contrast, density, viscosity, and advancing contact angle demonstrated comparatively weaker effects.
Figure 10.
The analysis of the GPR model: (a) individual predictor importance and (b) ICE plot showing the influence of surface tension on critical spreading–splashing threshold velocity. The bold colored line in the ICE plot represents the mean PDP, the shaded region denotes standard deviation across the ICE responses, the thin gray curves show individual conditional responses, and the dots represent experimental measurements.
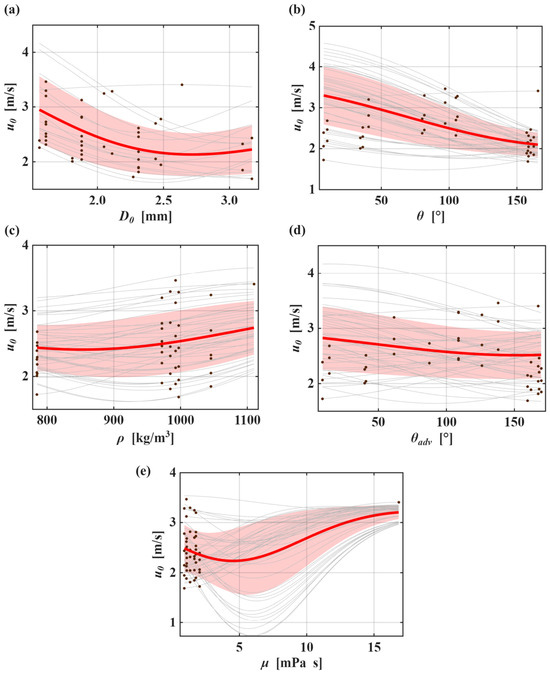
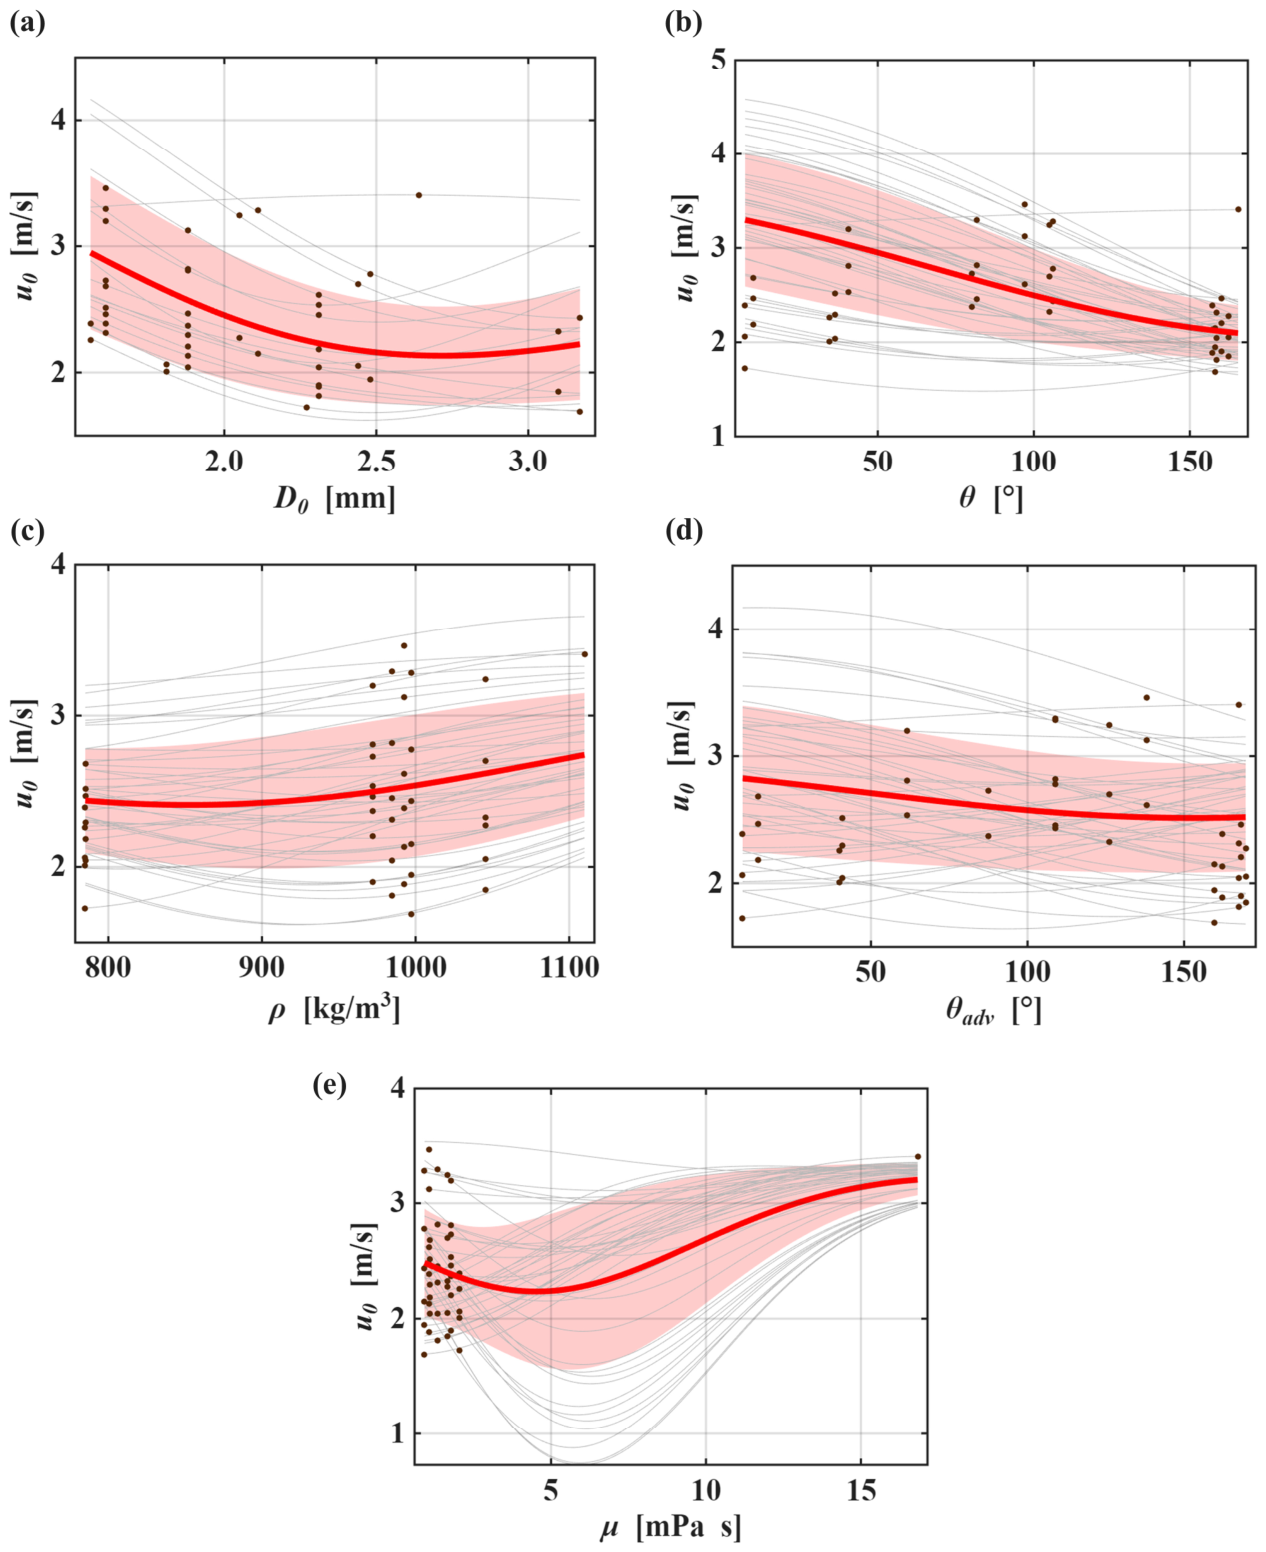
The ICE analysis indicates that surface tension σ is the dominant parameter influencing the predicted critical impact velocity u0 for the transition from spreading to splashing. The average ICE trend shows a clear increase in the splashing threshold with increasing surface tension, suggesting that liquids with larger σ require higher impact velocities to initiate splashing, as shown in Figure 10b. This behavior is physically consistent with the stabilizing role of capillary forces, which resist deformation and fragmentation of the liquid lamella during impact. Higher surface tension therefore suppresses the growth of instabilities responsible for splash formation, requiring greater inertial forcing to overcome capillary stabilization. However, the individual ICE trajectories exhibit substantial variability, particularly at larger σ, where some responses increase strongly while others remain nearly constant or even decrease slightly. This divergence indicates significant interaction effects with other governing parameters, such as viscosity, droplet size, or wettability, and also reflects the limited size and discrete nature of the underlying dataset. The remaining ICE analyses indicate that droplet diameter D0 and apparent contact angle θ exhibit the strongest secondary influence on the predicted critical impact velocity for splashing onset, although their effects are weaker and less consistent than that of surface tension. Increasing droplet diameter generally reduces the predicted critical impact velocity for the spreading-to-splashing transition. This trend is physically consistent, since larger droplets possess greater mass and kinetic energy at a given impact velocity, producing larger spreading lamellae that are more susceptible to the growth of the aerodynamic and capillary instabilities responsible for splash formation. Similarly, increasing the apparent contact angle decreases the predicted threshold velocity. This behavior is consistent with the reduced liquid–solid adhesion on hydrophobic surfaces, which facilitates lamella lift-off from the substrate and promotes the onset of splashing at lower impact velocities. However, both variables exhibit substantial variability among the individual ICE trajectories, indicating that their influence is strongly coupled with other governing parameters and should be interpreted with caution given the limited size of the available dataset. In contrast, density ρ, advancing contact angle θadv, and viscosity μ show comparatively weak average effects on the model prediction. ICE plots for these parameters are shown in Figure 11.
Figure 11.
ICE plots for all predictors ordered by importance: (a) initial droplet diameter, (b) surface contact angle, (c) fluid density, (d) surface advancing contact angle, and (e) fluid viscosity. The bold colored line represents the mean PDP, the shaded region denotes standard deviation across the ICE responses, the thin gray curves show individual conditional responses, and the dots represent experimental measurements.
Although the ICE curves suggest a nonlinear dependence of the predicted splashing threshold on viscosity, the available dataset provides only limited coverage of the intermediate and high-viscosity regimes. Most observations are concentrated at low viscosities, while the highest viscosity is represented by only a single experimental data point. Consequently, the average partial dependence in this region is strongly influenced by this isolated observation and should therefore be interpreted with caution. The apparent non-monotonic trend is more likely to reflect the limited distribution of the available data and the corresponding interpolation behavior of the model than a robust physical relationship between viscosity and the critical splashing threshold.
3.3. Limitations of the Models
Although the developed Gaussian process regression models demonstrated excellent predictive performance within the investigated parameter space, several limitations should be considered when interpreting the results. As with most supervised machine learning approaches, the predictive capability of the models is fundamentally determined by the distribution and representativeness of the training data. Consequently, the models are expected to provide the most reliable predictions when interpolating between experimentally sampled conditions, whereas predictions outside the investigated parameter space should be interpreted with greater caution. Extrapolation beyond the ranges of droplet diameter, impact velocity, liquid properties, or surface wettability considered in this study may not accurately represent the underlying physical behavior.
The reliability of the predictions also depends on the local density of the available experimental data. As demonstrated by the ICE analyses, some regions of the parameter space, particularly those corresponding to high impact velocities and high liquid viscosities, contain substantially fewer observations than the central part of the dataset. Predictions in these sparsely populated regions therefore exhibit greater uncertainty and should be interpreted as model-guided estimates rather than fully validated physical relationships. Expanding the experimental database in these regions would improve the robustness of the learned dependencies and reduce prediction uncertainty.
Another limitation is that the present models describe surface characteristics primarily through apparent and advancing contact angles, explicitly omitting a quantitative surface roughness parameter (e.g., Ra) or a categorical texture feature. Defining a universally comparable roughness metric across this dataset, which ranges from spin-coated polymers to laser-textured surfaces, is physically ambiguous, since standard do not capture spatial frequency of features or their geometry. Furthermore, as demonstrated by the SHAP analyses, maximum spreading and initial splash onset are dominated by inertia and viscous dissipation, with surface parameters playing a secondary role. At these energetic impact conditions, the macroscopic wetting effects of the underlying surface roughness are already encoded within the apparent and advancing contact angles. Therefore, while future machine learning models focusing on rebound or contact-line pinning may benefit from advanced topological descriptors, incorporating general roughness metrics here would not substantially improve the current predictions and risks introducing overfitting.
Finally, all experiments were performed under controlled laboratory conditions with ambient temperature and atmospheric pressure maintained approximately constant. The developed models therefore do not account for the influence of environmental variables such as reduced ambient pressure, elevated substrate temperature, or temperature-dependent changes in liquid properties, all of which are known to affect droplet spreading and splashing behavior [14,24]. Extension of the experimental database to include these parameters would broaden the applicability of the proposed modeling framework and enable predictions under a wider range of operating conditions.
4. Conclusions
This study developed and evaluated machine learning models for predicting two key characteristics of droplet impact on solid surfaces: the maximum spreading coefficient and the critical spreading–splashing threshold velocity. The models were trained using a comprehensive experimental dataset covering a broad range of droplet sizes, impact velocities, liquid properties, and surface wettabilities, providing a substantially wider parameter space than is typically considered in studies focused on individual fluids or surface types.
For prediction of the maximum spreading coefficient, Gaussian process regression (GPR) consistently provided the highest predictive accuracy among the evaluated machine learning approaches, achieving coefficient of determination (R2) values above 0.99 during internal validation. The developed model also outperformed several widely used empirical spreading correlations, demonstrating the potential of data-driven methods to capture the complex nonlinear interactions governing droplet impact over diverse liquid–surface combinations. Evaluation using the external KU Leuven comparison dataset resulted in a lower, but still satisfactory, predictive performance, highlighting both the robustness of the proposed framework and the continuing importance of broad and diverse training datasets for achieving improved model transferability. Comparison with alternative GPR, neural network, and SVM models showed that the selected model provided the most stable balance between internal accuracy and performance on unseen data.
Model interpretation using SHAP and ICE analyses further demonstrated that the learned relationships remain physically meaningful rather than purely statistical. Impact velocity was identified as the dominant parameter governing the maximum spreading coefficient, followed by fluid viscosity and droplet diameter, while surface wettability exhibited a comparatively smaller influence during the initial inertial spreading stage. These findings are consistent with the established physical understanding of droplet impact and provide additional confidence that the machine learning model captures realistic physical trends instead of relying solely on empirical curve fitting.
A second GPR model was developed to predict the critical spreading–splashing threshold velocity. Despite the considerably smaller dataset available for this problem, the model achieved excellent predictive performance within the investigated parameter space. SHAP analysis identified surface tension as the dominant predictor of the splashing threshold, followed by droplet diameter and apparent contact angle, which is physically consistent with the stabilizing role of capillary forces and the influence of droplet inertia and surface wettability on lamella instability.
The principal contribution of this work is the development of an interpretable machine learning framework capable of accurately predicting both droplet spreading and splashing behavior across a wide range of liquids and surface wettabilities while simultaneously providing quantitative insight into the relative importance of the governing physical parameters. These results demonstrate that machine learning methods, particularly Gaussian process regression, represent a powerful complement to conventional analytical and empirical models for investigating complex droplet-impact phenomena. Furthermore, it must be explicitly noted that the present models are most reliable within the low-to-moderate viscosity regime; predictions at higher viscosities carry greater uncertainty due to current data sparsity. Future work could focus on expanding the experimental database in these sparse regions to further improve model transferability, extending validation across additional independent datasets, and incorporating uncertainty quantification to support reliable application of the models beyond the current experimental domain.
Author Contributions
N.P.: Conceptualization, Data Curation, Investigation, Software, Writing—Original Draft; J.B.: Data Curation, Methodology, Software, Validation, Writing—Review and Editing; S.J.: Investigation, Methodology, Software, Writing—Review and Editing; M.Z.: Conceptualization, Supervision, Writing—Review and Editing; I.G.: Funding Acquisition, Supervision, Writing—Review and Editing; M.M.: Conceptualization, Methodology, Project Administration, Supervision, Validation, Writing—Review and Editing. All authors have read and agreed to the published version of the manuscript.
Funding
The authors acknowledge the financial support from the state budget of the Slovenian Research Agency (Program No. P2-0223 and Project No. J2-50085).
Data Availability Statement
The experimental dataset generated in this study and the trained machine learning models are available in Mendeley Data [38]. The externally sourced KU Leuven dataset used for model comparison and evaluation was provided by the authors of Ref. [40] and is not included in the repository, as the authors of the present study are not authorized to redistribute it. Requests for access should be directed to the original data owners.
Acknowledgments
The authors thank Prof. Dr. Maria Rosaria Vetrano and Ms. Yuheng Shang (both from KU Leuven, Department of Mechanical Engineering, Division of Applied Mechanics and Energy Conversion) for sharing their dataset on droplet spreading.
Conflicts of Interest
The authors declare no conflicts of interest.
Abbreviations
The following abbreviations are used in this manuscript:
| GPR | Gaussian process regression |
| HTMS | (heptadecafluoro-1,1,2,2-tetrahydrodecyl)trimethoxysilane |
| ICE | Individual Conditional Expectation |
| IPA | Isopropyl alcohol |
| ML | Machine learning |
| PEEK | Polyether ether ketone |
| PETG | Polyethylene terephthalate glycol |
| SHAP | Shapley Additive Explanations |
| SHPO | Superhydrophobic |
| SVM | Support vector machines |
References
- Yarin, A.L. Drop Impact Dynamics: Splashing, Spreading, Receding, Bouncing. Annu. Rev. Fluid Mech. 2006, 38, 159–192. [Google Scholar] [CrossRef] [Scilit]
- Josserand, C.; Thoroddsen, S.T. Drop Impact on a Solid Surface. Annu. Rev. Fluid Mech. 2016, 48, 365–391. [Google Scholar] [CrossRef] [Scilit]
- Clanet, C.; Béguin, C.; Richard, D.; Quéré, D. Maximal Deformation of an Impacting Drop. J. Fluid Mech. 2004, 517, 199–208. [Google Scholar] [CrossRef] [Scilit]
- Roisman, I.V. Inertia Dominated Drop Collisions. II. An Analytical Solution of the Navier-Stokes Equations for a Spreading Viscous Film. Phys. Fluids 2009, 21, 052104. [Google Scholar] [CrossRef] [Scilit]
- Pasandideh-Fard, M.; Qiao, Y.M.; Chandra, S.; Mostaghimi, J. Capillary Effects during Droplet Impact on a Solid Surface. Phys. Fluids 1996, 8, 650–659. [Google Scholar] [CrossRef] [Scilit]
- Antonini, C.; Amirfazli, A.; Marengo, M. Drop Impact and Wettability: From Hydrophilic to Superhydrophobic Surfaces. Phys. Fluids 2012, 24, 102104. [Google Scholar] [CrossRef] [Scilit]
- Zhang, H.; Zhang, X.; Yi, X.; He, F.; Niu, F.; Hao, P. Effect of Wettability on Droplet Impact: Spreading and Splashing. Exp. Therm. Fluid Sci. 2021, 124, 110369. [Google Scholar] [CrossRef] [Scilit]
- Lin, S.; Zhao, B.; Zou, S.; Guo, J.; Wei, Z.; Chen, L. Impact of Viscous Droplets on Different Wettable Surfaces: Impact Phenomena, the Maximum Spreading Factor, Spreading Time and Post-Impact Oscillation. J. Colloid Interface Sci. 2018, 516, 86–97. [Google Scholar] [CrossRef] [Scilit] [PubMed]
- Liu, X.; Liu, H.; Lv, C.; Liu, B.; Zhang, D. Predictive Model for the Maximum Spreading Diameter Coefficient of Droplets Impacting Surfaces with Different Wettability. Coatings 2026, 16, 676. [Google Scholar] [CrossRef] [Scilit]
- Mundo, C.; Sommerfeld, M.; Tropea, C. Droplet-Wall Collisions: Experimental Studies of the Deformation and Breakup Process. Int. J. Multiph. Flow 1995, 21, 151–173. [Google Scholar] [CrossRef] [Scilit]
- Rioboo, R.; Tropea, C.; Marengo, M. Outcomes from a Drop Impact on Solid Surfaces. At. Sprays 2001, 11, 155–165. [Google Scholar] [CrossRef] [Scilit]
- Vander Wal, R.L.; Berger, G.M.; Mozes, S.D. The Splash/Non-Splash Boundary upon a Dry Surface and Thin Fluid Film. Exp. Fluids 2006, 40, 53–59. [Google Scholar] [CrossRef] [Scilit]
- Usawa, M.; Fujita, Y.; Tagawa, Y.; Riboux, G.; Gordillo, J.M. Large Impact Velocities Suppress the Splashing of Micron-Sized Droplets. Phys. Rev. Fluids 2021, 6, 023605. [Google Scholar] [CrossRef] [Scilit]
- Xu, L.; Zhang, W.W.; Nagel, S.R. Drop Splashing on a Dry Smooth Surface. Phys. Rev. Lett. 2005, 94, 184505. [Google Scholar] [CrossRef] [Scilit] [PubMed]
- Mandre, S.; Brenner, M.P. The Mechanism of a Splash on a Dry Solid Surface. J. Fluid Mech. 2012, 690, 148–172. [Google Scholar] [CrossRef] [Scilit]
- Riboux, G.; Gordillo, J.M. Experiments of Drops Impacting a Smooth Solid Surface: A Model of the Critical Impact Speed for Drop Splashing. Phys. Rev. Lett. 2014, 113, 024507. [Google Scholar] [CrossRef] [Scilit] [PubMed]
- Tang, C.; Qin, M.; Weng, X.; Zhang, X.; Zhang, P.; Li, J.; Huang, Z. Dynamics of Droplet Impact on Solid Surface with Different Roughness. Int. J. Multiph. Flow 2017, 96, 56–69. [Google Scholar] [CrossRef] [Scilit]
- Quetzeri-Santiago, M.A.; Castrejón-Pita, A.A.; Castrejón-Pita, J.R. The Effect of Surface Roughness on the Contact Line and Splashing Dynamics of Impacting Droplets. Sci. Rep. 2019, 9, 15030. [Google Scholar] [CrossRef] [Scilit] [PubMed]
- Almohammadi, H.; Amirfazli, A. Droplet Impact: Viscosity and Wettability Effects on Splashing. J. Colloid Interface Sci. 2019, 553, 22–30. [Google Scholar] [CrossRef] [Scilit] [PubMed]
- Liu, C.; Liu, Q.; Lin, Z. Dynamical Behavior of Droplets Transiently Impacting on Superhydrophobic Microstructures. Phys. Fluids 2020, 32, 103304. [Google Scholar] [CrossRef] [Scilit]
- Aboud, D.G.K.; Kietzig, A.M. Splashing Threshold of Oblique Droplet Impacts on Surfaces of Various Wettability. Langmuir 2015, 31, 10100–10111. [Google Scholar] [CrossRef] [Scilit] [PubMed]
- Gauthier, A.; Symon, S.; Clanet, C.; Quéré, D. Water Impacting on Superhydrophobic Macrotextures. Nat. Commun. 2015, 6, 8001. [Google Scholar] [CrossRef] [Scilit] [PubMed]
- Zhang, X.; Li, K.; Liu, X.; Wu, X.; Song, Q.; Min, J.; Ji, B.; Wang, S.; Zhao, J. Droplet Impact Dynamics on Different Wettable Surfaces at Moderate Weber Numbers. Colloids Surf. A Physicochem. Eng. Asp. 2024, 695, 134250. [Google Scholar] [CrossRef] [Scilit]
- Lin, S.; Zhou, L.; Liu, B.; Xu, Q.; Chen, L.; Li, Z. The Roles of Surface Temperature and Roughness in Droplet Splashing. Int. J. Heat Mass Transf. 2024, 220, 124959. [Google Scholar] [CrossRef] [Scilit]
- Burzynski, D.A.; Roisman, I.V.; Bansmer, S.E. On the Splashing of High-Speed Drops Impacting a Dry Surface. J. Fluid Mech. 2020, 892, A2. [Google Scholar] [CrossRef] [Scilit]
- Richard, D.; Quéré, D. Bouncing Water Drops. Europhys. Lett. 2000, 50, 769–775. [Google Scholar] [CrossRef] [Scilit]
- Bird, J.C.; Dhiman, R.; Kwon, H.M.; Varanasi, K.K. Reducing the Contact Time of a Bouncing Drop. Nature 2013, 503, 385–388. [Google Scholar] [CrossRef] [Scilit] [PubMed]
- Lyu, J.; Gao, L.; Zhang, Y.; Bai, M.; Li, Y.; Gao, D.; Hu, C. Dynamic Spreading Characteristics of Droplet on the Hydrophobic Surface with Microstructures. Colloids Surf. A Physicochem. Eng. Asp. 2021, 610, 125693. [Google Scholar] [CrossRef] [Scilit]
- Zhang, L.Z.; Chen, X.; Yang, Y.R.; Wang, X.D. Impact Dynamics of a Droplet on Superhydrophobic Cylinders Structured with a Macro Ridge. Langmuir 2023, 39, 6375–6386. [Google Scholar] [CrossRef] [Scilit] [PubMed]
- Aksoy, Y.T.; Eneren, P.; Koos, E.; Vetrano, M.R. Spreading-Splashing Transition of Nanofluid Droplets on a Smooth Flat Surface. J. Colloid Interface Sci. 2022, 606, 434–443. [Google Scholar] [CrossRef] [Scilit] [PubMed]
- Tembely, M.; Vadillo, D.C.; Dolatabadi, A.; Soucemarianadin, A. A Machine Learning Approach for Predicting the Maximum Spreading Factor of Droplets upon Impact on Surfaces with Various Wettabilities. Processes 2022, 10, 1141. [Google Scholar] [CrossRef] [Scilit]
- Choudhury, R.; Nasir, D.M.T.; Kaiser, D.R.; Ghimire, R.; Aliyu, D.A.; Sohani, D.B.; Atanbori, D.J.; Rathaur, D.R.; Mishra, D.R. Uncovering the Effect of Physical Conditions and Surface Roughness on the Maximum Spreading Factor of Impinging Droplets Using a Supervised Artificial Neural Network Model. Ind. Eng. Chem. Res. 2023, 62, 21208–21221. [Google Scholar] [CrossRef] [Scilit]
- Yancheshme, A.A.; Enayati, S.; Kashcooli, Y.; Jafari, R.; Ezzaidi, H.; Momen, G. Dynamic Behavior of Impinging Drops on Water Repellent Surfaces: Machine Learning-Assisted Approach to Predict Maximum Spreading. Exp. Therm. Fluid Sci. 2022, 139, 110743. [Google Scholar] [CrossRef] [Scilit]
- Mahendru, P.; Tembely, M.; Dolatabadi, A. Artificial Intelligence Models for Analyzing Thermally Sprayed Functional Coatings. J. Therm. Spray Technol. 2023, 32, 388–400. [Google Scholar] [CrossRef] [Scilit]
- Yang, S.; Hou, Y.; Shang, Y.; Zhong, X. BPNN and CNN-Based AI Modeling of Spreading and Icing Pattern of a Water Droplet Impact on a Supercooled Surface. AIP Adv. 2022, 12, 045209. [Google Scholar] [CrossRef] [Scilit]
- Jereb, S.; Berce, J.; Lovšin, R.; Zupančič, M.; Može, M.; Golobič, I. Investigation of Droplet Spreading and Rebound Dynamics on Superhydrophobic Surfaces Using Machine Learning. Biomimetics 2025, 10, 357. [Google Scholar] [CrossRef] [Scilit] [PubMed]
- Može, M.; Jereb, S.; Lovšin, R.; Berce, J.; Zupančič, M.; Golobič, I. Dataset on Droplet Spreading and Rebound Behavior of Water and Viscous Water-Glycerol Mixtures on Superhydrophobic Surfaces with Laser-Made Channels. Data Brief 2025, 61, 111697. [Google Scholar] [CrossRef] [Scilit] [PubMed]
- Panjan, N.; Berce, J.; Jereb, S.; Zupančič, M.; Golobič, I.; Može, M. Dataset on Machine Learning Analysis of Droplet Spreading and Splashing for Various Liquids and Different Surface Wettability. Mendeley Data, 3 August 2026. [CrossRef]
- Goldstein, A.; Kapelner, A.; Bleich, J.; Pitkin, E. Peeking Inside the Black Box: Visualizing Statistical Learning with Plots of Individual Conditional Expectation. J. Comput. Graph. Stat. 2015, 24, 44–65. [Google Scholar] [CrossRef] [Scilit]
- Shang, Y.; Ding, M.; Rodríguez, G.H.; Coclite, A.M.; Castagne, S.; Seveno, D.; Roisman, I.V.; Hussong, J.; Vetrano, M.R. Impact Dynamics and Maximum Spreading of Water Droplets on Cold Surfaces with Different Wettabilities. Phys. Fluids 2025, 37, 092110. [Google Scholar] [CrossRef] [Scilit]
- Scheller, B.L.; Bousfield, D.W. Newtonian Drop Impact with a Solid Surface. AIChE J. 1995, 41, 1357–1367. [Google Scholar] [CrossRef] [Scilit]
- Chandra, S.; Avedisian, C.T. On the Collision of a Droplet with a Solid Surface. Proc. R. Soc. Lond. Ser. A Math. Phys. Sci. 1991, 432, 13–41. [Google Scholar] [CrossRef] [Scilit]
- Aksoy, Y.T.; Eneren, P.; Koos, E.; Vetrano, M.R. Spreading of a Droplet Impacting on a Smooth Flat Surface: How Liquid Viscosity Influences the Maximum Spreading Time and Spreading Ratio. Phys. Fluids 2022, 34, 092110. [Google Scholar] [CrossRef] [Scilit]
- Mao, T.; Kuhn, D.C.S.; Tran, H. Spread and Rebound of Liquid Droplets upon Impact on Flat Surfaces. AIChE J. 1997, 43, 2169–2179. [Google Scholar] [CrossRef] [Scilit]
- Moghtadernejad, S.; Lee, C.; Jadidi, M. An Introduction of Droplet Impact Dynamics to Engineering Students. Fluids 2020, 5, 107. [Google Scholar] [CrossRef] [Scilit]
- Jones, H. Cooling, freezing and substrate impact of droplets formed by rotary atomization. J. Phys. D Appl. Phys. 1971, 4, 1657–1660. [Google Scholar] [CrossRef] [Scilit]
- Asai, A.; Shioya, M.; Hirasawa, S.; Okazaki, T. Impact of an Ink Drop on Paper. J. Imaging Sci. Technol. 1993, 37, 205–207. [Google Scholar]

Disclaimer/Publisher’s Note: The statements, opinions and data contained in all publications are solely those of the individual author(s) and contributor(s) and not of MDPI and/or the editor(s). MDPI and/or the editor(s) disclaim responsibility for any injury to people or property resulting from any ideas, methods, instructions or products referred to in the content. |
© 2026 by the authors. Licensee MDPI, Basel, Switzerland. This article is an open access article distributed under the terms and conditions of the Creative Commons Attribution (CC BY) license.