


Abstract
Graphene oxide (GO) offers a high-surface-area platform for the noncovalent association of hydrophobic bioactive compounds, but its biological response depends strongly on surface chemistry. Here, GO was carboxylated with sodium chloroacetate and physically associated with curcumin (CUR) to obtain a graphene oxide–curcumin nanoadduct (GO-COOH-CUR). Ultraviolet-visible spectroscopy (UV-vis), X-ray photoelectron spectroscopy (XPS), Raman spectroscopy, Fourier-transform infrared spectroscopy (FTIR), X-ray diffraction (XRD), scanning electron microscopy (SEM), and atomic force microscopy (AFM) were used to assess chemical and morphological changes. XPS showed a lower C/O ratio and a higher fitted O-C=O contribution after carboxylation, although residual Na and Cl were detected. UV-vis, FTIR and XPS features were consistent with the presence of curcumin in the formulation with 83.35% of encapsulation efficiency (EE). In 24 h MTT assays, CO-COOH-CUR maintained BHK-21 metabolic activity above 70% across 3.125 µg mL−1 and reduced MCF-7 metabolic activity at the higher tested concentrations. Because formulation concentrations were expressed as a total mass and curcumin concentration is not reported here, direct potency or selectivity comparisons with free curcumin were not made. Qualitative histological evaluation performed 30 days after subdermal implantation in three male Wistar rats showed preserved adjacent tissue architecture, with no evident necrosis, prominent inflammatory infiltrate, organized fibrous capsule, or foreign-body giant cell response in the sections evaluated. These findings support further evaluation of GO-COOH-CUR within the limits of MTT-based and qualitative assessment.
1. Introduction
Cancer is a multifactorial and hyperproliferative disease characterized by uncontrolled cell growth, tissue invasion, angiogenesis, and metastasis to vital organs, representing one of the leading causes of mortality worldwide [1]. Although significant advances have been achieved in cancer treatment, conventional therapeutic approaches, including chemotherapy, radiotherapy, and targeted therapies, remain limited by poor selectivity toward malignant cells, systemic toxicity, multidrug resistance (MDR), and insufficient therapeutic efficacy in advanced-stage tumors [1,2,3,4]. These limitations have stimulated the search for alternative therapeutic agents and innovative delivery platforms to improve drug bioavailability, tumor targeting, and therapeutic outcomes.
Among naturally derived bioactive compounds, curcumin (CUR), chemically known as diferuloylmethane and obtained from the rhizomes of Curcuma longa L., has attracted considerable attention for its anti-inflammatory, antioxidant, antiproliferative, and anticancer properties [5,6,7]. Numerous preclinical studies have demonstrated its potential against several cancer types, including breast, colorectal, lung, prostate, and gastrointestinal cancers [8,9,10,11]. However, despite its promising pharmacological activity, the clinical translation of curcumin remains challenging due to its poor aqueous solubility, low stability under physiological conditions, rapid metabolism, and limited bioavailability following administration [12,13,14,15]. Consequently, developing efficient delivery systems that protect and transport curcumin to target tissues has become an important area of research.
Nanotechnology has emerged as a powerful tool for overcoming many of the limitations associated with conventional drug administration. Nanomaterials offer unique physicochemical properties, including a high surface-to-volume ratio, tunable surface chemistry, enhanced stability, and the ability to encapsulate or adsorb therapeutic molecules [16,17]. As a result, researchers have extensively investigated nanotechnology-based systems for cancer diagnosis, imaging, and therapy, particularly as drug-delivery platforms that can improve the pharmacokinetic profile and therapeutic efficacy of anticancer agents [16,18,19,20].
Among the nanocarriers explored for biomedical applications, graphene oxide (GO) has attracted significant interest because of its two-dimensional structure, large specific surface area, and abundance of oxygen-containing functional groups, including hydroxyl, epoxy, and carboxyl groups distributed across its basal planes and edges [21,22,23,24]. These structural features confer excellent dispersibility in aqueous media and provide multiple sites for the adsorption or conjugation of therapeutic molecules via hydrogen bonding, electrostatic interactions, and π–π stacking. Furthermore, GO can transport both hydrophilic and hydrophobic compounds, making it an attractive platform for drug-delivery applications [18,21,25]. Surface functionalization is an effective strategy to further improve the biological performance of graphene oxide. In particular, adding carboxyl groups enhances colloidal stability, increases hydrophilicity, improves cytocompatibility, and reduces the intrinsic toxicity often associated with unmodified graphene-based materials [22,25,26,27,28,29]. Moreover, carboxylated graphene oxide provides additional active sites for drug loading and facilitates stronger interactions with bioactive compounds such as curcumin.
Although several graphene oxide–curcumin systems have been reported in recent years, important questions remain regarding the specific role of carboxyl functionalization in modulating the biological performance of graphene-based nanocarriers [30,31,32,33,34]. Previous studies have primarily focused on drug loading, release behavior, or in vitro anticancer activity. In contrast, comparatively fewer investigations have systematically examined how carboxylation influences cytocompatibility toward healthy cells while maintaining antitumor activity. Furthermore, integrated studies that combine detailed physicochemical characterization with in vitro biological evaluation and preliminary in vivo tissue compatibility assessment remain limited. A better understanding of the relationship between surface functionalization, cellular response, and tissue interaction is essential to rationally design safer, more effective graphene-based platforms for biomedical applications.
Therefore, this study aimed to investigate how carboxyl functionalization affects the structural characteristics, biological compatibility, and anticancer performance of a graphene oxide–curcumin nanoadduct. To this end, graphene oxide was chemically modified with sodium chloroacetate to obtain carboxylated graphene oxide (GO-COOH), followed by the incorporation of curcumin via noncovalent interactions to yield a GO-COOH-CUR nanoadduct. UV-vis, XPS, Raman spectroscopy, FTIR, XRD, SEM, and AFM were used to characterize the resulting material comprehensively. Its biological performance was subsequently evaluated using in vitro cytotoxicity assays with non-tumoral BHK-21 and breast adenocarcinoma MCF-7 cell lines, as well as preliminary in vivo biocompatibility studies following subdermal implantation. Particular emphasis was placed on determining whether carboxyl functionalization could improve the biocompatibility of graphene oxide while preserving the dose-dependent cytotoxic activity associated with curcumin. Although reports describe the synthesis of GO and CUR [34,35,36], few studies have evaluated GO, GO-COOH, and GO-COOH-CUR through integrated physicochemical characterization, dual-cell-line cytotoxicity assessment, and preliminary in vivo tissue compatibility analysis within a single experimental framework. For the preliminary evaluation of in vivo biocompatibility, we selected the subdermal implantation model in Wistar rats because it is widely validated and recommended by ISO 10993-6 [37] for studying local tissue responses to implantable biomaterials and generating relevant preclinical evidence for potential biomedical applications.
2. Materials and Methods
2.1. Reagents
Graphene oxide (GO) and sodium chloroacetate were purchased from Sigma-Aldrich (St. Louis, MO, USA). Curcumin (CUR) was obtained from Sigma-Aldrich (Merck KGaA, Darmstadt, Germany). Sodium hydroxide pellets (NaOH, 98%) were supplied by LOBA Chemie (Mumbai, India), while hydrochloric acid (HCl, 37%) was obtained from Merck KGaA (Darmstadt, Germany). Ethanol (96%) was purchased from Merck KGaA.
Cell viability was evaluated using a commercial MTT assay kit based on 3-(4,5-dimethylthiazol-2-yl)-2,5-diphenyltetrazolium bromide (Sigma-Aldrich, St. Louis, MO, USA). Baby hamster kidney cells (BHK-21, clone 13) and human breast adenocarcinoma cells (MCF-7) from the Universidad Libre Seccional Barranquilla cell bank were used for in vitro biological evaluation. Cell culture reagents included RPMI-1640 medium, fetal bovine serum (FBS), phosphate-buffered saline (PBS), and dimethyl sulfoxide (DMSO). All reagents were used as received without further purification.
2.2. GO-COOH Synthesis and GO-COOH-CUR
Graphene oxide (200 mg) was dispersed in 100 mL of distilled water using ultrasonic homogenization for 1 h. Subsequently, 3.6 g of NaOH was added, and the suspension was stirred at 300 rpm for 30 min. Sodium chloroacetate (3.5 g) was then added, and the reaction mixture was stirred for 3 h to promote carboxylation of the graphene oxide surface.
After the reaction was completed, the pH was adjusted to 4–5 using hydrochloric acid. The resulting product was recovered by centrifugation at 4000 rpm for 30 min and purified by dialysis using a 12–14 kDa molecular weight cut-off membrane for 48 h. Finally, the purified GO-COOH was dried at 60 °C until constant weight (Figure 1) [28,38].
Figure 1.
Schematic of the reaction of graphene oxide with sodium chloroacetate in a basic medium. Created in BioRender. Grande Tovar, C.D. (2026) https://BioRender.com/u9di2g9.
A dispersion of GO-COOH (0.5 mg mL−1, 200 mL) in distilled water was mixed with 200 mL of a curcumin solution (0.5 mg mL−1 in ethanol). The mixture was stirred overnight at room temperature to promote curcumin adsorption onto the GO-COOH surface via noncovalent interactions. The resulting nanoadduct was collected by centrifugation at 4000 rpm and dried at 60 °C for 8 h [36].
2.3. Characterization
2.3.1. Ultraviolet-Visible Spectroscopy (UV-Vis)
The analyses of the absorbances of the precursors and the final adduct were performed using a UV-Vis UV2600 spectrophotometer (Shimadzu, Kyoto, Japan) with a double-beam and a spectral range of 700–200 nm [33].
The loading of the CUR on the GO-COOH was calculated using Equation (1) (EE%).
where initial CUR is the initial concentration of curcumin and final CUR is the concentration of the supernatant.
2.3.2. X-Ray Photoelectron Spectroscopy (XPS)
The surface chemical composition of the synthesized materials was analyzed using a Specs NAP-XPS spectrometer equipped with a PHOIBOS 150 1D-DLD analyzer (SPECS GmbH, Berlin, Germany). Spectra were acquired using a monochromatic Al Kα X-ray source (1486.7 eV, 13 kV), employing a pass energy of 85 eV for survey scans and 20 eV for high-resolution spectra. The spectral resolution was 1.0 eV for survey spectra and 0.1 eV for high-resolution analyses. Five scans were collected for survey spectra and twenty scans for high-resolution spectra. Charge compensation was performed using a 3 eV electron flood gun operated at 20 mA. The atomic composition was calculated from the integrated peak areas, corrected for the corresponding atomic sensitivity factors, according to Equation (2) [39]:
where Cx is the atomic fraction of element x, Ix is the integrated XPS peak area, Sx is the atomic sensitivity factor, and ∑Ii/Si represents the sum of the sensitivity-corrected peak areas of all detected elements. The term nx/∑ni corresponds to the relative atomic abundance of element x.
2.3.3. Raman Spectroscopy
Raman spectra were recorded using a DXR SmartRaman spectrometer (Thermo Scientific, Waltham, MA, USA) equipped with a 532 nm excitation laser. Measurements were performed in the spectral range of 800–3500 cm−1 using a laser power of 10 mW, an exposure time of 10 s, and 20 accumulations, with the laser operating at 10% of its maximum power.
The Raman spectra were used to compare the structural characteristics of GO, GO-COOH, CUR, and GO-COOH-CUR. Spectral deconvolution was performed using OriginPro software (version 2024, OriginLab Corporation, Northampton, MA, USA). The first-order Raman region was fitted with Gaussian–Lorentzian functions to determine the positions, intensities, and areas of the Raman bands. The intensity ratio (ID/IG) and area ratio (AD′/AD) were subsequently calculated from the fitted spectra [28].
2.3.4. Fourier Transform Infrared Spectroscopy (FT-IR)
Fourier transform infrared (FTIR) spectra were acquired using an FTIR-8400S spectrophotometer equipped with a diamond attenuated total reflectance (ATR) accessory (Shimadzu, Kyoto, Japan). Spectra were recorded in the wavenumber range of 500–4000 cm−1 with a spectral resolution of 4 cm−1 and 16 accumulations per sample.
FTIR analysis was performed to evaluate the chemical structure of GO, GO-COOH, CUR, and GO-COOH-CUR. The spectra were subsequently used to identify the functional groups present in each material and to compare the chemical modifications resulting from the synthesis and functionalization processes [28].
2.3.5. X-Ray Diffraction (XRD)
X-ray diffraction (XRD) analyses were performed using an Empyrean 2012 diffractometer (Malvern PANalytical, Jarman Way, Royston, UK) equipped with a Pixel 3D detector and Cu Kα radiation (λ = 1.541 Å). Measurements were carried out at an operating voltage of 45 kV and a current of 40 mA using an Omega/2θ goniometer configuration. Diffraction patterns were collected with a step size of 0.5° and a counting time of 50 s per step.
The diffraction data were used to compare the crystalline structure of GO, GO-COOH, CUR, and GO-COOH-CUR. The interlayer spacing (d-spacing) was calculated according to Bragg’s law (Equation (3)) [40]:
where d is the interplanar distance, n is the order of the X-rays [1], λ is the wavelength of the X-ray used, and θ is the angle of diffraction.
2.3.6. Scanning Electron Microscopy (SEM)
The morphology of GO, GO-COOH, CUR, and GO-COOH-CUR was examined using a SU8000 field-emission scanning electron microscope (FE-SEM) (Hitachi, Krefeld, Germany). Before imaging, the samples were sputter-coated with a thin gold layer to improve surface conductivity and minimize charging effects during observation. Micrographs were acquired at an accelerating voltage of 1–5 kV, a working distance of 4–7 mm, and a magnification of 10,000× using a secondary electron detector (SE(UL)). The obtained images were used for morphological comparison of the synthesized materials [28].
The SU8000 Scanning ELECTRON MICROSCOPE (Hitachi, Krefeld, Germany) was used to take these images at an acceleration voltage of 1–5 kV, a working distance of 4–7 nm, and 10K times magnification, using an SE(UL) detector [28].
2.3.7. Atomic Force Microscopy (AFM)
Atomic force microscopy (AFM) analyses were performed using a Multimode 8 microscope equipped with a Nanoscope V controller (Bruker, Durham, UK), operating in PeakForce Tapping® mode. The measurements were conducted to obtain topographical information of the GO, GO-COOH, and GO-COOH-CUR surfaces.
The acquired AFM images were processed using Gwyddion Analysis software (version 2.66, http://gwyddion.net/, accessed on 23 July 2026) to obtain two-dimensional and three-dimensional topographical representations. Surface profiles were extracted from the images to determine morphological features and height variations among the synthesized materials. Surface roughness parameters were calculated from the AFM images using Gwyddion Analysis software (version 2.66, http://gwyddion.net/, accessed on 23 July 2026). Height profiles and roughness measurements were obtained from representative scan areas and used for comparative analysis among the different materials [39].
2.4. In Vitro Cell Viability Assay
The cytotoxicity of GO, GO-COOH, CUR, and GO-COOH-CUR was evaluated using the MTT assay in BHK-21 and MCF-7 cell lines. The MCF-7 (ATCC® HTB-22™) human breast adenocarcinoma cell line was kindly provided by the District Institute of Science, Biotechnology and Innovation in Health (IDCBIS), Bogotá, Colombia. This epithelial cell line expresses estrogen receptors and was used as an experimental model of hormone-responsive breast cancer. BHK-21 [C-13] (ATCC CCL-10) cell lines were provided by the Laboratorio de Investigaciones de Química y Biología, Universidad del Norte, Barranquilla, Colombia. Cells were maintained under standard culture conditions and used for the cytotoxicity and cell viability assays described below.
Cells were cultured in RPMI-1640 medium supplemented with fetal bovine serum (FBS) and maintained at 37 °C in a humidified 5% CO2 atmosphere. For the assay, cells were seeded in 96-well plates at a density of 1 × 10⁴ cells per well using 100 μL of culture medium and allowed to adhere under standard culture conditions.
After cell attachment, the culture medium was replaced with fresh medium containing the corresponding concentrations of GO, GO-COOH, CUR, or GO-COOH-CUR. Following the selected incubation period, cell viability was determined using the MTT assay according to the manufacturer’s instructions. The resulting formazan crystals were dissolved in dimethyl sulfoxide (DMSO), and absorbance was measured using a microplate reader, FLUOstar Omega (BMG-Labortechnik, Ortenberg, Germany), at 570 nm.
Cell viability was expressed as a percentage relative to the untreated control group according to Equation (4):
Treatment was carried out with serial dilutions of 100 μg/mL, 50 μg/mL, 25 μg/mL, 12.5 μg/mL, 6.25 μg/mL, and 3.125 μg/mL of each sample, and a positive control (cells without treatment) for each composite, allowing incubation for 24 h under the same conditions 17. The MTT assay was performed in accordance with ISO 10993-5 [41] and as described by Castro et al. [42,43].
Three replicates of each formulation were evaluated, and the results are presented as the mean ± standard deviation.
A Shapiro–Wilk normality test was performed for each treatment in each cell line. In addition, a Tukey test (parametric) was performed to compare statistically significant differences in the concentrations used with respect to the control, with a confidence level of p < 0.05.
2.5. In Vivo Biocompatibility
The in vivo biocompatibility study was designed in accordance with the principles of the 3Rs (Replacement, Reduction, and Refinement), the recommendations of ISO 10993-6 [37] for the biological evaluation of implantable materials, and the ARRIVE 2.0 guidelines for reporting animal research. Three male Wistar rats weighing 286–295 g were used, consistent with the minimum number recommended by ISO 10993-6 [37] for preliminary biocompatibility studies.
To minimize animal use while maximizing the information obtained from each biological model, multiple independent subcutaneous pockets were created in each rat, allowing implantation of all experimental formulations and the control within the same animal. Consequently, each biomaterial was evaluated in all three animals, providing three independent implantation sites per material. Given the preliminary and descriptive nature of this stage of evaluation, histological findings were assessed descriptively, and no inferential statistical analyses were performed.
The animals were supplied by the Intermediate Preclinical Research Laboratory and Murine Animal Facility (LABBIO) of Universidad del Valle. They were housed throughout the study in the institutional animal facility under the supervision of trained animal care personnel. Animals were maintained under standard welfare conditions established by the institution, with unrestricted access to food and water (ad libitum) and routine environmental enrichment appropriate for the species.
Neither formal randomization nor blinding procedures were implemented. During implantation and histological processing, samples were identified using a coding system; however, the specific composition of each biomaterial was not considered until the histological interpretation stage, when this information was required to correlate the observed tissue response with the characteristics of the different formulations.
Animals were monitored daily throughout the postoperative period to assess general health, surgical wound healing, and the absence of clinical signs of pain, infection, or other procedure-related complications. No intraoperative or postoperative complications, adverse events, or animal losses were recorded during the study.
To perform the procedure, the animals were anesthetized by intramuscular administration of ketamine (Ketamine 50®, Holliday Laboratory, Buenos Aires, Argentina) at a dose of 100 mg/kg in combination with 2% xylazine (20 mg/mL) (Laboratorios ERMA, Celta, Colombia). The administered doses were adjusted according to the individual body weight of each animal.
Once an adequate anesthetic plane was achieved, the dorsal region was shaved and disinfected with povidone-iodine foam (Laboratorios MK, Cali, Colombia). The suspensions were homogenized with a vortex mixer for 1 min, and subdermal injections were administered in the dorsal region, delivering 1 mL of each suspension (1 mg per implantation site). A control was included in each animal by administering 1 mL of 0.9% sodium chloride solution under the same experimental conditions.
After 30 days, the animals were euthanized by intraperitoneal administration of sodium pentobarbital (Euthanex® Invet, Cota, Cundinamarca, Colombia) at a dose of 150 mg/kg. The implantation sites were subsequently recovered and fixed in buffered formalin. After 48 h of fixation, the samples were processed for histological analysis using a TP1020 Autotechnicon Tissue Processor™ and a Leica RM2125 RTS microtome (Leica Microsystems, Mannheim, Germany), resulting in 5 μm paraffin-embedded tissue sections [42,43].
Histological staining was performed using hematoxylin and eosin (H&E), Masson’s trichrome (MT), and Gomori’s trichrome (GT). Histological evaluation was carried out using a Leica DM750 optical microscope equipped with a Leica DFC 295 digital camera (Leica Microsystems, Mannheim, Germany). The acquired images were processed using Leica Application Suite software version 4.12.0 [42,43,44]. The experimental protocol was approved and supervised by the Internal Committee for the Care and Use of Animals (CICUA) of Universidad del Valle, Cali, Colombia, under Resolution 004 of 2026. Sample size determination was based on the recommendations of ISO 10993-6 [37] and the ARRIVE guidelines were also considered. No complications were observed in the biomodels during the study, and no research-related deaths occurred.
3. Results and Discussion
3.1. Characterization
3.1.1. Ultraviolet-Visible Spectroscopy (UV-Vis)
Figure 2 shows a maximum absorbance point at 247 nm attributed to the transitions of the GO conjugate systems (C=C), as the amount of conjugated carbons is large enough, the band (oxygenated groups) is masked under the band [45]. On the other hand, the functionalization with carboxylic groups is reflected in the appearance of the band at 204 nm () in the GO-COOH the appearance of this band can be related to a part of the GO reduced during the process (Figure 2) [29].
Figure 2.
UV-vis spectrum of: GO, GO-COOH, GO-COOH-CUR and CUR.
Increased oxidation of GO with carboxylic groups decreases conjugation, which reduces the density of delocalized pi electrons and the band is at 211 nm [46]. On the other hand, the CUR spectrum (Figure 2) exhibits a strong absorption band at 430 nm corresponding to the low-energy excitation of CUR (260–204 nm) [33,35]. The aromatic rings of curcumin interact with the graphitic regions of GO-COOH, generating interactions, resulting in a hypochromic effect and a bathochromic displacement of the CUR band up to 454 nm observed in the GO-COOH-CUR spectrum (205–271 nm) (Figure 2) [33,35,36].
With Equation (1), it was determined that the curcumin content associated with GO-COOH is 83.35% of the initial curcumin, which indicates that there is approximately 45.46 g of curcumin in every 100 g of nanoadduct recovered (45.46 wt.%). This value confirms the effective incorporation of curcumin into the surface of carboxylated graphene oxide.
3.1.2. X-Ray Photoelectron Spectroscopy (XPS)
X-ray photoelectron spectroscopy (XPS) provides information on the elemental composition and chemical environment of surface atoms by measuring their characteristic binding energies and associated functional groups [47]. The elemental composition of the samples was determined using 2, and the corresponding C/O ratios were calculated from the XPS data (Table 1).
Table 1.
Surface atomic composition and O/C and C/O ratios determined by XPS (atomic %).
As shown in Table 1, the C/O ratio decreased from 3.24 for GO to 2.54 for GO-COOH, indicating an increase in the oxygen content after the carboxylation process. This result is consistent with the introduction of additional oxygen-containing functional groups onto the graphene oxide surface.
The XPS survey spectra (Figure 3A) revealed distinct differences in the elemental composition of GO, GO-COOH, and GO-COOH-CUR. GO contained carbon, oxygen, nitrogen, sulfur, and silicon. After carboxylation, sodium and chlorine signals appeared in GO-COOH, while carbon, oxygen, silicon, and trace amounts of nitrogen and sulfur remained detectable. The GO-COOH-CUR nanoadduct exhibited changes in the relative elemental composition, supporting the successful chemical modification of the material following curcumin incorporation [47].
Figure 3.
XPS survey and high-resolution C 1s spectra of GO, GO-COOH, and GO-COOH-CUR: (A) survey spectra; (B) GO; (C) GO-COOH; and (D) GO-COOH-CUR.
The Na and Cl signals detected in GO-COOH (Figure 3A) are likely attributable to residual species from the NaOH and NaCl used during carboxylation, indicating incomplete removal during purification. In the GO-COOH-CUR sample, the remaining Na signal may be related to the partial formation of sodium carboxylate species through interactions between trace amounts of NaOH and carboxylic acid groups on the GO-COOH surface.
The high-resolution spectra (Figure 3B–D) were calibrated using the C1s peak at 284.8 eV. Subsequently, peak deconvolution was performed using Gaussian functions to determine the contribution of the different carbon environments present in each sample (Figure 3B–D). Six components were identified in the C1s region, corresponding to sp2-hybridized carbon (C=C), sp3-hybridized carbon (C–C), hydroxyl groups (C–OH), epoxy/ether groups (C–O–C), carbonyl/quinone groups (C=O), and carboxyl groups (O–C=O) [23,39,48]. The deconvoluted C1s spectrum of GO (Figure 3B) shows the characteristic oxygen-containing functionalities commonly associated with graphene oxide. Following carboxylation, the GO-COOH spectrum (Figure 3C) exhibited a reduction in the contribution of C=O groups together with changes in the distribution of oxygen-containing functionalities.
As shown in Table 2, under the alkaline conditions used in the carboxylation reaction, epoxy groups (C–O–C) are susceptible to ring opening, yielding hydroxyl groups (C–OH). In addition, alkylation reactions involving surface hydroxyl groups contribute to the incorporation of carboxyl-containing moieties. The increase in the O–C=O contribution further supports the successful carboxylation of graphene oxide [39,48,49]. The high-resolution C1s spectrum of GO-COOH-CUR (Figure 3D) exhibited an increased contribution of the C=O component, which can be attributed to the keto groups present in the curcumin structure [29,36]. This result provides additional evidence for the successful incorporation of curcumin into the carboxylated graphene oxide matrix.
Table 2.
Fitted C 1s component positions and relative areas.
3.1.3. Raman Spectroscopy
Figure 4A shows the characteristic first-order Raman bands of graphitic materials. The D band, centered at approximately 1343 cm−1, is associated with structural defects and disorder arising from sp3-hybridized carbon domains, whereas the G band, located at 1595 cm−1, corresponds to the in-plane vibration of sp2-hybridized carbon atoms within the graphene lattice [50,51]. Differences in band intensity among the samples reflect the structural modifications induced by graphene oxide carboxylation and subsequent curcumin incorporation, which alter the electronic environment and degree of disorder within the carbon framework [52].
Figure 4.
Raman characterization of GO, GO-COOH, and GO-COOH-CUR: (A) first-order spectra; (B–D) Gaussian–Lorentzian fits for GO, GO-COOH, and GO-COOH-CUR, respectively.
Because the first-order Raman region consists of multiple overlapping vibrational contributions, peak deconvolution was performed using Gaussian–Lorentzian fitting to accurately determine the areas and intensities of the D and G bands (Figure 4B) [53]. The deconvoluted spectra revealed the presence of the D*, D″, and D′ bands in addition to the principal D and G bands. The D* and D″ bands have been associated with vibrational modes involving sp2 carbon domains and their structural perturbations. In contrast, the D′ band originates from defect-induced intravalley scattering processes associated with localized surface charges and lattice imperfections [54,55,56].
Compared with GO, the GO-COOH spectrum exhibited a decrease in intensity and broadening of the G band, together with an increase in the D-band contribution. These changes indicate increased structural disorder and disruption of the graphitic network following chemical functionalization [57]. Broadening of the G band has been associated with an increase in sp3 carbon atoms neighboring sp2 domains, reflecting a greater degree of structural heterogeneity [52,57]. Additionally, both the GO-COOH spectrum and that of the nanoadduct display a low-intensity band at approximately 1720 cm−1 (marked with an arrow), tentatively attributed to the C=O stretching vibration of carboxyl (–COOH) groups; its presence is consistent with the XPS data, which confirmed a significant increase in the –COOH contribution to the C 1s envelope upon carboxylation, from 5.2% in GO to 12.04% in GO-COOH. The convergence of these two independent techniques supports the tentative assignment of this Raman feature to the carbonyl stretching of carboxyl groups introduced during functionalization.
The intensity ratio between the D and G bands (ID/IG) is commonly used as an indicator of the relative degree of disorder in graphitic materials, providing information on the balance between defective sp3 carbon and ordered sp2 carbon domains [54]. As shown in Table 3, the ID/IG ratio increased from 0.93 for GO to 1.29 for GO-COOH, indicating that carboxylation introduced additional defects into the graphene oxide structure. This increase is generally attributed to a reduction in the average size of the sp2 domains and to structural perturbations generated during the exfoliation and functionalization processes, which decrease the overall ordering of the carbon lattice [58,59].
Table 3.
Fitted Raman-band parameters. Position is reported in cm−1; I, relative fitted intensity; A, fitted area. PB: position of bands; R2; X2: square shift.
As previously reported, the area ratio between the D′ and D bands (AD′/AD) provides information regarding the nature and density of defects in graphene-based materials, particularly those associated with vacancies and sp3-hybridized carbon atoms [54]. In the present study, GO-COOH exhibited a higher AD′/AD value (0.748) than GO (0.273), indicating an increase in defect density following the carboxylation process. The generation of these additional defects may increase the number of available active sites on the graphene oxide surface, potentially favoring curcumin adsorption [54]. Interestingly, the GO-COOH-CUR nanoadduct exhibited ID/IG and AD′/AD values of 0.831 and 0.185, respectively, which are closer to those observed for GO than for GO-COOH (Table 3). This behavior may be associated with π–π interactions between the aromatic rings of curcumin and the graphenic domains of GO-COOH. Such interactions could promote partial structural reorganization of the carbon framework, reducing the spectroscopic contribution of the defects generated during carboxylation. Consequently, the Raman results suggest that curcumin incorporation modifies the defect structure of GO-COOH and contributes to a partial restoration of the ordering within the graphene-based matrix.
3.1.4. Fourier Transform Infrared Spectroscopy (FT-IR)
Figure 5 presents spectrum infrared of GO, GO-COOH, CUR, and GO-COOH-CUR. The spectrum of curcumin exhibits a broad band centered around 3300 cm−1, attributed to hydroxyl groups involved in intermolecular hydrogen bonding, together with a sharper band at 3508 cm−1 associated with free hydroxyl groups participating in intramolecular interactions [60,61,62]. A prominent absorption band at 1620 cm−1 corresponds to the conjugated carbonyl (C=O) and aromatic C=C stretching vibrations characteristic of the β-diketone structure of curcumin. Additional bands at 1593, 1419, 1270, 1153, and 1025 cm−1 were assigned to aromatic C=C stretching, phenolic Ph–O–H vibrations, =C–O–C stretching, phenolic C-CH stretching, and C–O vibrations, respectively [60,61,62]; the band at 1510 corresponds to vibrational modes of C=O and stretching in plane bending of CCC and CC=O [62].
Figure 5.
ATR-FTIR spectra of GO, GO-COOH, GO-COOH-CUR, and CUR.
The FTIR spectrum of GO displays the characteristic broad absorption extending from 2500 to 3500 cm−1, attributed to hydroxyl groups associated with carboxylic acid functionalities [35,36,63]. The intense band at 1730 cm−1 corresponds to carbonyl (C=O) stretching, while the band at 1620 cm−1 is assigned to C=C vibrations within the graphitic structure. Additional absorptions at 1410, 1193, and 1047 cm−1 are associated with O–H deformation, epoxy (C–O–C), and C–O stretching vibrations, respectively [63].
Following carboxylation, the GO-COOH spectrum retained the broad O–H absorption band between 2500 and 3500 cm−1. The carbonyl band appeared at 1718 cm−1, while the signal at 1590 cm−1 was associated with the graphitic C=C framework. However, it has also been attributed to carboxylate (COO−) vibrations in highly conjugated systems [64,65,66]. Bands located at 1410, 1230, and 1075 cm−1 were assigned to C–OH, C–O–C, and C–O vibrations, respectively. The displacement and sharpening of these bands may be related to structural changes generated during the reduction, functionalization, and partial exfoliation of the graphene oxide sheets [38,66]. In addition, the band at 1320 cm−1 was attributed to C–O stretching adjacent to carbonyl groups [38,66]. The GO-COOH-CUR nanoadduct exhibited the characteristic bands of GO-COOH, although slight band broadening and shifts in peak position were observed. More importantly, the appearance of new absorption bands at 1510, 1153, and 1025 cm−1, which are characteristic of curcumin, provides additional evidence for the successful incorporation of CUR into the carboxylated graphene oxide matrix [60,62]. The preservation of the main spectral features of both GO-COOH and curcumin suggests that the interaction between the two components does not substantially disrupt their fundamental chemical structures.
3.1.5. X-Ray Diffraction (XRD)
Figure 6 presents the X-ray diffraction patterns of GO, GO-COOH, and GO-COOH-CUR. The diffraction pattern of GO exhibits a prominent peak at 2θ = 14.08° indexed to the (001) crystallographic plane, d001 = 0.629 nm (Table 4), as calculated using Bragg’s law with λ = 0.1541 nm. This value lies within the range commonly reported for graphene oxide (approximately 0.6–1.2 nm) [67,68]. Following carboxylation, the GO-related reflection shifts to a higher diffraction angle (2θ = 14.80°), corresponding to d001 = 0.598 nm. This shift indicates a slight contraction in interlayer spacing and may be associated with a decrease in intercalated water, a rearrangement of oxygen-containing functional groups, and/or partial restacking of the graphene oxide sheets. In addition, a broad reflection appears at 2θ = 26.55°, corresponding to an interplanar spacing of d = 0.336 nm, which is close to the characteristic spacing of graphitic (002) layers. The emergence of this reflection is therefore consistent with the partial recovery or restacking of more ordered sp2-carbon domains within the material [23,38]. The alkaline conditions employed during synthesis may promote structural rearrangement and partial removal of labile oxygen-containing species, thereby decreasing the amount of intercalated water and favoring closer stacking of the carbon layers. Nevertheless, the reflection at 26.55° should be interpreted as consistent with partial graphitic ordering rather than as definitive proof of chemical reduction based solely on the XRD results [50].
Figure 6.
XRD patterns of GO, GO-COOH, and GO-COOH-CUR.
Table 4.
Verified XRD peak positions (2θ) and corresponding interplanar distances (d) calculated using the reported Cu Kα wavelength.
In the GO-COOH-CUR nanoadduct, the characteristic diffraction peak of GO-COOH at 2θ = 26.55° appears to be overlapped by a broader reflection centered at 2θ = 29.19°. This behavior may be associated with the incorporation of curcumin, which possesses a crystalline structure characterized by diffraction peaks in the 15–30° region [23,36,69]. The modification of the diffraction profile upon curcumin incorporation, together with spectroscopic evidence from XPS, Raman, and FTIR analyses, might indicate the formation of the GO-COOH-CUR nanoadduct.
3.1.6. Scanning Electron Microscopy (SEM)
The SEM micrographs of GO, GO-COOH, and GO-COOH-CUR are shown in Figure 6. The GO sample (Figure 7A) exhibits vertically oriented lamellae with low agglomeration, a relatively smooth surface morphology, and a limited number of folds and wrinkles.
Figure 7.
SEM micrographs of (A) GO, (B) GO-COOH, and (C) GO-COOH-CUR.
In the GO-COOH sample (Figure 7B), a greater degree of sheet stacking is observed, together with an increased number of folds and wrinkles. These morphological changes may be associated with a higher concentration of oxygen-containing groups at the sheet edges and a reduction of oxygenated functionalities within the basal plane. This observation is consistent with the appearance of the diffraction peak at approximately 25° in the GO-COOH diffractogram. Figure 7C shows possible curcumin aggregates deposited on the surface of the carboxylated graphene oxide (arrow). The apparent loss of the crystalline morphology characteristic of pure curcumin suggests the formation of the nanoadduct, likely as a result of π–π stacking interactions between curcumin and GO-COOH [36,61,70]. A comparison of Figure 7C and Figure 7B reveals a noticeable difference in the degree of GO-COOH sheet stacking. Although GO-COOH appears highly stacked in the dry state, it exhibits a high dispersion capacity in aqueous media, which increases the available surface area and favors the adsorption of curcumin molecules [61].
3.1.7. Atomic Force Microscopy (AFM)
Atomic force microscopy (AFM) images, three-dimensional reconstructions, and roughness profiles of GO, GO-COOH, and GO-COOH-CUR are presented in. The AFM analysis indicates that the samples are predominantly organized into multilayer structures rather than isolated monolayers, with surface roughness values exceeding 1 nm [71,72].
The GO sample Figure 8A–C exhibits lamellar structures with thicknesses of approximately 55.66 and 9.32 nm. The three-dimensional reconstruction (Figure 8B) reveals a localized aggregate approximately 58 nm thick, indicating regions of higher sheet stacking. The roughness profile (Figure 8C) confirms the sample’s heterogeneous topography [71].
Figure 8.
Atomic force microscopy (AFM) characterization of GO, GO-COOH, and GO-COOH-CUR. (A,D,G) AFM topographic images acquired over a 2 × 2 μm scan area for GO, GO-COOH, and GO-COOH-CUR, respectively. (B,E,H) Corresponding three-dimensional surface reconstructions. (C,F,I) Height profiles obtained from the AFM images for GO, GO-COOH, and GO-COOH-CUR, respectively. Arrows indicate the measurement positions used to obtain the height profiles.
Following carboxylation, the GO-COOH sample (Figure 8D–F) displays thicknesses of 15.97, 12.98, 10.84, and 9.77 nm, corresponding to approximately 7–12 stacked graphene layers [73]. The three-dimensional reconstruction (Figure 8E) shows a more homogeneous thickness distribution across the analyzed area compared with GO. In contrast, the roughness profile (Figure 8F) further supports the multilayer organization of the material.
The GO-COOH-CUR nanoadduct (Figure 8G–I) presents a maximum thickness of approximately 27 nm. Height measurements obtained from the roughness profile (Figure 8I) reveal structures with thicknesses of approximately 19.39, 12.26, and 5.38 nm. The three-dimensional reconstruction (Figure 8H) shows a relatively homogeneous surface morphology. However, the number of graphene layers cannot be reliably estimated because the incorporated curcumin contributes to the overall thickness of the observed structures [36].
Overall, the AFM results demonstrate that all samples consist of multilayer assemblies and reveal morphological and topographical changes associated with the carboxylation of graphene oxide and the subsequent incorporation of curcumin.
3.2. In Vitro Cell Viability Assay
Figure 9A shows the cytotoxic profile of the compounds evaluated against the BHK-21 cell line (BHK-21, Baby Hamster Kidney-21), a fibroblast-like cell line from the kidney tissue of Syrian hamsters (Mesocricetus auratus). GO and GO-COOH exhibited cytotoxicity at concentrations above 25 μg/mL, whereas the adduct maintained viability percentages above 70% across all evaluated concentrations, indicating better biocompatibility than either component. Graphene oxide typically induces cytotoxicity through two mechanisms. The first is biochemical in nature: GO generates reactive oxygen species (ROS), which triggers reduced glutathione (GSH) depletion and activation of apoptotic cascades, including CASP-3 overexpression and Bcl-2 reduction [21,74,75]. The second is physical: the sharp edges of GO can penetrate the lipid bilayer of the cell membrane. These 2D materials can penetrate the membrane and form transmembrane water channels along their polar edges, leading to permeabilization of the lysosomal membrane, release of cathepsin B, and generation of ROS [21,74,76].
Figure 9.
Cytotoxicity analysis of: (A) different concentrations of CUR, GO, GO-COOH, and GO-COOH-CUR after 24 h versus BHK-21 cells, (B) different concentrations of CUR, GO, GO-COOH, and GO-COOH-CUR after 24 h versus MCF-7 cells. * p < 0.05 compared to control (0). Concentrations are expressed as total particle mass.
The improvement in biocompatibility observed for GO-COOH-CUR in BHK-21 cells may be attributable to the synergistic contribution of curcumin. When adsorbed onto the GO-COOH surface through π-π stacking and hydrophobic interactions, curcumin may act as a biological “shield”, partially masking exposed GO surfaces (Figure 7C) and thereby attenuating mechanical damage. In addition, its antioxidant properties may contribute to scavenging free radicals generated by GO [8,36,77]. The combined effect of partial edge shielding and radical scavenging may explain the higher viability observed across all concentrations in BHK-21 cells.
Figure 9B shows that both curcumin and GO-COOH exhibit cytotoxicity against MCF-7 cells (breast cancer) at concentrations ≥25 μg/mL, while GO-COOH-CUR exhibits cytotoxicity at concentrations ≥50 μg/mL. These results indicate that GO-COOH-CUR retains cytotoxic activity against the MCF-7 cell line. The action of free curcumin, as a hydrophobic molecule, enters cells via passive diffusion, a process driven by a concentration gradient and requiring no receptors or endosomal processing [8,9,10,11]. In contrast, curcumin anchored to GO-COOH may require partial disruption of π-π* interactions and hydrogen bonds before it becomes available to exert its intracellular effects, processes influenced by pH [33]. Additionally, the literature reports a low rate of curcumin release from graphene-based nanocarriers during the first 24–48 h [35,36,78,79].
Although the Selectivity Index (SI) could not be formally determined because no IC50 values were obtained for either BHK-21 or MCF-7 cells within the tested concentration range, the ratio between the viability percentages of non-tumoral and tumoral cells at corresponding concentrations was consistently greater than 1. While these ratios do not constitute a true SI calculation, they suggest a degree of preferential cytotoxicity toward cancer cells. Similarly, it was observed that the compounds against the BHK-21 and MCF-7 cell lines exhibit dose-dependent behavior; an inverse correlation is observed between % viability and the concentration of the material, indicating that a concentration-dependent mechanism governs the cytotoxic activity of GO, GO-COOH, CUR, and GO-COOH-CUR. This pattern is consistent with the general pharmacological principle of dose–response relationships of graphene-based systems.
Together, these results demonstrate that GO-COOH-CUR has a dual functional profile: greater biocompatibility against normal cells (BHK-21), while retaining dose-dependent cytotoxic activity against MCF-7 cells. Additional studies are required to elucidate the specific molecular pathways underlying the nanoadduct’s mechanism of action, including precise quantification of intracellular ROS levels, mitochondrial membrane potential, and apoptotic marker expression (Bax/Bcl-2 ratio, caspase-3/7 activity) in both cell lines, as well as determination of curcumin release kinetics from GO-COOH under cell culture conditions.
3.3. In Vivo Biocompatibility
During sample retrieval, macroscopic examination revealed partial recovery of the dorsal hair in all biomodels. The subdermal tissues appeared macroscopically normal, with no visible signs of inflammation, infection, necrosis, or other adverse tissue reactions. The implantation sites were identified using external illumination.
In the control groups (0.9% sodium chloride and curcumin solution), the implantation site could not be identified either macroscopically or histologically during tissue retrieval. This finding is likely related to curcumin reabsorption, which hindered the precise localization of the site of application. Consequently, a histological evaluation comparable to that performed for the experimental groups could not be conducted.
3.3.1. Histological Studies with GO Samples
Figure 10A presents a low-magnification view (4×) of the tissue architecture, clearly showing the dermis (D), hypodermis (H), and underlying muscle tissue (M). The implantation zone (IZ), delimited by yellow lines, contains residual fragments of the implanted material surrounded by adipose tissue. The biomaterial is in close proximity to the muscle layer; however, the muscle fibers maintain their normal organization and morphology, with no evidence of degeneration, structural disruption, or tissue disorganization, suggesting favorable local tissue compatibility.
Figure 10.
Histological characterization of the GO implantation site 30 days after subdermal implantation. (A) H&E-stained section at 4× magnification. (B) H&E-stained section at 10× magnification. (C) MT-stained section at 100× magnification. D, dermis; H, hypodermis; M, muscle. Yellow lines delimit the implantation zone; yellow stars, adipocytes; blue stars, implanted material fragments; white arrows, GO deposits; yellow arrows, blood vessels; blue arrows, collagen fibers.
Figure 10B shows the implantation zone at higher magnification (10×). The implanted material exhibits an irregular and heterogeneous morphology, characterized by compact regions interspersed with multiple internal voids. The deposit consists of dark structures compatible with GO aggregates, embedded within an amorphous eosinophilic matrix, suggesting ongoing interactions between the material and the surrounding tissue. Adipocytes are observed at the periphery of the implant, while the adjacent muscle tissue retains its normal architecture without evident structural alterations.
At higher magnification (100×), Figure 10C reveals a greater accumulation of the implanted material, where dark structures compatible with GO are more clearly distinguished. These structures are irregularly distributed and intermixed with eosinophilic material throughout the implantation site. Using Masson’s trichrome staining (MT), blue-stained structures compatible with collagen fibers can be identified both surrounding and interspersed among the GO aggregates. These fibers exhibit a loose distribution, with no evidence of organized fibrous encapsulation. In addition, structures compatible with erythrocytes are observed in the peripheral regions, arranged in patterns suggestive of small blood vessels, although in some areas their boundaries are not clearly defined.
Overall, the histological findings at the GO implantation site indicate that the material is organized as an irregular deposit of GO aggregates in proximity to adipose tissue and the adjacent muscle layer, with no evidence of disruption of the normal architecture of these tissues. At higher magnification, the aggregates appear embedded within an amorphous eosinophilic matrix. They are associated with collagen fibers identified by Masson’s trichrome staining, which are loosely distributed both around and among the material deposits. These findings suggest the establishment of a tissue–material interface, with no evidence of extensive fibrotic organization.
In addition, structures compatible with erythrocytes and small blood vessels were identified both at the periphery and within the material deposit, indicating the presence of vascularized tissue surrounding the implant. No fibrous capsule formation, prominent inflammatory infiltrate, multinucleated giant cells, or evident foreign-body reaction were observed in the analyzed fields.
3.3.2. Histological Studies with GO-COOH Samples
Figure 11A shows the implantation zone (IZ), delimited by yellow lines, at low magnification (4×). An irregular, intensely dark band consistent with the implanted material is observed. Compared with Figure 9A, a lower proportion of material is identified within the implantation zone, whereas adipose tissue predominates in this region. This finding may reflect local tissue remodeling at the implantation site, where the material appears dispersed within an adipose-rich matrix. The adjacent muscle tissue retains its normal architecture without evident structural alterations, and no areas of necrosis or prominent inflammatory infiltrate are observed in this field.
Figure 11.
Histological characterization of the GO-COOH implantation site 30 days after subdermal implantation. (A) GT-stained section at 4× magnification. (B) GT-stained section at 10× magnification. (C) GT-stained section at 100× magnification. D, dermis; H, hypodermis; M, muscle; IZ, implantation zone. Yellow lines delimit the implantation zone; yellow stars, adipocytes; pink arrows, collagen fibers; white arrows, implanted material deposits; yellow arrows, blood vessels.
Using Gomori’s trichrome staining (GT), green-stained collagen fibers are identified in both the dermis and the implantation area. These fibers are distributed throughout the surrounding adipose tissue and at the interface with the implanted material, indicating the presence of connective tissue associated with the implantation site.
Figure 11B, obtained at 10× magnification and stained with Gomori’s trichrome, provides a more detailed view of the implantation zone, where adipocytes constitute the predominant tissue component. Within this region, an elongated central structure corresponding to the implanted material is identified as an intensely dark deposit with irregular peripheral extensions projecting into the surrounding adipose tissue.
In addition, small structures exhibiting morphology and staining characteristics similar to those of the central deposit are observed at the periphery (arrows). They are compatible with fragments of the implanted material that are associated with adipose tissue. Both the adipocytes and the material deposits are embedded in a matrix containing green-stained collagen fibers that are loosely distributed and lack a well-defined fibrillar organization.
At higher magnification (100×), Figure 11C reveals a larger accumulation of implanted material, where dark structures compatible with GO-COOH aggregates can be more clearly distinguished. These aggregates exhibit an irregular arrangement, are separated by multiple internal spaces and crevices, and are immersed within an amorphous matrix. Structures containing erythrocytes, compatible with small blood vessels, are observed at the periphery of the deposit. In contrast, collagen fibers and inflammatory infiltrates are not clearly evident in this field.
Overall, Figure 11 shows that the GO-COOH material is organized as an irregular deposit within the implantation area, maintaining a close association with the surrounding adipose tissue without disrupting the architecture of the adjacent muscle. At low and intermediate magnifications, adipose tissue constitutes the predominant component of the implantation zone. At the same time, the implanted material occupies a relatively smaller proportion of the analyzed area, suggesting local tissue remodeling at the implantation site. Gomori’s trichrome staining reveals loosely distributed collagen fibers located mainly at the periphery of the material deposit. At higher magnification, the material appears as heterogeneous aggregates immersed in an amorphous matrix, with no clear evidence of an inflammatory infiltrate. In addition, structures compatible with small blood vessels are observed at the periphery of the deposit, indicating vascularized tissue surrounding the implanted material.
3.3.3. Histological Studies with GO-COOH-CUR Samples
Figure 12A presents a low-magnification view (4×) of the implantation site, showing the overall tissue organization, including the dermis (D), hypodermis (H), and adjacent muscle tissue (M). Within the implantation zone (IZ), delimited by yellow lines, an irregular, intensely dark deposit consistent with the implanted material is present. The material is located in close proximity to the underlying muscle tissue, which preserves its normal architecture without evident structural alterations. No areas of necrosis or prominent inflammatory infiltrate are observed in this field.
Figure 12.
Histological characterization of the GO-COOH-CUR implantation site 30 days after subdermal implantation. (A) Gomori’s trichrome (GT)-stained section at 4× magnification. (B) GT-stained section at 10× magnification. (C) MT-stained section at 100× magnification. D, dermis; H, hypodermis; M, muscle; IZ, implantation zone. Yellow lines delimit the implantation zone; yellow stars, adipocytes; blue arrows, collagen fibers identified by GT staining; white arrows, implanted material deposits; yellow arrows, blood vessels.
Figure 12B shows the implantation zone at higher magnification (10×). The implanted material exhibits an elongated, irregular morphology with a compact, heterogeneous arrangement. The deposit is surrounded by connective tissue stained blue with Masson’s trichrome, in which densely distributed collagen fibers with variable orientation can be observed at the interface between the material and the surrounding tissue.
At the periphery of the implant, a gradual transition toward the adjacent muscle tissue is evident, while the normal tissue architecture remains preserved. No areas of necrosis or significant inflammatory infiltrate are identified.
At higher magnification (100×), Figure 12C provides a more detailed view of the implanted material, which appears as irregularly distributed dark aggregates within the implantation zone. These deposits are separated by multiple interstitial spaces and are embedded within the surrounding tissue, allowing a more detailed assessment of the biomaterial–tissue interface and the local tissue response.
Masson’s trichrome staining reveals abundant, blue-stained collagen fibers that occupy a substantial portion of the implantation area, predominantly located at the periphery of the material deposits and along the tissue–material interface. These fibers exhibit a loose arrangement, with no evidence of organized fibrous encapsulation. Structures compatible with foreign-body giant cell reactions or prominent inflammatory infiltrates are not evident in this field.
In addition, structures containing erythrocytes and compatible with small blood vessels are identified at the periphery of the deposit. The surrounding tissue retains its normal organization, with no evidence of necrosis. Notably, neither a prominent inflammatory response nor structures suggestive of a foreign-body reaction are observed.
Overall, Figure 12 shows that the GO-COOH-CUR material is organized as an irregular deposit within the implantation area, maintaining close contact with the surrounding tissue without disrupting the architecture of the adjacent muscle. At higher magnification, the implanted material appears as heterogeneous aggregates embedded within the tissue and associated with abundant collagen fibers, predominantly distributed at the periphery of the deposit and along the tissue–material interface. Structures compatible with small blood vessels are also identified in the surrounding tissue. Overall, the implantation site exhibits preserved tissue organization, with no evidence of necrosis, prominent inflammatory infiltrate, fibrous encapsulation, or foreign-body reaction.
These results show that graphene oxide (GO)-based systems, both non-functionalized and functionalized (GO-COOH and GO-COOH-CUR), exhibit biocompatible behavior in the subdermal model evaluated at 30 days. In general, none of the materials induced necrosis, significant inflammatory infiltrate, or evident foreign-body reaction, suggesting favorable tissue compatibility. This behavior is consistent with in vivo studies showing that GO can elicit a compatible tissue response after subcutaneous implantation without causing severe damage to the surrounding tissue [80].
When comparing GO and GO-COOH, a clear difference is observed in the persistence and distribution of the material within the implantation site. Non-functionalized GO appears as the most prominent aggregate. In contrast, GO-COOH exhibits a lower amount of observable material associated with a greater degree of tissue organization in the surrounding area. This behavior suggests that functionalization with carboxyl groups modifies the material’s interaction with the biological environment, possibly by increasing its hydrophilicity and dispersibility, thereby favoring its interaction with biomolecules and cells [80,81].
This trend becomes even more evident in the GO-COOH-CUR system. Comparison of the low-magnification images (4×) reveals a progressive reduction in the amount of observable material within the implantation area. GO samples exhibited the largest amount of residual material, followed by GO-COOH, whereas GO-COOH-CUR showed the lowest presence of visible remnants. These findings suggest that functionalization and curcumin incorporation may influence the material’s interaction with surrounding tissue, possibly through changes in hydrophilicity and dispersibility. This observation is consistent with reports indicating that GO-based materials can undergo progressive degradation after implantation in association with macrophage activity and tissue remodeling processes [80,82,83]. It has also been reported that GO can be internalized by immune cells and subjected to intracellular biodegradation, while surface modifications may alter its interactions with the biological environment [82,83,84]. However, these mechanisms were not directly evaluated in the present study and therefore should be considered only as possible explanations for the observed findings.
In addition, the GO-COOH-CUR system exhibited a more organized tissue response, characterized by the absence of evident inflammation and a greater apparent presence of collagen fibers at the material–tissue interface (Figure 12). These findings suggest improved interaction with the surrounding tissue, which may be related, at least in part, to curcumin’s anti-inflammatory and antioxidant properties. In this context, it has been reported that incorporating curcumin into GO-based systems can reduce material-associated cytotoxicity and improve cell viability, indicating favorable interactions with the biological environment, as well as enhancing cell proliferation and adhesion [84].
The increased collagen content observed in the GO-COOH-CUR system may also indicate a positive effect on tissue remodeling. Previous studies have shown that systems combining GO and curcumin can promote healing processes, reduce oxidative stress, and improve tissue regeneration [34].
An interesting finding is that curcumin administered in solution was completely reabsorbed after 30 days. This observation is consistent with its well-documented low stability and rapid elimination from the body [8]. Therefore, incorporation into the GO-COOH system may favor local retention and sustained release, which could explain the more evident tissue response observed in this group.
Furthermore, the presence of structures compatible with small blood vessels at the periphery of the implants suggests adequate integration of the material with the surrounding tissue. Although these structures may indicate local vascular support around the implant, specific techniques would be required to confirm any angiogenic or vascularization-related processes.
Despite these promising findings, the present study has some limitations. The number of animals evaluated was limited, restricting the generalizability of the results, and the histological analysis was primarily qualitative. Furthermore, the 30-day evaluation period does not allow assessment of the long-term behavior, degradation profile, or ultimate fate of the implanted materials [34]. The results obtained constitute preliminary preclinical evidence supporting the biomedical potential of the developed nanoducts. However, their relevance to human biology must be confirmed through studies in animal models specific to the intended application and, subsequently, through clinical trials.
The microphotographs presented in Figure 10, Figure 11 and Figure 12 are representative images of the histological findings observed in each experimental group. Although different staining techniques are shown in the figures, all samples were processed and evaluated using hematoxylin-eosin (H&E), Masson’s trichrome (MT), and Gomori’s trichrome (GT), following a uniform histological protocol. The selection of images was intended solely to illustrate the most representative morphological characteristics of each group and does not reflect differences in processing, histopathological evaluation, or analysis criteria. Consequently, between-group comparisons and study conclusions were based on comprehensive evaluation of all histological preparations obtained for each sample.
3.4. Study Limitations
This study has some limitations. The in vivo evaluation was performed with a small number of animals at a single experimental time point using qualitative histological analysis. Furthermore, the subdermal implantation model provides preliminary information on local biocompatibility but does not fully replicate the conditions of a specific clinical application. Therefore, these findings should be considered exploratory and confirmed by studies with larger sample sizes, multiple evaluation time points, and animal models specific to the intended application.
4. Conclusions
The present study demonstrated the successful functionalization of graphene oxide (GO) with sodium chloroacetate, yielding carboxylated graphene oxide (GO-COOH), followed by the incorporation of curcumin to obtain the GO-COOH-CUR nanoadduct. The combined results from UV-Vis, XPS, Raman, FTIR, XRD, SEM, and AFM analyses confirmed the introduction of carboxyl groups onto the graphene oxide surface. They supported the successful association of curcumin with the GO-COOH matrix. The physicochemical characterization further indicated that GO functionalization involved simultaneous incorporation of carboxyl groups and partial restoration of graphitic domains. At the same time, Raman analysis suggested that interactions between curcumin and GO-COOH may promote structural reorganization within the graphene-based material. An encapsulation efficiency of 83.35% for curcumin was also determined.
The biological evaluation revealed that GO-COOH-CUR exhibited improved biocompatibility toward BHK-21 cells compared with GO and GO-COOH, while maintaining dose-dependent cytotoxic activity against MCF-7 cells. Although a formal Selectivity Index could not be determined, the observed viability profiles suggest a preferential effect on tumoral cells relative to non-tumoral cells. These findings indicate that curcumin incorporation not only modulates the biological response of graphene oxide but also helps reduce the cytotoxic effects associated with the parent material.
The in vivo histological evaluation performed after 30 days demonstrated a favorable tissue response for all graphene-based systems. None of the evaluated materials induced necrosis, significant inflammatory infiltrate, fibrous encapsulation, or evident foreign-body reaction. In addition, GO-COOH-CUR exhibited a more organized tissue response, characterized by a greater apparent presence of collagen fibers at the tissue–material interface and preserved tissue architecture, suggesting improved interaction with the surrounding biological environment.
Taken together, these results identify GO-COOH-CUR as a promising graphene-based platform combining favorable tissue compatibility with cytotoxic activity against cancer cells. The synergistic effects of graphene oxide functionalization and curcumin incorporation highlight the potential of this system for future biomedical applications, particularly in tissue engineering and therapeutic delivery. Nevertheless, additional studies are required to investigate long-term biodegradation, curcumin release kinetics, cellular uptake mechanisms, and the molecular pathways responsible for the observed biological effects.
Author Contributions
Conceptualization, C.D.G.T. and D.D.J.M.D.A.; Methodology, D.D.J.M.D.A., T.C., C.-H.V.-L., D.L.-T., J.D.R.M., A.C., P.A.Z., R.C.A., K.Y.P.J., D.I. and C.D.G.T.; Validation, C.D.G.T.; Formal analysis, C.-H.V.-L., A.C. and C.D.G.T.; Investigation, D.D.J.M.D.A., C.-H.V.-L., D.L.-T., J.D.R.M., A.C., P.A.Z., R.C.A., K.Y.P.J., D.I. and C.D.G.T.; Resources, T.C., R.C.A., D.I. and C.D.G.T.; Funding acquisition, T.C., P.A.Z. and C.D.G.T.; Project administration, R.C.A. and C.D.G.T.; Supervision, C.D.G.T.; Writing—original draft, D.D.J.M.D.A., C.-H.V.-L., D.L.-T. and C.D.G.T.; Writing—review and editing, C.D.G.T. All authors have read and agreed to the published version of the manuscript.
Funding
Universidad del Atlántico has funded this research through Project CB669-CII2023 and Project CB752-CIS2023. CSIC (Project LINCG23014), MICIU/AEI/10.13039/501100011033, and FEDER, UE (Project PID2021-124926NB-I00) also funded this research.
Institutional Review Board Statement
The animal study protocol was approved by the Internal Committee for the Care and Use of Animals (CICUA) of Universidad del Valle, Cali, Colombia (Resolution No. 004 of 2026, approved on 30 March 2026).
Data Availability Statement
The original contributions presented in this study are included in the article. Further inquiries can be directed to the corresponding author.
Acknowledgments
P.A. Zapata gratefully acknowledges financial support from the FONDECYT Regular Project 1260069. P.A. Zapata is grateful to the Fondequip EQM220007 project titled “Plataforma Avanzada de Caracterización térmica en la Facultad de Química y Biología con la Implementación del equipo TGA-MS”. UV-vis graphics and EE, SEM images, and high-resolution XPS graphics were presented at the 5th International Online Conference on Nanomaterials (IOCN 2025) https://sciforum.net/paper/view/23985 (Accessed on 23 July 2026) [85]. The authors used OpenAI ChatGPT (GPT-5.5) exclusively for language editing, grammar correction, and readability improvement. No AI tool was used for data generation, data analysis, image generation, interpretation of experimental results, or preparation of scientific conclusions. The authors critically reviewed and edited all outputs and take full responsibility for the manuscript’s final content. The authors created the graphical abstract in BioRender. Grande Tovar, C.D. (2026) https://BioRender.com/9nysvwl.
Conflicts of Interest
The authors declare no conflicts of interest.
References
- Dong, Z.; Wang, Y.L.; Selimah, N. Taxanes: Promising Anti-Cancer Drugs. Asian Pacif. J. Cancer Prev. 2011, 12, 837–851. [Google Scholar]
- Li, J.; Yang, Z.; Li, Y.; Xia, J.; Li, D.; Li, H.; Ren, M.; Liao, Y.; Yu, S.; Chen, Y.; et al. Cell apoptosis, autophagy and necroptosis in osteosarcoma treatment. Oncotarget 2016, 7, 44763–44778. [Google Scholar] [CrossRef] [Scilit]
- Ashique, S.; Faiyazuddin, M.; Afzal, O.; Gowri, S.; Hussain, A.; Mishra, N.; Garg, A.; Maqsood, S.; Akhtar, M.S.; Altamimi, A.S.A. Advanced nanoparticles, the hallmark of targeted drug delivery for osteosarcoma—An updated review. J. Drug Deliv. Sci. Technol. 2023, 87, 104753. [Google Scholar] [CrossRef] [Scilit]
- Wang, S.Y.; Hu, H.Z.; Qing, X.C.; Zhang, Z.C.; Shao, Z.W. Recent advances of drug delivery nanocarriers in osteosarcoma treatment. J. Cancer 2020, 11, 69–82. [Google Scholar] [CrossRef] [Scilit]
- Gupta, S.C.; Kismali, G.; Aggarwal, B.B. Curcumin, a component of turmeric: From farm to pharmacy. BioFactors 2013, 39, 2–13. [Google Scholar] [CrossRef] [Scilit]
- Epstein, J.; Sanderson, I.R.; MacDonald, T.T. Curcumin as a therapeutic agent: The evidence from in vitro, animal and human studies. Br. J. Nutr. 2010, 103, 1545–1557. [Google Scholar] [CrossRef] [Scilit]
- Mesa, M.D.; Ramírez-Tortosa, M.C.; Aguilera, C.M.; Ramírez-Boscá, A.Y.; Gil, A. Pharmacological and nutritional effects of Curcuma longa L. extracts and curcuminoids. ARS Pharm. 2000, 41, 307–321. [Google Scholar]
- Afshari, A.R.; Sanati, M.; Kesharwani, P.; Sahebkar, A. Recent Advances in Curcumin-Based Combination Nanomedicines for Cancer Therapy. J. Funct. Biomater. 2023, 14, 408. [Google Scholar] [CrossRef] [Scilit]
- Li, X.; Chen, T.; Xu, L.; Zhang, Z.; Li, L.; Chen, H. Preparation of curcumin micelles and the in vitro and in vivo evaluation for cancer therapy. J. Biomed. Nanotechnol. 2014, 10, 1458–1468. [Google Scholar] [CrossRef] [Scilit] [PubMed]
- Bandyopadhyay, D. Farmer to pharmacist: Curcumin as an anti-invasive and antimetastatic agent for the treatment of cancer. Front. Chem. 2014, 2, 113. [Google Scholar] [CrossRef] [Scilit]
- Chen, T.; Xiao, Z.; Liu, X.; Wang, T.; Wang, Y.; Ye, F.; Su, J.; Yao, X.; Xiong, L.; Yang, D.-H. Natural products for combating multidrug resistance in cancer. Pharmacol. Res. 2024, 202, 107099. [Google Scholar] [CrossRef] [Scilit]
- Deshpande, S.S.; Veeragoni, D.; Kongari, L.; Mamilla, J.; Misra, S. Synthesis of biocompatible chitosan coated TiO2-curcumin nanocomposites shows potent anticancer activity towards melanoma cancer cells. J. Drug Deliv. Sci. Technol. 2023, 85, 104592–104604. [Google Scholar] [CrossRef] [Scilit]
- Yu, S.; Wang, S.; Xie, Z.; Yu, S.; Li, L.; Xiao, H.; Song, Y. Hyaluronic acid coating on the surface of curcumin-loaded ZIF-8 nanoparticles for improved breast cancer therapy: An in vitro and in vivo study. Colloids Surf. B Biointerfaces 2021, 203, 111759. [Google Scholar] [CrossRef] [Scilit] [PubMed]
- Wang, J.; Liu, Q.; Yang, L.; Xia, X.; Zhu, R.; Chen, S.; Wang, M.; Cheng, L.; Wu, X.; Wang, S. Curcumin-loaded TPGS/F127/P123 mixed polymeric micelles for cervical cancer therapy: Formulation, characterization, and in vitro and in vivo evaluation. J. Biomed. Nanotechnol. 2017, 13, 1631–1646. [Google Scholar] [CrossRef] [Scilit] [PubMed]
- Gou, M.; Men, K.; Shi, H.; Xiang, M.; Zhang, J.; Song, J.; Song, J.; Long, J.; Wan, Y.; Luo, F.; et al. Curcumin-loaded biodegradable polymeric micelles for colon cancer therapy in vitro and in vivo. Nanoscale 2011, 3, 1558–1567. [Google Scholar] [CrossRef] [Scilit] [PubMed]
- Zeng, L.; Gowda, B.H.J.; Ahmed, M.G.; Abourehab, M.A.S.; Chen, Z.S.; Zhang, C.; Li, J.; Kesharwani, P. Advancements in nanoparticle-based treatment approaches for skin cancer therapy. Mol. Cancer 2023, 22, 10. [Google Scholar] [CrossRef] [Scilit]
- Cui, L.; Yang, Y.; Hao, Y.; Zhao, H.; Zhang, Y.; Wu, T.; Song, X. Nanotechnology-Based Therapeutics for Airway Inflammatory Diseases. Clin. Rev. Allergy Immunol. 2025, 68, 12. [Google Scholar] [CrossRef] [Scilit]
- Aghebati-Maleki, A.; Dolati, S.; Ahmadi, M.; Baghbanzhadeh, A.; Asadi, M.; Fotouhi, A.; Yousefi, M.; Aghebati-Maleki, L. Nanoparticles and cancer therapy: Perspectives for application of nanoparticles in the treatment of cancers. J. Cell Physiol. 2020, 235, 1962–1972. [Google Scholar] [CrossRef] [Scilit]
- Bagheri, M.; Zandieh, M.A.; Daryab, M.; Samaei, S.S.; Gholami, S.; Rahmanian, P.; Dezfulian, S.; Eary, M.; Rezaee, A.; Rajabi, R.; et al. Nanostructures for site-specific delivery of oxaliplatin cancer therapy: Versatile nanoplatforms in synergistic cancer therapy. Transl. Oncol. 2024, 39, 101838. [Google Scholar] [CrossRef] [Scilit]
- Battigelli, A.; Ménard-Moyon, C.; Bianco, A. Carbon nanomaterials as new tools for immunotherapeutic applications. J. Mater. Chem. B 2014, 2, 6144–6156. [Google Scholar] [CrossRef] [Scilit]
- Seabra, A.B.; Paula, A.J.; De Lima, R.; Alves, O.L.; Durán, N. Nanotoxicity of graphene and graphene oxide. Chem. Res. Toxicol. 2014, 27, 159–168. [Google Scholar] [CrossRef] [Scilit] [PubMed]
- Rahimi, S.; Chen, Y.; Zareian, M.; Pandit, S.; Mijakovic, I. Cellular and subcellular interactions of graphene-based materials with cancerous and non-cancerous cells. Adv. Drug Deliv. Rev. 2022, 189, 114467. [Google Scholar] [CrossRef] [Scilit] [PubMed]
- Stobinski, L.; Lesiak, B.; Malolepszy, A.; Mazurkiewicz, M.; Mierzwa, B.; Zemek, J.; Jiricek, P.; Bieloshapka, I. Graphene oxide and reduced graphene oxide studied by the XRD, TEM and electron spectroscopy methods. J. Electron. Spectros. Relat. Phenom. 2014, 195, 145–154. [Google Scholar] [CrossRef] [Scilit]
- Xu, C.; Wang, J.; Xu, Y.; Shang, G.; Wang, R.; Lin, Y. Review of and Perspectives on the Toxicology of Graphene-based Materials. Curr. Drug Metab. 2013, 14, 863–871. [Google Scholar] [CrossRef] [Scilit]
- Tiwari, H.; Karki, N.; Pal, M.; Basak, S.; Verma, R.K.; Bal, R.; Kandpal, N.D.; Bisht, G.; Sahoo, N.G. Functionalized graphene oxide as a nanocarrier for dual drug delivery applications: The synergistic effect of quercetin and gefitinib against ovarian cancer cells. Colloids Surf. B Biointerfaces 2019, 178, 452–459. [Google Scholar] [CrossRef] [Scilit] [PubMed]
- Lalwani, G.; D’Agati, M.; Khan, A.M.; Sitharaman, B. Toxicology of graphene-based nanomaterials. Adv. Drug Deliv. Rev. 2016, 105, 109–144. [Google Scholar] [CrossRef] [Scilit] [PubMed]
- Zeng, W.N.; Yu, Q.P.; Wang, D.; Liu, J.L.; Yang, Q.J.; Zhou, Z.K.; Zeng, Y.P. Mitochondria-targeting graphene oxide nanocomposites for fluorescence imaging-guided synergistic phototherapy of drug-resistant osteosarcoma. J. Nanobiotechnol. 2021, 19, 79. [Google Scholar] [CrossRef] [Scilit] [PubMed]
- Chen, J.; Zhang, X.; Cai, H.; Chen, Z.; Wang, T.; Jia, L.; Wang, J.; Wan, Q.; Pei, X. Osteogenic activity and antibacterial effect of zinc oxide/carboxylated graphene oxide nanocomposites: Preparation and in vitro evaluation. Colloids Surf. B Biointerfaces 2016, 147, 397–407. [Google Scholar] [CrossRef] [Scilit] [PubMed]
- Gholami, A.; Emadi, F.; Nazem, M.; Aghayi, R.; Khalvati, B.; Amini, A.; Ghasemi, Y. Expression of key apoptotic genes in hepatocellular carcinoma cell line treated with etoposide-loaded graphene oxide. J. Drug Deliv. Sci. Technol. 2020, 57, 101725. [Google Scholar] [CrossRef] [Scilit]
- Kashani, A.V.; Bahrami, H.; Nadarlou, S.; Rostamizadeh, K.; Salehabadi, H. Density Functional Theory Calculations on the Adsorption of Curcumin Anticancer Drug on Graphene Oxide Nanosheet as a Drug Delivery System. Bionanoscience 2026, 16, 62. [Google Scholar] [CrossRef] [Scilit]
- Sajjadi, S.S.; Einafshar, E.; Javid, H.; Assaran Darban, R.; Jafari, N.; Hashemy, S.I. Chitosan-embedded β-cyclodextrin-magnetic graphene oxide nanoparticles for curcumin loading: Evaluating cytotoxicity and apoptosis induction in esophageal cancer. Naunyn. Schmiedebergs Arch. Pharmacol. 2025, 399, 4357–4369. [Google Scholar] [CrossRef] [Scilit]
- Yuan, S.; Gao, B.; Zhu, P.; Liu, Z.; Su, B. A sonochemically engineered graphene oxide nanocapsule platform with redox responsiveness for magnetically guided curcumin delivery. Diam. Relat. Mater. 2025, 160, 113011. [Google Scholar] [CrossRef] [Scilit]
- Yaghoubi, F.; Motlagh, N.S.H.; Naghib, S.M.; Haghiralsadat, F.; Jaliani, H.Z.; Moradi, A. A functionalized graphene oxide with improved cytocompatibility for stimuli-responsive co-delivery of curcumin and doxorubicin in cancer treatment. Sci. Rep. 2022, 12, 1959. [Google Scholar] [CrossRef] [Scilit] [PubMed]
- Assafi, A.; Zarouki, M.A.; Hejji, L.; Aoulad El Hadj Ali, Y.; Pérez-Villarejo, L.; Fiser, B.; Tamegart, L.; Souhail, B.; Azzouz, A. Curcumin-loaded graphene oxide nanocomposite with potent antibacterial and antioxidant activities for accelerated wound healing. Diam. Relat. Mater. 2025, 160, 113050. [Google Scholar] [CrossRef] [Scilit]
- Hatamie, S.; Akhavan, O.; Sadrnezhaad, S.K.; Ahadian, M.M.; Shirolkar, M.M.; Wang, H.Q. Curcumin-reduced graphene oxide sheets and their effects on human breast cancer cells. Mater. Sci. Eng. C 2015, 55, 482–489. [Google Scholar] [CrossRef] [Scilit] [PubMed]
- De, D.; Das, C.K.; Mandal, D.; Mandal, M.; Pawar, N.; Chandra, A.; Gupta, A.N. Curcumin Complexed with Graphene Derivative for Breast Cancer Therapy. ACS Appl. Bio. Mater. 2020, 3, 6284–6296. [Google Scholar] [CrossRef] [Scilit]
- ISO 10993-6:2016; Biological Evaluation of Medical Devices—Part 6: Tests for Local Effects After Implantation. International Organization for Standardization: Geneva, Switzerland, 2016.
- Patel, K.; Devi, R.; Dewangan, P.K.; Vinayak; Sutar, A.K.; Maharana, T. A Novel Method for the Removal of Uranium by Using Carboxyl Functionalized Graphene Oxide. IOP Conf. Ser. Mater. Sci. Eng. 2020, 798, 012029. [Google Scholar] [CrossRef] [Scilit]
- Lu, Y.J.; Wang, Y.H.; Sahu, R.S.; Chen, J.P.; Dash, B.S.; Chung, P.J.; Yang, H.W.; Chuang, E.Y.; Hwang, T.L. Mechanism of nanoformulated graphene oxide-mediated human neutrophil activation. ACS Appl. Mater. Interfaces 2020, 12, 40141–40152. [Google Scholar] [CrossRef] [Scilit] [PubMed]
- Faria, G.S.; Lima, A.M.; Brandão, L.P.; da Costa, A.P.; Nardecchia, S.; Ribeiro, A.A.; Pinheiro, W.A. Produção e caracterização de óxido de grafeno e óxido de grafeno reduzido com diferentes tempos de oxidação. Matéria 2018, 22, e-11918. [Google Scholar] [CrossRef] [Scilit]
- ISO 10993-5:2009; International Organization for Standardization. Biological Evaluation of Medical Devices—Part 5: Tests for In Vitro Cytotoxicity. ISO: Geneva, Switzerland, 2009.
- Castro, J.I.; Valencia-Llano, C.H.; Valencia Zapata, M.E.; Restrepo, Y.J.; Mina Hernandez, J.H.; Navia-Porras, D.P.; Valencia, Y.; Valencia, C.; Grande-Tovar, C.D. Chitosan/polyvinyl alcohol/tea tree essential oil composite films for biomedical applications. Polymers 2021, 13, 3753. [Google Scholar] [CrossRef] [Scilit]
- Grande-Tovar, C.D.; Castro, J.I.; Valencia Llano, C.H.; Tenorio, D.L.; Saavedra, M.; Zapata, P.A.; Chaur, M.N. Polycaprolactone (PCL)-Polylactic Acid (PLA)-Glycerol (Gly) Composites Incorporated with Zinc Oxide Nanoparticles (ZnO-NPs) and Tea Tree Essential Oil (TTEO) for Tissue Engineering Applications. Pharmaceutics 2023, 15, 43. [Google Scholar] [CrossRef] [Scilit]
- Castro, J.I.; Payan-Valero, A.; Valencia-Llano, C.H.; Insuasty, D.; Rodríguez Macias, J.D.; Ordoñez, A.; Valencia Zapata, M.E.; Mina Hernández, J.H.; Grande-Tovar, C.D. Evaluation of the Antibacterial, Anti-Cervical Cancer Capacity, and Biocompatibility of Different Graphene Oxides. Molecules 2024, 29, 281. [Google Scholar] [CrossRef] [Scilit] [PubMed]
- Guerrero-Contreras, J.; Caballero-Briones, F. Graphene oxide powders with different oxidation degree, prepared by synthesis variations of the Hummers method. Mater. Chem. Phys. 2015, 153, 209–220. [Google Scholar] [CrossRef] [Scilit]
- Pavia, D.L.; Lampman, G.M.; Kriz, G.S.; Vyvyan, J.R. Introduction to Spectroscopy; Brooks/Cole: Belmont, CA, USA, 2009. [Google Scholar]
- Moulder, J.F.; Stickle, W.F.; Sobol, P.E.; Bomben, K.D.; Chastain, J. Handbook of X-Ray Photoelectron Spectroscopy: A Reference Book of Standard Spectra for Identification and Interpretation of XPS Data; Physical Electronics Division, Perkin-Elmer Corporation: Eden Prairie, MN, USA, 1992. [Google Scholar]
- Zhou, H.; Zhai, H.J. Boosting the electrochemical capacitive properties of polypyrrole using carboxylated graphene oxide as a new dopant. J. Mater. Sci. Mater. Electron. 2018, 29, 7893–7903. [Google Scholar] [CrossRef] [Scilit]
- Pan, N.; Guan, D.; Yang, Y.; Huang, Z.; Wang, R.; Jin, Y.; Xia, C. A rapid low-temperature synthetic method leading to large-scale carboxyl graphene. Chem. Eng. J. 2014, 236, 471–479. [Google Scholar] [CrossRef] [Scilit]
- Claramunt, S.; Varea, A.; López-Díaz, D.; Velázquez, M.M.; Cornet, A.; Cirera, A. The importance of interbands on the interpretation of the raman spectrum of graphene oxide. J. Phys. Chem. C 2015, 119, 10123–10129. [Google Scholar] [CrossRef] [Scilit]
- The National Physical Laboratory (NPL). Available online: www.npl.co.uk (accessed on 23 July 2026).
- Wu, J.B.; Lin, M.L.; Cong, X.; Liu, H.N.; Tan, P.H. Raman spectroscopy of graphene-based materials and its applications in related devices. Chem. Soc. Rev. R Soc. Chem. 2018, 47, 1822–1873. [Google Scholar] [CrossRef] [Scilit] [PubMed]
- Sardinha, A.F.; Almeida, D.A.L.; Ferreira, N.G. Electrochemical impedance spectroscopy correlation among graphene oxide/carbon fibers (GO/CF) composites and GO structural parameters produced at different oxidation degrees. J. Mater. Res. Technol. 2020, 9, 10841–10853. [Google Scholar] [CrossRef] [Scilit]
- López-Díaz, D.; López Holgado, M.; García-Fierro, J.L.; Velázquez, M.M. Evolution of the Raman Spectrum with the Chemical Composition of Graphene Oxide. J. Phys. Chem. C 2017, 121, 20489–20497. [Google Scholar] [CrossRef] [Scilit]
- Sousa, D.V.; de Guimarães, L.M.; Félix, J.F.; Ker, J.C.; Schaefer, C.E.R.G.; Rodet, M.J. Dynamic of the structural alteration of biochar in ancient Anthrosol over a long timescale by Raman spectroscopy. PLoS ONE 2020, 15, e0229447. [Google Scholar] [CrossRef] [Scilit]
- Malard, L.M.; Pimenta, M.A.; Dresselhaus, G.; Dresselhaus, M.S. Raman spectroscopy in graphene. Phys. Rep. 2009, 473, 51–87. [Google Scholar] [CrossRef] [Scilit]
- Muzyka, R.; Drewniak, S.; Pustelny, T.; Chrubasik, M.; Gryglewicz, G. Characterization of graphite oxide and reduced graphene oxide obtained from different graphite precursors and oxidized by different methods using Raman spectroscopy. Materials 2018, 11, 1050. [Google Scholar] [CrossRef] [Scilit]
- Bagheri, S. Caracterización de Nanocomposites de Óxido de Grafeno y Polimetilmetacrilato Mediante Espectroscopía Raman. Bachelor’s Thesis, Universidad Politécnica de Cartagena, Cartagena, Spain, 2021. Available online: http://hdl.handle.net/10317/9568 (accessed on 23 July 2026).
- Flores Jerónimo, G.; Guerrero Salazar, C.A.; González González, V.A.; Guerrero Salas, T.E. Química verde en la síntesis de rGO partiendo de la exfoliación electroquímica del grafito. Ingenierías 2019, 22, 54–65. [Google Scholar]
- Mohan, P.R.K.; Sreelakshmi, G.; Muraleedharan, C.V.; Joseph, R. Water soluble complexes of curcumin with cyclodextrins: Characterization by FT-Raman spectroscopy. Vib. Spectrosc. 2012, 62, 77–84. [Google Scholar] [CrossRef] [Scilit]
- Bich, V.T.; Thuy, N.T.; Binh, N.T.; Huong, N.T.M.; Yen, P.N.D.; Luong, T.T. Structural and Spectral Properties of Curcumin and Metal-Curcumin Complex Derived from Turmeric (Curcuma longa). In Physics and Engineering of New Materials; Springer: Berlin, Germany, 2009; pp. 271–278. [Google Scholar] [CrossRef] [Scilit]
- Kolev, T.M.; Velcheva, E.A.; Stamboliyska, B.A.; Spiteller, M. DFT and experimental studies of the structure and vibrational spectra of curcumin. Int. J. Quantum Chem. 2005, 102, 1069–1079. [Google Scholar] [CrossRef] [Scilit]
- Hidayah, N.M.S.; Liu, W.-W.; Lai, C.-W.; Noriman, N.Z.; Khe, C.-S.; Hashim, U.; Lee, H.C. Comparison on graphite, graphene oxide and reduced graphene oxide: Synthesis and characterization. In Proceedings of the International Conference of Global Network for Innovative Technology and AWAM International Conference in Civil Engineering (IGNITE-AICCE’17), Penang, Malaysia, 8–10 August 2017. [Google Scholar] [CrossRef] [Scilit]
- Yu, S.; Liu, J.; Zhu, W.; Hu, Z.T.; Lim, T.T.; Yan, X. Facile room-temperature synthesis of carboxylated graphene oxide-copper sulfide nanocomposite with high photodegradation and disinfection activities under solar light irradiation. Sci. Rep. 2015, 5, 16369. [Google Scholar] [CrossRef] [Scilit]
- White, R.L.; White, C.M.; Turgut, H.; Massoud, A.; Tian, Z.R. Comparative studies on copper adsorption by graphene oxide and functionalized graphene oxide nanoparticles. J. Taiwan Inst. Chem. Eng. 2018, 85, 18–28. [Google Scholar] [CrossRef] [Scilit]
- Farooq, S.; Aziz, H.; Ali, S.; Murtaza, G.; Rizwan, M.; Saleem, M.H.; Mahboob, S.; Al-Ghanim, K.A.; Riaz, M.N.; Murtaza, B. Synthesis of Functionalized Carboxylated Graphene Oxide for the Remediation of Pb and Cr Contaminated Water. Int. J. Environ. Res. Public Health 2022, 19, 10610. [Google Scholar] [CrossRef] [Scilit]
- Yogesh, G.K.; Shuaib, E.P.; Roopmani, P.; Gumpu, M.B.; Krishnan, U.M.; Sastikumar, D. Synthesis, characterization and bioimaging application of laser-ablated graphene-oxide nanoparticles (nGOs). Diam. Relat. Mater. 2020, 104, 107733. [Google Scholar] [CrossRef] [Scilit]
- Xing, R.; Li, Y.; Yu, H. Preparation of fluoro-functionalized graphene oxide via the Hunsdiecker reaction. Chem. Commun. 2016, 52, 390–393. [Google Scholar] [CrossRef] [Scilit]
- Pedrosa, M.; Da Silva, E.S.; Pastrana-Martínez, L.M.; Drazic, G.; Falaras, P.; Faria, J.L.; Figueiredo, J.L.; Silva, A.M.T. Hummers’ and Brodie’s graphene oxides as photocatalysts for phenol degradation. J. Colloid. Interface Sci. 2020, 567, 243–255. [Google Scholar] [CrossRef] [Scilit]
- Sowińska, A.; Lange, A.; Kutwin, M.; Jaworski, S.; Skrzeczanowski, W.; Bombalska, A.; Romiszewska, A.; Olkowicz, K.; Bogdanowicz, Z.; Nasiłowska, B. Effect of Graphene Aerosol Doped with Hypochlorous Acid, Curcumin, and Silver Nanoparticles on Selected Structural and Biological Properties. Materials 2024, 17, 5640. [Google Scholar] [CrossRef] [Scilit]
- Charmi, J.; Nosrati, H.; Mostafavi Amjad, J.; Mohammadkhani, R.; Danafar, H. Polyethylene glycol (PEG) decorated graphene oxide nanosheets for controlled release curcumin delivery. Heliyon 2019, 5, e01466. [Google Scholar] [CrossRef] [Scilit]
- Some, S.; Gwon, A.R.; Hwang, E.; Bahn, G.H.; Yoon, Y.; Kim, Y.; Kim, S.H.; Bak, S.; Yang, J.; Jo, D.G.; et al. Cancer Therapy Using Ultrahigh Hydrophobic Drug-Loaded Graphene Derivatives. Sci. Rep. 2014, 4, 6314. [Google Scholar] [CrossRef] [Scilit] [PubMed]
- Bu, T.; Gao, H.; Yao, Y.; Wang, J.; Pollard, A.J.; Legge, E.J.; Clifford, C.A.; Delvallée, A.; Ducourtieux, S.; Lawn, M.A.; et al. Thickness measurements of graphene oxide flakes using atomic force microscopy: Results of an international interlaboratory comparison. Nanotechnology 2023, 34, 225702. [Google Scholar] [CrossRef] [Scilit] [PubMed]
- Liao, K.H.; Lin, Y.S.; Macosko, C.W.; Haynes, C.L. Cytotoxicity of Graphene Oxide and Graphene in Human Erythrocytes and Skin Fibroblasts. ACS Appl. Mater. Interfaces 2011, 3, 2607–2615. [Google Scholar] [CrossRef] [Scilit]
- Gurunathan, S.; Iqbal, M.A.; Qasim, M.; Park, C.H.; Yoo, H.; Hwang, J.H.; Uhm, S.J.; Song, H.; Park, C.; Do, J.T.; et al. Evaluation of Graphene Oxide Induced Cellular Toxicity and Transcriptome Analysis in Human Embryonic Kidney Cells. Nanomaterials 2019, 9, 969. [Google Scholar] [CrossRef] [Scilit]
- Lucherelli, M.A.; Qian, X.; Weston, P.; Eredia, M.; Zhu, W.; Samorì, P.; Gao, H.; Bianco, A.; von dem Bussche, A. Boron Nitride Nanosheets Can Induce Water Channels Across Lipid Bilayers Leading to Lysosomal Permeabilization. Adv. Mater. 2021, 33, 2103137. [Google Scholar] [CrossRef] [Scilit] [PubMed]
- Jafarinejad-Farsangi, S.; Hashemi, M.S.; Yazdi Rouholamini, S.E.; Gharbi, S.; Ansari-Asl, Z.; Jafari, E.; Shiralizadeh Dezfuli, A.; Shahrokhi-Farjah, M. Curcumin loaded on graphene nanosheets induced cell death in mammospheres from MCF-7 and primary breast tumor cells. Biomed. Mater. 2021, 16, 045040. [Google Scholar] [CrossRef] [Scilit]
- Yaghoubi, F.; Naghib, S.M.; Motlagh, N.S.H.; Haghiralsadat, F.; Jaliani, H.Z.; Tofighi, D.; Moradi, A. Multiresponsive carboxylated graphene oxide-grafted aptamer as a multifunctional nanocarrier for targeted delivery of chemotherapeutics and bioactive compounds in cancer therapy. Nanotechnol. Rev. 2021, 10, 1838–1852. [Google Scholar] [CrossRef] [Scilit]
- Pourjavadi, A.; Asgari, S.; Hosseini, S.H.; Akhlaghi, M. Codelivery of Hydrophobic and Hydrophilic Drugs by Graphene-Decorated Magnetic Dendrimers. Langmuir 2018, 34, 15304–15318. [Google Scholar] [CrossRef] [Scilit] [PubMed]
- Sydlik, S.A.; Jhunjhunwala, S.; Webber, M.J.; Anderson, D.G.; Langer, R. In Vivo Compatibility of Graphene Oxide with Differing Oxidation States. ACS Nano 2015, 9, 3866–3874. [Google Scholar] [CrossRef] [Scilit]
- Bellier, N.; Baipaywad, P.; Ryu, N.; Lee, J.Y.; Park, H. Recent biomedical advancements in graphene oxide- and reduced graphene oxide-based nanocomposite nanocarriers. Biomater. Res. 2022, 26, 65. [Google Scholar] [CrossRef] [Scilit]
- Newman, L.; Jasim, D.A.; Prestat, E.; Lozano, N.; de Lazaro, I.; Nam, Y.; Assas, B.M.; Pennock, J.; Haigh, S.J.; Bussy, C.; et al. Splenic Capture and In Vivo Intracellular Biodegradation of Biological-Grade Graphene Oxide Sheets. ACS Nano 2020, 14, 10168–10186. [Google Scholar] [CrossRef] [Scilit]
- Fang, H.; Luo, C.; Liu, S.; Zhou, M.; Zeng, Y.; Hou, J.; Chen, L.; Mou, S.; Sun, J.; Wang, Z. A biocompatible vascularized graphene oxide (GO)-collagen chamber with osteoinductive and anti-fibrosis effects promotes bone regeneration in vivo. Theranostics 2020, 10, 2759–2772. [Google Scholar] [CrossRef] [Scilit]
- Xie, Q.; Wang, T.; He, L.; Liang, H.; Sun, J.; Huang, X.; Xie, W.; Niu, Y. Biological and structural properties of curcumin-loaded graphene oxide incorporated collagen as composite scaffold for bone regeneration. Front. Bioeng. Biotechnol. 2024, 12, 1505102. [Google Scholar] [CrossRef] [Scilit]
- Martiliano, D.; Grande, C. Functionalization of Graphene Oxide as A Drug Nanocarrier for Anticancer Therapy. In Proceedings of the 5th International Online Conference on Nanomaterials (IOCN 2025), Basel, Switzerland, 22–24 September 2025. [Google Scholar]
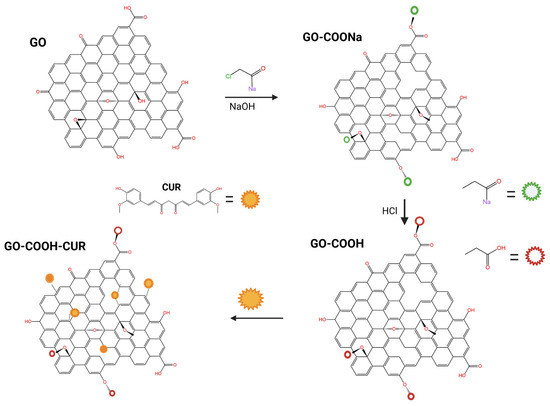
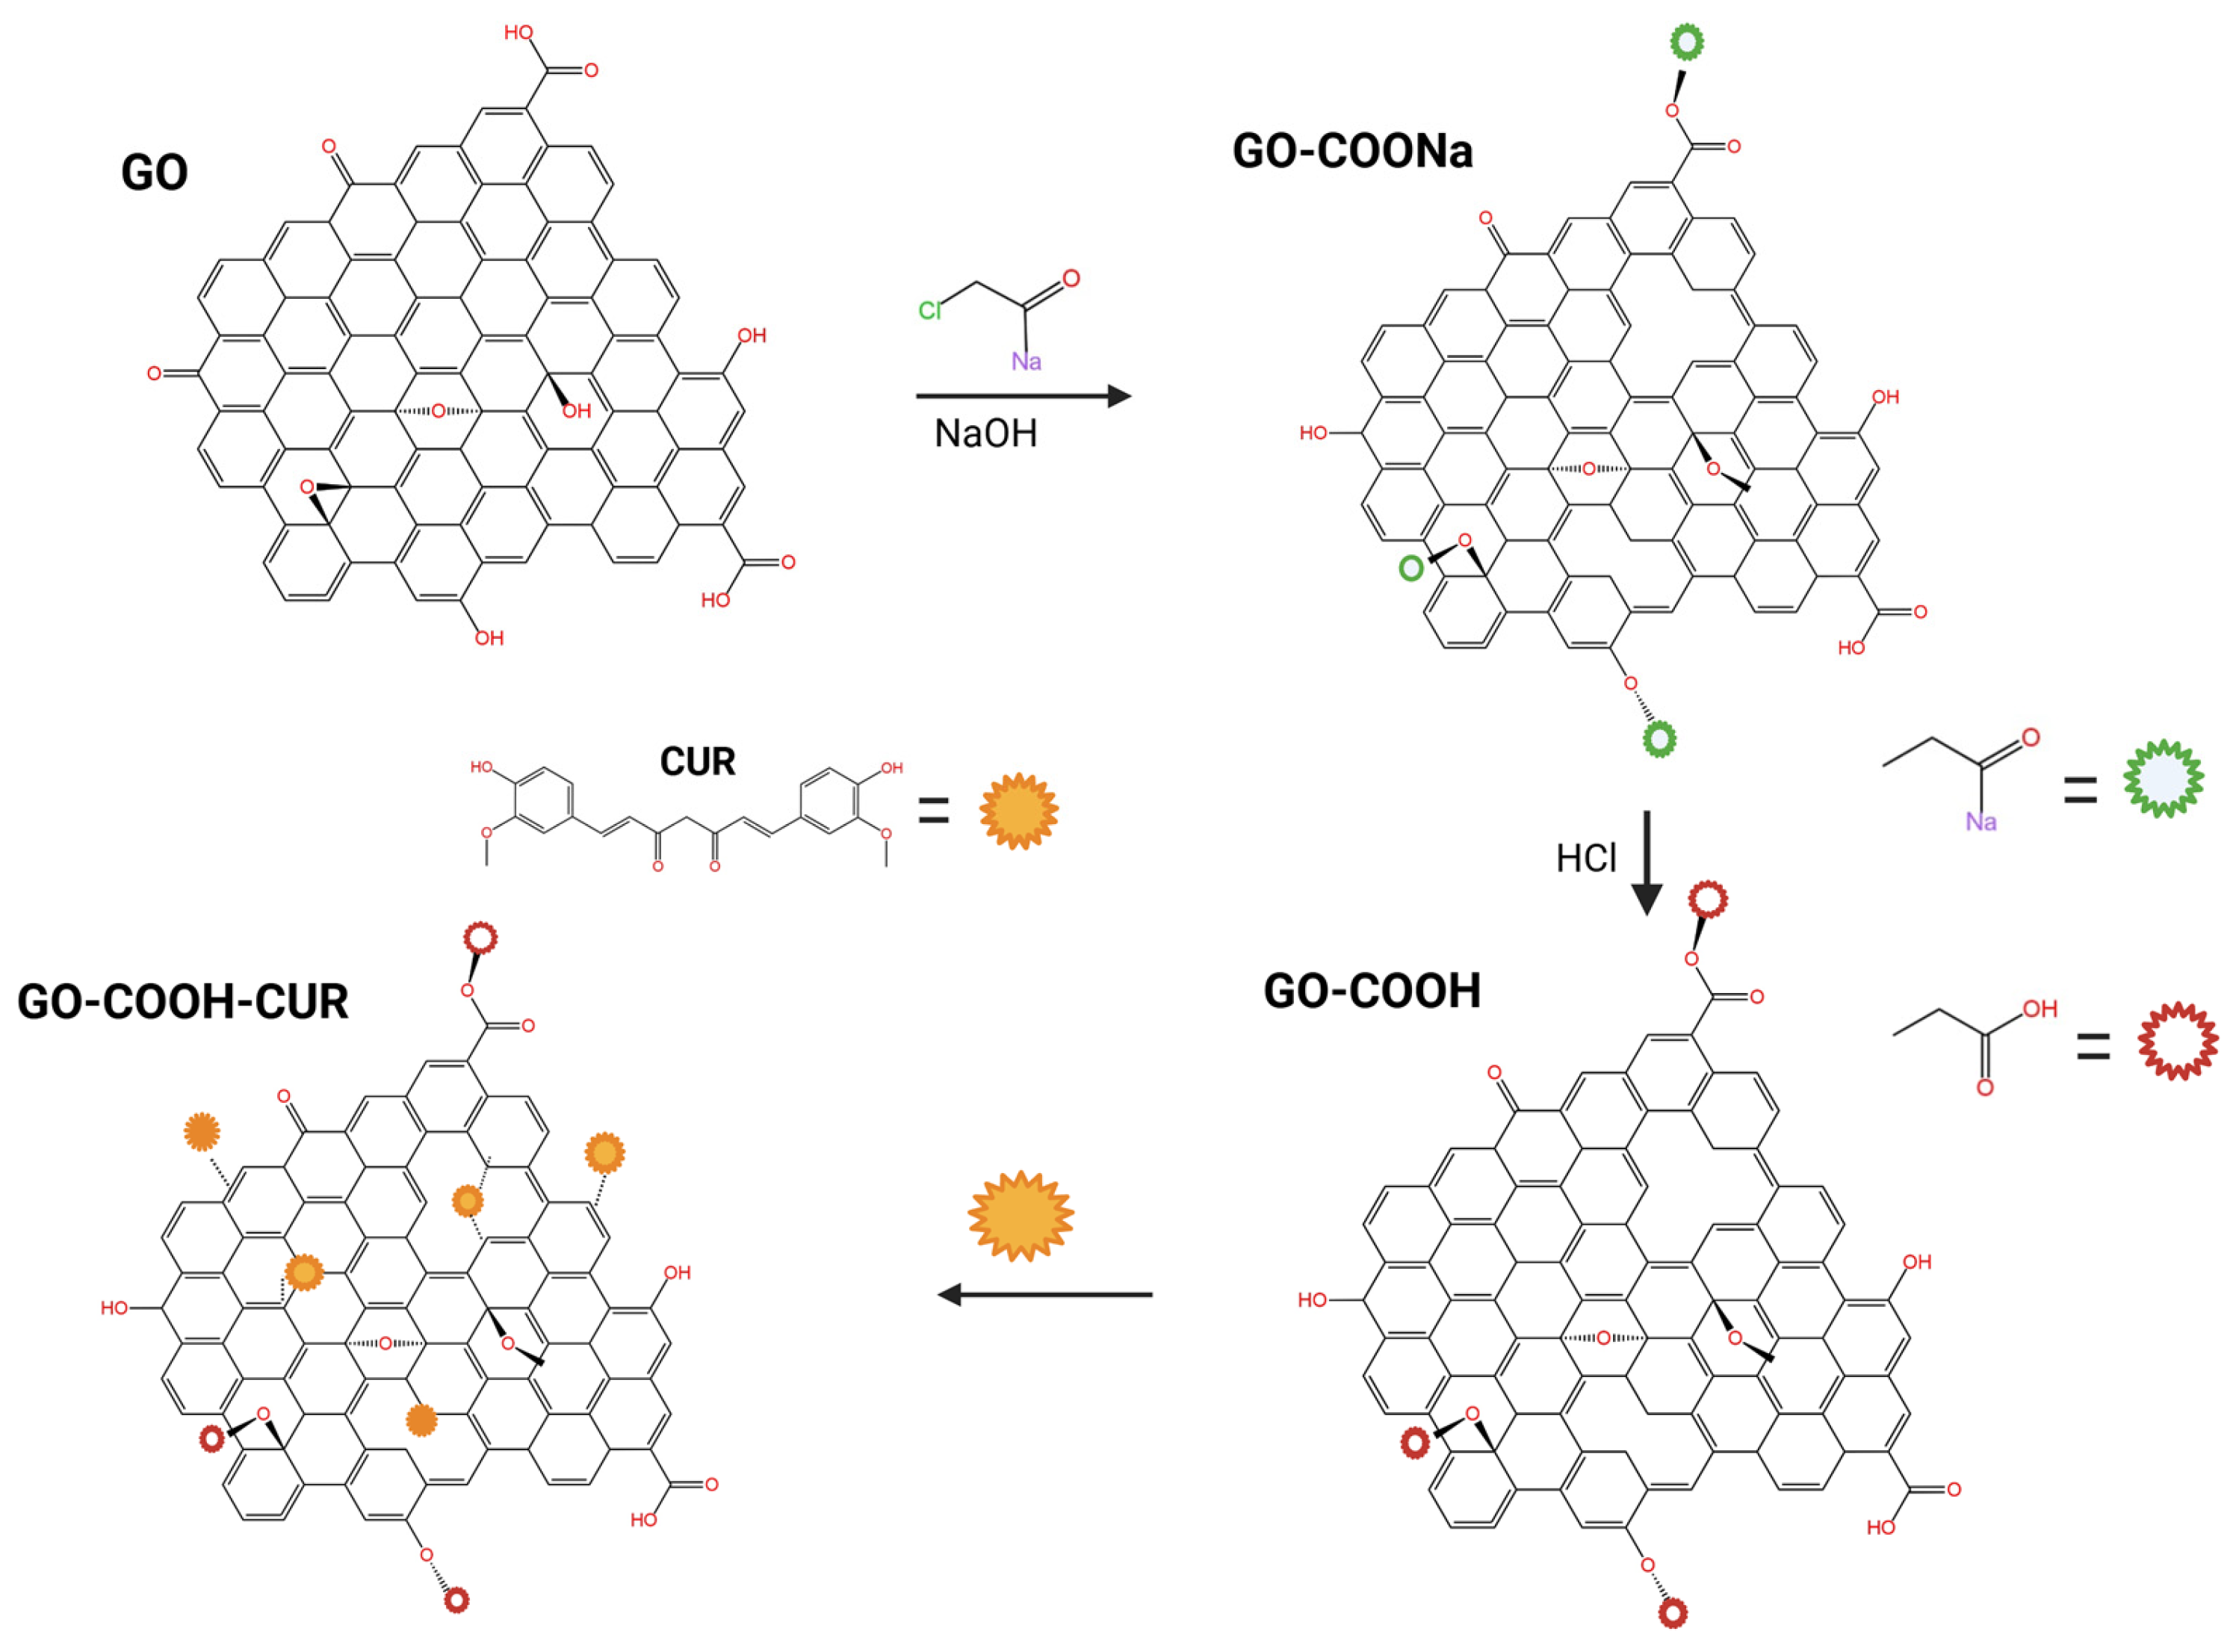
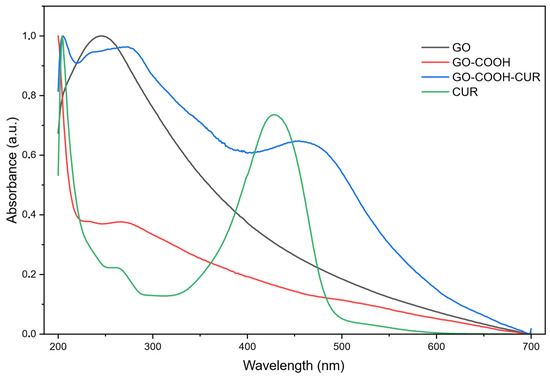
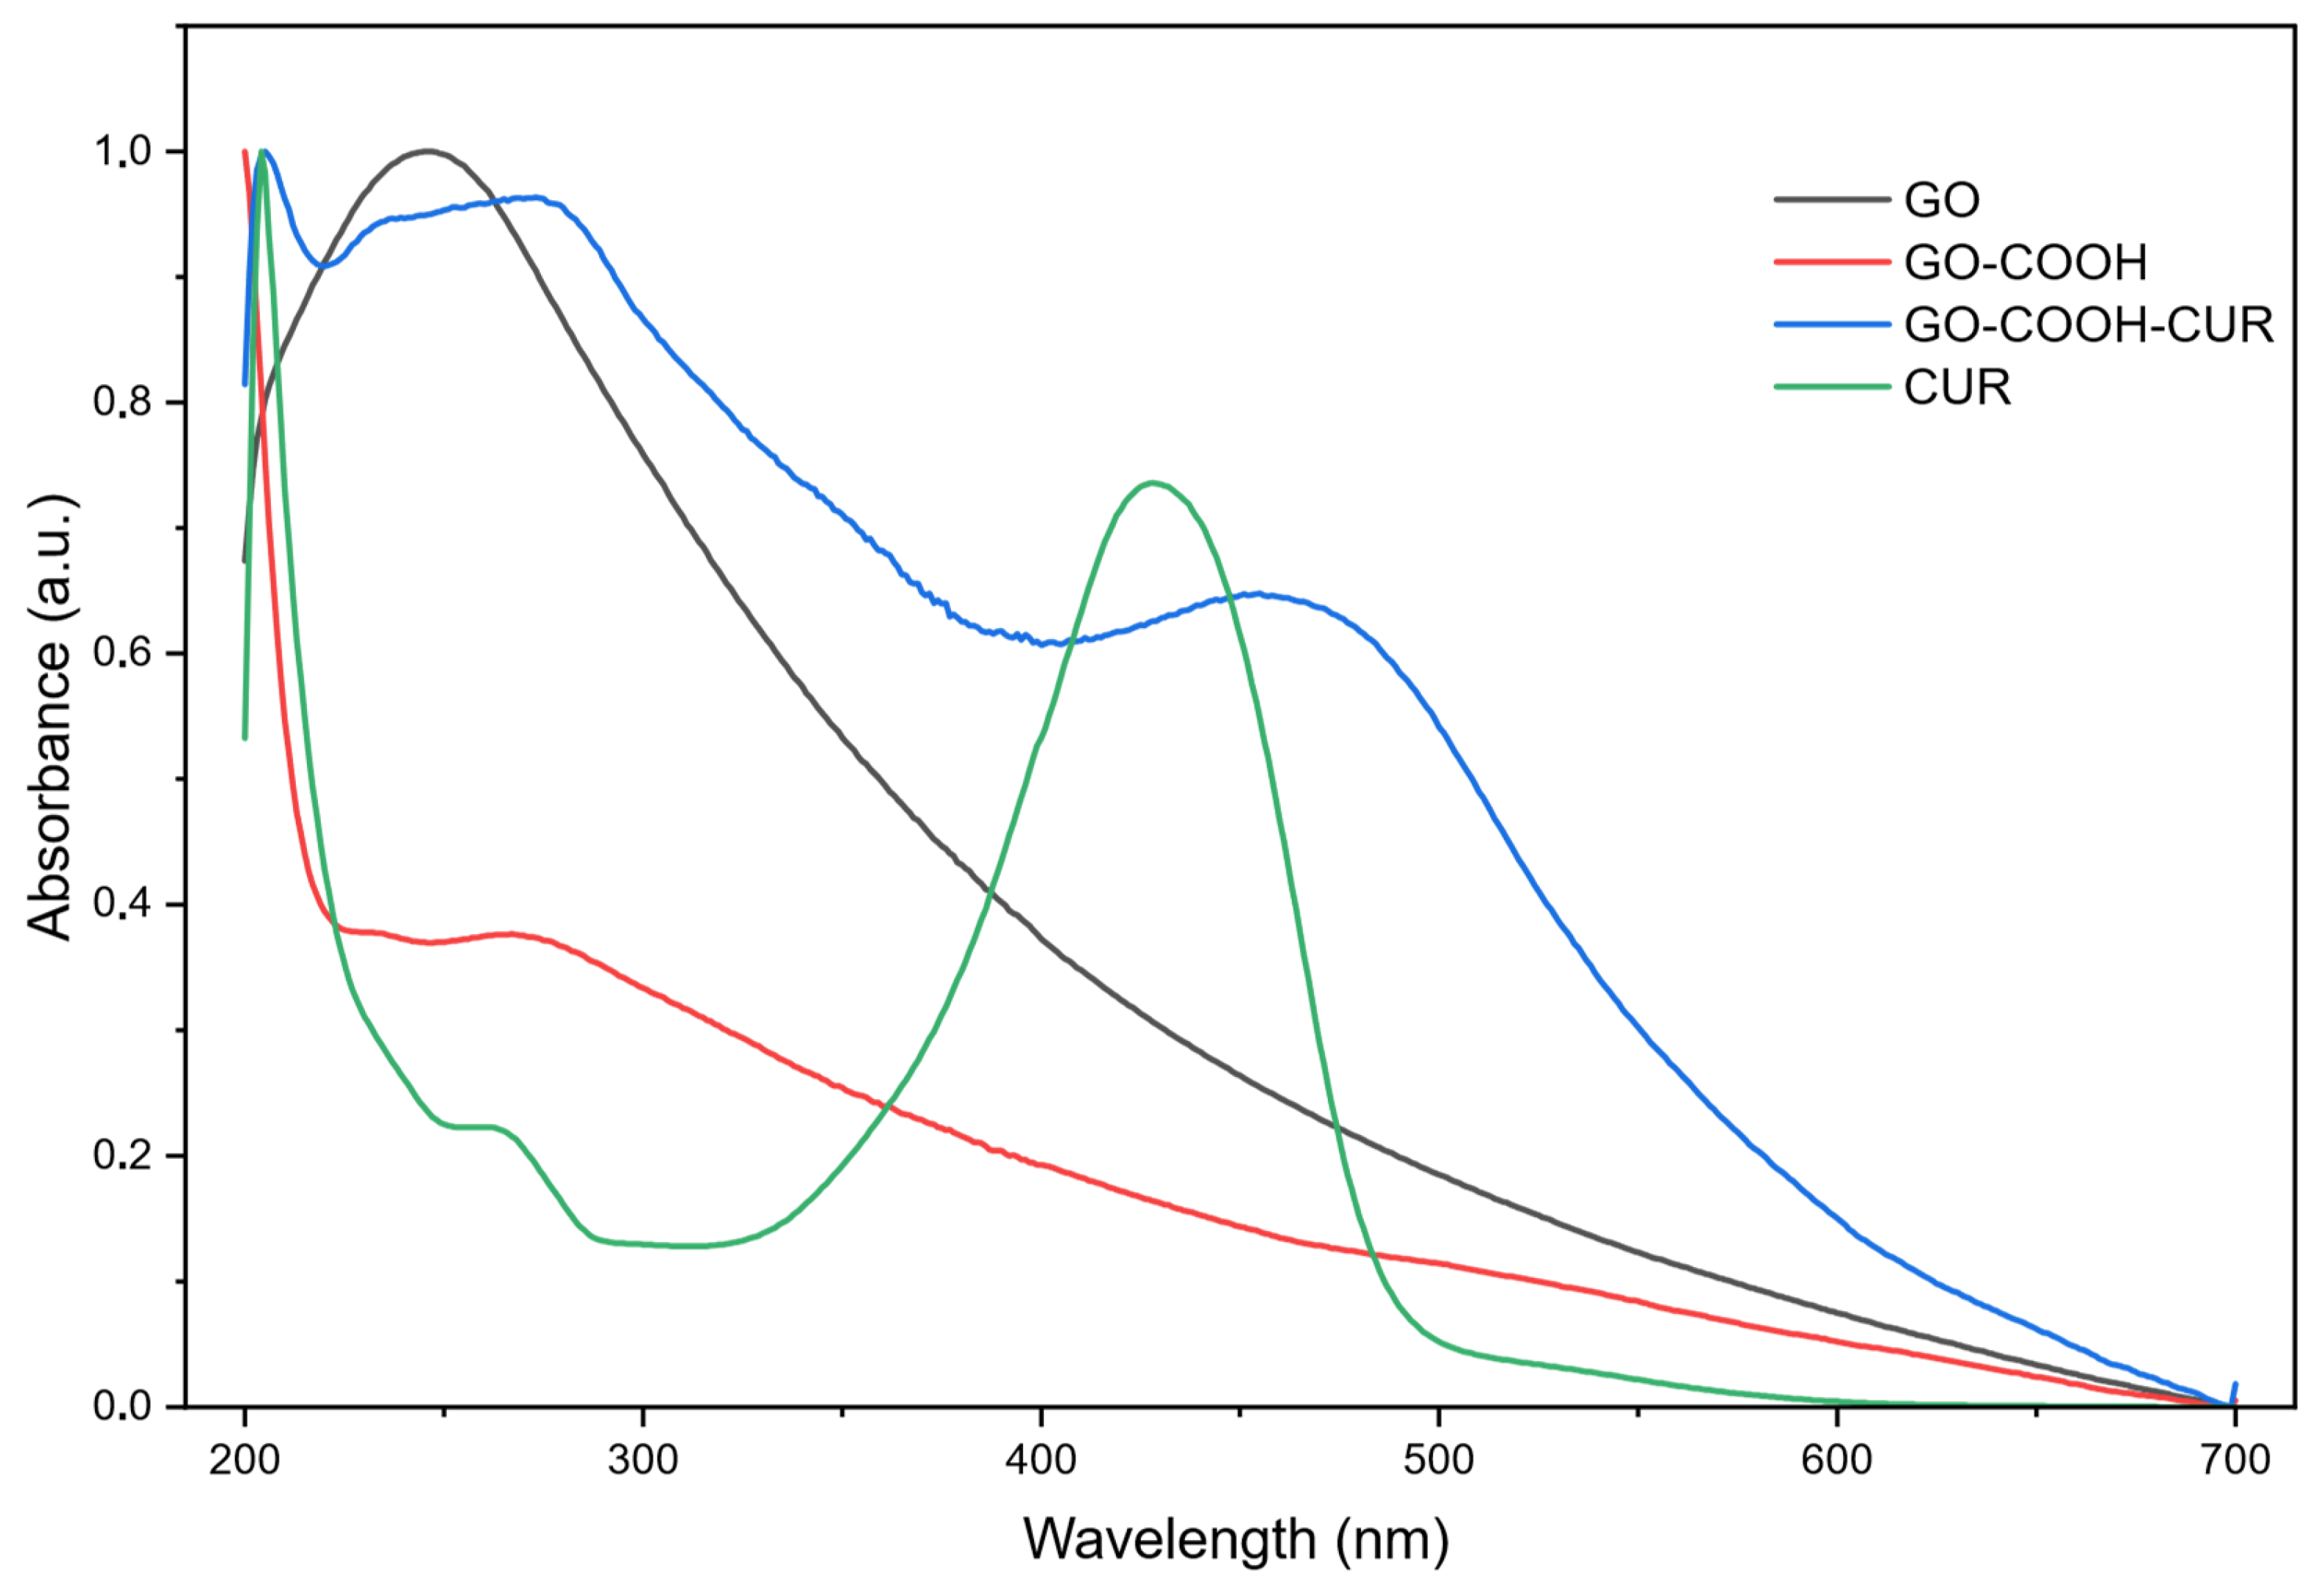
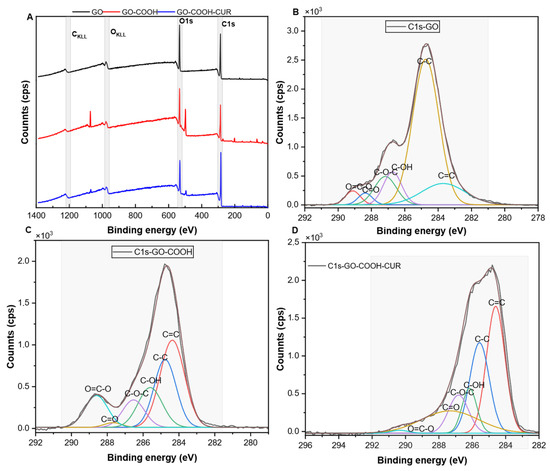
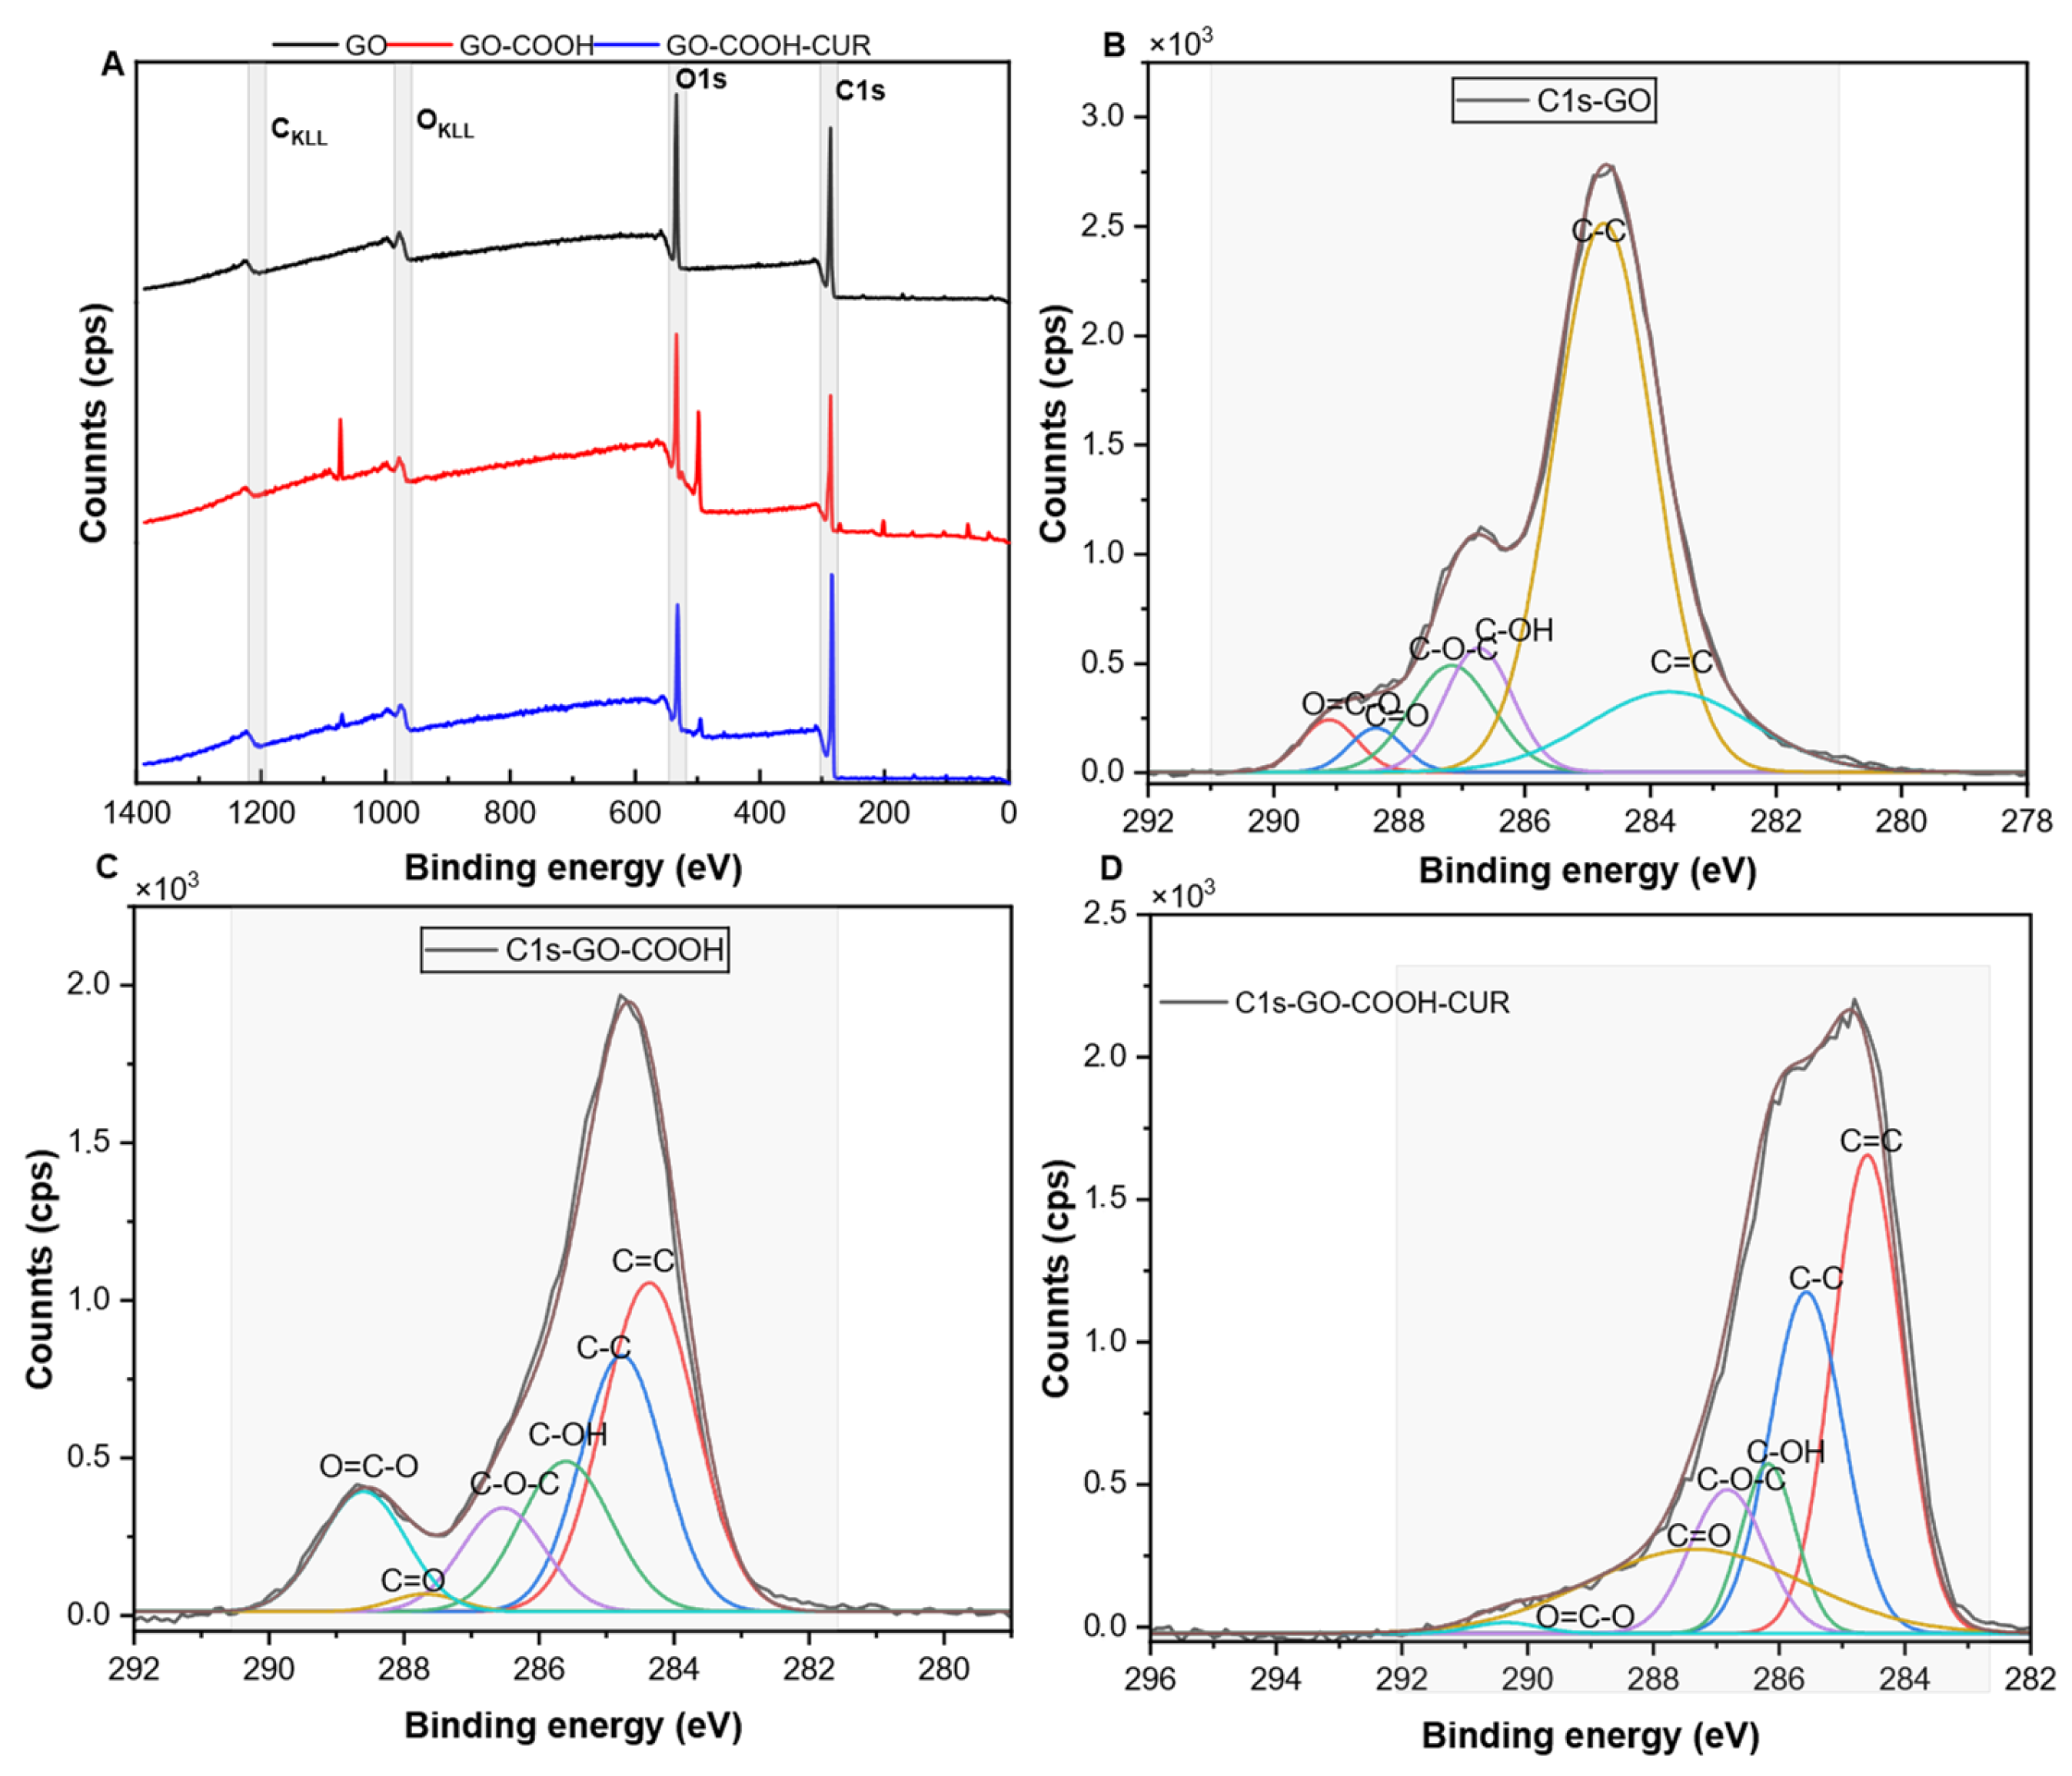
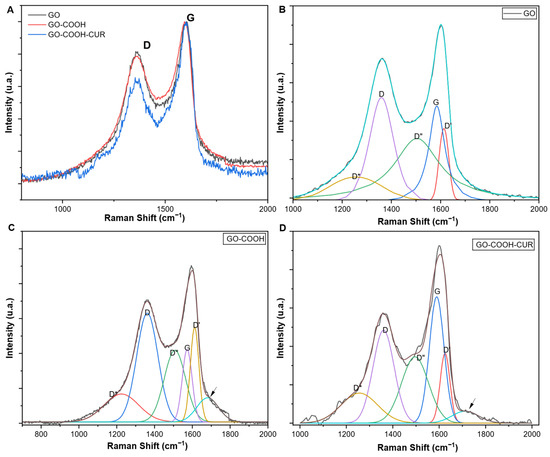
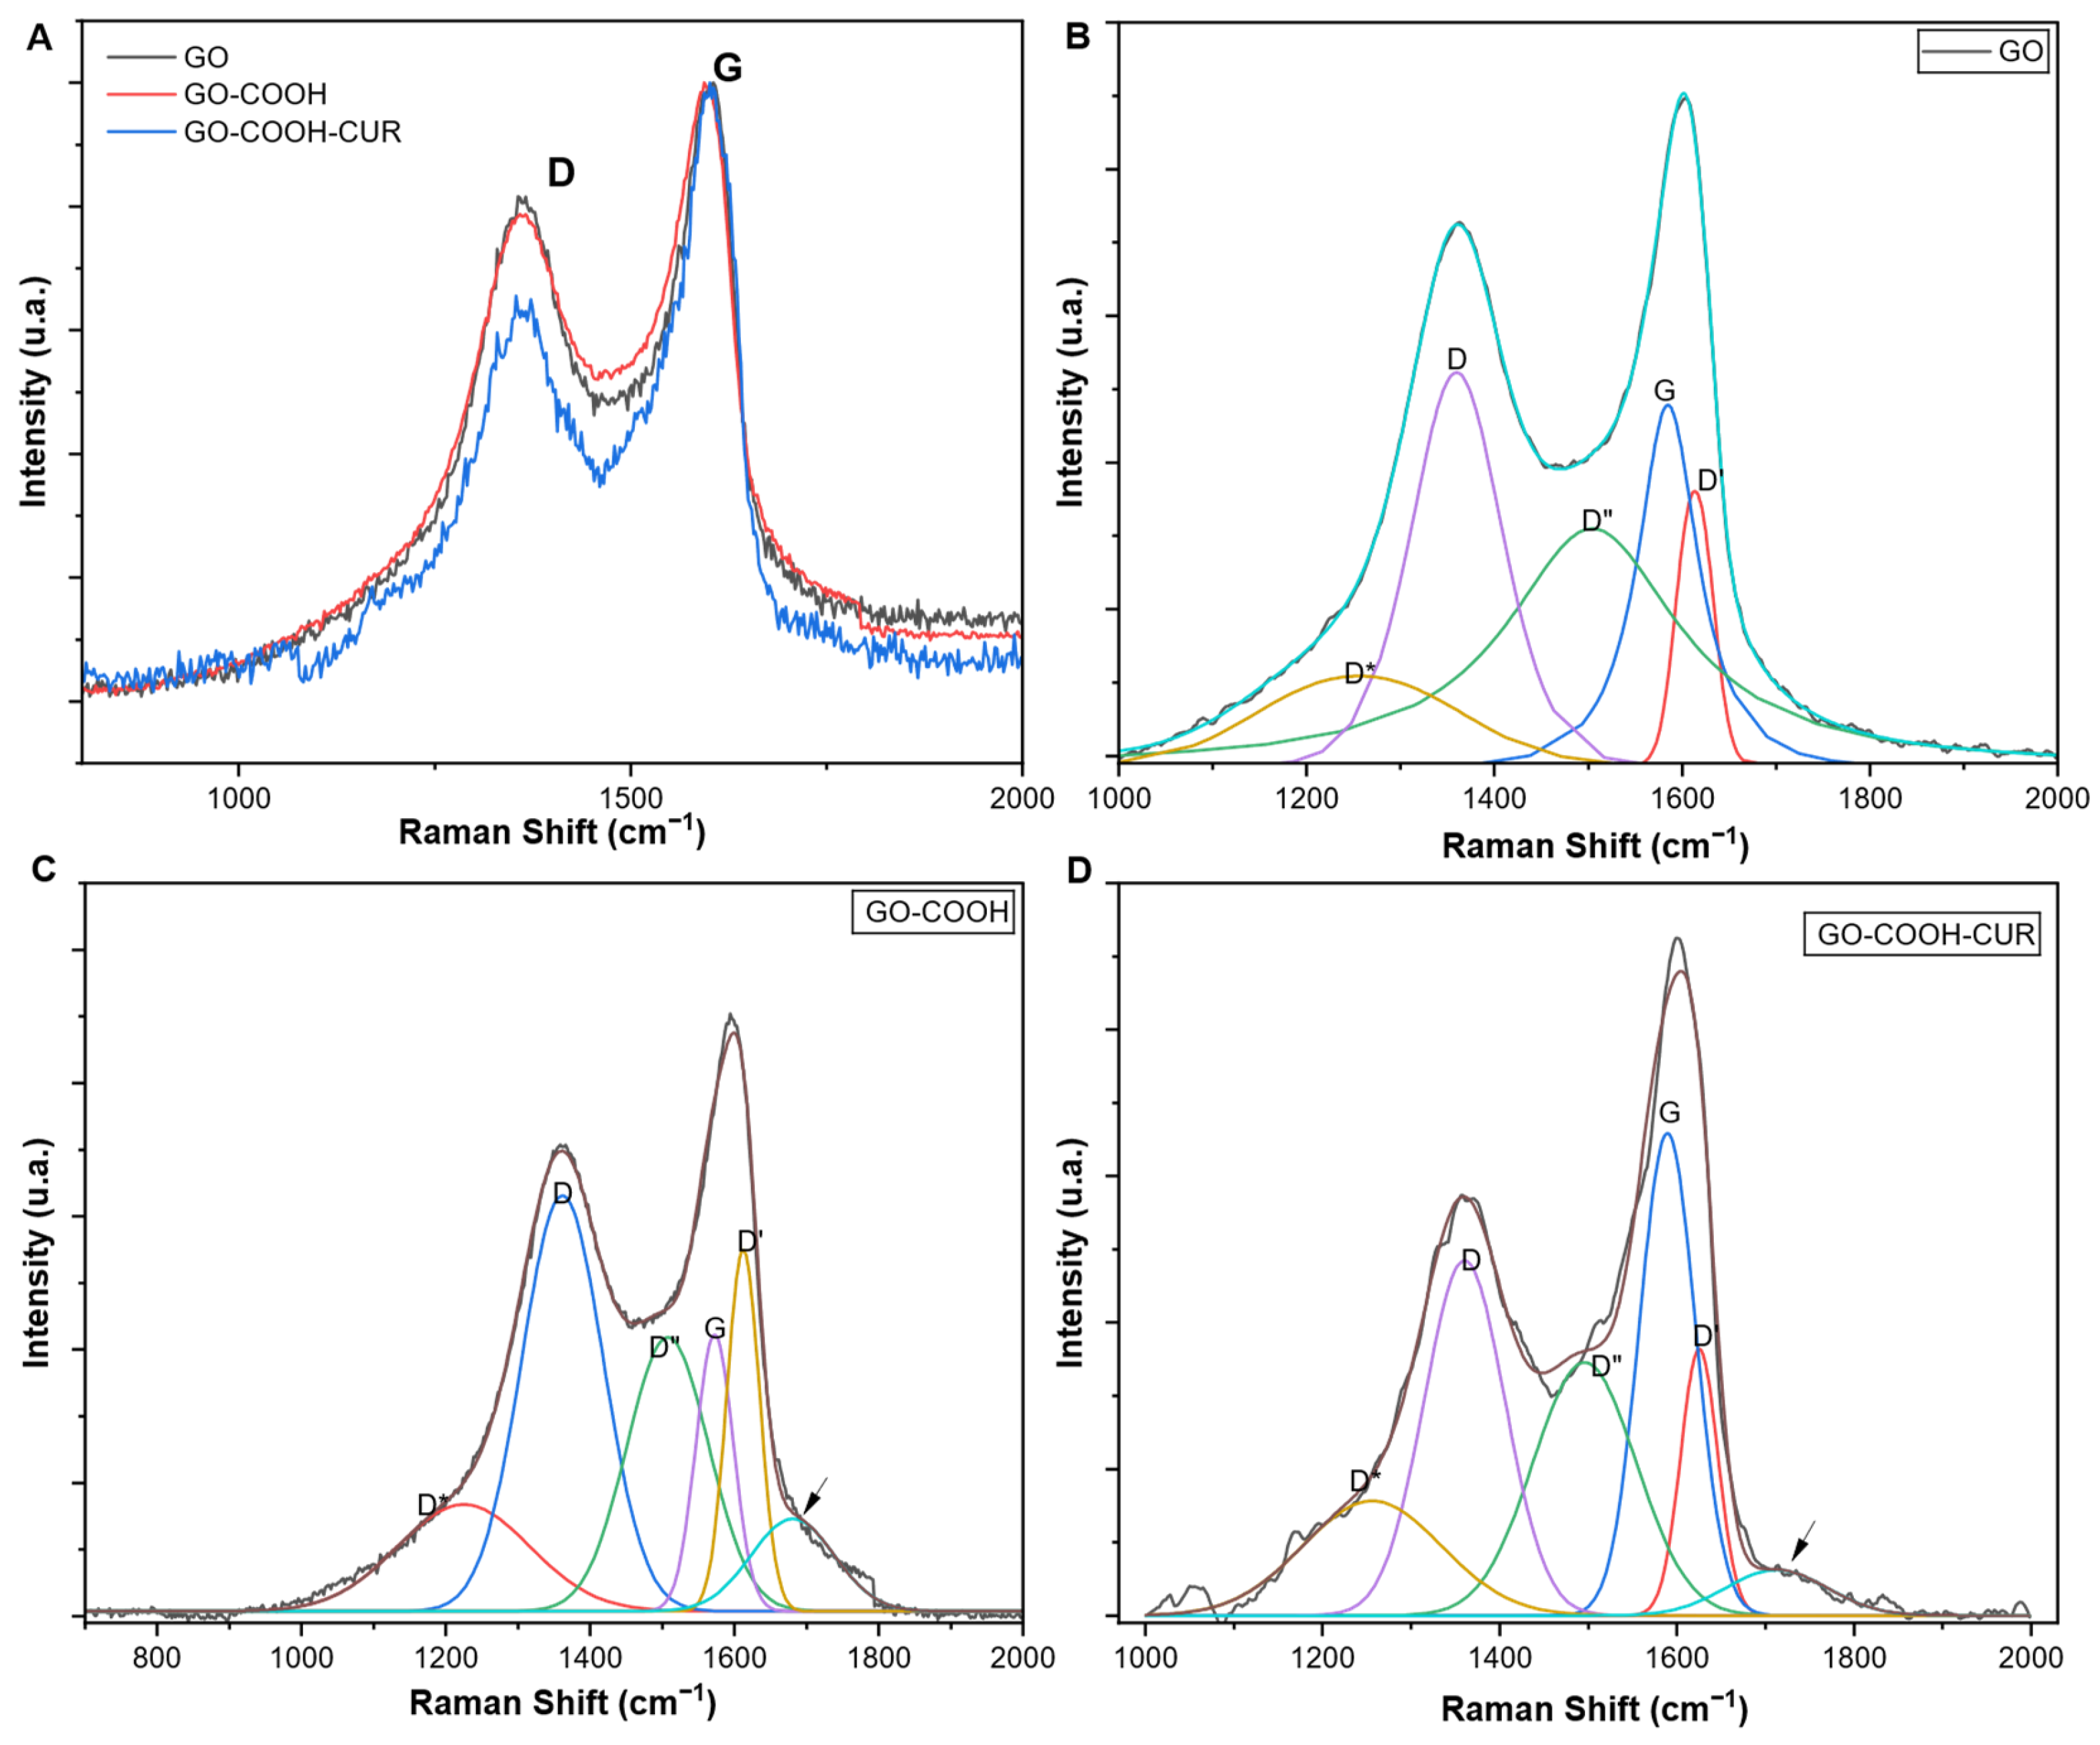
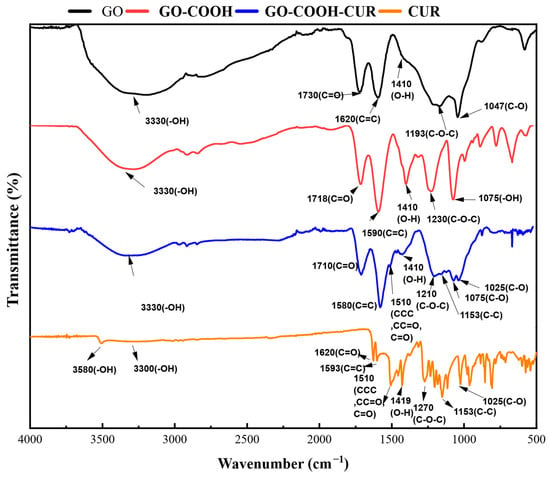
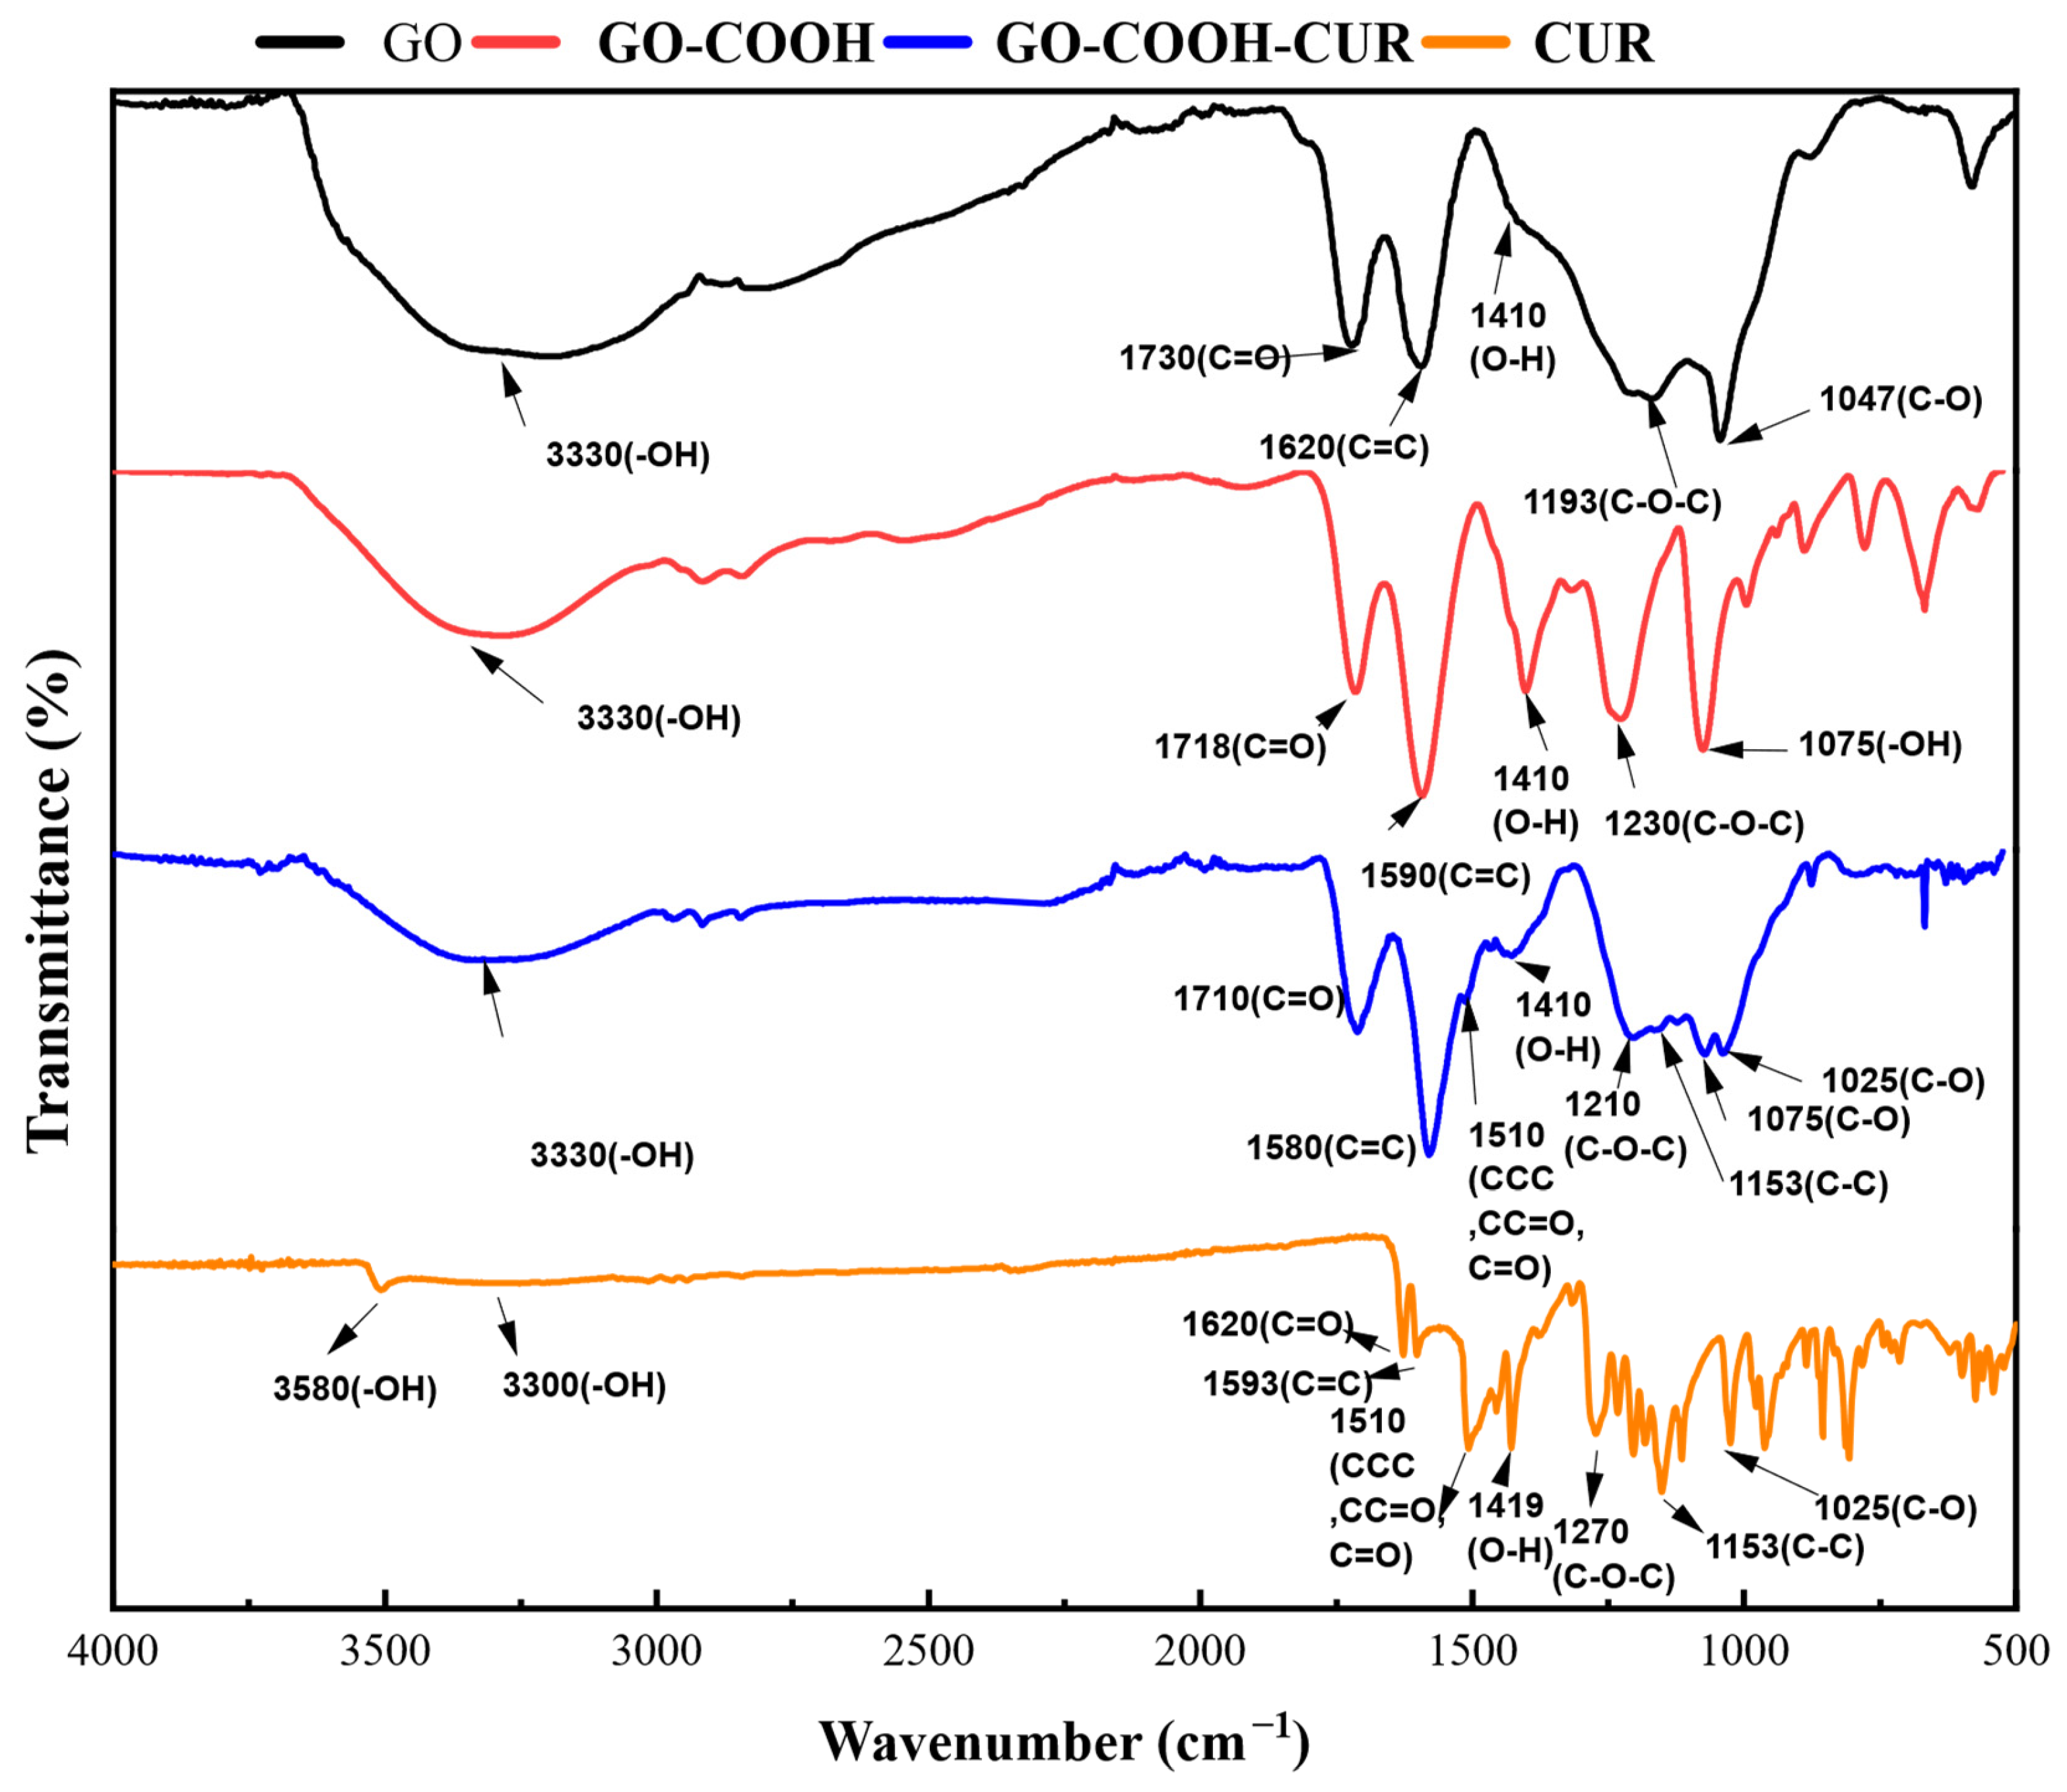
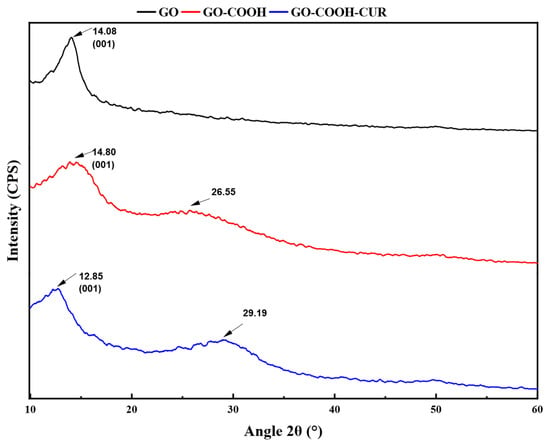
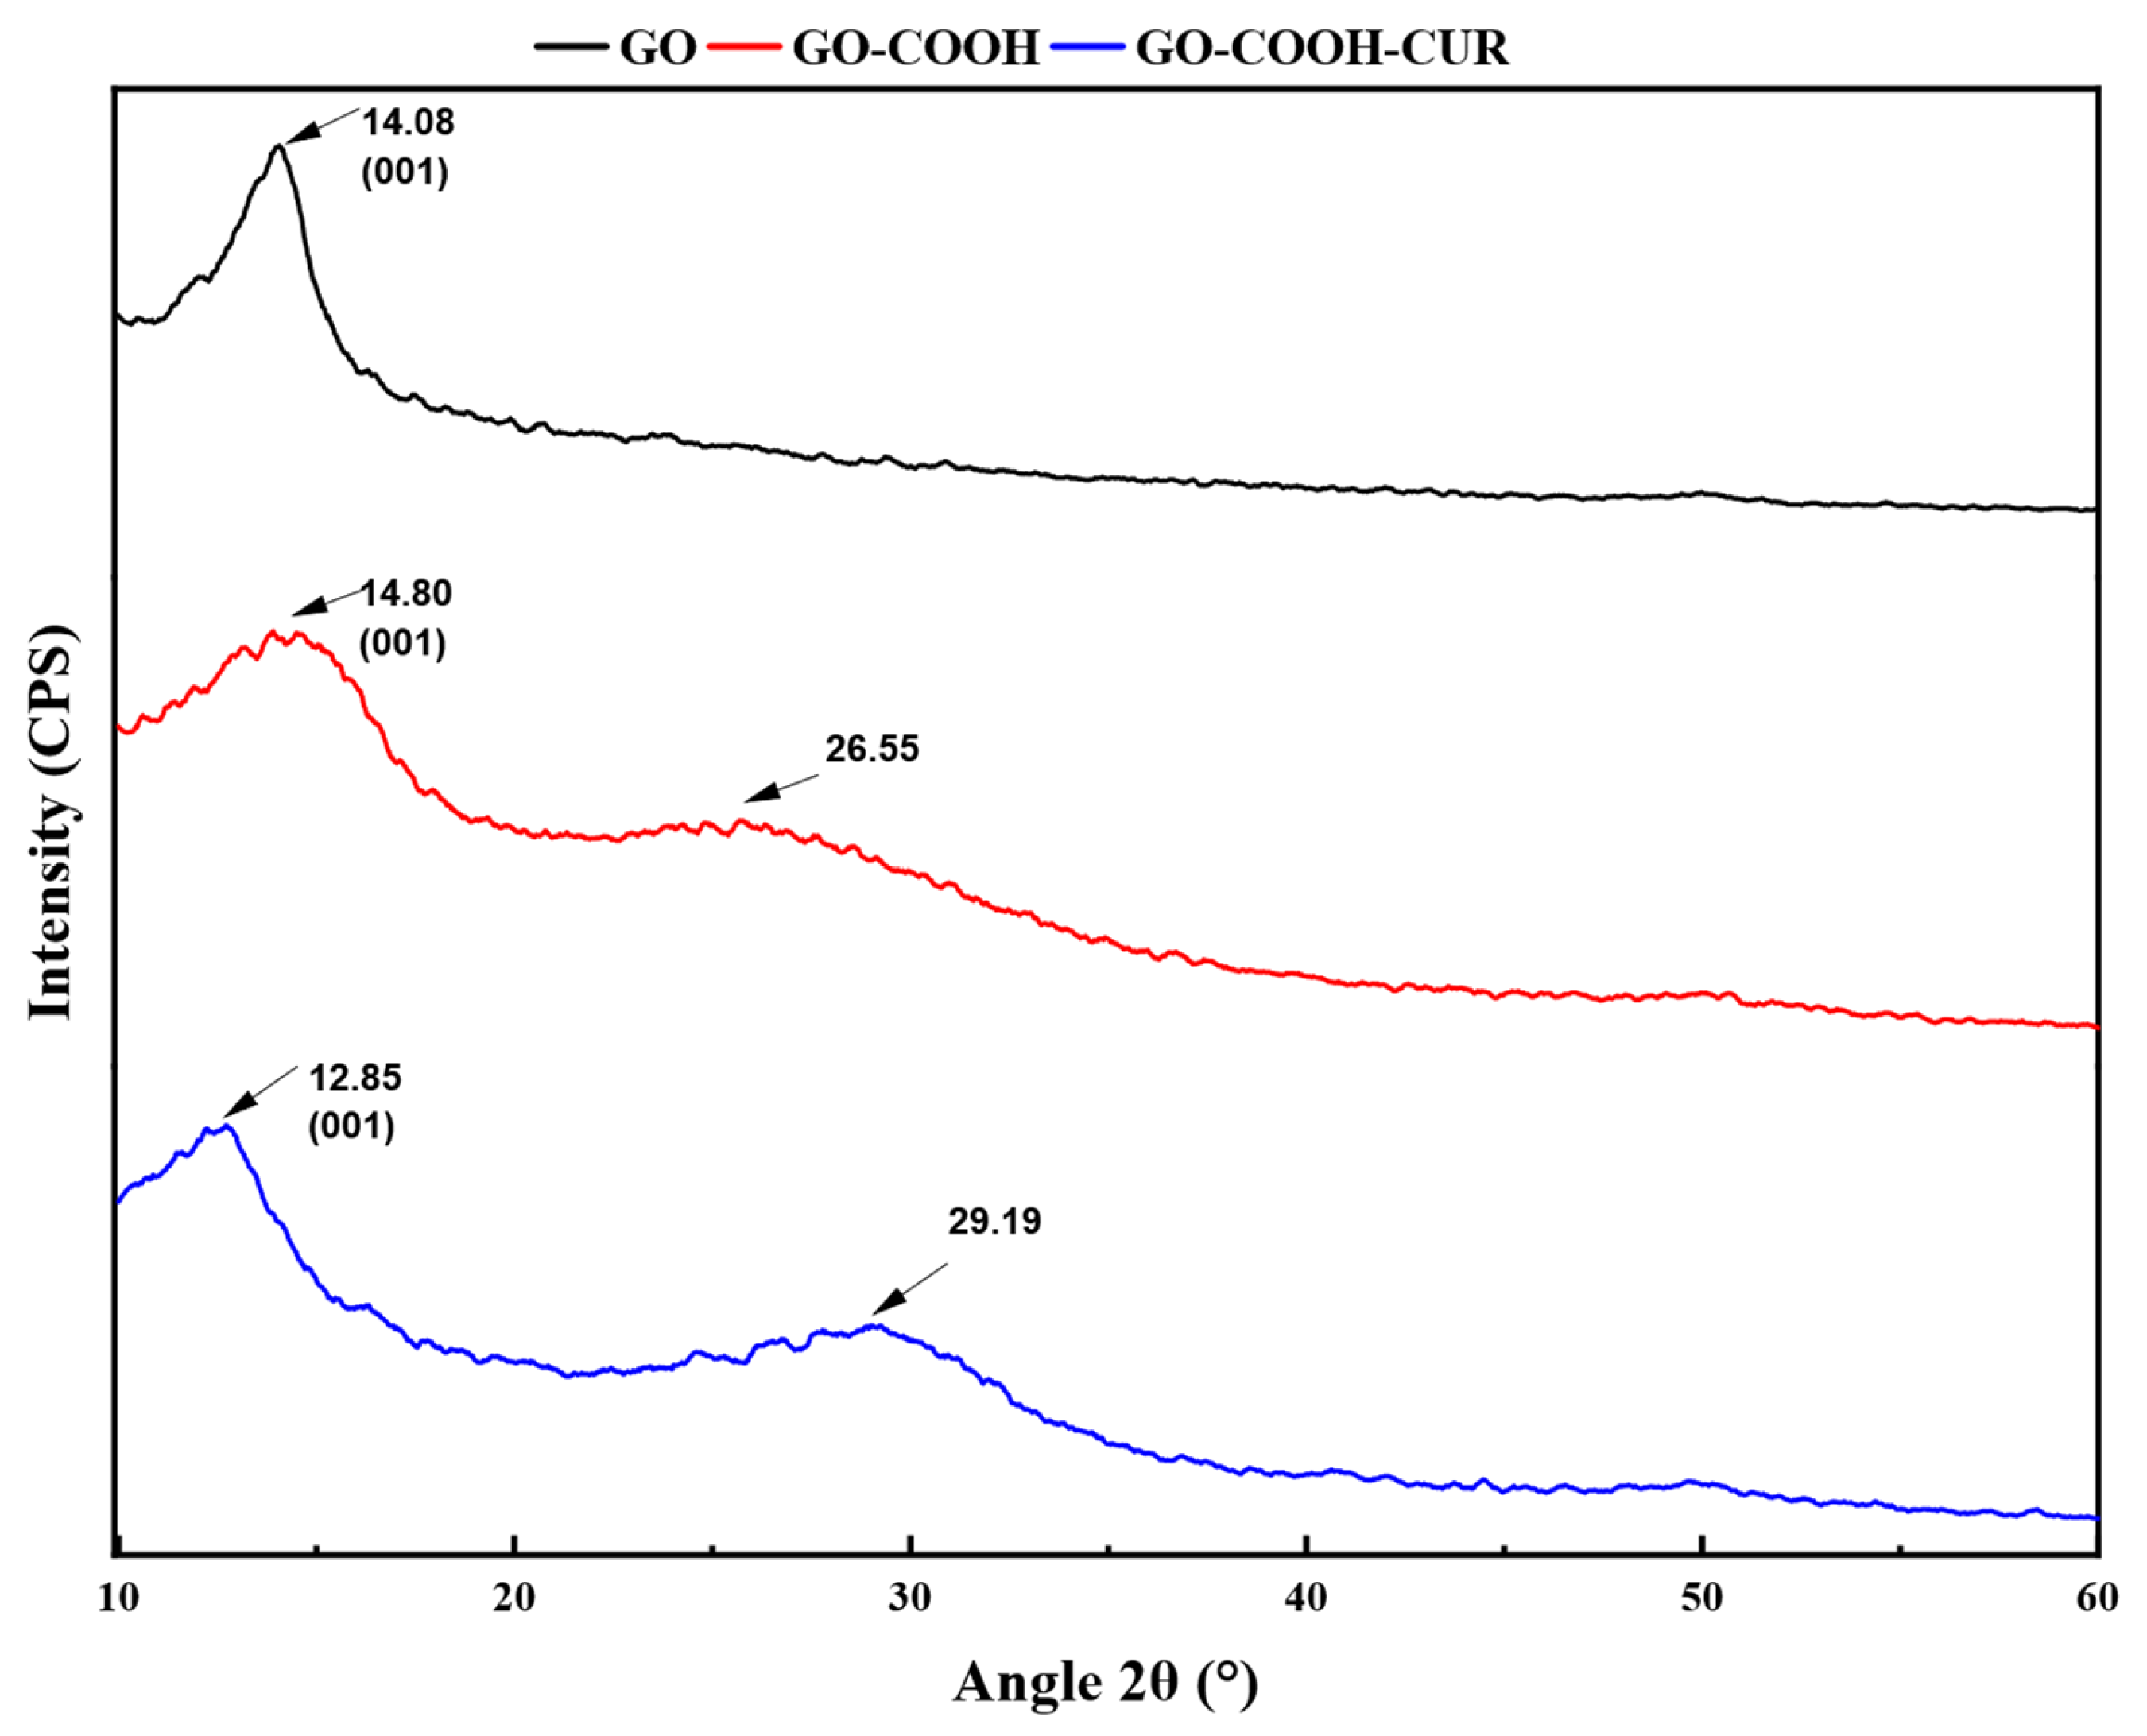
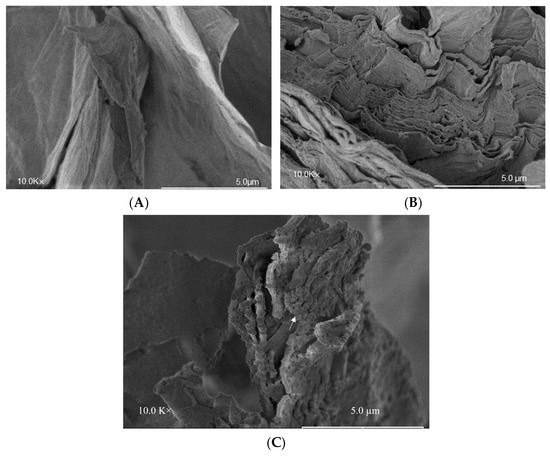
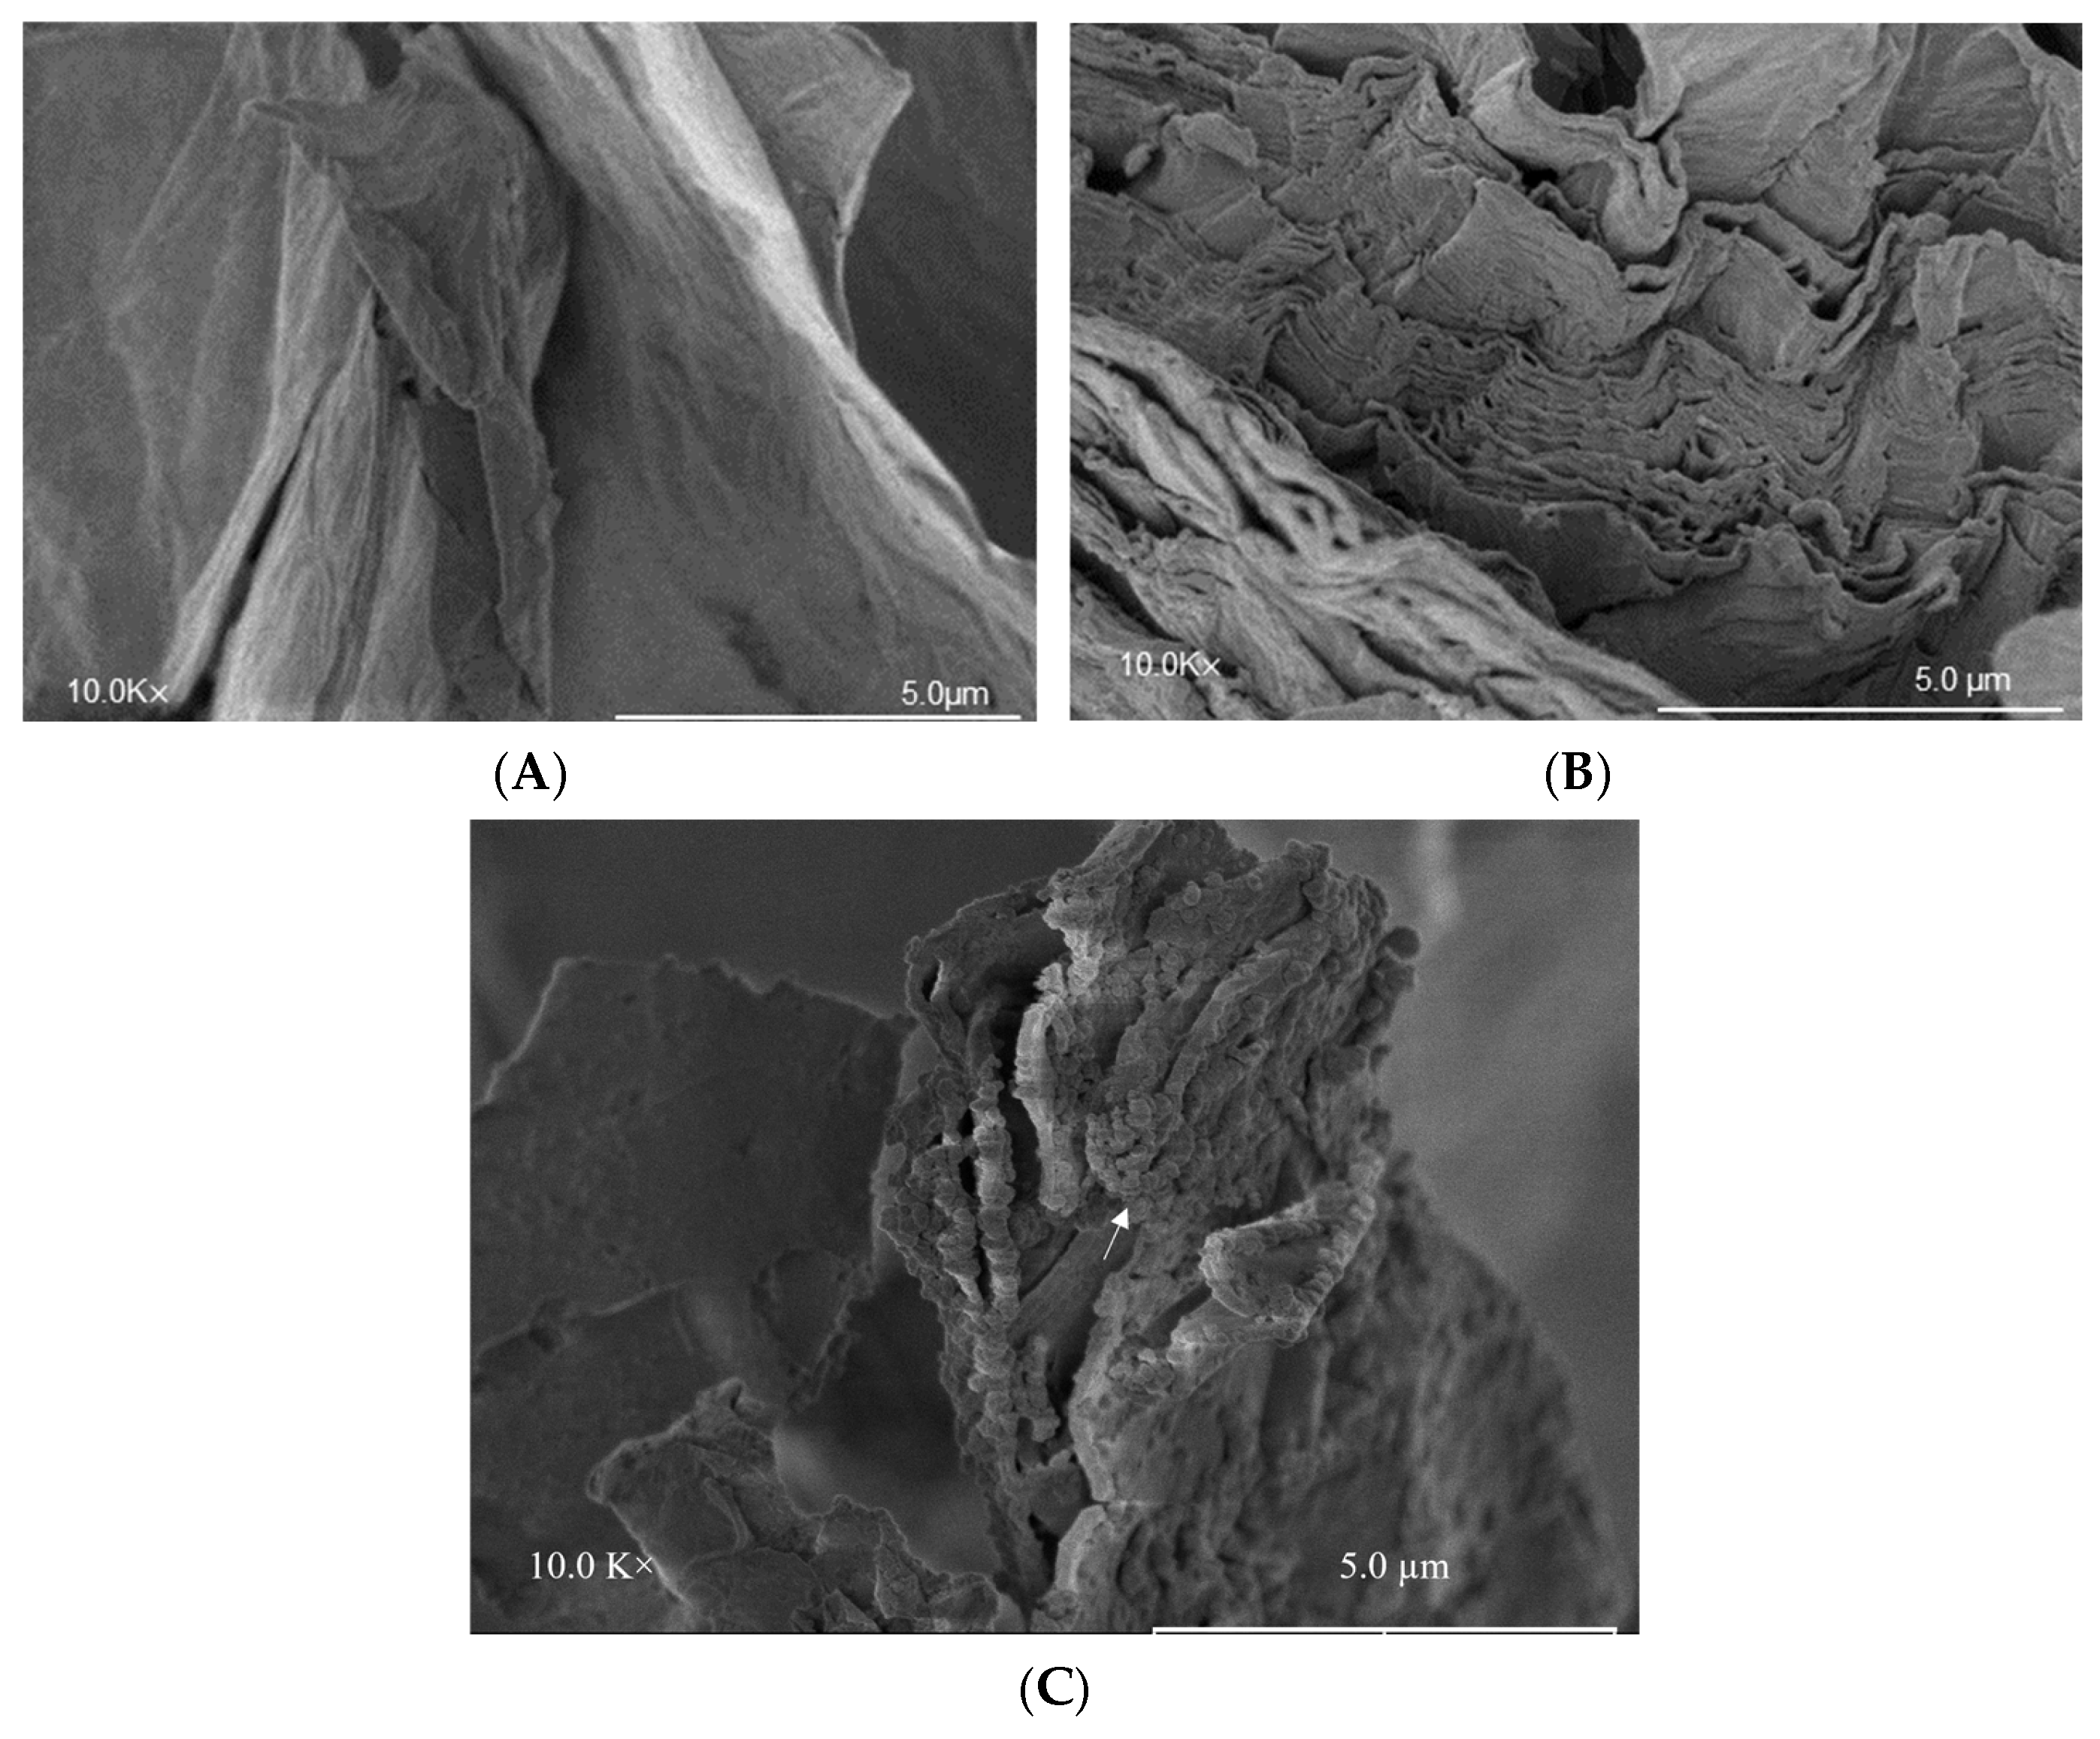
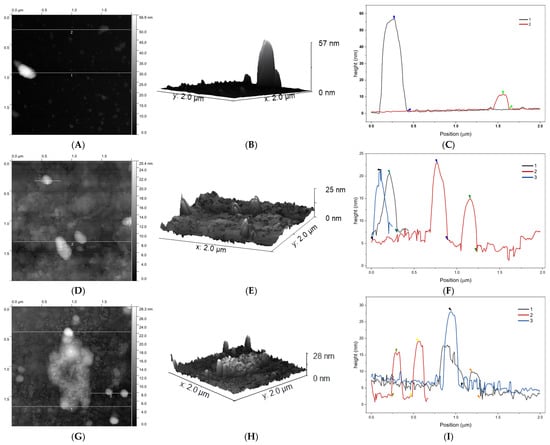
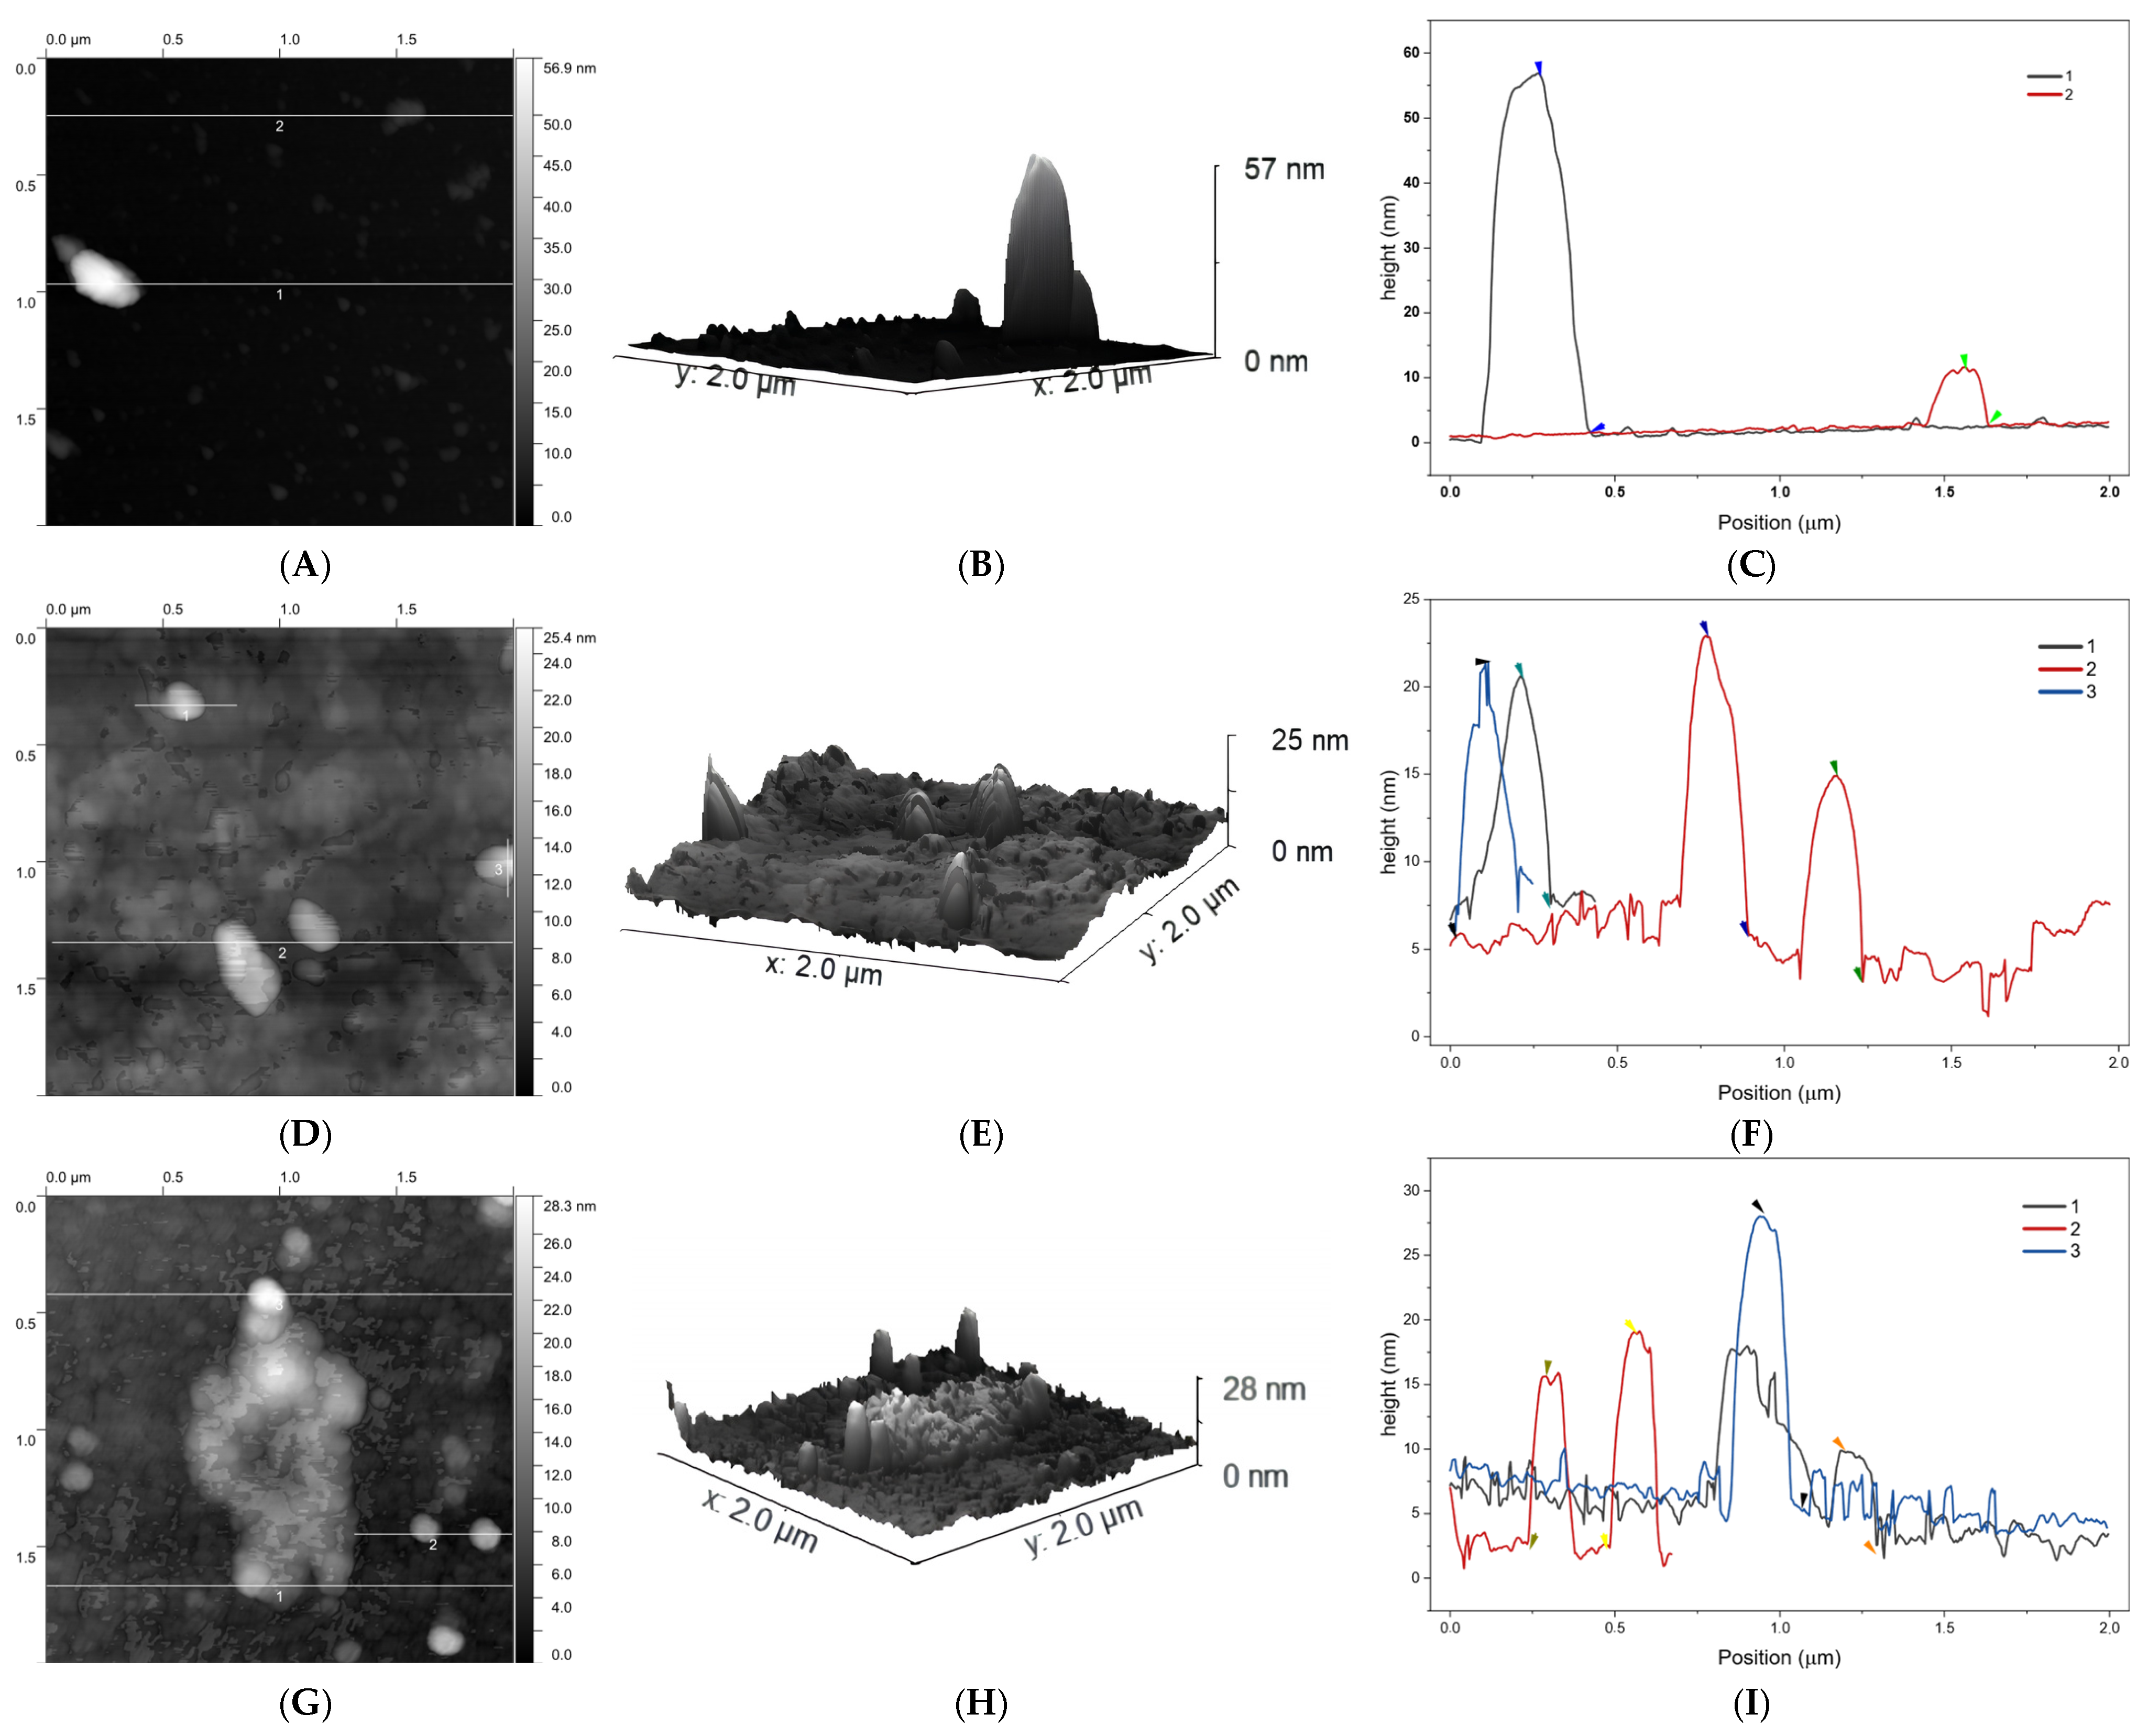
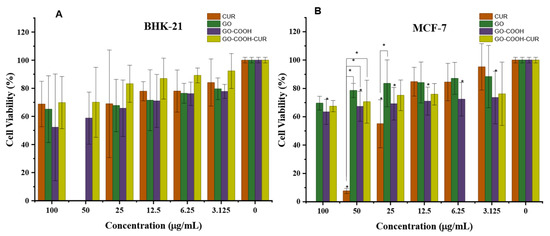
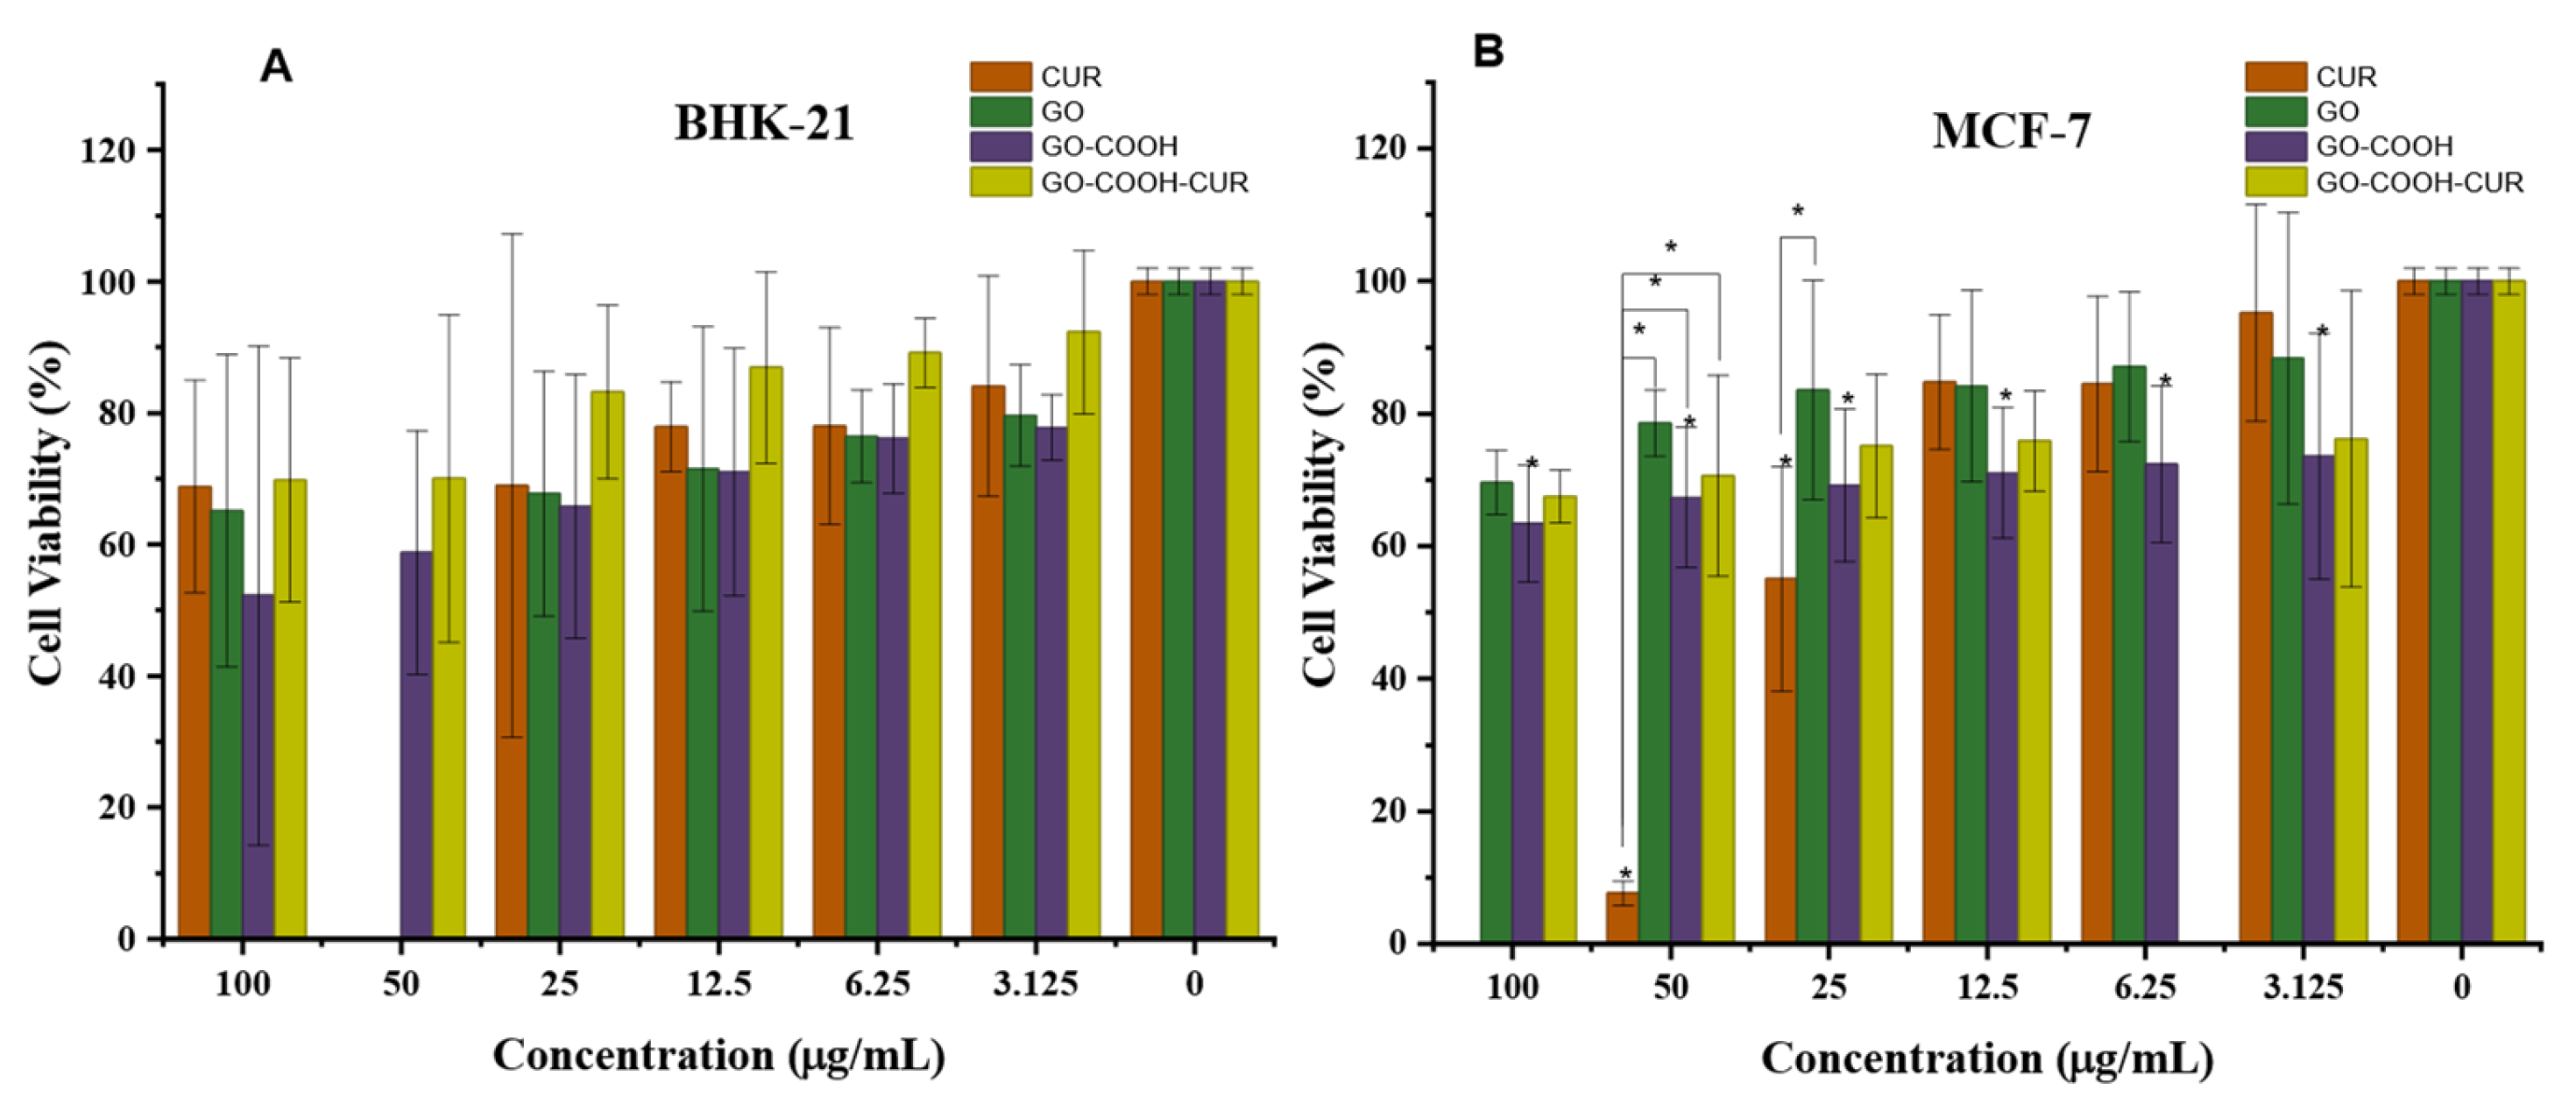
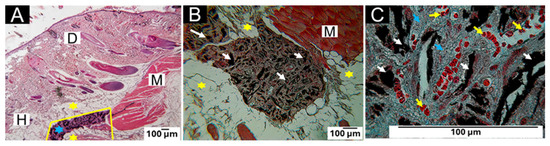
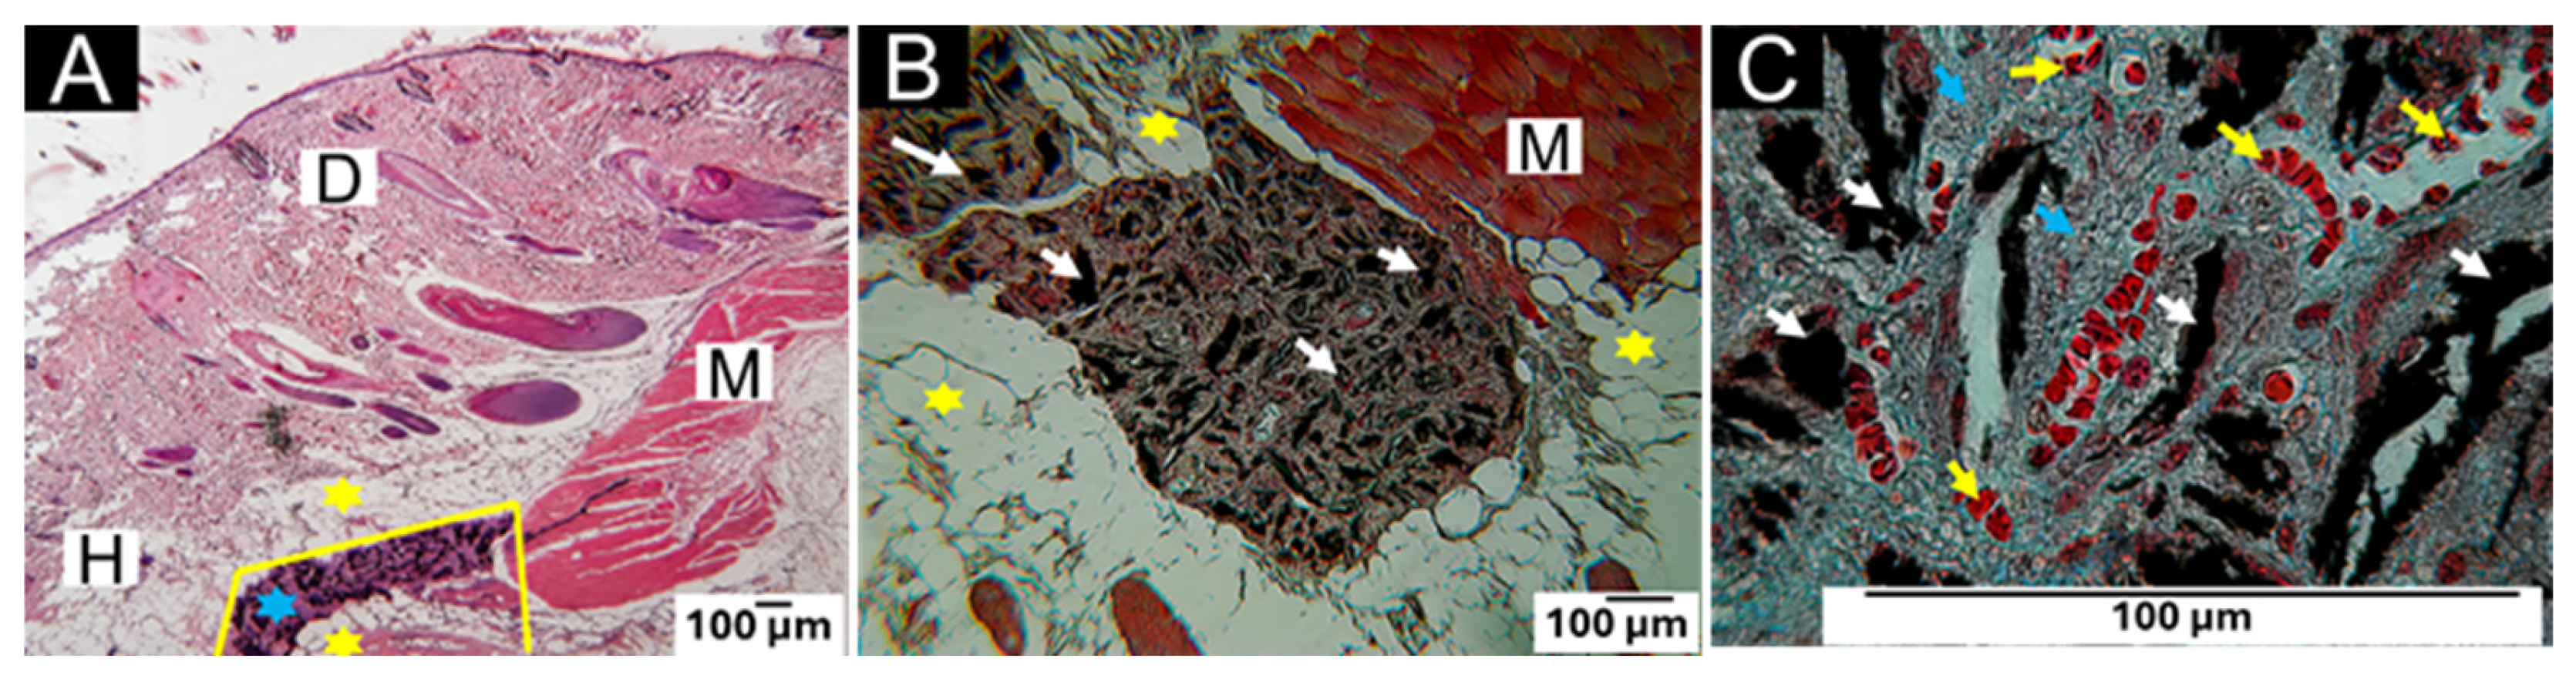
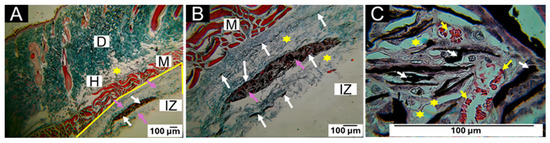
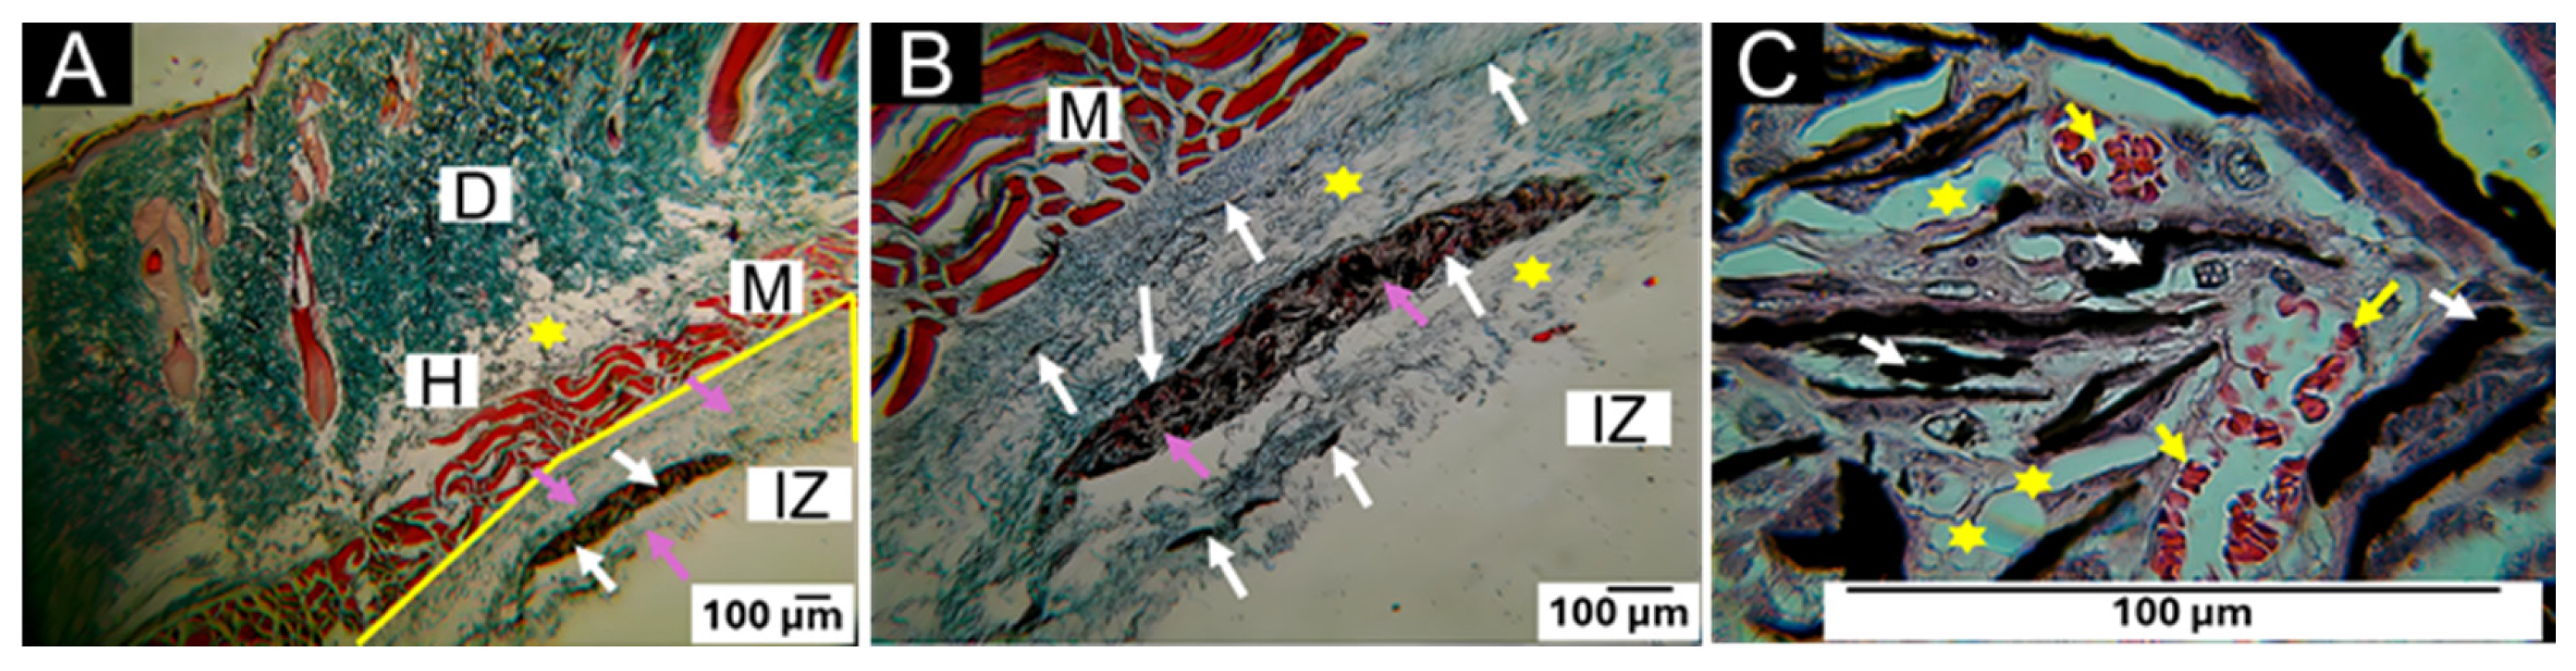
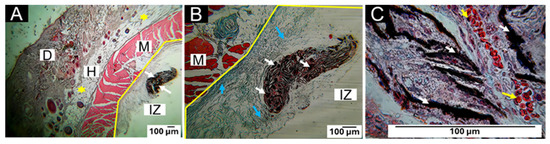
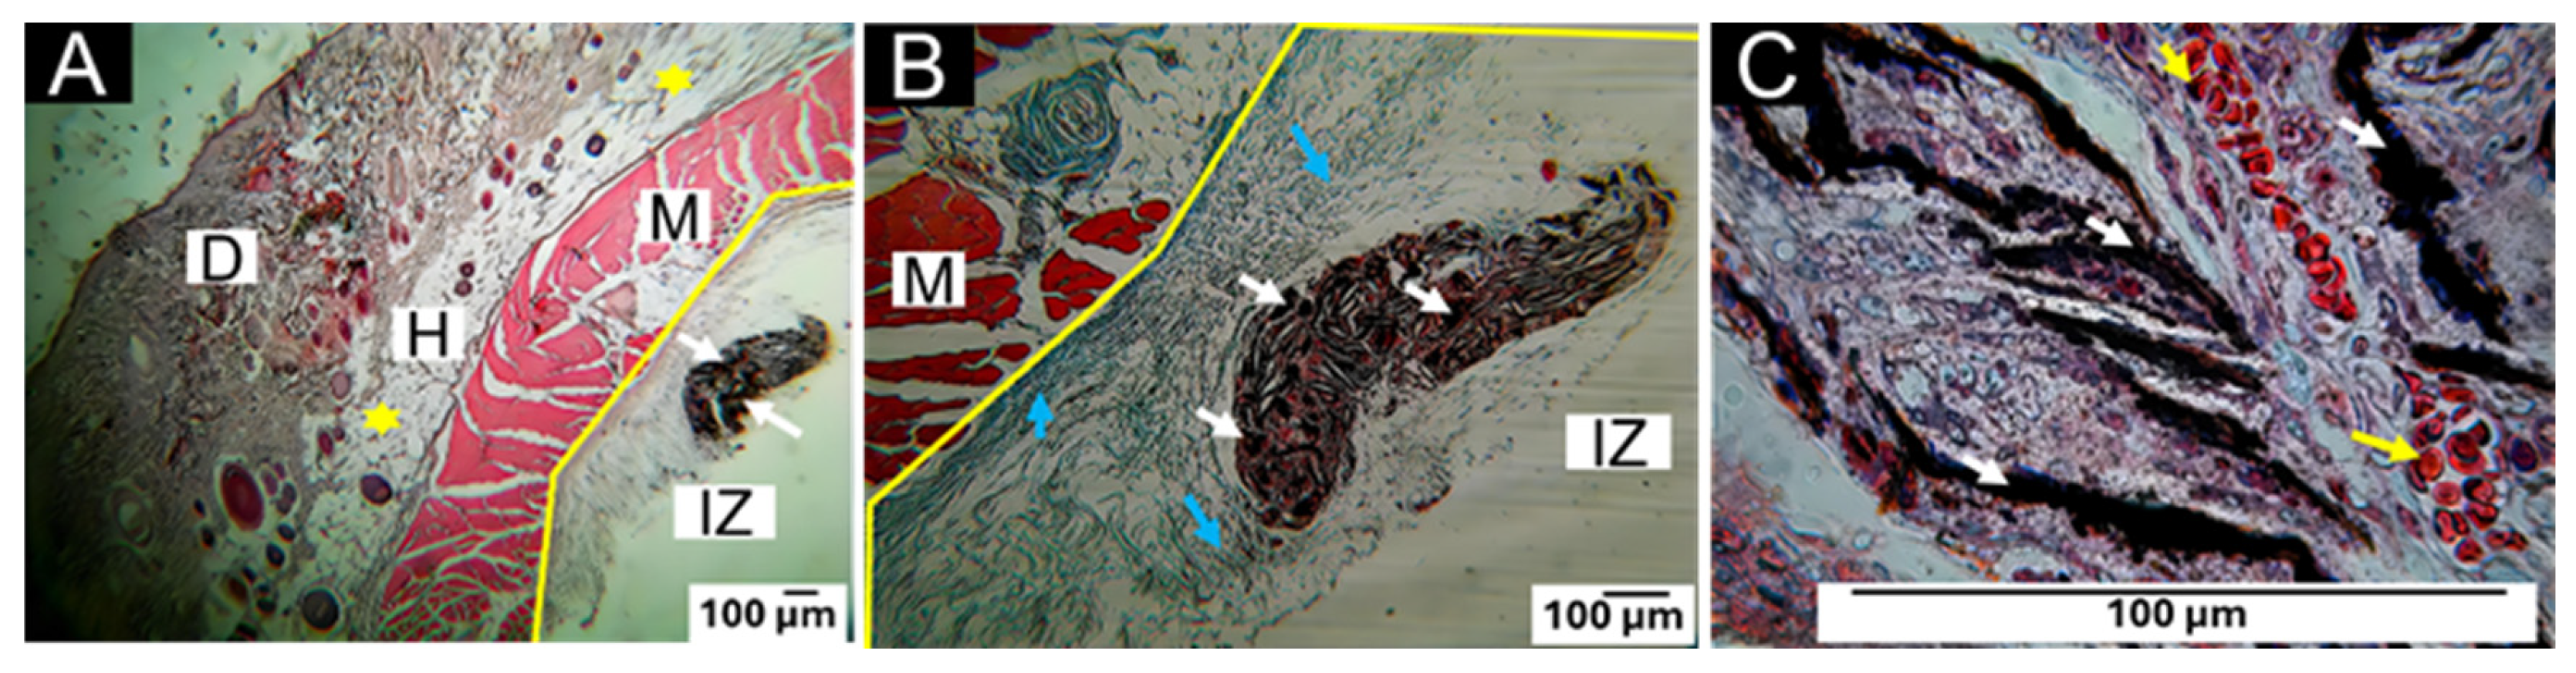

Disclaimer/Publisher’s Note: The statements, opinions and data contained in all publications are solely those of the individual author(s) and contributor(s) and not of MDPI and/or the editor(s). MDPI and/or the editor(s) disclaim responsibility for any injury to people or property resulting from any ideas, methods, instructions or products referred to in the content. |
© 2026 by the authors. Licensee MDPI, Basel, Switzerland. This article is an open access article distributed under the terms and conditions of the Creative Commons Attribution (CC BY) license.