


Abstract
Postnatal depression (PND) is a critical mental health issue that affects approximately one in seven women and has a profound impact on infant bonding and family dynamics. Despite its prevalence, PND often goes undiagnosed as a result of ignorance and stigma. This study uses machine learning techniques to predict PND, offering a novel approach to early detection and intervention. Employing multilayer perceptron (MLP), decision tree, XGBoost, support vector machine (SVM), and logistic regression and KNeighbors, this research aimed to analyze various demographic, medical, and psychosocial factors to identify patterns and predictors of PND. The data was subjected to rigorous model evaluation, where the MLPClassifier emerged as the superior model with an AUC of 0.99, indicating near-perfect predictive capability. The study also explored the model’s practical application by integrating it into a web interface using Streamlit, facilitating real-time prediction and analysis of PND risk, thereby making strides toward enhancing maternal mental health care. The findings of this study not only augment the existing body of literature on PND prediction but also highlight the role of ML as an indispensable tool in advancing healthcare technology. By achieving a high level of accuracy in the prediction of PND, the MLPClassifier model has the potential to significantly improve clinical outcomes for mothers and their families.
1. Introduction
Childbirth is a transformative event involving hormonal, physical, emotional, and psychological changes that extend into the postnatal period, significantly affecting a mother’s well-being and her bond with her infant. While many mothers experience joy, childbirth can also trigger complex emotional responses, such as the “baby blues”, characterized by transient sadness and tearfulness that typically resolve within two weeks [1]. However, for about one in seven women, these feelings escalate into postnatal depression (PND), a severe, persistent condition that impairs daily functioning [2]. PND, distinct from baby blues, emerges four to six weeks postpartum, peaking at two to three months, with symptoms including low mood, fatigue, insomnia, irritability, and reduced functioning (“Postnatal depression”, 2021). It encompasses depressive and anxiety states, marked by irregular sleep, mood swings, appetite changes, excessive worry about the infant, profound sadness, difficulty concentrating, disinterest in activities, and, in severe cases, suicidal ideation [3,4]. PND disrupts maternal confidence and bonding, potentially harming the child’s emotional, behavioral, and cognitive development and straining marital relationships [5].
In the UK, one in ten women experiences PND within six months postpartum, while one in eight faces antenatal depression during pregnancy. Prevalence varies from 10–15% to up to 30%, depending on diagnostic criteria [6,7]. A Royal College of Psychiatrists study found that 25% of women with PND remain symptomatic a year after childbirth. Underdiagnosis is a major barrier, with up to half of affected mothers avoiding help due to stigma, privacy concerns, or lack of support [8]. PND significantly impacts maternal and family well-being, necessitating strategies for prevention, early detection, and treatment [9]. Despite its prevalence and significant impact, a profound lack of awareness and widespread under-recognition of PND’s symptoms persist among the public and even healthcare providers. This often leads to missed opportunities for early intervention, exacerbating its negative outcomes. Early diagnosis is critical but challenging, as symptoms are often overlooked amid postpartum celebration. Recent advancements in machine learning, including predictive AI and deep learning algorithms, use medical data from early pregnancy to enable early PND identification [10]. These technologies show promise in transforming diagnostic approaches by analyzing patterns in medical records and patient data, attracting growing interest from researchers and clinicians.
This study introduces a new machine learning approach that combines physiological, psychological, and social data to predict PND earlier and more accurately than existing methods. Unlike previous work that often uses single data types or traditional statistics [10], our model employs advanced ensemble techniques and feature selection to improve prediction accuracy. We also propose a practical way to integrate these tools into clinical settings, bridging the gap between technology and real-world use. These advancements tackle underdiagnosis and stigma by enabling earlier, data-driven support, improving maternal mental health and mother–infant bonding.
Addressing PND requires combining technology with traditional care to improve detection and support. By raising awareness, reducing stigma, and using advanced diagnostic tools, healthcare systems can better support mothers during this vulnerable time, reducing PND’s long-term impact on families and society. Early intervention, supported by technology and compassionate care, ensures mothers receive timely, effective help for healthier outcomes for both mother and child.
The primary research questions this research has investigated are as follows:
RQ1: How can machine learning models help in analyzing and predicting postnatal depression in women based on a variety of demographic, medical, and psychosocial factors?
RQ2: Is there any relationship between postnatal depression and its impact on infant bonding, with a focus on maternal responsiveness, sensitivity, and attachment behaviors?
RQ3: What are the key predictors of postnatal depression and what is their significance in influencing the severity and duration of PND symptoms?
This research targets postnatal depression (PND) within the first year postpartum, a critical period impacting maternal and infant well-being. Using machine learning techniques, the study analyzes demographic, medical, and psychosocial data to identify PND predictors and patterns. A key focus is PND’s effect on mother–infant bonding, which significantly influences the child’s emotional and developmental outcomes [11]. The objectives include pinpointing risk factors, tracking PND progression, assessing bonding impacts, and exploring interventions. By providing insights into PND, the study aims to enhance clinical practices and support systems for new mothers during this vulnerable period.
2. Related Work
Depression, far from a fleeting condition, profoundly disrupts psychological health, thrusting individuals from normalcy into psychosis. This significant shift demands a deep exploration of its causes through diverse psychological perspectives. Postnatal depression (PND) significantly impacts mothers, infants, and families, marked by emotional turmoil during the postpartum period, a time of intense adjustments [12,13]. Affecting 10–15% of new mothers, PND involves symptoms like mood swings, sleep issues, and agitation, disrupting mother–infant bonding and risking infant development [8,14].
PND also increases paternal depression risk, straining marital relationships and family bonds [4]. Children face developmental delays, reduced activity, and altered cortisol, serotonin, and dopamine levels [3]. Early identification and management, including screening during the perinatal period as recommended by ACOG, are critical to mitigate PND’s severity [15]. Timely intervention and support from healthcare providers and families foster a nurturing environment, enhancing mother and child well-being and strengthening family resilience against PND’s multifaceted challenges.
- a.
- Determinants of Postnatal Depression
Younger mothers (18–24) face a higher risk of postnatal depression (PND), with 30–40% of those with prior mood disorders affected [6]. Socio-economic disadvantages, including low income and education, increase PND risk [16]. Obstetric factors like emergency cesareans, unwanted pregnancies, and early discharge elevate risk [17]. Biological factors, including hormonal changes and iron deficiency anemia, contribute to PND, though hormonal links remain inconsistent [18]. Negative life events, such as violence or stress, are strongly linked to PND [19]. Lack of spousal or social support, marital stress, and pediatric illness exacerbate symptoms [6]. Cross-cultural studies show varying PND rates, with cultural factors influencing symptom expression, necessitating culturally sensitive approaches [20].
- b.
- Machine Learning for Mental Health Prediction
Machine learning employs advanced statistical methods to create improving systems, originating with Alan Turing’s 1950s AI proposal [21]. Techniques like support vector machines, random forests, and neural networks predict and classify events [22]. Supervised learning, widely used in medical illness prediction, relies on structured training data with labeled instances, while unsupervised learning predicts without guidance, though its clinical use is limited. Mental illness, impacting emotions, cognition, and social interactions, underscores the need for innovative prevention and intervention.
- c.
- Predictive Modeling of Postnatal Depression
Clinical prediction models use patient data to assess risk, enabling tailored interventions to improve outcomes and reduce costs [23]. Clinical prediction models for postpartum depression (PPD) use patient data to assess risk, enabling tailored interventions to improve outcomes and reduce costs [24]. Zhang et al. developed a PPD model using pregnancy data, comparing four ML models [10]. SVM and FFS-RF performed best (sensitivity 0.69, AUC 0.78), with random forest highlighting psychological elasticity, third-trimester depression, and economic level as key predictors.
Pilot projects using electronic health records showed ML’s efficacy in PPD prediction, identifying risk factors like demographics, mental health, and prior depression [25]. Mobile apps with predictive algorithms advanced PPD prediction [10,26] Andersson et al. compared algorithms (e.g., Naïve Bayes, Ridge Regression), with XRT achieving 72% accuracy and 79% AUC, though sensitivity and PPV varied [25]. Maternal mood and infant sleep are linked, with depression disrupting bonding and causing infant sleep issues [27]. PPD risk factors include prior depression, family history, poor support, and pregnancy complications [28]. Predictive modeling remains underexplored. The literature shows ML and deep learning, including convolutional neural networks, achieve promising PPD detection results with high precision, accuracy, recall, and AUC. Integrating ML algorithms enables faster PPD detection, diagnosis, and treatment. Using the Streamlit application, this study employs supervised learning to predict PPD accurately while ensuring model transparency and interpretability.
Recent advances in deep learning for healthcare have demonstrated diverse architectural strategies for clinical prediction and grading tasks. He et al. proposed an isolation forest-voting fusion-multioutput framework for stroke risk classification that integrates anomaly detection with multidimensional decision fusion [29], achieving strong performance on structured electronic medical record data but requiring complex preprocessing for composite feature scoring. In contrast, our ensemble neural network approach operates directly on questionnaire-based categorical data without anomaly detection stages. For histopathological image analysis, transformer-based architectures have gained prominence. ViT-AMCNet combines vision transformers with attention-mechanism convolution blocks through adaptive model fusion and multiobjective optimization, achieving interpretable laryngeal tumor grading with excellent generalization [30]. However, ViT-AMCNet relies on high-resolution image inputs and multiobjective optimization complexity that may limit deployment in resource-constrained clinical settings. Subsequently, MamlFormer employs manifold adversarial multimodal learning to fuse high- and low-magnification pathology images, demonstrating superior interpretability through manifold subspace projection that eliminates background semantic redundancy [31]. While MamlFormer excels at multimodal image fusion, its reliance on paired magnification views and adversarial training increases computational demands. More recently, Huang et al. proposed FDTs, a feature disentangled transformer for squamous cell carcinoma grading that achieves interpretability through explicit feature separation rather than class-patch token mapping [32].
Despite known risk factors, a significant research gap exists in the proactive, early identification of postnatal depression (PND) using scalable technological solutions. There is a pressing need for accessible tools that can synthesize the multifaceted determinants of PND into a practical risk assessment for use in diverse healthcare settings. This study aims to bridge this gap by developing an interpretable machine learning model deployed via a user-friendly application to facilitate timely and actionable PND screening.
3. Methodology
The study utilizes six different machine learning methods, such as support vector machine (SVM) and logistic regression, decision tree, XGBoost, multilayer perceptron (MLP), and KNeighbors to analyze and predict postpartum depression. It involves an initial phase of data gathering and preprocessing, followed by application of the six ML models to the dataset to identify patterns and predictors of postpartum depression. Hyperparameter tuning is conducted to maximize the performance of the chosen model. The best-performing model, determined through rigorous evaluation metrics, is then integrated into a web page, allowing for real-time prediction and analysis of postpartum depression risk based on input data. This design demonstrates comprehensive use of machine learning techniques to address a critical mental health issue, with practical application through a user-friendly web interface. The data used in this research came from a publicly accessible source, Kaggle (https://www.kaggle.com/datasets/parvezalmuqtadir2348/postpartum-depression (accessed on 10 March 2025)), and specifically from the project titled “Postpartum Depression”. The data represents a comprehensive collection aimed at understanding the various factors that may contribute to postpartum depression (PPD) as explained in Table 1. It is structured to facilitate the use of predictive analysis methods with machine learning which consists of responses from a survey related to postpartum depression, capturing various symptoms and feelings experienced by individuals after childbirth. It contains 1503 entries (rows) and 10 columns. Each column represents a different variable related to postnatal factors such as age, emotional well-being, sleep patterns, appetite, anxiety, bonding with the baby, and suicide attempts.
Table 1.
Summarizes dataset (variable names, types, range, how encoded).
3.1. Data Preprocessing
The analysis begins by importing necessary libraries for data manipulation and visualization, including pandas, numpy, seaborn, and matplotlib. This setup is essential for exploring and preprocessing the data. The dataset is loaded into a panda DataFrame, mirroring the initial step performed. Any rows with missing values are removed from the dataset with df.dropna (inplace = True). The total observation was reduced from 1503 to 1491. This approach is straightforward and ensures that the dataset used for model training does not contain any incomplete records.
3.2. Machine Learning Model
The dataset was split into 80% training and 20% testing sets to accurately assess model performance. Six ML algorithms were trained on the data, with “feeling anxious” as the target variable and predictors including “Age”, “Feeling sad or Tearful”, “Irritable towards baby & partner”, “Trouble sleeping at night”, “Problems concentrating or making decisions”, “Overeating or loss of appetite”, “Feeling of guilt”, “Problems of bonding with baby”, and “Suicide attempt”. Trained models were tested on the testing dataset to evaluate their generalization to unseen data. Performance was assessed using classification metrics like accuracy, precision, recall, and F1 score. The Receiver Operating Characteristic (ROC) curve and Area Under the Curve (AUC) evaluated class distinction capability. Selection balanced accuracy, interpretability, and computational efficiency. K-fold cross-validation mitigated overfitting, and the best model was refined via hyperparameter tuning and validated on a separate dataset.
3.3. Model Comparison Metrics
These metrics are important for evaluating and comparing the performance of machine learning models in predicting postpartum depression, ensuring that the selected model is both accurate and reliable. Accuracy measures the ratio of accurately predicted instances to total instances, which indicates the model’s overall correctness. A high accuracy rate suggests that the model works well for both PPD and no PPD classes. Sensitivity (Recall) measures the proportion of actual positives (women who develop PPD) correctly identified by the model. High sensitivity is crucial for ensuring that most women at risk are not missed. Specificity measures the proportion of actual negatives (women who do not develop PPD) correctly identified. High specificity indicates that the model effectively identifies those who are not at risk, reducing false positives.
Positive Predictive Value (PPV) shows the likelihood that those who receive a positive screening test actually have the illness. In the context of PPD, it is the likelihood that women predicted to be at risk actually develop PPD. For Negative Predictive Value (NPV), the likelihood that an individual with a negative screening test does not have the ailment is indicated by NPV. Area Under the Curve (AUC) demonstrates the model’s capacity to distinguish between positive and negative classes. An AUC close to 1 indicates a high model performance, where it correctly classifies those with and without the risk of PPD.
3.4. Statistical Analysis
Before conducting the statistical analysis, categorical variables were transformed into numerical formats using the LabelEncoder from Scikit-learn in Python 3.13. This encoding process is essential for applying machine learning algorithms, which require numerical input. The encoding was applied to all columns except the first one, likely to convert responses such as “Yes”, “No”, “Sometimes”, etc., into a numerical format that algorithms can process.
3.5. Explorative Data Analysis
Table 2 presents the summary statistics of the modified dataset for the postpartum depression study, highlighting key findings. Participants’ ages vary, with a mean of 38.17 years and a standard deviation of 6.45 years. Emotional and behavioral symptoms, such as feeling depressed, tearful, agitated with the infant or partner, and difficulty sleeping, show a mean score near 1, indicating moderate prevalence among participants. “Feeling anxious” has a lower mean (0.649) with less variability, suggesting widespread anxiety. Conversely, “Overeating or loss of appetite” has the lowest mean (0.668), indicating lower prevalence or intensity. All variables are capped at a maximum value of 2, reflecting a standardized scale for analysis. These statistics provide a foundation for machine learning analysis, capturing the diverse postpartum depression symptoms in the study population.
Table 2.
Summary statistics of the transformed data.
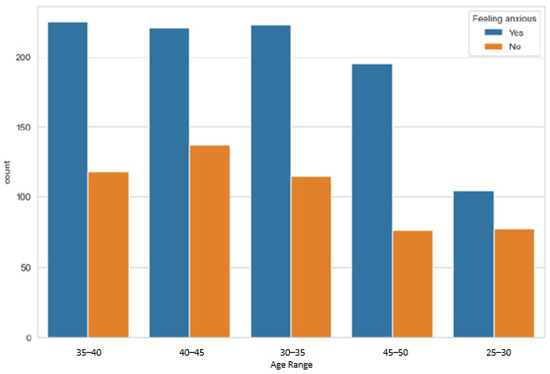
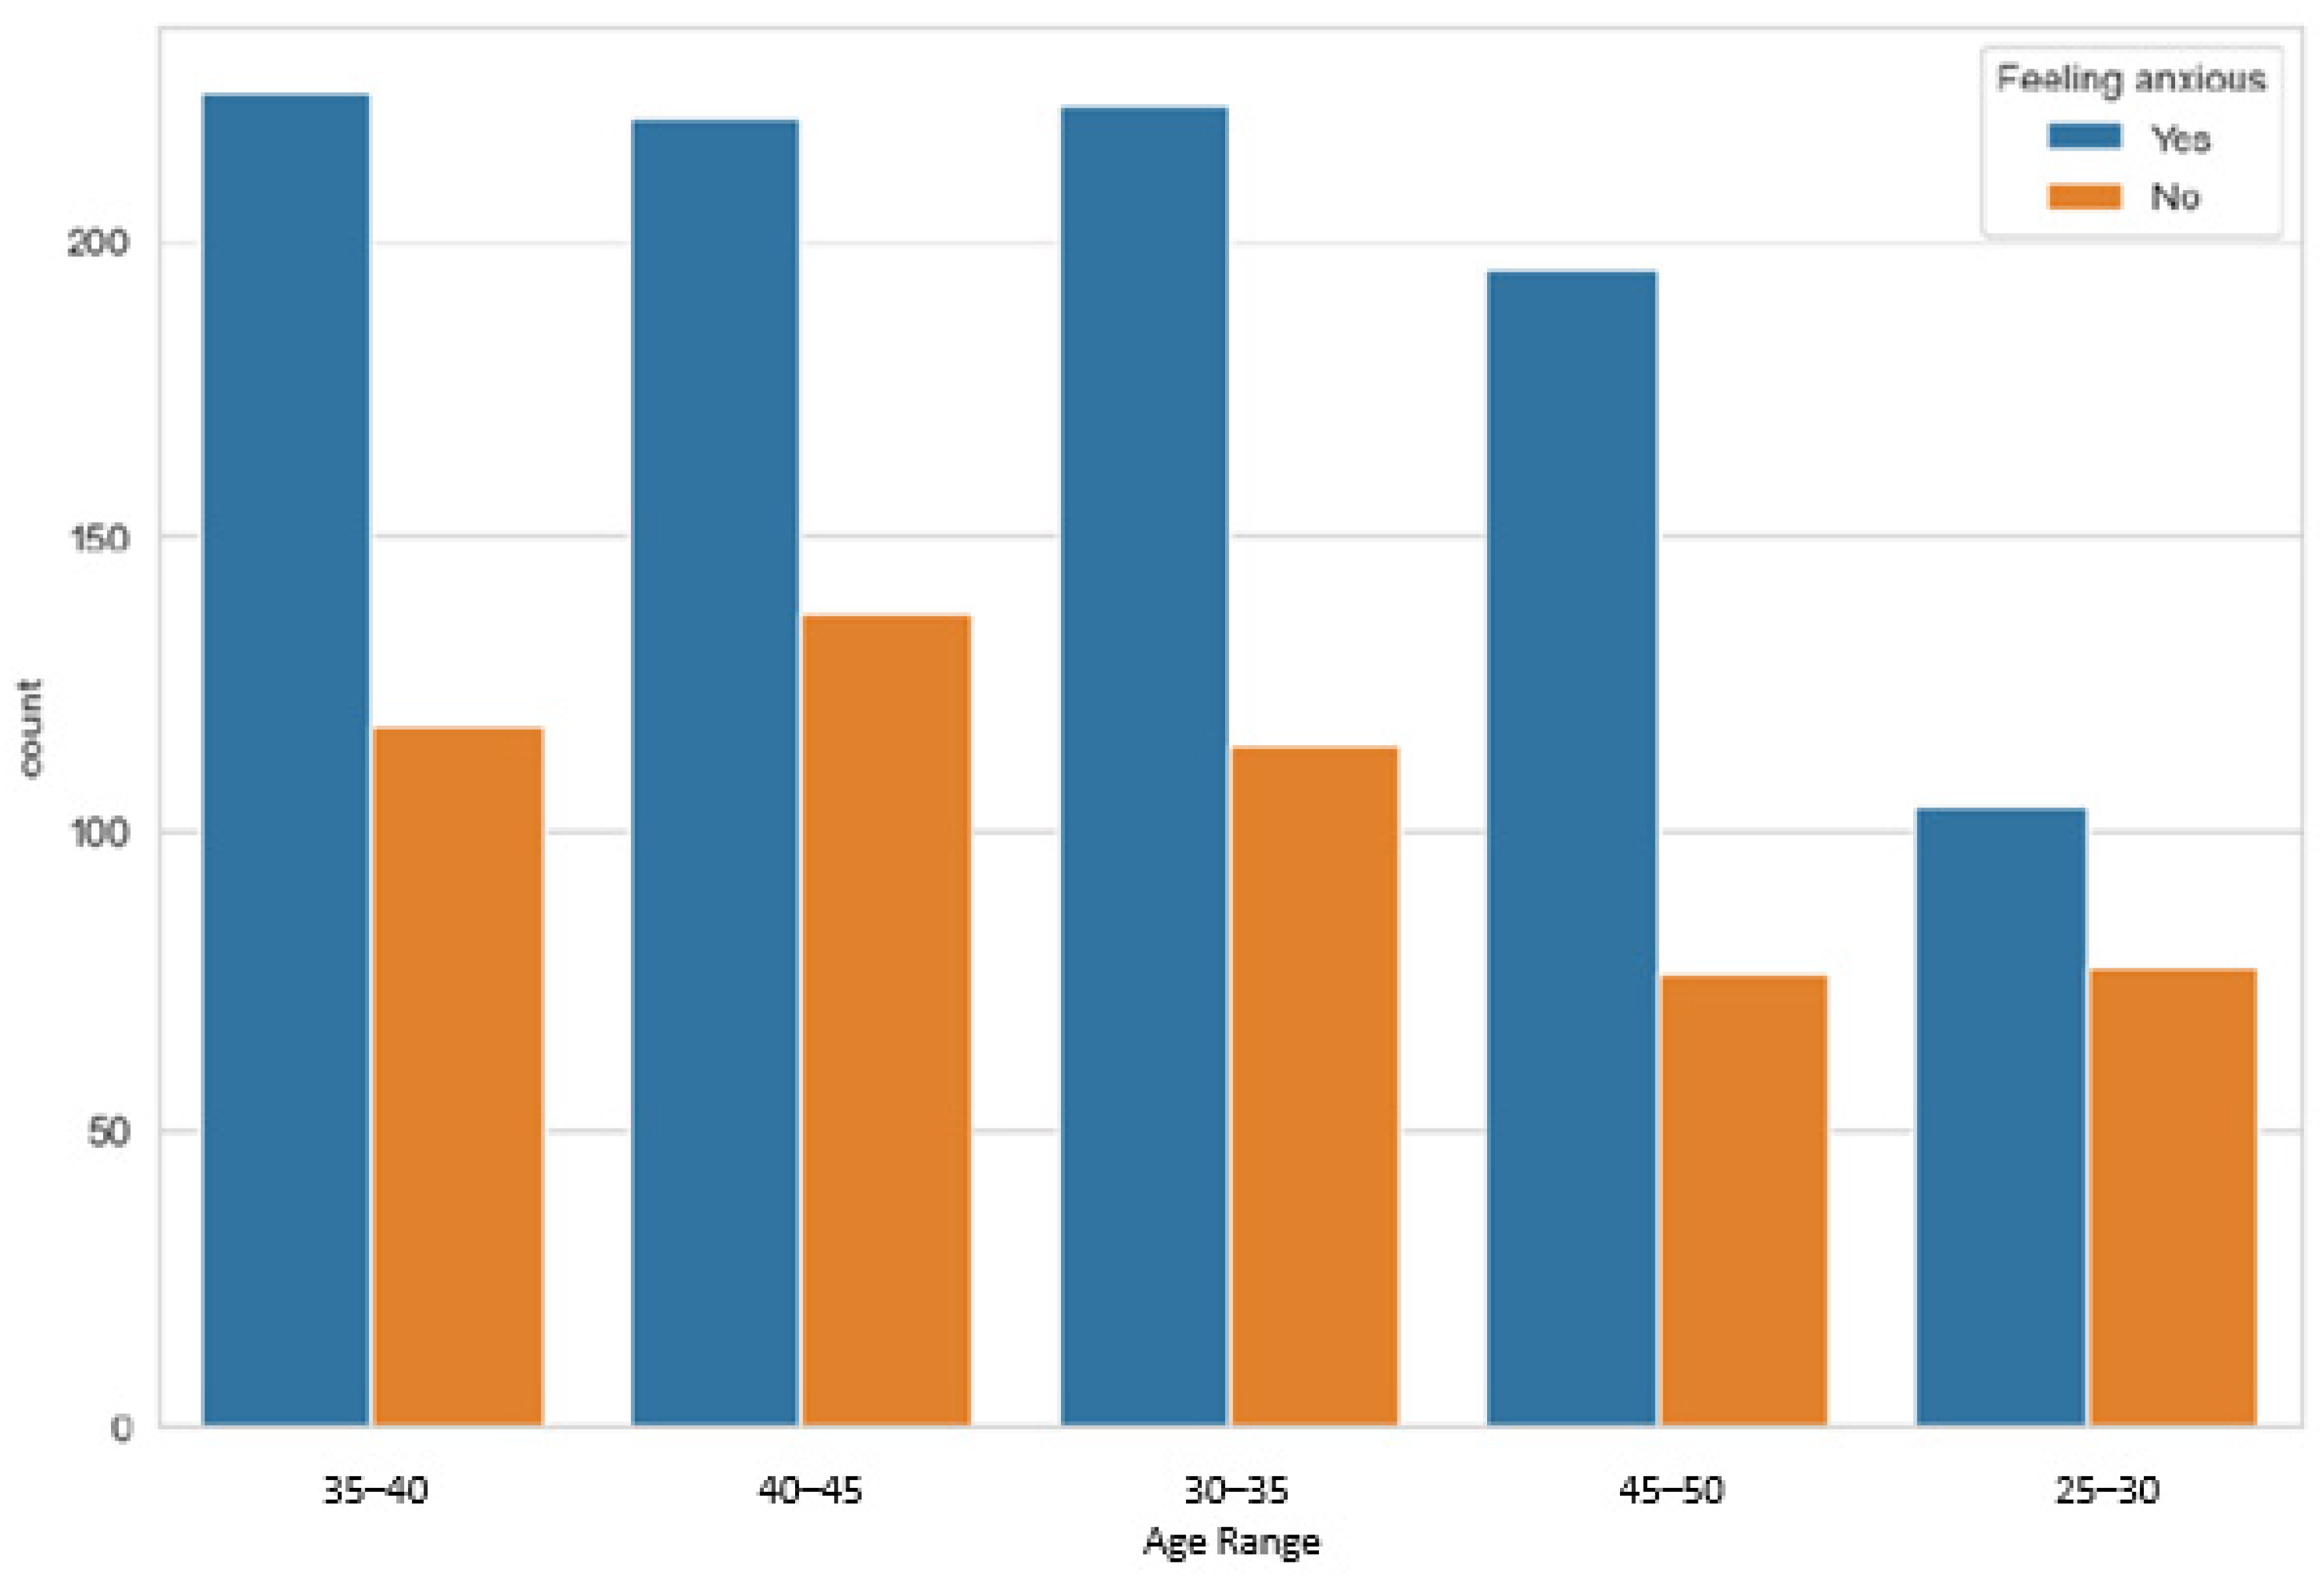
Table 3 details the number of participants by age range for the study on predicting postpartum depression. It reveals a progressive increase in participants, counting to the 40–45 age range, followed by a decrease in the oldest age group. Specifically, there are 181 participants aged 25–30, indicating the youngest cohort. This number rises in each subsequent age group, with 338 participants in the 30–35 age range, 343 in the 35–40 range, and peaking at 358 participants in the 40–45 age range. Beyond this peak, the count declines to 271 participants in the 45–50 age range. This distribution suggests a broad representation across middle adulthood, with a particularly strong representation from individuals in their late thirties to early forties. The bar graph in Figure 1 displays the number of study participants by age range and their anxiety levels. The 35–40 and 40–45 age group have the most participants, with those feeling anxious outnumbering those not anxious. The 30–35 age group follows, with a higher proportion reporting anxiety.
Table 3.
Number of study participants by age range.
Figure 1.
Distribution of age range by feeling anxious.
The 45–50 age range shows a similar trend but with fewer participants. The 25–30 age group has the fewest participants, with a minority not feeling anxious, suggesting younger participants are less represented but more likely to report anxiety. Overall, anxiety levels are balanced across age ranges, with a slight increase in the 30–35 age brackets.
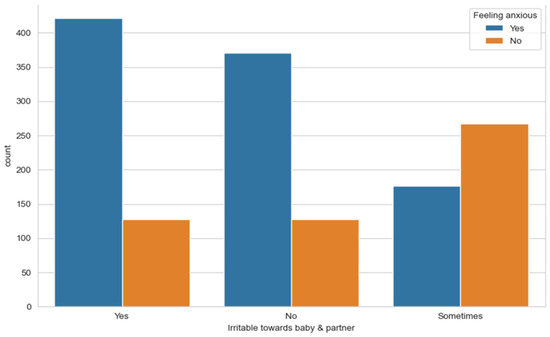
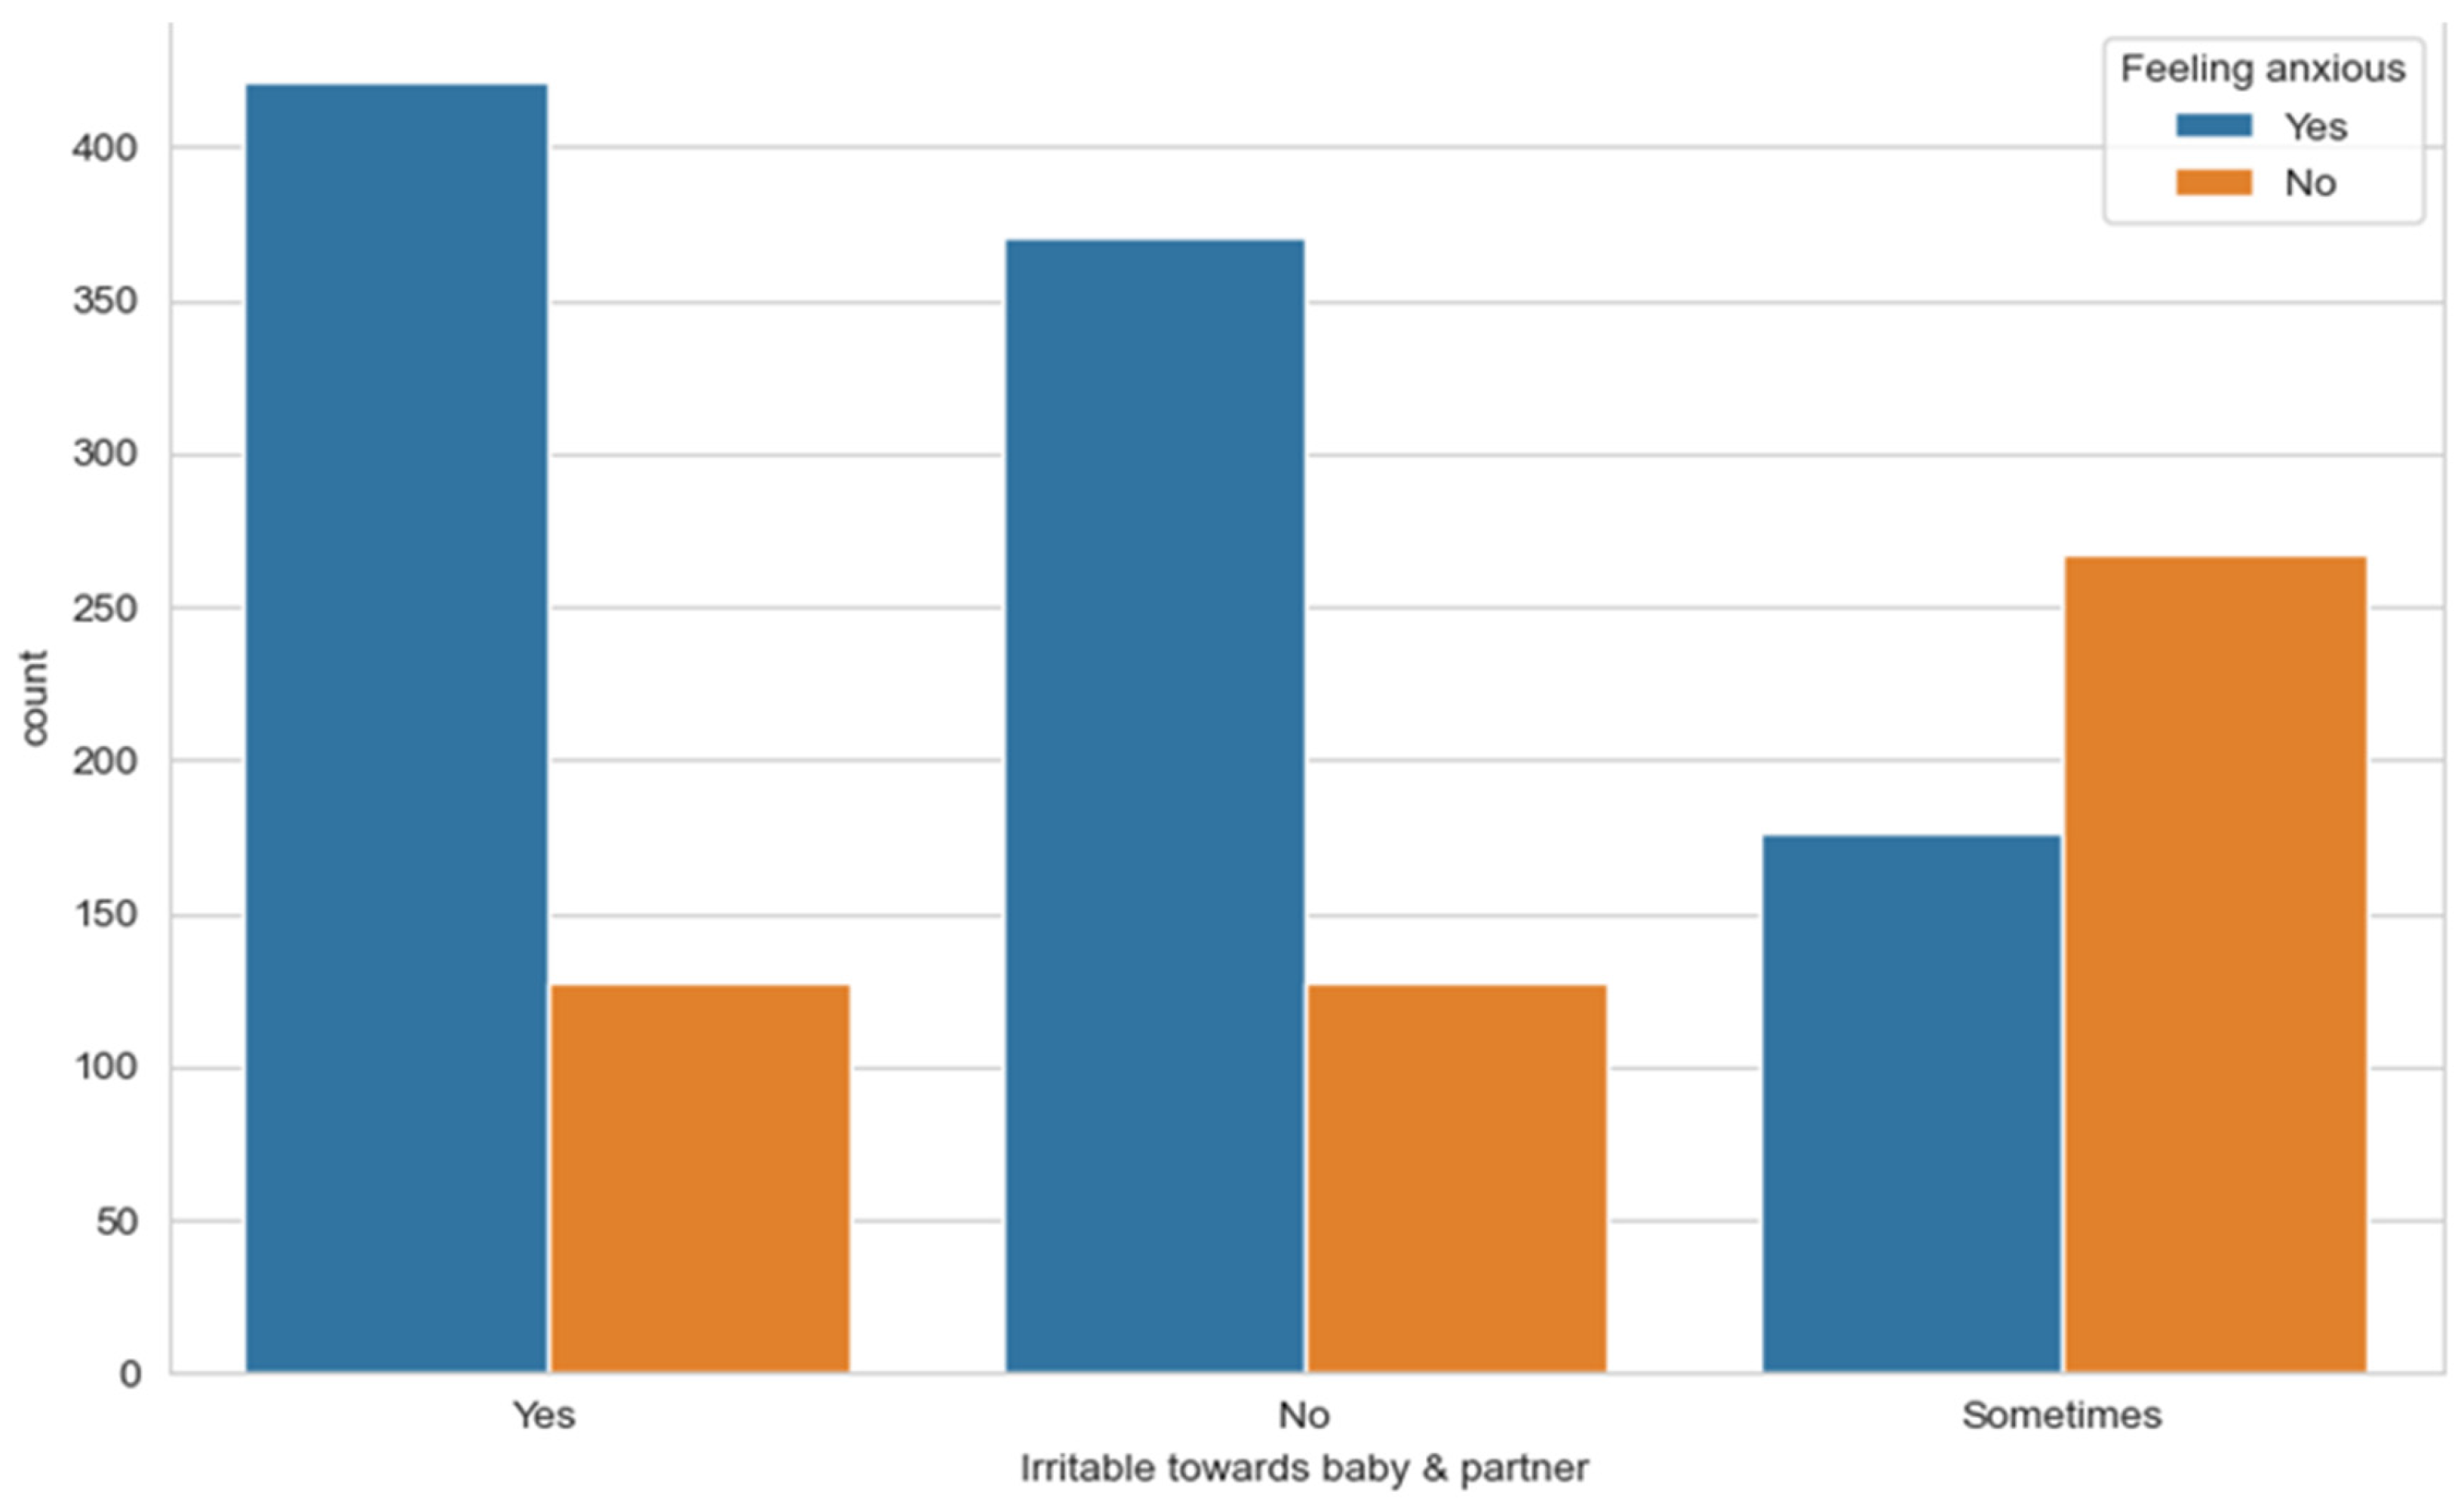
From Figure 2, among mothers who sometimes have irritation toward their babies and partners, there is a higher number of those who are not feeling anxious to those feeling anxious.
Figure 2.
Distribution of irritation towards baby and partner by feeling anxious.
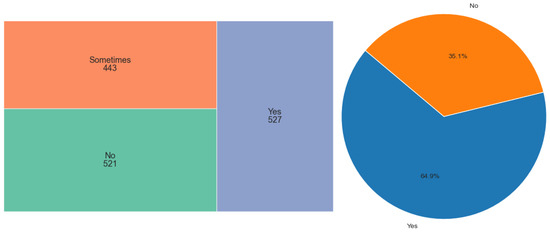
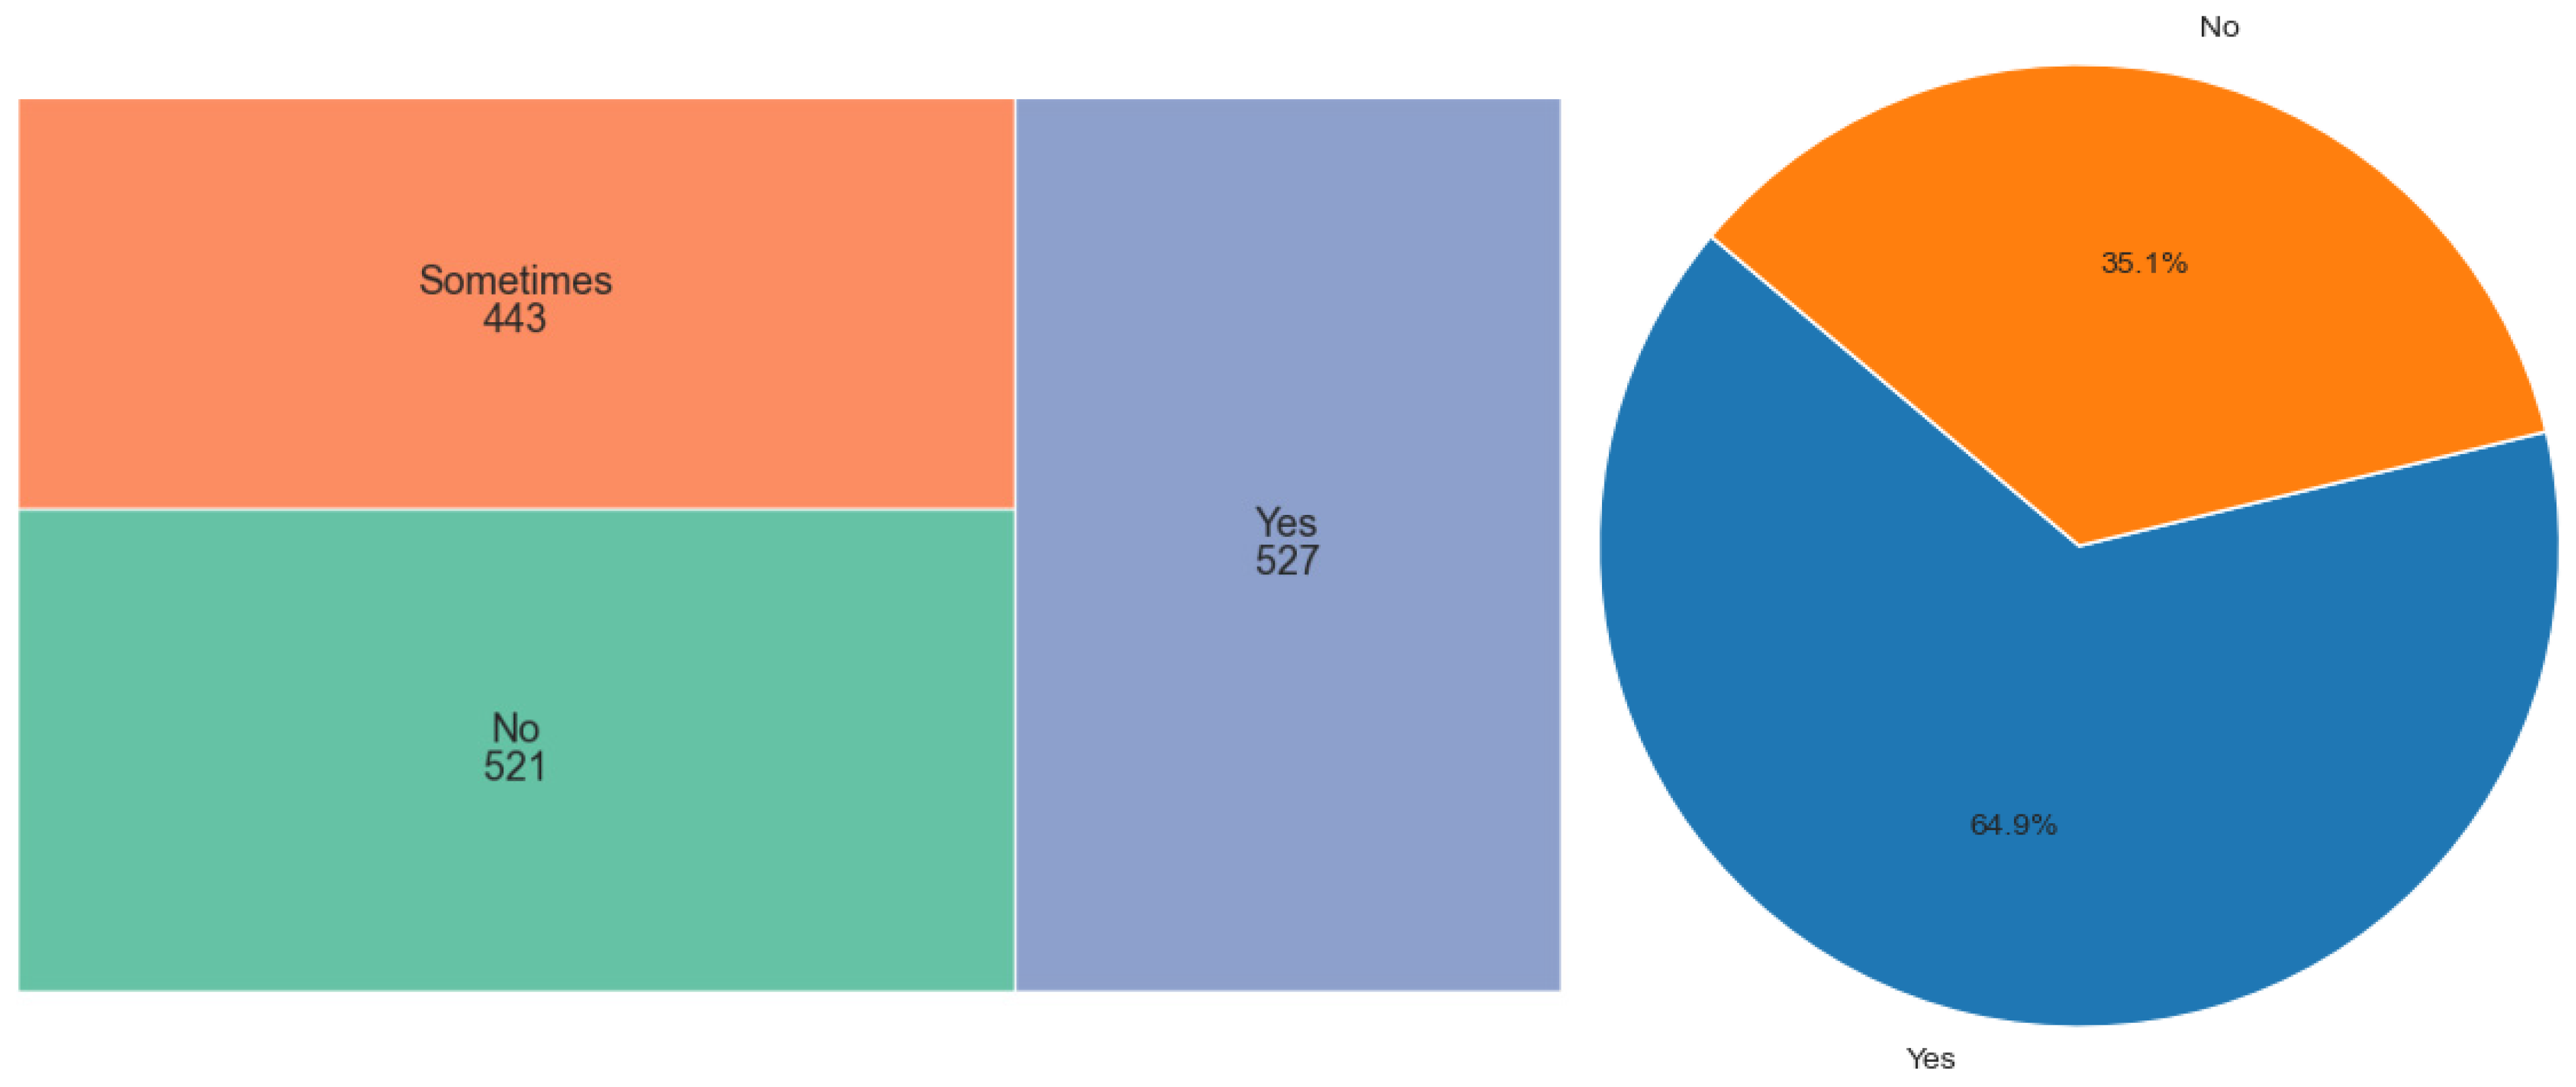
In terms of feeling sad or tearful, the data appears to be balanced with the feeling sad or tearful (Yes) having the highest number. In Figure 3, 64.9% of participants were feeling anxious and 35.1% were not feeling anxious.
Figure 3.
Distribution of participants by feeling sad or tearful; patients feeling anxious.
3.6. Correlation Analysis
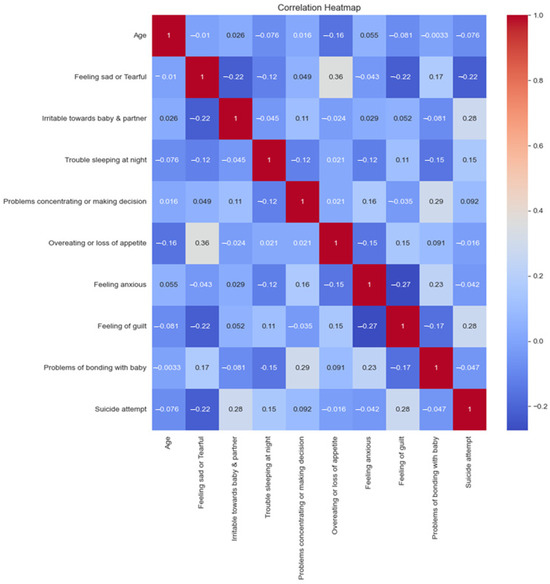
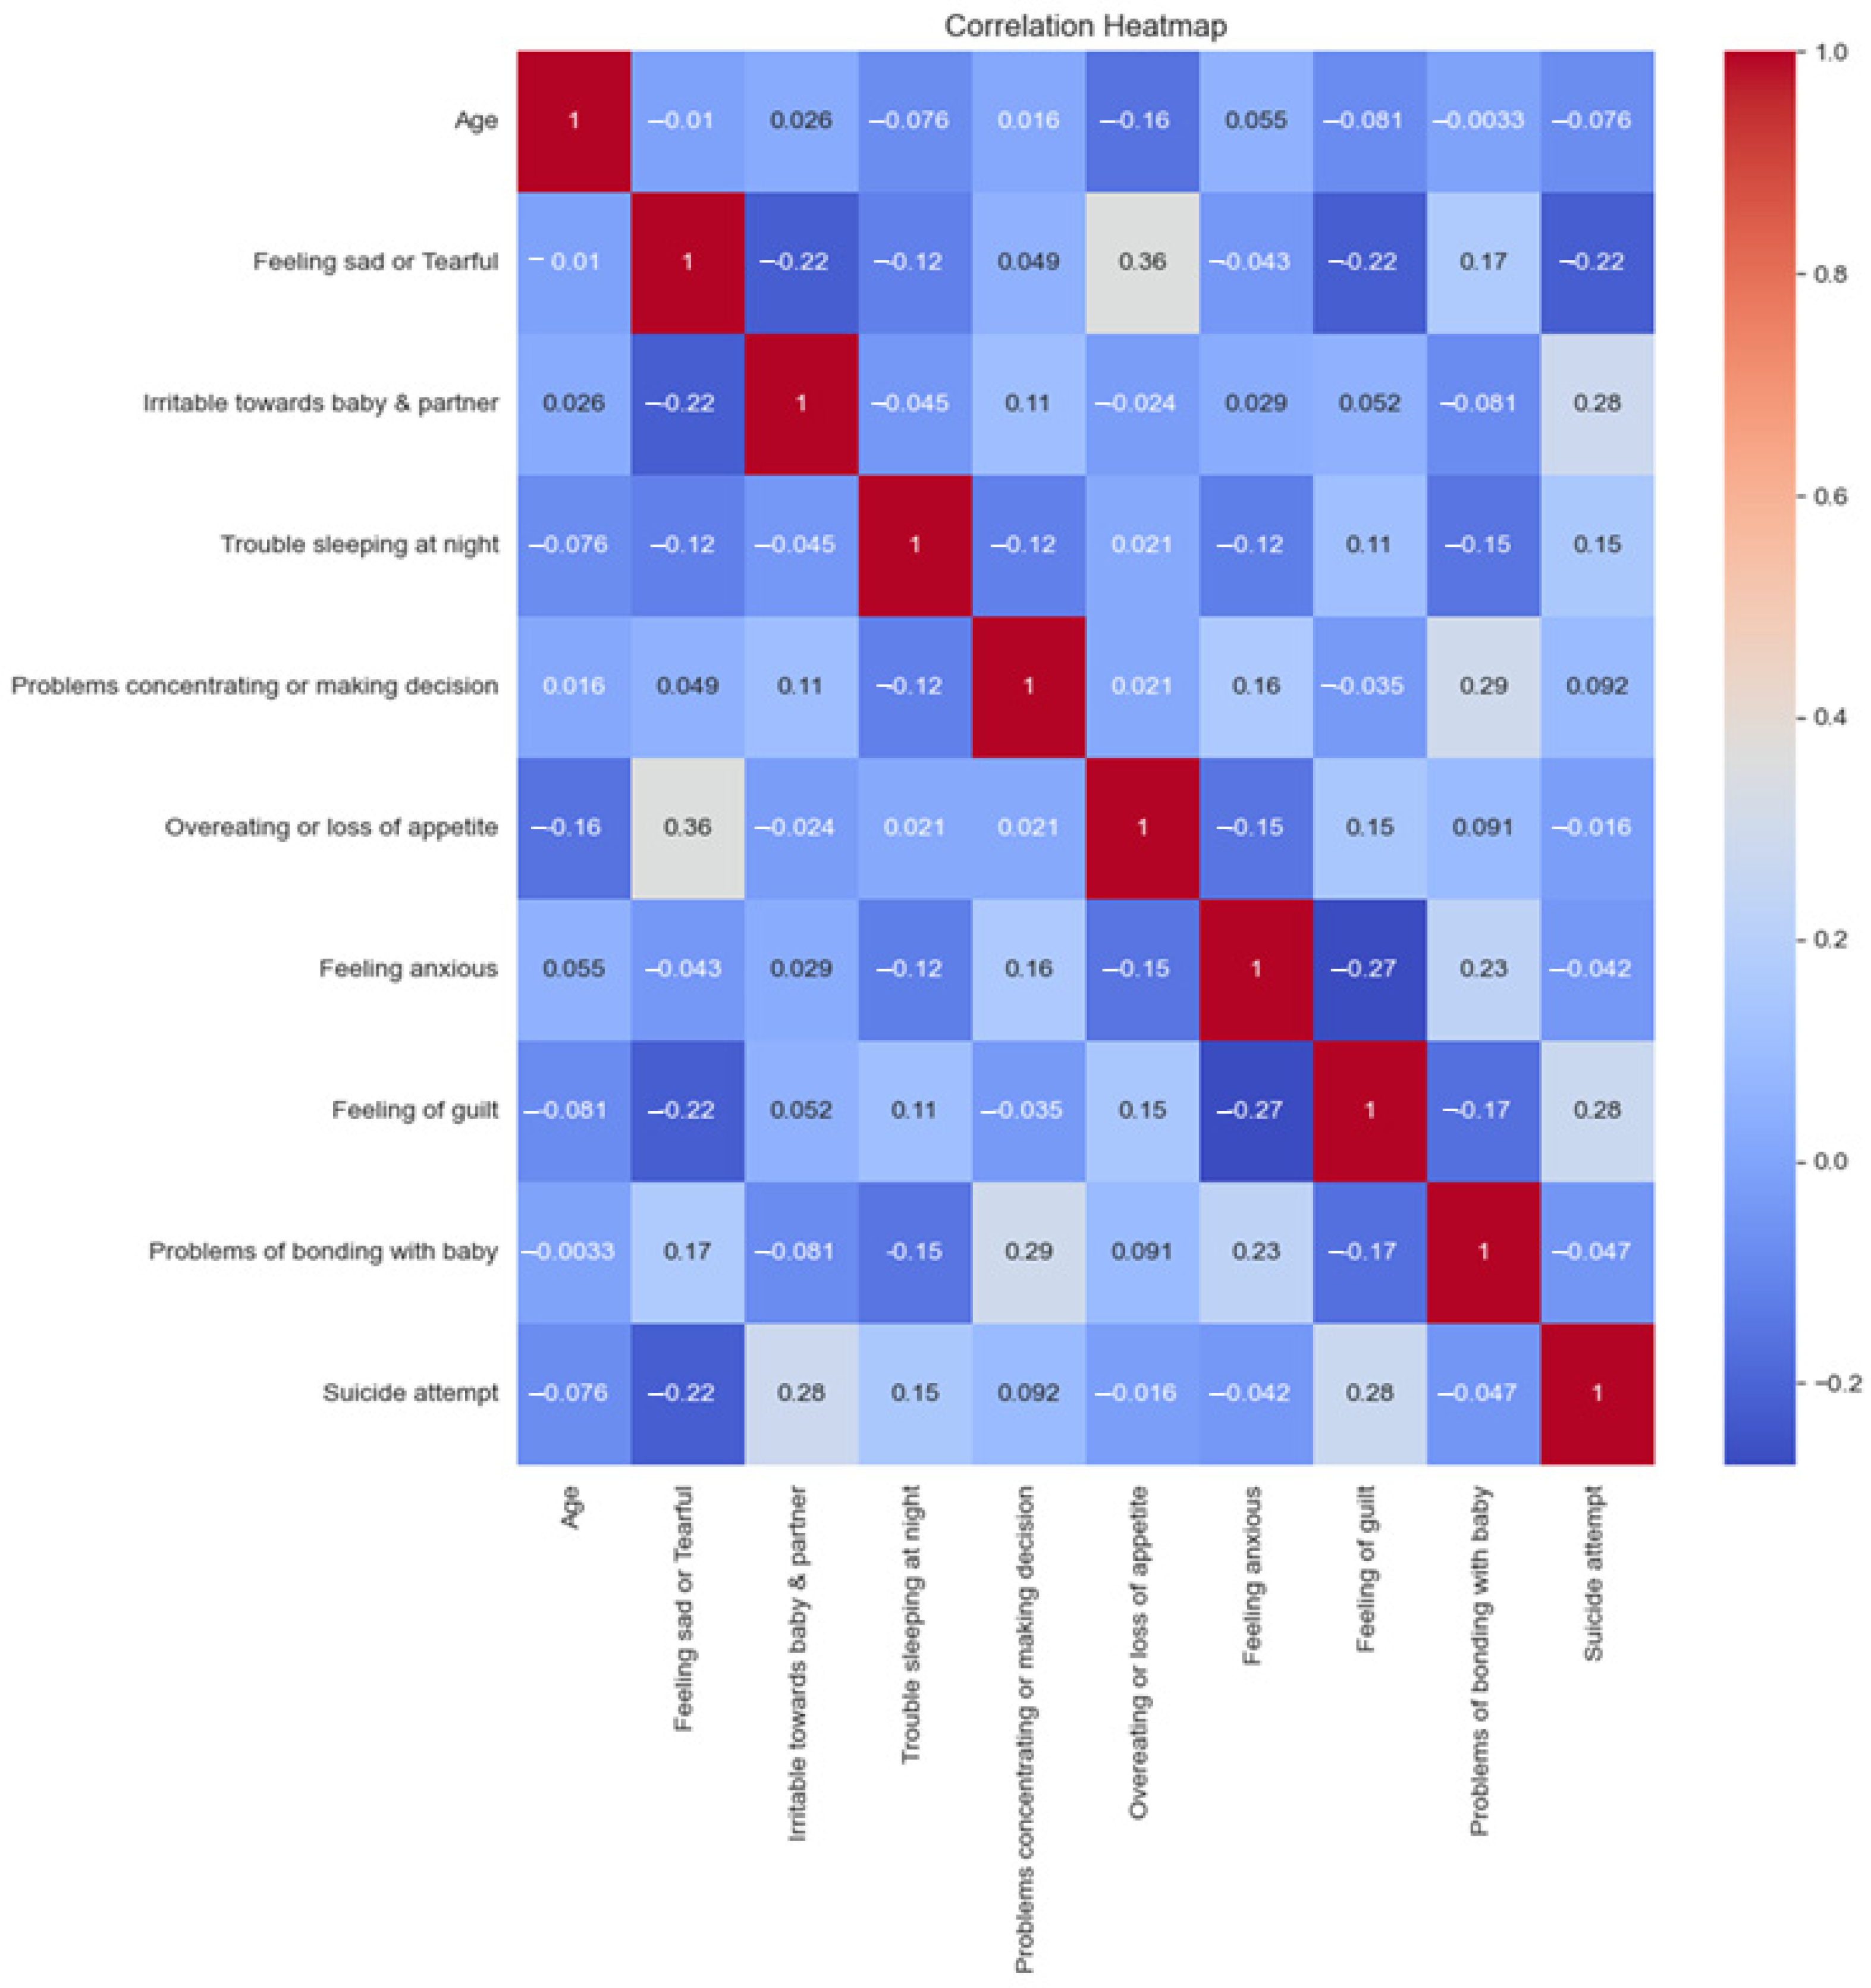
A correlation analysis was conducted to investigate the connections among the encoded variables. The correlation matrix (Figure 4) shows the direction and intensity of correlations between several factors associated with postpartum depression in women. “Feeling sad or Tearful” or “Overeating or loss of appetite” have a significant correlation (0.3595), indicating that individuals who feel sadder or more tearful are likely to experience changes in appetite. There is a notable positive correlation between “Irritable towards baby & partner” and “Suicide attempt” (0.2791), suggesting that irritability towards one’s baby and partner could be linked to a higher chance of suicide attempts. These correlations highlight the intertwined nature of emotional states and behaviors, and, as a result, stress the importance of addressing these issues holistically in healthcare and psychological support settings.
Figure 4.
Correlation matrix of encoded variables.
4. Implementation of Models and Results
This model estimates the probability of occurrence (in this case, the risk of developing PPD) by using a logistic function. It is straightforward, interpretable, and useful for understanding the influence of several independent variables on the outcome.
The logistic function is of the form:
where is a location parameter (the midpoint of the curve, where ) and is a scale parameter.
The result in Table 4 provides a detailed analysis of the logistic regression performance on the postnatal data. Precision measures the ability of models to correctly identify positive (1) and negative (0) instances. The precision for class 0 is 0.79, indicating that 79% of the instances predicted as 0 were 0. The precision for class 1 is 0.73, meaning that 73% of the instances predicted as 1 were actually 1. Recall, also known as sensitivity or true positive rate, assesses the model’s ability to correctly capture positive instances. The recall for class 0 is 0.36, indicating that the model identified 36% of the actual instances of class 0. The recall for class 1 is 0.95, meaning that the model captured 95% of the actual instances of class 1.
Table 4.
Performance report of the logistic regression model.
F1-score is the harmonic mean of precision and recall, providing a balanced measure of the model’s performance. The F1-score for class 0 is 0.49, and for class 1 is 0.83. Accuracy is the overall correct prediction rate of the model. In this case, the logistic regression model achieved an accuracy of 0.742, indicating it accurately predicted the class labels for 74.2% of the instances in the dataset. The logistic regression model demonstrates moderate performance, with relatively low recall and precision for class 0 but demonstrated higher precision and recall for class 1. The model’s accuracy of 0.742 indicates its effectiveness in correctly predicting the class labels in the given dataset, although there is room for improvement, especially in capturing instances of class 0.
4.1. Support Vector Machine (SVM)
SVM uses the optimal hyperplane to divide all the data points in one class from all of the other classes’ data points in order to classify the data. Table 5 provides a summary of the SVM performance on the postnatal data. The precision for class 0 is 0.90, showing that 90% of the instances predicted as 0 were 0. The precision for class 1 is 0.93, meaning that 93% of the instances predicted as 1 were 1.
Table 5.
Performance report on support vector machine model.
The recall for class 0 is 0.87, indicating that the model identified 87% of the actual instances of class 0. The recall for class 1 is 0.95, meaning the model captured 95% of the actual instances of class 1. The F1-score for class 0 is 0.88, and for class 1, it is 0.94. The SVM model achieved an accuracy of 0.920, indicating that it accurately predicted the class labels for 92% of the instances in the dataset.
4.2. Multilayer Perceptron Classifier
This model can capture non-linear relationships through layers of neurons, making it powerful for modeling complex patterns in data, such as interactions between risk factors for PPD. Neural networks can handle large datasets and perform feature extraction, which is crucial for accurate PPD prediction.
The output of a neuron in an MLP is given by
where are the input features, are the weights, = the bias term, and is the activation function (e.g., sigmoid, tanh, ReLU) (Sainlez and Heyen, 2011).
As in the Table 6, the precision for class 0 is 0.92, indicating that 92% of the instances predicted as 0 were 0. The precision for class 1 is 0.96, meaning that 96% of the instances predicted as 1 were 1. The recall for class 0 is 0.92, indicating that the model identified 92% of the actual instances of class 0. The recall for class 1 is 0.96, meaning that the model captured 96% of the actual instances of class 1. The F1-score for class 0 is 0.92, and for class 1 is 0.96. With an accuracy of 0.95, it indicates that it accurately predicted the class labels for 95% of the instances in the dataset.
Table 6.
Performance report of multilayer perceptron classifier.
4.3. Decision Tree Model
This model makes use of a graph of decisions and potential outcomes that resemble a tree. It is simple to comprehend and interpret, which helps professionals make wise decisions. Decision trees can handle categorical and numerical data, which is common in PPD risk factor analysis. This is the formula for the information gain function. According to the formula, the information gain is determined by subtracting the entropy of a candidate split at node t from the entropy of a decision tree node.
Table 7 presents a performance report on the decision tree classifier. For the label ‘0’, the precision is 0.80, recall is 0.81, and the F1-score is 0.80, with support of 104 instances. Label ‘1’ has higher precision and recall, both at 0.90 and 0.89, respectively, with an F1-score of 0.89, supported by 195 instances.
Table 7.
Performance report on decision tree classifier.
The overall accuracy of the model is 0.86, which suggests it correctly predicts 86% of the outcomes. The macro and weighted averages of precision, recall, and F1-score are all consistently around 0.85 or 0.86, indicating the model performed well across both classes, with balanced performance metrics and support.
4.4. XGBoost Model
A gradient-boosted decision tree implementation for efficiency and speed, XGBoost is effective for large and complex datasets, providing high predictive accuracy. It handles missing data and can rank the importance of variables, which is valuable for identifying key risk factors for PPD. The XGBoost classifier performance is similar to that of the decision tree classifier as can been seen in the Table 8 below.
Table 8.
Performance report of XGBoost classifier.
Mathematically, XGBoost Model is written as
where = number of trees, is the functional space of , and is the set of possible CARTs.
The objective function for the above model is given by
where the first term is the loss function and the second is the regularization parameter. (“XGBoost”, by GeeksforGeeks, 2021).
4.5. K-Nearest Neighbors (KNN) Model
This model uses the majority of a data point’s k-nearest neighbors to predict the class of a given data point. It is simple yet effective, especially if the dataset has intuitively separable subgroups. KNN can be used for both regression and classification tasks, including PPD risk prediction.
The distance between two points x and x′ is typically calculated using the Euclidean distance, though other metrics can be used (“K-Nearest Neighbor(KNN) Algorithm”, by GeeksforGeeks, Noida, India, 2017):
where and are the values of the feature of points and respectively.
The KNeighbors classifier model achieved an accuracy of 0.93 as can be seen in Table 9, indicating it accurately predicted the class labels for 93% of the instances.
Table 9.
Performance report for K-Neighbors classifier.
With a precision of 0.97 for class 0, 97% of the examples that were predicted to be 0 turned out to be 0. With a precision of 0.91 for class 1, 91% of the examples that were predicted to be 1 were actually 1. The recall for class 0 is 0.83 and for class 1 is 0.98. The F1-score for class 0 is 0.89, and for class 1 is 0.95.
4.6. Model Evaluation (Predictions on Test Data)
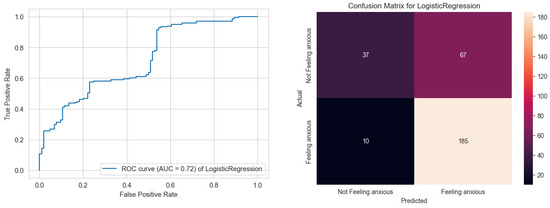
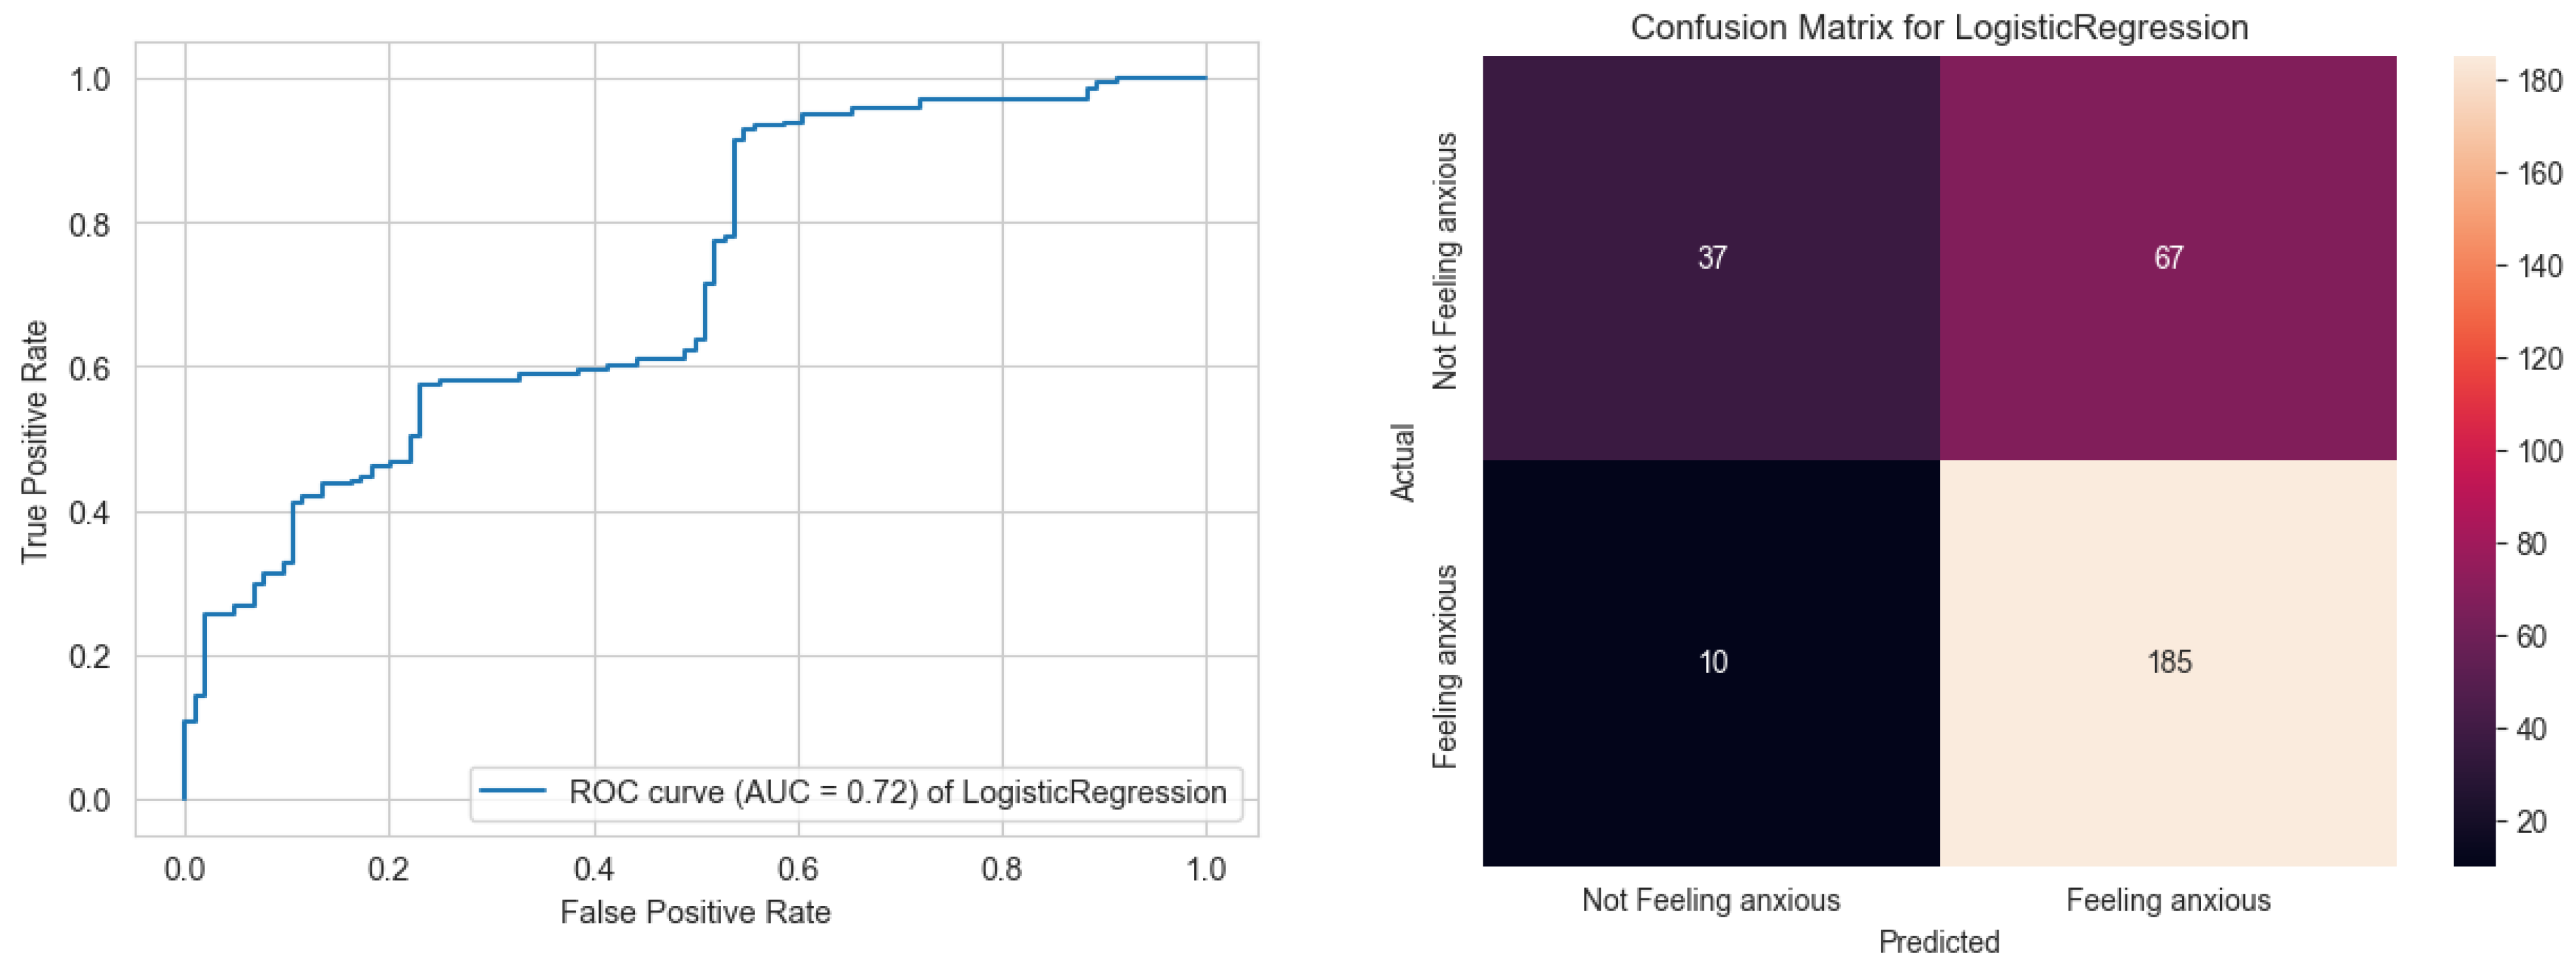
Figure 5 shows the ROC curve for a logistic regression model with an AUC of 0.72. The ROC curve shows true positive rate (sensitivity) against the false positive rate (1-specificity) at various threshold settings. The model’s ability to discriminate between the positive and negative classes is indicated by the AUC value. An AUC of 0.72 suggests that the logistic regression model has fair discriminatory power, but there is still room for improvement. In the context of predicting postnatal depression, this model correctly identifies a fair proportion of positive cases (women with postnatal depression) while also incurring some false positives (women without postnatal depression incorrectly identified as having it). The closer the AUC is to 1, the better the model is at prediction. An AUC of 0.72 may be acceptable depending on the needs and the effects of false positives and false negatives in the clinical or operational scenario where model is implemented.
Figure 5.
ROC curve of the logistic regression & confusion matrix.
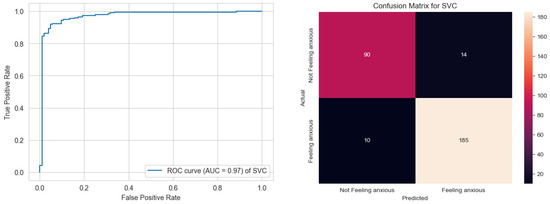
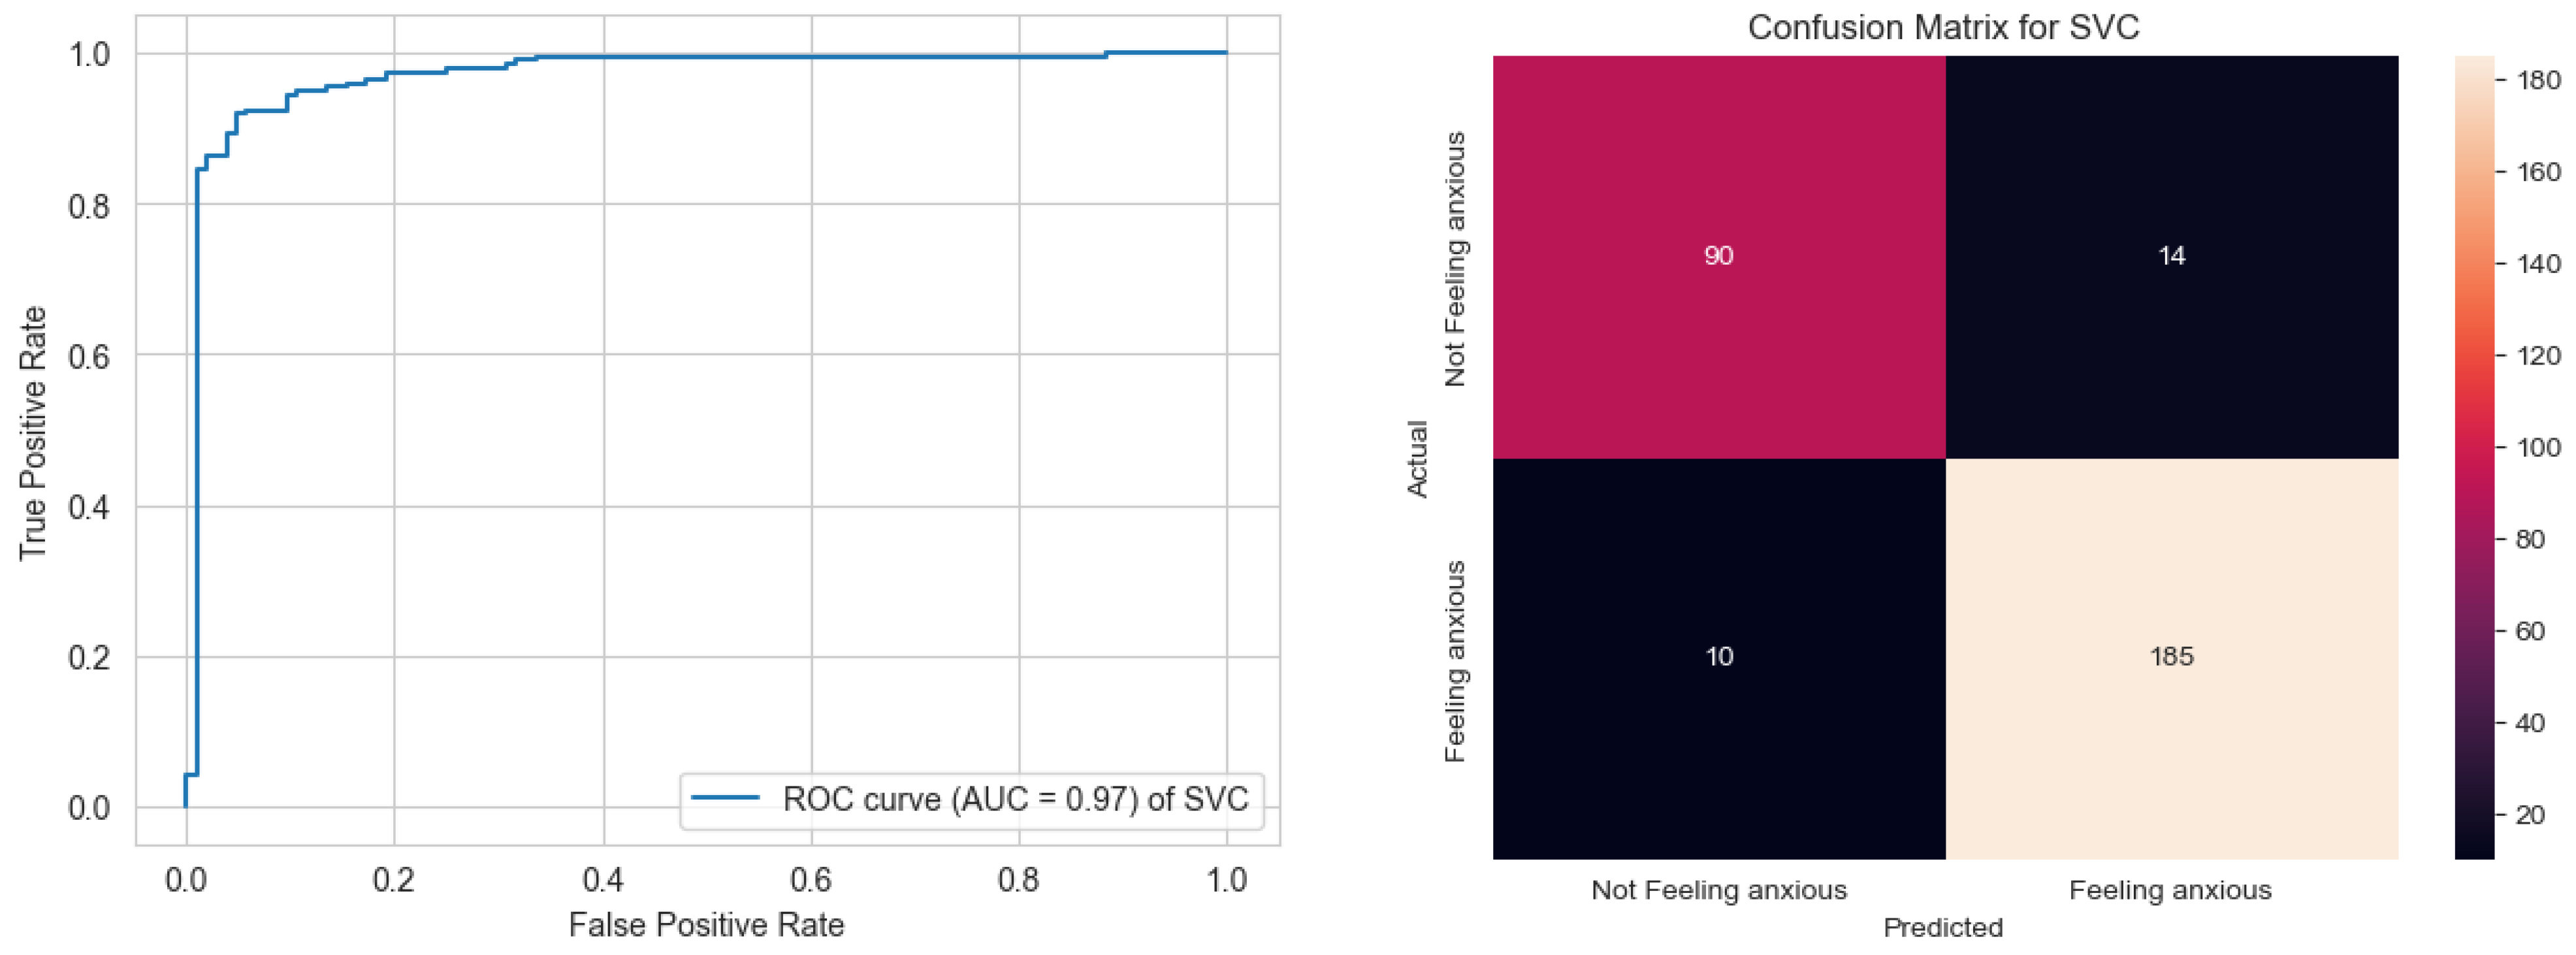
This model has relatively more false positives (67) and fewer true negatives (37) than the other models. It also has a moderate number of false negatives (10) and a high number of true positives (185). The ROC curve displayed in graph Figure 6 is for a support vector classifier (SVC) model with an AUC of 0.97, which is excellent. This high AUC value implies that the SVC model has a very high ability to differentiate between true positives (correctly identifying women with postnatal depression) and true negatives (correctly identifying those without it). The graph shows that at a low false positive rate, the model achieves a high true positive rate, which indicates that the model is highly effective with few incorrect predictions of the positive class. In a medical or clinical context, such as predicting postnatal depression, a model with this level of accuracy could be extremely valuable, potentially resulting in better patient outcomes through early and, hence, accurate identification of those at risk.
Figure 6.
ROC curve of the support vector classifier and matrix.
The SVM model shows a significant improvement in true negatives (90) compared to logistic regression and has the same number of true positives (185). It also reduces the false positives (14) but has an equal number of false negatives (10).
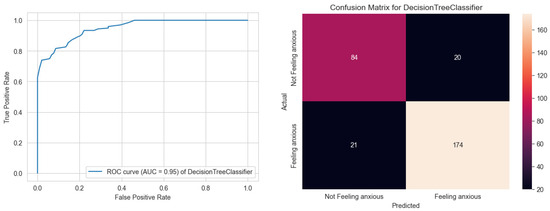
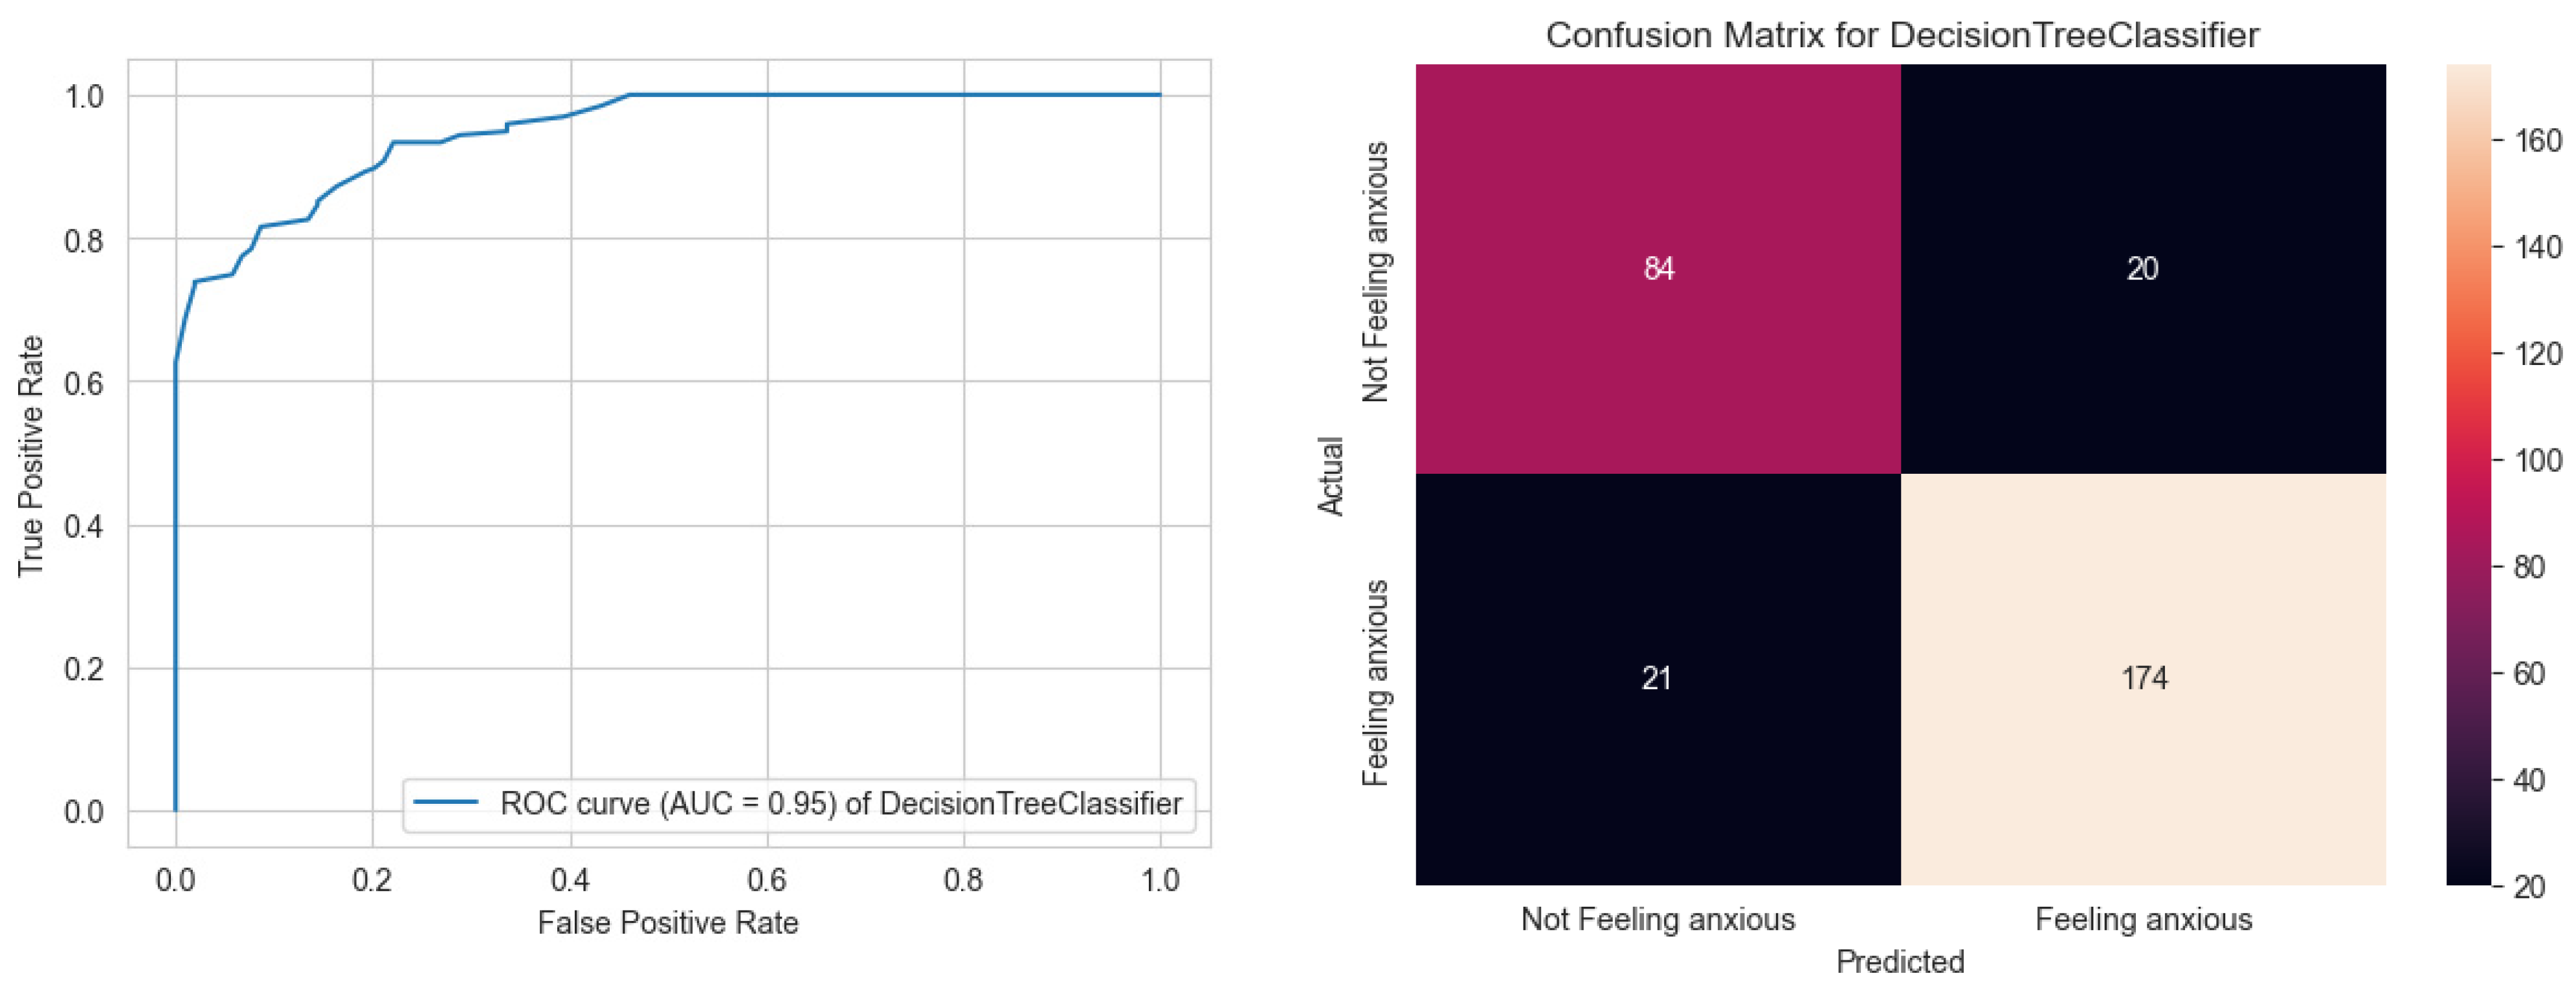
The ROC curve in the graph (Figure 7) represents the performance of a decision tree classifier on the test data, with an AUC of 0.95. With a 95% probability that the model will properly rank a random positive instance higher than a random negative one, this shows a high degree of accuracy in class distinction.
Figure 7.
ROC curve of the decision tree classifier and confusion matrix.
The classifier produces a high true positive rate with a low false positive rate, which is desirable in many scenarios, including medical diagnosis, as demonstrated by the curve’s strong ascent towards the top-left corner. The confusion matrix for the decision tree classifier presented in Figure 8 reveals how the model performs on the test data in classifying into either “Not feeling anxious” or “Feeling anxious”. It shows that out of the total predictions made for the “Not feeling anxious” category, 84 instances were correctly identified (true negatives), while 20 instances were incorrectly classified as “Feeling anxious” (false positives). Conversely, for the “Feeling anxious” category, 174 instances were accurately predicted (true positives), but 21 instances were misclassified as “Not feeling anxious” (false negatives).
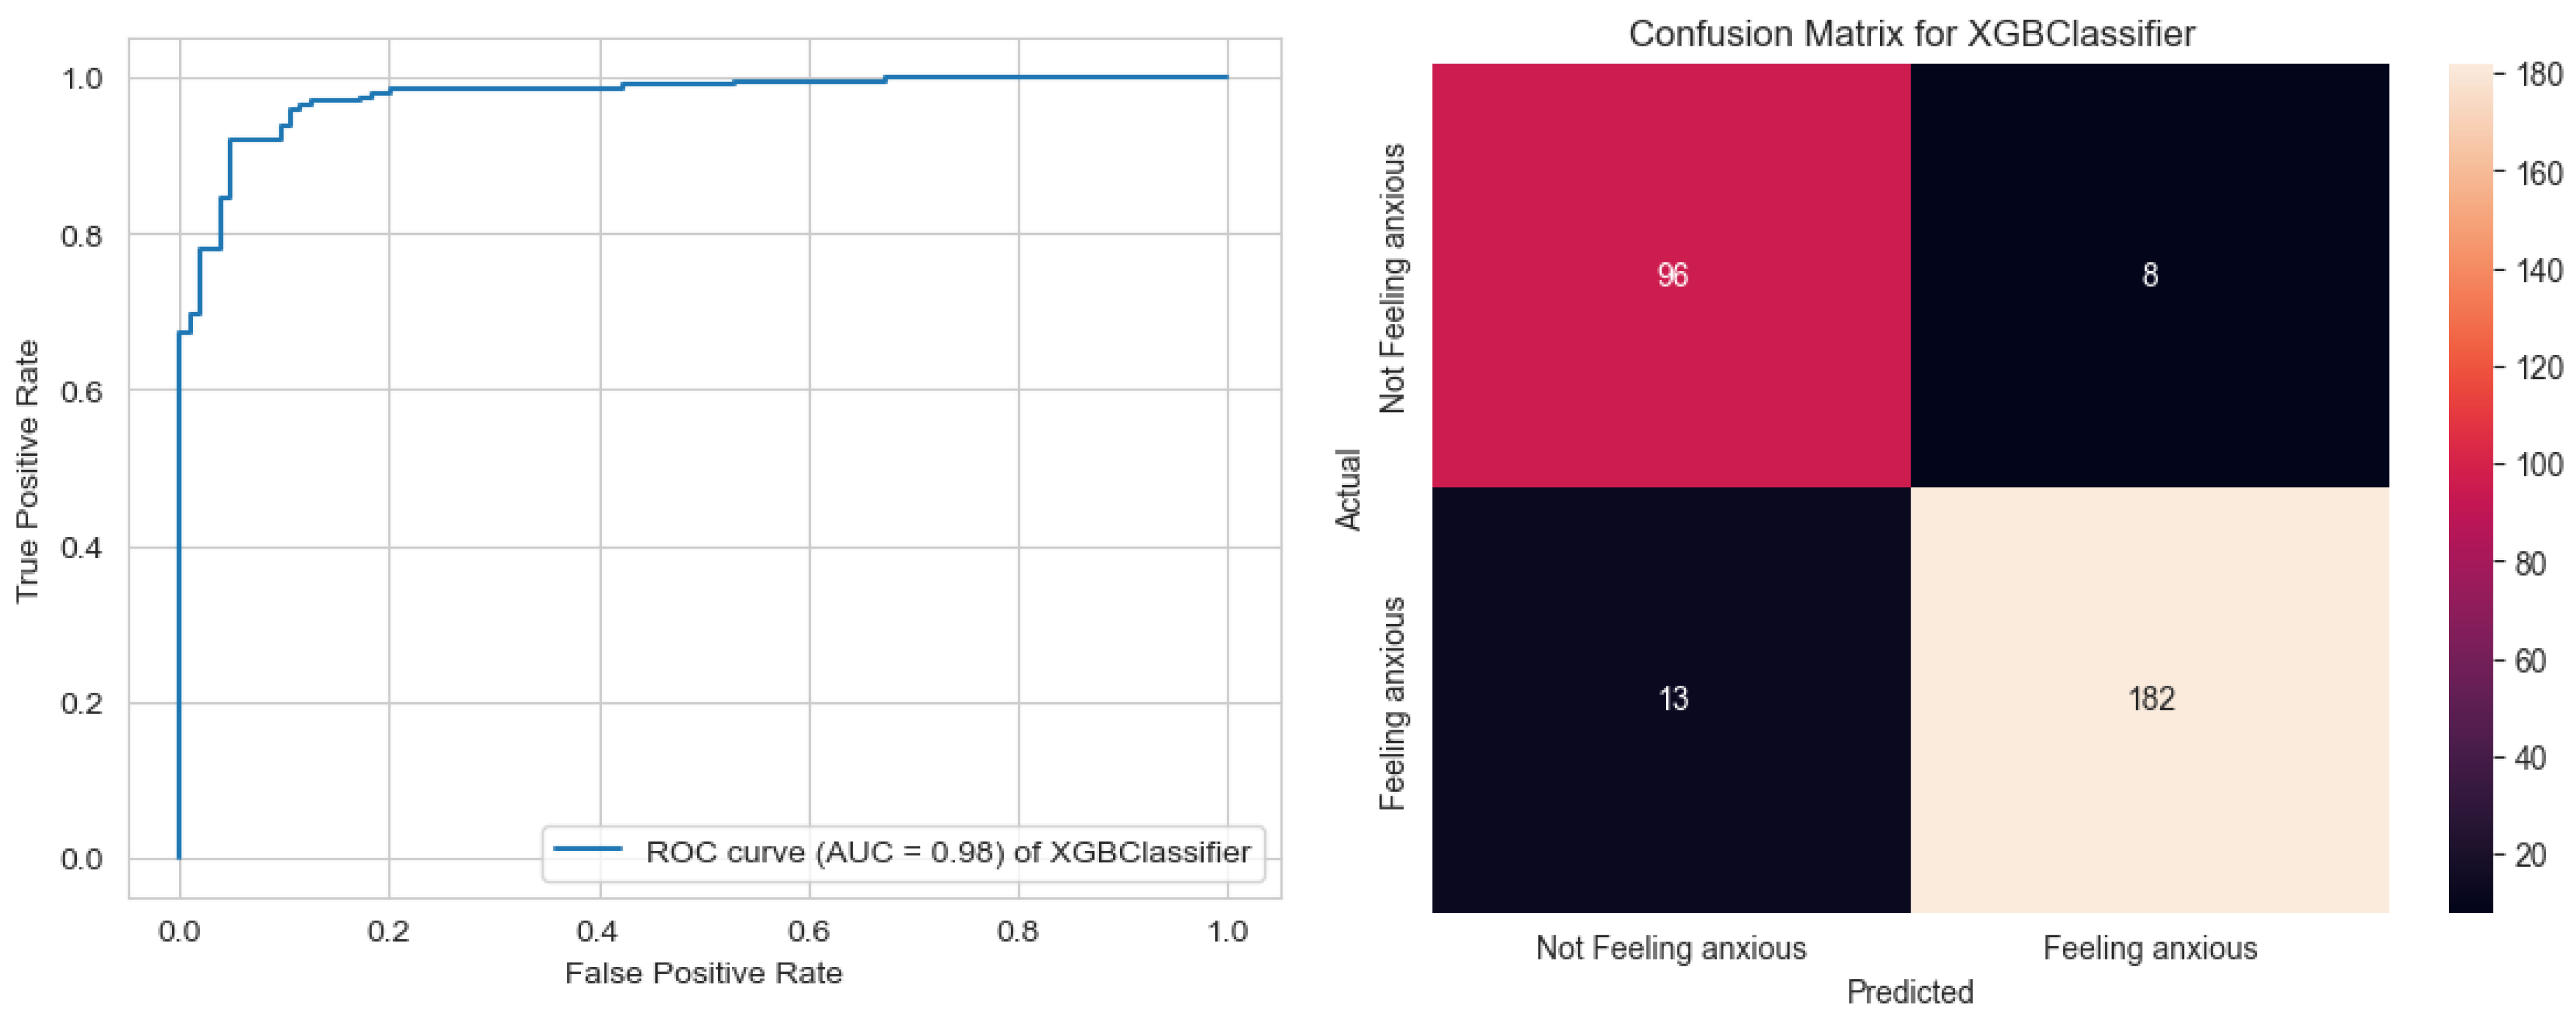
Figure 8.
ROC curve of the XGBoost classifier and confusion matrix.
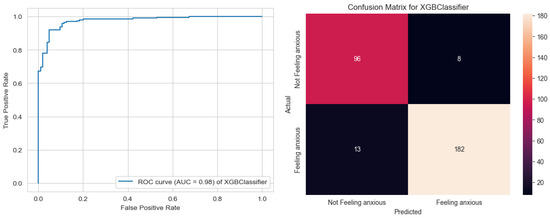
The ROC curve for an XGBoost classifier has an AUC of 0.98, indicating an exceptional level of performance (Figure 8). The model has a 98% chance of correctly distinguishing between the positive and negative class. The curve’s progression, closely hugging the top-left side of the graph, signifies that the classifier can achieve a high true positive value while maintaining a very low false positive value. In practical terms, especially within a medical or healthcare context like predicting postnatal depression, this suggests that the XGBoost classifier is highly precise and reliable, making very few mistakes in classifying individuals. This level of accuracy is especially important in medical diagnostics, when the cost of false positives and false negatives can be very high.
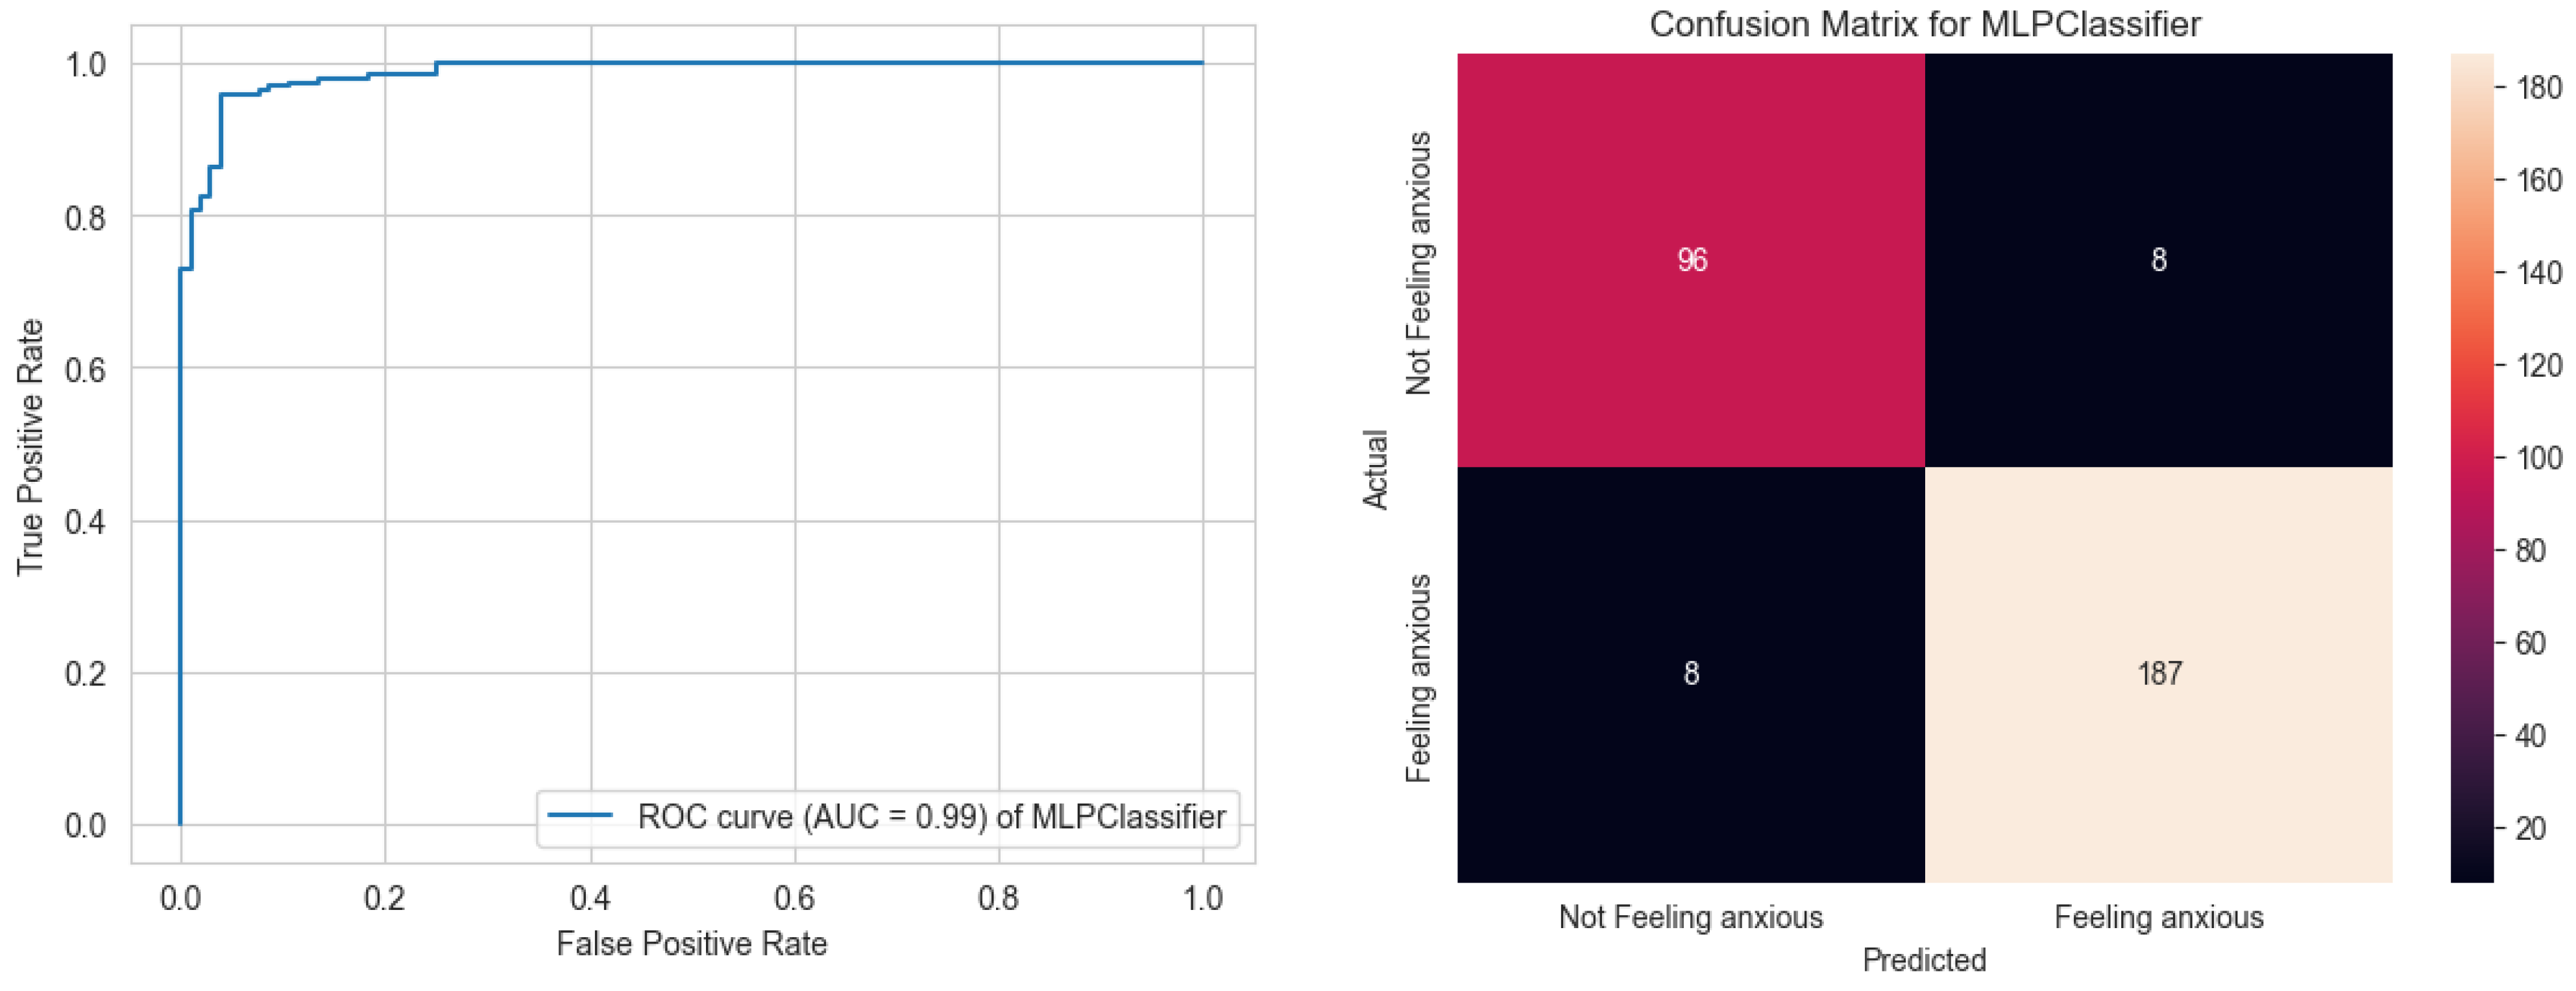
Figure 9 presents the confusion matrix for the XGBoost classifier, which illustrates the model’s performance in distinguishing between “Not feeling anxious” and “Feeling anxious” states. The matrix indicates that for individuals not feeling anxious, 96 were correctly identified (true negatives), and 8 were incorrectly classified as feeling anxious (false positives). On the other hand, for individuals feeling anxious, 179 were accurately predicted (true positives), while 16 were misclassified as not feeling anxious (false negatives). The graph displays an ROC curve for an MLPClassifier [33] in (Figure 9), which is a type of neural network, with an AUC of 0.99. This near-perfect AUC rate signifies the MLPClassifier has an exceptional ability to differentiate between positive and negative cases of postnatal depression.
Figure 9.
ROC curve of the MLPClassifier and confusion matrix.
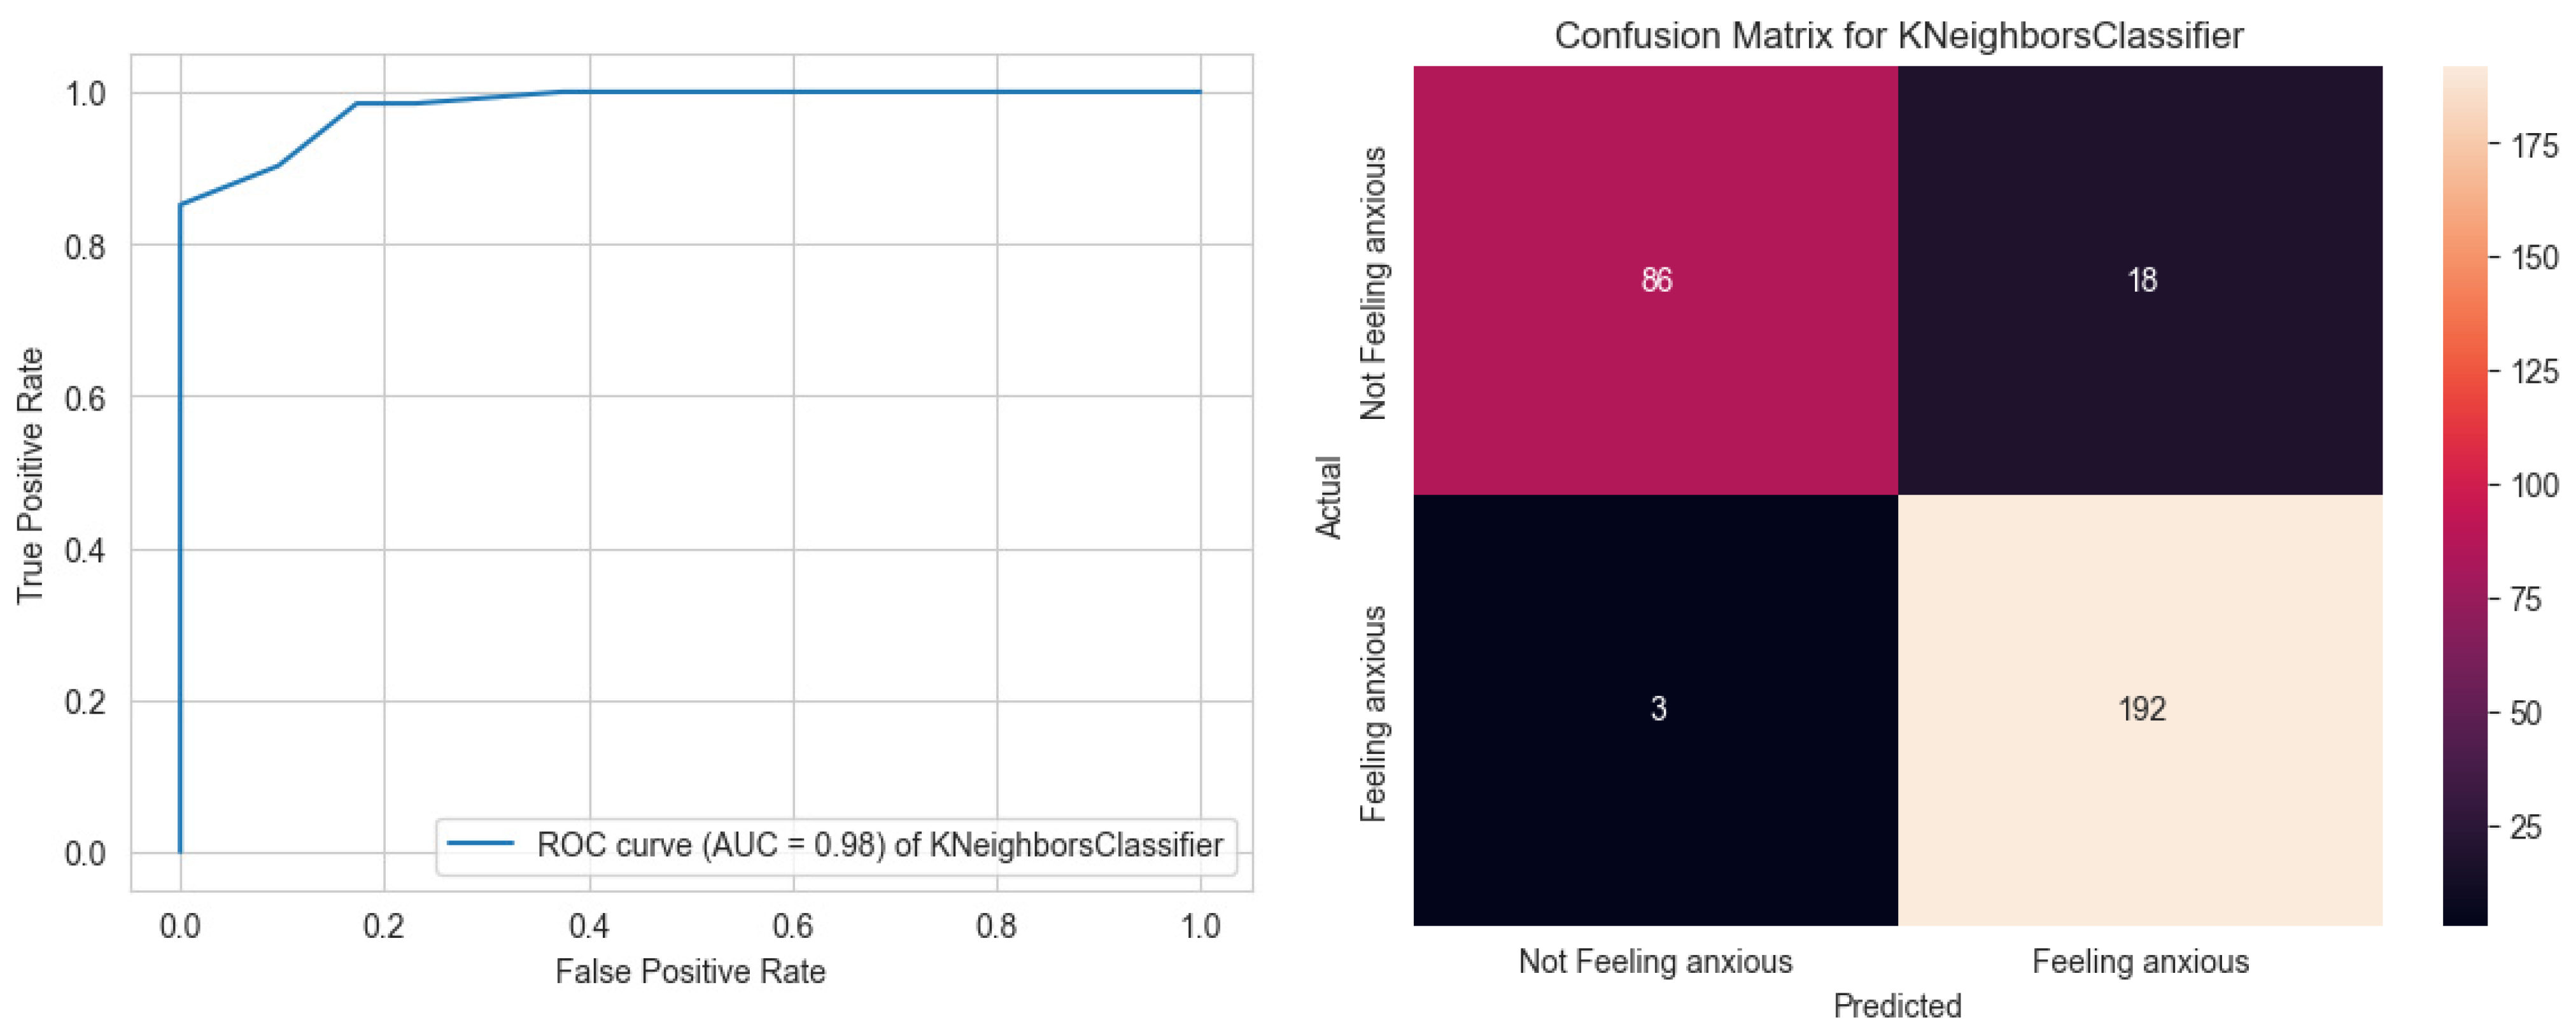
The curve, which ascends steeply, and plateaus close to the top-left side of the graph, indicates that the model achieves a very high true positive value while keeping the false positive value extremely low. In real-world applications such as predicting postnatal depression, a model demonstrating such high accuracy is extremely valuable, as it implies that the classifier is robust and can be trusted to make predictions with a high degree of confidence. The MLP has fewer false negatives (8) compared to logistic regression and SVM, suggesting better sensitivity. It also maintains a lot of true positives (187) and a substantial number of true negatives (96), with minimal false positives (8). The ROC curve shown below (Figure 10) represents the performance of a KNeighbours classifier with an AUC of 0.98. This indicates an excellent ability to distinguish between the classes. The true positive rate (sensitivity) is high, while the false positive rate is kept low across the threshold settings, which is indicative of a model with high diagnostic ability.
Figure 10.
ROC curve of the KNeighbors classifier and confusion matrix.
This model shows a slight increase in false negatives (3) compared to MLP but improves on the true negatives (86) with a modest number of false positives (18). It has a very high number of true positives (192), indicating it is quite sensitive to the positive class. Evaluating machine learning models by AUC and confusion matrices, logistic regression (AUC: 0.72) performs least accurately, while MLPClassifier (AUC: 0.99) and XGBoost classifier (AUC: 0.98) excel in predicting postnatal depression. The MLPClassifier achieves the highest true positive rate and lowest false negatives, making it optimal for identifying postnatal depression cases, critical for ensuring timely treatment. SVC and decision tree models perform well but fall short of MLPClassifier’s accuracy. Given its high true positive rate and low false positive rate, the MLPClassifier is the best choice for integration into a web platform for postnatal depression prediction, ensuring reliable identification of those needing support while minimizing misclassification of healthy individuals.
4.7. Hyperparameter Tuning of the Multilayer Perceptron (MLP) Model
A grid search tuned the MLPClassifier’s hyperparameters, testing combinations of hidden layer sizes ((50,), (100, 50), (100, 100, 50)), activation functions (‘logistic’, ‘relu’), and alpha values (0.0001, 0.001, 0.01). Using 5-fold cross-validation on training data, models were scored by F1 score. The grid search yielded an optimal F1 score of 0.976, indicating high precision and recall. The best hyperparameters were ‘relu’ activation, alpha of 0.0001, and hidden layer sizes of (100, 100, 50). This complex model, with two 100-neuron layers and one 50-neuron layer, regularized with low alpha, performed best. Evaluated on the test set, it achieved 99% accuracy, suggesting the MLPClassifier is highly effective for postnatal depression prediction and reliable for real-world deployment, such as in a web interface.
4.8. Integration of the MLP Model into a Web Page
It will be of little to no importance if researchers or healthcare workers cannot make use of the built MLP model to make predictions on postnatal depression. This is where Streamlit comes into action. Streamlit is the fastest way to build any data app and share it. It allows machine learning practitioners to share their models in a user-friendly fashion with little or no code approach (“Streamlit: A faster way to build and share data apps”, 2021). The Streamlit app was developed in Python. The built-in functions used include the slider widget for selecting age, and input-number widgets for recording emotion scores for sadness, irritability, trouble sleeping problem with concentration, loss of appetite, guilt feeling and suicide attempt. Lastly, the submit button will implement the prediction function and return an output.
5. Discussion
This study presented a comprehensive analysis of various machine learning models to predict postnatal depression (PND) and its subsequent impact on infant bonding. The results were particularly striking in the context of the MLPClassifier, which achieved an AUC of 0.99, demonstrating remarkable predictive power. Compared to the findings of Zhang et al. [10], who reported an AUC of 0.78 using SVM and RF models, this study represents a significant advance in the accuracy of PND prediction. This leap in predictive performance can be attributed to a rigorous hyperparameter tuning process and the utilization of a rich dataset encompassing a wide range of factors, from demographic to psychosocial variables. This meticulous approach mirrors the steps taken in related research, [25], which also underscored the importance of a diverse array of predictive variables in machine learning applications within mental health.
The study demonstrates that logistic regression, SVM, MLP, decision tree, XGBoost, and KNN effectively predict postnatal depression (PND) using demographic, medical, and psychosocial factors, achieving high accuracy (up to 95% with MLP) for early identification and intervention (RQ1). These models analyze complex patterns in data, such as prenatal depression, anxiety, socio-economic status, and stress, to estimate PND risk, enabling targeted mental health support. Regarding RQ2, PND is linked to impaired maternal responsiveness, sensitivity, and attachment behaviors, negatively affecting mother–infant bonding, as depressed mothers may exhibit intrusive or withdrawn interaction patterns, disrupting secure attachment. For RQ3, key predictors of PND severity and duration include antepartum depression, psychosocial stressors (e.g., lack of support, relationship issues), and biochemical markers like elevated TSH and serum ferritin. Models like MLP and XGBoost, with AUCs of 0.99 and 0.98, respectively highlight these factors’ significance in predicting PND risk accurately, facilitating timely interventions to mitigate symptom severity and duration.
The integration of the MLPClassifier into a web interface marks a transition from theoretical research to a practical diagnostic tool. The choice of the MLP model over others, such as logistic regression or SVM, was based not only on its statistical superiority but also on its operational feasibility. The MLP’s high true positive rate and minimal false negatives are of paramount importance in a clinical setting where early detection can drastically alter the course of treatment and patient support. Its deployment through a user-friendly Streamlit application facilitates greater access to mental health evaluation tools, democratizing the early identification of PND risk. This step forward echoes the transition seen in other healthcare models, where machine learning has bridged the gap between data science and patient care, such as in the dermatological imaging analyses [34].
The superior performance of the MLPClassifier in this study indicates that it is a robust tool which can be relied upon for accurate PND predictions, leading to timely and potentially life-saving interventions. This aligns with the research conducted by Shin et al. [35], which highlighted the necessity of accurate prediction models in improving maternal and child health outcomes. It also aids the findings of Roshaidai et al. [36], whose emphasis was on the high prevalence and critical impact of PND on mother–infant dynamics, underscoring the need for such advanced predictive technologies. It is fundamental to consider the implications of integrating such a model into clinical practice. The ease of interpretability of the MLPClassifier’s predictions allows for greater trust and reliance on the part of healthcare providers, which is a necessary step for its adoption. This user-centered approach in the application of complex models is essential for clinical acceptance [37], and it is a decisive factor in the application of machine learning in healthcare.
Limitations
This study’s focus on postnatal depression (PND) within the first year postpartum provides valuable insights but introduces limitations. The temporal scope excludes late-onset PND or long-term effects beyond this period, limiting the understanding of PND’s full spectrum. Additionally, the exclusive focus on PND omits related perinatal mental health disorders, such as antenatal depression or anxiety, neglecting their interconnected impacts on mothers and infants. The reliance on demographic, medical, and psychosocial factors for prediction may reduce generalizability, as data availability, quality, and relevance vary across populations, potentially limiting model applicability. Using secondary open datasets (e.g., from Kaggle) introduces challenges, including questionable data quality, potential misalignment with study needs, incomplete documentation, legal/ethical concerns, and inherent biases. Firstly, the model’s dependence on self-reported data introduces potential for cultural and recall bias, and the lack of biochemical markers limits its clinical depth. Secondly, future validation is required on a multi-ethnic cohort with serological data to confirm generalizability. Due to the scope and focus of this study, we did not perform statistical significance testing (e.g., DeLong’s test or bootstrap AUC comparison) between the top-performing models. Future work will focus DeLong’s test and bootstrap resampling to provide statistical significance of performance differences between the proposed model and baseline classifiers.
6. Conclusions
This study advances the application of machine learning in predicting postnatal depression (PND) and its impact on infant bonding, marking a significant step in mental health technology. By integrating diverse datasets and employing advanced analytical models, the research elucidates PND’s complexities and offers hope for early, accurate diagnosis. The multilayer perceptron (MLP) classifier achieved an exceptional Area Under the Curve (AUC) of 0.99, demonstrating superior precision in identifying PND cases compared to traditional statistical methods. This high accuracy establishes the MLPClassifier as a powerful clinical prediction tool. Implemented through a user-friendly Streamlit web interface, the model enhances accessibility, providing reliable diagnostic support for healthcare professionals and patients. The research underscores machine learning’s potential to yield critical insights into complex, multifactorial health conditions. By addressing PND underdiagnosis, it paves the way for improved clinical outcomes and serves as a foundation for future research to refine model precision and broaden applicability across diverse populations. The study’s implications extend beyond academia, merging technology with human well-being to support new mothers during vulnerable life stages. It encourages further innovation at the intersection of machine learning and mental health, fostering tools to mitigate PND’s effects and strengthen mother–infant bonds, essential for societal health. To maximize impact, future work should validate the model across varied cultural, social, and economic contexts and include a wider range of perinatal mental health conditions. The future efforts must focus on collecting primary data with physiological measurements to translate this model into a robust clinical tool. Longitudinal studies are essential to evaluate the lasting impacts of postnatal depression (PND) on mothers, children, and families, ensuring a deeper understanding of its long-term consequences. High-quality primary data collection will further improve the accuracy and robustness of our machine learning models for clinical and research applications. Additionally, we plan to deploy the Streamlit-based web interface in future studies for user testing and clinical validation. This will allow healthcare providers to assess their usability and effectiveness in real-world settings. These efforts will enhance the practical relevance of our MLPClassifier model for PND prediction.
Author Contributions
Conceptualization, N.G.-O. and M.Z.I.; methodology, N.G.-O.; software, N.G.-O.; validation, N.G.-O. and M.Z.I.; formal analysis, N.G.-O.; investigation, N.G.-O.; resources, N.G.-O.; data curation, N.G.-O.; writing—original draft preparation, N.G.-O. and M.Z.I.; writing—review and editing, N.G.-O. and M.Z.I.; visualization, N.G.-O.; supervision, M.Z.I.; project administration, N.G.-O.; funding acquisition, M.Z.I. All authors have read and agreed to the published version of the manuscript.
Funding
This research received no external funding.
Institutional Review Board Statement
Not applicable.
Data Availability Statement
The data presented in this study are available on request from the corresponding author. The data are not publicly available due to privacy or ethical restrictions.
Conflicts of Interest
The authors declare no conflicts of interest.
References
- Taufiq, D.; Manda, R. Behavioral Manifestations of Baby Blues Syndrome Among Postpartum Mothers in Muara District, North Tapanuli Regency. Acta Psychol. 2024, 2, 123–130. [Google Scholar] [CrossRef] [Scilit]
- Yim, I.S.; Tanner Stapleton, L.R.; Guardino, C.M.; Hahn-Holbrook, J.; Dunkel Schetter, C. Biological and psychosocial predictors of postpartum depression: Systematic review and call for integration. Annu. Rev. Clin. Psychol. 2015, 11, 99–137. [Google Scholar] [CrossRef] [Scilit] [PubMed]
- Nzoma, A.; Shaw, R. Depression, Anxiety, and Suicide. In Pediatric Rotations: A Quick Guide for Medical Students; Springer International Publishing: Cham, Switzerland, 2024; pp. 205–220. [Google Scholar]
- Slomian, J.; Honvo, G.; Emonts, P.; Reginster, J.Y.; Bruyère, O. Consequences of maternal postpartum depression: A systematic review of maternal and infant outcomes. Women’s Health 2019, 15, 1745506519844044. [Google Scholar] [CrossRef] [Scilit] [PubMed]
- Ghaedrahmati, M.; Kazemi, A.; Kheirabadi, G.; Ebrahimi, A.; Bahrami, M. Postpartum depression risk factors: A narrative review. J. Educ. Health Promot. 2017, 6, 60. [Google Scholar] [CrossRef] [Scilit] [PubMed]
- Darcy, J.M.; Grzywacz, J.G.; Stephens, R.L.; Leng, I.; Clinch, C.R.; Arcury, T.A. Maternal depressive symptomatology: 16-month follow-up of infant and maternal health-related quality of life. J. Am. Board Fam. Med. 2011, 24, 249–257. [Google Scholar] [CrossRef] [Scilit] [PubMed]
- Gavin, N.I.; Gaynes, B.N.; Lohr, K.N.; Meltzer-Brody, S.; Gartlehner, G.; Swinson, T. Perinatal depression: A systematic review of prevalence and incidence. Obstet. Gynecol. 2005, 106, 1071–1083. [Google Scholar] [CrossRef] [Scilit] [PubMed]
- Toohey, J. Depression during pregnancy and postpartum. Clin. Obstet. Gynecol. 2012, 55, 788–797. [Google Scholar] [CrossRef] [Scilit] [PubMed]
- Giesbrecht, G.F.; Campbell, T.; Letourneau, N.; Kooistra, L.; Kaplan, B.; APrON Study Team. Psychological distress and salivary cortisol covary within persons during pregnancy. Psychoneuroendocrinology 2012, 37, 270–279. [Google Scholar] [CrossRef] [Scilit] [PubMed]
- Zhang, W.; Liu, H.; Silenzio, V.M.B.; Qiu, P.; Gong, W. Machine Learning Models for the Prediction of Postpartum Depression: Application and Comparison Based on a Cohort Study. JMIR Med. Inform. 2020, 8, e15516. [Google Scholar] [CrossRef] [Scilit] [PubMed]
- Federica, G.; Renata, T.; Marzilli, E. Parental Postnatal Depression in the Time of the COVID-19 Pandemic: A Systematic Review of Its Effects on the Parent–Child Relationship and the Child’s Developmental Outcomes. Int. J. Environ. Res. Public Health 2023, 20, 2018. [Google Scholar] [CrossRef] [Scilit] [PubMed]
- Chung, J.; Teo, J. Mental Health Prediction Using Machine Learning: Taxonomy, Applications, and Challenges. Appl. Comput. Intell. Soft Comput. 2022, 2022, 9970363. [Google Scholar] [CrossRef] [Scilit]
- Cox, J.L.; Holden, J. Perinatal Mental Health: A Guide to the Edinburgh Postnatal Depression Scale (EPDS); Royal College of Psychiatrists: London, UK, 2003. [Google Scholar]
- Monzon, C.; di Scalea, T.L.; Pearlstein, T. Postpartum psychosis: Updates and clinical issues. Psychiatr. Times 2014, 31, 26. [Google Scholar]
- Byatt, N.; Biebel, K.; Lundquist, R.S.; Moore Simas, T.A.; Debordes-Jackson, G.; Allison, J.; Ziedonis, D. Patient, provider, and system-level barriers and facilitators to addressing perinatal depression. J. Reprod. Infant Psychol. 2012, 30, 436–449. [Google Scholar] [CrossRef] [Scilit]
- Milgrom, J.; Gemmill, A.W.; Bilszta, J.L.; Hayes, B.; Barnett, B.; Brooks, J.; Buist, A. Antenatal risk factors for postnatal depression: A large prospective study. J. Affect. Disord. 2008, 108, 147–157. [Google Scholar] [CrossRef] [Scilit] [PubMed]
- Schramm, K.; Nees, J.; Hoffmann, J.; Bruckner, T.; Haun, M.W.; Maatouk, I.; Schott, S. Emergency consultations in obstetrics: Identification of decisive, contributing and associated factors. Arch. Gynecol. Obstet. 2020, 302, 821–828. [Google Scholar] [CrossRef] [Scilit] [PubMed]
- Saraswat, N.; Wal, P.; Pal, R.S.; Wal, A.; Pal, Y.; Roohi, T.F. A detailed biological approach on hormonal imbalance causing depression in critical periods (postpartum, postmenopausal and perimenopausal depression) in adult women. Open Biol. J. 2021, 9, 17–35. [Google Scholar] [CrossRef] [Scilit]
- Alfayumi-Zeadna, S.; Froimovici, M.; O’Rourke, N.; Azbarga, Z.; Okby-Cronin, R.; Salman, L.; Daoud, N. Direct and indirect determinants of prenatal depression among Arab-Bedouin women in Israel: The role of stressful life events and social support. Midwifery 2021, 96, 102937. [Google Scholar] [CrossRef] [Scilit] [PubMed]
- Nan, Y.; Yang, L.; Nisar, A.; Zhang, J.; Gao, Y.; Zhang, M.; Zhang, Y. Psychological dilemmas and distress among Chinese primiparas during the postpartum transition underlying implicit cultural norms: A phenomenological inquiry. BMC Psychol. 2025, 13, 911. [Google Scholar] [CrossRef] [Scilit] [PubMed]
- Habehh, H.; Gohel, S. Machine Learning in Healthcare. Curr. Genom. 2021, 22, 291–300. [Google Scholar] [CrossRef] [Scilit] [PubMed]
- Lanfranco, A.R.; Castellanos, A.E.; Desai, J.P.; Meyers, W.C. Robotic surgery: A current perspective. Ann. Surg. 2004, 239, 14–21. [Google Scholar] [CrossRef] [Scilit] [PubMed]
- Kissi, S.A.; Talukder, M.G.M.; Iqbal, M.Z. Data-driven predictive modelling of lifestyle risk factors for cardiovascular health. Electronics 2025, 14, 2906. [Google Scholar] [CrossRef] [Scilit]
- Yang, S.T.; Yang, S.Q.; Duan, K.M.; Tang, Y.Z.; Ping, A.Q.; Bai, Z.H.; Wang, S.Y. The development and application of a prediction model for postpartum depression: Optimizing risk assessment and prevention in the clinic. J. Affect. Disord. 2022, 296, 434–442. [Google Scholar] [CrossRef] [Scilit] [PubMed]
- Andersson, S.; Bathula, D.R.; Iliadis, S.I.; Walter, M.; Skalkidou, A. Predicting women with depressive symptoms postpartum with machine learning methods. Sci. Rep. 2021, 11, 7877. [Google Scholar] [CrossRef] [Scilit] [PubMed]
- Jiménez-Serrano, S.; Tortajada, S.; García-Gómez, J.M. A mobile health application to predict postpartum depression based on machine learning. Telemed. E-Health 2015, 21, 567–574. [Google Scholar] [CrossRef] [Scilit]
- Kalmbach, D.A.; O’Brien, L.M.; Pitts, D.A.S.; Sagong, C.; Arnett, L.K.; Harb, N.C.; Drake, C.L. Mother-to-infant bonding is associated with maternal insomnia, snoring, cognitive arousal, and infant sleep problems and colic. Behav. Sleep Med. 2022, 20, 393–409. [Google Scholar] [PubMed]
- Pope, C.J.; Mazmanian, D. Breastfeeding and postpartum depression: An overview and methodological recommendations for future research. Depress. Res. Treat. 2016, 2016, 4765310. [Google Scholar] [CrossRef] [Scilit] [PubMed]
- He, H.; Yang, L.; Li, X.; Li, Y.; Wang, Y.; Li, J. Isolation forest-voting fusion-multioutput: A stroke risk classification method based on the multidimensional output of abnormal sample detection. Comput. Methods Programs Biomed. 2024, 253, 108255. [Google Scholar] [CrossRef] [Scilit] [PubMed]
- Huang, P.; He, P.; Tian, S.; Ma, M.; Feng, P.; Xiao, H.; Mercaldo, F.; Santone, A.; Qin, J. A ViT-AMC network with adaptive model fusion and multiobjective optimization for interpretable laryngeal tumor grading from histopathological images. IEEE Trans. Med. Imaging 2023, 42, 15–28. [Google Scholar] [CrossRef] [Scilit] [PubMed]
- Huang, P.; Li, X.; Luo, X.; He, P.; Tian, S.; Ma, M.; Feng, P.; Xiao, H.; Mercaldo, F.; Santone, A.; et al. MamlFormer: Priori-experience guiding transformer network via manifold adversarial multi-modal learning for laryngeal histopathological grading. Inf. Fusion 2024, 108, 102333. [Google Scholar] [CrossRef] [Scilit]
- Huang, P.; Li, X.; Luo, X.; He, P.; Tian, S.; Ma, M.; Feng, P.; Xiao, H.; Mercaldo, F.; Santone, A.; et al. FDTs: A feature disentangled transformer for interpretable squamous cell carcinoma grading. IEEE Trans. Med. Imaging 2025, 44, 2068–2078. [Google Scholar] [CrossRef] [Scilit]
- Zhang, D.; Yu, N.; Yang, X.; De Marinis, Y.; Liu, Z.P.; Gao, R. SRPNet: Stroke risk prediction based on two-level feature selection and deep fusion network. Front. Physiol. 2024, 15, 1357123. [Google Scholar] [CrossRef] [Scilit] [PubMed]
- Esteva, A.; Kuprel, B.; Novoa, R.A.; Ko, J.; Swetter, S.M.; Blau, H.M.; Thrun, S. Dermatologist-level classification of skin cancer with deep neural networks. Nature 2017, 542, 115–118. [Google Scholar] [CrossRef] [Scilit] [PubMed]
- Shin, D.; Lee, K.J.; Adeluwa, T.; Hur, J. Machine Learning-Based Predictive Modeling of Postpartum Depression. J. Clin. Med. 2020, 9, 2899. [Google Scholar] [CrossRef] [Scilit] [PubMed]
- Roshaidai Mohd Arifin, S.; Cheyne, H.; Maxwell, M. Review of the prevalence of postnatal depression across cultures. AIMS Public Health 2018, 5, 260–295. [Google Scholar] [CrossRef] [Scilit] [PubMed]
- Hanai, A.; Ishikawa, T.; Sugao, S.; Fujii, M.; Hirai, K.; Watanabe, H.; Matsuzaki, M.; Nakamoto, G.; Takeda, T.; Kitabatake, Y.; et al. Explainable Machine Learning Classification to Identify Vulnerable Groups Among Parenting Mothers: Web-Based Cross-Sectional Questionnaire Study. JMIR Form. Res. 2024, 8, e47372. [Google Scholar] [CrossRef] [Scilit] [PubMed]

Disclaimer/Publisher’s Note: The statements, opinions and data contained in all publications are solely those of the individual author(s) and contributor(s) and not of MDPI and/or the editor(s). MDPI and/or the editor(s) disclaim responsibility for any injury to people or property resulting from any ideas, methods, instructions or products referred to in the content. |
© 2026 by the authors. Licensee MDPI, Basel, Switzerland. This article is an open access article distributed under the terms and conditions of the Creative Commons Attribution (CC BY) license.