


Abstract
To accurately predict temperature rise due to the concrete hydration heat released from the #0 segment of a continuous concrete girder bridge at an early construction stage for structural design purposes, researchers proposed an approach incorporating empirical predictive formulae with a preliminary numerical analysis. However, due to the uniqueness of the structural geometry and material in each engineering case and the limited data shared by the whole engineering community, no universal predictive empirical model for temperature rise due to hydration heat has yet been identified for practical use that can be applied to a variety of different projects. Moreover, the preliminary numerical analyses are usually based on questionable assumptions and simplifications of the physical truth, the accuracy of which also requires further validation. To this end, the present research measured the time-varying temperature samples of early age massive concrete in the #0 segment of Huangsha Harbor Bridge (a twin-deck three-span continuous concrete box girder bridge located in Jiangsu Province, China) and examined the accuracy of the predictive empirical models formulated by other researchers and the usability of a numerical modal established on a commercial finite element (FE) platform by comparing the corresponding results with the data from the present field measurements. The results suggest that the empirical formulae proposed can generally effectively describe the actual temperature distribution patterns related to the thermal issue, but they are characterized by inferior usability in some cases. In addition, the present comparison also indicates that the actual maximum temperature rise can be correctly predicted by the preliminary FE analysis in most cases.
1. Introduction
Large mass concrete blocks are widely used structural components in bridge engineering, such as the #0 segments of continuous girder bridges constructed using the cantilever beam casting method (i.e., the cantilever roots). During the construction of large mass concrete components, the key issue concerning practical engineers is the effect of early-age hydration heat on the performance of concrete, which is different from the usual effects of externally applied elevated temperatures [1,2,3]. A lot of researchers’ attention has been on the issue of the unfavorable additional stress in concrete caused by hydration heat, which is released by and preserved in the material during the early stage of the construction process [4,5,6,7,8,9,10,11,12,13,14,15,16].
To deal with this issue, many researchers have jointly employed the field measurement approach and the numerical simulation technique in their studies [15,16,17]. Results reported by Wu and Liu [17], Taysi and Abid [15] and Schackow et al. [16] indicate that when the field measurement data reflecting the variations in the temperatures and/or the stresses at local positions are obtained for reference, the numerical models subsequently established can be effectively calibrated by adjusting the parameters in the initial model, which can then be reliably used to predict the whole time-varying temperature/temperature-induced stress field in the component to guide structural monitoring and maintenance. However, at the design stage, no field test can be performed to generate the actual samples of the physical parameters for use, and the proposed practice of employing the numerical model for structural behavior prediction at that time therefore suffers from unreliable accuracy due to non-calibration.
In this regard, Wu and Liu [17] and Zhang et al. [18] propose some empirical formulae obtained by mathematically fitting the physical test results, which, assisted by numerical analyses, are then used to predict the temperature field caused by the concrete hydration in specific bridge structures. However, due to the uniqueness of the structural geometry and material in each engineering case and the limited data shared by the whole engineering community, no universal empirical model that can be applied to a large variety of different projects to predict the hydration stress field of the #0 segments of continuous girder bridges has been acknowledged for practical use yet. In dealing with the issue, the present research measured the time-varying temperature samples of early age massive concrete in the #0 segment of the Huangsha Harbor Bridge (a twin-deck three-span continuous concrete box girder bridge located in Jiangsu Province, China) and examined the empirical predictive models formulated by Wu and Liu [17] and Zhang et al. [18] based on the data from the present field measurements for structural engineers’ practical applications. Therefore, the emphasis of the present research is on practical aspects. Actually, the traditional temperature field prediction method that integrates the FE analysis and the empirical models is validated in this article via its comparison with the field measurement data, which has rarely been done by the engineering community before. The obtained results are therefore of significant practical importance for guiding future structural design works.
2. Engineering Background and Field Measurement Plan
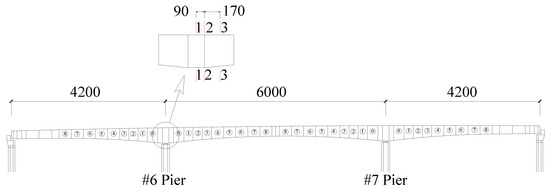
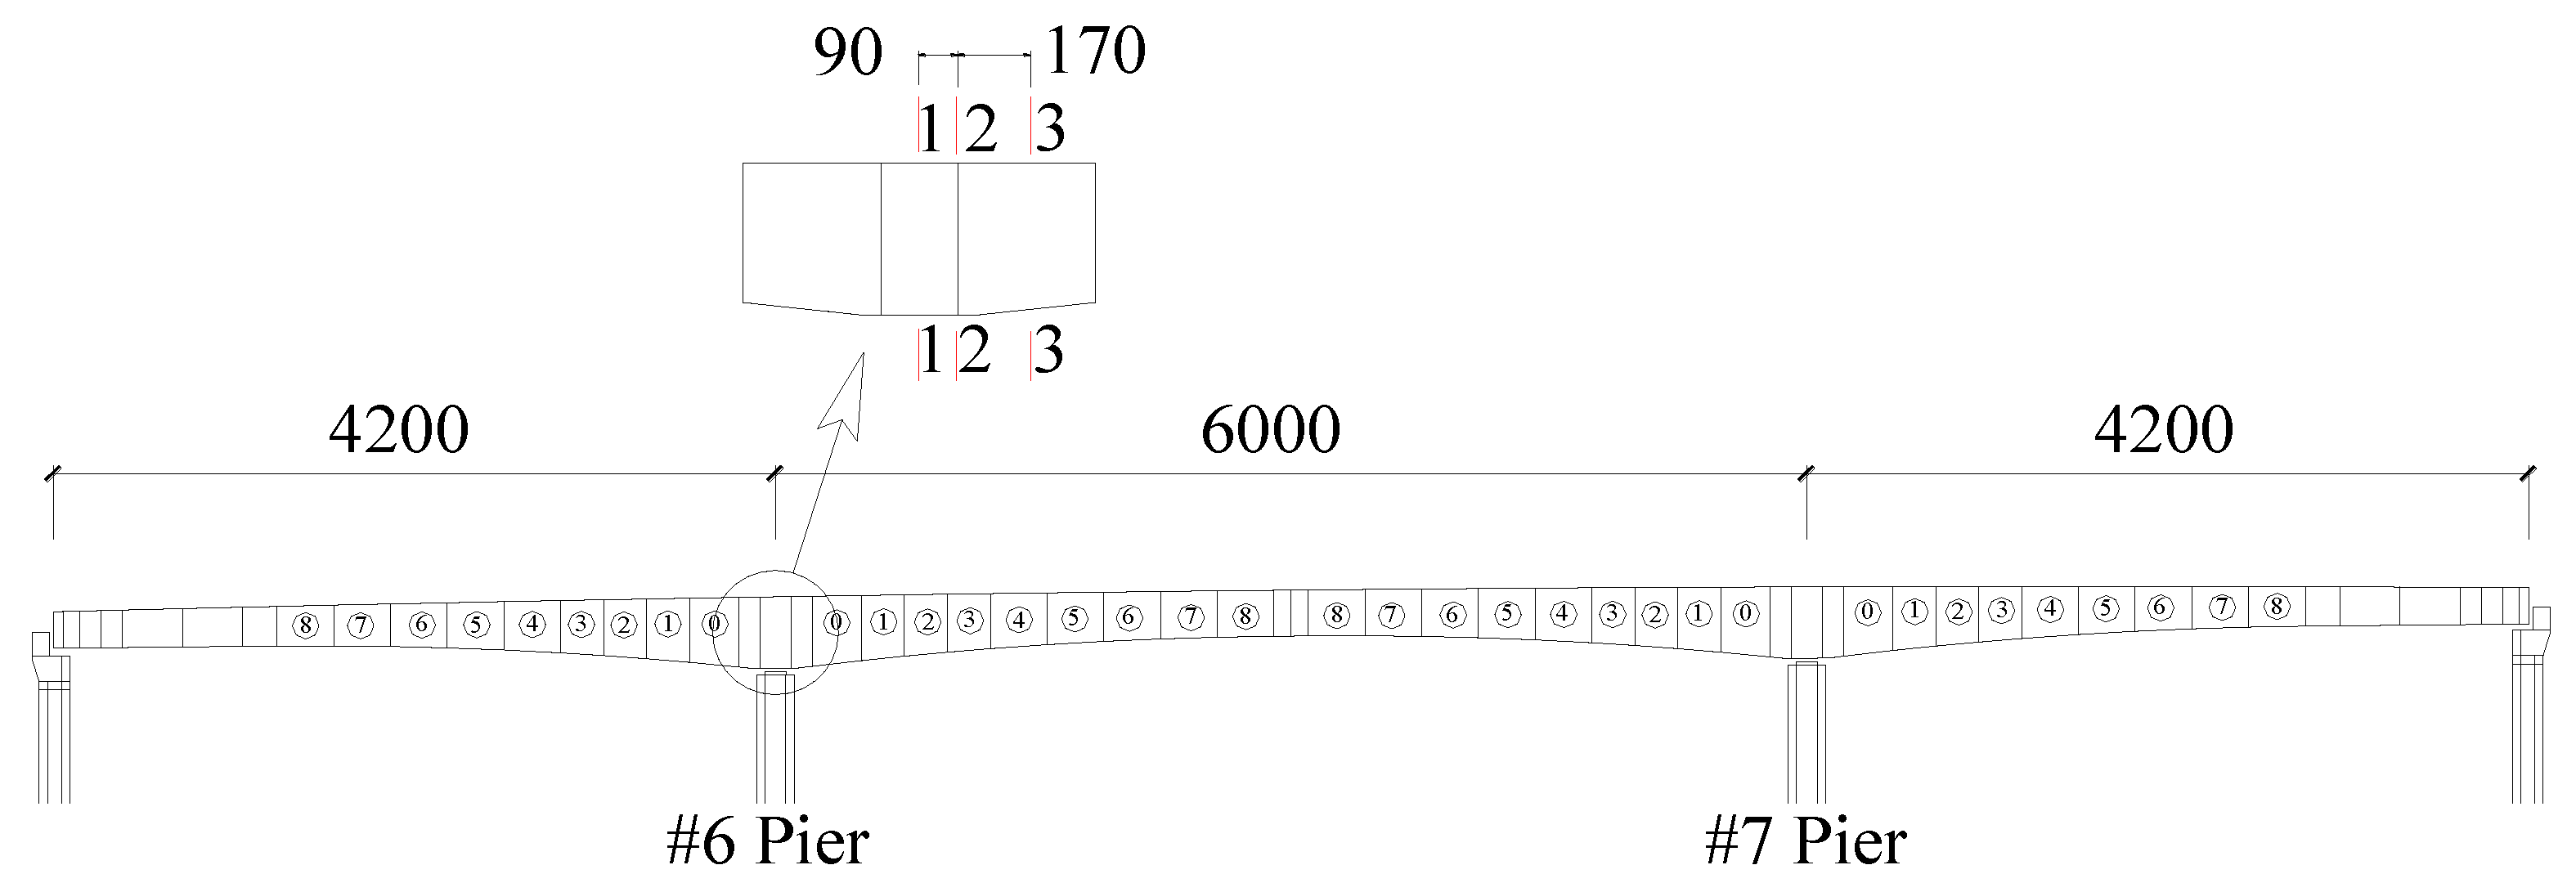
Huangsha Harbor Bridge has a total length of 1431 m and a width of 24.5 m. Designed to cross the Huangsha Harbor River, the main bridge is a twin-deck three-span (42 m + 60 m + 42 m) continuous concrete box girder structure with pre-stressing forces applied longitudinally (see Figure 1). The bridge was constructed utilizing the symmetric cantilever casting method. The box girder of each deck has a varying single-cell straight cross-section with a width of 12 m (see Figure 2).
Figure 1.
Elevation of Huangsha Harbor Bridge and measurement cross-sections (unit: cm).
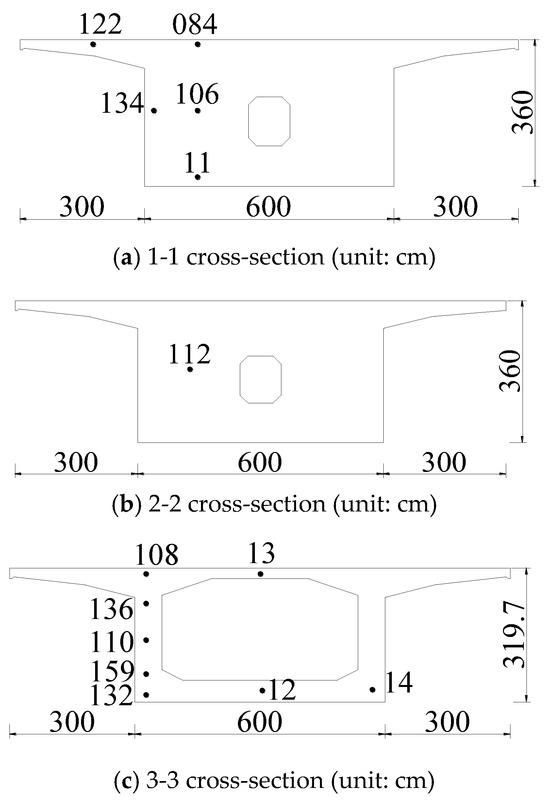
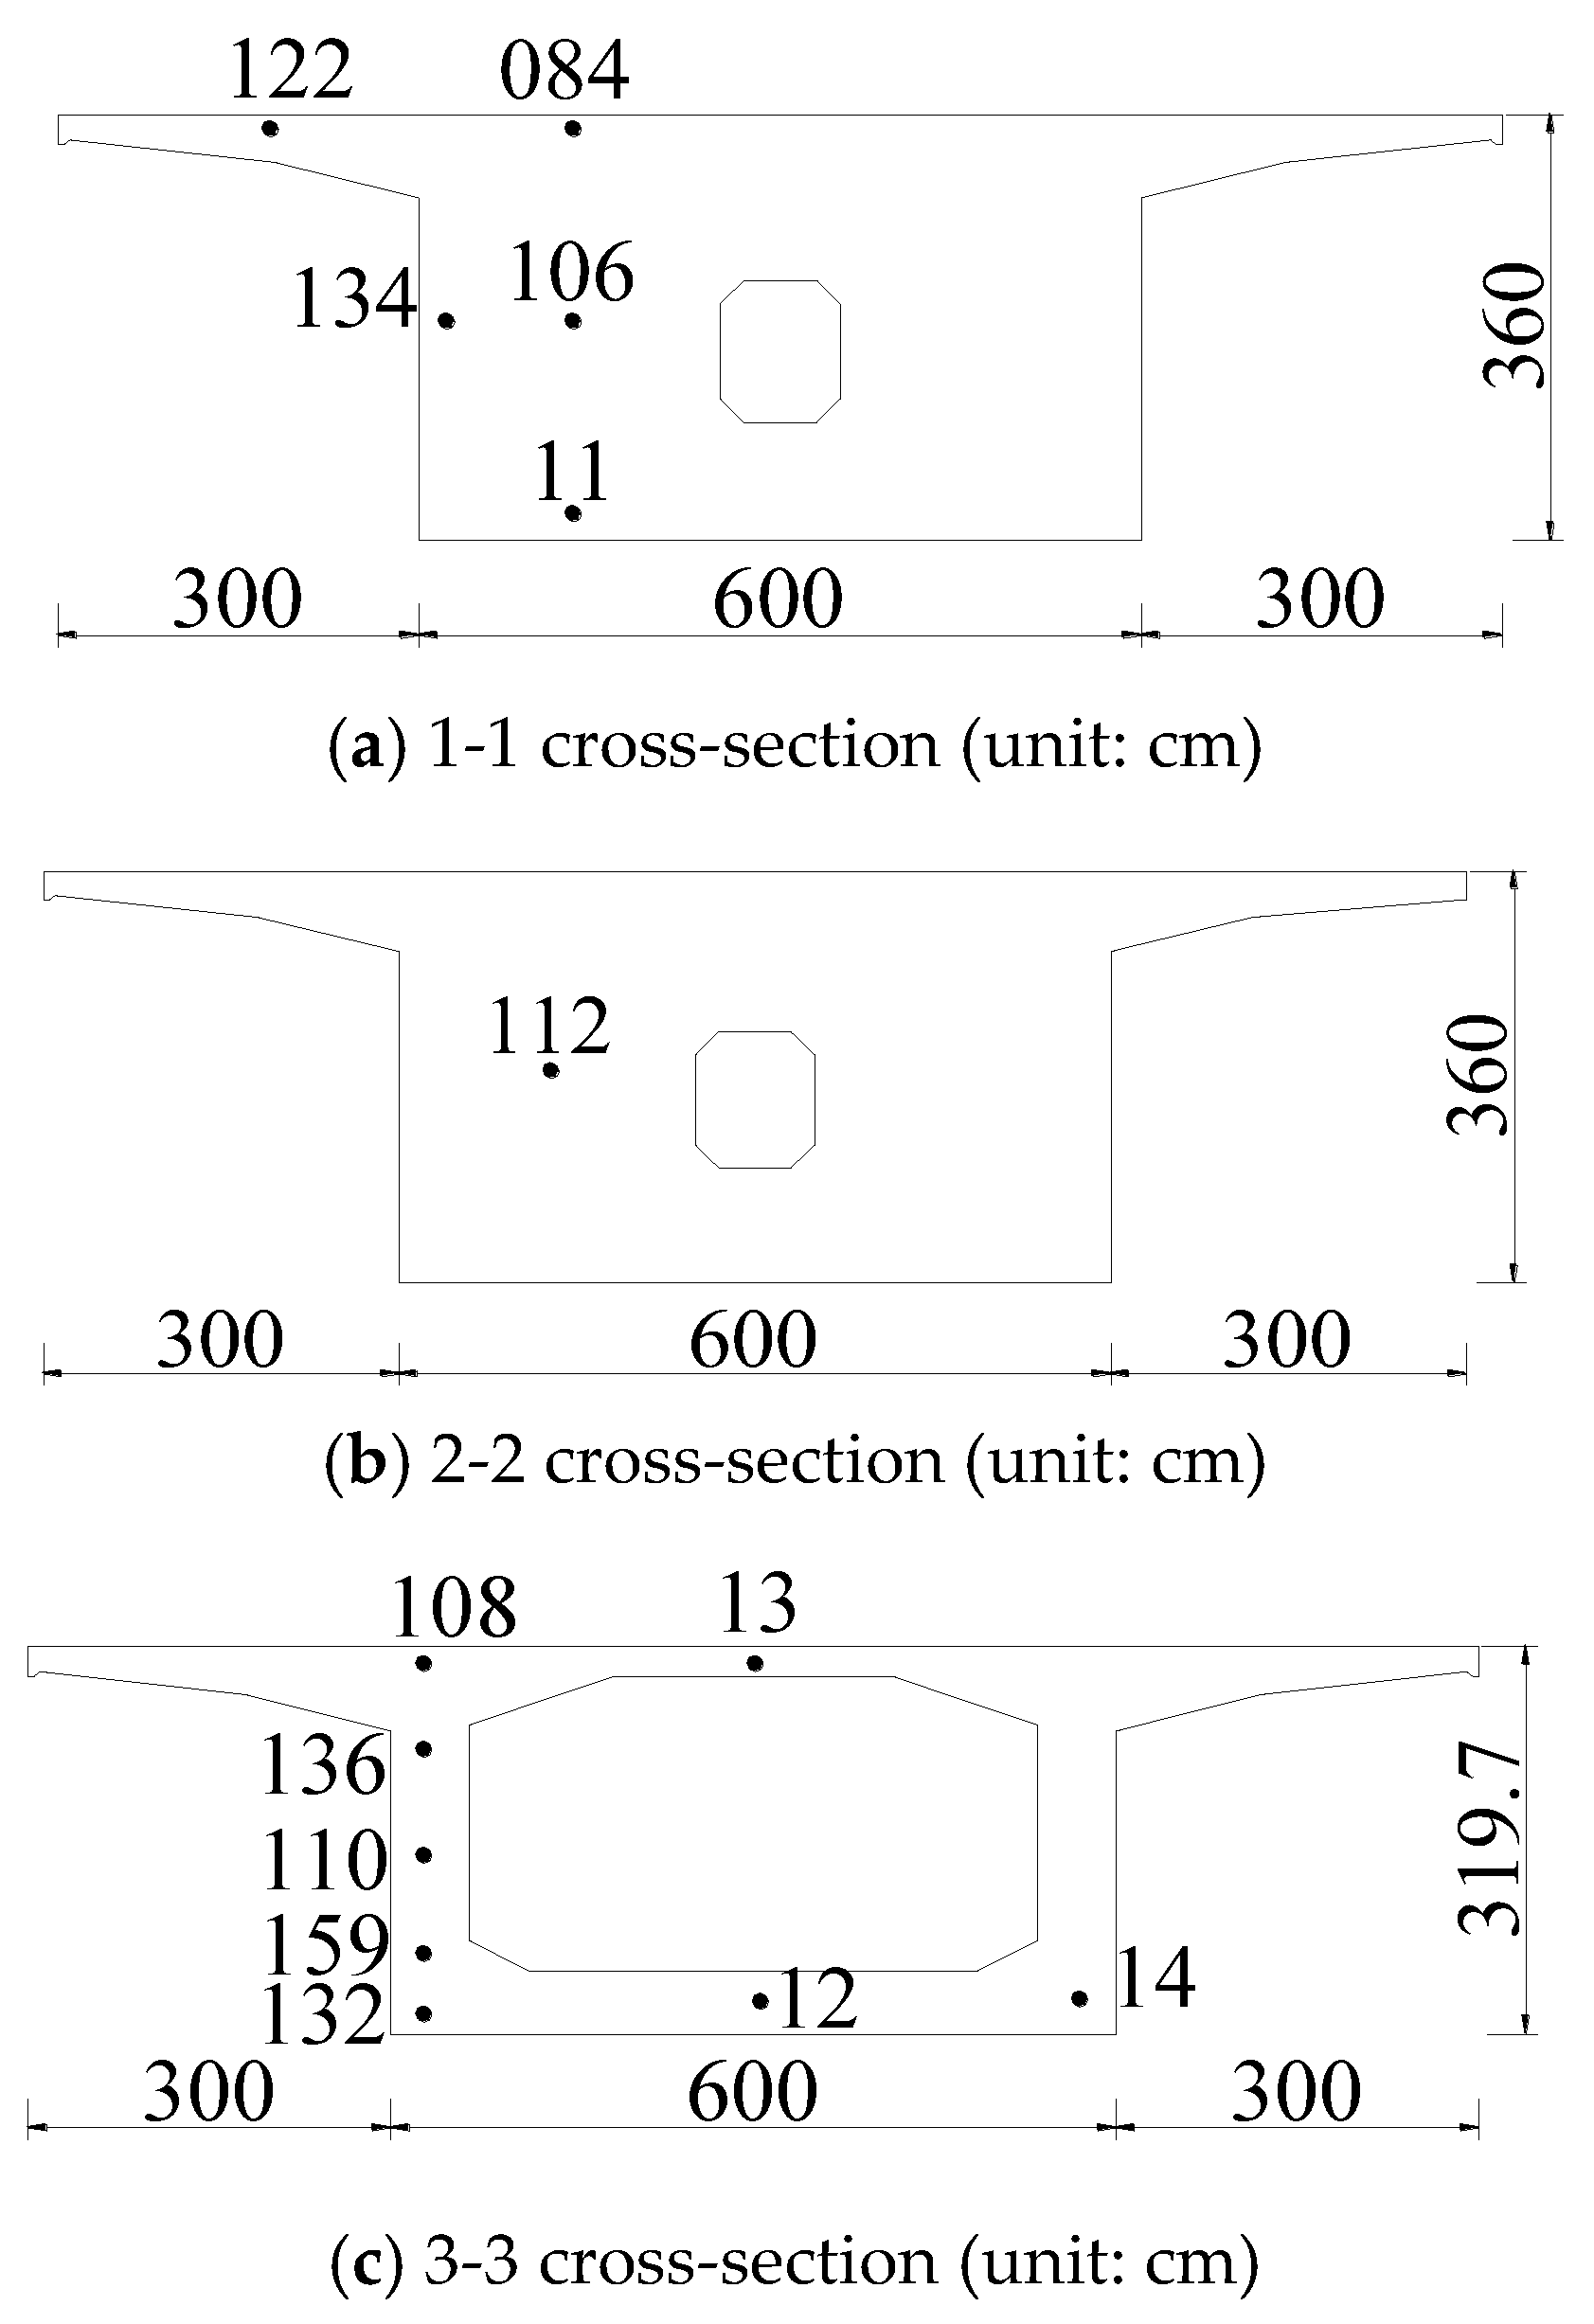
Figure 2.
Measurement point arrangement on cross-sections in #0 segment at #6 pier.
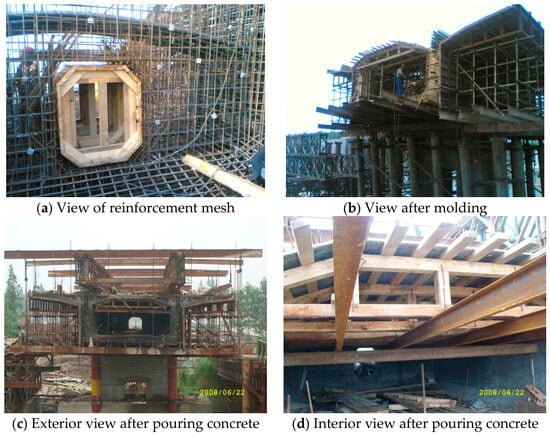
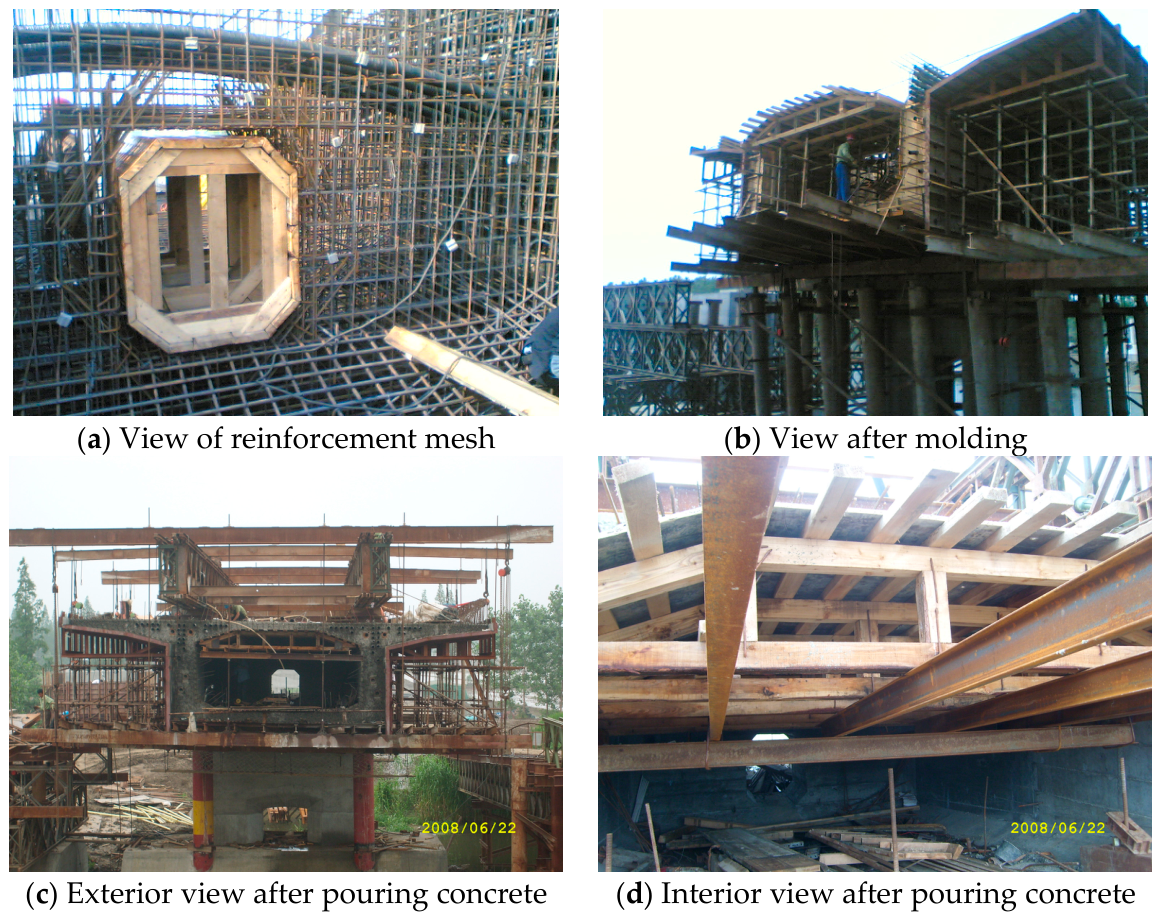
The concrete of the #0 segment above the #6 pier was poured on 20 June 2008 (see Figure 3 for the actual engineering scenario), and in the process of the construction, 14 temperature sensors were arranged on three cross-sections (see Figure 1 and Figure 2) to obtain the temperature time histories at those positions during the whole construction process. For sections 1-1 and 3-3, the arrangements of the sensors can help reflect the temperature gradients in the vertical and the transverse directions on these cross-sections. Comparing the measurement results of all the three cross-sections, the temperature gradient along the longitudinal direction can be revealed.
Figure 3.
Views of actual engineering scenario.
3. Field Measurement Data
3.1. Data on 1-1 Cross-Section
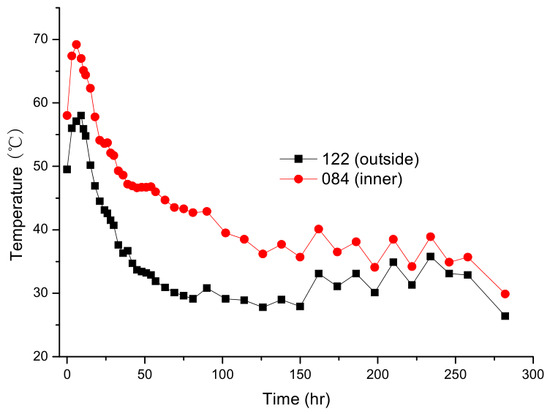
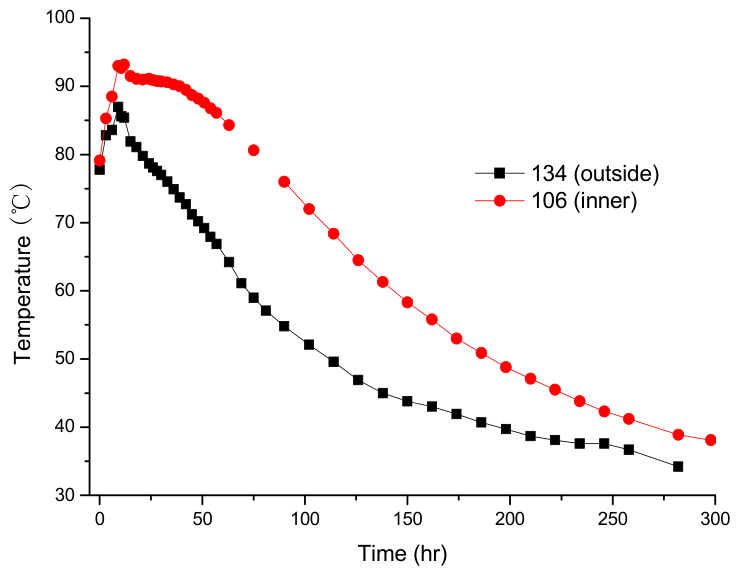
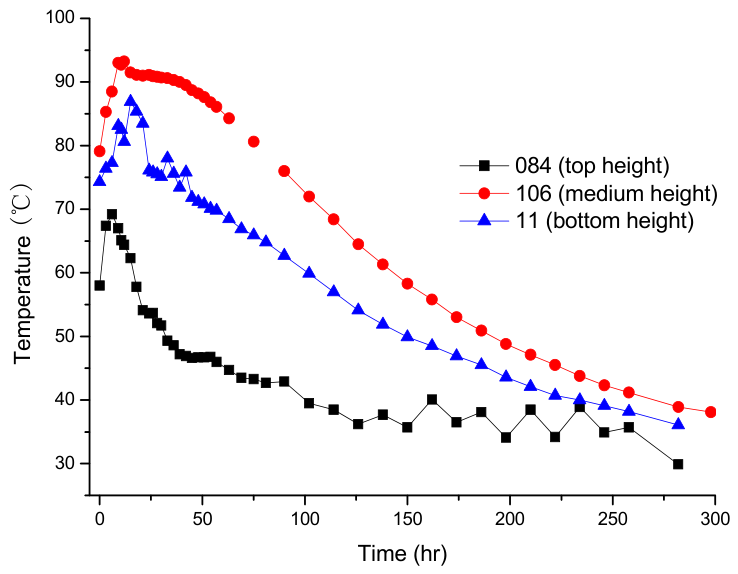
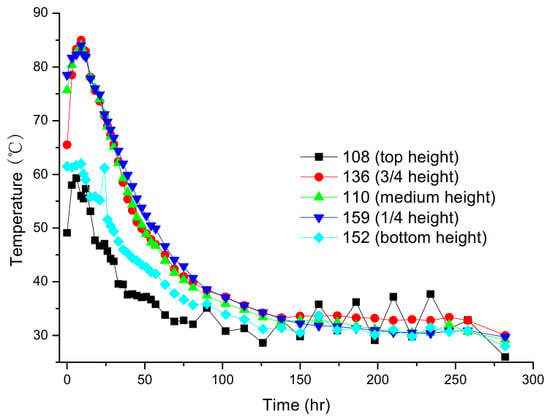
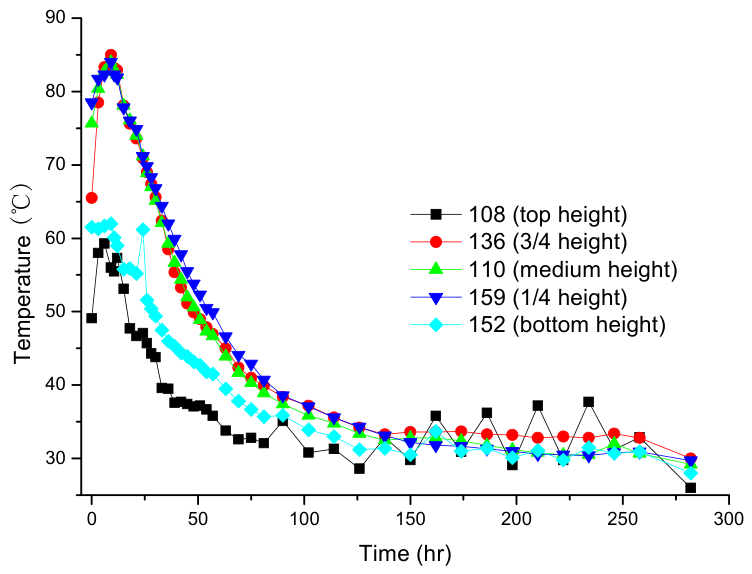
Temperature time histories are shown in Figure 4, Figure 5 and Figure 6, measured from the time when the concrete was poured to 300 h later using the five sensors arranged on the 1-1 cross-section. As can be seen in these figures, all the temperature samples measured follow a pattern of first sharply rising to the maximum (reaching the maximum at around 10 h after the pouring of the concrete) and then gradually decreasing and stabilizing (comparatively stable from 150 h after the pouring of the concrete). This observation agrees with the generalized observation [19] and the rule of physics. According to Tanabe et al. [20], for the case of adiabatic temperature rise, the release of the hydration heat in massive concrete with time can be described using the exponential model
in which is the adiabatic temperature rise at time t; is the final adiabatic temperature rise; and is the coefficient of the temperature rise. Apparently, the temperature variation patterns presented in Figure 4, Figure 5 and Figure 6 do not comply with Equation (1), as the heat exchange exists between the massive concrete and the outside environment. However, the maximum of the temperature sample measured is basically associated with the total released heat of the concrete and fairly compares with the theoretical final adiabatic temperature rise, which can be calculated according the equation below:
where is the amount of cementitious material in the per unit volume of concrete; is the total hydration heat of the concrete; is the specific heat; and is the density of the concrete.
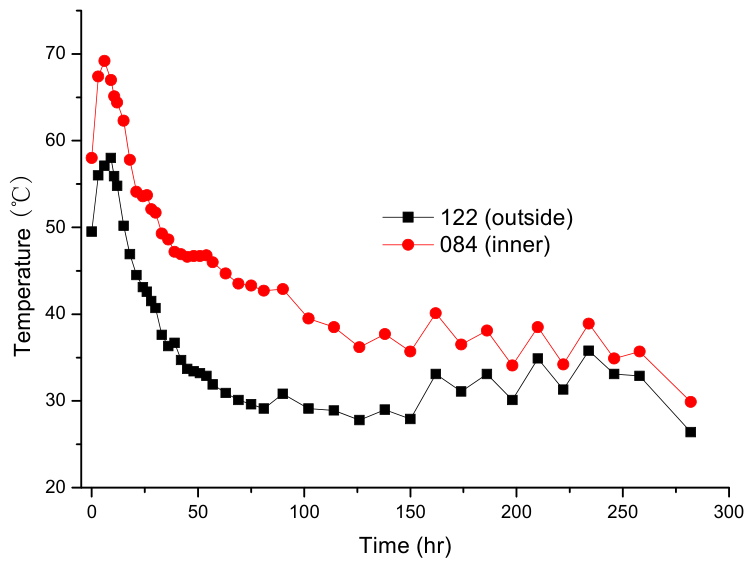
Figure 4.
Temperature samples measured on the upper surface of the 1-1 cross-section.
Figure 5.
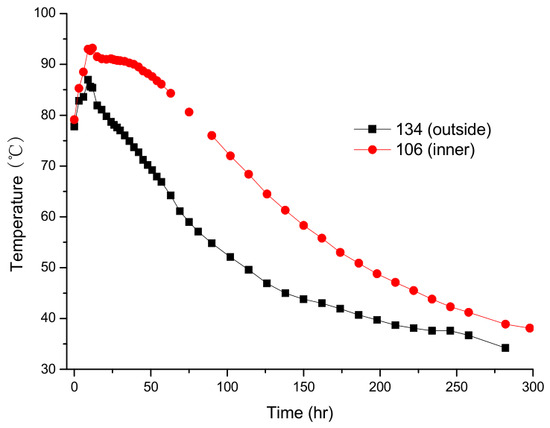
Temperature samples measured at the medium height of the 1-1 cross-section.
Figure 6.
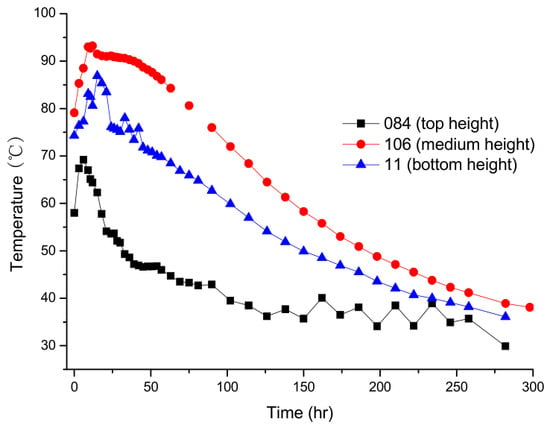
Temperature samples measured along the vertical direction of the 1-1 cross-section.
As shown in Figure 4, the temperature measured at an outside point on the upper surface of the 1-1 cross-section is smaller than that measured at an inner point throughout the construction process. The maximum temperatures identified on the two curves shown in Figure 4 are 58 °C and 69.2 °C for the outside point and the inner point, respectively. There is a similar situation observed in Figure 5 at the medium height of the 1-1 cross-section. According to Figure 6, which compares the temperature samples measured at three different heights along a vertical line on the 1-1 cross-section, the temperature measured is greater for the medium height than for the bottom height; moreover, the temperature measured is even greater for the bottom height than for the top height. In Figure 6, the maximum temperatures identified at the top measuring point, the medium measuring point and the bottom measuring point are 69.2 °C, 93.2 °C and 86.9 °C, respectively.
3.2. Data on 3-3 Cross-Section
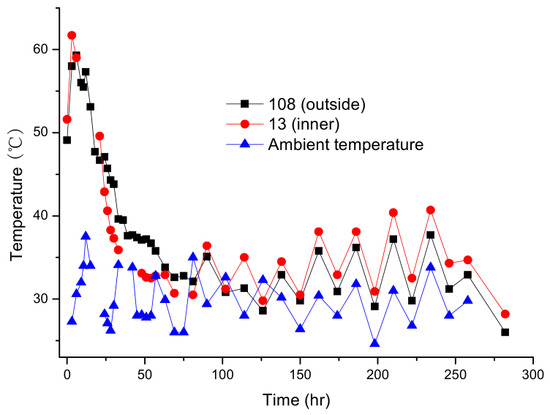
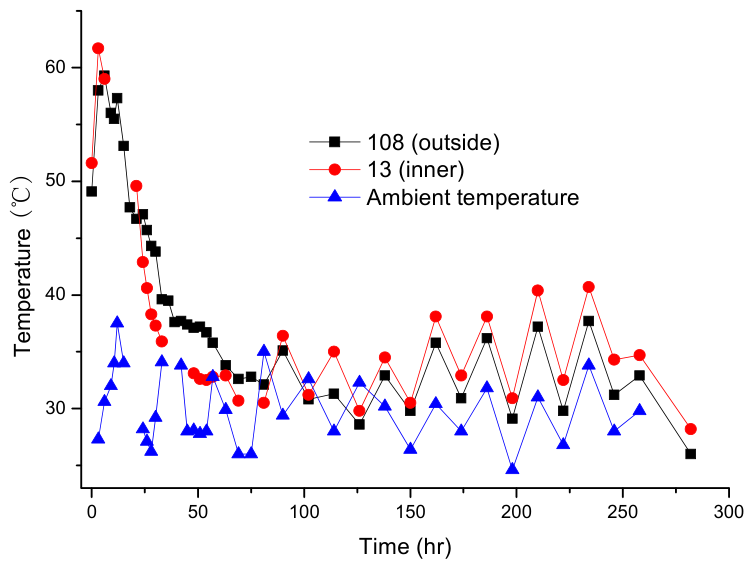
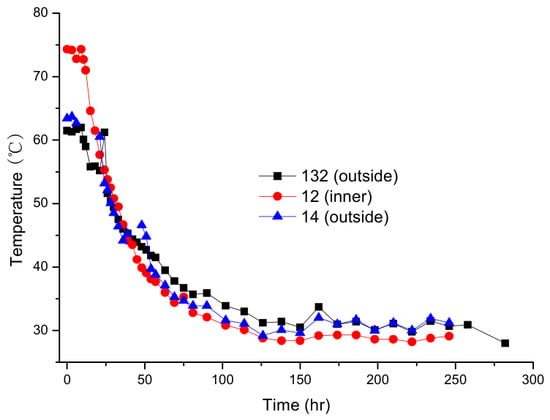
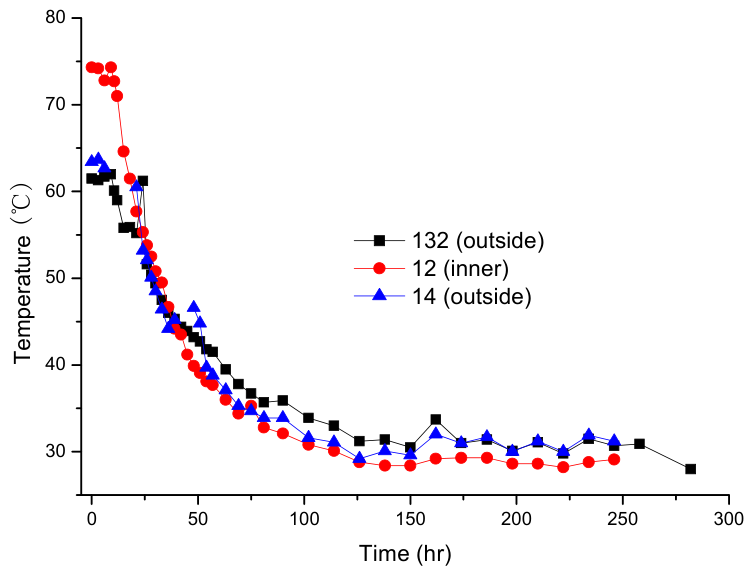
Temperature time histories measured during the construction process using the eight sensors arranged on the 3-3 cross-section are shown in Figure 7, Figure 8 and Figure 9. As shown in Figure 7 and Figure 8, the temperatures measured on the outside points are very close to those measured on the inner points throughout the construction process (this observation applies to both the top plate (Figure 7) and bottom plate (Figure 8) of the 3-3 cross-section). This is probably due to the fact that both the outside points and the inner points are located near the external surfaces of the beam body, where the concrete can effectively exchange heat with the outside environment in all cases. Comparing the data shown in Figure 7 with those shown in Figure 4, it can be noted that the temperature measured is greater on the 1-1 cross-section than on the 3-3 cross-section, which agrees with the fact that the 1-1 cross-section is at the root of the cantilever, while the 3-3 cross-section is close to the end of the cantilever. Moreover, as can be seen, periodic fluctuations can be observed at the later stages of the temperature time histories shown in Figure 7, which are most probably due to the diurnal variations in ambient temperature. Therefore, the ambient temperature time history obtained on location is added in Figure 7 to compare the temperature samples measured on the top plate of the 3-3 cross-section. This comparison indicates significant effects of the ambient temperature.
Figure 7.
Temperature samples measured on top plate of 3-3 cross-section.
Figure 8.
Temperature samples measured on bottom plate of 3-3 cross-section.
Figure 9.
Temperature samples measured along vertical direction of 3-3 cross-section.
3.3. Data Along the Longitudinal Direction
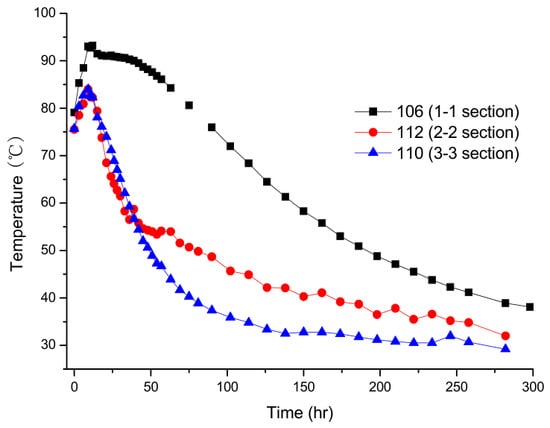
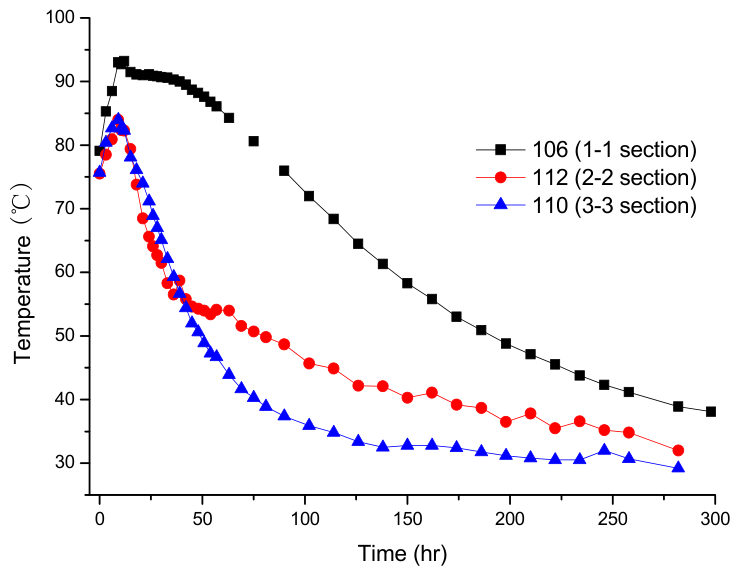
The temperature samples measured at the corresponding points on the three cross-sections shown in Figure 1 are compared in Figure 10, which suggests that the measured temperature is greater in the temperature drop stage when the measuring point is closer to the root of the cantilever beam.
Figure 10.
Temperature samples measured along longitudinal direction.
3.4. Maximum Temperature Differences in Concrete Mass
The key to the temperature control of large-volume concrete is usually not only the peak temperature but also the temperature difference and the resulting temperature stress and cracking risk. Therefore, the maximum temperature differences in concrete mass—including the maximum internal temperature, the maximum surface temperature, the maximum temperature difference between the core and surface, the maximum vertical temperature difference, the maximum lateral temperature difference, and the maximum longitudinal temperature difference—and the time of occurrence of these indicators are calculated and listed in Table 1 for the readers’ reference.
Table 1.
Maximum temperature differences in concrete mass.
4. Numerical Simulation
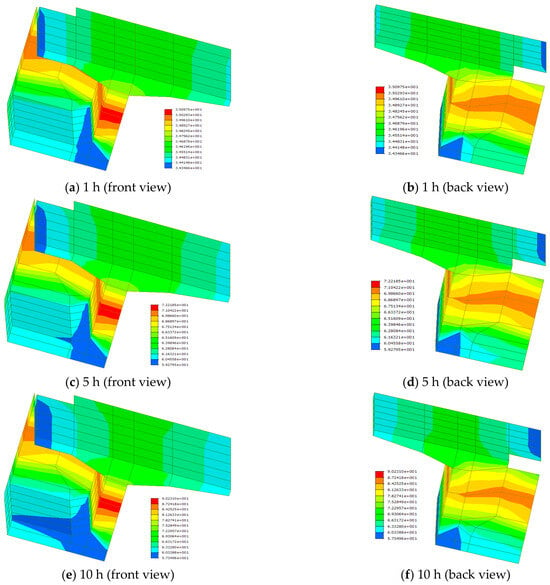
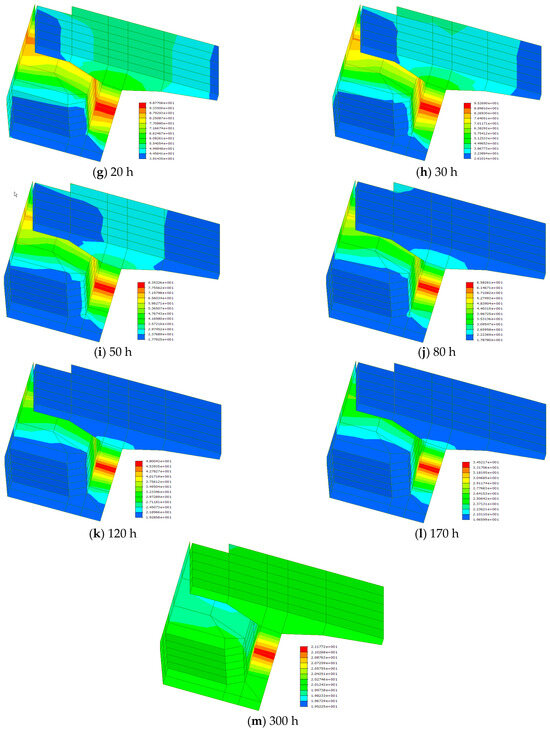
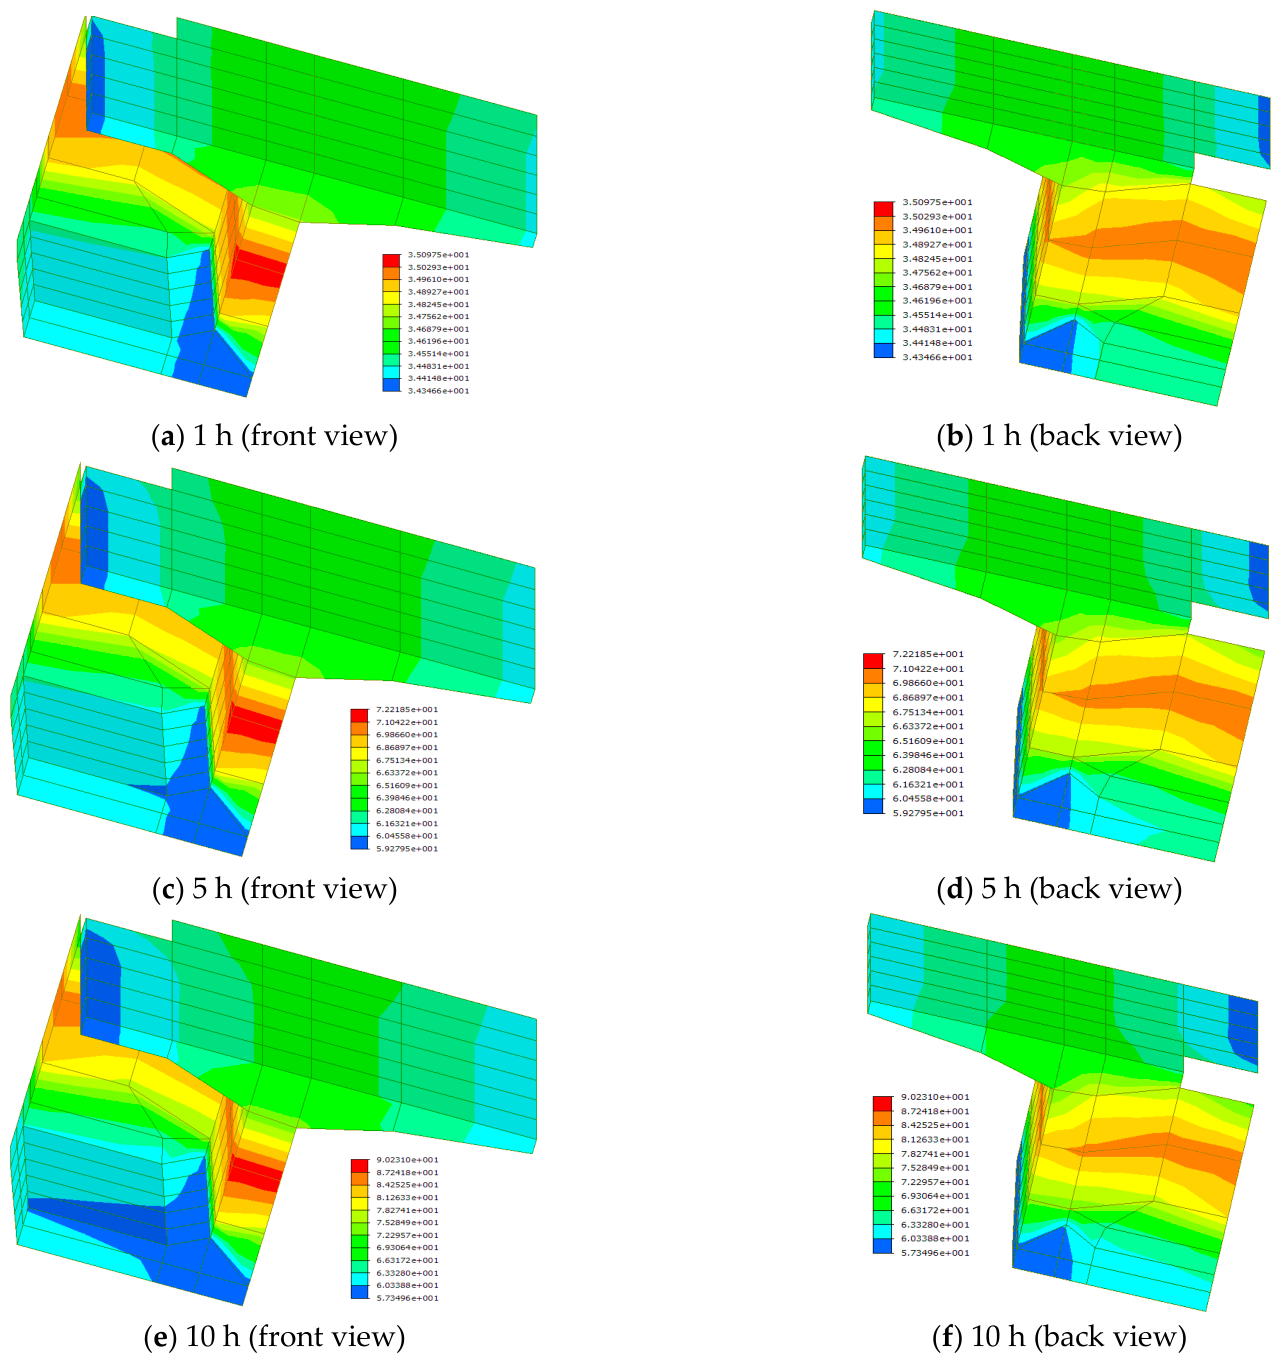
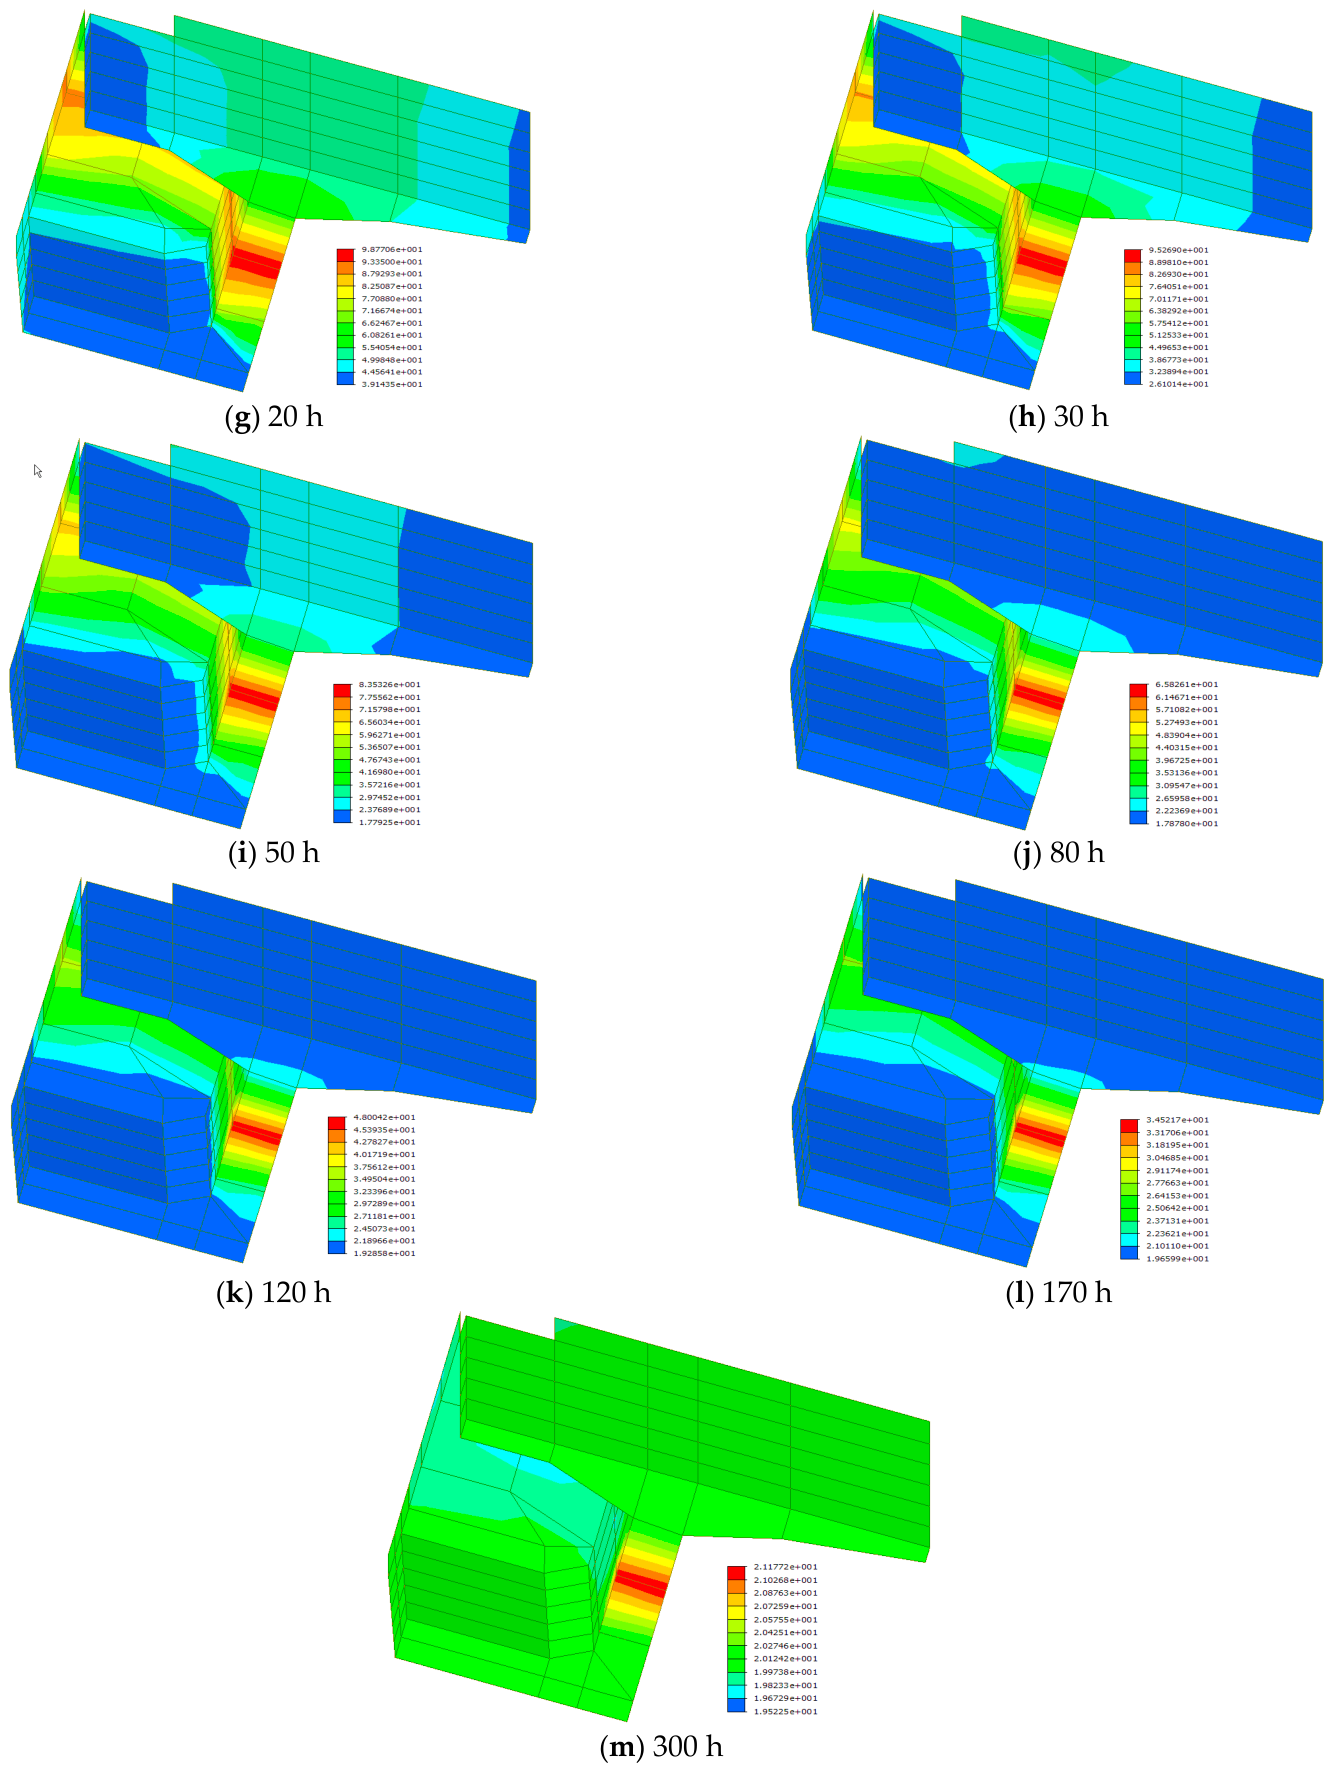
Considering the symmetry of the #0 segment, only one-quarter of the concrete block has been modeled on the MIDAS commercial finite element (FE) platform (Version 6.71); 85 hexahedron 3D elements have been employed to simulate the 1/4 part of the #0 segment. Symmetrical boundaries have been set at the corresponding interfaces, and a fixed boundary has been set at the bottom surface of the #0 segment, since the concrete block sits on the pier with its bottom fixed on the top of the pier. With reference to Zhang et al. [18] and according to the material properties for the present engineering project, the physical parameters for the calculation of the hydration heat are listed in Table 2. Following the procedures indicated in ref. [21] for typical concrete hydration heat analyses on the MIDAS platform, the numerical simulation has been performed for the #0 segment of Huangsha Harbor Bridge, with the results in the form of temperature contours shown in Figure 11.
Table 2.
Physical parameters for simulation of hydration heat.
Figure 11.
Temperature contours for a quarter of #0 segment at different times after concrete pouring (unit: °C).
On the contours in Figure 11, the temperature reaches the maximum at the medium height in the 1/4 part of the #0 segment throughout the time history (1~300 h), which agrees with the rule demonstrated in Figure 6 and Figure 9. In addition, as can be seen on each subfigure in Figure 11, the temperature on each cross-section does not vary too much along the lateral direction, which strongly agrees with the observation made for Figure 4, Figure 5, Figure 7 and Figure 8. However, the numerical simulation does not reflect the observation made via the field measurement that the temperature is greater when the measuring point is closer to the root of the cantilever beam (Figure 10).
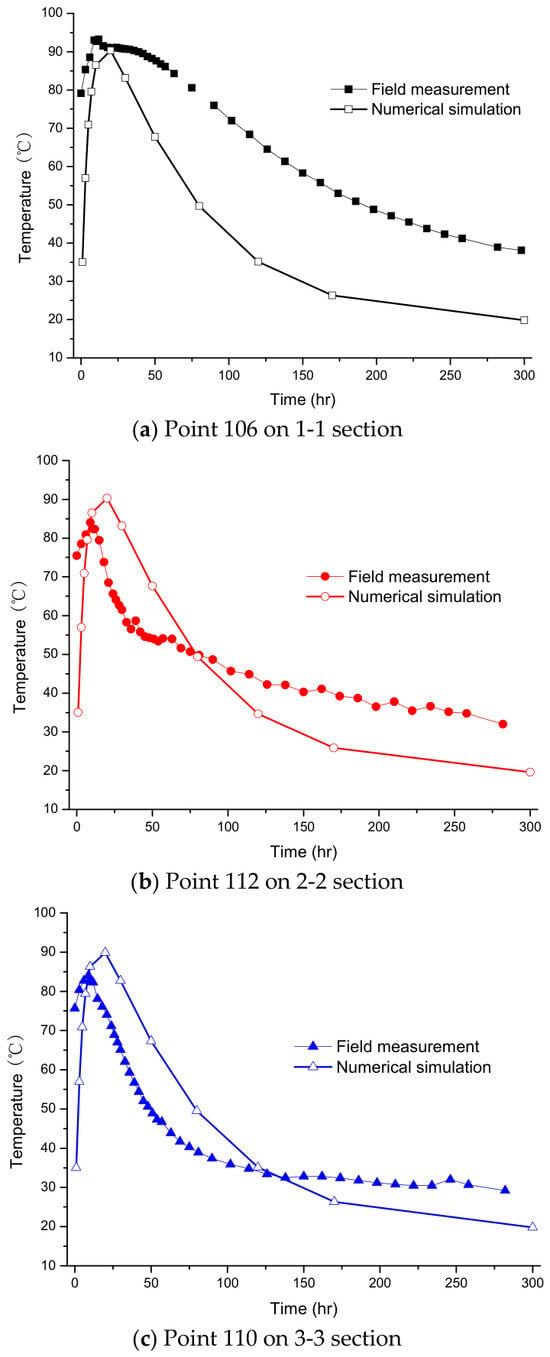
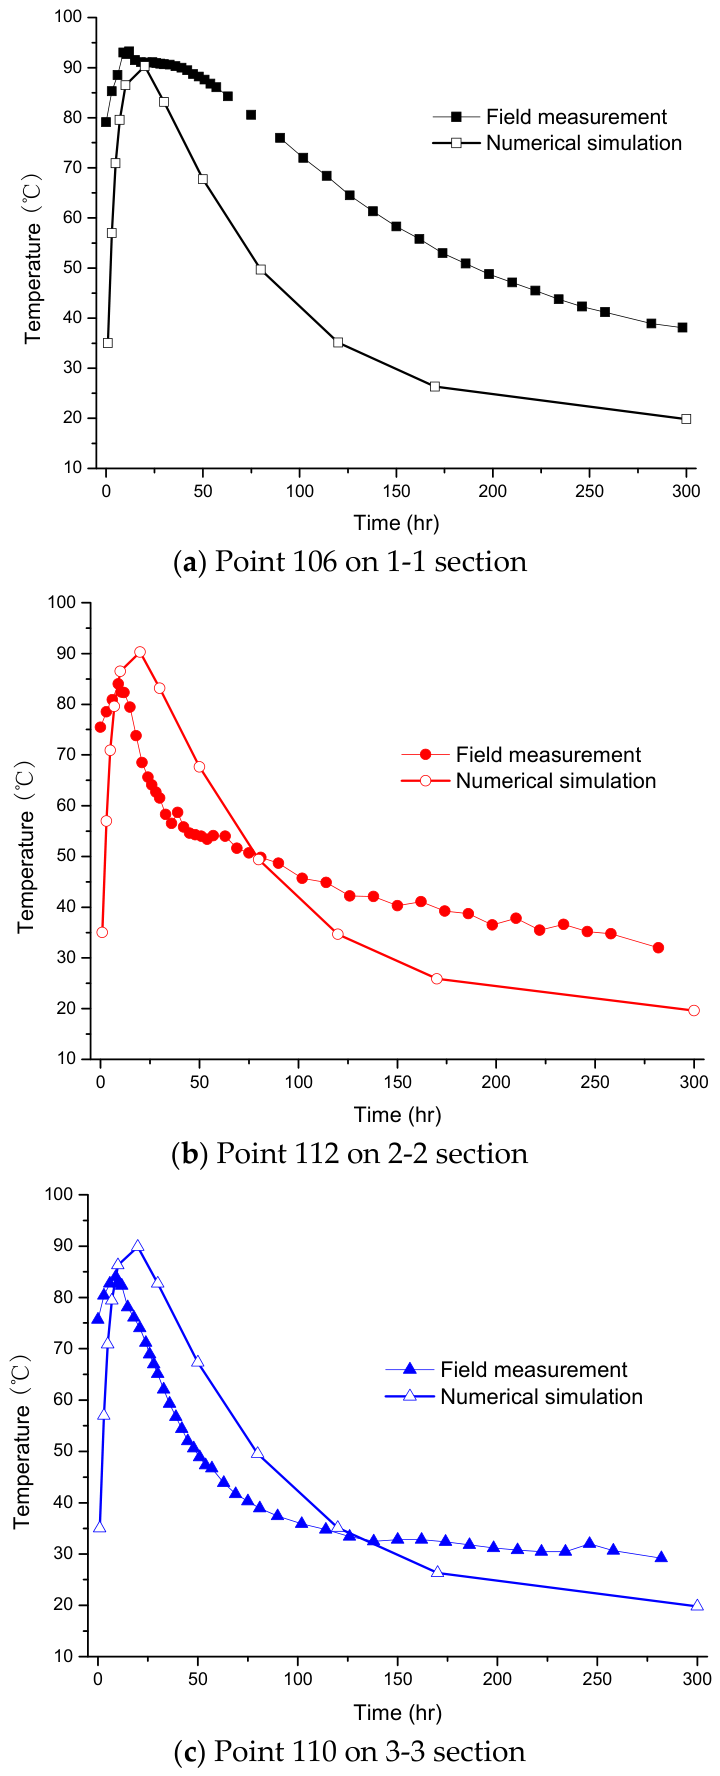
Figure 12 further compares the temperature time history samples at three points (points 106, 112 and 110) obtained from the field measurement and the numerical simulation, respectively. As can be seen, the maximum temperatures identified for the field measurement samples can basically be correctly reproduced from the corresponding numerical thermal analysis. In addition, when the points are closer to the free end of the cantilever beam (see Figure 12b,c), the numerical simulation data agree with the field measurement results comparatively well throughout the time domain. However, when the point is closer to the root of the cantilever beam (see Figure 12a), the agreement between the two sets of data is not good. As shown in Figure 12a, the field measurement result is much greater than the numerical simulation data during the temperature drop stage for point 106 on the 1-1 section, indicating that the numerical simulations of the concrete hydration heat on usual commercial FE platforms might not be very accurate. Since factors exist in conjunction with the actual construction process (such as the heat storage effect of the pier and crossbeams, construction joints, thermal resistance of formwork and supports, fluctuations in actual ambient temperature, deviations in material thermal parameter values, simplification of boundary heat transfer conditions, and subsequent construction activities), the measured temperature is significantly higher than the simulated temperature. The predictive empirical formulae proposed by Wu and Liu [17] and Zhang et al. [18] for concrete hydration heat analyses of #0 segments at the design stage must be assisted by the numerical simulation methods in use; therefore, in-depth data analyses should be carried out to check the validity of the approaches proposed by Wu and Liu [17] and Zhang et al. [18] that are based on the numerical simulation.
Figure 12.
Comparison of field measurement and numerical simulation data.
5. Data Analyses
5.1. Empirical Formulae Proposed by Wu and Liu [17] and Zhang et al. [18]
According to Wu and Liu [17], for the required data analyses to take place, the measured temperature rise should be non-dimensionalized to generate the maximum temperature rise coefficient using Equation (3):
in which is the molding temperature of the concrete (27.3 °C for the present case); is calculated to be 74.08 °C for the present case.
In general, a typical box girder cross-section can be separated into three parts, i.e., the top plate, the bottom plate and the web plates. According to Wu and Liu [17] and Zhang et al. [18], the distributed along the width on the top and bottom plates follows the binomial Gaussian function:
in which is the maximum temperature along the width of the plate that should be calculated via the numerical simulation when the empirical model is in practical use; is the horizontal distance from the measuring point to the center of the plate; and is the horizontal distance from the point of the maximum temperature to the center of the plate.
According to Zhang et al. [18], the distribution of temperature rise coefficients along the height of the web plate could be regarded as a constant, which, however, disagrees with the present observation made via the physical test and the numerical simulation in Section 3.2 and Section 4, respectively. According to Wu and Liu [17], the distribution of the temperature rise coefficient along the height of the web plate is not a constant at the early stage of the construction process (0~9 days), obeying the piecewise function. It tends to be a constant later. Equation (5) can be utilized to describe the coefficient according to Wu and Liu [17]:
in which H and h are the height of the web and the vertical height difference between the measuring point and the point of the maximum temperature on the web.
As suggested by Wu and Liu [17], for intermediate crossbeams constructed using layered casting, each casting layer can be regarded as a large-volume concrete plate, and the temperature distributions on the bottom and the middle layers along the layer width basically follow the Gaussian function, as expressed by Equation (6).
5.2. Rule of Maximum Temperature Rise in Time Domain
Using the measured maximum temperature rise (the maxima of the measured temperature time history sample), the maximum temperature rise coefficient can be obtained according to Equation (7):
Following this treatment, the values for all measured samples shown in Section 3 are calculated and listed in Table 3.
Table 3.
Maximum temperature rise coefficients measured on location.
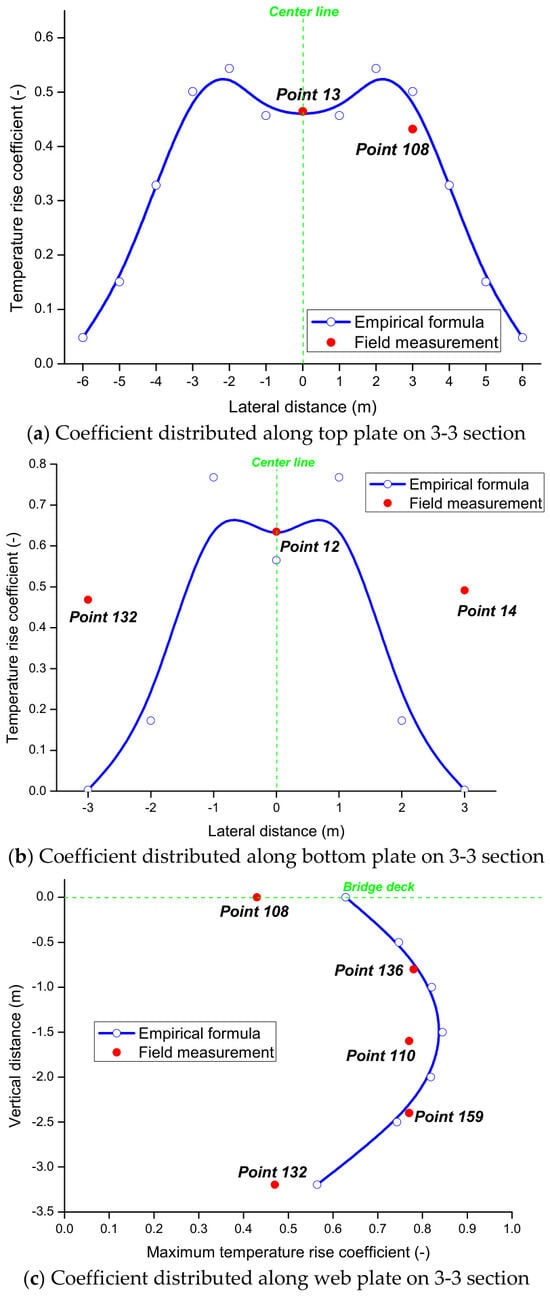
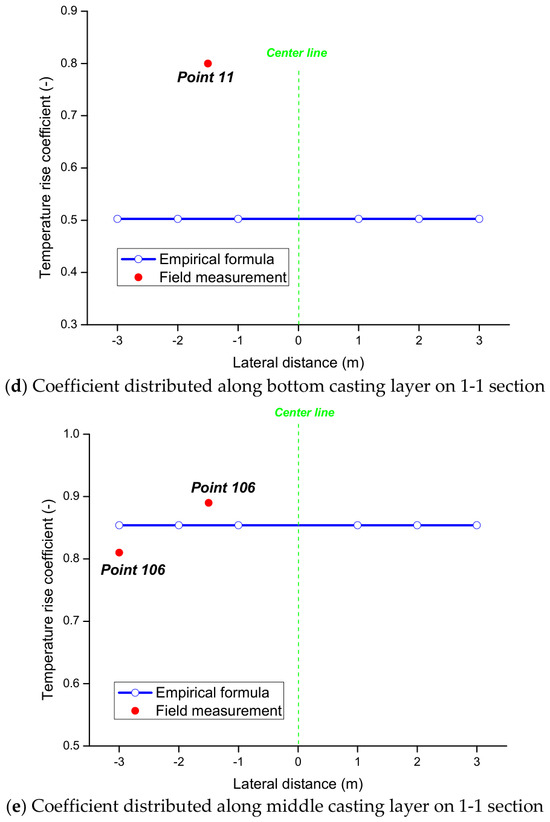
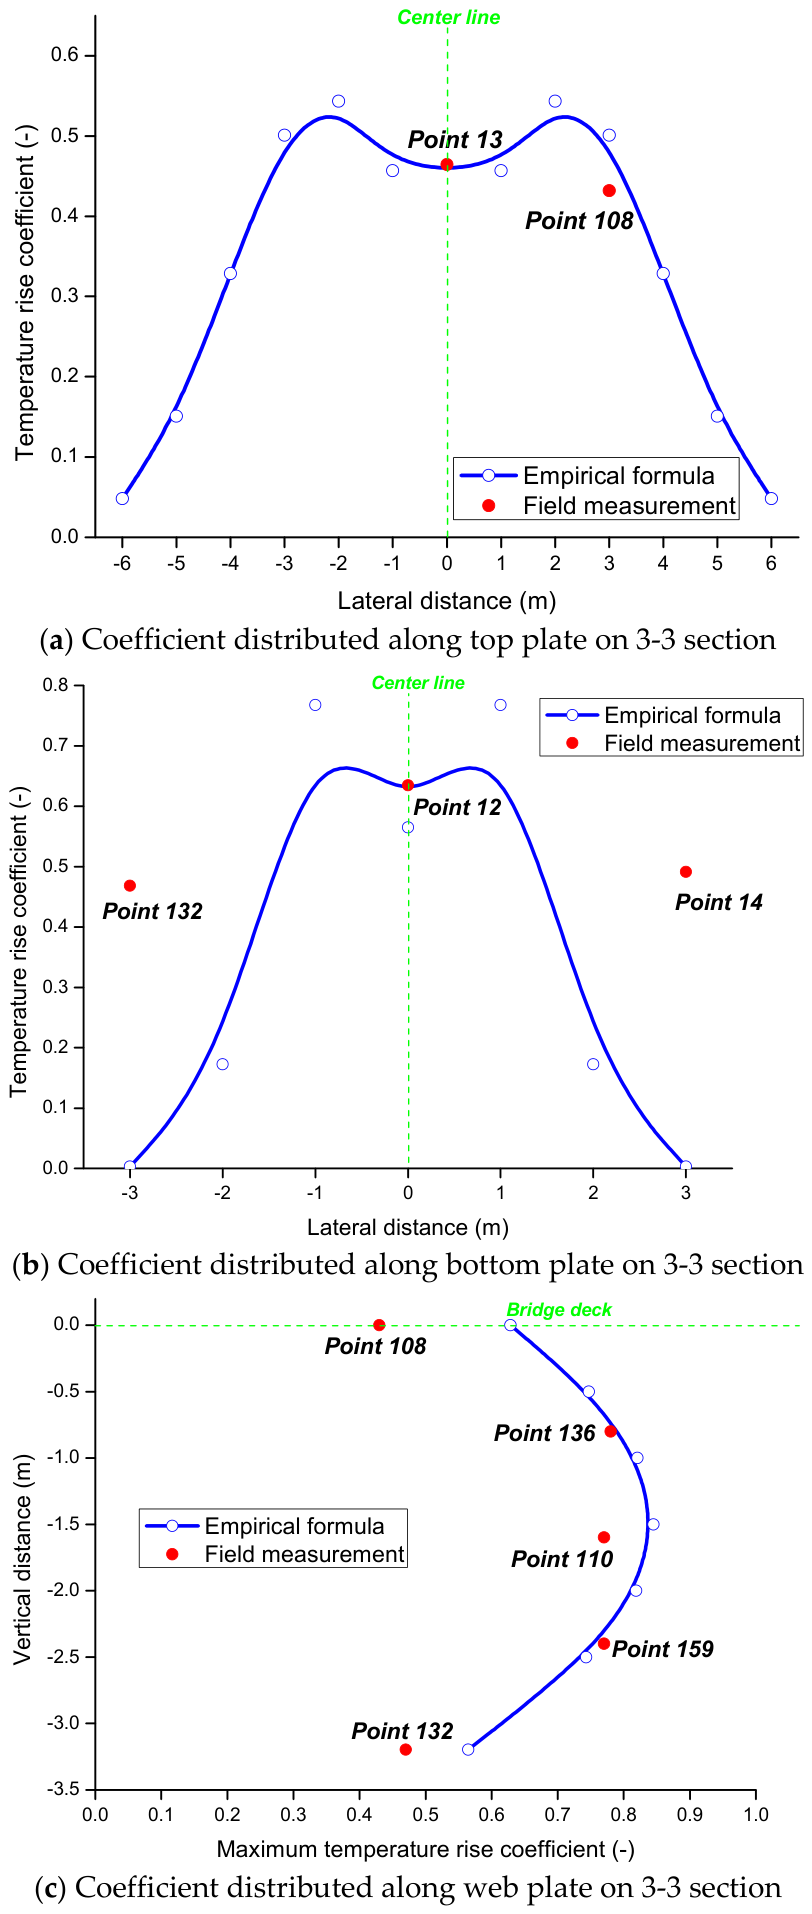
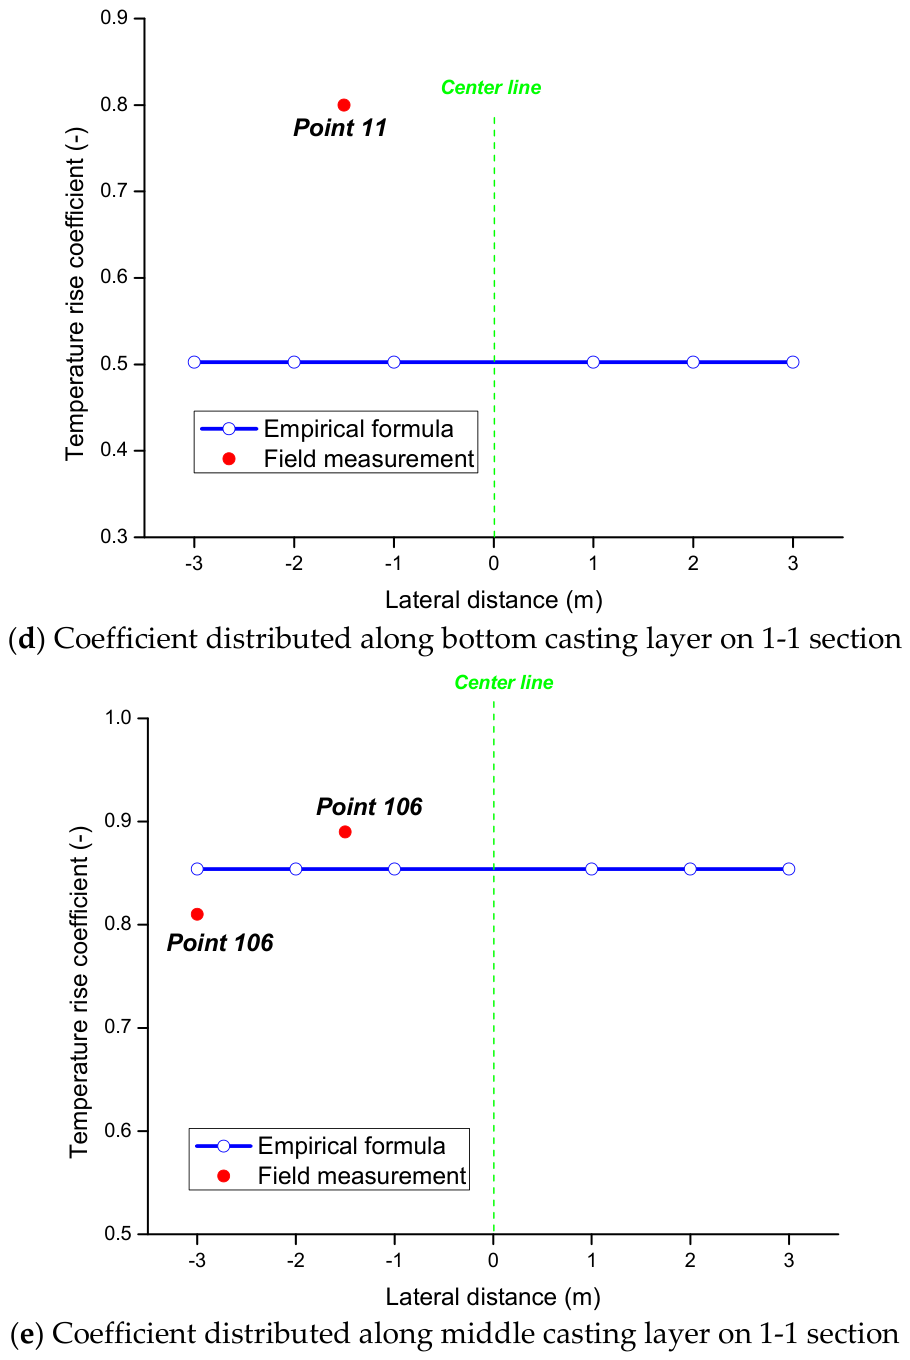
Using Equations (4)–(6) with the , the maxima identified for the numerical temperature samples calculated in Section 4 at the critical position (where the temperature rise reaches the maximum within the geometry of the component), being substituted into them, the distributions of the maximum temperature rises on the top plate, the bottom plate and the web plates on the 3-3 cross-section and those on the bottom and the middle casting layers on the 1-1 cross-section are estimated and compared with the corresponding field measurement data presented in Table 3 (see Figure 13).
Figure 13.
Distributions of maximum temperature rise coefficient on 3-3 and 1-1 cross-sections.
As can be seen in Figure 13a, for the top plate in the box girder section, the empirical formulae demonstrate applicability under the investigated conditions on both the side of the box and the center line. However, as shown in Figure 13b, for the bottom plate in the box girder section, the empirical formula produces very accurate predictions at the position of the center line, but the agreements between the predictions and field measurement data are not good for the two sides of the box. For the web plate on the box girder section, the agreements between the predictions and field measurement data are comparatively good, especially for intermediate heights (see Figure 13c). For the intermediate crossbeam section, the empirical formula provides comparatively accurate predictions on the middle casting layer (see Figure 13e) but poor predictions on the bottom casting layer (see Figure 13d). According to the above observations, Equations (4) and (5) show a reasonable agreement with the field measurement data for the present case, but the accuracy of Equation (6) is not totally validated. The incapability of the mathematical formulation chosen to describe the present thermal issue leads to the conclusion that Equation (6) is characterized by inferior usability.
6. Conclusions
The main findings of this study concerning the time-varying temperature field of the early age massive concrete in the #0 segment of Huangsha Harbor Bridge are summarized below:
(1) Field measurements on the temperature rise due to the concrete hydration heat of the #0 segment of Huangsha Harbor Bridge suggest that the actual temperature field of the massive concrete at an early age is highly time-varying, and the variation trend agrees with the basic rules of physics and observations of similar studies undertaken by other researchers (see, e.g., refs. [17,18]).
(2) The comparison between the present field measurement data and the numerical simulation results obtained on the MIDAS FE platform suggests that the actual maximum temperature rise can generally be predicted by the corresponding FE analysis for the present engineering example, but the FE simulation is found to be less accurate in some occasional cases (such as the prediction of the temperature drop for a point on an intermediate crossbeam section). This affects the effectiveness of the conventional design-oriented estimation approach incorporating the empirical models with the preliminary numerical analyses.
(3) It is found that the empirical formulae proposed by Wu and Liu [17] and Zhang et al. [18] for the temperature rise prediction can accurately describe the actual temperature distribution patterns concerning the thermal issue in usual cases for the present engineering example, but they are characterized by inferior usability in a few circumstances. In this regard, it is suggested that certain empirical models (Equation (6)) should be revised accordingly.
This article only discusses the temperature field, without a further discussion of temperature stress and crack risks. For the #0 block of large-volume concrete, the engineering significance of the highest temperature and temperature difference lies in their potential to induce constraint stress and early cracking. Therefore, a discussion of temperature stress or crack resistance safety will be conducted and reported in another article in the near future, when a mechanical analysis can be conducted.
Author Contributions
Conceptualization, X.-X.C., Z.-Y.S. and H.Z.; methodology, X.-X.C. and Z.-Y.S.; software, X.-X.C. and Z.-Y.S.; validation, X.-X.C., Z.-Y.S. and H.Z.; formal analysis, X.-X.C.; investigation, X.-X.C.; writing—original draft preparation, X.-X.C. and Z.-Y.S.; writing—review and editing, H.Z.; supervision, H.Z.; project administration, H.Z. All authors have read and agreed to the published version of the manuscript.
Funding
The authors disclose the receipt of the following financial support for the research, authorship, and/or publication of this article: the authors gratefully acknowledge the financial supports from the National Natural Science Foundation of China (Grant No. 51908124), the China Postdoctoral Science Foundation (Grant No. 2016M601793) and the State Grid Corporation of China.
Data Availability Statement
The data presented in this study are available on request from the corresponding author.
Conflicts of Interest
The authors declare no potential conflicts of interest with respect to the research, authorship, and/or publication of this article.
References
- Zhang, B.; Cullen, M.; Kilpatrick, T. Fracture toughness of high performance concrete subjected to elevated temperatures Part 1 The effects of heating temperatures and testing conditions (hot and cold). Adv. Concr. Constr. 2014, 2, 145–162. [Google Scholar] [CrossRef] [Scilit]
- Zhang, B.; Cullen, M.; Kilpatrick, T. Fracture toughness of high performance concrete subjected to elevated temperatures Part 2 The effects of heating rate, exposure time and cooling rate. Adv. Concr. Constr. 2017, 5, 513–537. [Google Scholar]
- Zhang, B.; Cullen, M.; Kilpatrick, T. Spalling of heated high performance concrete due to thermal and hygric gradients. Adv. Concr. Constr. 2016, 4, 1–14. [Google Scholar] [CrossRef] [Scilit]
- Djezzar, M.; Ezziane, K.; Kadri, A.; Kadri, E.H. Modeling of ultimate value and kinetic of compressive strength and hydration heat of concrete made with different replacement rates of silica fume and w/b ratios. Adv. Concr. Constr. 2018, 6, 297–309. [Google Scholar]
- Didouche, Z.; Ezziane, K.; Kadri, E.H. Predicted of hydration heat and compressive strength of limestone cement mortar with different type of superplasticizer. Adv. Concr. Constr. 2018, 6, 659–677. [Google Scholar]
- Ha, S.J.; Rajadurai, R.S.; Kang, S.T. Effects of multi-walled carbon nanotubes on the hydration heat properties of cement composites. Adv. Concr. Constr. 2021, 12, 439–450. [Google Scholar]
- Cai, Y.; Wang, F.; Zhao, Z.; Lyu, Z.; Wang, Y.; Zou, P. Early-Hydration heat and influencing factor analysis of Large-Volume concrete box girder based on equivalent age. Structures 2023, 50, 1699–1713. [Google Scholar] [CrossRef] [Scilit]
- de Matos, P.R.; Junckes, R.; Graeff, E.; Prudencio, L.R., Jr. Effectiveness of fly ash in reducing the hydration heat release of mass concrete. J. Build. Eng. 2020, 28, 101063. [Google Scholar] [CrossRef] [Scilit]
- Zhang, T.; Wang, H.; Luo, Y.; Yuan, Y.; Wang, W. Hydration Heat Control of Mass Concrete by Pipe Cooling Method and On-Site Monitoring-Based Influence Analysis of Temperature for a Steel Box Arch Bridge Construction. Materials 2023, 16, 2925. [Google Scholar] [CrossRef] [Scilit] [PubMed]
- Do, T.A.; Verdugo, D.; Tia, M.; Hoang, T.T. Effect of volume-to-surface area ratio and heat of hydration on early-age thermal behavior of precast concrete segmental box girders. Case Stud. Therm. Eng. 2021, 28, 101448. [Google Scholar] [CrossRef] [Scilit]
- Mehdizadeh, H.; Sarker, S.; Baghban, M.H. Evaluating the efficacy of concrete washout water utilization in wet carbonation of hydrated cement waste considering temperature effects. Constr. Build. Mater. 2025, 482, 141688. [Google Scholar] [CrossRef] [Scilit]
- Del Savio, A.A.; Esquivel, D.L.T.; Carbajal, E.P.; Silva, F.d.A. Experimental and analytical study of temperatures developed by the heat of hydration of high-strength self-compacting mass concrete. Case Stud. Constr. Mater. 2025, 22, e04098. [Google Scholar] [CrossRef] [Scilit]
- Tran, M.V.; La, H.; Nguyen, T. Hybrid machine learning for predicting hydration heat in pipe-cooled mass concrete structures. Constr. Build. Mater. 2025, 481, 141558. [Google Scholar] [CrossRef] [Scilit]
- Khan, I.; Yong, G. Role of supplementary cementiteous materials in mitigating heat of hydration in mass concrete elements. Constr. Build. Mater. 2024, 431, 136482. [Google Scholar] [CrossRef] [Scilit]
- Taysi, N.; Abid, S. Temperature Distributions and Variations in Concrete Box-Girder Bridges: Experimental and Finite Element Parametric Studies. Adv. Struct. Eng. 2015, 18, 469–486. [Google Scholar] [CrossRef] [Scilit]
- Schackow, A.; Effting, C.; Gomes, I.R.; Patruni, I.Z.; Vicenzi, F.; Kramel, C. Temperature variation in concrete samples due to cement hydration. Appl. Therm. Eng. 2016, 103, 1362–1369. [Google Scholar] [CrossRef] [Scilit]
- Wu, H.; Liu, J. Investigations of the Temperature Field and Cracking Risk in Early Age Massive Concrete in the # 0 Segment of a Box Girder Bridge. KSCE J. Civ. Eng. 2023, 27, 3971–3989. [Google Scholar] [CrossRef] [Scilit]
- Zhang, N.; Zhou, X.; Liu, Y.; Liu, J. In-situ test on hydration heat temperature of box girder based on array measurement. China Civ. Eng. J. 2019, 52, 76–86. (In Chinese) [Google Scholar]
- Singh, P.R.; Rai, D.C. Effect of piped water cooling on thermal stress in mass concrete at early ages. J. Eng. Mech. 2018, 144, 1–10. [Google Scholar] [CrossRef] [Scilit]
- Tanabe, T.; Kawasumi, M.; Yamashita, Y. Thermal stress analysis of massive concrete. In Proceedings of the Seminar Proceedings for Finite Element Analysis of Reinforced Concrete Structures, Tokyo, Japan, 21–24 May 1984; ASCE: New York, NY, USA, 1984. [Google Scholar]
- Midas Information Technology (Beijing) Co., Ltd. User’s Guide of Computer Software MIDAS/Civil (Version 6.71); Midas Information Technology (Beijing) Co., Ltd.: Beijing, China, 2007. [Google Scholar]

Disclaimer/Publisher’s Note: The statements, opinions and data contained in all publications are solely those of the individual author(s) and contributor(s) and not of MDPI and/or the editor(s). MDPI and/or the editor(s) disclaim responsibility for any injury to people or property resulting from any ideas, methods, instructions or products referred to in the content. |
© 2026 by the authors. Licensee MDPI, Basel, Switzerland. This article is an open access article distributed under the terms and conditions of the Creative Commons Attribution (CC BY) license.