


Abstract
Underground tunnel construction projects using tunnel boring machines (TBMs) require a holistic risk perspective. Such projects face various risks arising from social, economic, political, workforce, and regulatory aspects during project execution. It is necessary to develop preventive strategies for managing these risks and thereby ensure timely project delivery, cost efficiency, and safety. In this study, we aimed to develop a comprehensive hybrid decision-making framework for analyzing risks in TBM-based tunnel construction projects. The proposed approach integrates the best–worst method (BWM), data envelopment analysis (DEA) model-based risk assessment, and the preference ranking organization method for enrichment evaluation (PROMETHEE). The BWM was applied to determine the weights of decision criteria with fewer comparisons and improved consistency. Subsequently, the DEA model was then used to compute local risk scores under multiple input and output conditions. Finally, PROMETHEE was employed to analyze the risks based on positive and negative outranking flows. The proposed approach was applied to a realistic metro construction project in Bangkok. The findings indicated that the proposed approach effectively compromised all the decision-making attributes to manage the uncertainties. The proposed methodology can support project managers, stakeholders, engineers, and relevant authorities in identifying high-priority risks and implementing effective mitigation strategies to enhance risk management in tunnel construction.
1. Introduction
In recent decades, mechanized tunneling has become an essential component of urban infrastructure development, especially in densely populated areas where minimizing surface disruption is critical. Tunnel boring machines (TBMs) are widely used for constructing underground routes for metro systems, roadways, and utility lines [1]. The advantages of TBMs in underground engineering include high excavation efficiency, enhanced operational safety, reduced noise and vibration, and improved control of ground deformation when compared with conventional tunneling methods. In addition, TBMs enable a stable and continuous excavation process, provide high-quality tunnel profiles, and limit adverse impacts on surrounding structures and the urban environment, which makes them suitable for large-scale underground projects in urban areas [2,3,4]. However, TBM-based tunnel construction also presents several inherent limitations. The application of TBMs requires high initial investment and operating costs, which may reduce economic feasibility for short tunnels or projects with limited scale. Moreover, TBM performance shows strong dependence on geological conditions, and unexpected variations in ground properties, such as fault zones, mixed ground, or high groundwater pressure, may lead to reduced excavation efficiency, equipment damage, or construction delays [5,6]. Moreover, the execution of such projects involves significant risks, including geological uncertainties, mechanical failures, and safety-related issues [7]. While numerous risk assessment methodologies have been introduced in this context, many of these approaches depend heavily on subjective expert judgment, which can compromise the consistency and reliability of results. In addition, conventional methods often struggle to incorporate multiple interrelated variables simultaneously and are insufficient to analyze the complex and multidimensional nature of risks in large-scale tunneling projects.
Many previous studies have addressed risk analysis in tunnel construction by employing a variety of assessment techniques, particularly those designed to handle qualitative information. These methods are often used to capture expert judgment and subjective evaluations, which are essential when quantitative data is limited or unavailable, such as risk matrices, fuzzy logic systems, Bayesian networks, bow-tie method [8,9,10,11]. Given the complex and uncertain nature of tunnel construction, especially in urban environments, different types of tunneling risks are typically assessed through expert-based qualitative approaches. Previous methods often rely heavily on historical data, yet in large-scale infrastructure projects such as tunnel construction, some risks may have never occurred before or may lack sufficient recorded data, making it difficult to accurately estimate their probabilities or consequences [12]. Moreover, past methods often struggle to systematically evaluate risks across multiple criteria. Many of these approaches focus narrowly on a single aspect, which oversimplifies the complexity inherent in construction project decision-making. Additionally, they generally lack a structured mechanism for integrating both qualitative insights and quantitative data, limiting their ability to handle the ambiguity and subjectivity involved in expert evaluations. These limitations make it difficult to assess risks holistically or reflect the diverse priorities of stakeholders. Furthermore, existing tools are typically not equipped to identify trade-offs among competing criteria or to rank risks in a way that aligns with strategic project goals.
To solve these limitations, multi-criterion decision-making (MCDM) methods have been widely adopted to translate linguistic evaluations into structured risk analysis. These approaches provide a practical foundation for analyzing risks, especially when decision-makers must rely on experience, expert opinion, or incomplete data to support safety and planning decisions. These methods are favored in both academia and practice due to alignment with intuitive human decision-making processes, making them accessible even to practitioners without advanced technical expertise [13]. Although individual MCDM techniques offer valuable insights, each comes with inherent limitations and difficulty in handling qualitative data [14,15]. To address these shortcomings, hybrid MCDM frameworks have been presented to handle the problem of risk analysis [16]. Generally, these can be categorized into several types. The first type refers to the integration of multiple MCDM methods. For example, Ghorbani et al. [17] applied a hybrid approach using the preference ranking organization method for enrichment evaluation (PROMETHEE), weighted aggregated sum product assessment (WASPAS), and Combined Compromise Solution (COCOSO) integrated with Shannon’s entropy to assess geotechnical hazards in Iran. Koohathongsumrit and Meethom [18] applied the best–worst method (BWM) to determine risk criterion weights and data envelopment analysis (DEA) to calculate and rank risks for tunneling projects. The second type consists of hybrid models that combine a single MCDM method with fuzzy logic. For example, Nezarat et al. [19] employed a fuzzy analytic hierarchy process (AHP) with the extent analysis method to prioritize negative risks in mechanized tunneling construction. Shaffiee Haghshenas et al. [20] applied a fuzzy AHP to identify and rank potential risks in tunnel projects. The third type involves the combination of one or more crisp MCDM methods with one or more fuzzy MCDM methods or their extensions. For example, Yazdani-Chamzini et al. [21] ranked risks that can occur during underground construction, in which an analytic hierarchy process (AHP), fuzzy elimination, and choice expressing reality (ELECTRE) were used. Ehsanifar and Hemesy [22] established the hybrid MCDM approach integrating Shannon’s entropy, decision-making trial and evaluation laboratory (DEMATEL), and the complex proportional assessment of alternatives with gray relations (COPRAS-G) for ranking future uncertainties of subway tunnel construction. Liu et al. [23] employed a hybrid method combining a fuzzy AHP and VIKOR (Serbian name: VlseKriterijumska Optimizacija I Kompromisno Resenje) for risk analysis in urban excavation projects. Gogate et al. [24] used an AHP and fuzzy technique for order of preference by similarity to ideal solution (TOPSIS) to prioritize risk factors in Indian tunnel projects, integrating results from the AHP and analysis based on probability, impact, and cost. Wang et al. [25] applied a hybrid Pythagorean fuzzy AHP and extended VIKOR method with interval numbers to assess the risk of building damage adjacent to shield tunnel construction. Lastly, some hybrid approaches combine MCDM methods with other advanced techniques. Hyun et al. [26] calculated the levels of each risk in subway shield tunneling operations of subway construction, where the AHP–fault tree analysis (FTA) method was utilized to estimate severities and probabilities of risk events. Zhang and Chen [27] proposed a hybrid MCDM approach that integrates the cloud model, TOPSIS, and Monte Carlo simulation to address alternative selection problems under uncertainty. Zhang et al. [28] presented a decision-making model based on the correlation coefficient and standard deviation method and multi-objective optimization on the basis of a ratio analysis, as well as the full multiplicative form (MULTIMOORA)-based regret theory for risk assessment of utility tunnel construction projects. Koohathongsumrit and Chankham [29] extended Hyun et al.’s method by adding fuzzy logic, developing what is known as the fuzzy AHP–FTA method. All the related studies are summarized as shown in Table 1.
Table 1.
Related studies using hybrid MCDM approaches in analyzing risks in tunnel construction.
Although previous studies have employed various hybrid MCDM methods to assess risks in tunnel construction projects using tunnel boring machines, several research gaps remain. Many existing approaches focus primarily on risk analysis but lack robustness in determining reliable criterion weights, especially when expert consistency is limited. Some methods, like fuzzy AHPs, involve extensive pairwise comparisons, which may introduce redundancy and inconsistency, particularly when dealing with a large number of criteria. In addition, few studies provide a mechanism for measuring the relative performance or efficiency of risks under multiple criteria, making it difficult to differentiate risks with similar scores or to justify final rankings. Furthermore, existing models often do not account for preference-based ranking with outranking logic, which is essential in situations where decision-makers need to compare alternatives that may not be directly comparable on a common utility scale.
To address these gaps, the integration of the BWM, DEA, and PROMETHEE offers a promising solution. The BWM proposed by Rezaei [30] enables a more consistent and efficient elicitation of criterion weights using only a limited number of comparisons, reducing the cognitive burden on experts while improving reliability. The DEA model-based risk analysis of Wang et al. [31] can be used to evaluate the relative efficiency of each risk by treating it as a decision-making unit, allowing for the calculation of composite risk scores based on multiple input and output criteria. PROMETHEE, proposed by Brans et al. [32] as an outranking method, facilitates preference-based comparisons and provides reliable risk ranking by capturing the strengths and weaknesses of each alternative relative to others. The BWM–DEA–PROMETHEE technique can overcome the limitations of earlier methods by offering a more consistent, transparent, and comprehensive approach to tunnel construction risk analysis. This combination is adopted to exploit the complementary strengths of these methods and to overcome the limitations of using a single technique. The BWM provides a structured and consistent approach for deriving criterion weights with reduced comparison burden and higher reliability compared with conventional pairwise comparison methods. DEA enables an objective efficiency-based assessment that accounts for multiple inputs and outputs without requiring predefined functional relationships, which enhances discrimination among risks with similar performance levels. PROMETHEE offers a transparent outranking mechanism that supports pairwise comparison of alternatives and produces a complete ranking while preserving the preference structure of the decision-maker. By integrating these three methods, the proposed approach is developed to provide reliable risk scores and robust multi-criterion performance evaluation and to enhance the decision-support capability of the risk assessment process. Finally, the case study of the Metropolitan Rapid Transit (MRT) Purple Line South extension in Bangkok illustrates the practical effectiveness of the BWM–DEA–PROMETHEE approach in a real-world infrastructure project. The case study validates the method’s capability to identify, quantify, and prioritize complex risks under multiple criteria. The results provide decision-makers with actionable insights that support informed risk mitigation planning, enhance project reliability, and contribute to timely and efficient project delivery.
2. Materials and Methods
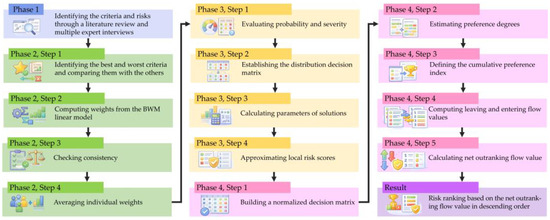
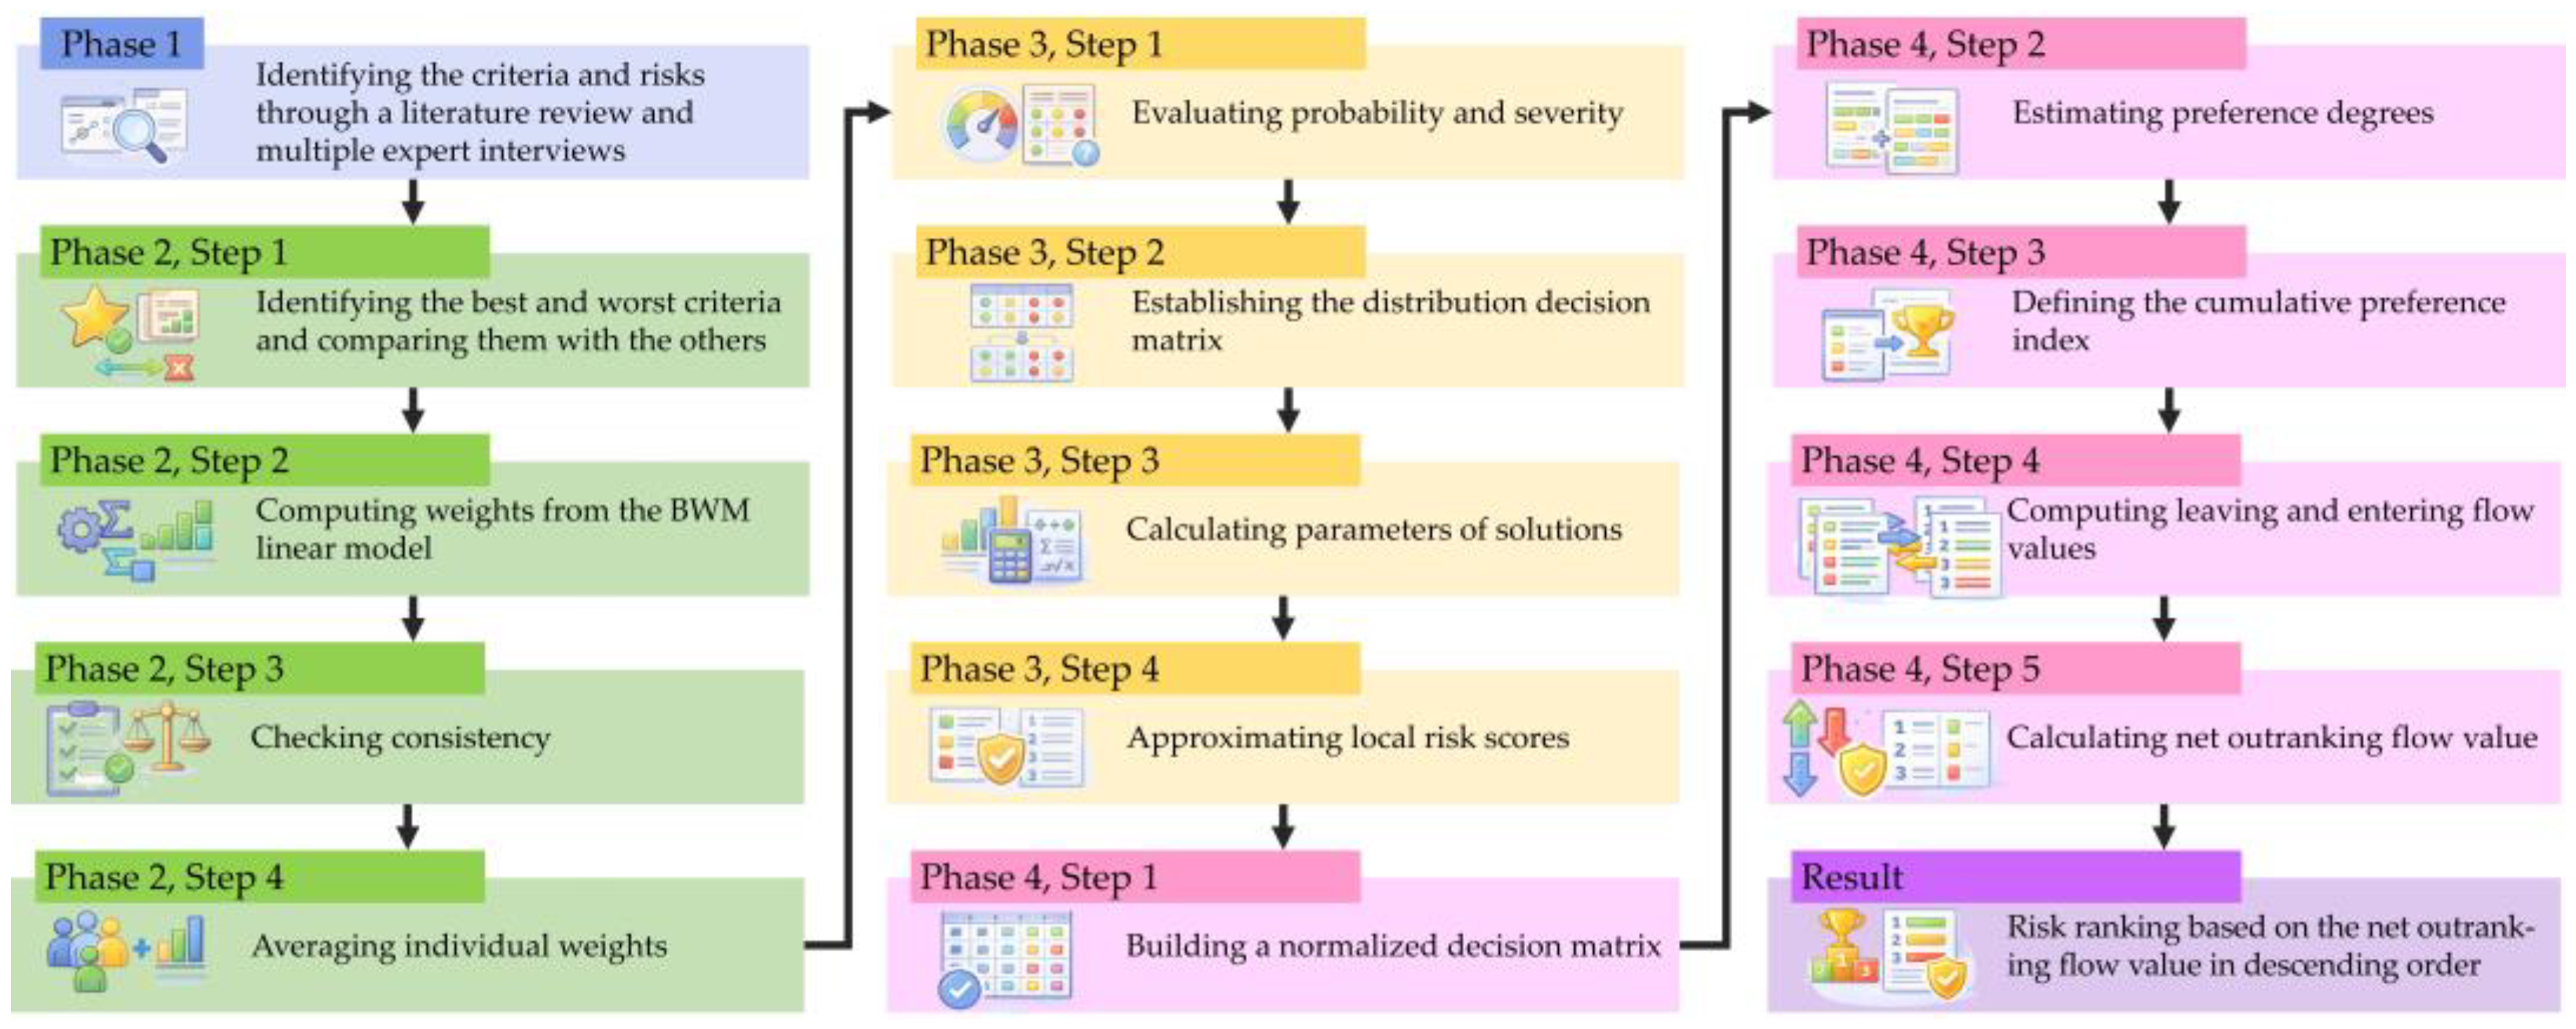
This section thoroughly describes the procedures and mechanisms of the proposed approach-based research methodology, which can be divided into different phases as given below (see also Figure 1):
Figure 1.
Framework of the proposed approach.
2.1. Phase 1: Identifying Criteria and Risks
In this phase, we aimed to identify the evaluation criteria and risks (alternatives) associated with TBM-based tunnel construction through a comprehensive literature review and structured expert interviews. The literature review was first conducted to establish an initial set of risk factors and criteria reported in previous studies. To ensure the completeness and practical relevance of the identified items, expert interviews were then carried out as a complementary step.
The expert interviews involved professionals with at least five years of experience in underground tunnel construction, TBM operation, project management, or metro system design. All experts held at least a master’s degree in civil engineering or a related field. The interviews followed a structured format. First, the preliminary list of risks and criteria derived from the literature was provided to the experts for review and discussion. The experts then confirmed the applicability of each identified risk to TBM-based tunnel construction projects and proposed additional risks or criteria that were not sufficiently addressed in the existing studies.
The identified risks refer to negative events that may occur or not occur during underground tunnel construction. These risks mainly arise from workforce-related issues, machinery conditions, construction operations, and external factors. The finalized set of criteria and risks obtained from the combined literature review and expert interviews served as the basis for the subsequent analysis.
2.2. Phase 2: Determining Weights
In practice, it is rare to give equal importance to all decision-making attributes. Thus, priorities must be assigned to them. The BWM is utilized to determine weights of criteria. The details of this phase are as follows:
Step 1: Determine the best and worst criteria from a set of criteria: From a predefined set of criteria, decision-makers individually determine the best and worst criteria. Then, they compare the best criterion with the other criteria and the other criteria with the worst criterion using importance scales. Examples of the questions used to elicit expert judgments from decision-makers include the following:
- How much more important is the best criterion compared with this criterion with respect to TBM-related risk assessment?
- How do you assess the relative importance of the best criterion over this criterion in evaluating risks in tunnel construction projects?
- How much more important is this criterion compared with the worst criterion in the context of TBM-based tunnel construction risks?
- How do you rate the importance of criterion relative to the worst criterion for risk assessment purposes?
After the data are collected, the best-to-other and other-to-worst comparisons are written as ABOd = {aB1d, aB2d, …, aBmd} and AOWd = {a1Wd, a2Wd, …, amWd}, where ABOd denotes the best-to-other vector; AOWd denotes the other-to-worst vector; aBjd is the importance scale of the best criterion over the jth criterion for the dth decision-maker; ajWd is the importance scale of the jth criterion over the worst criterion for the dth decision-maker; aBBd = 1; aWWd = 1; d is the number of decision-makers; d = 1, 2, …, D; D is the number of decision-makers [33].
Step 2: Compute weights: The weights of criteria are calculated by maximizing the maximum from the set {|wBd − aBjdwjd|, |wjd − ajwdwWd|}, which results in the following model: min maxj = {|wBd − aBjdwjd|, |wjd − ajwdwWd|}, when its constraint is = 1; wjd ≥ 0 for all j. This model, which usually provides the best solutions, is converted into the linear model with a unique solution, as follows [34]:
where represent the consistency indicator of the comparisons; wBd, wWd, and wjd are the weights of the best, worst, and the jth criterion, obtained from the dth decision-maker.
Step 3: Check consistency: One of the crucial features of the BWM is its ability to determine the consistency ratio. In practice, it is often not possible to have full consistency and subjective evaluation with a high level of accuracy. The existence of consistency cannot show the level of expertise. Hence, the decision-makers can therefore accept slight inconsistency. The consistency ratio is calculated as follows:
where refers to the optimal value of the consistency indicator. The consistency index can be obtained based on the importance scale between the best and worst criteria. A consistency ratio closer to zero means that the judgments are more consistent, and vice versa [35]. If the consistency ratio is high, the decision-makers must revise the comparisons.
Step 4: Aggregate the individual weights: To reduce the influence of individual subjectivity, the criterion weights obtained from each decision-maker are aggregated to determine the final representative weights. After the calculations of the weights, the arithmetic mean method is applied to combine them. The final criteria weight is calculated as follows:
where wj refers to the weight of the jth criterion; = 1.
2.3. Phase 3: Calculating Risk Levels
In this phase, we aim to calculate risk levels by using the risk assessment-based DEA model, which evaluates risk levels through relative efficiency rather than simple aggregation. Unlike weighted averages or fuzzy logic methods that transform expert judgments into a consensus score, DEA compares each risk against an efficiency frontier and preserves multiple-criterion information. As a result, the DEA model highlights dominant or extreme risks under specific criteria, which provides greater discrimination and suits complex TBM-related risk assessment. The details of each step are explained as follows:
Step 1: Evaluate probability and severity: All identified risks are systematically evaluated with respect to each decision criterion to ensure a comprehensive and balanced assessment. For every criterion, the grading scale typically ranges from low to high. The evaluation process is grounded in expert judgment, where each decision-maker independently classifies each risk into a distinct grade according to its level under each criterion. This process records how many decision-makers assign each risk to each grade level under a given criterion. In the case of five decision-makers, it is possible that four classify a particular risk as having the very high grade under a criterion, while one decision-maker rates it as having the very low grade [36].
Step 2: Establish the distribution decision matrix: Let Gj = {Hj1, …, HjKj} be the set of risk assessment grades for the jth criterion, where Hj1, …, HjKj are the risk assessment grades from the most to least important grades of the jth criterion. Assume that ND = {NDij1, NDij2, …, NDijKj} is the number of decision-makers who consider the ith risk in each grade under the jth criterion, where n, m, and k are the sets of risk, criteria, and assessment grades; i = 1, 2, …, n; j = 1, 2, …, m; k = 1, 2, …, K. Some example questions used to collect data in this step are as follows:
- How would you categorize the risk under the current project conditions using a scale from the “very low” to “very high” grades?
- Considering historical records and site conditions, which grade best represents the category of risk that may occur during the tunnel construction phase?
After collecting the data, the distribution decision matrix is constructed as shown in Table 2, where the rows represent individual risks and the columns correspond to the grades with respect to every criterion [31].
Table 2.
Distribution decision matrix for linguistic assessment grades.
Step 3: Calculate parameters of solutions: The DEA model is formulated for this step, as follows [37]:
Step 4: Approximate local risk scores: The local levels of each risk are approximated by multiplying the most optimal decision variables obtained from the lowest values of solutions and the associated sets of decision-makers, as follows [38]:
where xij is the risk level of the ith risk and jth criterion, and S*(Hjk) is the most optimal decision variable of the jth criterion and kth grade.
2.4. Phase 4: Prioritizing Risks
This phase uses PROMETHEE in order to prioritize risks of TBM tunnel construction based on risk scores and relative weights. For applying PROMETHEE, it is necessary to consider six typical preference function shapes, namely those of the usual, U-shape, level, V-shape, V-shape-with-indifference, and Gaussian functions [32,39]. This study selects the usual preference function because the evaluated risk scores are normalized and any non-zero difference between two risks represents a meaningful distinction in preference. The usual preference function requires no additional parameter definition, which simplifies model implementation and enhances transparency and reproducibility. Therefore, this function is appropriate for the objectives and data characteristics of this TBM-related risk assessment. The details of each step are presented below:
Step 1: Build the normalized decision matrix: The decision matrix is constructed, consisting of the sets of criteria and risks. Next, this matrix is converted, and the normalized decision is performed based on the characteristics of each criterion, as follows [40]:
where Rij is the normalized value of the ith risk and the jth criterion; xij refers to the risk level of the ith risk against the jth criterion.
Step 2: Estimate preference degrees: The evaluative differences in each risk with respect to other risks are determined. Let i′ = {1, 2, …, n} be the set of risks, his step involves the calculation of differences in criterion values; the preference degree of deviations between the evaluations of any two risks is computed [41]:
where is the preference degree of the jth criterion between the ith and i′th risks.
Step 3: Define the cumulative preference index: The aggregated preference function of each risk compared with other risks is defined by multiplying the preference degrees and relevant weights, as follows [42]:
where represents the cumulative preference index. Notice that 0 indicates a weak preference of the ith and i′th risks, whereas 1 indicates a strong preference of the ith and i′th risks.
Step 4: Compute leaving and entering flow values: The leaving (or positive) and entering (or negative) outranking flows for each risk are examined. The positive outranking flow expresses how a risk outranks all the other risks, whereas the negative one implies how an alternative is outranked by all the others. Both parameters are estimated as follows [43]:
where and are the leaving and entering flow values of the ith risk, respectively.
Step 5: Calculate the net outranking flow value: The net outranking flows of each risk are calculated by considering the difference between the positive and negative flows of each risk, as follows [44]:
where i is the net outranking flow value of the ith risk. The ith risk outranks the i′th risk, if i > i′. Similarly, if the ith risk is outranked by the i′th risk, if i < i′. The ranking of all risks is depended on the value of i in descending order. The most important risk has the highest net outranking flow value.
3. Results
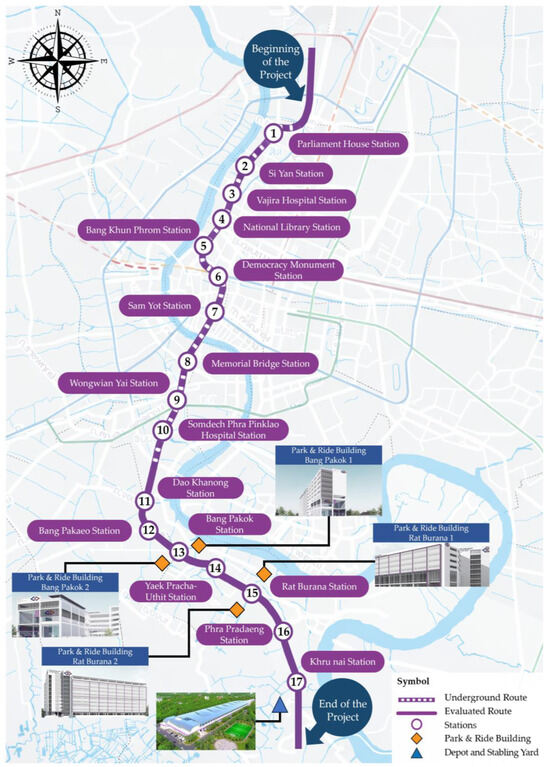
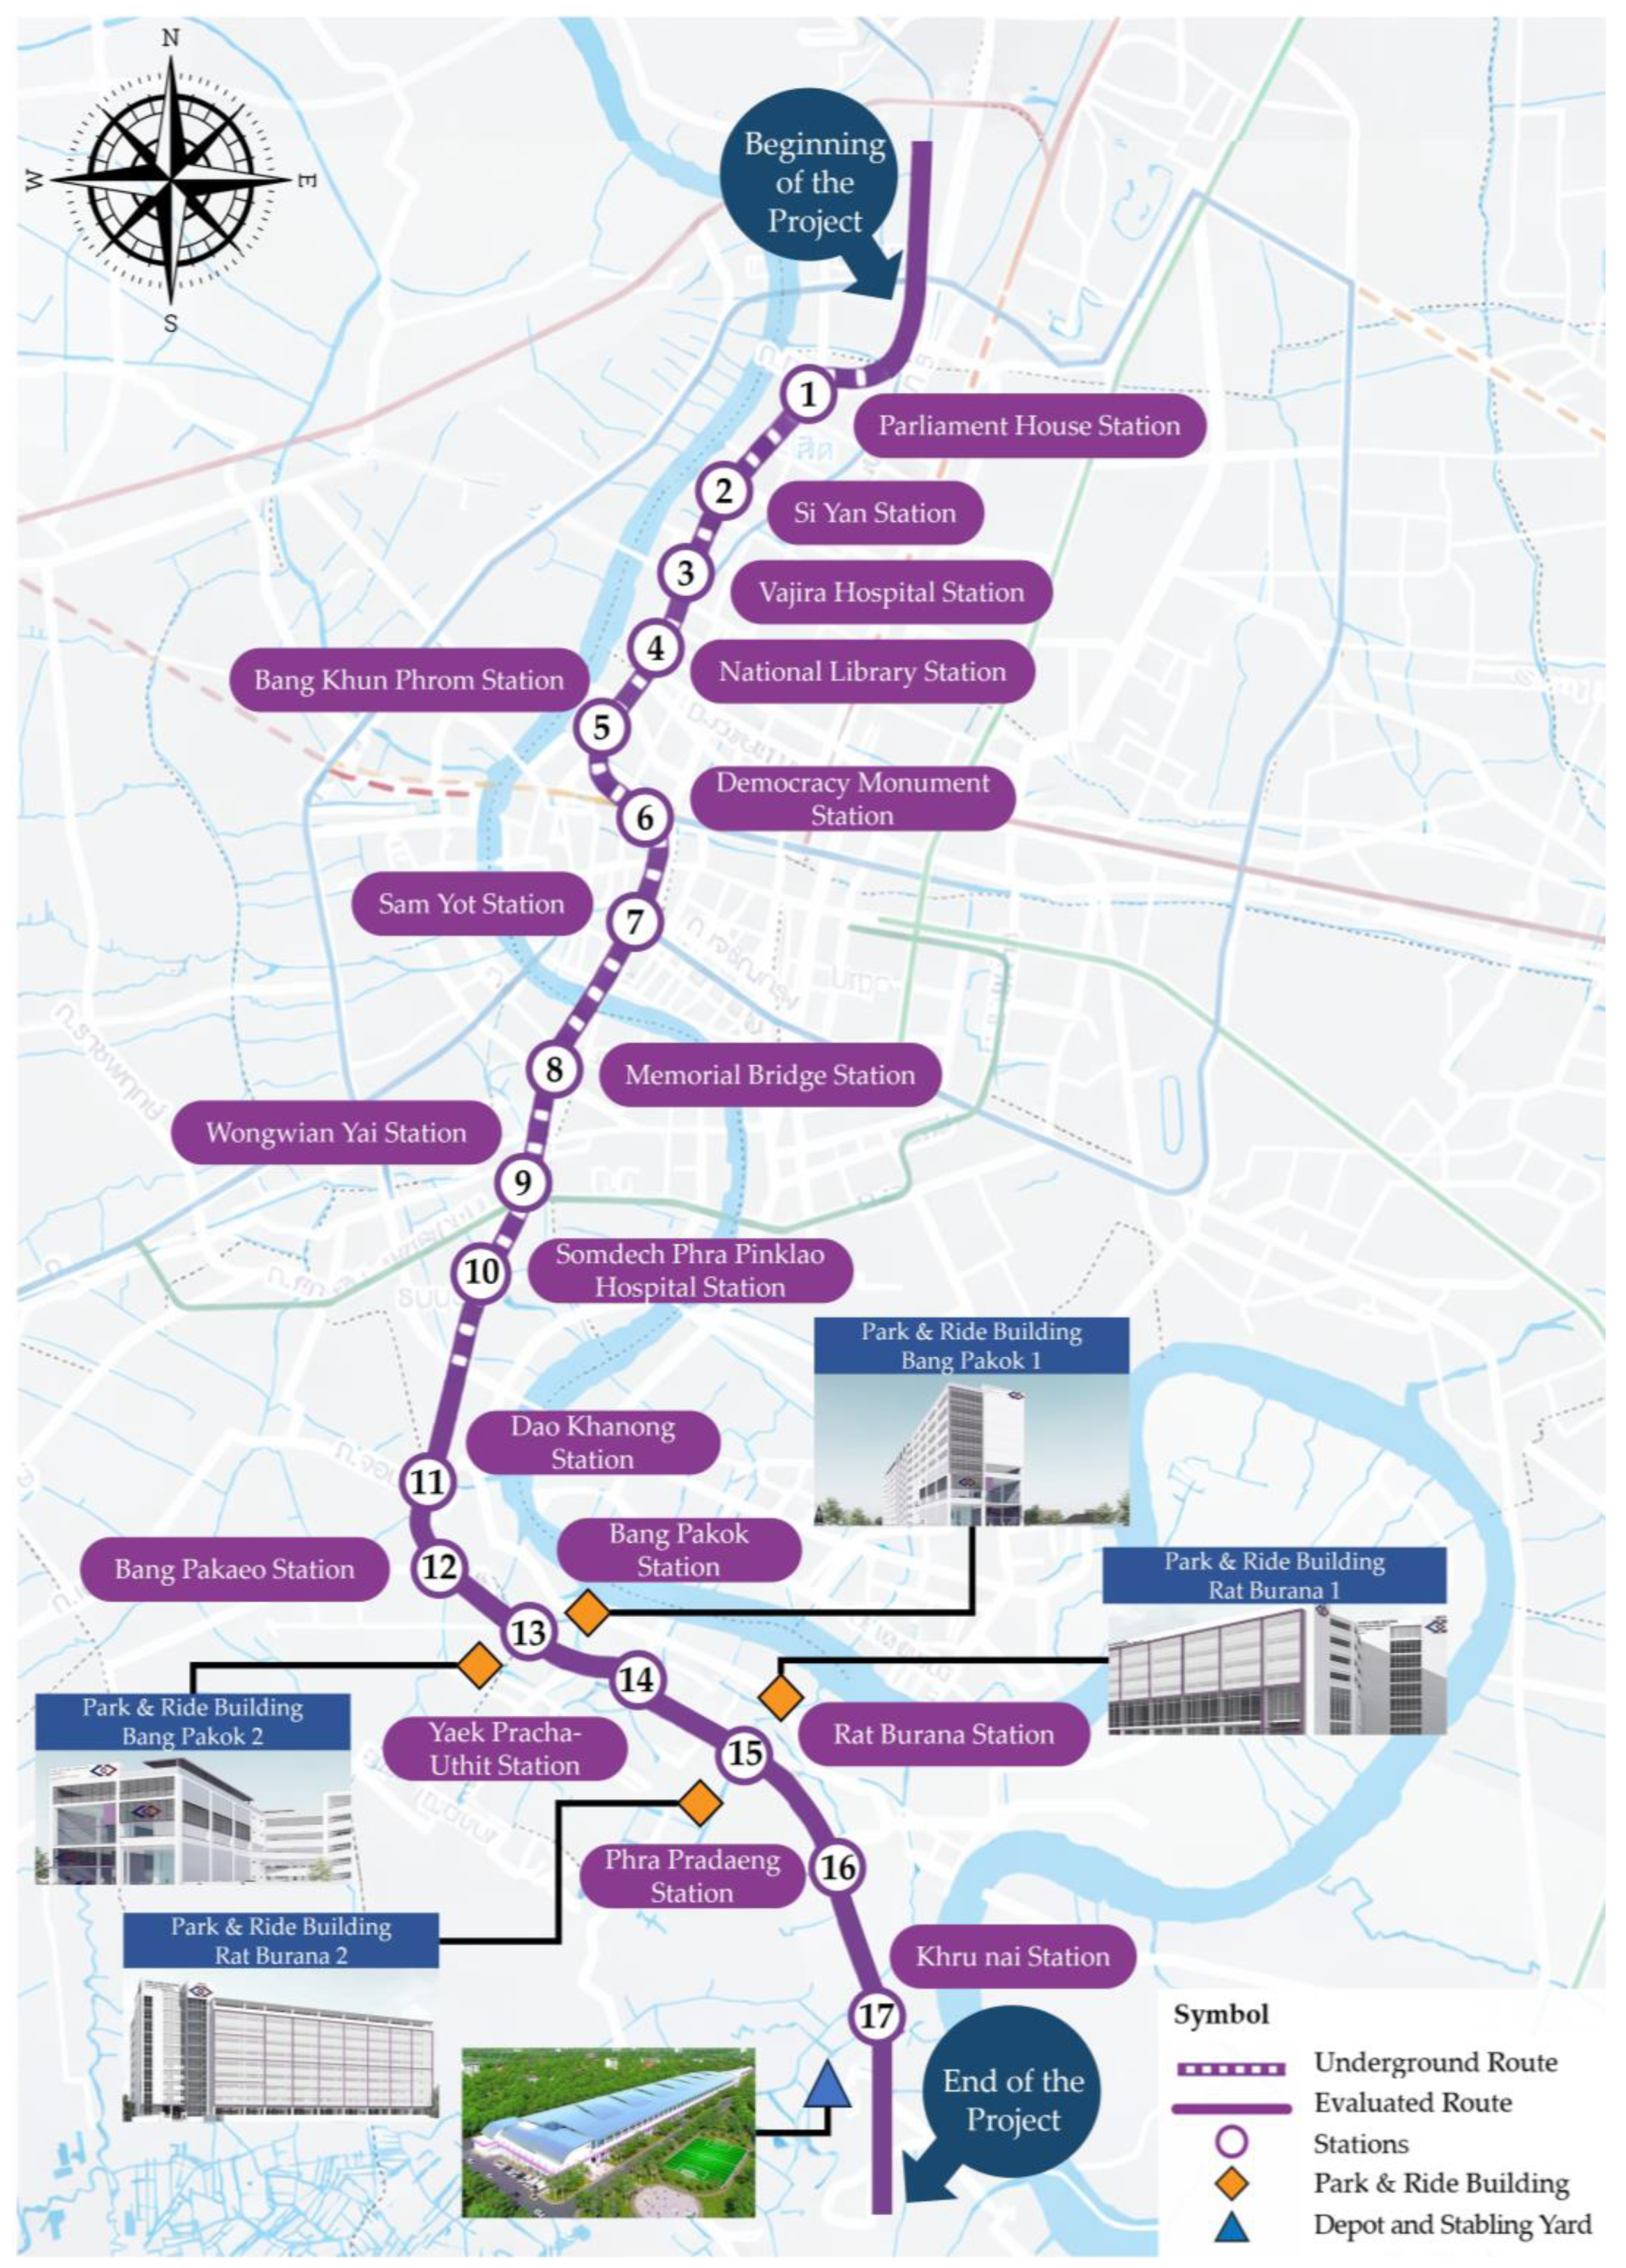
This section presents the step-by-step application of the proposed approach to an actual Metropolitan Rapid Transit (MRT) construction project, namely the Tao Poon–Rat Burana section of the Purple Line South Extension in Bangkok, Thailand. The project consists of the 23.63 km transit line that connects the inner city of Bangkok to the southern suburbs, with the objective to reduce traffic congestion and improve urban mobility. The line includes 17 stations, with 10 located underground and 7 constructed as elevated stations, passing through several densely populated and high-traffic areas, as presented in Figure 2. The project commenced in mid-2022 and had reached 66.14% completion by the end of November 2025. The scheduled completion date is set for 2028 (for more information see, https://www.mrta-purplelinesouth.com/home (accessed on 9 December 2025)). The case study used to validate the proposed approach in this study has previously been examined for risk assessment by Koohathongsumrit and Meethom [18], in which the project risks were evaluated at an earlier stage of construction. The overall construction progress, as of the end of May 2023, was 11.55%, and the assessment reflected the risk conditions during the initial phase of project execution. In the current study, the risk assessment was conducted again using the proposed BWM–DEA–PROMETHEE approach and newly collected data when the project reached 66.14% completion by the end of November 2025. This study ensures that the risk analysis closely reflects the actual project conditions. By reassessing the risks based on updated decision-makers’ judgments and a more advanced stage of construction, this study provides a more realistic validation of the proposed approach and reflects the dynamic nature of risk profiles throughout the project lifecycle.
Figure 2.
Project’s details.
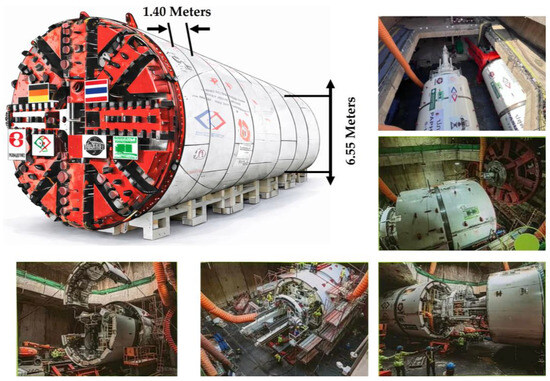
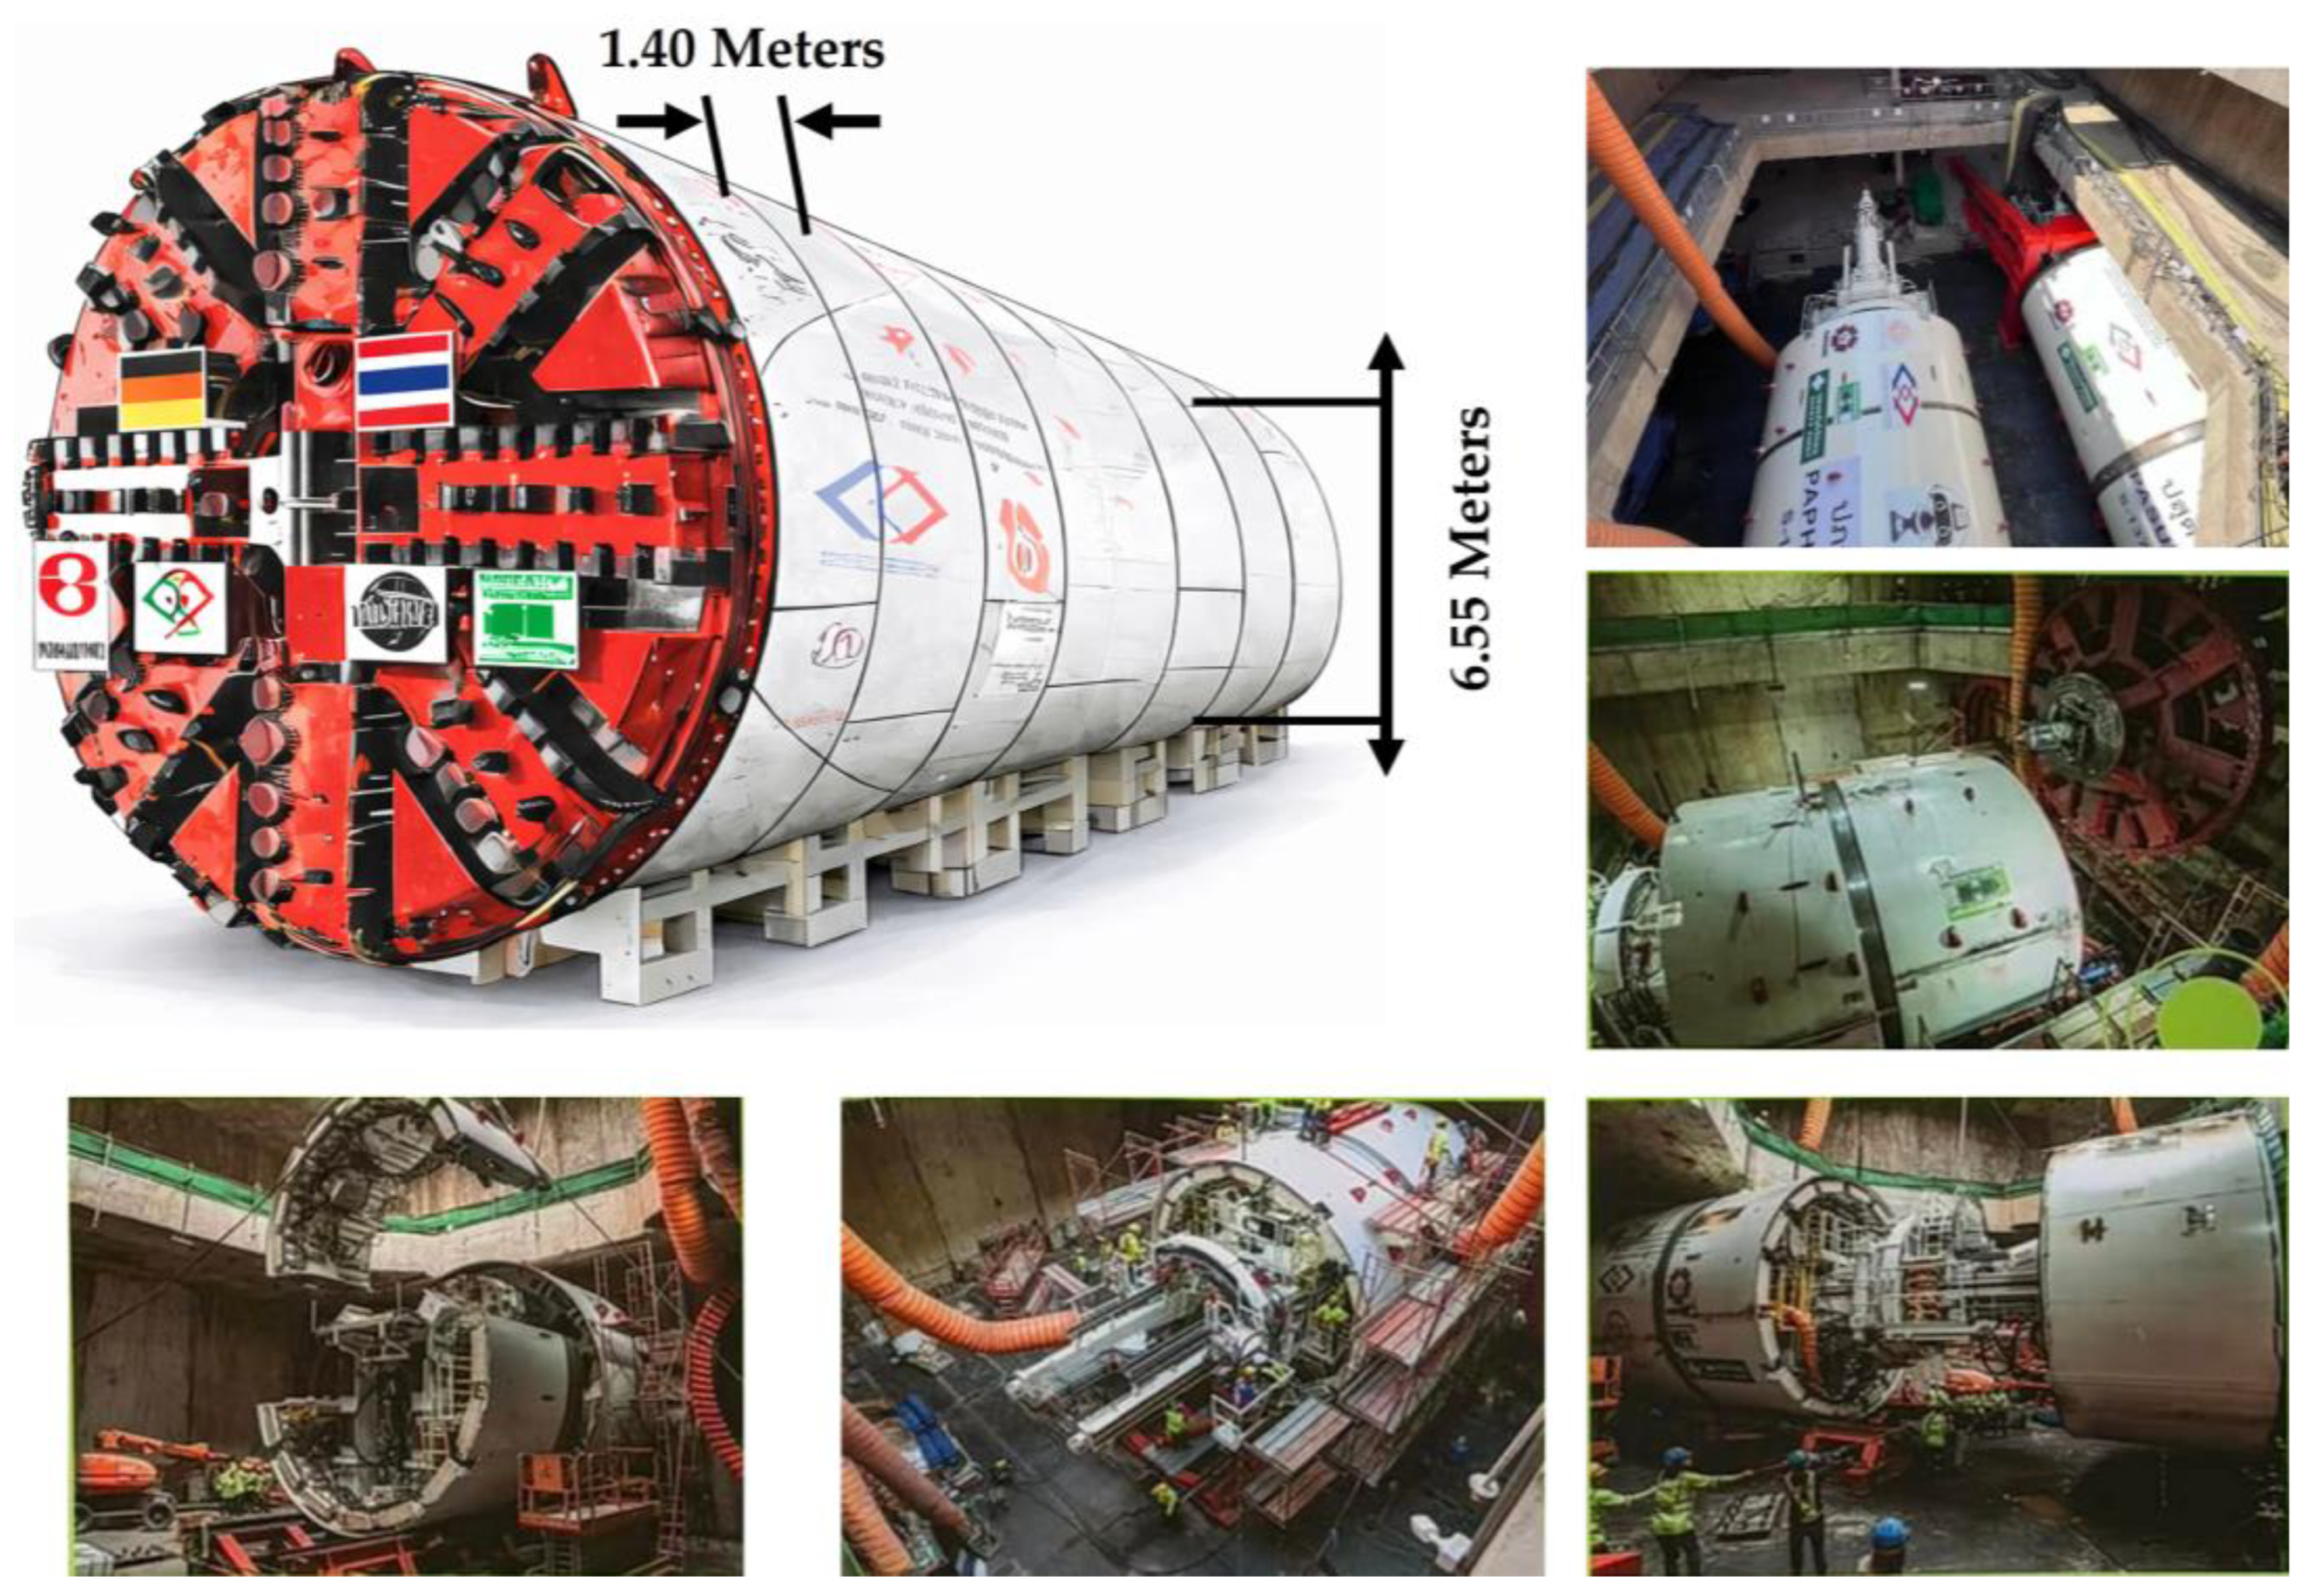
For tunnel excavation works, a TBM with earth pressure balance has been adopted in this project, as depicted in Figure 3. This machine is suitable for underground excavation under soft ground conditions, particularly in clayey soils and sandy layers with high groundwater pressure. The earth pressure balance TBM maintains face stability through the equilibrium of earth and water pressures at the tunnel face, which enhances excavation safety and reduces the risk of ground settlement in dense urban areas. The TBM used in this project operates with a segment ring length of 1.40 m and an external diameter of 6.55 m. The installed cutterhead motor power is 990 kilowatts, and the maximum thrust force applied to the cutterhead reaches 42,575 kilonewtons. These technical specifications support stable and efficient excavation under complex subsurface conditions along the tunnel alignment.
Figure 3.
TBM used in the project.
Due to the complexity and scale of the infrastructure, this project serves as a practical and relevant case study to show the applicability of the proposed approach for risk analysis in the real-world tunnel construction project. Although the project includes preventive measures and corrective actions to address environmental impacts, these plans have been developed in a generalized manner without emphasizing any specific risk. The absence of targeted risk prioritization in the current risk management framework may limit the effectiveness of mitigation strategies, especially for significant risks. This study supports decision-makers in analyzing and identifying the most critical risks. Decision-makers can implement more focused and effective mitigation plans that align with project priorities and ensure timely and safe project completion.
A new decision-maker panel was formed for this research, with seven participating decision-makers, each holding at least a master’s degree in civil engineering and each with at least five years of experience in one or more of the following areas: underground tunnels, shafts, chambers, passageway construction, and metro design. The panel included three participants who were involved as independent academic experts and did not represent their universities, project owners, or contractors during the evaluation process. Their role focused on providing neutral technical judgments based on professional knowledge and experience. The panel also consisted of four decision-makers from contractor organizations who are directly involved in on-site operations and practical tunnel construction activities. Two of the decision-makers had previously participated in the earlier risk assessment of the same project. Their inclusion was intended to enable the evaluation of changes in risk conditions as the project has progressed and as contextual situations have evolved, allowing the study to examine whether and how the risk profiles have shifted over time. The details of each decision-maker are shown in Table 3.
Table 3.
Details of decision-makers.
In this study, all the criteria are determined to evaluate all the risks, as follows:
- Probability (C1): This criterion refers to the estimated likelihood or frequency of risk occurring during the execution of the tunnel construction project. It is typically based on expert judgment, historical data, or predictive analysis. A higher probability indicates a greater chance that the risk will materialize and disrupt project activities.
- Increase in cost (C2): This criterion assesses the potential financial impact of risk, specifically the extent to which it may cause cost overruns. This includes unplanned expenditures related to equipment damage, labor, material shortages, penalties, or emergency interventions. High-cost risks pose a significant threat to budgetary control and project profitability.
- Late delivery of project (C3): This criterion evaluates the potential of risk to delay the project timeline or critical milestones. Delays may result from technical failures, regulatory issues, or logistical disruptions and can lead to reputational damage, contractual penalties, and increased indirect costs.
- Resource loss (C4): This criterion refers to the possibility of losing or misusing key resources due to the risks. Resources may include skilled labor, machinery, raw materials, or information systems. Resource loss can disrupt workflow efficiency and reduce overall productivity.
- Decrease in quality of working (C5): This criterion assesses how the risks may negatively affect the standard or consistency of project performance, workmanship, or output quality. Poor working quality may lead to structural defects, safety hazards, or the need for rework, ultimately undermining long-term project sustainability and user satisfaction.
All the decision-makers participated in a structured meeting aimed at consolidating expert judgments. Through open discussion and iterative validation, the participants collectively reviewed potential risks based on their professional experience and the relevant literature. As a result, the group agreed on a total of 68 distinct risks deemed significant in the context of the project. These risks encompass a wide range of categories, such as geology, machinery, technique, human, finance, policy and legalization, and facility. All the possible risks are shown in Table 4 [8,9,10,11,26,45,46,47,48,49].
Table 4.
All possible risks.
The decision-makers’ preferences were reflected via criterion weights obtained by the BWM. Each participant was individually interviewed to provide input for the weight calculation process, identifying the best and worst criteria from the given set. The best and worst criteria are presented in Table 5. Most decision-makers assigned the highest importance to the increase in cost criterion. This preference likely reflects strong concern over potential penalties, budget overruns, and unforeseen expenses, which often represent the most critical and difficult-to-control consequences in large-scale TBM-based tunnel construction projects.
Table 5.
Best and worst criteria.
Next, the decision-makers separately compared the best and worst criteria to the other criteria using importance scales, and the BWM models were formulated based on their judgments. The vectors of best-to-others and others-to-worst are shown in Table 6.
Table 6.
Best-to-other and other-to-worst vectors.
Next, the BWM models were formulated based on the decision-makers’ judgments. For example, the BWM model, conducted by the first decision-maker was written as follows:
- Min
- subject to
- |w21 − 2w11| ≤ , |w21 − 3w3| ≤ , |w21 − 4w41| ≤ ,
- |w21 − 2w51| ≤ , |w11 − 2w41| ≤ ,|w31 − 2w41| ≤ ,
- |w51 − 2w41| ≤ , w11 + w21 + w31 + w41 + w51 = 1,
- w11, w21, w31, w41, w51 ≥ 0.
Subsequently, all the models were solved to derive the weights of the criteria and the consistency ratios. Then, the average weights with respect to every criterion were computed as follows: w1 = 0.197, w2 = 0.275, w3 = 0.215, w4 = 0.155, and w5 = 0.157.
Then, all risks were evaluated using the DEA model, with input based on expert judgment provided by the decision-makers. Each decision-maker independently assessed all risks under each of the defined evaluation criteria by classifying all of them into different grades. For the probability (C1) criterion, risks were classified into five grades as follows: frequent (F), probable (P), occasional (O), remote (R), and improbable (I) grades. These grades reflect how likely the risk is to occur. For the remaining criteria (C2 to C5), a five-point grade was used to classify the risks, as follows: very high (VH), high (H), moderate (M), low (L), and very low (VL) grades. These grades allowed the decision-makers to evaluate each risk systematically based on its severity or potential consequences under each criterion. For more details about the assessment grades refer to Koohathongsumrit and Meethom [18]. The assessment results are presented in Table 7. For example, considering the hardness of rock mass risk under the probability criterion, two decision-makers assigned occasional and remote grades, and other decision-makers assigned frequent, probable, and improbable grades. For the remaining risks across all the decision criteria, the number of decision-makers assigning each risk to each grade level was considered in the same manner.
Table 7.
Assessment grade of risk with respect to all criteria in distribution matrix.
The DEA models were formulated to estimate the values of the parameter solutions based on the assessment grades of several decision-makers for each criterion. The local scores of risks with respect to each criterion can be estimated by the risk assessment-based DEA model, as shown in Table 8.
Table 8.
Local risk score.
PROMETHEE was applied to provide outranking results based on more reliable risk levels and their priority values. The normalized decision matrix is shown in Table 9.
Table 9.
Normalized decision matrix.
The preference degrees were calculated through pairwise comparison of the normalized values under each evaluation criterion, as presented in columns 2 to 6 of Table 10. For each criterion, the normalized performance of every risk is compared with all the other risks in a pairwise manner to determine the corresponding preference degree. In this study, a total of 68 risks and 5 evaluation criteria were considered. Then, the cumulative preference indices were calculated by summing up the preference degrees (or net outranking flows) for each alternative over all other risks, as shown in the last column of Table 10.
Table 10.
Preference degrees.
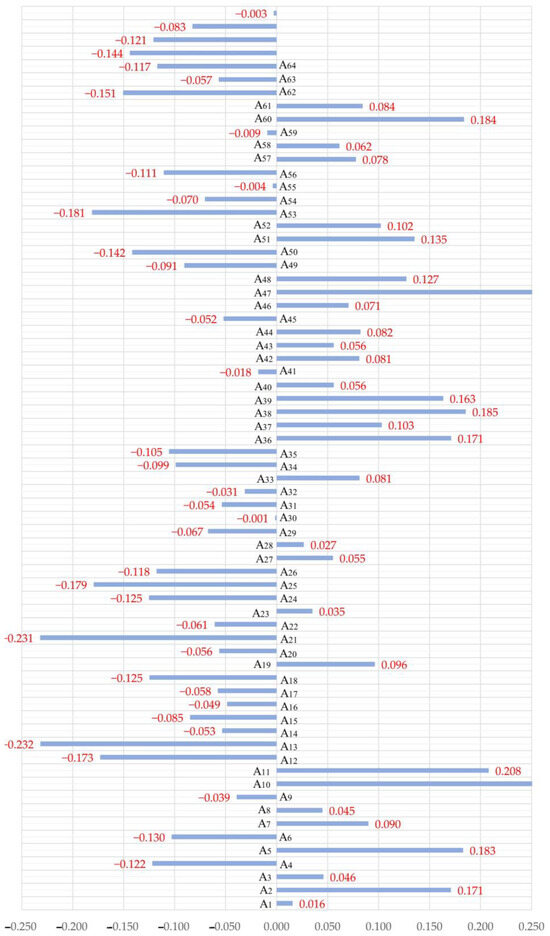
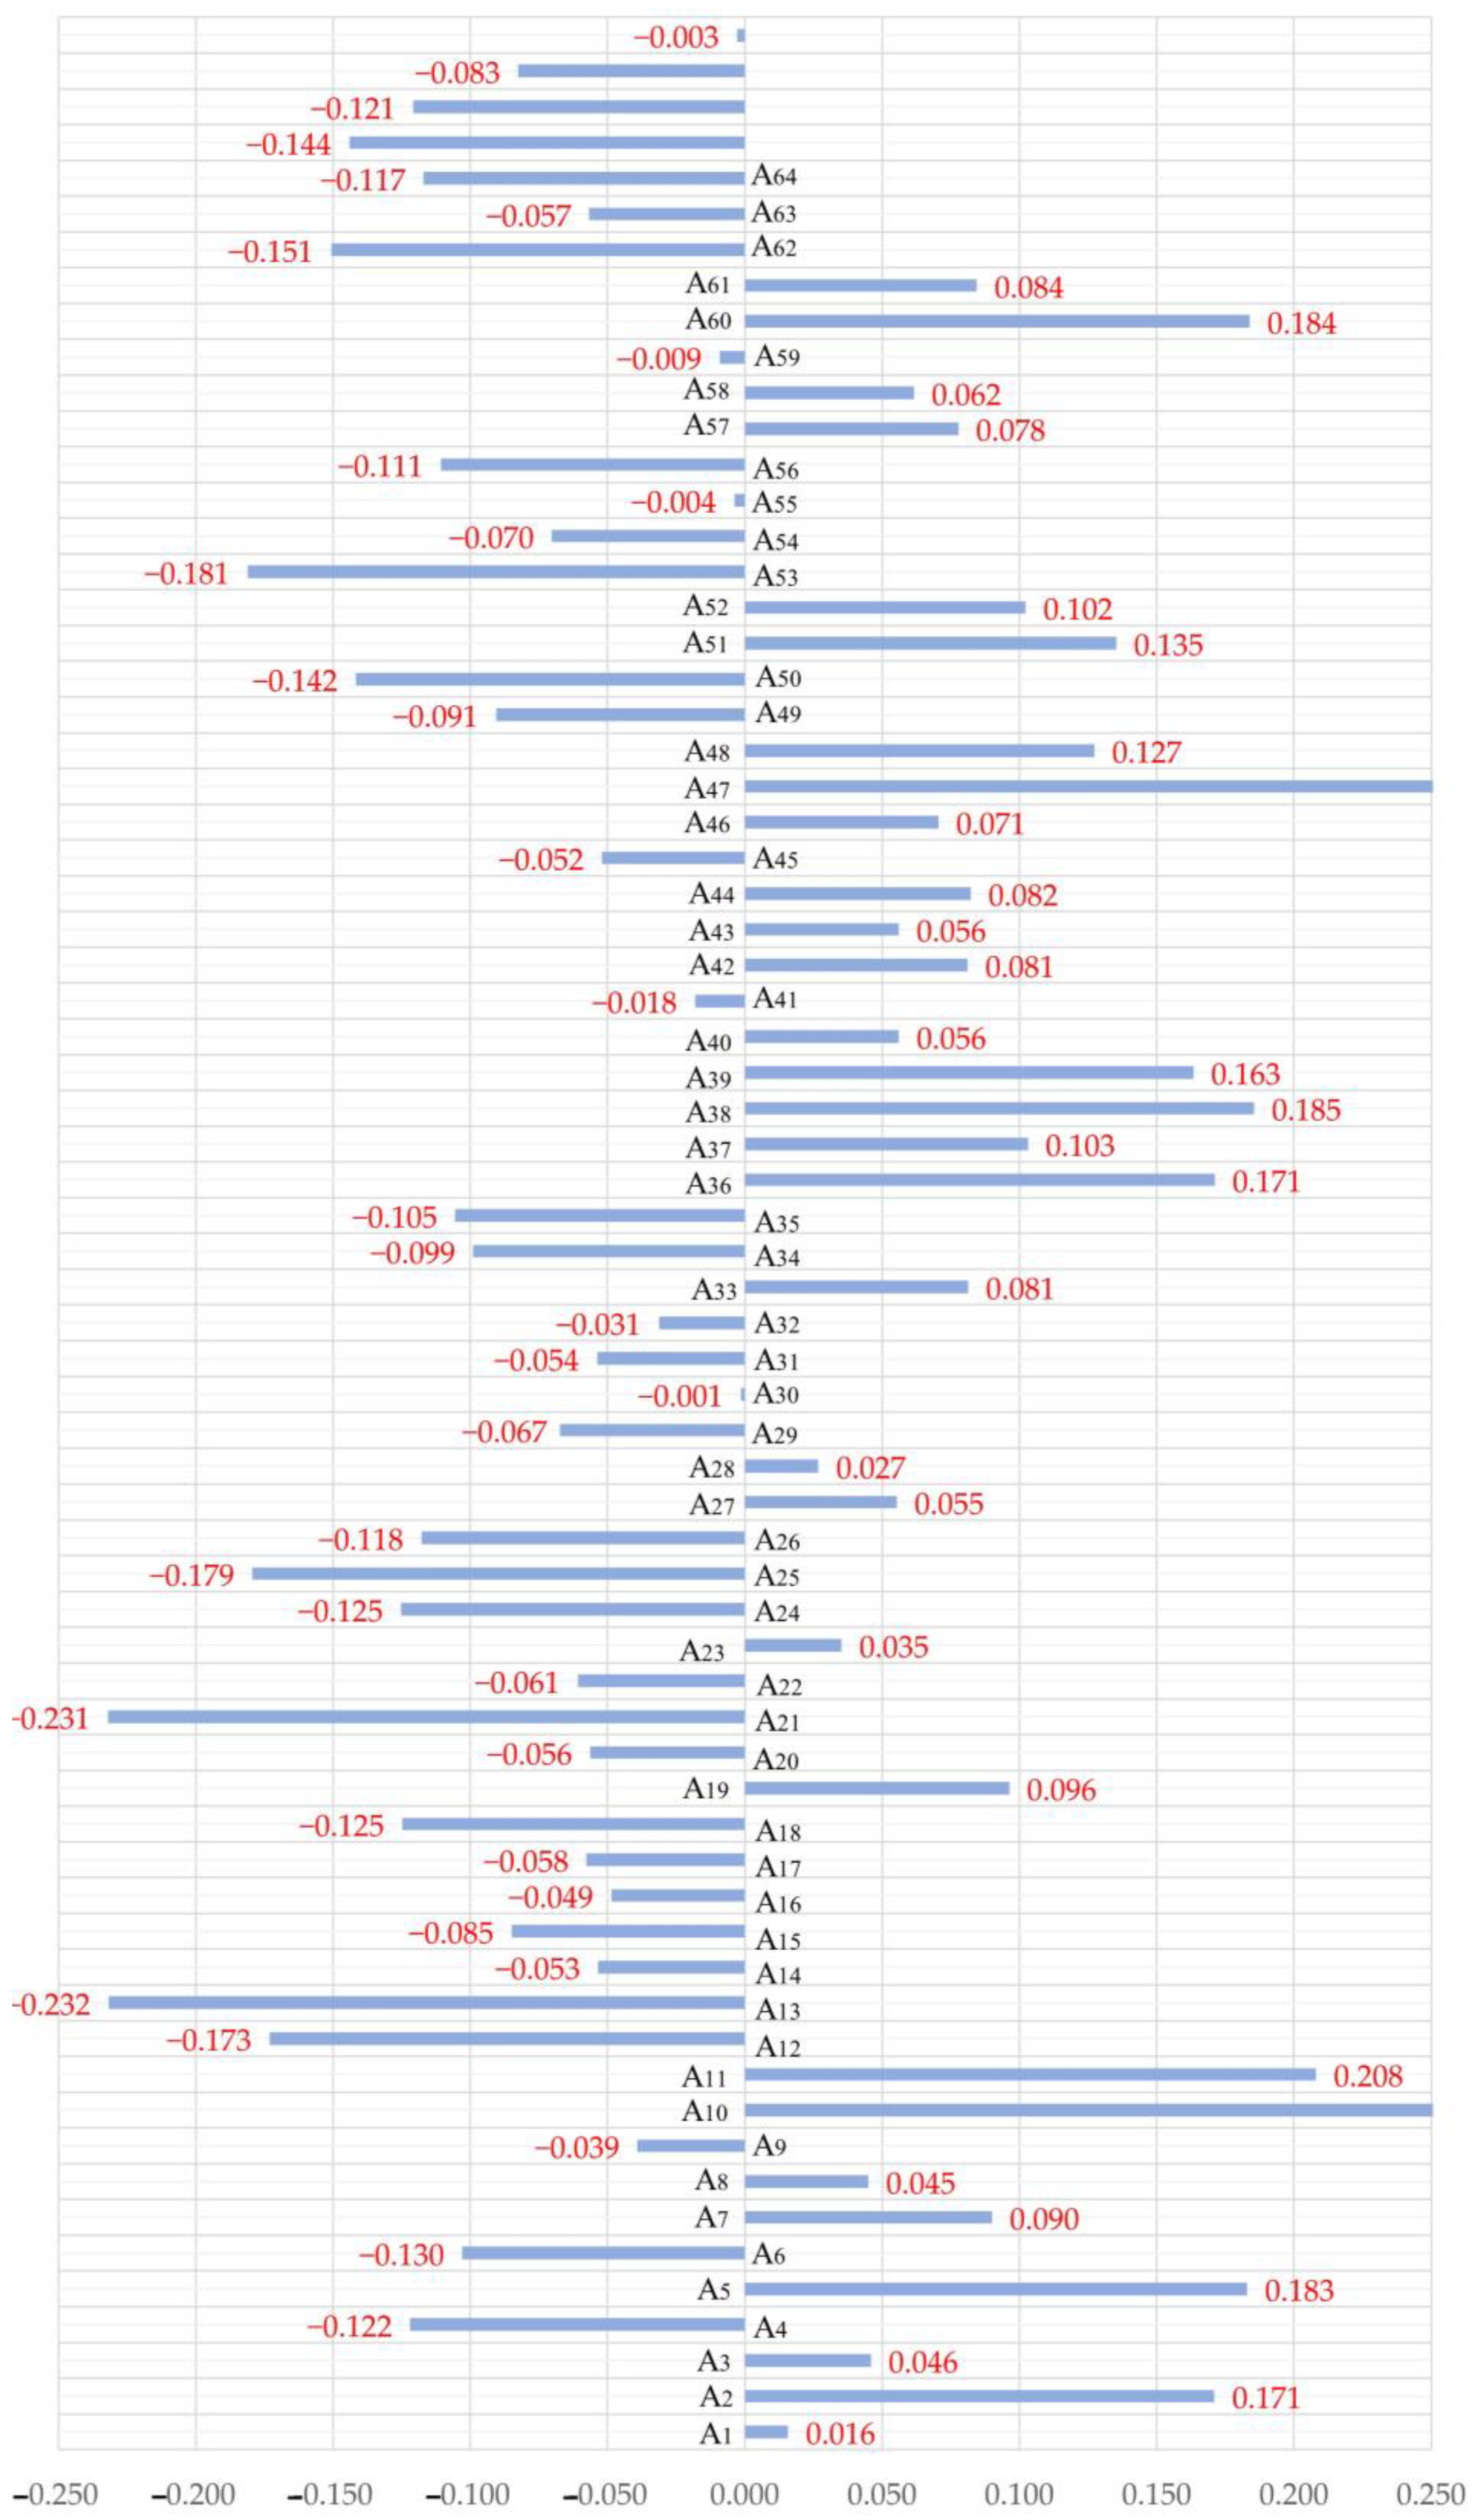
Based on the above calculations, the leaving and entering flow values of the risks could be calculated as follows: = 0.147, …, = 0.149. Similarly, the entering flow values can be computed as follows: = 0.131, …, = 0.152. Then, by subtracting the entering flows from the leaving flows, the net outranking flows for each risk were obtained, which were used to rank the risks in descending order, as shown in Table 11 (see also Figure 4).
Table 11.
Risk ranking according to net outranking flows.
Figure 4.
Net outranking flows.
The results demonstrated that the boulders and clays in the ground is the most important, with the highest net outranking flow value, while the least important risk is blockage in the conveyor belt. The other risks are prioritized based on their net outranking flow values in descending order.
After obtaining the ranking results, a sensitivity analysis was conducted to check the robustness and reliability of the findings. If the weight of the most important criterion was changed from wp to , the new weights can be calculated as follows [50]:
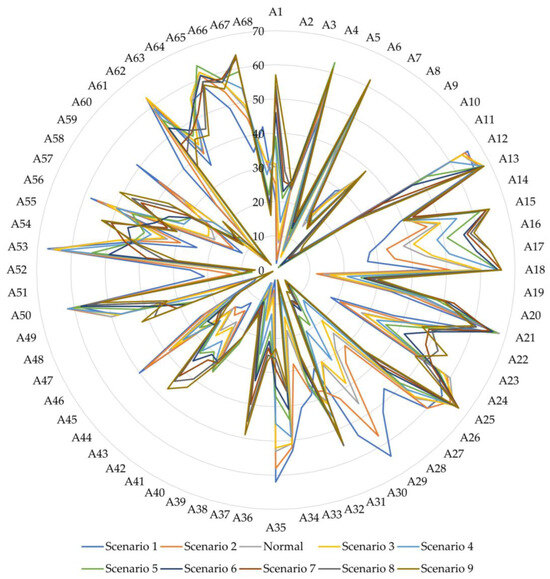
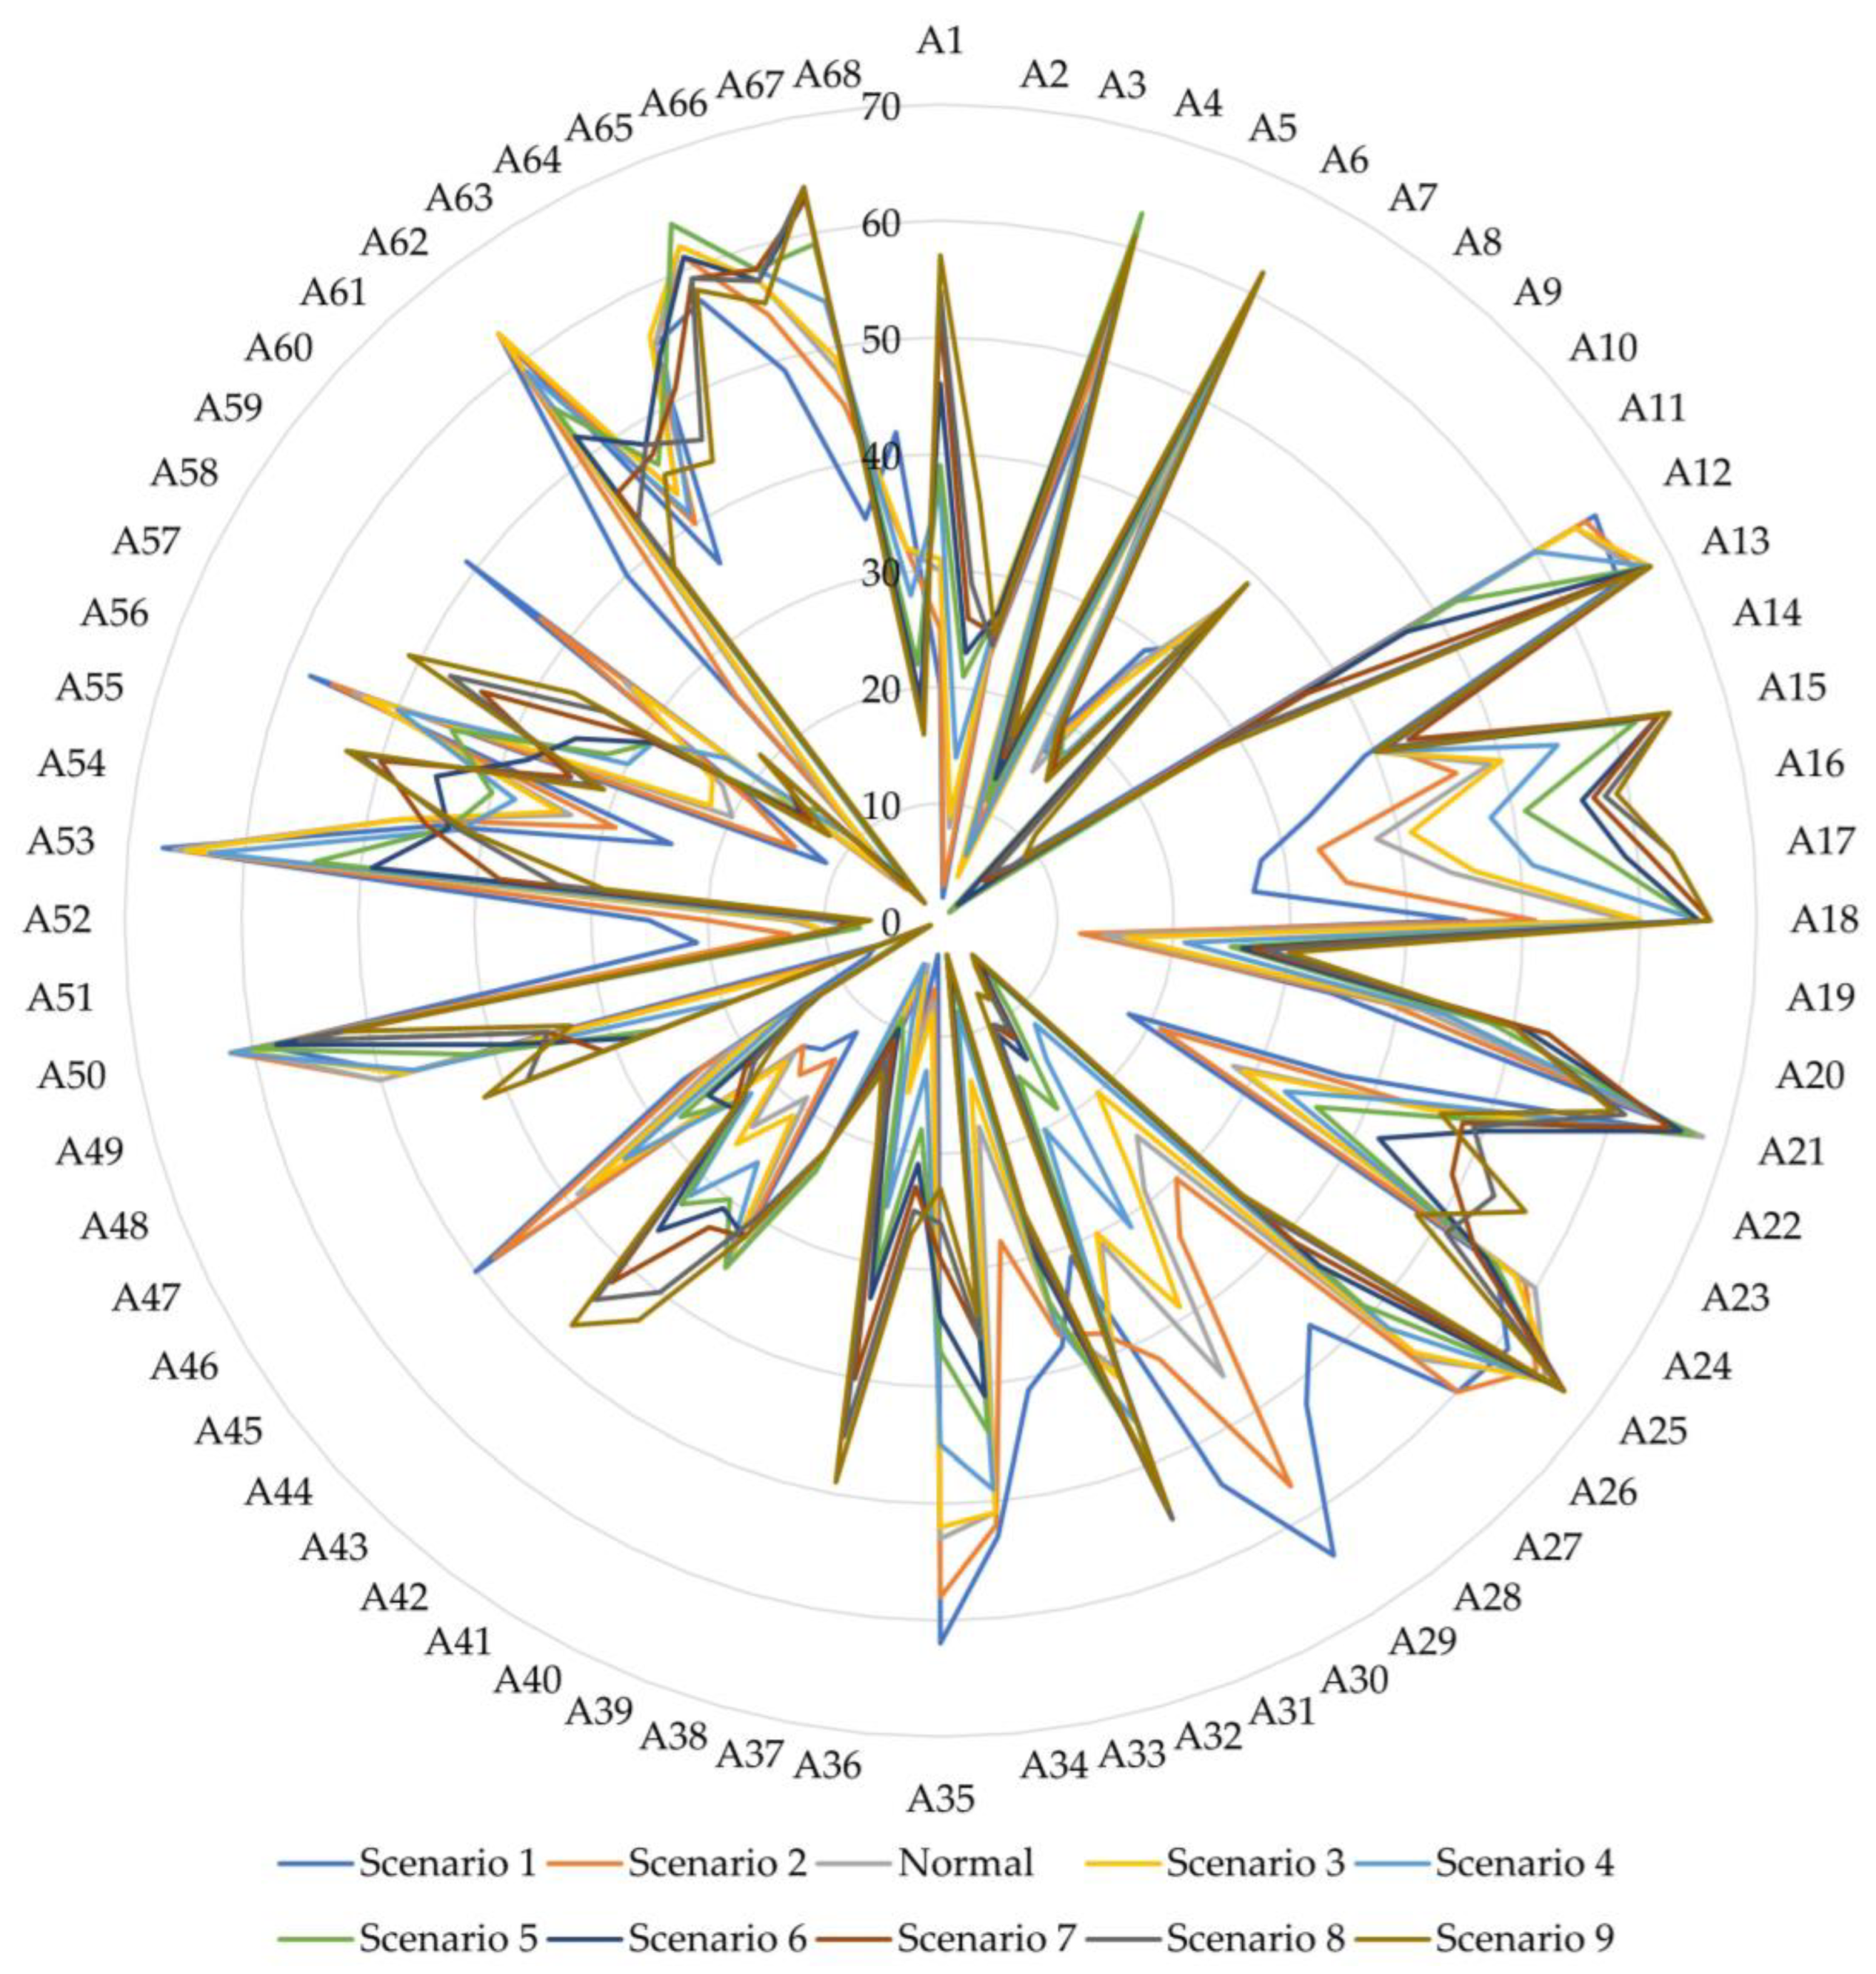
where wp and denote the original and new weights of the most important criterion; = wp + Δp; Δp represents a predefined variation applied to this weight; p = 1, 2, …, m. In this study, the highest weight value was varied from 0.1 to 0.9 in steps of 0.1, while the other weights were changed in optimal proportions to examine the new ranks of each risk, as presented in Figure 5.
Figure 5.
Sensitivity analysis results.
The sensitivity analyses illustrate the results obtained from the proposed risk evaluation framework under the normal condition and nine sensitivity scenarios. The method ranks all the risks based on their aggregated evaluation scores. The results show that several risks retain similar ranking positions across all scenarios, particularly those located at the top and bottom of the list. This observation indicates that these risks exhibit strong dominance or weak influence regardless of weight variations, which demonstrates the stability of the proposed method for clearly distinguishable risks. In contrast, the changes mainly occur among risks located in the middle range of the ranking list. These risks display noticeable rank shifts when the criterion weights change, which indicates higher sensitivity to the relative importance of the evaluation criteria. As the weight of the most influential criterion increased or decreased, some risks changed based on their relative preference degrees. Overall, the sensitivity analysis confirms that the proposed method effectively captures the influence of criterion weight variations on risk prioritization. At the same time, the general ranking structure remains stable, which indicates that the method provides robust and reliable results while preserving sufficient flexibility to reflect different decision-making assumptions. This balance enhances the credibility of the proposed approach for supporting risk management decisions in tunnel construction projects.
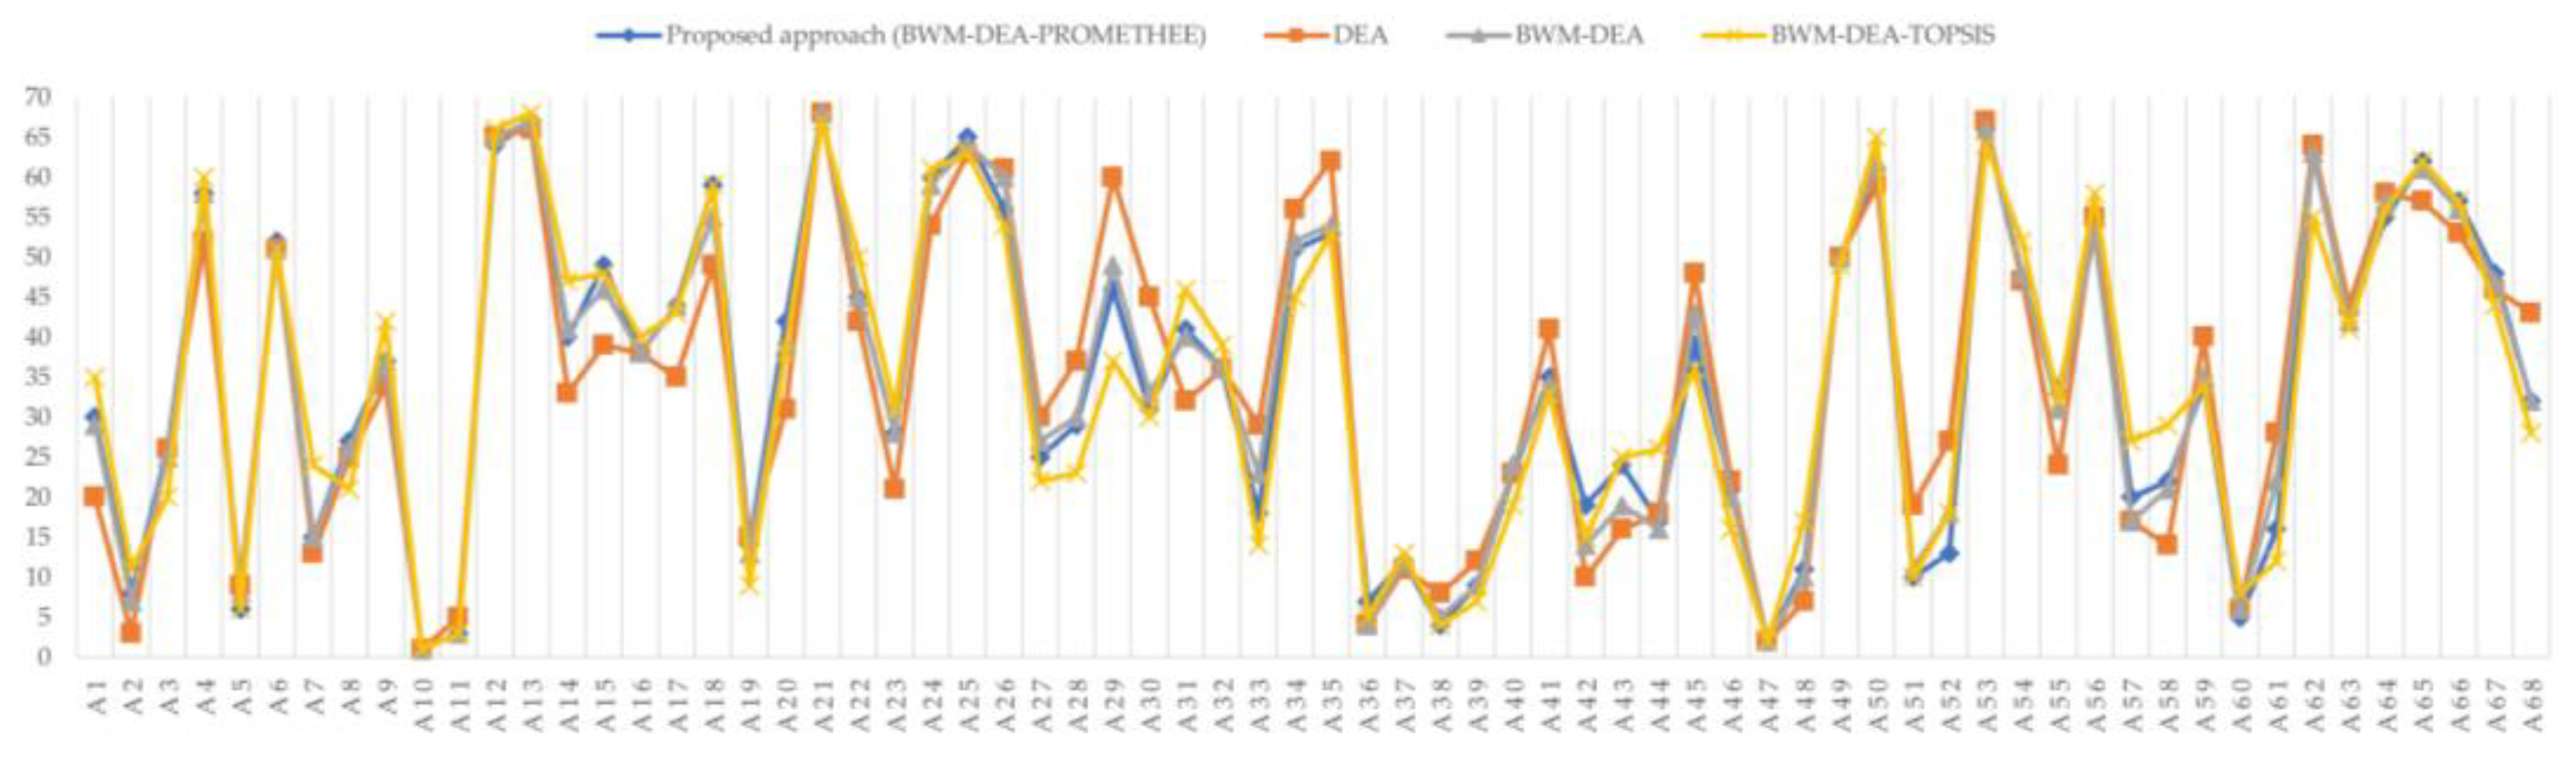
To further evaluate the effectiveness of the proposed approach, its results were compared with those obtained from alternative methods using the same dataset, including the DEA, BWM–DEA, and BWM–DEA–TOPSIS approaches. The DEA model was used to calculate the local risk scores, and the final risk values were derived through direct summation of these scores across all criteria. In the BWM–DEA approach, the criterion importance weights obtained from the BWM were combined with the DEA-based local risk scores through weighted aggregation, where each local risk score was multiplied by its corresponding weight and then summed to obtain the final risk value. In the BWM–DEA–TOPSIS approach, the same criterion weights and local risk scores were analyzed, while the PROMETHEE method was replaced by TOPSIS to derive the final risk ranking. This comparison under identical data conditions enables an objective assessment of the influence of different aggregation and ranking mechanisms on risk prioritization results. The results of this comparative analysis are illustrated in Figure 6 (see also Table S1 in the Supplementary File).
Figure 6.
Comparison results.
The comparison results indicate that the proposed approach produces a risk ranking that differs from those obtained by the other methods. Based on the net outranking flow values of the risks, all the methods identify the same risks in the first and second ranks. However, differences emerge from the third-ranked risk onward. In particular, the DEA-based method yields a lower cumulative net outranking flow value of 0.896 for the top three ranked risks, whereas the other methods produce a higher cumulative value of 0.933. When the cumulative net outranking flow values of the top four most significant risks are considered, the proposed and BWM–DEA–TOPSIS approaches achieve a total value of 1.119, which exceeds the corresponding values obtained by the remaining methods. Furthermore, analysis of the top five ranked risks shows that the proposed approach attains the highest cumulative net outranking flow value of 1.302, which surpasses the totals produced by all alternative methods. These results demonstrate that the proposed approach provides stronger overall discrimination among high-priority risks and more effectively captures their combined significance within the ranking structure.
4. Discussion
The results of this study demonstrate that the proposed hybrid decision-making approach is highly effective in addressing the complexities of risk analysis in underground tunnel construction using TBMs. The BWM, DEA, and PROMETHEE methods effectively worked together to solve the risk analysis problem. All the risks were analyzed based on multiple dimensions, such as decision-makers’ preferences, occurrence, and different severities. The BWM provides an efficient mechanism to determine the weights of criteria. The DEA model evaluates local risk scores based on multiple inputs and outputs in the forms of assessment grades and criterion weights. Finally, PROMETHEE synthesizes all the decision-making information and offers an accurate risk ranking based on positive and negative outranking flows, which enhances interpretability for decision-makers by clearly distinguishing between high-priority and lower-priority risks. This proposed approach captures expert knowledge and multiple-criterion complexity, provides balanced, consistent, and practical results, and supports risk analysis in complex infrastructure environments.
The application of the proposed approach yielded insightful results that confirm its effectiveness in analyzing risks associated with underground tunnel construction using TBMs. The criterion weights, local risk scores, and net outranking flow values enabled the comprehensive risk analysis. The results demonstrated that the criterion weights ranged between 0.157 and 0.275. Although differences among the weights existed, the values remained relatively close to one another, which indicates that no single criterion overwhelmingly dominated the evaluation process. This pattern shows that the final risk rankings depended more on the risk evaluations themselves than on the prioritization of criteria. In other words, variations in local risk scores across different criteria had a stronger influence on the final rankings than the weight distribution alone. The results therefore reflect the actual performance and severity of individual risks under each criterion rather than strong influence from a single dominant weighting structure. Moreover, clear differentiation was observed between high- and low-significance risks, which were analyzed with respect to all the criteria, such as the possibility of risks occurring, cost escalation, project delay, resource loss, and quality degradation. The results showed that the boulders and clays in the ground risk was the most significant, whereas blockage in the conveyor belt was the least important. This outcome indicates that adverse ground conditions exert a more critical influence on TBM-based tunnel construction than isolated mechanical disruptions. Boulders and clay-rich strata directly affect excavation efficiency, cutter wear, face stability, and construction continuity, which often lead to substantial delays, increased costs, and operational uncertainty. Furthermore, several risks related to geological variability, excavation control, and equipment performance occupy upper ranking positions, which confirms their dominant role in determining project success. Conversely, risks associated with logistical or auxiliary systems tend to appear at lower ranks, which suggests a relatively smaller immediate impact on construction progress. This risk distribution emphasizes the need for project managers to prioritize ground condition assessment and excavation strategy optimization when allocating resources and planning mitigation measures.
Further consideration of the project context indicates that no significant issues related to delays in payment have been observed. This situation can be attributed to the structured financial management system, clear contractual payment schedules, and strong institutional support associated with this publicly funded infrastructure project. The presence of predefined administrative procedures, regular budget allocation, and close supervision by relevant governmental agencies reduces uncertainty in financial disbursement and ensures continuity in project financing. Consequently, financial risks associated with payment delays are perceived as less critical than technical and operational risks that directly affect construction performance. This observation is consistent with the results, which show that the delay in payment for ensuring contractual progress risk was ranked at a relatively low level. The results may vary due to several factors, such as changes in project conditions, progression of construction phases, updated operational experience, and differences in stakeholder perspectives. The composition of the decision-maker panel further explains this outcome. The panel consisted of three independent academic experts and four contractor-associated practitioners who are directly involved in tunnel construction. This composition may have emphasized technical and operational perspectives, leading to greater attention to geological and construction risks than to financial risks. Variation in stakeholder composition could shift the rankings toward human, legal, financial, or other risk aspects.
A clear shift in risk prioritization is observed when the results of this study are compared with those reported by Koohathongsumrit and Meethom [18], who conducted risk analysis for the same project at an earlier construction stage as of the end of May 2023, with a progress level of 11.55%. As the project advanced to 66.14% completion as of the end of November 2025, changes in construction conditions, accumulated operational experience, and emerging site-specific challenges prompted a reassessment of risk importance. The updated risk evaluation presented in this study reveals markedly different priority risks, which reflect the dynamic nature of risk profiles throughout the project lifecycle. When considering the top five risks identified in the initial assessment and those obtained in the present study, substantial differences are clearly observed, as shown in Table 12.
Table 12.
Comparison of the top five risks between the end of May 2023 and the end of November 2025.
Based on the above results, the shift in rankings indicates that as construction progressed, practical challenges related to actual ground conditions and workforce performance became more prominent than regulatory and initial operational uncertainties. In particular, geological risks such as boulders and clay-rich formations emerged as the most critical due to their direct influence on excavation efficiency, cutter wear, and face stability during ongoing tunneling operations. Workforce-related risks, especially inefficient labor, also became more significant as project activities intensified and coordination demands increased. Meanwhile, some risks identified in the earlier stage, such as violations of laws and poor control of face pressure, declined in priority, likely due to improved regulatory compliance, enhanced monitoring systems, and accumulated technical experience in TBM operations. Nonetheless, the difficulty in cooperation with the related government and the high water pressure in the ground risks remained consistently important across both assessments, highlighting their persistent impact on project performance regardless of construction stage. The presence of two different rankings for the same project reflects the evolving nature of risks throughout the project lifecycle. Stakeholders should continuously update risk assessments and adjust mitigation strategies accordingly so that decision-making remains responsive to current realities rather than depending solely on the initial rankings.
The sensitivity analysis further reveals that the risk ranking strongly depends on the criterion weights. When the weights are relatively evenly distributed among all the criteria, boulders and clays in the ground emerges as the highest-ranked risk. This result reflects the comprehensive influence of face pressure control on multiple aspects of tunnel construction. However, when a criterion is of significantly higher importance, the ranking outcome changes accordingly. For example, when greater emphasis is placed on the increase in cost criterion, difficulty in cooperation with the related government becomes the highest-ranked risk. This change reflects the strong financial implications of administrative and coordination challenges, which may lead to delays, contractual disputes, budget overruns, and penalty costs associated with project delays. These findings demonstrate that risk prioritization is highly sensitive to decision-maker preferences and strategic objectives. Therefore, decision-makers should adjust risk mitigation strategies based on dominant decision criteria, with particular attention to face pressure control under balanced priorities and ground condition management when cost escalation is the primary concern. Furthermore, the comparison between the proposed approach and competing methods indicates that the former, which provides superior risk discrimination capability, enables more precise identification of critical risks and supports more informed decision-making under complex and evolving project conditions. Across different scenarios, some risks remain relatively stable at the top of the ranking. These risks simultaneously affect cost, schedule, safety, and operational continuity and reflect strong influence across multiple attributes. Thus, cost-focused priorities elevate financial and administrative risks, whereas schedule-focused priorities elevate excavation and workforce-related risks. Mitigation plans therefore depend on the resulting risk rankings and require a balanced approach. High-priority risks require continuous monitoring and strict control, while lower-ranked risks require preventive measures. Cost-oriented rankings require emphasis on contract administration, coordination, and budget control, whereas schedule-oriented rankings require emphasis on excavation planning, equipment reliability, and workforce management. This alignment supports effective mitigation actions and helps achieve project objectives.
In this case, project managers, stakeholders, engineers, and relevant authorities should place strong emphasis on the identification and management of adverse ground conditions, particularly risks associated with a large number of boulders and clays in the ground, which emerges as the highest-priority risk under balanced decision preferences. Effective mitigation of this risk requires comprehensive geotechnical investigation, detailed ground condition characterization prior to excavation, and careful selection of excavation strategies and cutter configurations that suit heterogeneous soil conditions. In addition, close monitoring of excavation performance and timely adjustment of operational parameters can reduce excavation resistance, equipment wear, and unexpected delays. Moreover, early stakeholder engagement, clear communication channels, and well-defined mechanisms of coordination with governmental authorities play a crucial role in preventing delays, contractual disputes, and cost escalation. These findings also confirm that the proposed approach captures variations in decision-makers’ judgments through the consideration of their distributions, which strengthens the credibility and transparency of the ranking results. Overall, the proposed method supports robust risk analysis and offers practical guidance for resource allocation and strategic risk mitigation in large-scale underground infrastructure projects.
5. Conclusions
In this study, we aim to address the complexities of risk analysis in underground tunnel construction projects using TBMs. The proposed approach, which integrates the BWM, DEA, and PROMETHEE, is first developed to evaluate and prioritize multiple risks across diverse criteria in high-risk infrastructure environments. The BWM enables an efficient process for criterion prioritization with fewer comparisons and reliable consistency checks. The risk analysis-based DEA model calculates local risk scores by handling multiple qualitative and quantitative inputs and outputs and allows objective evaluation across diverse risk dimensions. PROMETHEE synthesizes all decision-making data to generate the best compromise, which clearly identifies the most critical risks and supports data-driven risk analysis. Finally, the proposed approach was verified through an empirical metro construction project in Thailand.
This study contributes to both theoretical and practical perspectives through the development of a comprehensive and innovative risk assessment framework for TBM-based tunnel construction that integrates multiple MCDM methods. From a theoretical perspective, the proposed approach contributes to MCDM knowledge by demonstrating how decision-makers’ judgments, efficiency-based evaluation, and preference-based ranking operate jointly within a coherent framework for tunnel construction risk analysis. The distinctive strengths of each method are explicitly utilized, with each technique assigned a clearly defined analytical role within the assessment process. This integrated use of complementary methodological advantages enhances analytical rigor and contributes to a deeper theoretical understanding of risk assessment in complex infrastructure projects. From a practical perspective, the proposed approach provides a transparent and structured decision-support tool that assists key project participants in identifying critical risks, understanding their relative importance under different strategic priorities, and supporting adaptive risk mitigation strategies. For example, project managers can clearly identify the most critical risks that threaten project success. In this case, the most significant risk that emphasizes the need for a robust risk management strategy prioritizes ground condition uncertainty. Effective mitigation requires detailed geotechnical investigation, accurate ground characterization, and careful selection of excavation methods and TBM configurations that suit heterogeneous soil conditions. In addition, continuous supervision of excavation performance and timely adjustment of operational parameters can reduce excessive tool wear, excavation resistance, and unexpected construction delays. Addressing this high-priority geological risk is essential not only for operational safety but also for maintaining construction efficiency and overall project progress.
The generalizability of this study extends to other large-scale infrastructure projects involving high-risk environments, as the proposed approach can be adapted to assess risks across various domains. Decision-makers can systematically evaluate risks, prioritize them, and implement effective mitigation strategies, thereby enhancing the sustainability and safety of underground construction initiatives. Despite the advantages of the proposed approach, some limitations should be acknowledged. First, it depends strongly on the participation of decision-makers who possess substantial domain knowledge in tunnel construction and TBM operation. These decision-makers must have a clear understanding of the evaluation scales before the decision process. Second, the proposed approach does not explicitly account for interdependencies or causal relationships among decision elements, such as interactions between risks or mutual influences among criteria, which may exist in complex construction systems. Third, the use of the usual preference function is limited because this function assumes that any non-zero performance difference immediately implies strict preference. This limitation neglects the presence of indifference zones or tolerance thresholds and may oversimplify actual decision behavior. Lastly, the proposed approach may face practical limitations related to computational cost and implementation effort. An increase in the number of criteria, risks, or decision-makers leads to a rapid growth in pairwise comparisons, which requires more analysis time and computational resources. This may reduce efficiency in large-scale applications and increase the possibility of rank reversal, where less critical risks appear in higher positions while more critical risks shift to lower ranks, which may affect result reliability.
For future research, several directions are recommended. First, further testing of the proposed approach across different tunneling environments and construction projects can enhance its generalizability and adaptability. Second, integrating additional decision-making methods or advanced simulation techniques can strengthen the risk analysis framework. Finally, the model could be extended to include considerations of sustainability and environmental impact. Incorporating environmental, social, and governance risks into the risk assessment model can provide a more holistic approach to project management in infrastructure construction.
Supplementary Materials
The following supporting information can be downloaded at: https://www.mdpi.com/article/10.3390/infrastructures11020072/s1, Table S1: Ranking results of comparative analysis.
Author Contributions
Conceptualization, N.K.; methodology, N.K.; software, N.K. and W.C.; validation, N.K. and W.C.; formal analysis, N.K.; investigation, N.K.; resources, N.K.; data curation, N.K.; writing—original draft preparation, N.K. and W.C.; writing—review and editing, N.K. and W.C.; visualization, N.K.; supervision, N.K.; project administration, N.K. All authors have read and agreed to the published version of the manuscript.
Funding
This research received no external funding.
Data Availability Statement
The original contributions presented in this study are included in the article/Supplementary Material. Further inquiries can be directed to the corresponding author.
Conflicts of Interest
The authors declare no conflicts of interest.
References
- Elgamal, A.; Elfaris, N. Seismic isolation materials for bored rock tunnels: A parametric analysis. Infrastructures 2024, 9, 44. [Google Scholar] [CrossRef] [Scilit]
- Zhou, Z.; Li, Z.; Tan, Z.; Lei, K.; Zhang, L. Optimized decision-making for tunnel boring machine control parameters. Rock Mech. Rock Eng. 2025, 58, 5711–5731. [Google Scholar] [CrossRef] [Scilit]
- Armetti, G.; Migliazza, M.R.; Ferrari, F.; Berti, A.; Padovese, P. Geological and mechanical rock mass conditions for TBM performance prediction. The case of “La Maddalena” exploratory tunnel, Chiomonte (Italy). Tunn. Undergr. Space Technol. 2018, 77, 115–126. [Google Scholar] [CrossRef] [Scilit]
- Han, S.; Li, Z.; Zhou, Z.; Tan, Z.; Wei, F. Research on real-time prediction method of surrounding rock classification of TBM tunnel based on stacked ensemble classifier. Tunn. Undergr. Space Technol. 2025, 166, 107025. [Google Scholar] [CrossRef] [Scilit]
- Lai, H.; Zhou, Z.; Tan, Z.; Li, Z.; Zhao, J. Development of open TBM tunnelling performance prediction model based on Hydropower Classification (HC) system: A case study in Xinjiang. Rock Mech. B 2025, 2025, 100264. [Google Scholar] [CrossRef] [Scilit]
- Salimi, A.; Rostami, J.; Moormann, C. Application of rock mass classification systems for performance estimation of rock TBMs using regression tree and artificial intelligence algorithms. Tunn. Undergr. Space Technol. 2019, 92, 103046. [Google Scholar] [CrossRef] [Scilit]
- Fan, Z.; Zheng, Z.; Xu, B.; Li, W.; Zhang, Y.; Hao, Z. Performance optimization of hard rock tunnel boring machine using multi-objective evolutionary algorithm. Comput. Ind. Eng. 2022, 169, 108251. [Google Scholar] [CrossRef] [Scilit]
- Moradi, M.R.; Farsangi, M.A.E. Application of the risk matrix method for geotechnical risk analysis and prediction of the advance rate in rock TBM tunneling. Rock Mech. Rock Eng. 2014, 47, 1951–1960. [Google Scholar] [CrossRef] [Scilit]
- Yazdani-Chamzini, A. Proposing a new methodology based on fuzzy logic for tunnelling risk assessment. J. Civ. Eng. Manag. 2014, 20, 82–94. [Google Scholar] [CrossRef] [Scilit]
- Chung, H.; Lee, I.-M.; Jung, J.-H.; Park, J. Bayesian networks-based shield TBM risk management system: Methodology development and application. KSCE J. Civ. Eng. 2018, 23, 452–465. [Google Scholar] [CrossRef] [Scilit]
- Sharafat, A.; Latif, K.; Seo, J. Risk analysis of TBM tunneling projects based on generic bow-tie risk analysis approach in difficult ground conditions. Tunn. Undergr. Space Technol. 2021, 111, 103860. [Google Scholar] [CrossRef] [Scilit]
- Zhang, L.; Wu, X.; Ding, L.; Skibniewski, M.J.; Lu, Y. Bim-based risk identification system in tunnel construction. J. Civ. Eng. Manag. 2016, 22, 529–539. [Google Scholar] [CrossRef] [Scilit]
- Kouaissah, N.; Hocine, A. XOR-best worst method and its assessment to COVID-19 sectorial impact. Ann. Oper. Res. 2023. [Google Scholar] [CrossRef] [Scilit]
- Koohathongsumrit, N.; Meethom, W. A fuzzy decision-making framework for route selection in multimodal transportation networks. Eng. Manag. J. 2022, 34, 689–704. [Google Scholar] [CrossRef] [Scilit]
- Sotoudeh-Anvari, A. The applications of MCDM methods in COVID-19 pandemic: A state of the art review. Appl. Soft Comput. 2022, 126, 109238. [Google Scholar] [CrossRef] [Scilit]
- Baydaş, M.; Elma, O.E. An objectıve criteria proposal for the comparison of MCDM and weighting methods in financial performance measurement: An application in Borsa Istanbul. Decis. Mak. Appl. Manag. Eng. 2021, 4, 257–279. [Google Scholar] [CrossRef] [Scilit]
- Ghorbani, S.; Bour, K.; Javdan, R. Applying the PROMETHEE II, WASPAS, and CoCoSo models for assessment of geotechnical hazards in TBM tunneling. Sci. Rep. 2025, 15, 491. [Google Scholar] [CrossRef] [Scilit]
- Koohathongsumrit, N.; Meethom, W. Risk analysis in underground tunnel construction with tunnel boring machines using the Best-Worst method and data envelopment analysis. Heliyon 2024, 10, e23486. [Google Scholar] [CrossRef] [Scilit]
- Nezarat, H.; Sereshki, F.; Ataei, M. Ranking of geological risks in mechanized tunneling by using Fuzzy Analytical Hierarchy Process (FAHP). Tunn. Undergr. Space Technol. 2015, 50, 358–364. [Google Scholar] [CrossRef] [Scilit]
- Shaffiee Haghshenas, S.; Shaffiee Haghshenas, S.; Abduelrhman, M.A.; Zare, S.; Mikaeil, R. Identifying and ranking of mechanized tunneling project’s risks by using a fuzzy multi-criteria decision making technique. J. Soft Comput. Civ. Eng. 2022, 6, 29–45. [Google Scholar] [CrossRef]
- Yazdani-Chamzini, A.; Yakhchali, S.H.; Mahmoodian, M. Risk ranking of tunnel construction projects by using the ELECTRE technique under a fuzzy environment. Int. J. Manag. Sci. Eng. Manag. 2013, 8, 1–14. [Google Scholar] [CrossRef] [Scilit]
- Ehsanifar, M.; Hemesy, M. A new hybrid multi-criteria decision-making model to prioritize risks in the construction process under fuzzy environment (case study: The Valiasr Street underpass project). Int. J. Constr. Manag. 2021, 21, 508–523. [Google Scholar] [CrossRef] [Scilit]
- Liu, X.; Zhou, X.-H.; Wang, Y.-J. Risk analysis for urban excavation: A FAHP-VIKOR hybrid method. Geomat. Nat. Hazards Risk 2023, 14, 2282944. [Google Scholar] [CrossRef] [Scilit]
- Gogate, N.G.; Shelake, A.G.; Band, P. Selection of most significant risk factors for Indian tunnel projects: An integrated fuzzy-based MCDM approach. Int. J. Constr. Manag. 2024, 24, 161–176. [Google Scholar] [CrossRef] [Scilit]
- Wang, H.-L.; Liu, Y.; Jiang, Y.; Wang, Z.-T.; Ozmen, H.B. A novel approach for risk assessment of building damage via metro tunnel construction. Adv. Civ. Eng. 2022, 2022, 8448223. [Google Scholar] [CrossRef] [Scilit]
- Hyun, K.-C.; Min, S.; Choi, H.; Park, J.; Lee, I.-M. Risk analysis using fault-tree analysis (FTA) and analytic hierarchy process (AHP) applicable to shield TBM tunnels. Tunn. Undergr. Space Technol. 2015, 49, 121–129. [Google Scholar] [CrossRef] [Scilit]
- Zhang, L.; Chen, W. Multi-criteria group decision-making with cloud model and TOPSIS for alternative selection under uncertainty. Soft Comput. 2022, 26, 12509–12529. [Google Scholar] [CrossRef] [Scilit]
- Zhang, P.; Zhang, Z.-J.; Gong, D.-Q. An improved failure mode and effect analysis method for group decision-making in utility tunnels construction project risk evaluation. Reliab. Eng. Syst. Saf. 2024, 244, 109943. [Google Scholar] [CrossRef] [Scilit]
- Koohathongsumrit, N.; Chankham, W. Risk analysis of underground tunnel construction with tunnel boring machine by using fault tree analysis and fuzzy analytic hierarchy process. Safety 2024, 10, 68. [Google Scholar] [CrossRef] [Scilit]
- Rezaei, J. Best-worst multi-criteria decision-making method. Omega 2015, 53, 49–57. [Google Scholar] [CrossRef] [Scilit]
- Wang, Y.-M.; Liu, J.; Elhag, T.M.S. An integrated AHP–DEA methodology for bridge risk assessment. Comput. Ind. Eng. 2008, 54, 513–525. [Google Scholar] [CrossRef] [Scilit]
- Brans, J.P.; Vincke, P.; Mareschal, B. How to select and how to rank projects: The Promethee method. Eur. J. Oper. Res. 1986, 24, 228–238. [Google Scholar] [CrossRef] [Scilit]
- Khan, N.Z.; Shihab, S.K.; Attri, R.; Siddiquee, A.N.; Khan, Z.A. Prioritization of lower back pain risk factors among industrial workers using the best-worst method. Int. J. Occup. Saf. Ergon. 2021, 27, 544–551. [Google Scholar] [CrossRef] [Scilit] [PubMed]
- Koohathongsumrit, N.; Chankham, W. Route selection in multimodal supply chains: A fuzzy risk assessment model-BWM-MARCOS framework. Appl. Soft Comput. 2023, 137, 110167. [Google Scholar] [CrossRef] [Scilit]
- Rezaei, J. Best-worst multi-criteria decision-making method: Some properties and a linear model. Omega 2016, 64, 126–130. [Google Scholar] [CrossRef] [Scilit]
- Koohathongsumrit, N.; Meethom, W. An integrated approach of fuzzy risk assessment model and data envelopment analysis for route selection in multimodal transportation networks. Expert. Syst. Appl. 2021, 171, 114342. [Google Scholar] [CrossRef] [Scilit]
- Koohathongsumrit, N.; Meethom, W. Route selection in multimodal transportation networks: A hybrid multiple criteria decision-making approach. J. Ind. Prod. Eng. 2021, 38, 171–185. [Google Scholar] [CrossRef] [Scilit]
- Ghavami, S.M.; Borzooei, Z.; Maleki, J. An effective approach for assessing risk of failure in urban sewer pipelines using a combination of GIS and AHP-DEA. Process Saf. Environ. Prot. 2020, 133, 275–285. [Google Scholar] [CrossRef] [Scilit]
- Pelit, İ.; Avşar, İ.İ. Turkiye’s carbon emission profile: A global analysis with the MEREC-PROMETHEE hybrid method. Sustainability 2025, 17, 6527. [Google Scholar] [CrossRef] [Scilit]
- Singh, A.; Gupta, A.; Mehra, A. Best criteria selection based PROMETHEE II method. Opsearch 2021, 58, 160–180. [Google Scholar] [CrossRef] [Scilit]
- Maracajá, K.F.B.; Batista Schramm, V.; Schramm, F.; Valduga, V.; Trindade, J.R. Application of MCDM using PROMETHEE II for evaluation of wine tourism services. Int. J. Wine Res. 2023, 35, 427–444. [Google Scholar] [CrossRef] [Scilit]
- Kazançoglu, Y.; Ozturkoglua, Y.; Mangla, S.K.; Ozbiltekin-Pala, M.; Ishizaka, A. A proposed framework for multi-tier supplier performance in sustainable supply chains. Int. J. Prod. Res. 2023, 61, 4742–4764. [Google Scholar] [CrossRef] [Scilit]
- Gulmez, B. A novel hybrid MCDM framework combining TOPSIS, PROMETHEE II, and VIKOR for peach drying method selection. Curr. Res. Food Sci. 2025, 10, 101034. [Google Scholar] [CrossRef] [Scilit]
- Fonseca, L.S.a.; Lima, D. Supporting delivery allocation decisions in a beverage company with multi-criteria methods and an optimization model. Int. J. Prod. Econ. 2025, 288, 109701. [Google Scholar] [CrossRef] [Scilit]
- Zhou, Z.; Tan, Z.; Li, Z.; Ma, D.; Zhang, L. TBM cutter wear under high-strength surrounding rock conditions: A case study from the second phase of the northern Xinjiang water supply project. Rock Mech. Rock Eng. 2021, 54, 5023–5039. [Google Scholar] [CrossRef] [Scilit]
- Li, Z.; Zhou, Z.; Tan, Z.; Guo, Z.; Zhang, L. Development and experimental verification of a new model for predicting laser-induced rock cutting slit depth. Int. J. Rock Mech. Min. Sci. 2024, 177, 105722. [Google Scholar] [CrossRef] [Scilit]
- Frough, O.; Torabi, S.R.; Yagiz, S. Application of RMR for estimating rock-mass–related TBM utilization and performance parameters: A case study. Rock Mech. Rock Eng. 2014, 48, 1305–1312. [Google Scholar] [CrossRef] [Scilit]
- Rostami, J. Performance prediction of hard rock Tunnel Boring Machines (TBMs) in difficult ground. Tunn. Undergr. Space Technol. 2016, 57, 173–182. [Google Scholar] [CrossRef] [Scilit]
- Chung, H.; Park, J.; Kim, B.-K.; Kwon, K.; Lee, I.-M.; Choi, H. A causal network-based risk matrix model applicable to shield TBM tunneling projects. Sustainability 2021, 13, 4846. [Google Scholar] [CrossRef] [Scilit]
- Koohathongsumrit, N.; Chankham, W.; Meethom, W. Multimodal transport route selection: An integrated fuzzy hierarchy risk assessment and multiple criteria decision-making approach. Transp. Res. Interdiscip. Perspect. 2024, 28, 101252. [Google Scholar] [CrossRef] [Scilit]

Disclaimer/Publisher’s Note: The statements, opinions and data contained in all publications are solely those of the individual author(s) and contributor(s) and not of MDPI and/or the editor(s). MDPI and/or the editor(s) disclaim responsibility for any injury to people or property resulting from any ideas, methods, instructions or products referred to in the content. |
© 2026 by the authors. Licensee MDPI, Basel, Switzerland. This article is an open access article distributed under the terms and conditions of the Creative Commons Attribution (CC BY) license.