


Abstract
Recently, many countries have sought to obtain sustainable energy from different sources. This study’s primary objective is to determine ways to optimize the advantages of water structures, especially ski-jump spillways, within the hydropower sector. A ski-jump spillway is a type of energy dissipation structure that relies on projectile principles, causing scour holes in the downstream bed. To convert the flow energy into hydroelectric power, the wheel turbine is mounted in the spillway bucket. The turbine’s impact on total hydraulic energy reduction, power generation, and downstream scour was evaluated, alongside optimizing blade design (number and shape) for peak performance. To conduct this research, a numerical 3D model was created using FLOW-3D HYDRO. Adding turbines to the ski-jump spillway is a promising modification, increasing total hydraulic energy reduction by approximately 22.10% and decreasing the maximum scour depth under the investigated conditions. It was discovered that increasing the number of turbine blades from five to 10 results in a 2.77% increase in total hydraulic energy reduction under the investigated conditions. This study represents a starting point toward harvesting flow energy that would otherwise be dissipated, in contrast to most researchers in this field, who focus primarily on reducing hydraulic energy without recovering it.
1. Introduction
Energy is now the foundation of contemporary civilization, and global dependence on it has increased considerably. As energy demand continues to rise, two major global challenges emerge. First, increasing the reliance on fossil fuels for energy production in developed countries is a core driver of climate change and pollution. Second, a significant problem in developing nations is energy poverty, with an estimated 770 million people without access to electricity and over 2.5 billion without clean cooking fuels [1]. In recent decades (i.e., 2000), the world began to focus on sustainable development to minimize costs, taking into account the different environmental effects [2]. Moreover, to decrease emissions and diversify energy sources, the demand for utilizing renewable energy has emerged [3]. Renewable energy can be obtained from a variety of sources, including hydroelectric, solar, tidal, and wind. Hydropower is considered a main source of renewable energy, accounting for more than 70% of the total renewable energy [4]. Hydropower is distinguished from other renewable energy sources, such as wind and solar energy, by its continuous availability, unlike those sources, which depend on specific weather conditions and only generate energy at certain times.
Hydropower plants (HPPs) are mainly located along waterways and in structures such as dams, weirs, and regulators [5]. They can be categorized according to their installed capacity; however, the capacity thresholds used to distinguish large, medium, small, mini, micro, and pico hydropower plants vary among countries and organizations [6,7]. The main component of a hydropower plant is the water turbine. The water turbines can be classified according to different criteria, such as operating principles and flow direction [8]. Conventional hydraulic turbines are commonly classified as impulse or reaction turbines. Pelton turbines are representative of impulse turbines, whereas Francis and Kaplan turbines are representative of reaction turbines [9]. The Dethridge wheel is a water-wheel device and is considered separately from this conventional impulse/reaction classification [5,10]. According to the flow direction, conventional turbines can be classified into three categories: axial flow turbines (i.e., the flow crosses parallel to the turbine shaft), radial flow turbines (i.e., the flow crosses perpendicular to the turbine shaft), and mixed flow turbines (i.e., mixing between axial and radial characteristics) [11]. Turbines are typically more efficient and economical in large HPPs because these plants require specialized flow control methods. However, developing countries often lack financial resources to afford such complex, advanced machinery. So, developing traditional water wheels, which were previously used for irrigation and grain milling, is a very important issue [12].
A wide range of researchers have analyzed experimental works on the hydrodynamic performance of these wheels [13,14,15,16,17,18,19], whereas the literature analyzing their performance through numerical simulations is comparatively more limited. For example, Pujol et al. [20] proposed an inexpensive modification to a conventional water wheel for a remote Himalayan site using Computational Fluid Dynamics (CFD) STAR-CCM+. Likewise, Bachan et al. [21] used ANSYS 2022 to study the performance of an overshot water wheel under different operating conditions. Moreover, Quaranta and Revelli [22] developed a numerical model to refine the design of the wheel blades. According to this investigation, changing blade profiles improves turbine performance. Yah et al. [23] presented a numerical model demonstrating that the circular profile performs better than straight and elliptical shapes. However, straight blades are recommended for tidal energy harvesting [24]. The number of blades also influences the performance, so every operational condition should be studied to determine the optimal number of blades [24,25]. Spillways are mainly used to escape excess discharges from dams’ reservoirs and dissipate flow energy [26]. There are different types of spillways, such as ski-jump (flip bucket), side channel, chute, shaft, stepped, and siphon [27]. The suitable type can be determined based on parameters such as flow characteristics, water head, geology, dam body, and site configuration [28]. Ski-jump spillways are considered the most appropriate for high dams with high flood energy [29]. This type depends on the trajectory principles for energy dissipation, in which a jet can form and travel away from the dam foundation to avoid scour holes [30]. Using a ski-jump spillway has two impacts: the first is a positive effect on energy dissipation, and the second is a negative effect on scour downstream of water structures [31]. Several studies were carried out to assess scour holes downstream of the ski-jump spillway. These studies can be divided into different categories such as empirical equations, experimental, and numerical models.
Empirical equations are created based on laboratory and field data. These equations are considered a simple method for predicting approximate values of scour depth (ds) and length (Ls). The most effective parameters according to these equations are the differential head between upstream and downstream (H), the unit discharge (q), and the median sediment diameter (d50). Table 1 presents a summary of the most proper equations.
Table 1.
Summary of empirical equations for maximum scour hole.
Scour hole development immediately downstream of ski-jump spillways remains the subject of extensive experimental research due to its implications for structural integrity and sediment management. One recent experimental model-scale study by Chavhan and Hinge [36] investigated scour reduction using side deflectors in a 1:50-scale flume that simulated the Ukai Dam ski-jump bucket. The evidence shows that deflectors reduce scour depth by 16–28%, demonstrating the viability of passive hydraulic countermeasures. In a second set of laboratory tests, Sá Machado et al. [37] investigated the effects of bucket angle of exit, tailwater level, and flow rate on scour hole development. Moreover, with higher bucket angles, deeper but more limited scour holes were obtained, whose three-dimensional profiles were strongly influenced by the dynamics of jet impact and the energy dissipation rate. Different parameters of ski-jump spillways were examined by Rajaei et al. [38], including the bucket exit angle (15° and 30°), chute slope (1V:1H and 1V:2H), and surface conditions (smooth and stepped). According to the study results, using a stepped surface for the chute instead of a smooth surface reduces the maximum scour depth by 15–51%. Furthermore, changing the chute surface slope from 1:1 to 1:2 reduces the maximum scour depth by 16% and 25% for smooth and stepped spillway profiles, respectively. Also, careful experimental measurements were reported by Nou et al. [39], which served as input data for hybrid Adaptive Neuro-Fuzzy Inference System–Particle Swarm Optimization (ANFIS-PSO) algorithms. Although modeling was the main focus, straightforward physical flume testing yielded precise measurements of scour depth and geometry across various hydraulic regimes. Taken together, these controlled experiments highlight the significant role of hydraulic conditions, including tailwater depth, bucket geometry, and flow regimes, in governing the scour hole shape and final depth. The utility of the experimental study was also illustrated, not just for physical understanding development but also as a calibration and validation dataset for new computational and data-driven prediction models.
Recent investigations have continued to explore methods for improving the hydraulic performance of ski-jump spillways and mitigating downstream erosion. Wang-wu et al. [40] experimentally investigated erosion-prevention measures for the downstream slope in a steep and narrow valley under ski-jump energy dissipation conditions, highlighting the importance of considering downstream topography and erosion protection in the design of such systems. In addition, Cheng, Li, Feng, Zhu and Li [29] numerically compared the hydraulic characteristics of fully and partially flipped ski-jump buckets, examining the effects of bucket configuration on flow dispersion, energy dissipation, and total dissolved gas generation. More recently, Tessendorf and Bosman [41] investigated the influence of trajectory bucket geometry on downstream energy dissipation, further demonstrating the importance of bucket configuration in determining the hydraulic response of ski-jump spillways.
Increasingly, modern computer modeling is used to study scour holes downstream of ski-jump spillways. These techniques can replicate complicated hydraulic and sediment transport processes. Shiri [42] made a significant contribution by using a combined Smoothed Particle Hydrodynamics–Finite Element Method–Discrete Element Method (SPH–FEM–DEM) model to simulate erosion processes in a smaller-scale ski-jump spillway flume. It was concluded that the model was very good at showing how jet impacts and scour pools change shape. Castillo and Carrillo [43] presented FLOW-3D simulations of the Toachi Dam’s ski-jump bucket, evaluating four Reynolds-averaged Navier–Stokes (RANS) turbulence models. It was found that the Renormalization Group (RNG) k–ε formulation with a bed-load coefficient < 7 best matches laboratory scour data. To model multiphase flow along ski-jump jets, a mathematical simulation of air–water flow was carried out using FLOW-3D, employing the Volume of Fluid (VOF) and Fractional Area/Volume Obstacle Representation (FAVOR) methods [44]. The findings helped to explain how turbulence and air entrainment affect the start of scour. Another important numerical study by Kulhare et al. [45] used FLOW-3D simulations with RANS turbulence and sediment-bed-load coupling to assess the sensitivity of scour depth to turbulence closure schemes. Further, Asadi et al. [46] applied support vector regression to statistically investigate the function of horizontal splitters in scour pools, demonstrating their effectiveness in reducing erosion behind jet spillways. Collectively, these simulations validate the potential of CFD-based numerical modeling for predicting scour depth and morphology, particularly when enhanced by turbulence-resolving RANS schemes and multiphase models. Such approaches provide detailed information on velocity, shear stress, pressure fields, and entrainment dynamics, which can be elusive in experimental setups, enabling large parametric studies (e.g., jet angle, tailwater depth, sediment size changes) to optimize spillway design and scour protection measures.
Conventional approaches for ski-jump spillways primarily aim to dissipate excess flow energy and mitigate downstream scour, without utilizing the dissipated energy for a useful purpose. Integrating a wheel turbine into the spillway system provides an alternative approach in which part of the available flow energy can be converted into useful mechanical energy while simultaneously contributing to hydraulic energy reduction and influencing downstream scour. This approach therefore offers the potential to combine energy dissipation and energy recovery within the same hydraulic system.
Previous research by the authors [47] investigated the integration of wheel turbines with ski-jump spillways, focusing on the comparison between undershot and overshot configurations and the influence of wedge geometric characteristics. Building on those findings, the present study extends the investigation by focusing on the undershot turbine and examining the effects of inflow discharge, blade number, and blade shape on its mechanical performance and the associated hydraulic response of the spillway. In particular, the analysis considers turbine power output and mechanical efficiency alongside total hydraulic energy reduction and downstream scour characteristics. Thus, the contribution of the present study lies in extending the numerical investigation of the integrated turbine–spillway system to turbine blade design and varying inflow conditions, rather than introducing the integration concept itself. Although previous investigations have demonstrated the feasibility of integrating a wheel turbine with a ski-jump spillway, the effects of varying inflow discharge and turbine blade characteristics on the coupled hydraulic and mechanical response have received limited attention. In particular, the relationship between blade number and blade shape, turbine performance, hydraulic energy reduction, and downstream scour has not been systematically examined for the undershot configuration considered in the present study. The present investigation therefore seeks to bridge this gap by evaluating these parameters within a consistent three-dimensional numerical framework and by considering energy harvesting together with the hydraulic response and scour characteristics of the spillway. This provides further insight into the interaction between energy harvesting, hydraulic energy reduction, and downstream scour under the investigated conditions. The remainder of this paper is organized as follows. Section 2 describes the methodology adopted in the study, including the numerical model, model geometry, governing equations, boundary conditions, validation procedure, and investigated scenarios. Section 3 presents and discusses the numerical results, including the effects of inflow discharge, turbine blade number, and blade shape on turbine performance, hydraulic energy reduction, and downstream scour. The main findings of the study, together with the principal limitations and implications of the investigation, are summarized in Section 4.
2. Methodology
In this study, a three-dimensional numerical model was developed using FLOW-3D HYDRO Ver. 22.2.0.17. The research was divided into two main stages. The first stage focused on verifying the accuracy of the developed numerical model by comparing its results with previously conducted experimental data to ensure the reliability of the outcomes. The second stage involved simulating three different scenarios: (i) examining the influence of varying inflow discharges to the spillway, (ii) analyzing the impact of changing the number of turbine blades, and (iii) assessing the effect of modifying the turbine blade shape. The reference rotational speed adopted in these scenarios was selected based on the findings of the authors’ previous study [47]. Figure 1 presents a flowchart summarizing the methodology of the current study.
Figure 1.
Flow chart of current study.
2.1. Numerical Model
The CFD code FLOW-3D HYDRO was used to simulate various scenarios in this study.
2.1.1. Model Geometry
The 3D Computer-Aided Design (CAD) models of the spillway and water-wheel turbine were created in SolidWorks 2019, as shown in Figure 2. Two 3D models were created: one at a small scale (1:150) for validation and another at full scale for the case study. All dimensions of both models are presented in the following sections. Additionally, upon completion of the 3D models, they are converted to stereolithographic (STL) format for import into FLOW-3D software. The turbine utilized in the current study is a Dethridge water-wheel turbine, as shown in Figure 3. This type consists of a cylinder with eight blades made of mild steel of 14-gauge (1.90 mm) thickness attached externally and internally braced with steel spokes at the center and ends of the cylinder. The blades are distributed uniformly around the circumference of a cylindrical hub. They have a V-shape with an angle of 127° and chamfered corners with lengths of 4” horizontally and 3.5” vertically. The apex of the V-shape indicates the rotation direction. The axle of the turbine is made from a galvanized pipe. Furthermore, to capture the details of a water-wheel turbine with a suitable mesh size, the thickness was increased to 30 mm without affecting the simulation results.
According to Cone [48], Dethridge water-wheel turbines are available in three standard sizes: 4, 5, and 6 feet, as presented in Table 2. The largest standard size (6 feet) was selected for the present study, and its corresponding dimensions were adopted as the reference turbine geometry. This selection follows the configuration considered in the authors’ previous study [47], which investigated the integration of a Dethridge water-wheel turbine with a prototype-scale ski-jump spillway. To achieve geometric compatibility with the prototype-scale spillway, the turbine geometry was enlarged by a factor of eight (8:1).
The eight-blade V-shaped configuration was adopted as the reference turbine geometry. To investigate the influence of blade arrangement on turbine performance and the downstream hydraulic response, additional configurations with 5, 6, and 10 blades were examined. Similarly, rectangular, triangular, and curved-blade profiles were considered in separate parametric scenarios. These variations were introduced to assess the effects of blade number and shape on the mechanical and hydraulic performance of the integrated system.
Figure 2.
CAD model of Maithon Dam spillway and water-wheel turbine adapted from [47].
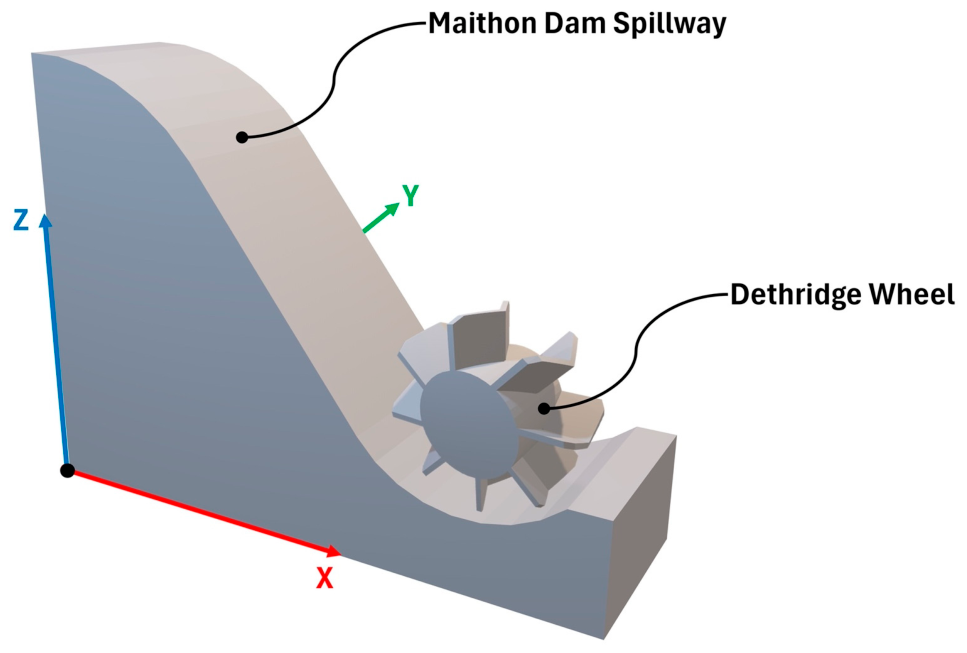
Figure 3.
Dethridge wheel turbine [49].
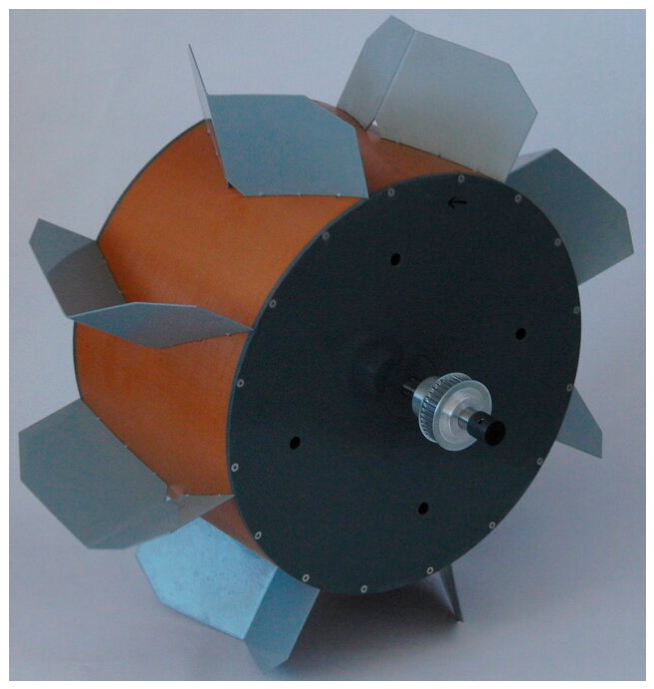
Table 2.
Dimensions of standard Dethridge wheel sizes [48].
2.1.2. Governing Equations
In this study, the fluid (i.e., water) is treated as incompressible and non-heat-conducting. So, the flow is described solely by the mass conservation (continuity) and momentum (Reynolds-averaged Navier–Stokes) equations. Although the flow is incompressible, a time-dependent term appears on the right side of the continuity equation due to the presence of a moving object, as shown in Equations (1) and (2) [50].
The continuity equation:
The momentum equation:
where is the time-averaged velocity, is the fractional volume open to flow, is the kinematic viscosity, is the averaged pressure and are the components of Reynold’s stress.
Physically, the continuity equation ensures mass conservation throughout the computational domain, meaning that any local change in the flow field must be consistent with the movement of water and the presence of the moving turbine. The momentum equation describes the balance of forces governing the flow motion, including pressure forces, viscous effects, and turbulent stresses. In the present system, these terms are particularly important because the turbine blades interact with the incoming flow, modifying its velocity distribution and generating forces that produce torque on the rotating wheel. Consequently, the governing equations provide the basis for predicting the coupled hydraulic and mechanical behavior of the integrated system.
The free-surface tracking simulation uses the VOF method. This method was introduced by Hirt and Nichols [51]. The VOF algorithm uses a function (F) to represent the fraction of each grid cell occupied by fluid. Values of (F) range from zero to one, where zero indicates that the grid cell is empty, and one means the cell is filled with fluid. The free surface is created in grid cells with (F) values ranging from zero to one according to Equation (3).
where (u, v, w) are the velocity components in (x, y, z) coordinates, respectively, and (Ax, Ay, Az) are the area fractions.
2.1.3. Simulation Domain and Meshing
The simulation domain is determined by the control volume that contains the phenomena. The domain extends from the upstream (U.S.) ski-jump spillway to the downstream (D.S.) region to calculate hydraulic energy reduction after using a water-wheel turbine. Figure 4 shows the simulation domain and the U.S. and D.S. sections. Moreover, the available power for the water-wheel turbine is the head difference between the U.S. and D.S. sections. Equations (4) and (5) are used to calculate the available power for the turbine.
Figure 4.
Schematic of the simulation process adapted from [47], with a view of the moving turbine blade control volume.
The hydraulic energy reduction represents the total reduction in specific energy between the upstream and downstream sections. When the turbine is installed, this reduction consists of two components: the useful energy harvested by the turbine and the hydraulic energy dissipated within the system. These components are therefore calculated separately to distinguish the useful energy extracted by the turbine from the energy dissipated hydraulically. The equivalent energy head harvested by the turbine is calculated as follows:
where is the mechanical power output of the turbine, is the turbine torque, and is its angular velocity.
where and represent the equivalent energy heads associated with the harvested and dissipated energy, respectively. (ER), (EH), and (ED) denote the percentages of hydraulic energy reduction, energy harvested, and hydraulic energy dissipated, respectively. The energy accounting approach adopted in this study follows the formulation presented in the authors’ previous study [47], with the corresponding energy indicators applied to the investigated configurations.
From a physical perspective, the specific energy at each section consists of the flow depth and velocity head. Therefore, the difference between the upstream and downstream specific energy represents the total hydraulic energy reduction across the investigated system. When the turbine interacts with the flow, part of the available hydraulic energy is transferred to the rotating wheel as mechanical power through the hydrodynamic forces acting on its blades. The remaining energy reduction is associated with hydraulic dissipation resulting from turbulence, flow separation, mixing, and other irreversible flow processes. This distinction is essential because energy extracted by the turbine represents useful harvested energy rather than hydraulic energy dissipation.
Furthermore, in this investigation, four mesh blocks of varying sizes were used to reduce simulation time while accurately reflecting the model’s precise characteristics. The first mesh block contains the upstream region with a grid size of 0.8 m. The second block model of the ski-jump spillway has a grid size of 0.4 m, and the third block describes the downstream region with a grid size of 0.8 m. Finally, the fourth block contains the water-wheel turbine with a finer size of 0.2 m, as shown in Figure 5. The first, second, and third mesh blocks are related to each other by an adjacent form, with the ratio between the different sizes of mesh blocks set to 2:1. The fourth block was nested within the second block.
Figure 5.
Mesh blocks arrangements adapted from [47].
2.1.4. Boundary and Initial Conditions
Boundary conditions play a crucial role in the numerical setup, significantly impacting the accuracy of the results. Therefore, care should be taken when determining those boundaries. The inlet was defined as the volume flow rate with the assigned inflow discharge value at Xmin for the first mesh block in the X-direction. At the same time, the outlet was prescribed as an outflow with the assigned fixed tailwater depth at Xmax for the third mesh block in the X-direction. The wall boundary condition (This condition is normally used to model the fluid bounded by the solid regions. For the case of the viscous flows, the no-slip boundary condition implies that the velocity component tangent to the surface equals the velocity of the wall, and the normal velocity component is zero.) was used to simulate the bottom and sides of the simulation domain. At the interfaces between mesh blocks, the faces were defined as symmetry boundaries (The symmetry boundary condition is usually used for reducing the computational work involved during CFD simulation. This boundary condition enables the fluid to be transferred from one mesh block to another. No inputs are required for this boundary condition except for an accurate definition of its location.). Finally, the specified pressure was used to set the top of the domain to atmospheric pressure. The various boundary conditions for each mesh block in the simulation domain are shown in Figure 6. Certain initial conditions had to be specified for the numerical domain, including the fluid (i.e., water) pressure distribution, temperature, and initial velocity. Furthermore, the pressure is prescribed as a hydrostatic distribution. In contrast, the water temperature is normal (25 °C) with an initial velocity of 0.
Figure 6.
Boundary conditions of model adapted from [47].
2.1.5. Numerical Solution Technique
The finite volume method (FVM) is the main technique used by FLOW-3D to solve the governing equation (Reynolds-averaged Navier–Stokes). The finite volume method is considered an Eulerian technique to deal with partial differential equations in an algebraic system [52]. Furthermore, the finite volume method is primarily used to approximate the small volume surrounding each mesh node. FVM applied the divergence theorem to transform volume integrals to surface integrals, allowing these terms to be calculated as fluxes across the surfaces of each finite volume.
2.1.6. Turbulent Models
Several turbulence models are available in FLOW-3D HYDRO, including the standard K-ω model, shear stress transport (SST) k-ω model, standard K-ε model, realizable k-ε, large eddy simulation (LES), and RNG K-ε model. The selection of an appropriate turbulence closure depends on the characteristics of the flow and the physical phenomena being investigated. In the present study, the RNG k-ε model was adopted because the flow downstream of a ski-jump spillway is characterized by high velocities, strong turbulence, and complex flow structures. Furthermore, its suitability for modeling ski-jump spillway flows and predicting downstream scour is supported by the comparative investigation of Castillo and Carrillo [43], who evaluated four RANS turbulence models against experimental data and reported good agreement when using the RNG k-ε model with an appropriate bed-load coefficient. Although the realizable k-ε model has also demonstrated good performance in hydro-turbine applications, the RNG k-ε model was considered suitable for the present study in view of its reported performance in simulating complex turbulent flows, including those encountered in ski-jump spillways. It should be noted that no direct comparison between the RNG k-ε and realizable k-ε models was conducted in the present study.
The RNG K-ε model is divided into two primary equations: one for turbulent kinetic energy () and the second for turbulent dissipation rate (), as presented in Equations (11) and (12).
where is the turbulent kinetic energy, is the turbulent kinetic energy production, is the buoyancy turbulence energy, is the turbulent dissipation rate, and represent the diffusion terms, and , and are dimensionless coefficients; and have a constant value of 1.42 and 0.2, respectively, while the turbulent kinetic energy () and its production () are used to compute the value of .
The turbulent kinetic energy equation describes the evolution of turbulence within the flow. Turbulence is generated mainly by velocity gradients and flow disturbances, while diffusion redistributes turbulent energy throughout the computational domain and the dissipation term represents its conversion into internal energy at smaller scales. The turbulent dissipation rate equation describes the rate at which this turbulent kinetic energy is dissipated. These quantities are relevant to the present investigation because the interaction between the high-velocity flow, the turbine blades, and the spillway geometry produces strong velocity gradients and complex turbulent structures that influence both energy transfer and hydraulic energy dissipation.
2.1.7. Moving Object Model
A general moving object (GMO) is a rigid body that exhibits two types of motion. The first type is called dynamically coupled motion, and the second is called user-prescribed motion. Moreover, the GMO can simulate any object with six degrees of freedom, including those with constraints such as a fixed axis/point. In the coupled motion type, the GMO computes all the forces acting on the object, while in the case of a prescribed motion type, forces or torques can be applied to a GMO.
2.1.8. Sediment Scour Model
FLOW-3D’s sediment scour model includes different non-cohesive sediment types [50]. Each sediment type is defined by its properties, including but not limited to grain size, density, critical shear stress, angle of repose, and bed-load transport rate. The model accounts for the complete cycle of sediment transport: entrainment, bed-load transport, suspended transport, and deposition.
Erosion starts when the shear stress from flowing water exceeds the sediment’s critical shear stress, detaching grains from the bed and elevating them into suspension—a process modeled as entrainment transport. Once entrained, grains carried by the flow are treated as suspended load transport. Gravity, buoyancy, and friction cause some of these suspended particles to settle, which is a process known as deposition. Finally, the sliding or rolling motion of grains along the bed is simulated as bed-load transport.
For the entrainment process, the shear stress exerted by the fluid on the bed surface is computed using a standard wall function given by Equation (13).
where is the Nikuradse roughness and is a user-defined coefficient. The critical bed shear stress is determined using a dimensionless parameter known as the critical Shields number, as outlined in Equation (14).
where is the critical Shields number, is the critical bed shear stress, is the absolute value of gravity acceleration, is the diameter of the sediment grain, is the density of the sediment species (i) and is the density of the fluid. The Soulsby–Whitehouse equation is utilized to determine the critical Shields number value [53]. Thus, the critical Shields number was calculated from the sediment and fluid properties using the Soulsby–Whitehouse relationship rather than prescribed as a fixed model coefficient.
where is the dimensionless diameter of the sediment, shown by Equation (16).
where is the fluid dynamic viscosity. In the bed-load transport process, grains move by rolling, hopping, and sliding along a packed bed surface. This is expressed as a volumetric transport rate per unit width of the bed, () and is given by Equation (17).
where is the dimensionless bed-load transport rate, calculated by using the Meyer-Peter and Müller equation [54].
where is the Meyer-Peter and Müller user-defined coefficient and is the volume fraction of species i in the bed material. The suspended load transport is calculated as shown in Equation (19).
where is the suspended sediment mass concentration, is the diffusivity, and is the grain velocity of species i. Entrainment and deposition are two opposing processes that take place at the same time. The lifting and settling velocities for both entrainment and deposition processes are calculated according to Equation (20) and Equation (21), respectively.
where is the entrainment coefficient of species i and is the kinematic viscosity of the fluid. The sediment properties and model parameters adopted in the FLOW-3D HYDRO sediment scour model are summarized in Table 3. These parameters were used to define the sediment characteristics and simulate the sediment transport and scour processes in the numerical model.
Table 3.
Sediment properties and parameters used in the numerical model.
It should be noted that the sediment scour model adopted in the present study is formulated for non-cohesive sediment. Accordingly, the predicted scour results are used primarily to assess relative differences among the investigated configurations. Further experimental validation and site-specific sediment characterization are required to assess the accuracy of the predicted scour depths.
From a physical standpoint, scour develops when the shear stress exerted by the flowing water on the sediment bed exceeds the critical shear stress required to initiate particle motion. Once this threshold is exceeded, sediment particles are entrained and transported either along the bed or in suspension, depending on the local flow conditions. Sediment may subsequently settle when the local flow capacity to transport particles decreases. Accordingly, the predicted scour pattern is governed by the interaction between flow velocity, bed shear stress, sediment properties, and sediment transport processes. In the present system, the turbine modifies the downstream flow field and its associated hydraulic loading on the sediment bed, which can consequently influence the development of the scour hole.
2.1.9. Time Control
The maximum time-step size depends on the Courant number, which governs the flow’s distance traveled during the simulation time step. In this investigation, a Courant number of 0.25 was set to ensure that the flow does not traverse more than one cell per time step [55]. To further assess the influence of temporal discretization on the numerical results, an additional time-step sensitivity analysis was performed using three Courant numbers: 0.25, 0.125, and 0.0625, representing coarse, medium, and fine temporal resolutions, respectively. The analysis was conducted for an inflow discharge of 1132.5 m3/s, using eight triangular turbine blades, while keeping the other simulation settings unchanged. The resulting torque, output power, mechanical efficiency, upstream and downstream total heads, and maximum scour depth were compared to evaluate the sensitivity of the numerical predictions to time-step refinement.
2.2. Grid Convergence and Numerical Uncertainty Analysis
Numerical uncertainty is an important aspect of CFD simulations. It may arise from several sources, including spatial discretization, round-off, and iterative convergence errors [56]. Although these sources of uncertainty cannot be completely eliminated, their influence can be assessed and reduced through appropriate numerical procedures [57,58]. So, the Grid-Convergence Index (GCI) method was employed to evaluate the sensitivity of the numerical solution to grid refinement. This method is based on Richardson extrapolation [59] and has been widely applied in previous numerical investigations [14,60]. Prior to the GCI evaluation, the time-history curves of the key variables were examined to ensure that the simulation had reached a sufficiently stable state. The numerical simulations were conducted for a total duration of 35.0 s. The final 10.0 s were considered for calculating the average values of the variables, after the initial fluctuations had sufficiently diminished. For the grid-convergence assessment, three grid resolutions were considered: coarse (X3), medium (X2), and fine (X1). A constant refinement ratio was maintained between the successive grids. The corresponding grid dimensions and computational requirements are summarized in Table 4. The grid configurations and the corresponding computational data presented in Table 4 were previously reported in the authors’ published study [47] and are reproduced here for consistency in documenting the numerical uncertainty assessment.
Table 4.
Details of grid system and time consumed.
Equations (22) and (23) show the percentage of GCI indicator for the key variable (f) between fine and medium and medium and coarse grids, respectively [59].
In the previous equations, the power of the constant refinement ratio (r) is computed by the following equation [59].
To estimate the approximate solution for minimum grid size (t), which is near zero, Equation (25) can be used [59].
where f represents the different values of key variables and the subscripts 1, 2, and 3 relate to grid sizes (fine, medium, and coarse), respectively. Fs is a safety factor for estimating uncertainty in numerical solutions by increasing the confidence level to 95% [61]. This factor had two values: 3 for comparison between two grid sizes and 1.25 for three or more grid sizes [59,62]. Furthermore, two other indicators were computed to assess solution convergence. The first indicator is (α) as expressed in Equation (26). When its value is near unity, the simulation results converge. The convergence ratio (R) is the second indicator, as represented in Equation (27), which has three possible ranges. When its value is between zero and a unit, this indicates monotonic convergence; below zero, oscillatory convergence; and above a unit, divergence [59].
The numerical results presented in Table 5 are based on the same grid-convergence dataset previously reported by the authors [47]. They are included here to document the numerical uncertainty assessment relevant to the present investigation. The calculated GCI values and the associated convergence indicators for the three grid resolutions are presented in Table 5. According to the adopted sign convention, negative angular-velocity values indicate counterclockwise rotation of the turbine. The temporal variations in the investigated variables are shown in Figure 7. The values of the parameter (α), which are close to unity for the investigated variables, indicate that the numerical solutions are within the asymptotic range. Furthermore, the relationship GCI12 < GCI23 suggests that the estimated discretization uncertainty decreases as the grid is refined. Based on these results, the coarse grid was selected for the subsequent simulations because it provided an acceptable level of grid convergence with substantially lower computational requirements than the finer grids.
Table 5.
Summary of the uncertainty analysis test.
Figure 7.
Time histories of the investigated key variables (a) angular velocity, (b) torque, (c) U.S. specific energy head, (d) D.S. specific energy head, (e) U.S. flow depth, (f) D.S. flow depth, (g) U.S. velocity, (h) D.S. velocity, and (i) discharge. The underlying numerical data were previously reported by the authors [47].
The GCI analysis provides an estimate of the numerical uncertainty associated with grid discretization and should not be interpreted as a measure of the overall accuracy of the CFD model. In particular, it does not replace experimental validation or account for uncertainties associated with the physical modeling assumptions and scale effects. Therefore, although the results indicate relatively low grid-related uncertainty for some of the investigated variables, the small differences between the simulated configurations should be interpreted cautiously. Such differences are considered numerical trends within the scope of the present grid-convergence assessment rather than independently validated absolute effects.
Time-Step Sensitivity Analysis
As shown in Table 6, the numerical results exhibited limited sensitivity to time-step refinement. The relative differences between the coarse (CFL = 0.25) and fine (CFL = 0.0625) temporal resolutions were less than 0.71% for torque, output power, and mechanical efficiency. Similarly, the upstream and downstream total heads showed differences of 0.05% and 0.62%, respectively, while the maximum scour depth differed by approximately 1.26%. These relatively small variations indicate that further time-step refinement had a limited influence on the predicted parameters for the investigated operating condition. Accordingly, a CFL number of 0.25 was considered adequate for the main simulations, providing a balance between numerical accuracy and computational cost. Nevertheless, this assessment was conducted for one representative operating condition and does not establish identical temporal sensitivity for all investigated configurations.
Table 6.
Sensitivity of the numerical results to time-step refinement.
2.3. Validation Stage
The hydraulic behavior of the numerical setup was assessed against the experimental results reported by Bhuinyan et al. [63] for the Maithon Dam ski-jump spillway. The experimental model was installed in a hydraulic flume with a width and height of 30 cm and a length of 6 m. Based on Froude similarity, a scale ratio of 1:150 was adopted for the numerical validation model. Test No. 2, corresponding to an inflow discharge of 0.004 m3/s, was selected for comparison with the experimental results. The validation comparison considered velocity, flow depth, energy head, Froude number, and trajectory height. The velocity, flow-depth, and energy-head comparisons were previously reported by the authors [47]. In the present study, these variables are retained as part of the hydraulic validation, while Froude number and trajectory height are additionally included to provide a more comprehensive assessment of the numerical model. The complete comparison is presented in Table 7.
Table 7.
Comparison of numerical and experimental results for the hydraulic model validation.
The comparison yielded average errors of 8.91%, 7.58%, and 5.43% for velocity, flow depth, and energy head, respectively, while the additional comparisons of trajectory height and Froude number resulted in errors of 2.67% and 12.61%, respectively. The corresponding root mean square error (RMSE) values are also reported in Table 7. These results indicate that the numerical setup reproduces the principal hydraulic characteristics of the ski-jump spillway under the investigated validation condition. The time histories of the investigated hydraulic variables were examined to identify the stabilization of the numerical solution. The variables exhibited transient fluctuations during the initial stage of the simulation and subsequently approached relatively stable values after approximately 5 s, as shown in Figure 8. The values reported in Table 7 were obtained after this stabilization period.
Figure 8.
Time histories of the hydraulic variables used in the numerical validation: (a) velocity, (b) flow depth, (c) energy head, and (d) Froude number, together with (e) the water-surface profile.
The second part of the validation focused on the numerical representation of the water-wheel turbine. For this purpose, the experimental results reported by Paudel and Saenger [64] were used for comparison. The available experimental data allow the runaway speed of the turbine to be examined. The angular-velocity data used in this comparison were previously reported by the authors [47]. The numerical runaway speed was 1.751 rad/s, compared with 1.529 rad/s obtained experimentally, resulting in an average error of 14.52%. The 14.52% difference is not considered negligible and should be taken into account when interpreting the numerical predictions. Rather than being assessed against a universally established acceptance threshold, this discrepancy is reported transparently and considered alongside the agreement in the temporal evolution of the angular velocity, while recognizing the limitations of the available validation data. As illustrated in Figure 9, the numerical and experimental results exhibit a similar temporal evolution, including the increase in angular velocity and the subsequent stabilization. The larger difference observed between approximately 2.50 and 10.0 s occurs during the transient adjustment toward the stabilized angular velocity. This difference may reflect the different transient responses of the numerical and experimental systems, with physical effects such as mechanical resistance and measurement uncertainty potentially contributing to the observed deviation. Nevertheless, the available experimental data do not provide complete torque–speed or power–speed relationships for direct comparison. Therefore, the present validation supports the numerical prediction of the turbine’s angular-velocity behavior under the investigated condition, but does not provide direct experimental validation of the predicted torque, power output, or mechanical efficiency.
Figure 9.
Comparison of the simulated and experimental angular-velocity histories of the water-wheel turbine.
A first-order sensitivity assessment of the potential effect of the 14.52% angular-velocity error on turbine power and mechanical efficiency was presented in the authors’ previous study [47]. Following the same approach, this error corresponds to an approximate sensitivity of ±9.82 MW for the reported power output of 67.60 MW and approximately ±4.79 percentage points for the corresponding mechanical efficiency of 33%. These values represent sensitivity estimates rather than direct uncertainty bounds. Accordingly, the reported power and efficiency values should be interpreted as numerical estimates within the limitations of the available component-level validation.
It should be noted that the integrated turbine–spillway system was not experimentally validated as a complete system because experimental data for the combined configuration investigated in the present study are not available. Accordingly, the validation was performed separately for the spillway and turbine components. The hydraulic validation was conducted using the available experimental data for the ski-jump spillway, whereas the turbine validation was based on the available angular-velocity measurements. Thus, the present validation provides component-level verification of the numerical setup rather than complete experimental validation of the integrated prototype-scale system.
Regarding scale effects, the 1:150 experimental model was used exclusively to validate the hydraulic behavior of the ski-jump spillway, whereas the main numerical investigation was conducted using the prototype-scale spillway geometry (1:1), with the turbine geometrically enlarged at a scale of 8:1 for integration. However, this geometric arrangement does not guarantee complete dynamic similarity, particularly regarding Reynolds number and tip-speed ratio. Furthermore, sediment transport and scour processes are subject to scale-dependent effects that cannot be fully represented by Froude similarity alone. These limitations, which are discussed in detail in the authors’ previous study [47], should be considered when interpreting the predicted turbine performance and scour results. Accordingly, the scour results are primarily used to identify relative trends among the investigated configurations rather than to provide definitive prototype-scale predictions. The scale difference may also affect surface-tension and air-entrainment effects, which cannot be fully reproduced when comparing the 1:150 validation model with the prototype-scale simulations. These effects may influence the free-surface flow and air–water interaction in the highly aerated ski-jump flow. Therefore, the full-scale hydraulic and turbine results should be interpreted as numerical estimates under the adopted modeling assumptions rather than as experimentally validated prototype-scale predictions.
2.4. Case Study Definition: Maithon Dam Spillway
2.4.1. Location Description
At a distance of 48 km from Dhanbad, Maithon Dam is constructed (23°51′1″ N, 86°46′40″ E) on the Barakar River near Maithon city, in Jharkhand state, India. This dam has a very large reservoir covering 65 km2 and an underground power station that generates about 60,000 kW of electricity. This station attracts many tourists because it is the first underground station in Southeast Asia [65]. Figure 10 shows the location of Maithon Dam.
Figure 10.
Location of Maithon Dam.
2.4.2. Geometric and Flow Characteristics
The Maithon Dam is categorized as a hybrid dam (i.e., a mix of concrete and earthfill). This dam has a total height of 56.08 m and a total length of 4426.76 m, divided into 4064.35 m of earthen material and 362.41 m of concrete overflow. The dam reservoir storage capacity is 1093.54 Mm3. The spillway consists of 12 bays with radial gates 12.50 m high and 12.19 m wide. This spillway was designed to handle a 13,592 m3/s flood flow [66]. Figure 11 shows the Maithon Dam spillway geometry and dimensions. Moreover, Table 8 provides additional details on the Maithon Dam.
Figure 11.
(a) Actual view of the Maithon Dam spillway (image source: Jaiprakashsingh, Wikimedia Commons, CC BY-SA 3.0); (b) dimensions of spillway [47,63].
Table 8.
Different details of Maithon Dam [67].
3. Results and Discussion
3.1. Selection of the Reference Operating Speed
The effect of turbine rotational speed on the mechanical and hydraulic performance of the undershot configuration was investigated in the authors’ previous study [47]. That investigation identified an operating speed of 1.75 rad/s (approximately 63.6% of the runaway speed) as the condition corresponding to the maximum mechanical power output among the examined operating speeds. Since the rotational-speed characteristics of the undershot system have already been reported in that study, the identified operating speed was adopted as the reference condition for the subsequent parametric investigations, allowing the effects of inflow discharge, blade number, and blade shape to be examined under a consistent operating condition.
3.2. Effect of Inflow Discharge
In this case, the effect of variation in inflow discharge values has been investigated using different inflow ratios (40%, 60%, 80%, and 100%) relative to the maximum flow condition. These inflow discharge ratios were used twice in the current study. Firstly, without using turbines to capture the behavior of the ski-jump spillway in terms of total hydraulic energy reduction. Secondly, the turbine is used to assess its importance as a modification technique for the ski-jump spillway. According to this scenario, decreasing the inflow discharge by 20% with a constant angular velocity (i.e., 1.75 rad/s ≈, 16.71 rpm) results in an average decrease of about 54% in torque and power. The turbine efficiency also decreases by 36% on average when the inflow discharge is reduced by the same percentage, as shown in Figure 12. Accordingly, the best mechanical performance of the turbines can be achieved under the maximum flow conditions. This behavior can be explained by the reduction in the momentum flux of the incoming flow as the discharge decreases, which weakens the hydrodynamic forces acting on the turbine blades. Consequently, the torque generated by the turbine decreases, leading to lower mechanical power output at the fixed rotational speed considered in this scenario.
Figure 12.
Characteristic curves for various inflow discharge.
For the four investigated inflow discharge conditions, the energy recovery ratio (EH) ranged from 4.93% to 19.86%, with an average value of 11.23%. This indicates that approximately 11.23% of the upstream specific energy was converted into mechanical energy by the turbine on average under the investigated discharge conditions. On the other hand, the hydraulic characteristics of ski-jump spillway flow have been studied in both cases. The produced relations in the two cases appear to show the same trend across variables, with some shifts in values from one case to another. The relationships between inflow discharge and the percentage of total hydraulic energy reduction in both cases are shown in Figure 13. There is a slight variation in the total hydraulic energy reduction percentage with changes in inflow discharge. Moreover, this can be attributed to the relative changes in energy values with each inflow discharge. In this scenario, high upstream and downstream energy values are accompanied by high inflow discharge values. Consequently, the difference between them becomes very slight, tending towards an almost constant value. Furthermore, using turbines as a modification technique appears to be a promising development for ski-jump spillways, as total hydraulic energy reduction increased by an average of 22.10% compared to the no-turbine scenario.
Figure 13.
Total hydraulic energy reduction due to inflow discharge variation.
The effect of inflow discharge variation on both the maximum scour depth and its location was also studied in the two cases. In the case of using turbines, it was observed that a 20% reduction in discharge decreases the maximum scour depth by 21.46% on average, while the location of maximum scour depth shifts closer to the structure’s apron by about 14.28%. Moreover, for the ski-jump spillway only, the average maximum scour depth decreases by about 21.06%, and its site decreases by an average of 13.73% at the same input discharge reduction ratio, as shown in Figure 14 and Figure 15. Furthermore, using turbines can reduce the maximum scour depth by an average of 25.20% compared to no turbines. However, the location of maximum scour depth becomes closer to the structure’s apron by 13.30% using turbines than without them. This reduction in the stand-off distance between the maximum scour region and the protected apron zone may increase the potential for local erosion to approach the structural protection system and, if not adequately controlled, may increase the risk of undermining or excessive loading near the apron and downstream foundation zone. Therefore, the shift in scour location should be considered an important structural-safety constraint rather than a minor geometric adjustment. Any practical application would require a site-specific assessment of the required scour protection extent, apron length and thickness, foundation conditions, and downstream bed protection based on the design flood conditions. The use of additional apron protection or riprap should therefore be regarded as part of a dedicated hydraulic and structural protection design rather than as a simple mitigation measure.
Figure 14.
Maximum scour depth due to the inflow discharge changing.
Figure 15.
Maximum scour location due to the inflow discharge changing.
3.3. Effect of Turbine Blade Number
In this scenario, the effects of varying the number of turbine blades on the maximum scour depth and its location, as well as on turbine power output, were examined. This research was conducted under the same operating conditions for flow rate and turbine rotational speed (i.e., and ). Moreover, four turbines with different blade counts (5, 6, 8, and 10) were used to determine the optimal blade count to enhance turbine operational efficiency, as shown in Figure 16. The results of this scenario show that as the number of turbine blades increases, both torque and generated power increase up to a point beyond which both values decrease with further increases in blade number. Analysis showed that the turbine with eight blades achieves the highest operational efficiency and consequently produces the maximum power output, as illustrated in Figure 17. The improvement in turbine performance with increasing blade number up to eight can be associated with the increased blade–flow interaction, which provides greater opportunities for transferring hydraulic energy to the rotating wheel. However, adding more blades does not necessarily result in a continuous increase in mechanical output, as the additional blades may increase flow obstruction and interference between adjacent blades. Therefore, the eight-blade configuration appears to provide a balance between effective energy extraction and flow obstruction under the investigated conditions. This finding is in agreement with previous studies [24,25], which demonstrated that the number of blades is an important design parameter influencing water-wheel performance. However, the optimal blade number depends on the turbine configuration and operating conditions, supporting the need to investigate this parameter for the specific integrated turbine–spillway system considered in the present study.
Figure 16.
Different arrangements of turbine blades: (a) 5 blades, (b) 6 blades, (c) 8 blades and (d) 10 blades.
Figure 17.
Characteristic curves for number of blades (N).
This scenario also shows that any increase in the number of turbine blades is accompanied by an average increase in total hydraulic energy reduction of 2.77%. This may be attributed to the fact that adding more blades can cause significant flow disturbances, which contribute to greater energy loss. Figure 18 shows the linear relationship between the number of blades and the percentage of total hydraulic energy reduction, with a coefficient of determination close to unity. Moreover, it is observed that with the increase in the number of blades, the maximum scour depth downstream of the ski-jump spillway decreases by 12% on average, as shown in Figure 19. This reduction may be associated with the higher total hydraulic energy reduction. However, when the maximum scour is examined, it is seen to shift by an average of 10% closer to the spillway’s apron, as illustrated in Figure 19. This could be because, as total hydraulic energy reduction increases, the flow loses more specific energy, making it less able to extend downstream. This shift, together with the reduction in maximum scour depth, may be associated with a decrease in the residual flow momentum and the resulting bed shear stress downstream. Consequently, the flow may have a reduced capacity to entrain and transport sediment particles, thereby limiting scour development farther downstream.
Figure 18.
Total hydraulic energy reduction due to the number of blades changing.
Figure 19.
Maximum scour depth and location versus the number of blades.
3.4. Effect of Turbine Blade Shape
In this scenario, the effects of changing turbine blade shape on the maximum scour depth and its location, as well as on turbine power output, were studied. To achieve this scenario, different shapes (i.e., rectangular, triangular, and curved) were used under the same simulation conditions to reach a fair conclusion, as shown in Figure 20. According to this study’s results, significant changes were observed in torque, turbine output power, and mechanical efficiency. When the turbine blade shape was changed from the rectangular design to the triangular shape, the torque and output power increased by 32.7%, while the mechanical efficiency increased by 27.8%. Moreover, when the blade shape was changed from triangular to curved, an additional 25.50% increase in torque and output power was observed, with efficiency increasing by 17%, as shown in Figure 21. Among the investigated blade shapes, the curved-blade configuration showed the highest mechanical performance in terms of torque, output power, and efficiency under the examined operating conditions, achieving a maximum output power of 67.6 MW and a mechanical efficiency of 33%. Power-chain consistency was further checked for the curved-blade configuration. Power-chain consistency was further checked for the curved-blade configuration. The numerical model represents one spillway bay; therefore, the maximum simulated discharge of 1132.5 m3/s corresponds to one-twelfth of the total spillway design discharge of 13,592 m3/s. The standard 6-ft Dethridge wheel was enlarged by a factor of eight for prototype-scale integration, resulting in a turbine width of 8.0 m and an overall wheel diameter of approximately 14.4 m. The discharge interacting with the turbine was obtained directly from the numerical flow field and was approximately 600 m3/s under the investigated maximum flow condition. Using the simulated upstream and downstream energy heads ( and ), Equation (5) gives an available hydraulic power of approximately 204.7 MW. The mechanical power calculated independently from the simulated torque and angular velocity, , is approximately 67.6 MW ( and ), corresponding to a mechanical efficiency of approximately 33.0%, consistent with the reported value. The difference between the percentage increases in power output and mechanical efficiency is attributed to the variation in hydraulic input power among the investigated configurations. This may be attributed to the ability of the curved blade to reduce flow disturbances and promote a more streamlined flow, unlike rectangular and triangular shapes, which cause an increase in flow disturbances, as shown in Figure 22. These velocity contours provide a qualitative visualization of the flow field around the turbine and illustrate how blade geometry influences the local velocity distribution and downstream flow pattern. The smoother flow pattern observed with the curved blades suggests a more favorable distribution of the flow momentum around the turbine, which may contribute to the higher torque and mechanical power obtained with this configuration. Additionally, it distributes pressure more gradually than triangular or straight blades, resulting in higher torque and consequently higher output power and improved efficiency. The improved mechanical performance obtained with the curved blade is in qualitative agreement with previous numerical investigations showing that blade profile can significantly influence water-wheel performance. For example, Quaranta and Revelli [22] demonstrated the importance of blade-profile optimization, while Yah et al. [23] reported better performance for a circular blade profile than for straight and elliptical profiles. Although these studies considered different water-wheel configurations, their findings support the general observation that blade geometry plays an important role in determining turbine performance.
Figure 20.
Different turbine blade shapes: (a) rectangular, (b) triangular and (c) curved.
Figure 21.
Characteristic curves for different shapes of blades.
Figure 22.
Velocity contours for different turbine blade shapes: (a) rectangular, (b) triangular, and (c) curved.
In addition, this investigation examined the effect of using turbines with different blade shapes to determine the optimal design for total hydraulic energy reduction. The results show a significant increase in total hydraulic energy reduction with changes in blade shape. The triangular shape led to a 3.80% increase in total hydraulic energy reduction compared to the rectangular shape, while the curved shape further increased total hydraulic energy reduction by 7.30% compared to the triangular shape, as seen in Figure 23.
Figure 23.
Total hydraulic energy reduction due to different shapes of blades.
Moreover, this study shows that altering the shape of turbine blades directly affects the hydraulic behavior of the spillway, particularly the maximum scour depth and its location downstream of the spillway. It was found that when the turbine blade shape changes from rectangular to triangular, then to curved, the maximum scour depth decreases by 18% and 12%, respectively. The results also show that the location of the maximum scour depth moves closer to the spillway apron by 3% and 49%, respectively, as presented in Figure 24. The reduction in maximum scour depth with the transition from rectangular to triangular and curved blades may be associated with changes in the downstream flow momentum and the resulting bed shear stress. The smoother flow distribution obtained with the curved blades may contribute to reducing the concentration of high-velocity flow near the downstream bed, thereby limiting sediment entrainment under the investigated conditions.
Figure 24.
Maximum scour depth and location due to different shapes of blades.
Regarding turbine efficiency, the maximum value obtained for the undershot configuration in the authors’ previous study (28%) falls within the range of 18–60% reported by Mugisidi et al. [68] for undershot Dethridge wheels. Moreover, the corresponding operating speed, approximately 63.6% of the runaway speed, is consistent with the observation of Paudel and Saenger [69] that maximum efficiency occurs at rotational speeds exceeding 50% of the runaway speed. Regarding scour mitigation, the authors’ previous study reported reductions in maximum scour depth of 24.60% and 34.33% for the undershot and overshot configurations, respectively, relative to the original spillway at a discharge of 1132.5 m3/s [47]. These results provide a reference for understanding the scour-mitigation performance of the turbine-integrated system. However, the limited availability of directly comparable studies on turbine integration with ski-jump spillways restricts broader quantitative comparisons, particularly regarding power output and scour reduction.
3.5. Study Limitations
Several aspects of the present numerical investigation should be considered when interpreting its findings. The sediment transport simulations rely on a non-cohesive sediment formulation, which may not adequately represent bed materials with cohesive properties. In addition, the computational mesh was selected to balance numerical accuracy and computational cost. Although the grid-convergence analysis provided an assessment of discretization uncertainty for the monitored variables, local flow structures and their interactions with the turbine may still be influenced by the adopted mesh resolution. Furthermore, the absence of experimental measurements for the combined turbine–spillway configuration limits the extent to which the predicted performance of the integrated system can be independently assessed. The implications of the experimental validation scope and geometric scaling are discussed in the preceding section. Therefore, the numerical findings should be interpreted within the assumptions and limitations of the adopted modeling approach, and further experimental investigations of the integrated configuration are needed to assess its performance under physical conditions. The three parametric scenarios were investigated separately; therefore, interactions among inflow discharge, blade number, and blade shape were not evaluated, and the best-performing condition identified for each parameter should not be interpreted as an optimal configuration of the integrated system. The present simulations provide instantaneous mechanical power under selected steady-flow conditions and do not include a long-term flow-duration record or an annual operating schedule. Therefore, annual energy yield and capacity factor cannot be reliably estimated without introducing site-specific assumptions regarding the frequency and duration of the investigated discharge conditions. Similarly, an indicative levelized cost of energy (LCOE) or payback period cannot be established from the present numerical results because capital costs, operation and maintenance costs, service life, and the value of generated electricity were not evaluated. A quantitative comparison with dedicated small-hydropower systems is likewise beyond the scope of the present study and would require site-specific hydraulic, operational, and economic data.
3.6. Constructability, Operational Safety, and Practical Implementation Considerations
From a constructability perspective, implementation of the proposed system would require the integration of the turbine, shaft, and supporting components within the existing ski-jump spillway while maintaining the hydraulic function of the structure. Practical implementation would therefore require site-specific assessment of the supporting system, installation and inspection access, and provisions for managing sediment and floating debris. These aspects were not evaluated in the present numerical investigation and would require detailed civil and mechanical design before any prototype-scale implementation.
Operational safety is also an important consideration because the proposed turbine operates within the high-velocity flow of the ski-jump spillway. In particular, the combination of high-velocity, sediment-laden, and aerated flow may impose additional durability demands on the exposed turbine components. Repeated hydraulic loading may contribute to fatigue of the blades, shaft, bearings, and supporting components, while sediment-laden flow may cause abrasive wear of exposed surfaces. The present study evaluates the hydraulic and energy-harvesting performance under the investigated discharge conditions; however, it does not assess transient structural loads, potential overspeed, debris impact, cavitation or abrasion effects, or safe turbine shutdown during extreme flood events. Cavitation-related effects and pressure fluctuations around the blades and supporting components also require dedicated assessment because these phenomena were not explicitly evaluated in the present numerical investigation. Under extreme flood conditions, the substantially higher discharge and flow velocity would be expected to increase the hydraulic loading on the turbine blades, shaft, and supporting components, while also increasing the potential for debris impact, vibration, overspeed, and sediment-related abrasion. Such conditions may also alter the hydraulic interaction between the turbine and the ski-jump flow and could increase operational and structural demands. Therefore, turbine operation during extreme flood events may require controlled shutdown, isolation, or bypass to maintain the safety and hydraulic function of the spillway. Accordingly, practical implementation would require dedicated structural and operational safety assessments addressing blade and shaft loads, bearing and support response, fatigue, and the provision of an appropriate strategy for turbine isolation or bypass when required. Such assessments should also consider the expected wear of components exposed to sediment-laden flow and define appropriate inspection, maintenance, and component-replacement requirements over the service life of the turbine. In addition, long-term implementation would require assessment of the economic feasibility of the proposed system. Therefore, the power and hydraulic performance reported in the present study should be regarded as numerical estimates of the potential of the investigated configuration rather than evidence of field-ready operation. These practical aspects should be addressed through site-specific structural, operational, economic, and experimental assessments before full-scale implementation.
4. Conclusions
There are many traditional methods used to improve the performance of ski-jump spillways, most of which dissipate flow energy without utilizing it. Given the growing importance of energy recovery, the present study investigates the potential of harvesting part of the flow energy using wheel turbines integrated with ski-jump spillways. For this purpose, FLOW-3D HYDRO was used to simulate the combined operation of the spillway and turbine under different conditions. Following the numerical uncertainty assessment and model validation, three parametric scenarios were investigated: (i) varying the inflow discharge to the spillway, (ii) changing the number of turbine blades, and (iii) modifying the turbine blade shape. The main findings can be summarized as follows:
- Overall system performance
The use of the turbine increased the total hydraulic energy reduction by an average of 22.10% and reduced the maximum scour depth by an average of 25.20% downstream of the ski-jump spillway compared with the configuration without a turbine. These results indicate that the turbine can contribute to both hydraulic energy reduction and scour mitigation under the investigated conditions.
- 2.
- Inflow discharge effects
The variation in inflow discharge had a pronounced effect on turbine performance and downstream scour. A 20% reduction in the inflow discharge resulted in an approximately 54% decrease in turbine power output and a 21.46% reduction in the maximum scour depth. This demonstrates the sensitivity of the turbine–spillway system to the operating discharge.
- 3.
- Blade number effects
Among the investigated blade arrangements (5, 6, 8, and 10 blades), the eight-blade configuration produced the highest mechanical efficiency and power output. Increasing the number of blades beyond eight resulted in greater total hydraulic energy reduction, indicating that blade number affects both the mechanical and hydraulic performance of the integrated system.
- 4.
- Blade Shape Effects
The blade shape also had a significant influence on the hydraulic and mechanical performance of the system. The triangular blade shape increased the total hydraulic energy reduction by 3.80% compared with the rectangular shape, while the curved-blade shape provided a further increase of 7.30% compared with the triangular shape. Among the investigated blade shapes, the curved-blade configuration provided the best mechanical performance, increasing mechanical efficiency by 17% and decreasing maximum scour depth by 12.0% compared with the triangular configuration. The curved blades also achieved a maximum power output of 67.6 MW with an efficiency of 33% under the examined operating conditions.
This study provides an initial numerical investigation into the possibility of harvesting flow energy from ski-jump spillways using wheel turbines. However, further numerical and experimental investigations are required to assess the performance of the integrated turbine–spillway system. The predicted scour characteristics should be interpreted as relative numerical trends under the adopted non-cohesive sediment-bed assumption rather than as definitive prototype-scale predictions. It should also be noted that the investigated parameters were examined separately; therefore, the best-performing condition identified for each parameter does not necessarily represent the optimal combined configuration of the system.
Author Contributions
All authors contributed to the study conception and design; Conceptualization, A.J., M.T.G., H.M.E. and H.F.A.-E.; Data curation, H.M.E. and A.J.; Formal analysis, A.J., H.O., M.H.M., H.F.A.-E., and H.M.E.; Methodology, A.J., M.H.M. and H.F.A.-E.; Modeling, M.T.G., A.J., H.O. and H.M.E.; Writing—original draft, A.J., M.T.G., M.H.M., M.Z. and H.M.E.; Writing—review and editing, M.H.M., H.O., M.Z. and H.F.A.-E. All authors have read and agreed to the published version of the manuscript.
Funding
This research received no external funding.
Data Availability Statement
The original contributions presented in this study are included in the article. Further inquiries can be directed to the corresponding author.
Acknowledgments
The research was supported by “CERMA: Center of Excellence for Environmental Risk Management”, Project N°: 2024-1-SK01-KA220-HED-000243758. This work was supported by the project of the Ministry of Education of the Slovak Republic VEGA 1/0588/24. This work was supported by project HUSK/2302/1.2/063 Development of an ENVironmental Impact and Risk Assessment focusing on the activities on the catchment of Sajó/Slaná river basin.
Conflicts of Interest
The authors declare no conflicts of interest.
Nomenclature
| Scour length (i.e., location of maximum scour depth) (m) | |
| Maximum scour depth (m) | |
| Unit discharge value (m3/s/m`) | |
| Mean sediment diameter (m) | |
| Specific energy head at upstream (m) | |
| Specific energy head at downstream (m) | |
| Pressure head at upstream (m) | |
| Pressure head at downstream (m) | |
| Velocity of flow at upstream (m/s) | |
| Velocity of flow at downstream (m/s) | |
| Slope ratio (Vertical: Horizontal) (dimensionless) | |
| Differential head between upstream and downstream (m) | |
| Inflow discharge (m3/s) | |
| Time averaged velocity (m/s) | |
| Kinematic viscosity (m2/s) | |
| Fractional volume | |
| Averaged pressure (N/ m2) | |
| Component of Reynold’s stress (m2/s2) | |
| Turbulent kinetic energy (m2/s2) | |
| Velocities component in x-, y-, and z-direction (m/s) | |
| Area fractions | |
| Turbulent kinetic energy production (m2/s2) | |
| Buoyancy turbulence energy (m2/s2) | |
| Turbulent energy dissipation rate (m2/s3) | |
| Coefficient of turbulence model | |
| Density of the fluid (kg/m3) | |
| Angular velocity (rad/s) | |
| Torque (N.m) | |
| Efficiency (N.m) | |
| Key variables according to different mesh densities | |
| r | Grid refinement ratio (dimensionless) |
| R | Convergence ratio (dimensionless) |
| Relative convergence ratio (dimensionless) | |
| Grid Convergence Index between fine and medium meshes (dimensionless) | |
| Grid Convergence Index between medium and coarse meshes (dimensionless) | |
| P | Formal order of accuracy (dimensionless) |
| N | Number of turbine blades |
References
- IEA. World Energy Outlook 2021; International Energy Agency: Paris, France, 2021. [Google Scholar]
- Narrain, A.G.P. Low Head Hydropower for Local Energy Solutions; CRC Press: Boca Raton, FL, USA, 2017. [Google Scholar]
- Hosseini, S.E. Transition away from fossil fuels toward renewables: Lessons from Russia-Ukraine crisis. Future Energy 2022, 1, 2–5. [Google Scholar] [CrossRef] [Scilit]
- Llamosas, C.; Sovacool, B.K. The future of hydropower? A systematic review of the drivers, benefits and governance dynamics of transboundary dams. Renew. Sustain. Energy Rev. 2021, 137, 110495. [Google Scholar] [CrossRef] [Scilit]
- Paudel, S. Experimental and Numerical Study of Dethridge Wheel for Pico-Scale Hydropower Generation. Ph.D. Thesis, University of the West of Scotland, London, UK, 2016. [Google Scholar]
- Paish, O. Micro-hydropower: Status and prospects. Proc. Inst. Mech. Eng. Part A J. Power Energy 2002, 216, 31–40. [Google Scholar] [CrossRef] [Scilit]
- Paish, O. Small hydro power: Technology and current status. Renew. Sustain. Energy Rev. 2002, 6, 537–556. [Google Scholar] [CrossRef] [Scilit]
- Yildiz, V.; Brown, S.; Rougé, C. Importance of variable turbine efficiency in run-of-river hydropower design under deep uncertainty. Water Resour. Res. 2024, 60, e2023WR035713. [Google Scholar] [CrossRef] [Scilit]
- Types of Hydropower Turbines. 2025. Available online: https://www.energy.gov/eere/water/types-hydropower-turbines (accessed on 5 June 2026).
- Mugisidi, D.; Fauzi, I.N.; Heriyani, O.; Djeli, Y.; Aidhilhan, E.; Gunawan, P.H. Development of the Dethridge Wheel Blade Shape for Hydropower Generation in Irrigation Canals in Indonesia. J. Adv. Res. Fluid Mech. Therm. Sci. 2022, 98, 146–156. [Google Scholar] [CrossRef] [Scilit]
- Kabeyi, M.J.B.; Olanrewaju, O.A. Hydroelectric Power Plants and Their Sustainability; IntechOpen: London, UK, 2025. [Google Scholar]
- Pujol, T.; Montoro, L. High hydraulic performance in horizontal waterwheels. Renew. Energy 2010, 35, 2543–2551. [Google Scholar] [CrossRef] [Scilit]
- Quaranta, E.; Revelli, R. Performance optimization of overshot water wheels at high rotational speeds for hydropower applications. J. Hydraul. Eng. 2020, 146, 06020011. [Google Scholar] [CrossRef] [Scilit]
- Paudel, S.; Weber, M.; Geyer, D.; Saenger, N. Experimental and numerical study of Zuppinger water wheel model. Proc. Inst. Civ. Eng. Water Manag. 2022, 175, 206–216. [Google Scholar] [CrossRef] [Scilit]
- Jasa, L.; Priyadi, A.; Purnomo, M.H. Experimental Investigation of Micro-Hydro Waterwheel Models to Determine Optimal Efficiency. Appl. Mech. Mater. 2015, 776, 413–418. [Google Scholar] [CrossRef] [Scilit]
- Quaranta, E.; Revelli, R. Optimization of breastshot water wheels performance using different inflow configurations. Renew. Energy 2016, 97, 243–251. [Google Scholar] [CrossRef] [Scilit]
- Nishi, Y.; Inagaki, T.; Li, Y.; Omiya, R.; Fukutomi, J. Study on an undershot cross-flow water turbine. J. Therm. Sci. 2014, 23, 239–245. [Google Scholar] [CrossRef] [Scilit]
- Nguyen, M.H.; Jeong, H.; Yang, C. A study on flow fields and performance of water wheel turbine using experimental and numerical analyses. Sci. China Technol. Sci. 2018, 61, 464–474. [Google Scholar] [CrossRef] [Scilit]
- Vidali, C.; Fontan, S.; Quaranta, E.; Cavagnero, P.; Revelli, R. Experimental and dimensional analysis of a breastshot water wheel. J. Hydraul. Res. 2016, 54, 473–479. [Google Scholar] [CrossRef] [Scilit]
- Pujol, T.; Vashisht, A.K.; Ricart, J.; Culubret, D.; Velayos, J. Hydraulic efficiency of horizontal waterwheels: Laboratory data and CFD study for upgrading a western Himalayan watermill. Renew. Energy 2015, 83, 576–586. [Google Scholar] [CrossRef] [Scilit]
- Bachan, A.; Ghimire, N.; Eisner, J.; Chitrakar, S.; Neopane, H.P. Numerical analysis of low-tech overshot water wheel for off grid purpose. J. Phys. Conf. Ser. 2019, 1266, 012001. [Google Scholar] [CrossRef] [Scilit]
- Quaranta, E.; Revelli, R. CFD simulations to optimize the blade design of water wheels. Drink. Water Eng. Sci. 2017, 10, 27–32. [Google Scholar] [CrossRef] [Scilit]
- Yah, N.F.; Oumer, A.N.; Aziz, A.A.; Sahat, I.M. Numerical investigation on effect of blade shape for stream water wheel performance. IOP Conf. Ser. Mater. Sci. Eng. 2018, 342, 012066. [Google Scholar] [CrossRef] [Scilit]
- Nguyen, M.H.; Jeong, H.; Jhang, S.-s.; Kim, B.-g.; Yang, C. A parametric study about blade shapes and blade numbers of water wheel type tidal turbine by numerical method. J. Korean Soc. Mar. Environ. Saf. 2016, 22, 296–303. [Google Scholar] [CrossRef] [Scilit]
- Quaranta, E.; Revelli, R. Hydraulic behavior and performance of breastshot water wheels for different numbers of blades. J. Hydraul. Eng. 2017, 143, 04016072. [Google Scholar] [CrossRef] [Scilit]
- Khatsuria, R.M. Hydraulics of Spillways and Energy Dissipators; CRC Press: Boca Raton, FL, USA, 2004. [Google Scholar]
- Novák, P.; Moffat, A.; Nalluri, C.; Narayanan, R. Hydraulic Structures; CRC Press: Boca Raton, FL, USA, 2017. [Google Scholar]
- Gul, E.; Alpaslan, N.; Emiroglu, M.E. Robust optimization of SVM hyper-parameters for spillway type selection. Ain Shams Eng. J. 2021, 12, 2413–2423. [Google Scholar] [CrossRef] [Scilit]
- Cheng, X.; Li, R.; Feng, J.; Zhu, D.Z.; Li, K. TDG generation in a ski-jump spillway with a fully or partial-flip bucket. J. Environ. Manag. 2024, 353, 120123. [Google Scholar] [CrossRef] [Scilit] [PubMed]
- Chavhan, V.; Hinge, G. Trajectory features and energy dissipation of conventional and modified (Deflector) Ski-Jump bucket. Mater. Today Proc. 2022, 49, 1973–1979. [Google Scholar] [CrossRef] [Scilit]
- Lauria, A.; Alfonsi, G.; Tafarojnoruz, A. Flow pressure behavior downstream of ski jumps. Fluids 2020, 5, 168. [Google Scholar] [CrossRef] [Scilit]
- Veronese, A. Erosioni Di Fondo a Valle Di Uno Scarico; Stab. Tip. Del Genio Civile: Rome, Italy, 1937. [Google Scholar]
- Martins, R.B. Scouring of rocky riverbeds by free-jet spillways. Water Power Dam Constr. 1975, 27, 152–153. [Google Scholar]
- Schoklitsch, A. Kolkbildung unter überfallstrahlen. Die Wasserwirtsch. 1932, 24, 341–343. [Google Scholar]
- D’Agostino, V.; Ferro, V. Scour on alluvial bed downstream of grade-control structures. J. Hydraul. Eng. 2004, 130, 24–37. [Google Scholar] [CrossRef] [Scilit]
- Chavhan, V.; Hinge, G. Model Study to Minimize Scour in Tail Channel of Ski-Jump Bucket Energy Dissipator Using Deflectors. ASEAN Eng. J. 2022, 12, 249–257. [Google Scholar] [CrossRef] [Scilit]
- Sá Machado, L.; Lima, M.; Aleixo, R.; Carvalho, E. Effect of the ski jump bucket angle on the scour hole downstream of a converging stepped spillway. Int. J. River Basin Manag. 2020, 18, 383–394. [Google Scholar] [CrossRef] [Scilit]
- Rajaei, A.; Omid, M.H.; Varaki, M.E. Experimental investigation on local scour downstream of stepped chutes with a flip bucket. J. Appl. Water Eng. Res. 2024, 12, 369–387. [Google Scholar] [CrossRef] [Scilit]
- Nou, M.R.G.; Zolghadr, M.; Bajestan, M.S.; Azamathulla, H. Application of ANFIS–PSO hybrid algorithm for predicting the dimensions of the downstream scour hole of ski-jump spillways. Iran. J. Sci. Technol. Trans. Civ. Eng. 2021, 45, 1845–1859. [Google Scholar] [CrossRef] [Scilit]
- Zhou, W.; Wei, J.; Miao, B.; Dai, X.; Ren, W. Experimental study on downstream slope erosion prevention for ski-jump energy dissipation in steep narrow valley. J. Chang. River Sci. Res. Inst. 2024, 41, 76. [Google Scholar]
- Tessendorf, K.; Bosman, A. Comparative study on the influence of trajectory bucket geometry on energy dissipation downstream of ski-jump spillways. J. S. Afr. Inst. Civ. Eng. 2026, 68, 20–35. [Google Scholar] [CrossRef] [Scilit]
- Shiri, S. 3D numerical modeling of flows on a reduced model of a ski jump spillway with an erosion pit using a coupled SPH–FEM-DEM approach. J. Appl. Water Eng. Res. 2024, 12, 1–13. [Google Scholar] [CrossRef] [Scilit]
- Castillo, L.G.; Carrillo, J.M. Comparison of methods to estimate the scour downstream of a ski jump. Int. J. Multiph. Flow 2017, 92, 171–180. [Google Scholar] [CrossRef] [Scilit]
- Ahmadpour, R.; Sarkardeh, H.; Azamathulla, H. Mathematical simulation of air-water flow along Ski Jump Jet. Water Supply 2022, 22, 2093–2105. [Google Scholar] [CrossRef] [Scilit]
- Kulhare, A.; Bhate, R.; Bhajantri, M. Hydraulic Design of Plunge Pool Downstream of Ski-Jump Bucket of Orifice Spillways. In Proceedings of the International Conference on Hydraulics, Water Resources and Coastal Engineering, Surat, India, 23–25 December 2021; pp. 411–425. [Google Scholar]
- Asadi, M.E.; Naeeni, S.T.O.; Kerachian, R. The effects of splitters on the downstream scour hole of overflow spillways: Application of support vector regression. Water Supply 2022, 22, 1905–1929. [Google Scholar] [CrossRef] [Scilit]
- Jatwary, A.; Mowafy, M.H.; Eldeeb, H.M.; Armanuos, A.M.; Ghonim, M.T. Optimizing The Hydraulic Performance and Energy Harvesting of Ski-Jump Spillways Using the Wedge. Results Eng. 2026, 32, 113215. [Google Scholar] [CrossRef] [Scilit]
- Cone, V.M. The Deathridge Meter; Agricultural Experiment Station of the Agricultural College of Colorado: Fort Collins, CO, USA, 1915; Volume 215. [Google Scholar]
- Paudel, S.; Saenger, N. Dethridge wheel for pico-scale hydropower generation: An experimental and numerical study. IOP Conf. Ser. Earth Environ. Sci. 2016, 49, 102007. [Google Scholar] [CrossRef] [Scilit]
- Flow Science Inc. Flow 3D User’s Manual; Flow Science Inc.: Los Alamos, NM, USA, 1997. [Google Scholar]
- Hirt, C.W.; Nichols, B.D. Volume of fluid (VOF) method for the dynamics of free boundaries. J. Comput. Phys. 1981, 39, 201–225. [Google Scholar] [CrossRef] [Scilit]
- Patankar, S.V. Numerical Heat Transfer and Fluid Flow; Hemisphere Publishing Corporation: New York, NY, USA, 1980; Volume 58, p. 288. [Google Scholar]
- Soulsby, R.L.; Whitehouse, R.J. Threshold of sediment motion in coastal environments. In Proceedings of the Pacific Coasts and Ports’ 97: Proceedings of the 13th Australasian Coastal and Ocean Engineering Conference and the 6th Australasian Port and Harbour Conference, Christchurch, New Zealand, 7–11 September 1997; Volume 1, pp. 145–150. [Google Scholar]
- Meyer, P.E.; Muller, R. Formulas for bed-load transport. In Proceedings of the 2nd Meeting of the International Association for Hydraulic Structures Research, Stockholm, Sweden, 7–9 June 1984. [Google Scholar]
- Talimi, V.; Muzychka, Y.; Kocabiyik, S. A review on numerical studies of slug flow hydrodynamics and heat transfer in microtubes and microchannels. Int. J. Multiph. Flow 2012, 39, 88–104. [Google Scholar] [CrossRef] [Scilit]
- Freitas, C.J. The issue of numerical uncertainty. Appl. Math. Model. 2002, 26, 237–248. [Google Scholar] [CrossRef] [Scilit]
- Eça, L.; Hoekstra, M. Evaluation of numerical error estimation based on grid refinement studies with the method of the manufactured solutions. Comput. Fluids 2009, 38, 1580–1591. [Google Scholar] [CrossRef] [Scilit]
- Eça, L.; Hoekstra, M. A procedure for the estimation of the numerical uncertainty of CFD calculations based on grid refinement studies. J. Comput. Phys. 2014, 262, 104–130. [Google Scholar] [CrossRef] [Scilit]
- Roache, P.J. Quantification of uncertainty in computational fluid dynamics. Annu. Rev. Fluid Mech. 1997, 29, 123–160. [Google Scholar] [CrossRef] [Scilit]
- Ndebele, B.; Skews, B. The locus of the inflection point of a diffracting cylindrical shock segment. Shock Waves 2019, 29, 941–955. [Google Scholar] [CrossRef] [Scilit]
- Roache, P.J. Perspective: A method for uniform reporting of grid refinement studies. ASME J. Fluids Eng. 1994, 116, 405–413. [Google Scholar] [CrossRef] [Scilit]
- Oberkampf, W.L.; Roy, C.J. Verification and Validation in Scientific Computing; Cambridge University Press: Cambridge, UK, 2010. [Google Scholar]
- Bhuinyan, S.S.; Sinha, A.K.; Bhagate, K. Experimental Investigation of Ogee Spillway with an Altered Ski Jump Energy Dissipator: Maithon Dam, India. NeuroQuantology 2022, 20, 2571–2581. [Google Scholar]
- Paudel, S.; Saenger, N. Grid refinement study for three dimensional CFD model involving incompressible free surface flow and rotating object. Comput. Fluids 2017, 143, 134–140. [Google Scholar] [CrossRef] [Scilit]
- Dasgupta, M.; Das, S. Extreme flood flow routing for Panchet and Maithan reservoirs of India using Modified Puls Technique. Water 2024, 16, 663. [Google Scholar] [CrossRef] [Scilit]
- Bhuinyan, S.S.; Sinha, A.K.; Bhagate, K. A Case Study: Innovating Energy Dissipation In Ogee Spillways With Modified Ski Jump Designs. Educ. Adm. Theory Pract. 2024, 30, 8528–8535. [Google Scholar] [CrossRef] [Scilit]
- Ghosh, S.; Bid, S.; Mondal, C. Impact of maithon dam-a micro level study on salanpur block of paschim bardhaman district, west bengal. Int. J. Comput. Eng. Res. (IJCER) 2018, 8, 51–64. [Google Scholar]
- Mugisidi, D.; Heriyani, O.; Luhung, R.A.; Andrian, M.R.D. Utilization of the dethridge wheel as a low head power generator and loss analysis. In Proceedings of the MATEC Web of Conferences, Abu Dhabi, United Arab Emirates, 20–22 November 2018; p. 04003. [Google Scholar]
- Paudel, S.; Saenger, N. Effect of channel geometry on the performance of the Dethridge water wheel. Renew. Energy 2018, 115, 175–182. [Google Scholar] [CrossRef] [Scilit]
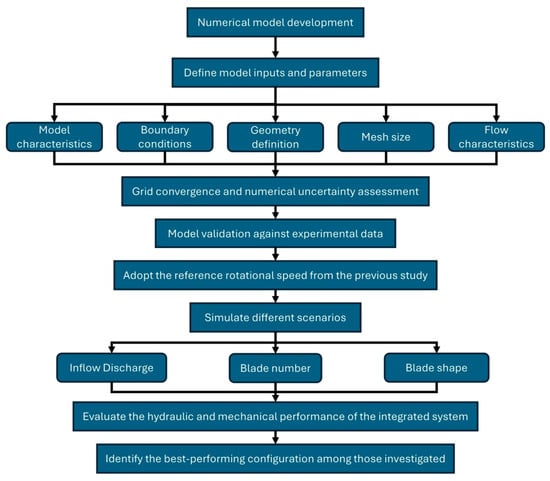
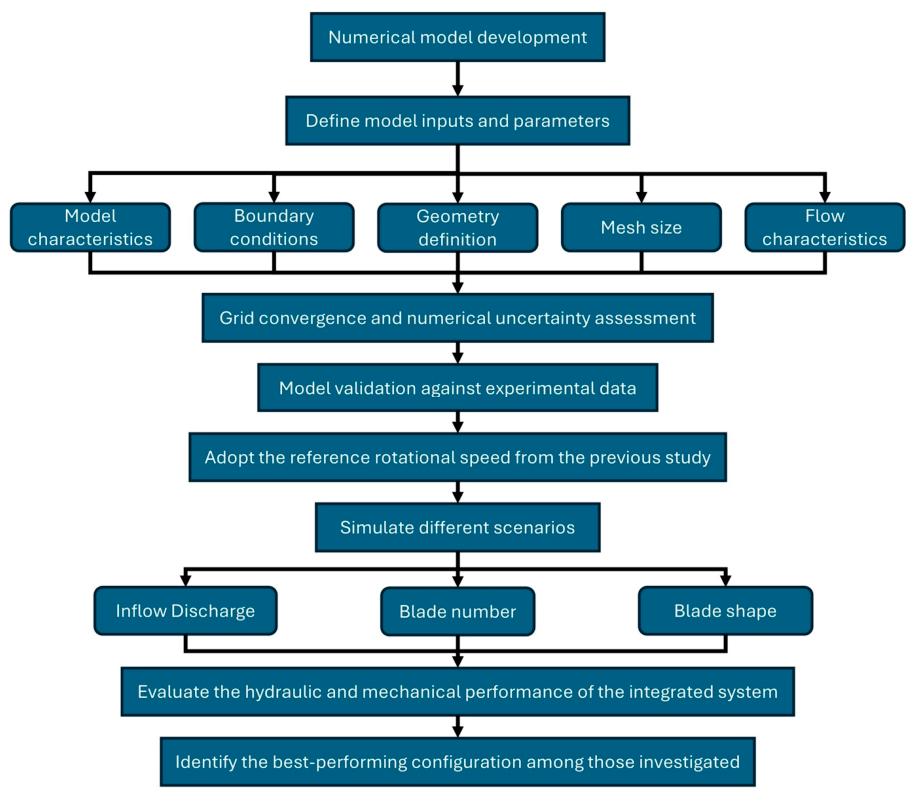
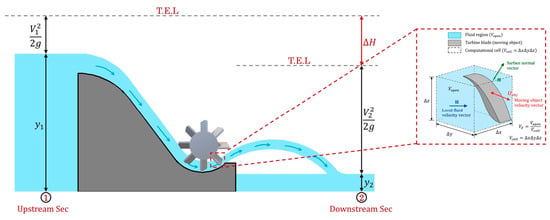
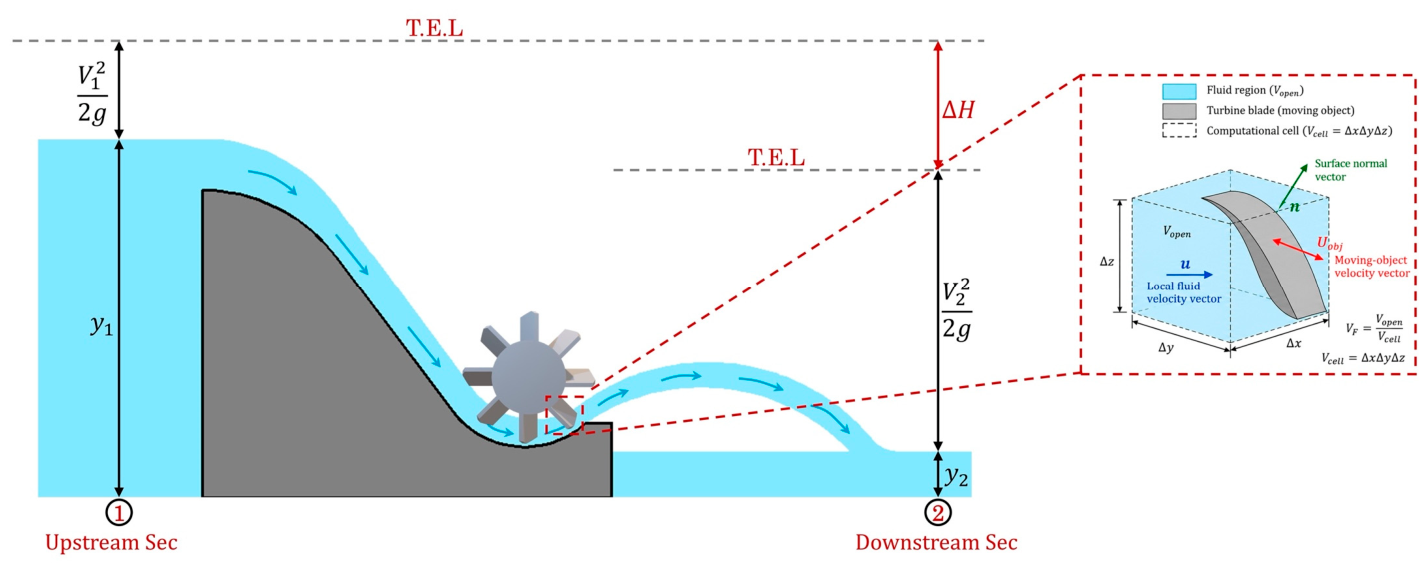
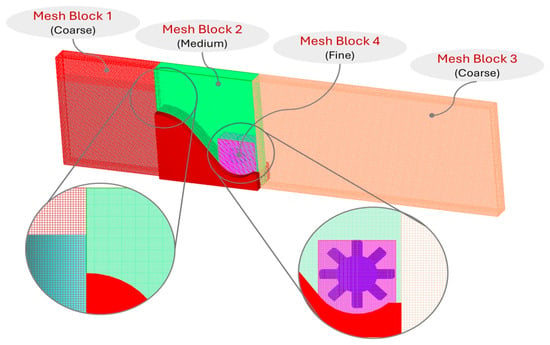
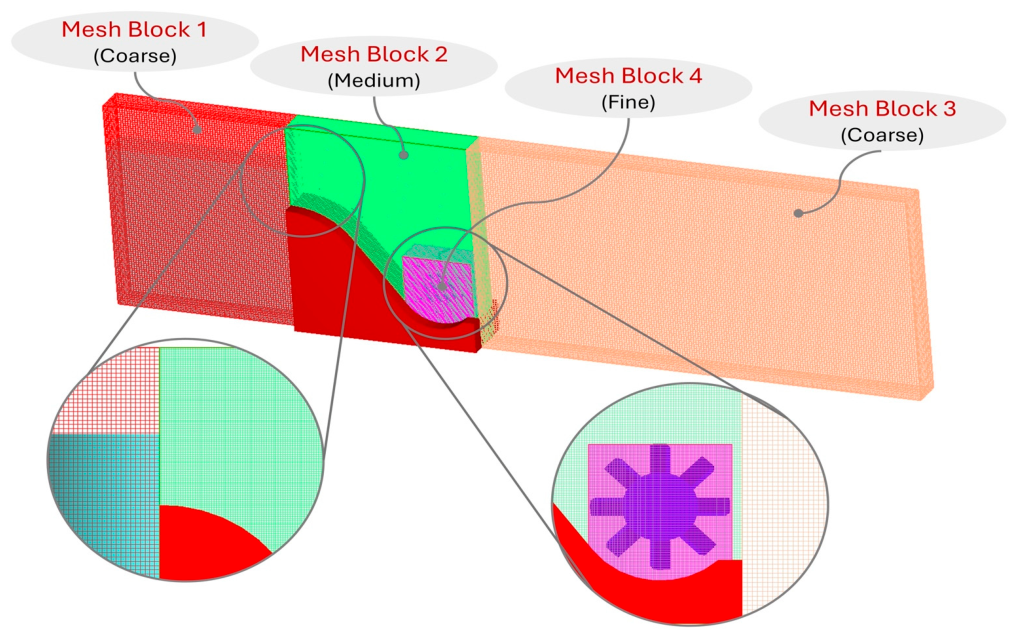
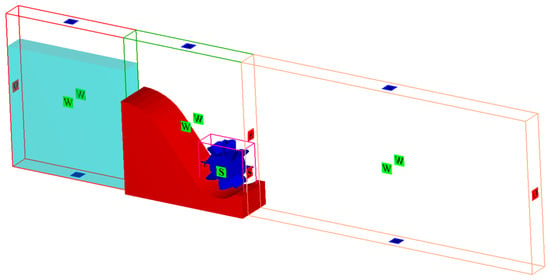
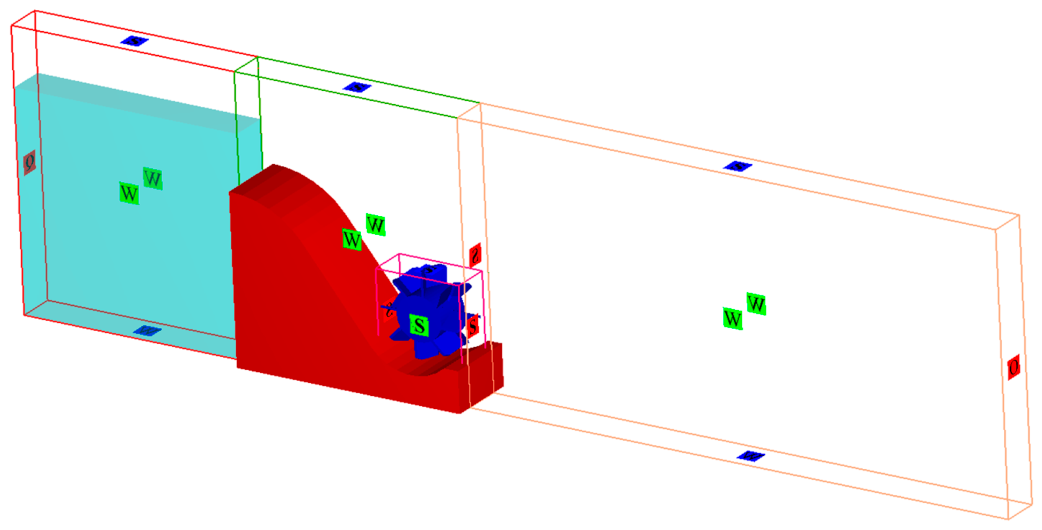
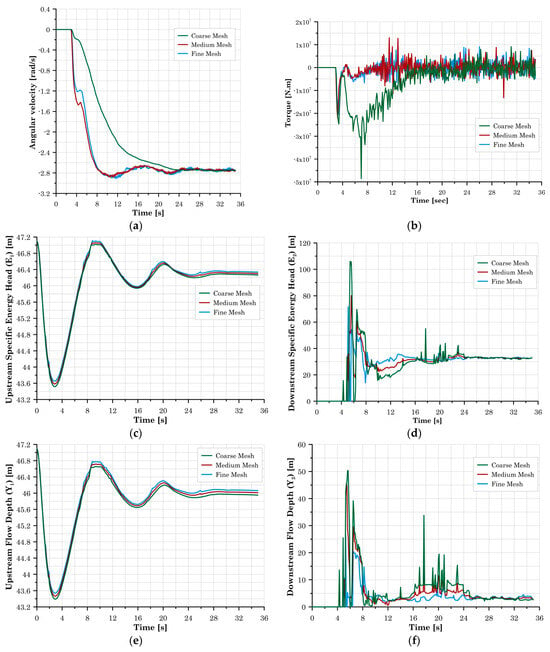
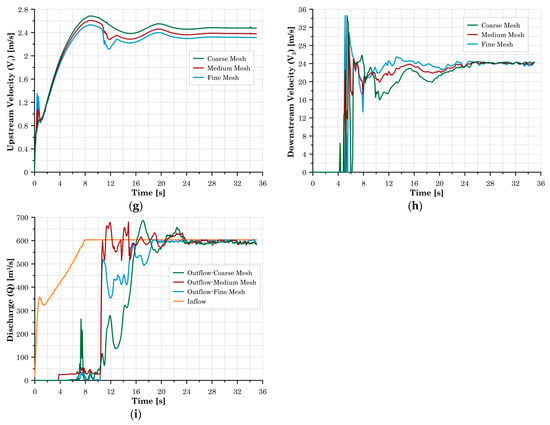
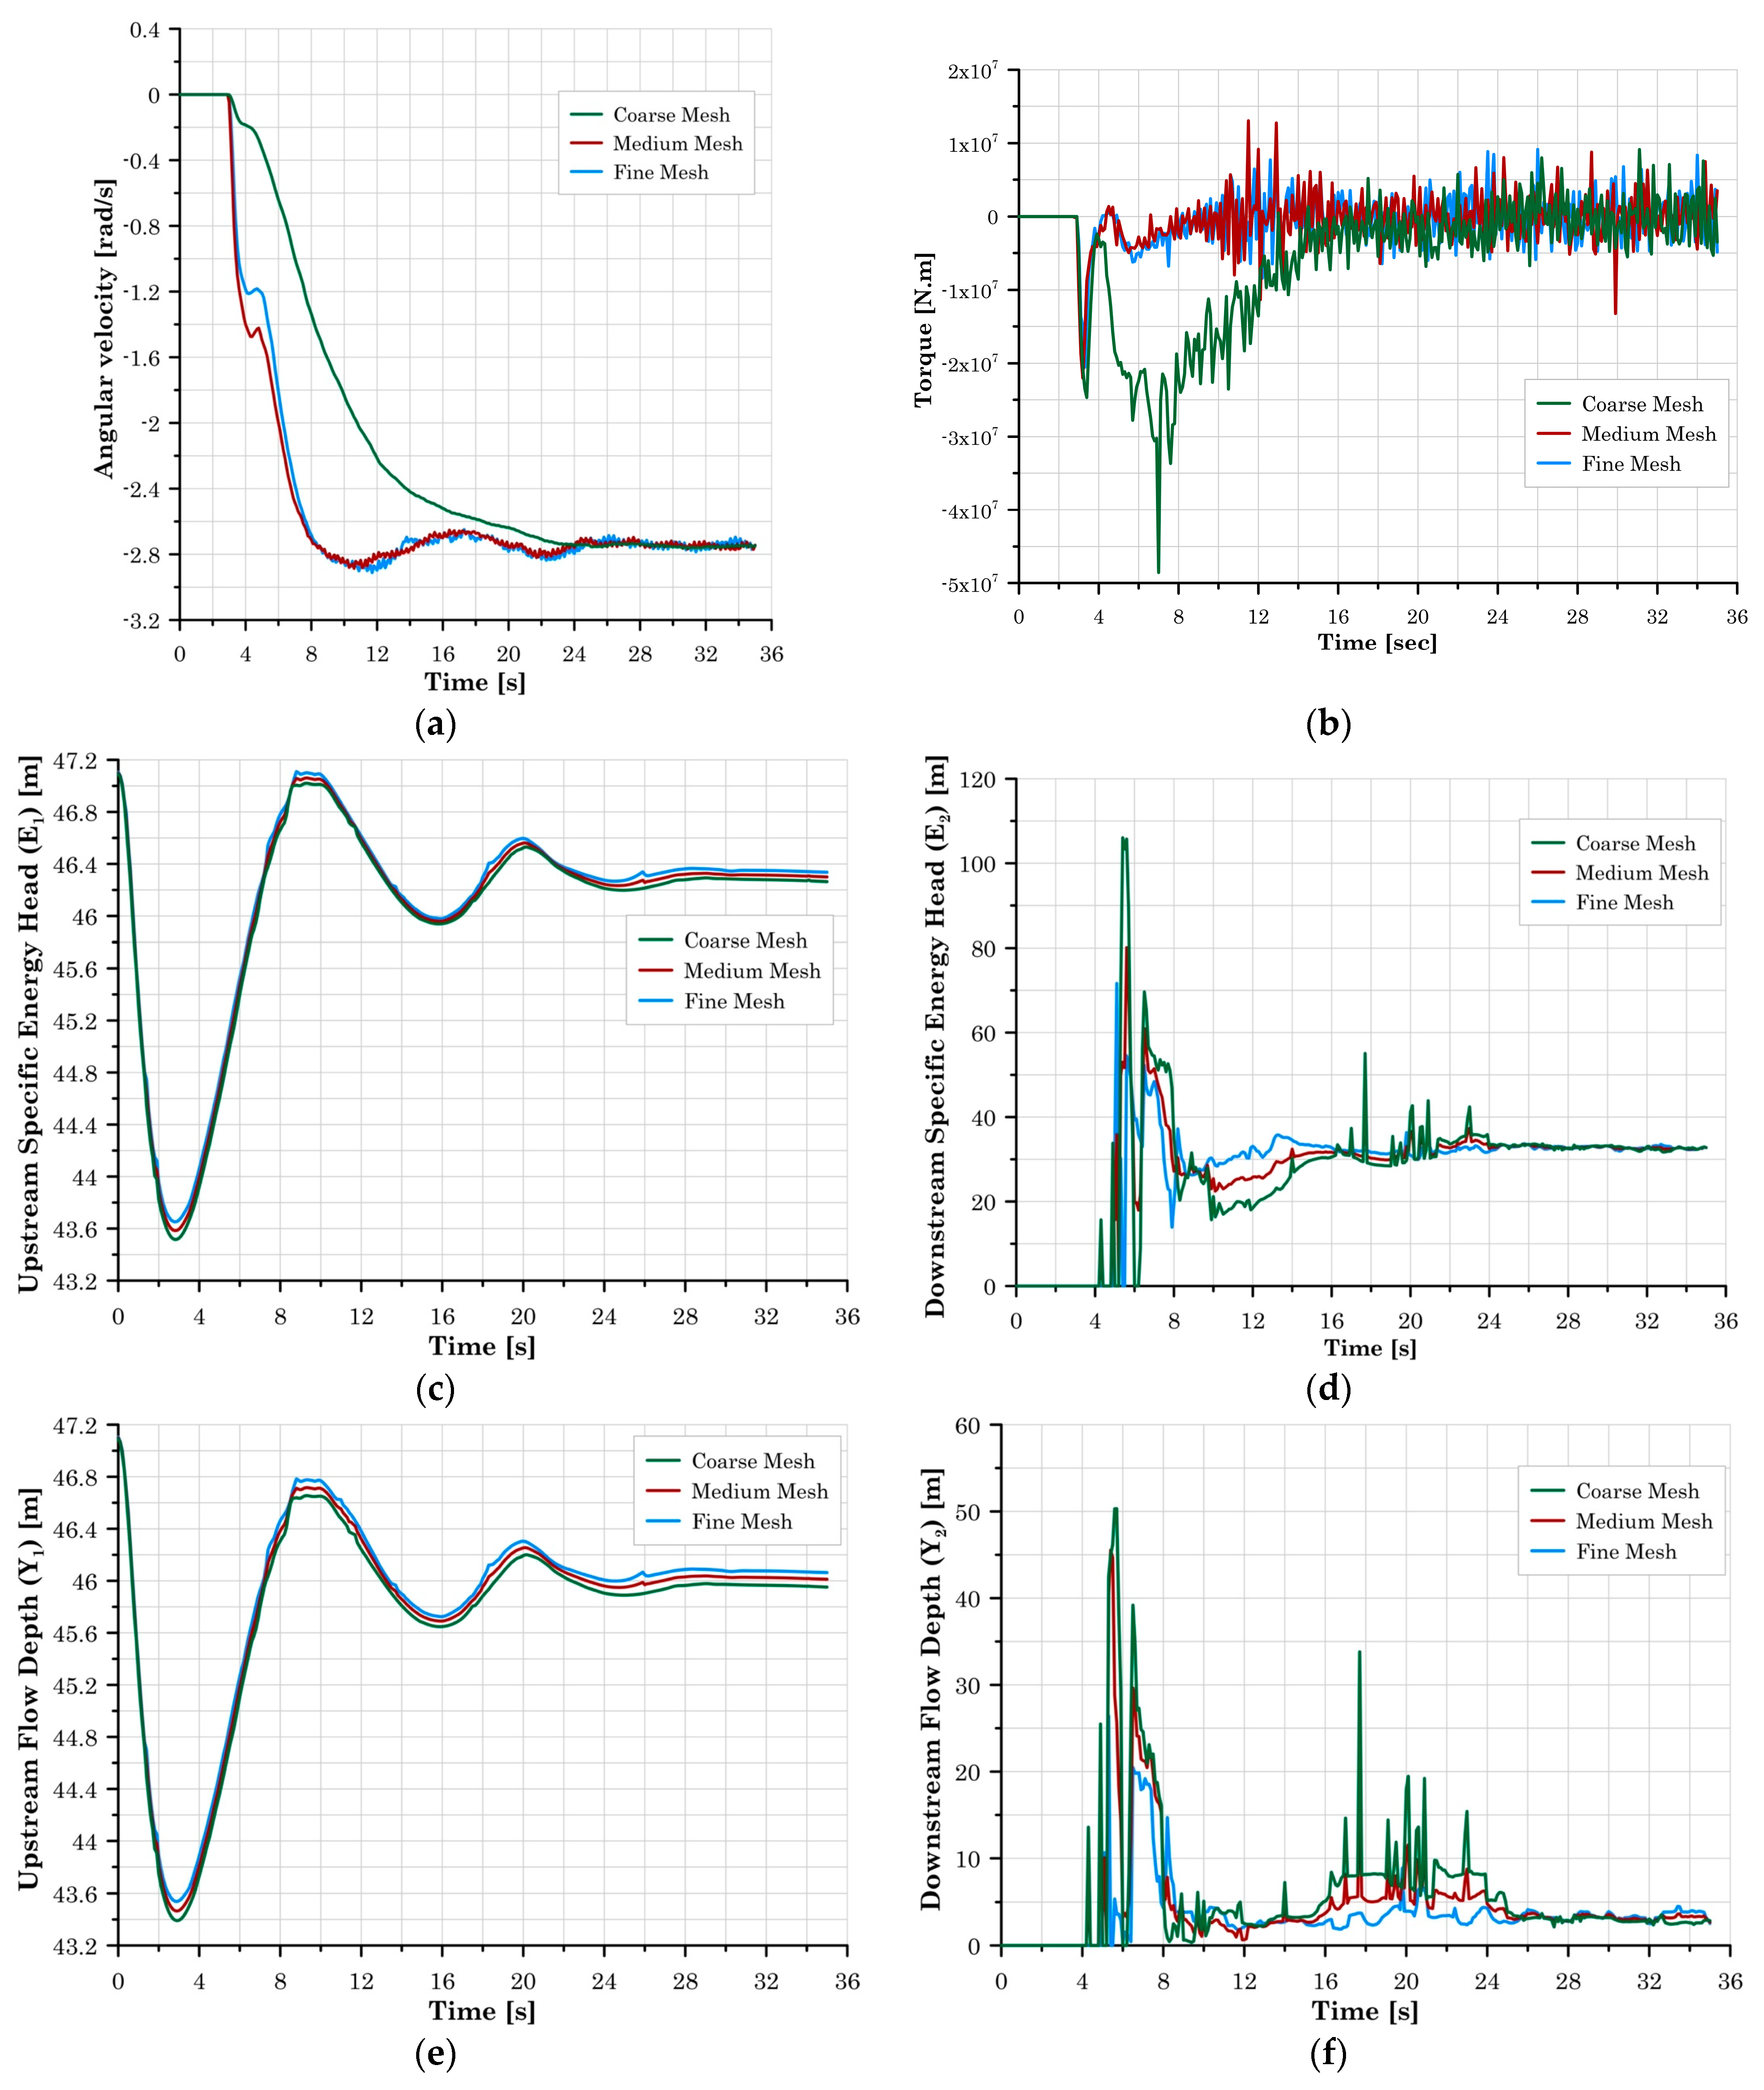
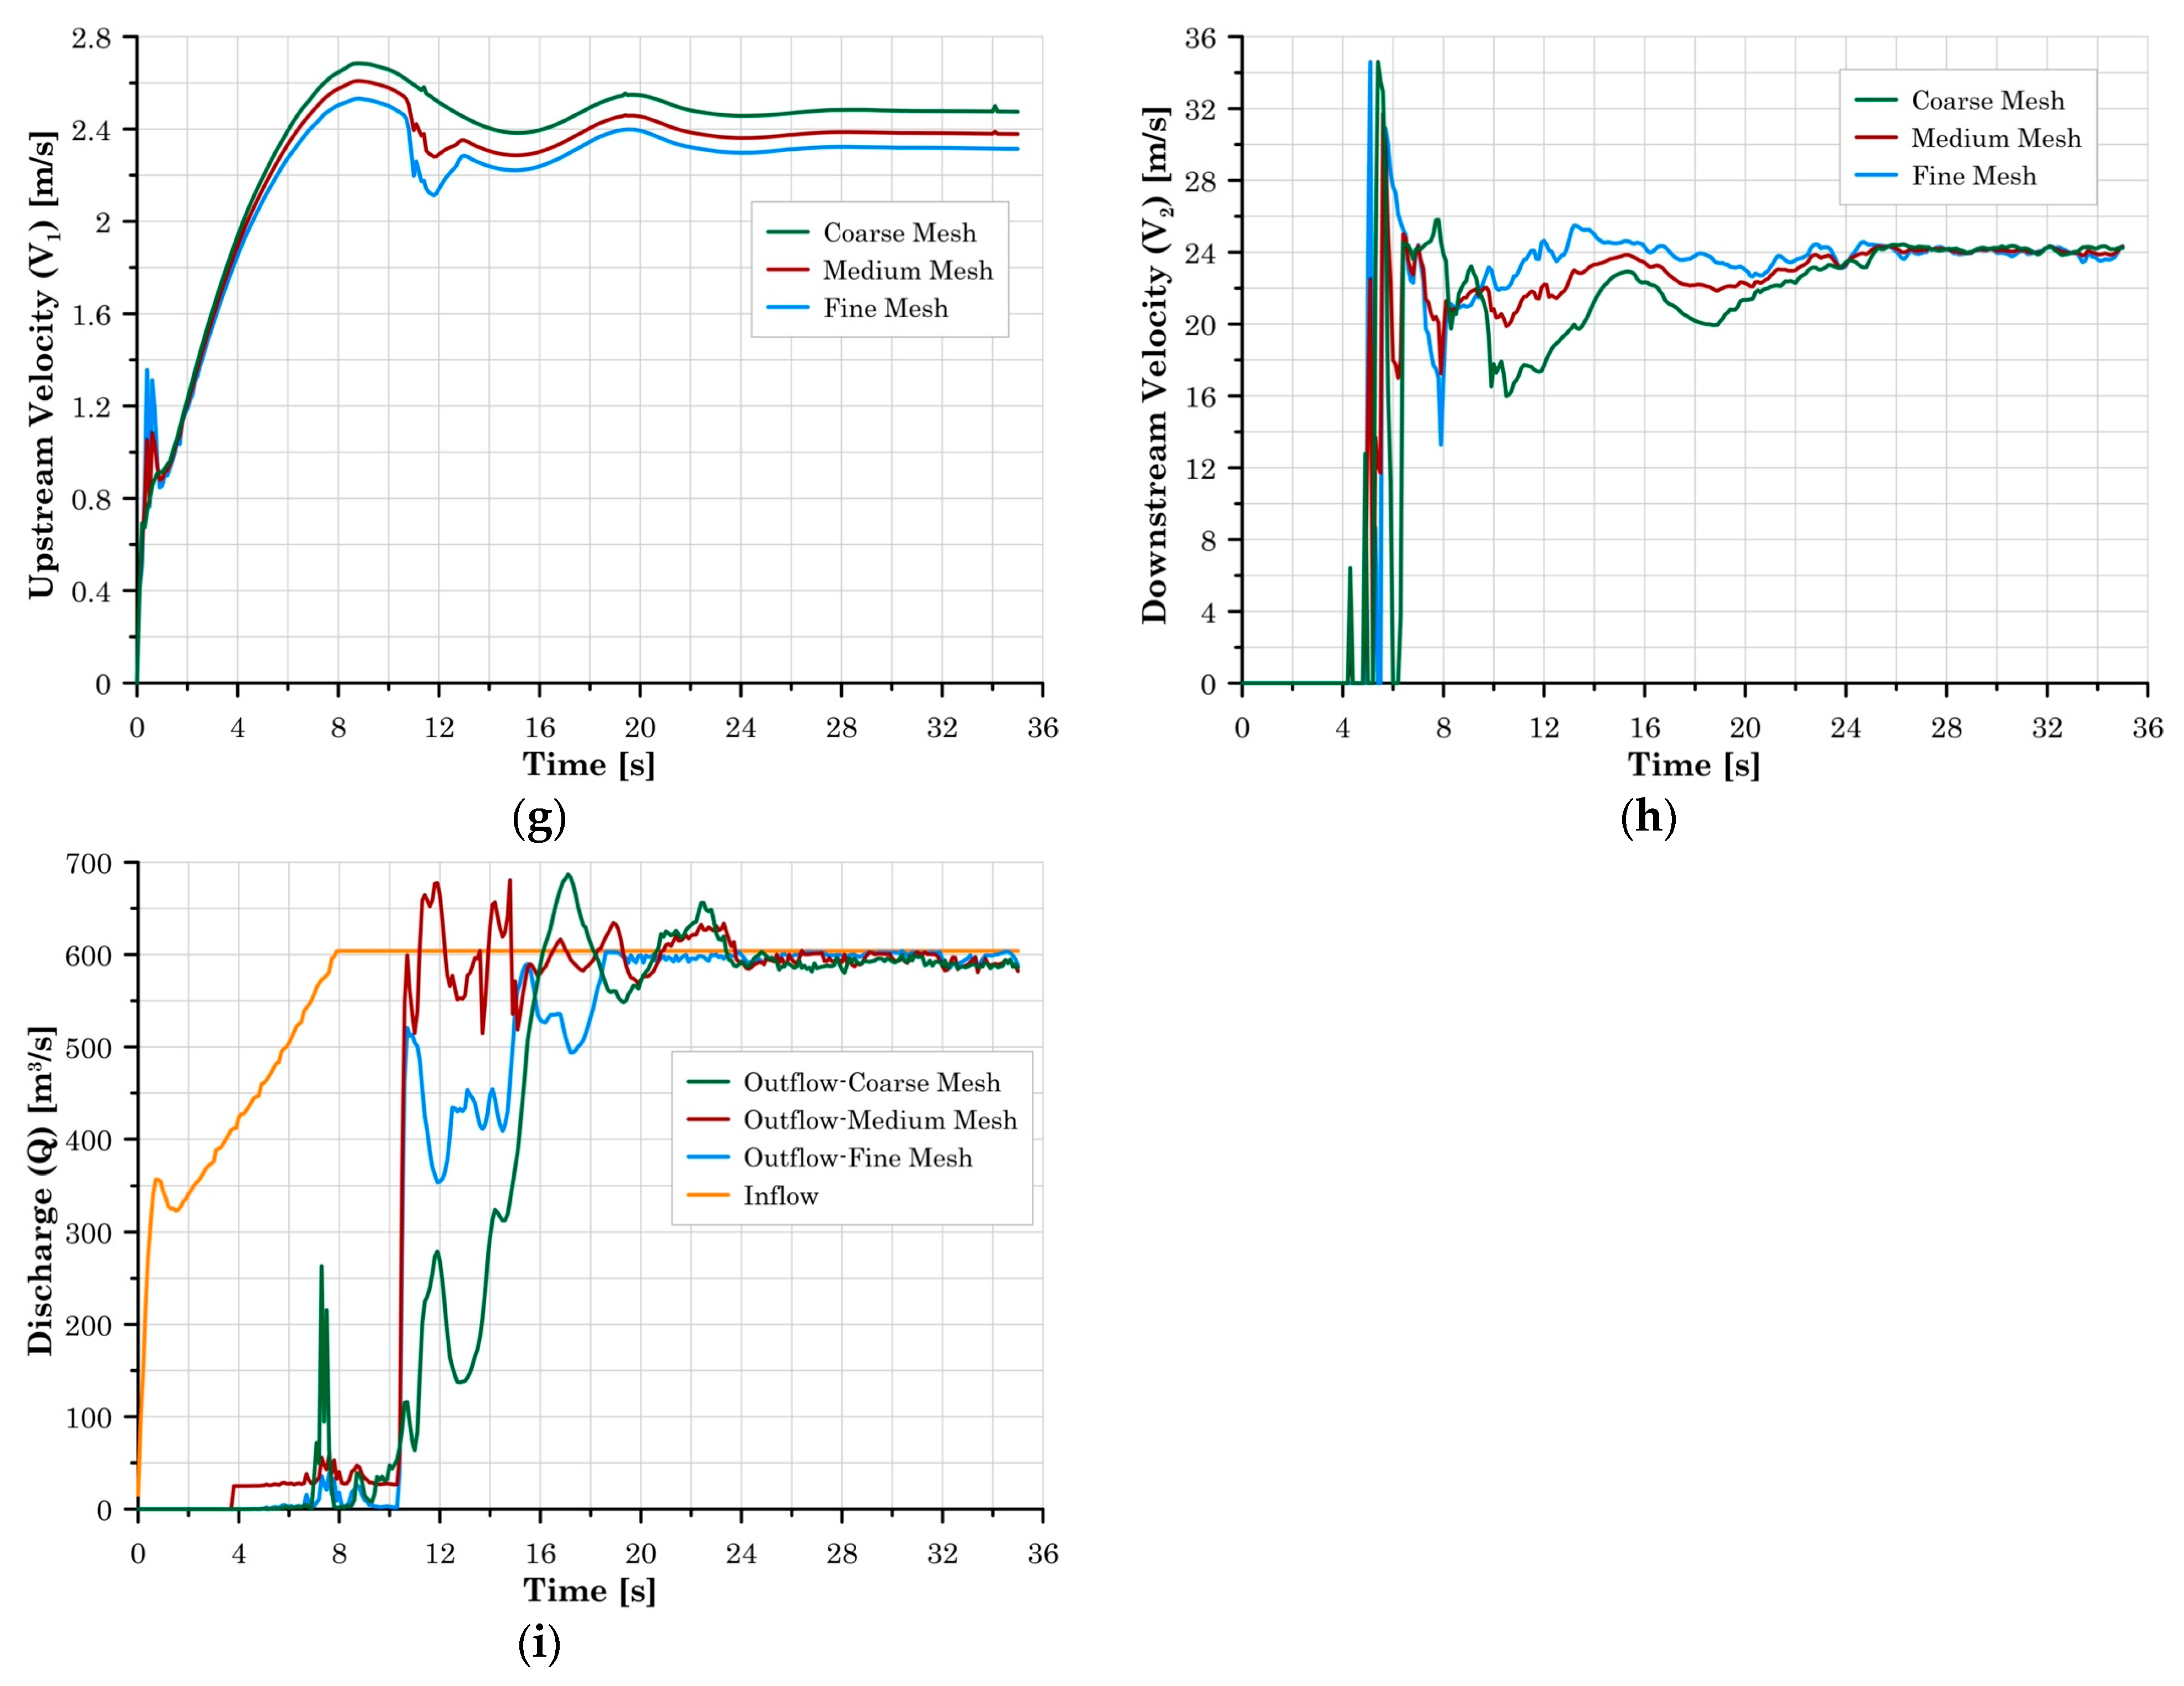
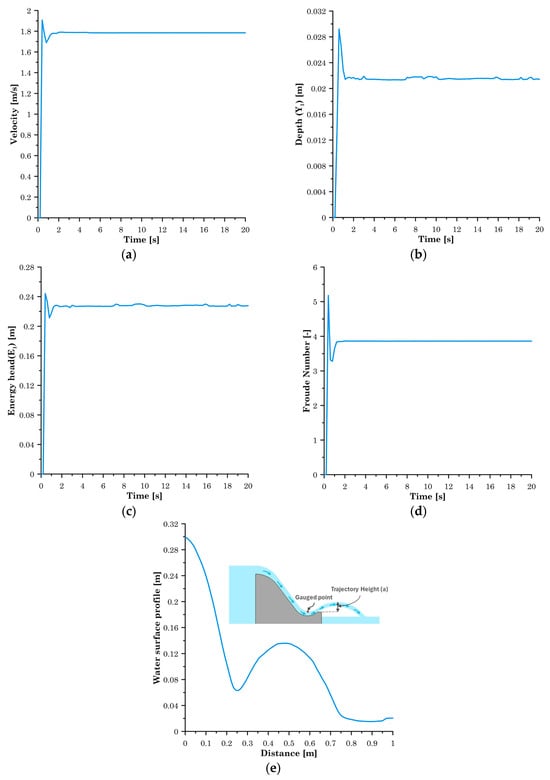
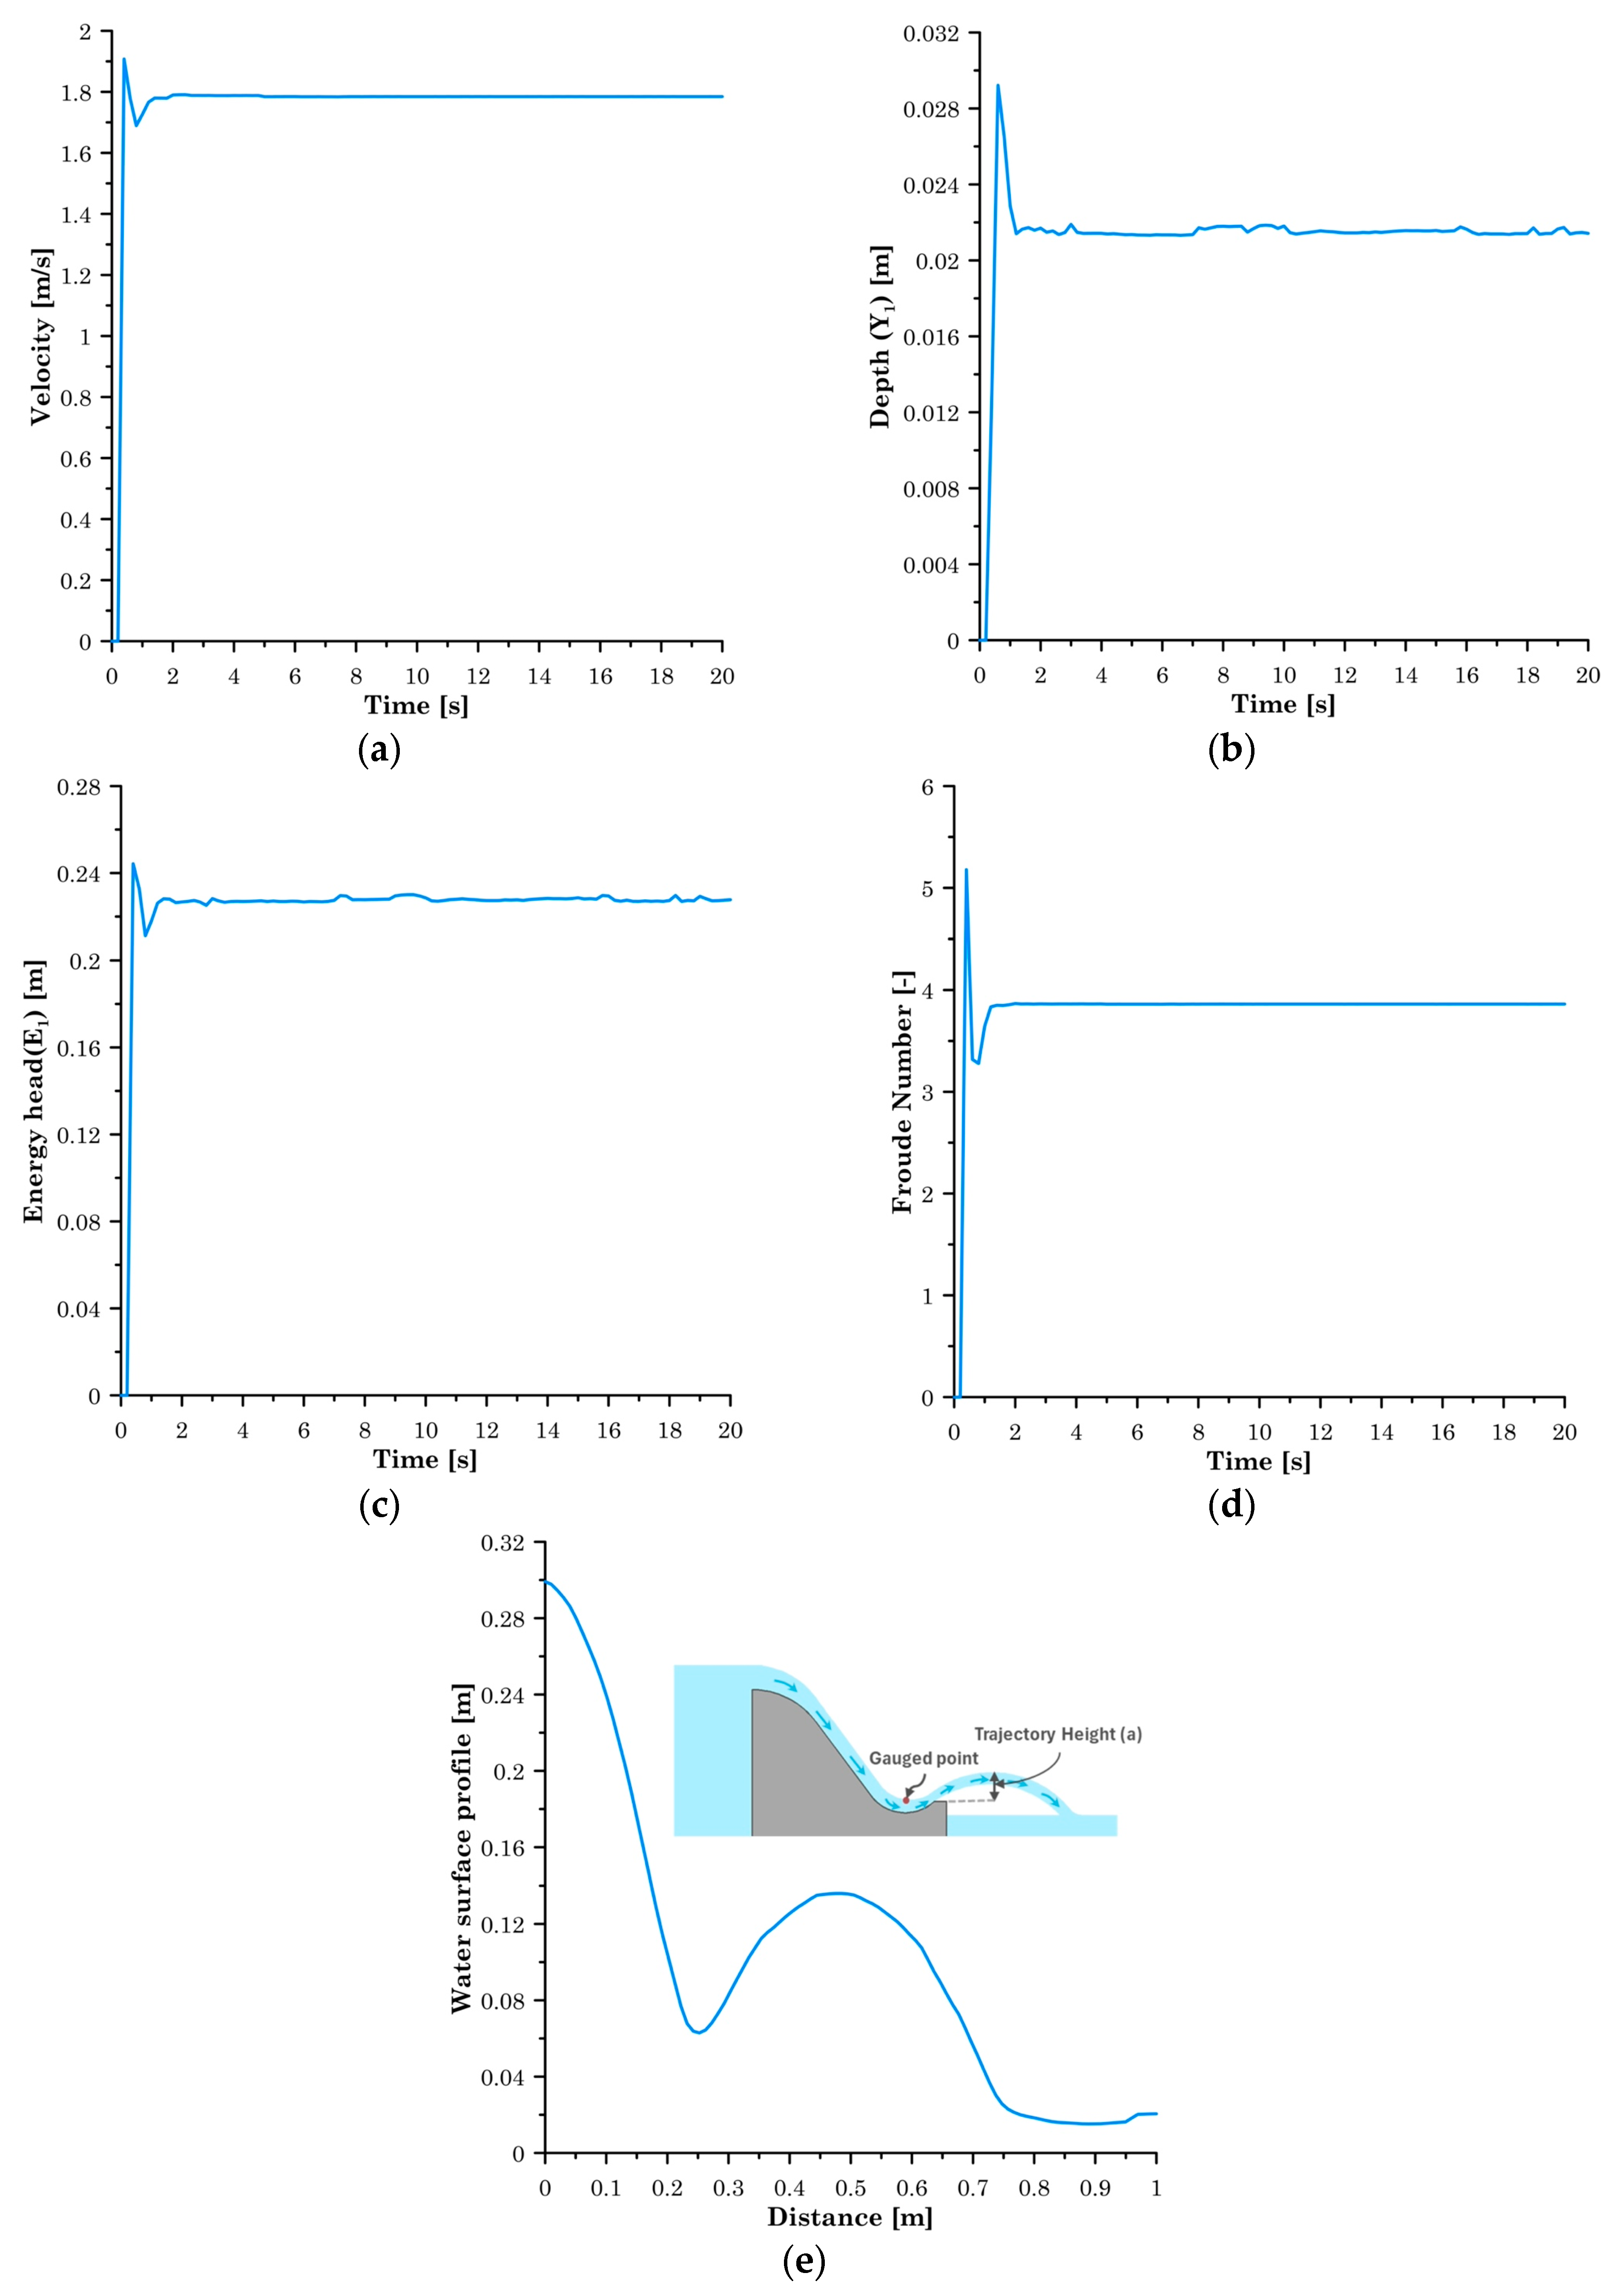
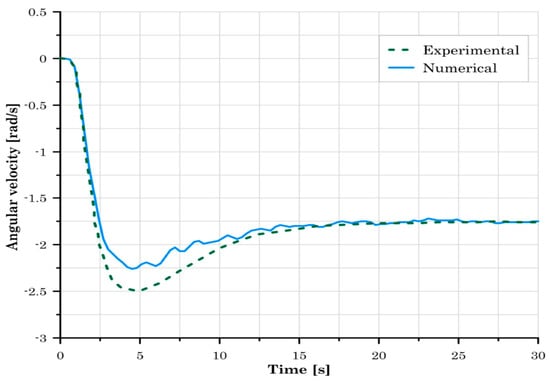
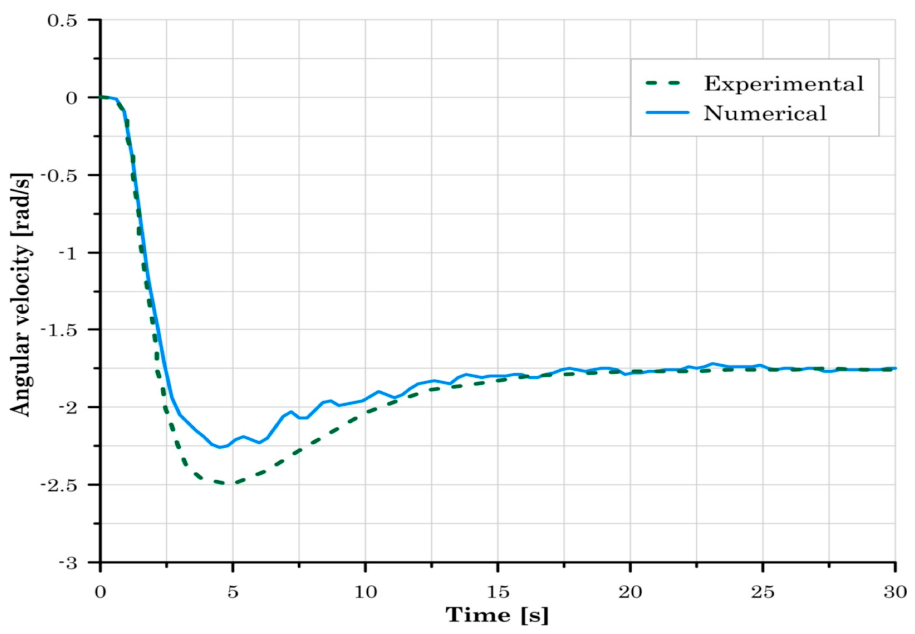
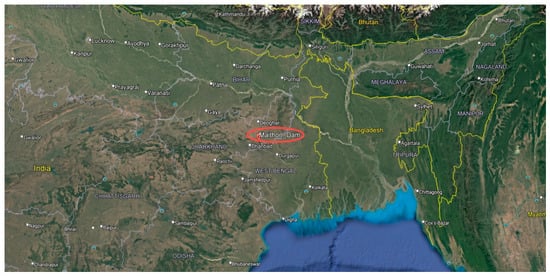
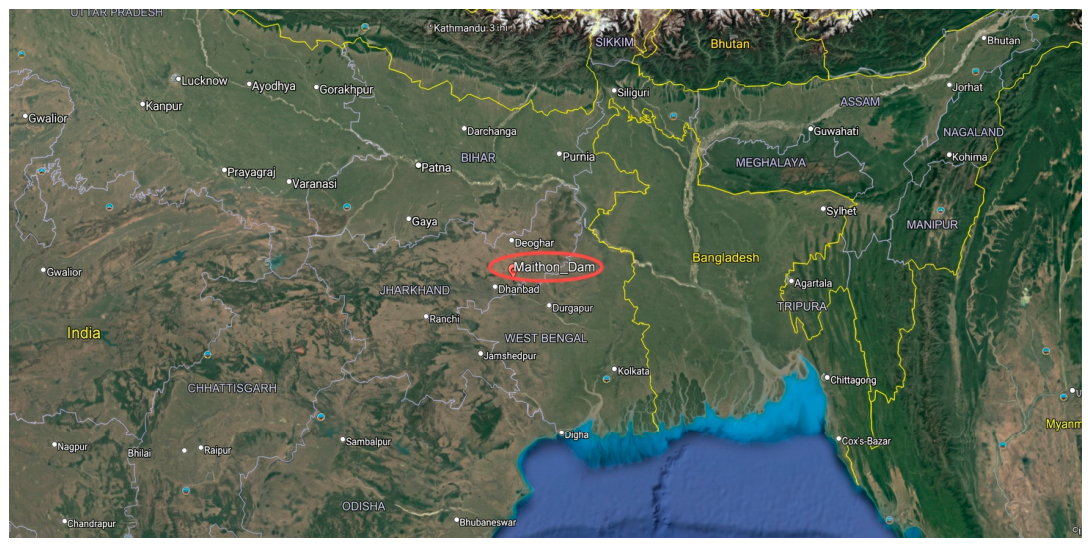
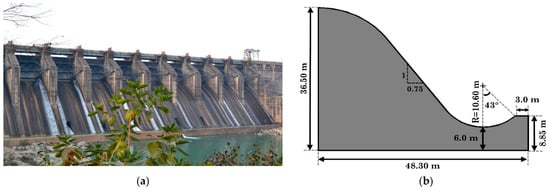
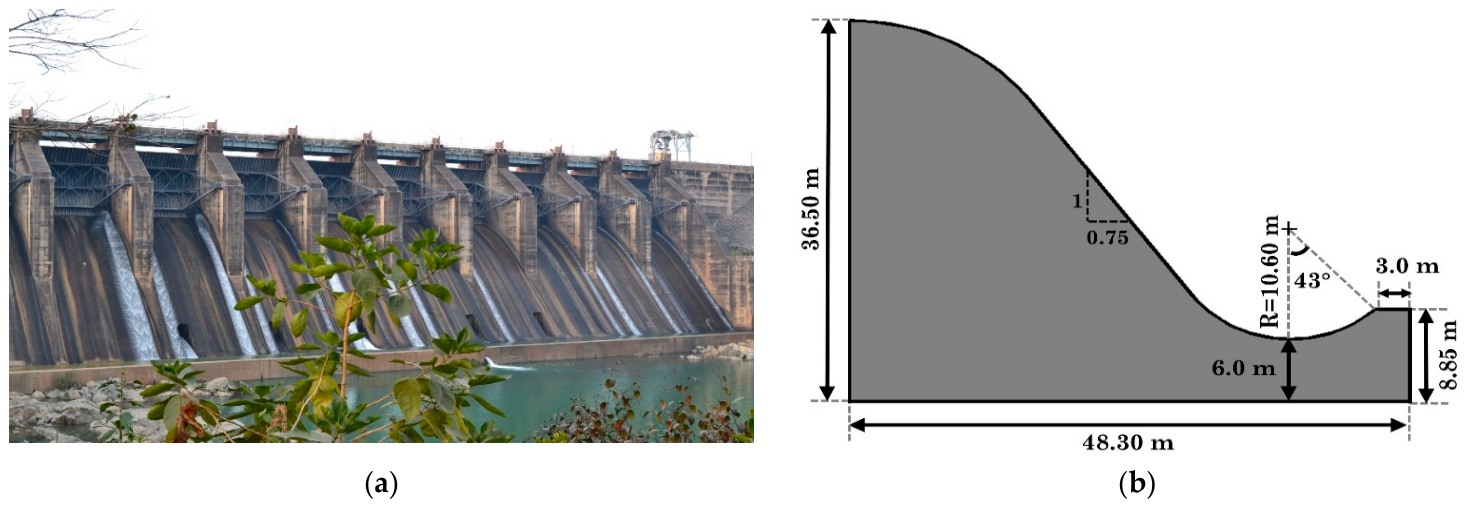
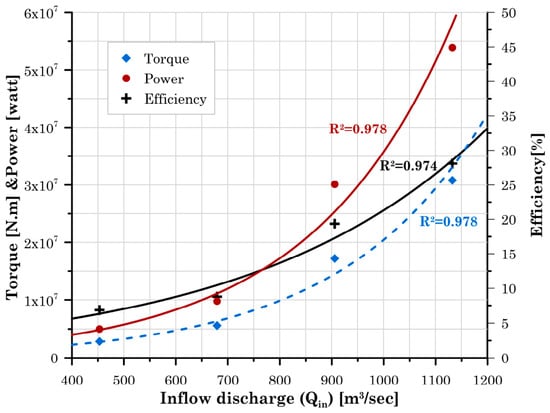
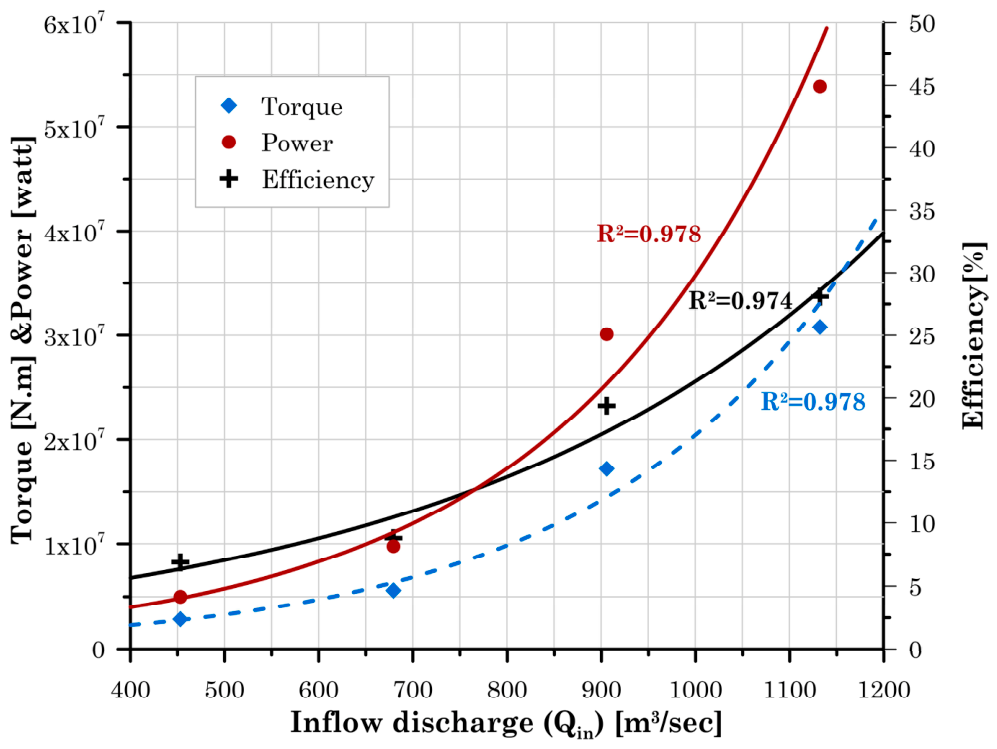
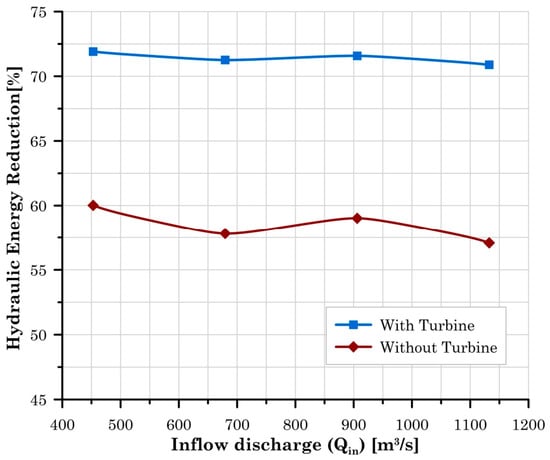
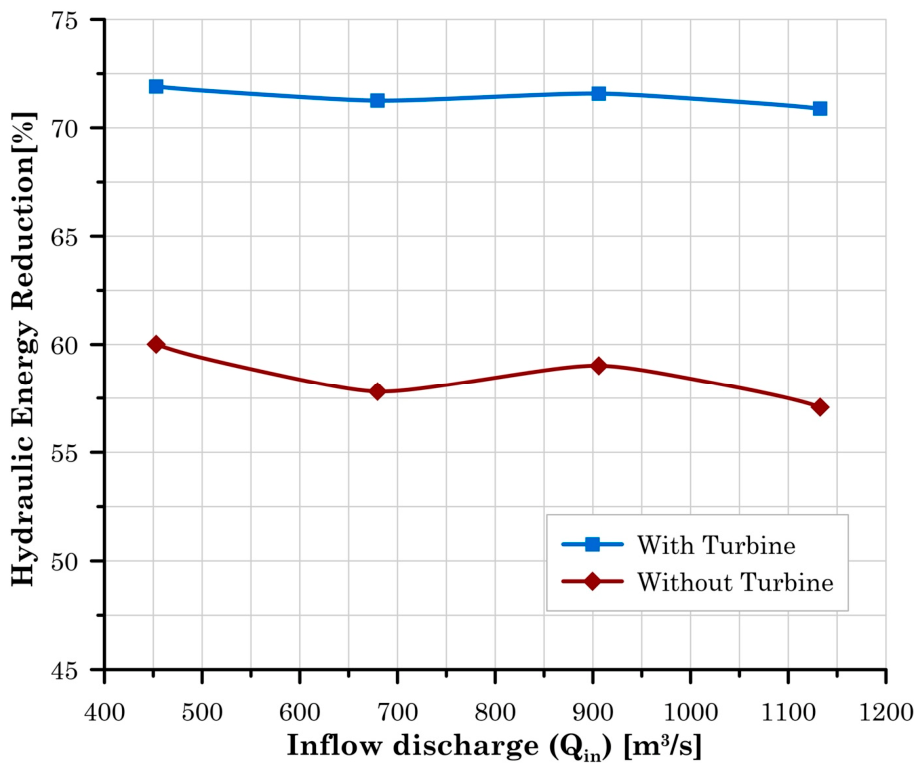
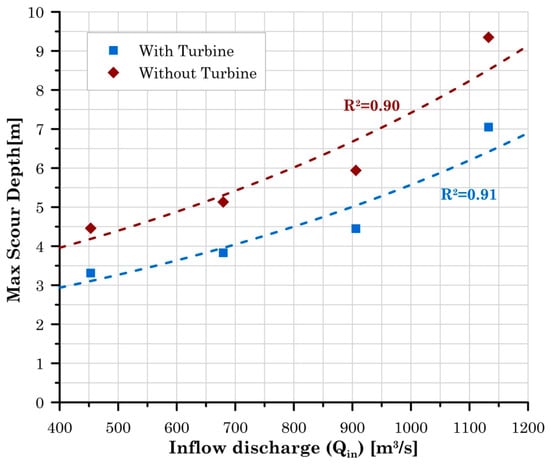
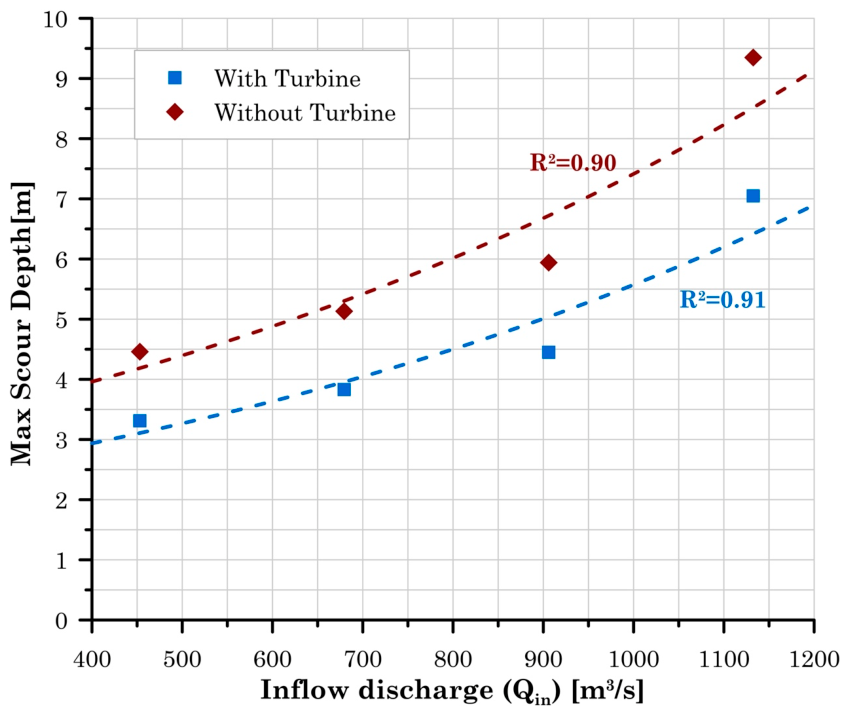
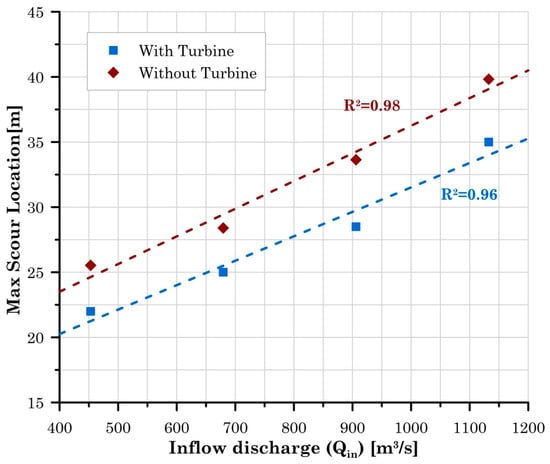
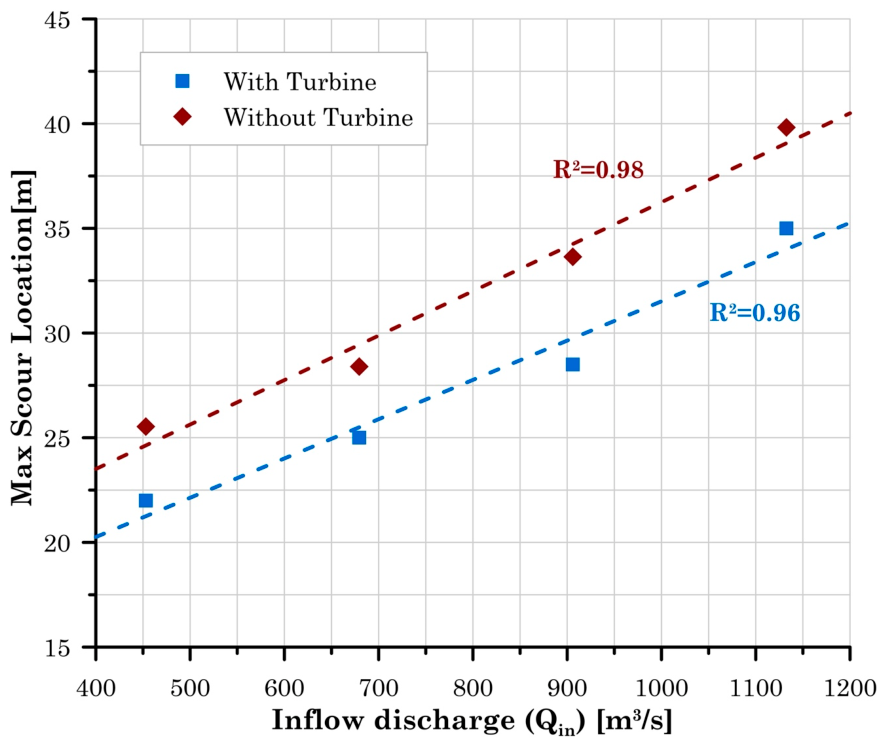
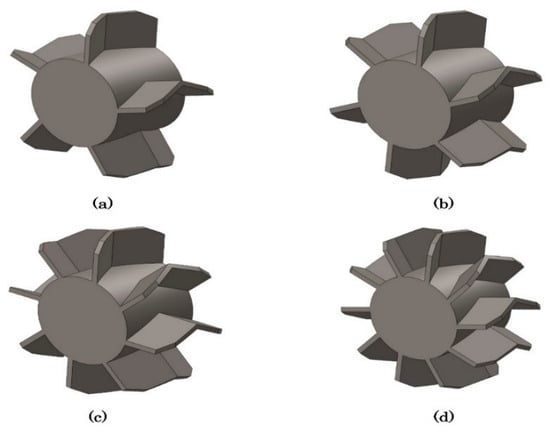
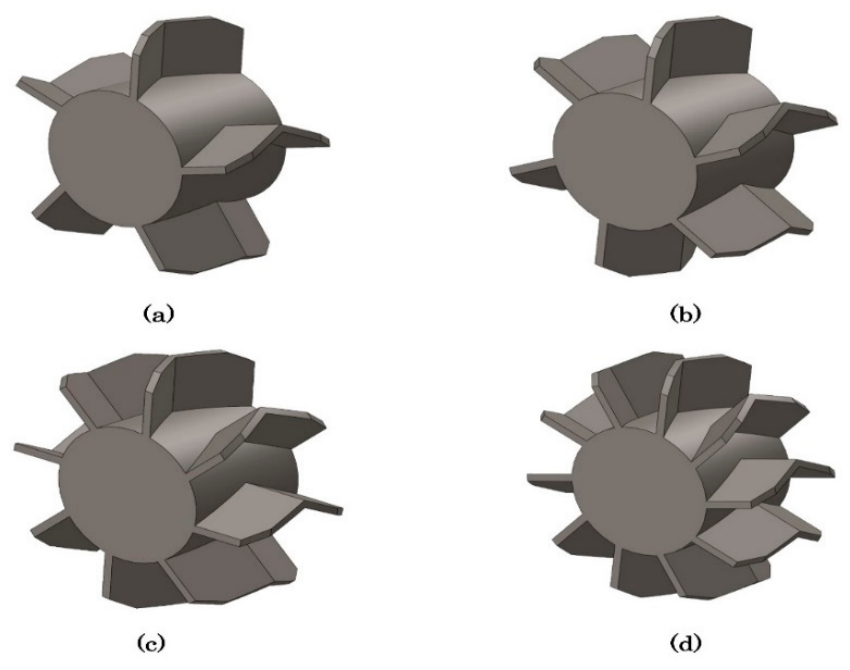
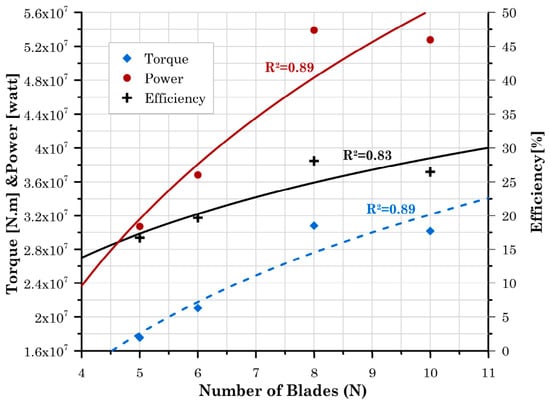
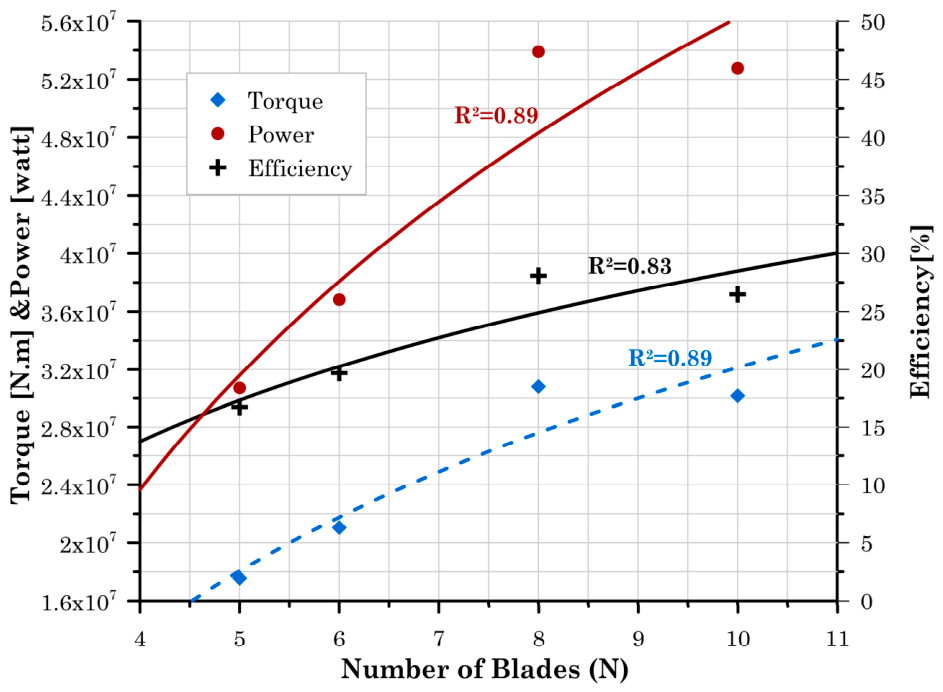
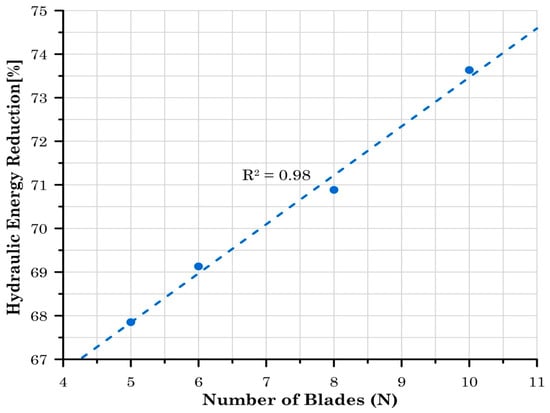
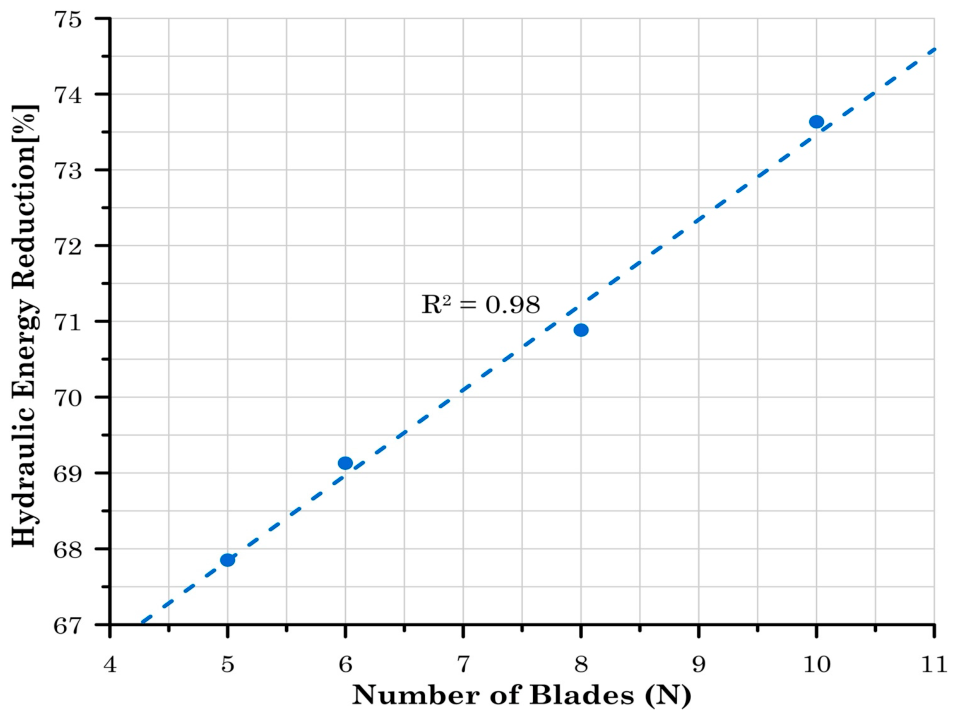
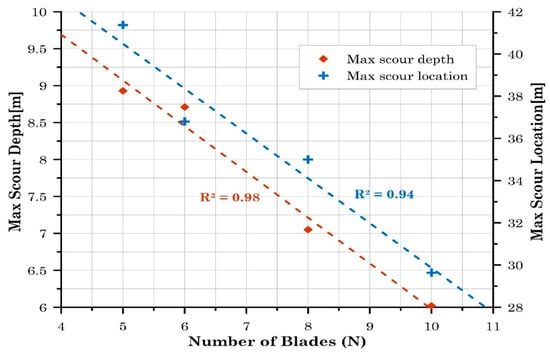
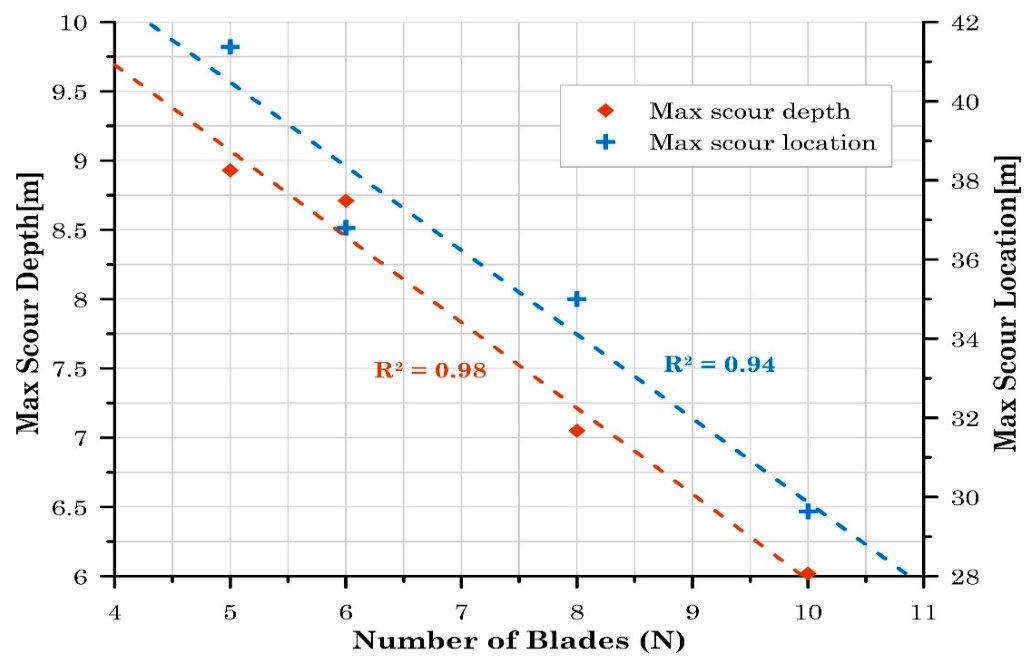
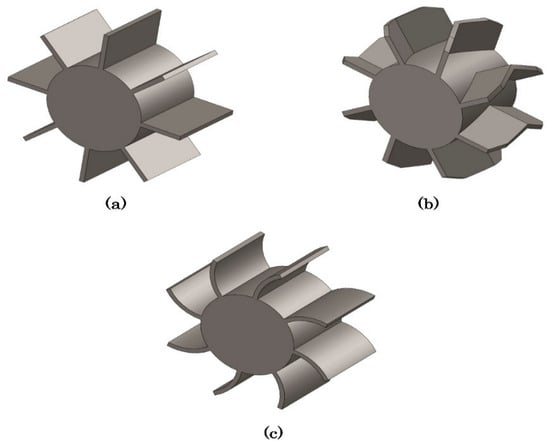
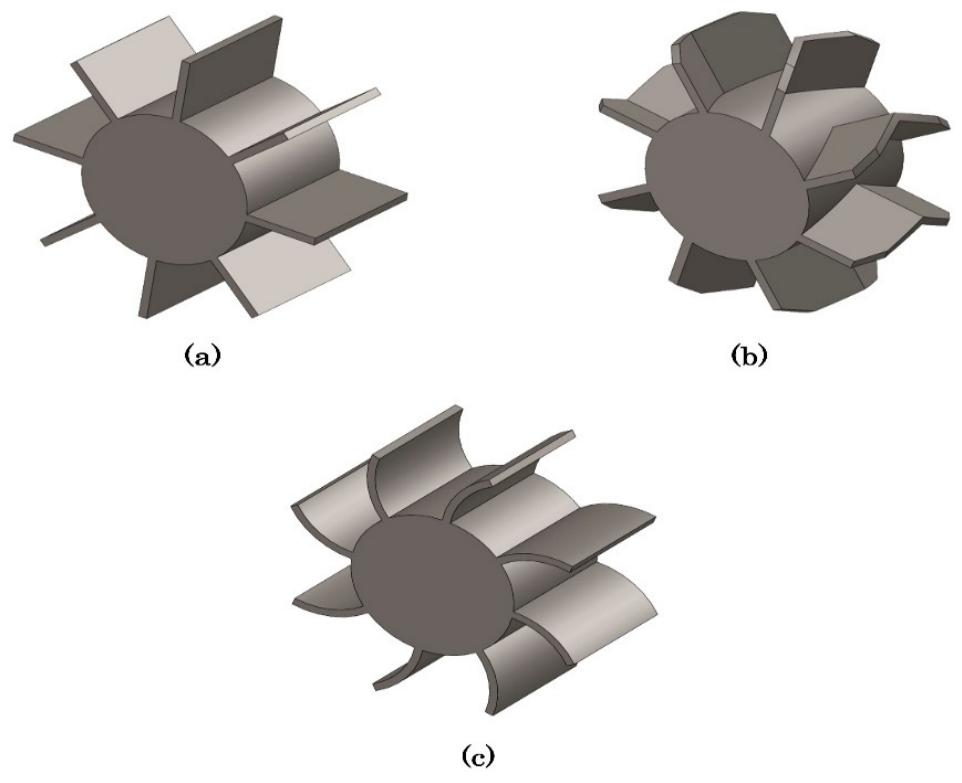
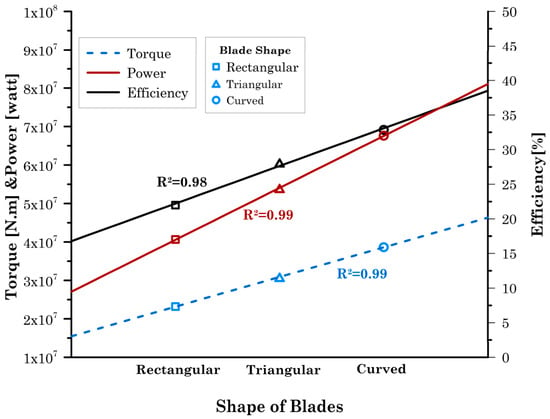
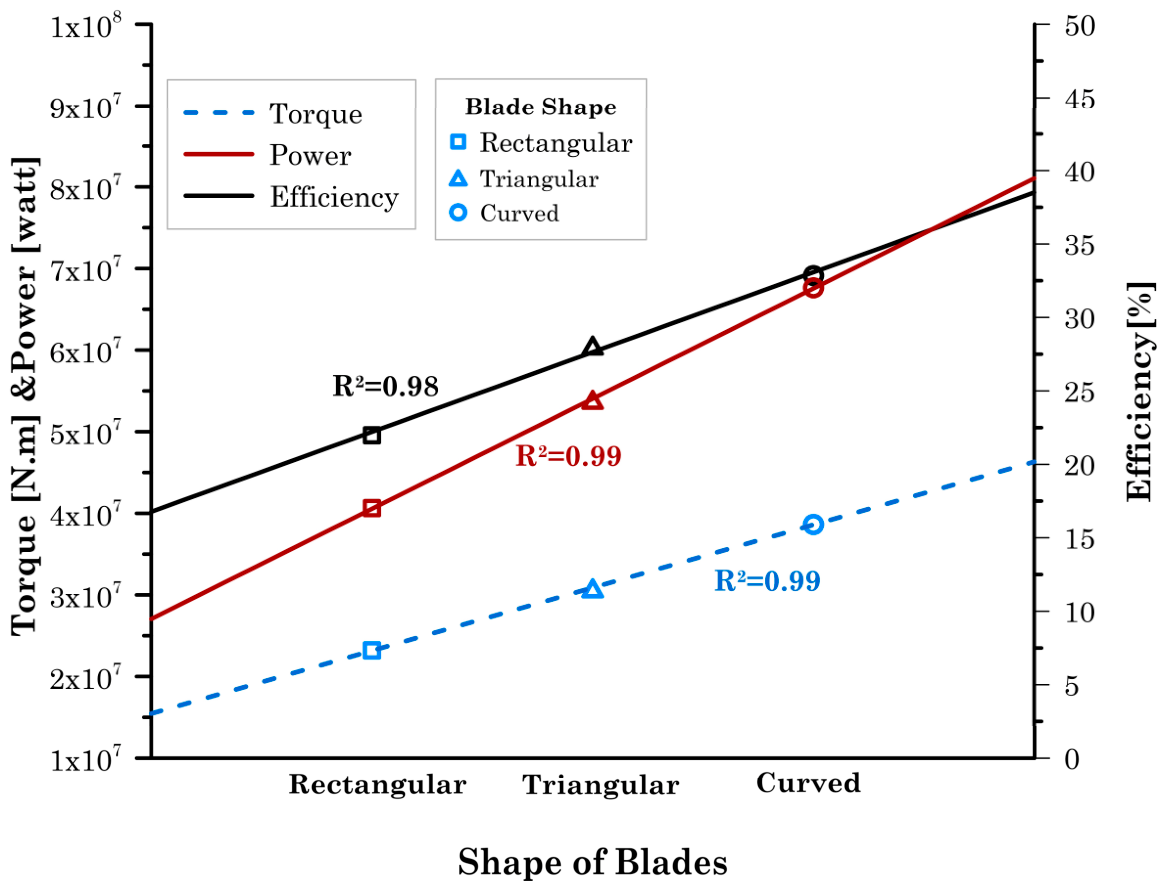
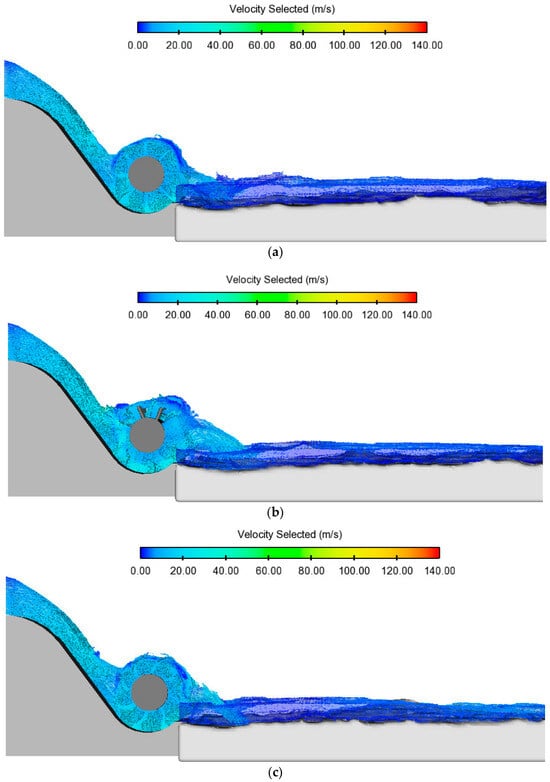
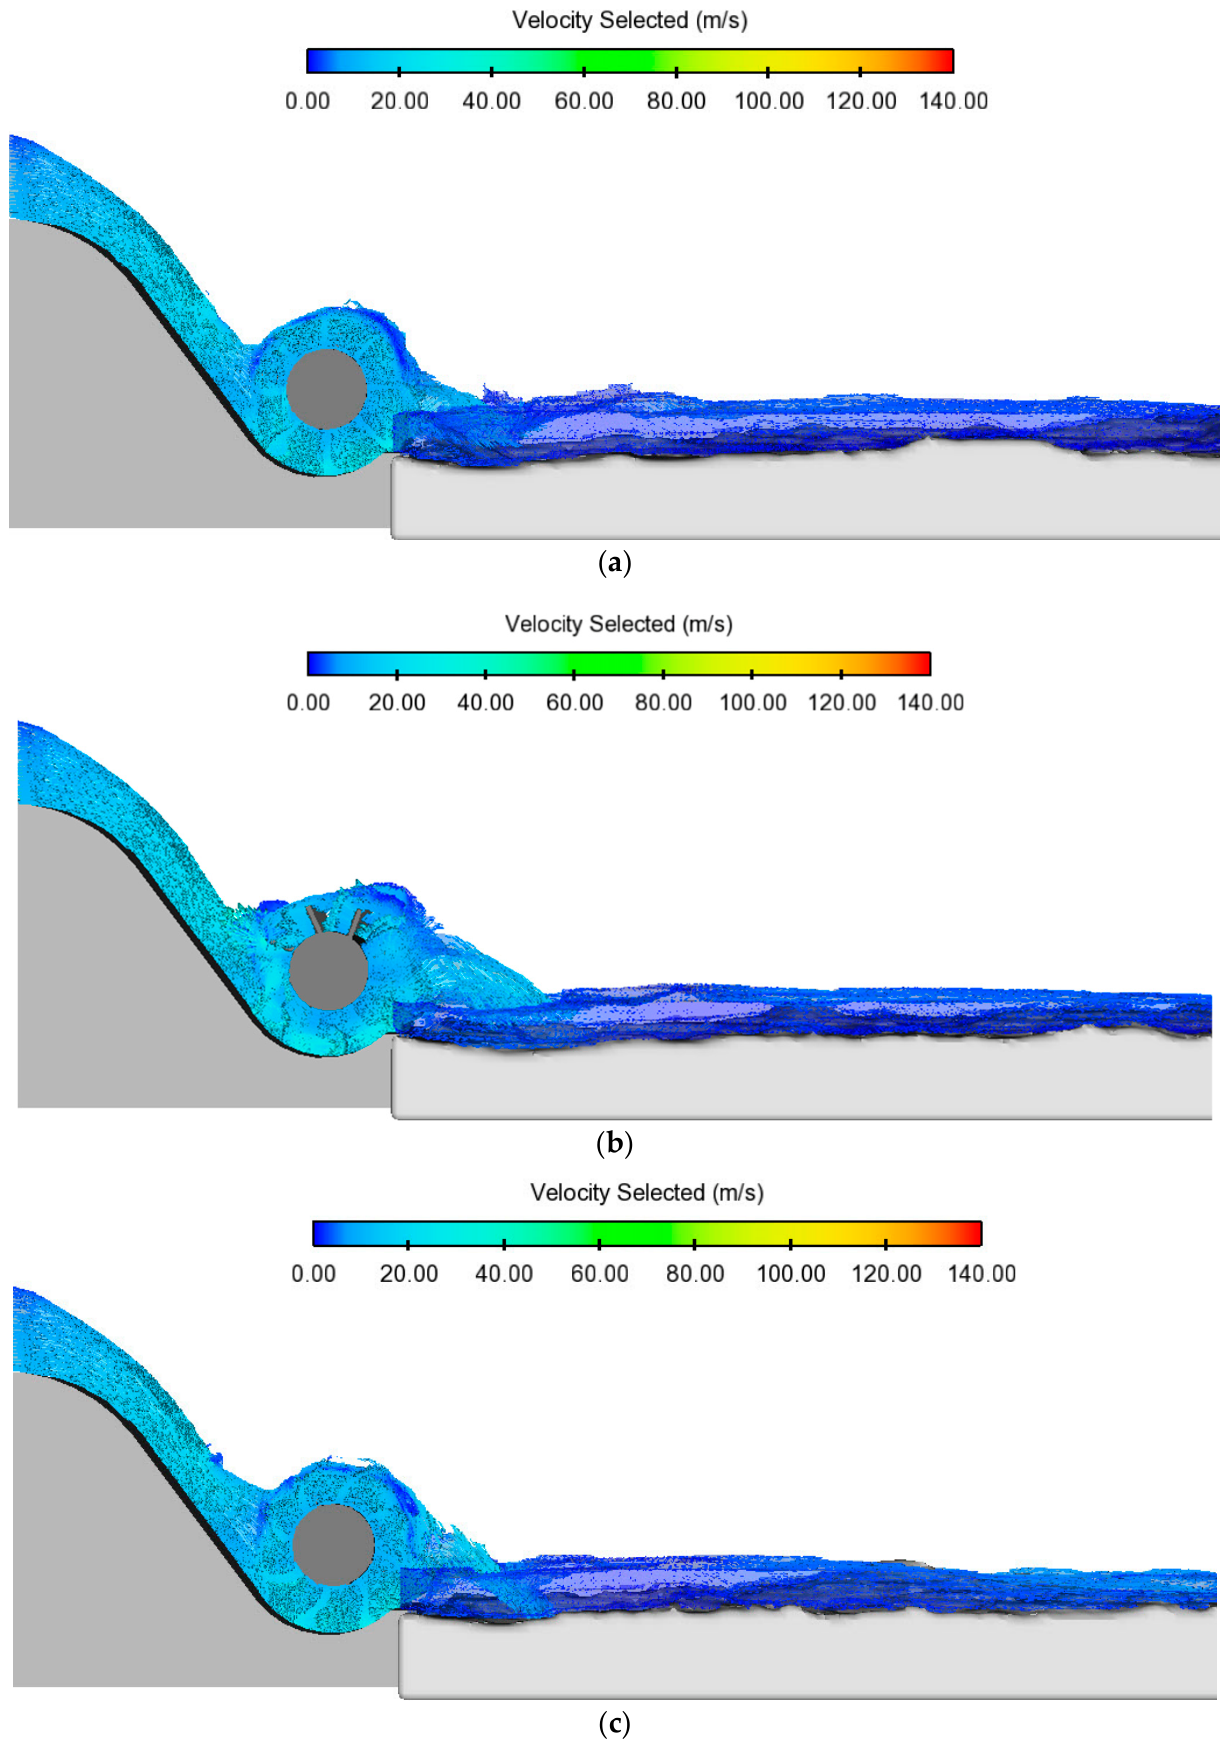
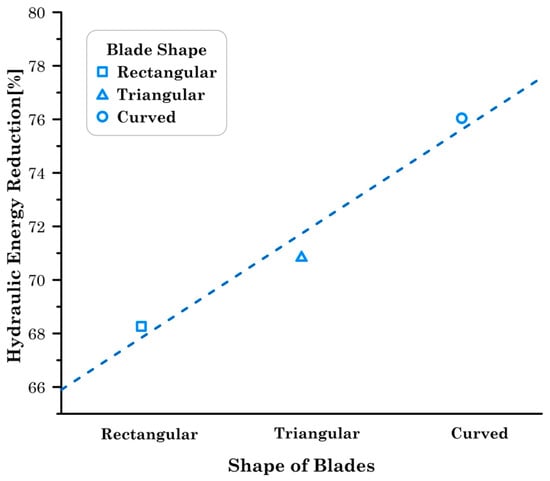
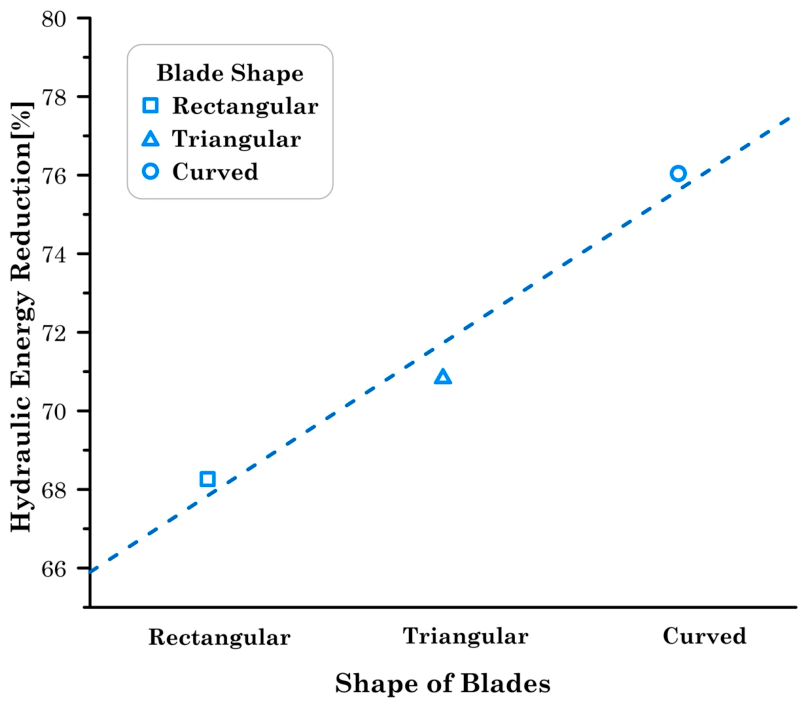
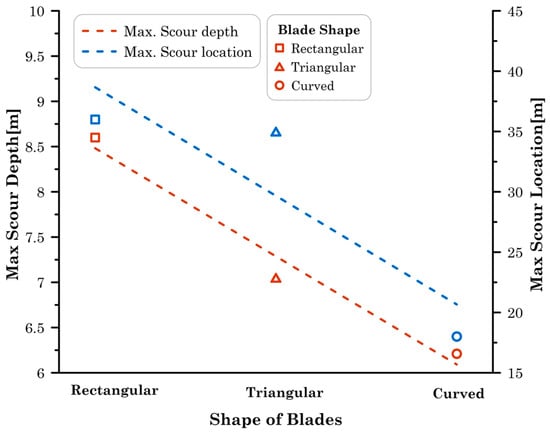
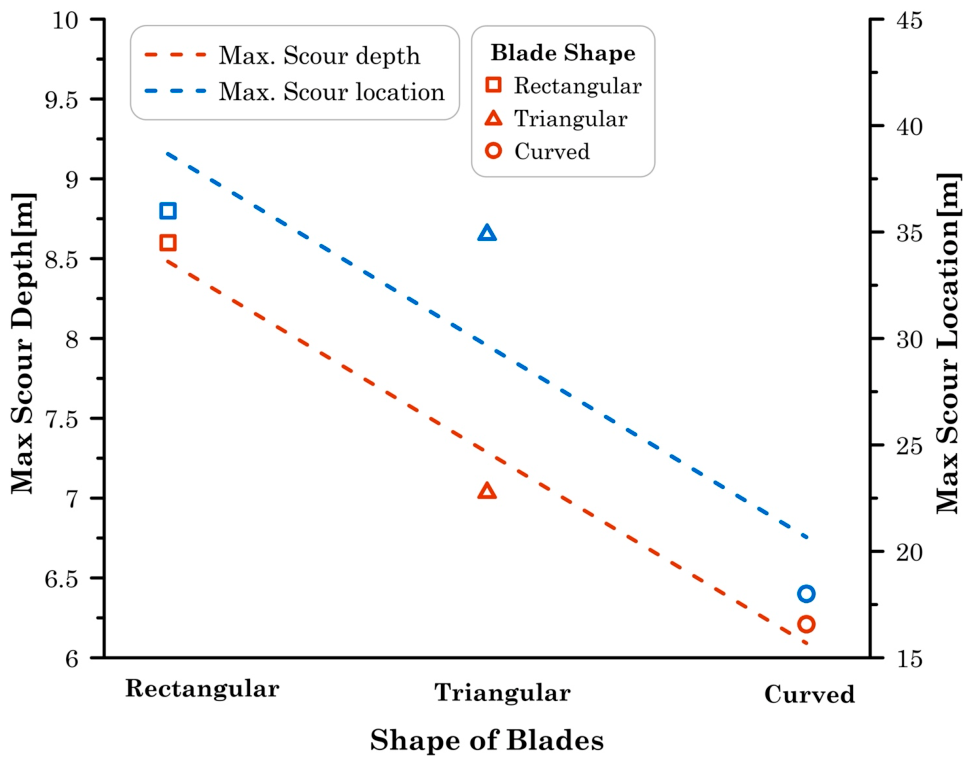

Disclaimer/Publisher’s Note: The statements, opinions and data contained in all publications are solely those of the individual author(s) and contributor(s) and not of MDPI and/or the editor(s). MDPI and/or the editor(s) disclaim responsibility for any injury to people or property resulting from any ideas, methods, instructions or products referred to in the content. |
© 2026 by the authors. Licensee MDPI, Basel, Switzerland. This article is an open access article distributed under the terms and conditions of the Creative Commons Attribution (CC BY) license.