


Abstract
Motivated by Industry 4.0, digital twin (DT) technology has emerged as a pivotal enabler of intelligent transformation in the construction industry, addressing challenges such as fragmented management and limited decision support. However, its practical adoption remains early and is constrained by multiple interdependent barriers. Existing studies often examine these barriers in isolation, overlooking their perceived interrelationships and relative influence pathways. To address this gap, we identify 28 barrier factors through a structured literature review and expert consultation, categorizing them into technical, personnel, organizational, policy, industry, and economic subsystems. We then hypothesize linkages among these barriers and develop a system dynamics model to simulate their relative influence on subsystem-level barrier accumulation. Simulation results show that technical, personnel, and industry barriers exert the strongest influence on DT implementation. Based on these findings, we propose mitigation strategies focusing on technological innovation, workforce capacity building, and industry-level standardization, with complementary organizational measures. This study provides preliminary insights and a prioritization reference for enhancing DT adoption and sustainable development in construction, and offers a foundation for future research on multi-factor interactions and adaptive strategies.
1. Introduction
In the context of globalization, the construction industry is experiencing a pivotal stage in its shift toward intelligent development. Statistics reported by the World Economic Forum indicate that the construction sector employs more than 100 million individuals globally and accounts for approximately 6% of the global GDP (Gross Domestic Product) [1]. Nevertheless, persistent problems, including low labor productivity, resource-intensive production practices, and substantial energy and resource consumption [2], continue to impede the industry’s progress toward a higher-quality and more sustainable development paradigm. In China, the Guidance on Promoting the Collaborative Development of Intelligent Construction and Building Industrialization, released by the Ministry of Housing and Urban-Rural Development in collaboration with other governmental bodies, clearly defines objectives aimed at advancing industrialization, digitization, and intelligence within the construction sector. The document further emphasizes key tasks, such as accelerating industrial upgrading, reinforcing technological innovation, enhancing informationization, and cultivating integrated industrial ecosystems [3].
To overcome these constraints and advance the industry, exploring novel solutions and innovative technologies is necessary to enhance the overall level of intelligence within the sector progressively. With ongoing digitalization, technologies such as the Internet of Things, building information modeling (BIM), digital twins (DTs), and blockchain are being applied to enhance productivity across various industries [4]. Among these approaches, DT technology, which provides a virtual representation of physical objects or processes, has emerged as a transformative tool with strong value creation potential.
Researchers and industry practitioners have increasingly recognized the potential of DT technology in the construction sector. Although this technology demonstrates promise for close integration between physical buildings and their corresponding virtual models, large-scale implementation in construction practice remains limited. DT platforms for buildings have not yet been widely adopted in practical projects. The present study conducts a structured review of the existing literature and further identifies perceived implementation challenges and barriers to building digital twins (BDTs) through expert interviews. A system dynamics model is then developed to explore the hypothesized interrelationships among barrier factors and to assess their relative influence through sensitivity analysis. Based on the simulation results, a preliminary set of prioritized intervention directions is proposed. It should be emphasized that, owing to the cross-sectional, perception-based nature of the expert data, the findings are exploratory and are intended to inform priority setting rather than to establish suggested interaction patterns.
Scope definition and terminology: In this study, “digital twin” (DT) refers to the general concept of a virtual representation of a physical system, as widely used across industries. “Building digital twin” (BDT) refers specifically to DT applications in the building and construction sector, characterized by integration of building information modeling (BIM) data, real-time sensor data, and operational information across the building lifecycle. The barriers examined in this study focus on construction-stage applications of BDT within building projects (residential, commercial, and public buildings) in the Chinese construction context, unless otherwise specified. Infrastructure projects—such as bridges, tunnels, and transportation networks—share certain technical foundations but are not the primary focus of this analysis; findings may not be directly generalizable to those domains without contextual adaptation. The terms “implementation,” “adoption,” and “application” are used interchangeably to refer to the introduction and operational use of DT/BDT technologies in real projects.
2. Literature Review
As a key facilitator of enterprise digital transformation and the digital economy, DT technology is characterized by broadly applicable theoretical foundations and technical architectures, with extensive relevance to engineering practice and interdisciplinary research. In the current stage of development in China, where multiple industries prioritize technological autonomy and digital security, the intrinsic advantages of DTs, namely efficient decision support and deep analytical capability, are well-positioned to promote both digital industrialization and industrial digitization, thereby expediting the achievement of national strategic objectives related to the digital economy.
2.1. Definition of Digital Twins
The origin of the DT concept can be traced to the 1960s, when engineers at NASA (National Aeronautics and Space Administration) developed comprehensive mathematical models and simulation systems to evaluate spacecraft performance under diverse operational conditions and to diagnose mission failures [5]. In 2002, Michael Grieves formally introduced the term “digital twin” during a presentation, describing it as “an information construct that serves as a dynamic proxy of a physical system” [6]. Later interpretations by Borth et al. characterize DTs as interconnected and synchronized digital replicas, namely virtual models, of physical assets that reflect the components and dynamic behaviors of systems and equipment within their operating environments across the full lifecycle [7]. Canedo defines DTs as digital representations of real-world objects, with emphasis on the corresponding physical entity [8]. Tao et al. further highlight that data linking the physical and digital domains, together with bidirectional dynamic interaction between physical objects and their virtual counterparts, constitute the core elements of DTs [9].
The notion of DTs is intrinsically broad and lacks precise boundaries, since it does not correspond to a single, well-defined technology but instead represents an integrated framework realized through the combination of multiple and heterogeneous technologies. To reduce this ambiguity and improve both usability and clarity in industrial contexts, it is necessary to formulate more specific and explicit definitions, implementation approaches, and sector-oriented application scenarios for DTs.
2.2. Building Digital Twin
The definition of DTs is grounded in their general applicability across industries rather than dependence on a specific sector. In response to the digital transformation requirements of the construction industry, BDTs integrate design-related data with operational information throughout the entire building lifecycle. This integration enables the dynamic representation of multidimensional data attributes that capture both historical evolution and real-time conditions of a building, thereby forming a fully traceable conceptualization of building digitalization [10].
It should be noted that several foundational DT concepts originated in manufacturing. While these manufacturing-based studies provide theoretical foundations, their transfer to construction requires adaptation due to differences in project characteristics (one-off designs, fragmented supply chains, multi-stakeholder collaboration). Therefore, manufacturing literature is cited here only for conceptual basis, and the barriers analyzed are specific to the construction context.
2.3. Applications in Construction
Since its emergence, DT technology has been extensively applied in manufacturing and related fields, covering complete product lifecycle processes. At present, an increasing number of scholars are examining the application of DT technology within the construction industry. In construction contexts, DTs facilitate closed-loop management throughout a structure’s lifecycle by enabling dynamic simulation, real-time monitoring, intelligent diagnosis, and strategy optimization through the creation of virtual counterparts of physical structures and the development of high-accuracy dynamic models.
During the planning stage, BIM is employed to specify architectural parameters and develop DT models, thereby supporting feasibility studies, trade-off analyses, and sustainability assessments, which contribute to informed planning decisions [11].
In the design stage, DTs are integrated throughout design processes [12]. Through the close coupling of building twin models with virtual reality technology, potential design defects can be identified and mitigated at an early stage, substantially enhancing design precision. This approach minimizes design modifications during construction, safeguards construction quality, and shortens overall project durations [13].
At the construction stage, DTs rely on GPS (Global Positioning System) for spatial positioning and schedule tracking, RFID (Radio-Frequency Identification) tag systems for monitoring the locations of materials and personnel, and intelligent sensor networks to enable real-time control of construction quality [14].
During the operation & maintenance stage, DTs improve operational efficiency by consolidating real-time data and supporting predictive maintenance of smart building systems through comprehensive analysis and forecasting. This capability effectively overcomes the limitations of traditional BIM in dynamic operation & maintenance scenarios [15].
The demolition stage, which has received comparatively limited attention from researchers [11], represents a crucial final phase that preserves extensive lifecycle data and information. By applying DT technology to establish historical building information models, valuable residual data can be economically retained within a virtual environment, providing essential support for the maintenance and renovation of existing buildings [16].
Recent scientometric analyses have mapped the evolution of DT research in construction, identifying key research clusters such as intelligent building representation, asset monitoring, and active building systems [17]. However, this body of work also highlights that the lack of standardized frameworks and interoperability protocols remains a persistent challenge.
2.4. Theoretical Framework
To provide a theoretical foundation for the classification and hypothesized interrelationships of barriers, this study draws on two complementary theoretical perspectives: the Technology–Organization–Environment (TOE) framework [18] and Socio-Technical Systems Theory [19].
The TOE framework posits that technology adoption in organizations is influenced by three contextual dimensions: the technological context, the organizational context, and the environmental context. Applied to the present study, this framework maps directly onto our six barrier subsystems. The technological context encompasses the technical barriers (B1–B12), which pertain to the availability, quality, security, and interoperability of the digital technologies that underpin DT implementation. The organizational context includes personnel barriers (B16–B21) and organizational barriers (B24–B26), which reflect the internal capabilities, culture, structure, and readiness of construction firms to adopt new technologies. The environmental context covers policy and regulatory barriers (B13–B15), industry barriers (B22–B23), and economic barriers (B27–B28), which represent the broader external forces—including government policies, industry standards, and market conditions—that shape the opportunities and constraints for DT adoption.
Socio-Technical Systems Theory complements the TOE framework by emphasizing that technical and social subsystems are inherently interdependent. According to this perspective, technological advancements cannot succeed without corresponding adaptations in human skills, organizational structures, and institutional arrangements, and vice versa. This theoretical lens provides a rationale for the hypothesized interactions among barrier categories:
(1) Technical barriers are expected to influence personnel and organizational barriers. For example, inadequate supporting technologies (B6) may reduce staff confidence and acceptance of DT tools (B17), while system instability (B8) may increase organizational maintenance burdens (B9) and complicate project coordination.
(2) Policy and economic barriers are treated as exogenous contextual drivers that shape industry and organizational conditions. For instance, insufficient governmental incentives (B13) may constrain investment in technology R&D (B27), while ambiguous regulations on data governance (B15) may deter organizations from committing to DT adoption.
(3) Personnel barriers serve as mediating variables that moderate the translation of technical potential into actual adoption outcomes. Even with mature technologies, inadequate knowledge levels (B16) or low acceptance of new technologies (B17) can impede effective implementation.
(4) Organizational barriers often act as amplifiers or attenuators of other barrier effects. High project complexity (B24) may exacerbate data integration challenges (B2, B26), whereas streamlined organizational processes may mitigate technical difficulties.
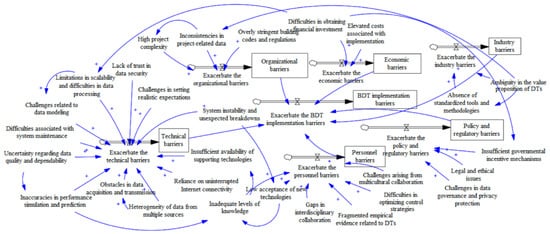
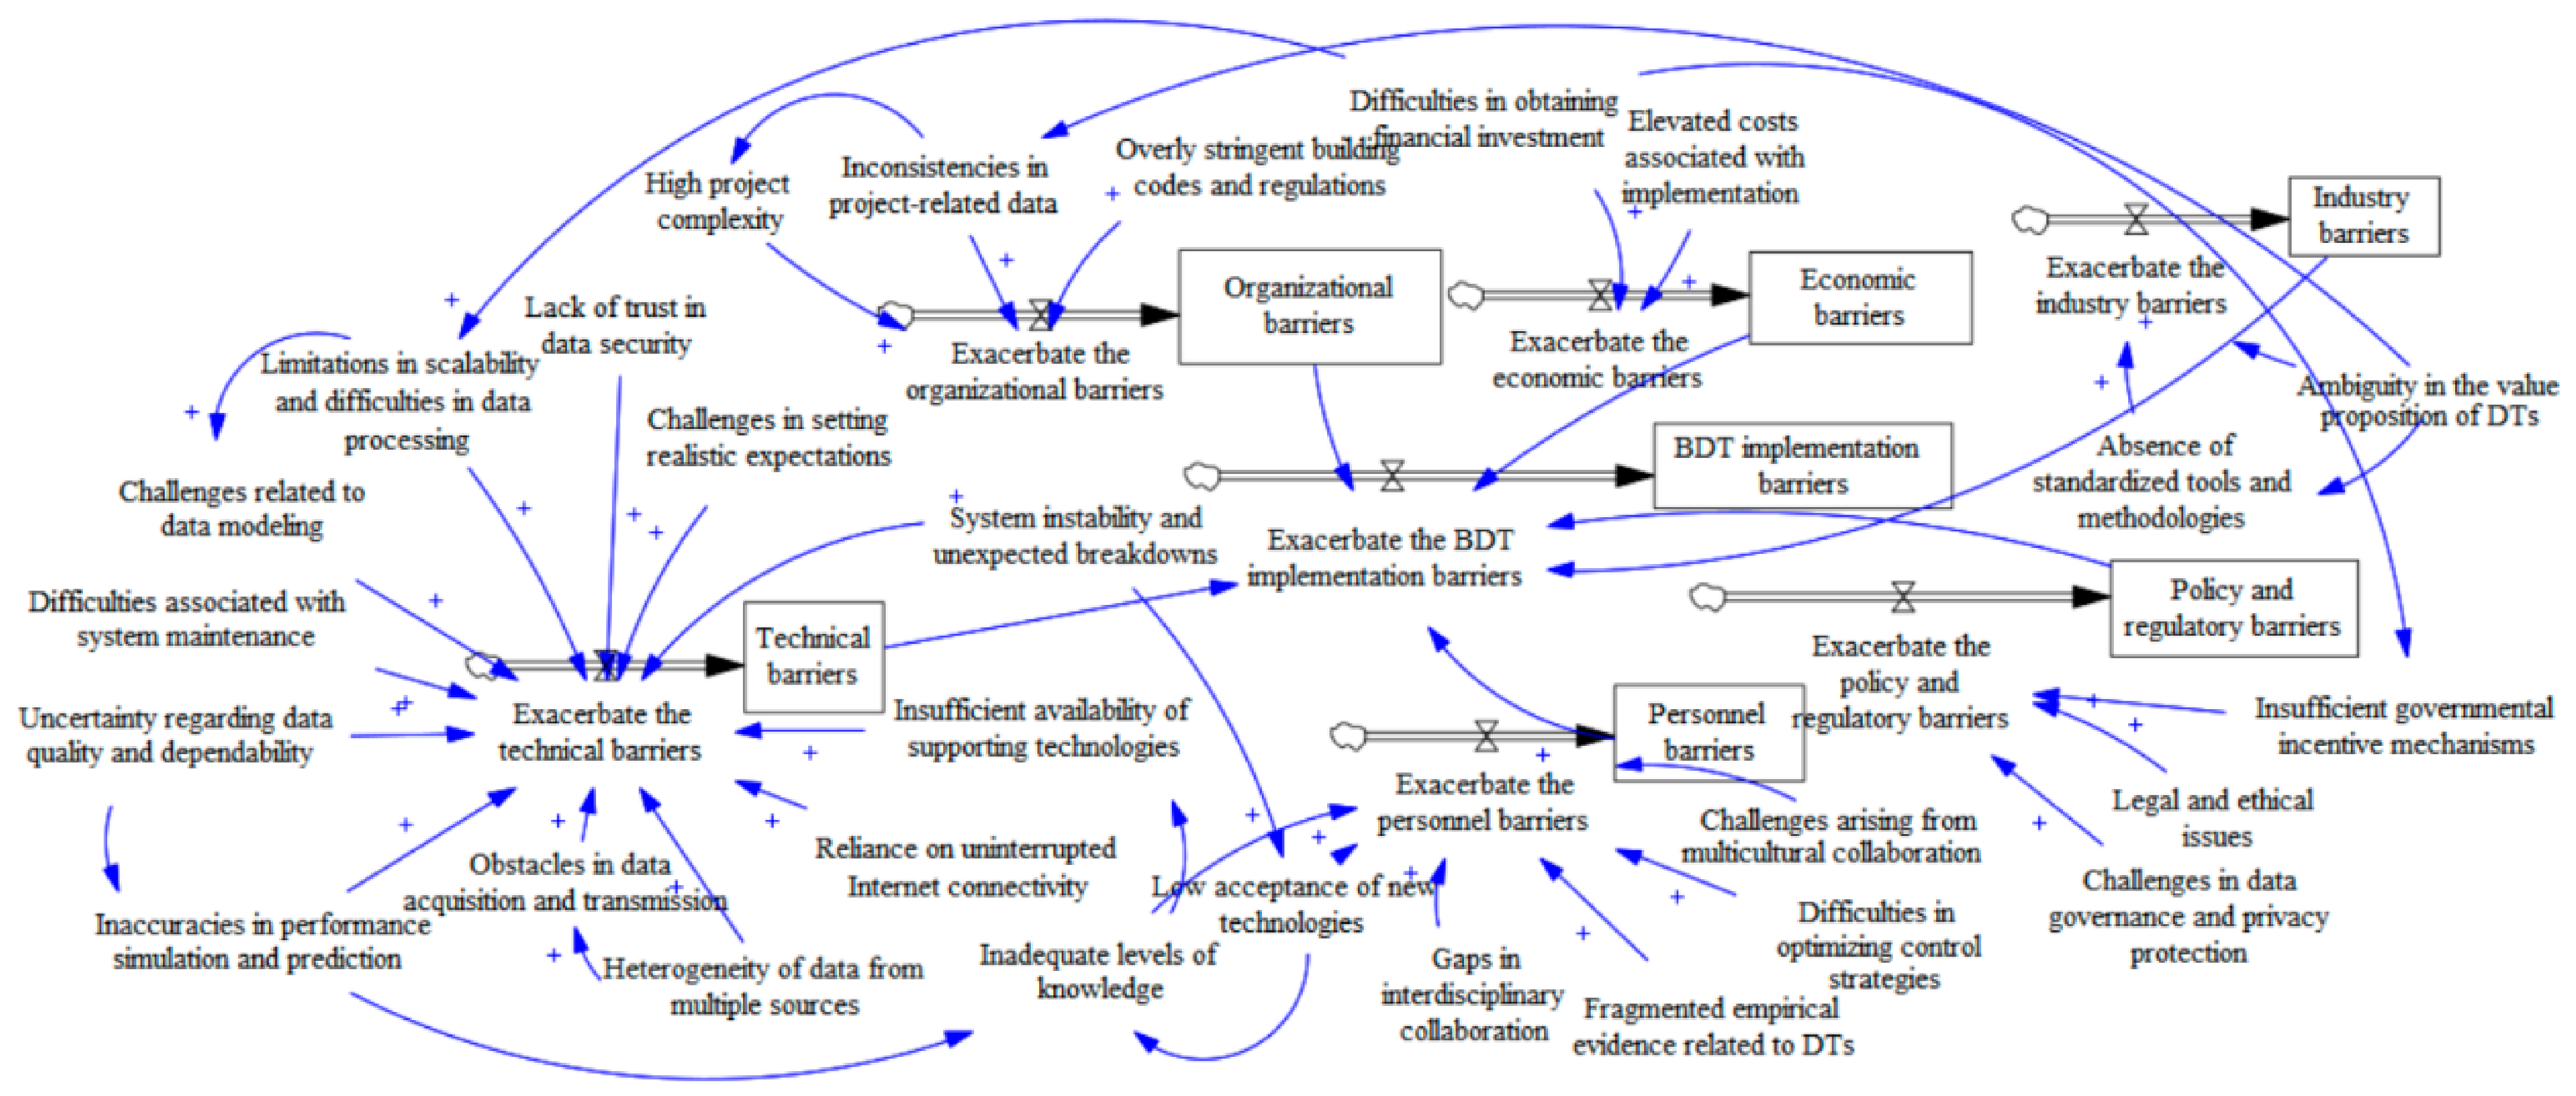
Based on this theoretical foundation, Figure 1 presents a perceived influence loop diagram that operationalizes these hypothesized relationships. The model treats policy and economic barriers as exogenous environmental factors, technical barriers as core technological constraints, personnel barriers as mediating organizational capabilities, and organizational barriers as moderating internal conditions. This theoretically grounded structure informs the selection of variables, the directionality of arrows in the perceived influence diagram, and the interpretation of simulation results.
Figure 1.
System Dynamics Model Illustrating Barriers to BDT Implementation.
3. Acquisition and Processing of Bdt Implementation Barrier Data
3.1. Bdt Implementation Barrier Identification
A survey of the existing literature indicates that the factors contributing to the limited practical adoption of DT technology in the construction industry have not been sufficiently examined. Although certain studies have acknowledged challenges and obstacles associated with the implementation of BDTs, relatively few investigations adopt a practice-oriented viewpoint or apply integrated qualitative and quantitative approaches to systematically examine these barriers. For example, Tuhaise et al. performed a systematic review of representative case studies and experimental configurations in construction to identify core technologies, research deficiencies, and future development directions for BDTs within the industry [20]. Comparably, Omrany et al. introduced a systematic framework to assess the influence of barriers on the successful implementation of DTs across specific countries or regions, thereby clarifying the principal challenges that restrict the effective application of DT technology in construction operations [21].
Current investigations into barriers affecting BDT implementation remain limited and frequently neglect the interdependent relationships among barrier factors. To address this shortcoming, the present study develops a system dynamics model to determine the critical barriers constraining BDT implementation through sensitivity analysis. By emphasizing barriers characterized by strong interconnectivity and extensive influence, this method supports the development of focused implementation strategies and corresponding policy measures, thereby encouraging the broader adoption of BDT technology.
The literature search was conducted on 28 January 2025, using CNKI and Web of Science. Language was restricted to English and Chinese. Document types were restricted to peer-reviewed journal articles, conference proceedings, and review articles. A supplementary search was conducted during revision to capture studies published since the initial search. No new barrier categories emerged, confirming the robustness of the 28-barrier taxonomy. Studies were included if they directly addressed DT barriers in construction, building, or civil engineering contexts; studies limited to manufacturing applications or general DT concepts without barrier analysis were excluded. The selection process followed a structured approach: initial identification, duplicate removal, title/abstract screening, and full-text assessment. To achieve a comprehensive collection of relevant studies, systematic searches were carried out using two major academic databases: China National Knowledge Infrastructure (CNKI) and Web of Science. These databases were selected due to their broad coverage of both domestic and international scholarly literature. To reduce omissions arising from variations in terminology and to enhance retrieval completeness, the searches employed the following keyword combinations: (“建筑业” OR “建筑”) AND (“障碍” OR “挑战”) AND (“数字孪生”) in CNKI, and ((“construction industry” OR “construction”) AND (“barriers” OR “challenges”) AND (“digital twin” OR “digital replica” OR “virtual twin” OR “virtual counterpart”)) in Web of Science [22]. No restrictions were imposed on publication year (search date: 28 January 2025). The initial search identified 386 records (CNKI: 18, Web of Science: 368). After title and abstract screening, 150 records remained. Of these, 105 were excluded, leaving 45 for full-text assessment. Full-text review resulted in 30 studies being included in the final qualitative synthesis. A flow diagram of the study selection process is provided in Figure S1. Based on the literature review and expert interviews, 28 barrier factors were identified and classified into six subsystems: technical barriers, policy and regulatory barriers, personnel barriers, industry barriers, organizational barriers, and economic barriers. Table 1 presents the complete list of barrier factors within each subsystem together with their corresponding sources.
Table 1.
Integrated Overview of Barriers Affecting BDT Development.
Quality assessment of the included studies was based on relevance to DT barriers in construction, clarity of barrier identification, and methodological rigor. No studies were excluded on quality grounds alone; rather, quality assessments were used to contextualize the strength of evidence for each identified barrier.
The number of studies addressing each subsystem in Table 1 was as follows: technical barriers (15 studies), policy and regulatory barriers (4), personnel barriers (9), industry barriers (4), organizational barriers (5), and economic barriers (4).
It should be noted that several barrier factors span more than one subsystem in practice. For example, “challenges in data governance and privacy protection” (B15) has both technical dimensions (data security, system trust) and regulatory dimensions (legal compliance, privacy law). It is classified under policy and regulatory barriers because its primary mitigation depends on legal and institutional frameworks rather than technical fixes alone. Similarly, “fragmented empirical evidence related to DTs” (B18) is classified under personnel barriers because it primarily reflects the limited knowledge base and research capacity of individuals and teams, although it also has industry-level dimensions. “Overly stringent building codes and regulations” (B25) is placed under organizational barriers because, in the Chinese construction context, these regulations are interpreted and enforced at the organizational project level, shaping internal compliance procedures. “Inconsistencies in project-related data” (B26) is classified as an organizational barrier because data consistency relies on inter-departmental coordination and standardized workflows within organizations, rather than purely technical solutions. The assignment of each factor to a primary subsystem is based on its dominant conceptual nature, with the understanding that cross-subsystem influences are captured through the perceived influence loop diagram (Figure 1) and the regression-based coefficients in the system dynamics model.
3.2. Data Processing and Analysis
The expert panel was recruited through personal invitations and professional online networks. The panel comprised 20 experts: 7 enterprise managers and 5 on-site project managers from construction enterprises of varying sizes, and 8 academic researchers from universities or research institutions. Their professional experience ranged from 1 to 17 years (mean = 10 years). All experts were located in China. The project types represented include residential buildings. All 20 experts completed the full questionnaire.
Each barrier factor was assessed by the experts along two dimensions: probability of occurrence and magnitude of impact. The probability dimension was evaluated using a five-point scale ranging from 1 (extremely unlikely) to 5 (extremely likely), while the impact dimension was likewise measured on a five-point scale from 1 (negligible impact) to 5 (severe impact). Higher scores represent a stronger perceived likelihood of occurrence or a greater level of impact associated with the barrier. The specific scoring standards are presented in Table 2.
Table 2.
Evaluation Criteria for Barrier Factors.
Prior to the consistency analysis, a formal outlier check was conducted using Z-scores (|Z| > 3) for all barrier factors. No extreme values were identified; therefore, no data points were adjusted. To evaluate the consistency of the expert scoring results, this study employed Kendall’s coefficient of concordance (W) with k = 28 factors and n = 20 experts (df = 27). The results yielded W = 0.692, χ2 = 373.756, df = 27, p < 0.001, indicating a strong degree of agreement among the experts and satisfying the reliability requirements for the scoring data used in this research.
3.3. Analysis of Hypothesized Interrelationships Among Variables
This section presents a qualitative perceived influence loop diagram (Figure 1) that synthesizes the hypothesized linkages among barrier factors based on the literature review and expert input. It is important to clarify that this diagram is intended to visually represent the conceptual structure of barrier interconnections and to guide the subsequent parameterization of the system dynamics model. However, not every individual barrier-to-barrier arrow depicted in Figure 1 is explicitly parameterized as a separate pairwise regression equation in the quantitative model. Instead, the system dynamics model operationalizes these interconnections at an aggregated level: auxiliary variables (individual barrier factors) influence rate variables (subsystem-level barrier accumulation) through regression-estimated coefficients. This approach captures the net effect of multiple barriers within each subsystem on the overall accumulation of constraints, rather than modeling each individual propagation channel separately. The distinction between the conceptual perceived influence diagram and the empirically parameterized model is further elaborated in Section 3.5 and Section 5 (Limitations).
Building upon the theoretical framework outlined in Section 2.4, the perceived influence directions depicted in Figure 1 are informed by the following premises: technical barriers and economic constraints are treated as primary drivers; personnel and organizational factors are conceptualized as mediating and moderating conditions, respectively; and policy and industry barriers are positioned as contextual enablers or inhibitors.
Within the system of barriers influencing DT implementation, hypothesized propagation effects arise both inside individual barrier subsystems (intra-subsystem) and between different subsystems (inter-subsystem). Regarding intra-subsystem perceived influence effects, interactions among factors within the same subsystem can amplify implementation difficulties. For instance, within the technical barrier subsystem, issues related to software maintenance, difficulties in model optimization, and delays in software updates may jointly contribute to reduced accuracy in performance simulation and prediction.
With respect to inter-subsystem perceived influence effects, barrier factors originating in one subsystem can trigger or intensify constraints in another. For example, within the policy and regulatory barrier subsystem, insufficient government incentives for DT technology can generate investment obstacles for technology development enterprises. In addition, within the technical barrier subsystem, a lack of trust in data security can give rise to legal and ethical issues. Consistent with the socio-technical systems perspective introduced in Section 2.4, these inter-subsystem influences reflect the inherent coupling between technical and social dimensions of DT implementation. Technical inadequacies (e.g., data heterogeneity, B2; system instability, B8) do not remain confined to the technical domain—they propagate into personnel challenges (e.g., reduced acceptance, B17) and organizational difficulties (e.g., increased coordination complexity, B24). Similarly, policy deficiencies (e.g., insufficient incentives, B13) create economic constraints (e.g., investment difficulties, B27), which in turn limit the availability of technical resources. This theoretical lens thus justifies modeling the barriers as an interconnected system rather than as independent factors, while also clarifying that the direction of influence flows primarily from environmental and technical factors toward organizational and human factors. Based on the identified perceived influence relationships among all barrier factors, a system dynamics model for BDT implementation barriers is established in this study, as shown in Figure 1.
3.4. System Dynamics Equations
It should be clarified that the present model adopts a simplified stock-flow structure without explicit stock-to-rate feedback loops. The stocks (subsystem barrier levels) accumulate through rate variables driven by auxiliary variables, but the stocks do not feed back into the rates in this version of the model. This design choice was made because the expert-based cross-sectional data do not provide a basis for estimating dynamic feedback parameters. The model is therefore best characterized as a stock-flow simulation with exogenous rate drivers rather than a fully closed feedback system. The term “system dynamics” is used here in a broad sense to refer to the stock-flow modeling approach, while acknowledging that the feedback structure is simplified. Future research with longitudinal data could incorporate stock-to-rate feedback to create a fully dynamic system dynamics model.
The configuration of this variable system follows the “Stock-Flow” structure proposed by Forrester (1961), the founder of system dynamics, aimed at characterizing the accumulation effects of risks within the system and their aggregated influence on subsystem-level constraints through quantitative equations. The formulation of auxiliary variables is based on other associated auxiliary variables together with their corresponding relative coefficients. Multiple linear regression analysis conducted in SPSS Statistics 27 is used to estimate these relative coefficients, which represent the interaction strengths among auxiliary variables. Rate variables describe the growth of barriers within each subsystem. The system dynamics representation of rate variables is composed of auxiliary variables and absolute coefficients, which are obtained through multiple linear regression analysis using the composite scores of the subsystems. State variables are defined by their associated rate variables and specified initial values. The mathematical expressions governing these variables are given as follows:
Auxiliary variable = ∑ (related auxiliary variable × relative coefficient)
Rate variable = ∑ (auxiliary variable × absolute coefficient)
State variable = INTEG (rate variable, initial value)
(1) Calculation of Auxiliary Variables
The system dynamics equations demonstrate that each of the six subsystems includes one state variable and one rate variable, while the barrier factors within each subsystem function as auxiliary variables. Parameter values are determined through expert scoring, which evaluates both the likelihood of occurrence and the magnitude of impact associated with each barrier factor. To reduce potential calculation errors, a combined approach integrating arithmetic and geometric means is adopted to quantify the barrier factors. The two resulting values are subsequently averaged within this method. To ensure the rigor of data processing, this study strictly controlled the consistency of expert scoring and the management of divergent opinions based on preliminary investigations. To address potential extreme outliers during the scoring process, the median method was employed for correction, aiming to eliminate the interference of individual subjective bias on the sensitivity of the subsequent model. In the specific calculation, to further minimize measurement errors, a hybrid approach integrating arithmetic and geometric means was adopted to quantify the barrier factors, followed by averaging the two resulting values. The corresponding formula is presented as follows:
Aij: Composite score representing the overall impact of the i-th barrier factor as evaluated by the j-th expert.
Pij: Rating assigned by the j-th expert to indicate the likelihood of occurrence of the i-th barrier factor.
Iij: Rating provided by the j-th expert to reflect the magnitude of impact associated with the i-th barrier factor.
The rationale for selecting this hybrid calculation method lies in the fact that the geometric mean component effectively captures the joint effect of occurrence likelihood and impact magnitude, while the arithmetic mean component serves to smooth extreme values. This combination ensures that the values of the auxiliary variables not only highlight the combinatory characteristics of risks but also maintain data robustness, thereby providing reliable initial inputs for the subsequent system dynamics simulation.
(2) Calculation of Relative Coefficients
As reflected in the system dynamics equation established in the preceding step, the interrelationships among barrier factors are highly complex, with certain influencing factors being simultaneously affected by multiple variables. Such complexity may lead to situations in which a single dependent variable is associated with several independent variables. In response to this characteristic, the present study computes coefficients using questionnaire-derived data, employs SPSS for data processing and regression analysis, and subsequently determines the corresponding coefficients and relational expressions. The regression equation is expressed as follows:
Y = β0 + X1β1 + X2β2 + … + Xtβt + ℇ
β0: Constant term.
Xt: Independent variables representing auxiliary variables that exert influence on the dependent variable.
βt: Relative coefficient corresponding to the t-th independent variable.
Y: Dependent variable, representing the auxiliary variable being influenced.
ℇ: Random error term of the regression model.
During the regression process, a multicollinearity diagnostic was performed on all independent variables. By examining the Variance Inflation Factor (VIF), it was ensured that the VIF for all selected variables remained below the threshold of 5. This effectively prevented the distortion of regression coefficients caused by high correlation among variables, ensuring the accuracy of perceived influence identification. The selection of independent variables was strictly based on the previously constructed feedback loop diagrams (CLD), ensuring the logical closure of the model’s internal feedback loops.
(3) Calculation of Absolute Coefficients
According to Equation (1), the composite scores assigned by individual experts to each barrier factor are obtained. On this basis, the composite score representing the impact magnitude of a barrier subsystem as evaluated by an expert can be calculated as follows:
m: Number of barrier factors contained within a given barrier subsystem.
Aij: Composite score representing the impact magnitude of the i-th barrier factor as evaluated by the j-th expert.
Aj: Composite score reflecting the impact magnitude of a barrier subsystem as assessed by the j-th expert.
Subsequently, absolute coefficients are derived by performing regression analysis on the comprehensive impact magnitude scores of the barrier subsystems evaluated by the experts, as calculated according to Equation (3). This coefficient reflects the contribution rate of the evolution from micro-level barrier factors to macro-level subsystem barriers. Through this two-stage regression, the aggregation of data from individual factors to the subsystem level is achieved.
(4) Calculation for Initial Values of State Variables
Composite expert scores for rate variables are calculated in accordance with Equation (3). Based on these results, the initial value of a state variable is determined by calculating the mean of expert evaluations of the rate variables, as shown in Equation (4).
m: Number of barrier factors within a given subsystem.
n: Number of participating experts.
Aj: Composite score indicating the impact magnitude of a barrier subsystem as assessed by the j-th expert.
A: Initial value of the state variable.
The arithmetic mean was selected as the initial value; in the absence of historical benchmark data, the mean evaluation from a multi-disciplinary expert group serves as the most reliable basis for characterizing the initial risk stock of the system. Sensitivity testing demonstrated that the overall trend of system evolution remained stable when initial values fluctuated within a range of ±10%, thereby proving the robustness of the model regarding this parameter selection.
3.5. Parameter Assignment for Equations
Before presenting the specific equations, it should be noted that all regression coefficients reported in this section are estimated at the subsystem level. That is, the auxiliary variables belonging to the same subsystem are regressed onto the rate variable of that subsystem. This approach yields aggregate coefficients that reflect the average contribution of each barrier factor to the overall barrier accumulation rate within its subsystem. These coefficients do not represent pairwise influence relationships between individual barriers. Rather, they should be interpreted as statistical associations derived from expert perceptions, capturing the relative strength of each barrier’s influence on the subsystem-level risk accumulation.
Based on the formulas described above, the collected data are processed to calculate the composite scores of barrier factors as evaluated by experts. On this basis, the system dynamics equations corresponding to auxiliary variables, rate variables, and state variables are formulated as follows:
(1) System Dynamics Equation for Auxiliary Variables
When an auxiliary variable is affected by other variables, its specific value can be determined using the system dynamics formulation for auxiliary variables. Relative coefficients representing the interdependencies among auxiliary variables are obtained through multiple linear regression analysis, as expressed in Equation (2). For instance, the auxiliary variable Inadequate levels of knowledge is defined as −0.339 + 0.529 × Inaccuracies in performance simulation and prediction + 0.606 × Low acceptance of new technologies.
When other variables do not influence an auxiliary variable, its system dynamics equation is equal to its initial value. As an example, lack of trust in data security is assigned a value of 4.541.
(2) System Dynamics Equation for Rate Variables
Rate variables describe the growth of barriers within each subsystem and are calculated based on the composite scores of the subsystems. The absolute coefficients that characterize the relationships between rate variables and auxiliary variables are obtained through multiple linear regression analysis, where the values calculated according to Equation (3) serve as independent variables and the auxiliary variables corresponding to each subsystem act as dependent variables. For example, the rate of increase in barriers within the personnel subsystem is expressed as 0.289 × low knowledge level + 0.280 × low acceptance of new technologies + 0.253 × fragmented empirical evidence on DTs + 0.281 × gaps in interdisciplinary collaboration + 0.254 × difficulties in optimizing control strategies + 0.233 × challenges arising from multicultural collaboration. The physical significance of the absolute coefficient represents the change in the subsystem risk flow induced by a unit change in the corresponding auxiliary variable.
(3) System Dynamics Equation for State Variables
The system dynamics equations for state variables are formulated using the INTEG function in Vensim PLE, which incorporates both the increment of barriers within a given subsystem and the initial value of the corresponding state variable. For instance, the state value of the technical barrier subsystem is expressed as INTEG (increment of barriers in the technical barrier subsystem, 3.931).
In the subsequent sensitivity analysis, a controlled variable method was adopted: specifically, only one auxiliary variable was reduced by one unit at a time while maintaining all other variables at their initial levels. The rationale for selecting a “one-unit reduction” is to facilitate the observation of differences in contribution among various factors under a uniform dimension, thereby identifying the transmission paths of key barrier factors. By following the computational procedures described above, the system dynamics equations for all auxiliary variables, rate variables, and state variables are obtained. These equations, together with the parameters that characterize the interactions among barrier factors, are subsequently embedded into a stock flow diagram model to complete the overall model framework. Complete regression outputs—including coefficients, standard errors, t-values, p-values, R2, adjusted R2, F-statistics, and VIF diagnostics for all models—are provided in Tables S1 and S2, and Supplementary File S1. Given the modest sample size (n = 20), the regression coefficients should be interpreted as exploratory estimates of relative influence rather than precise effect sizes. This limitation is acknowledged in Section 5.
4. Simulation Analysis and Discussion
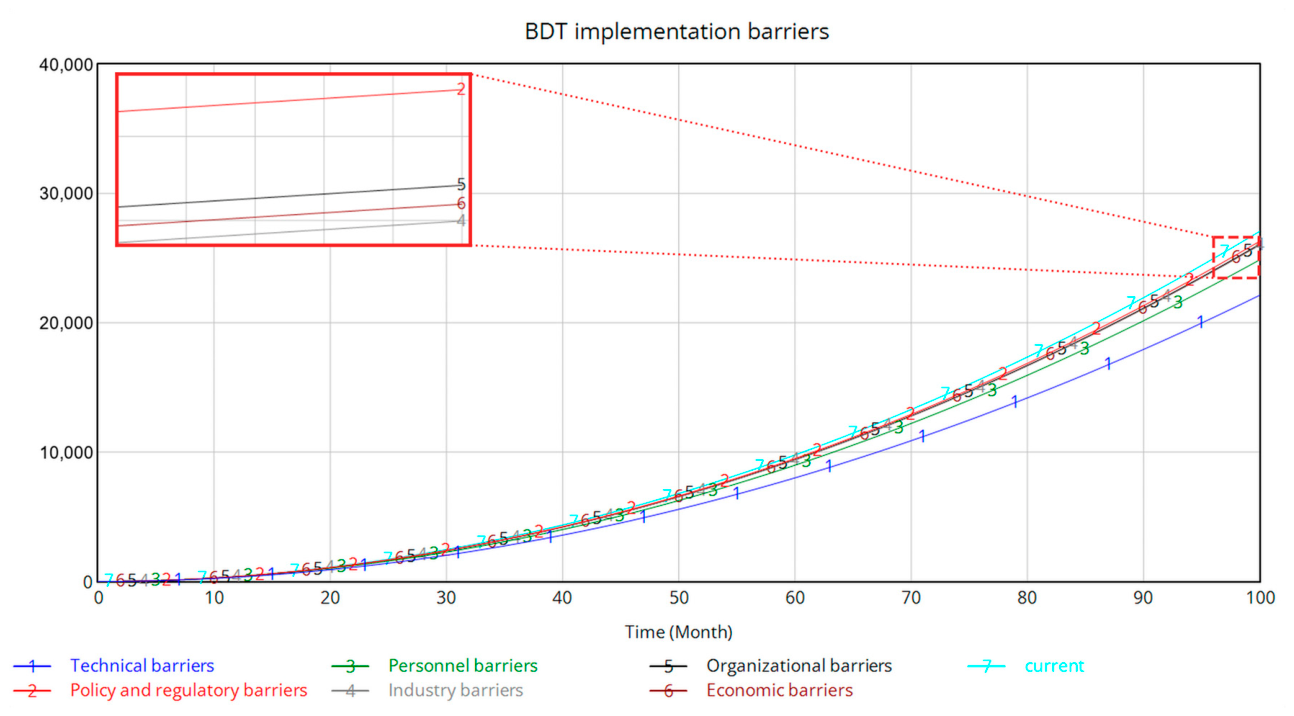
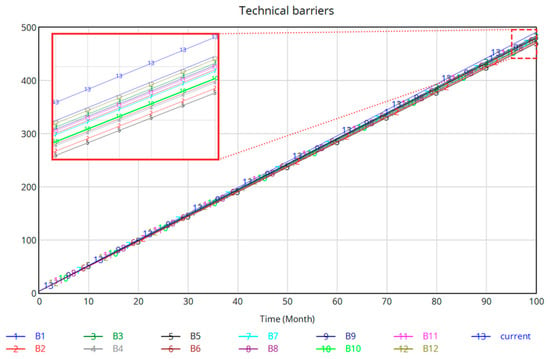
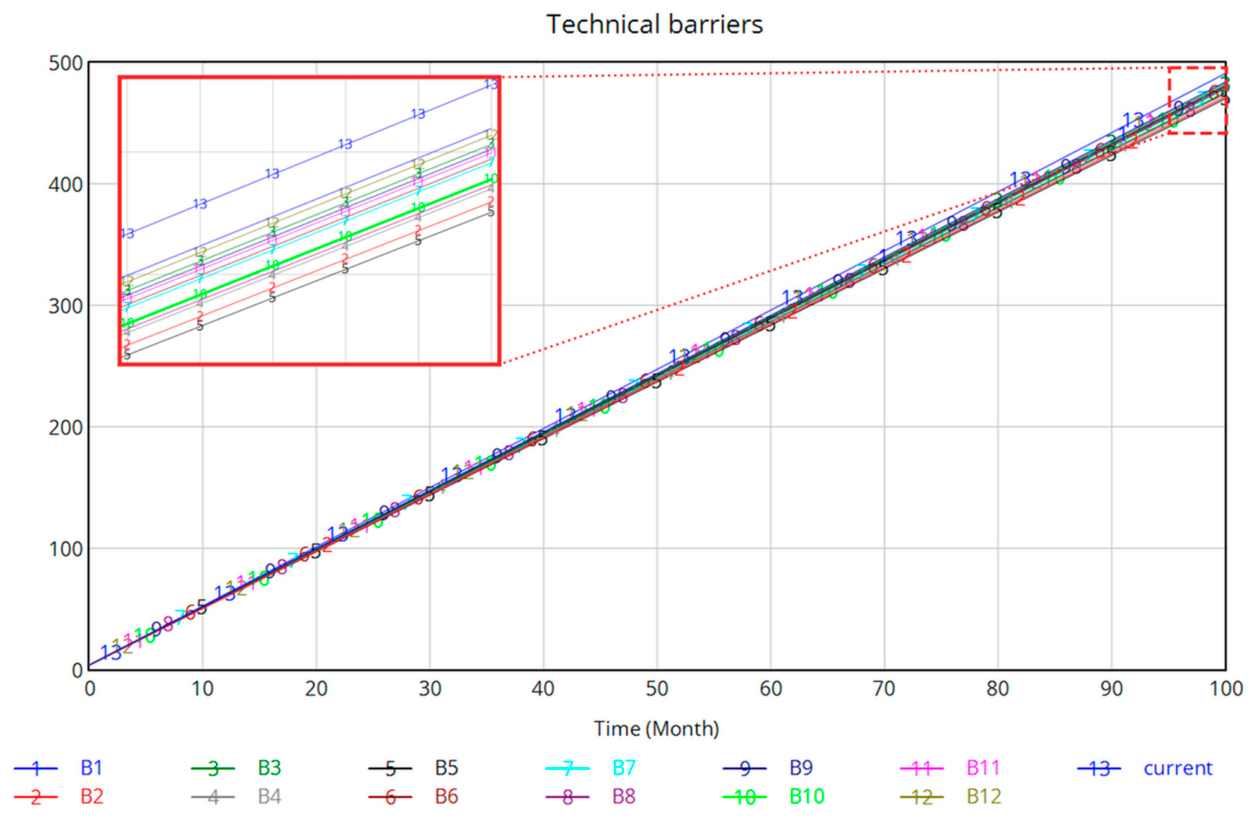
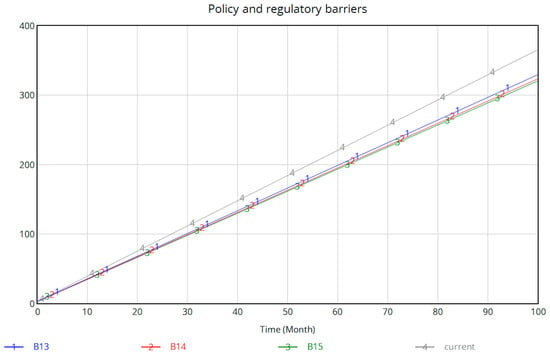
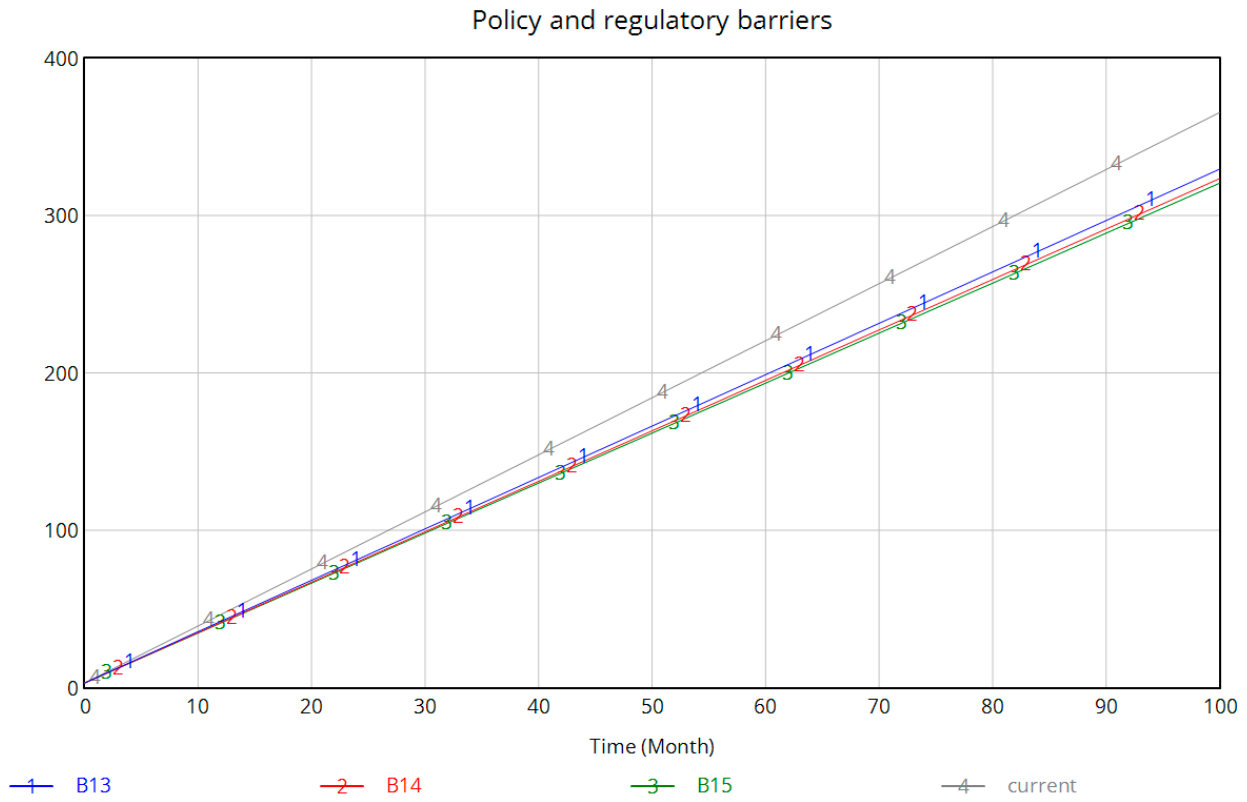
The established system dynamics equations and associated parameters are integrated into the developed stock flow diagram model. Sensitivity analysis is performed in Vensim PLE to examine and determine the relative significance of individual barrier factors in the transmission of BDT implementation barriers. The procedure involves holding the initial conditions of all remaining barrier factors constant while adjusting the initial value of a single factor. Specifically, a one-unit reduction is applied to ensure all factors are compared under a uniform benchmark. Subsequently, the model calculations are executed and the process is repeated iteratively. Through this approach, the relative sensitivity of each barrier factor within the barrier propagation system is identified. The corresponding results are presented in Figure 2, Figure 3, Figure 4, Figure 5, Figure 6, Figure 7 and Figure 8.
Figure 2.
Sensitivity Ranking of Barrier Subsystems.
Figure 3.
Sensitivity Analysis Results for Technical Barrier Factors.
Figure 4.
Sensitivity Analysis Results for Policy and Regulatory Barrier Factors.
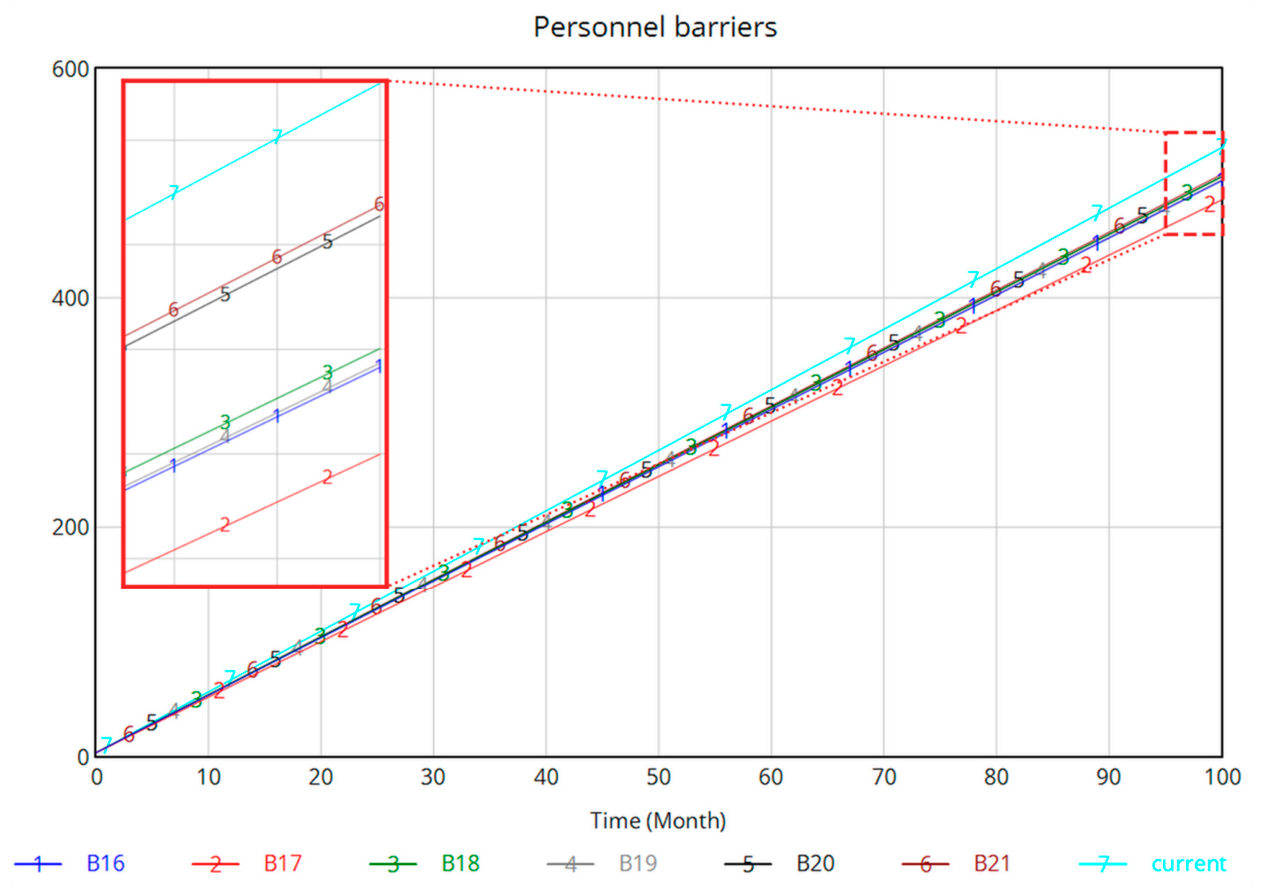
Figure 5.
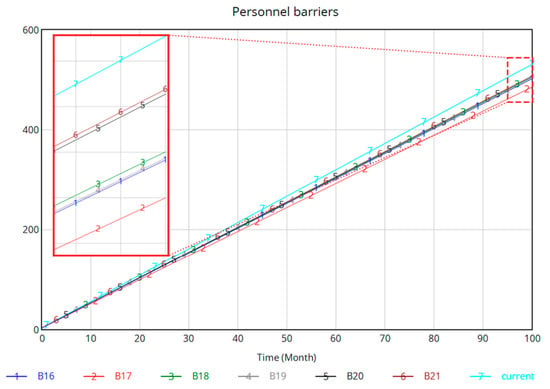
Sensitivity Analysis Results for Personnel Barrier Factors.
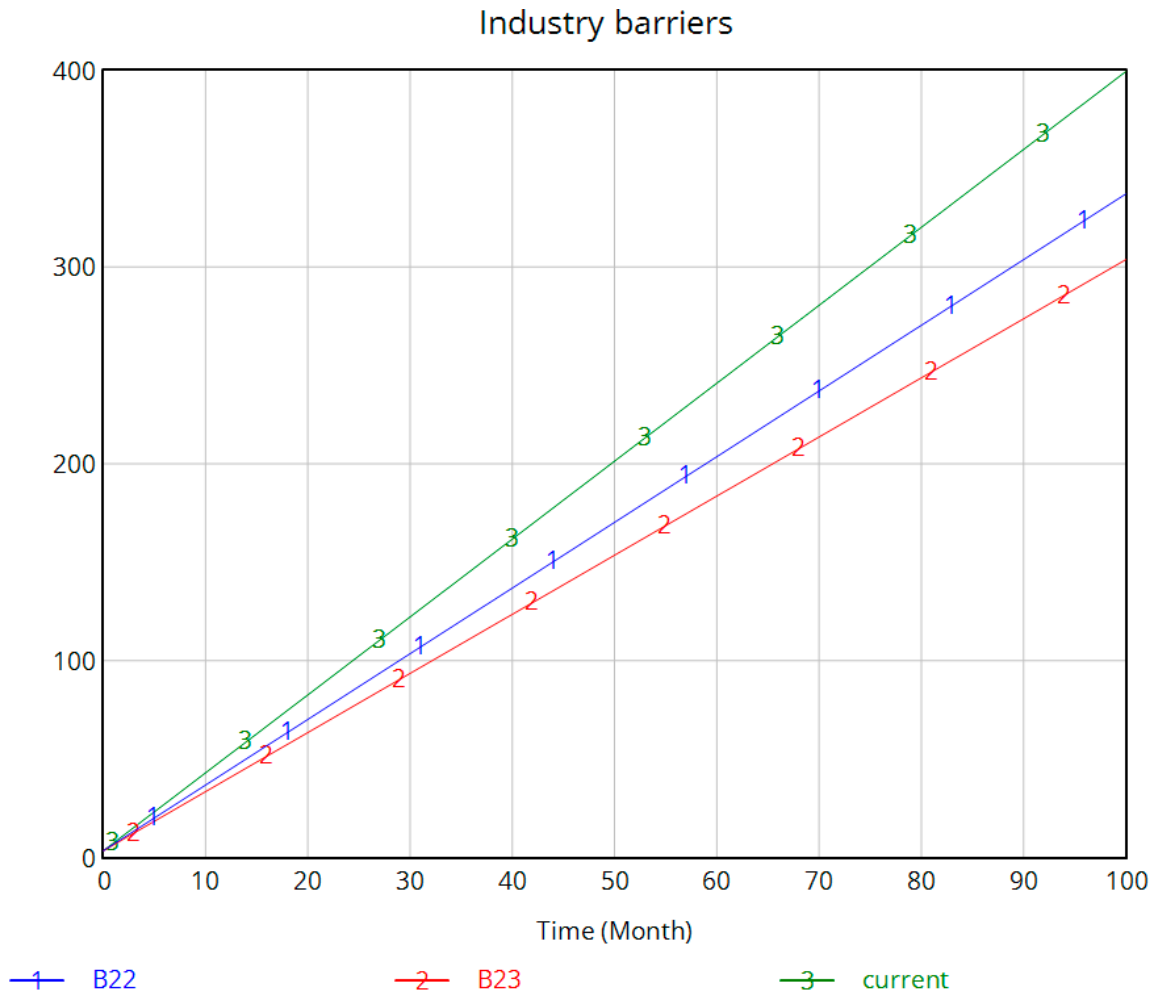
Figure 6.
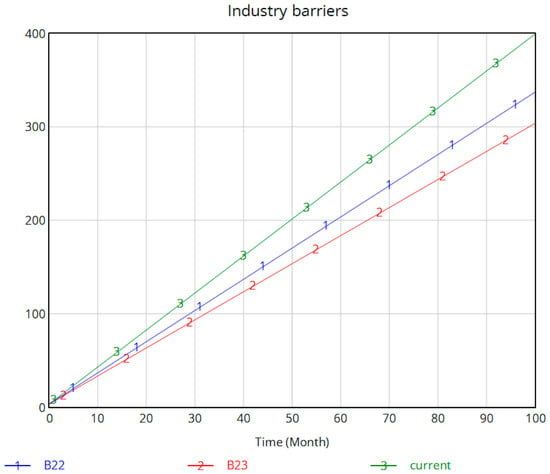
Sensitivity Analysis Results for Industry Barrier Factors.
Figure 7.
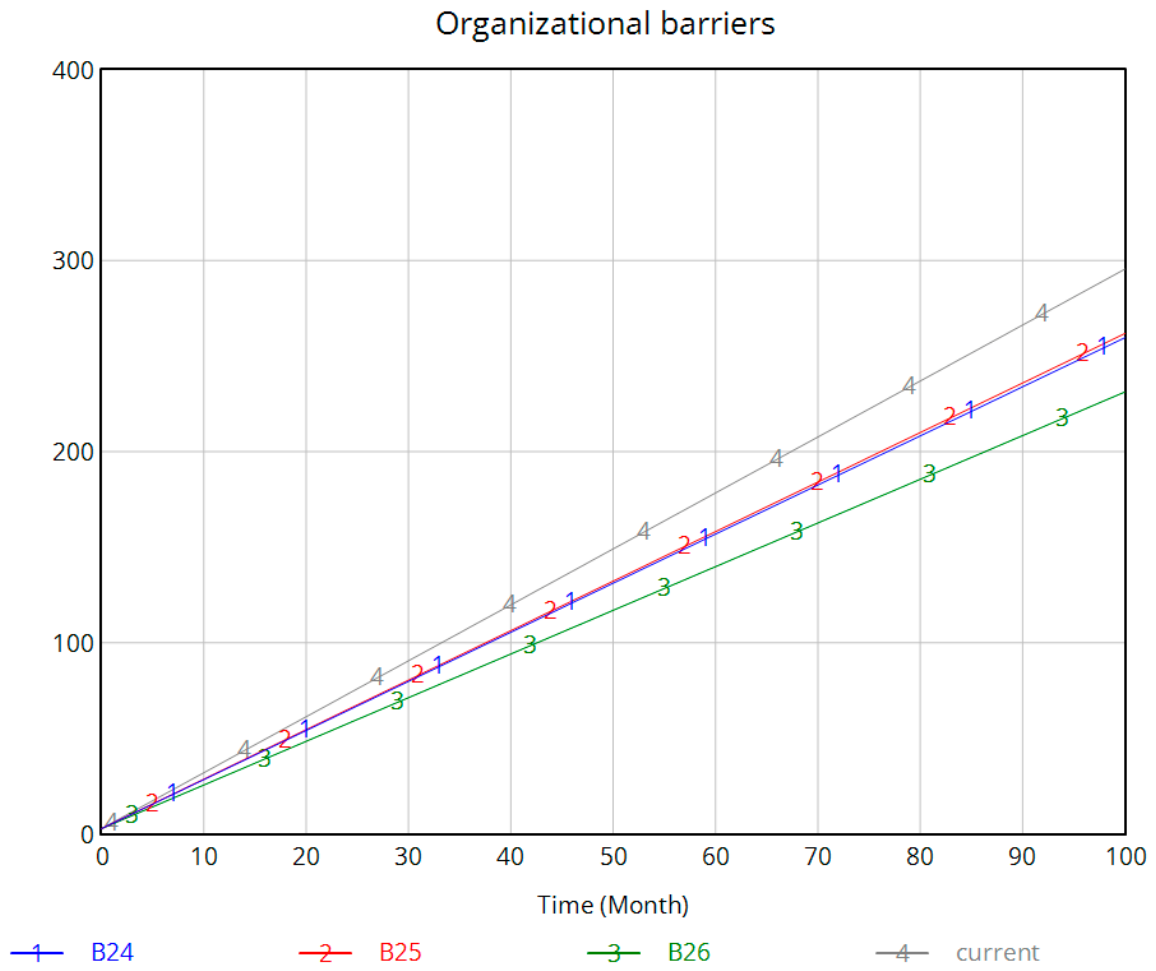
Sensitivity Analysis Results for Organizational Barrier Factors.
Figure 8.
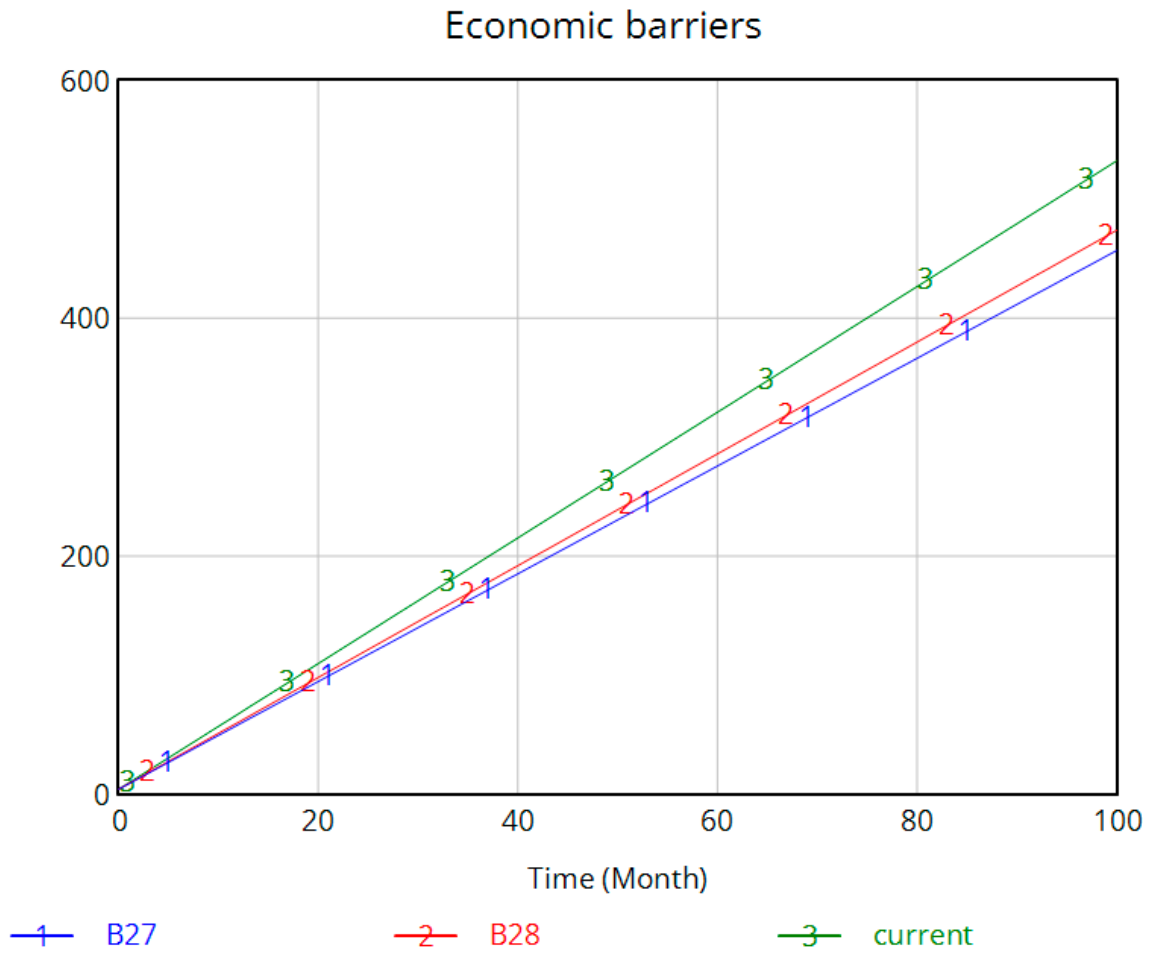
Sensitivity Analysis Results for Economic Barrier Factors.
4.1. Sensitivity Analysis of Digital Twin Implementation Barriers
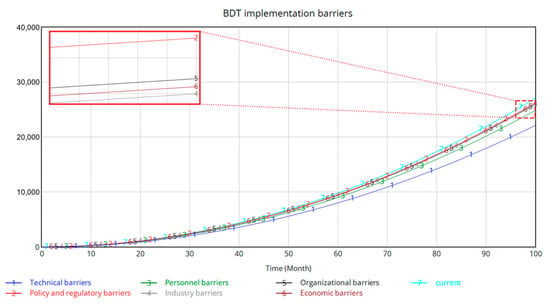
The sensitivity analysis yields the following hierarchy of barrier subsystems in descending order of sensitivity: technical barriers, personnel barriers, industry barriers, economic barriers, organizational barriers, and policy and regulatory barriers, as illustrated in Figure 2. This suggests that, within the current industrial landscape, technical maturity remains the core variable determining the success or failure of Digital Twin (DT) implementation.
The y-axis values in Figure 2, Figure 3, Figure 4, Figure 5, Figure 6, Figure 7 and Figure 8 represent dimensionless relative indices of barrier accumulation, not absolute physical quantities. These values are meaningful only for rank-ordering the relative influence of different barriers; they should not be interpreted as literal counts or magnitudes.
4.2. Sensitivity Analysis of Risk Factors in Subsystems
Prior to identifying subsystem sensitivity, a dispersion test was conducted on the raw expert scores of the 28 barrier factors. Statistical results indicated that the Coefficient of Variation (CV) for all indicators was below the threshold of 0.25. This demonstrates a high level of consensus among the expert group regarding the importance of each barrier factor, thereby ensuring the statistical robustness of the subsequent sensitivity ranking results.
As shown in Figure 3, the sensitivity ranking of technical barrier factors, arranged from highest to lowest, is as follows: uncertainty regarding data quality and dependability, heterogeneity of data from multiple sources, limitations in scalability and difficulties in data processing, system instability and unexpected breakdowns, inaccuracy in performance simulation and prediction, challenges in setting realistic expectations, insufficient availability of supporting technologies, obstacles in data acquisition and transmission, difficulties associated with system maintenance, reliance on uninterrupted Internet connectivity, challenges related to data modeling and lack of trust in data security.
According to Figure 4, the sensitivity ranking of policy and regulatory barrier factors, from highest to lowest, is as follows: challenges in data governance and privacy protection, legal and ethical issues, and insufficient governmental incentive mechanisms.
According to Figure 5, the sensitivity ranking of challenges arising from multicultural collaboration and personnel-related barrier factors, ordered from highest to lowest, is as follows: low acceptance of new technologies, inadequate levels of knowledge, gaps in interdisciplinary collaboration, difficulties in optimizing control strategies, fragmented empirical evidence related to DTs, and challenges arising from multicultural collaboration.
According to Figure 6, the sensitivity ranking of industry-related barrier factors, from highest to lowest, is as follows: ambiguity in the value proposition of DTs, followed by the absence of standardized tools and methodologies.
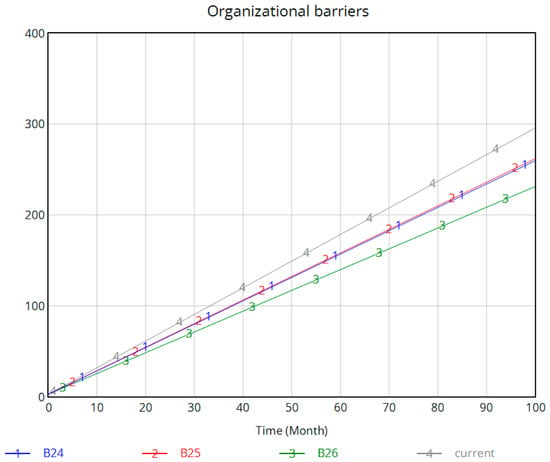
According to Figure 7, the sensitivity ranking of organizational barrier factors, arranged from highest to lowest, is as follows: inconsistencies in project-related data, high project complexity, and overly stringent building codes and regulations.
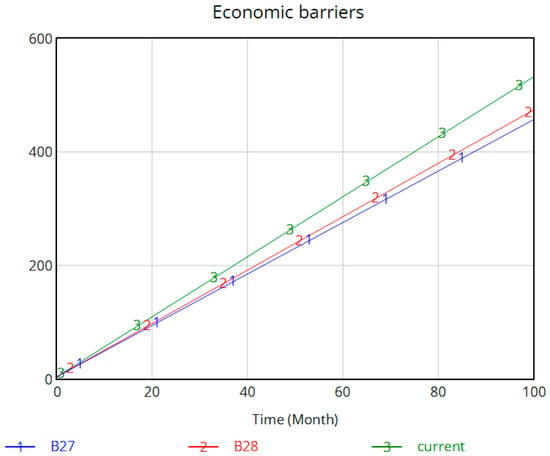
According to Figure 8, the sensitivity ranking of economic barrier factors, from highest to lowest, is as follows: difficulties in obtaining financial investment and elevated costs associated with implementation.
4.3. Model Validation
Extreme condition tests were conducted by setting three representative root variables—B1 (lowest weight), B5 (core pathway driver), and B27 (widest influence)—to 0 and 100. In all six scenarios, the model produced smooth, non-negative growth without oscillations or explosive behavior. When set to 0, total barrier level decreased by 6.6% (B1), 16.8% (B5), and 58.6% (B27) at month 100; when set to 100, it increased by 138%, 406%, and 1358%, respectively. The proportional responses confirm structural robustness, supporting the model’s use for comparative sensitivity analysis.
To assess the robustness of the subsystem ranking under parameter uncertainty, a Monte Carlo simulation (1000 iterations) was conducted. The influence magnitudes obtained from the Vensim sensitivity analysis were perturbed by ±10% following a normal distribution. The results show that the ranking remained highly stable: the technical subsystem ranked first in 100% of simulations, and the personnel subsystem ranked second in 100% of simulations. The industry and economic subsystems alternated between the third and fourth positions, while the organizational and policy subsystems remained in the fifth and sixth positions in over 90% of simulations. These findings confirm that the ranking of barrier subsystems is robust to plausible parameter uncertainty.
4.4. Discussion
The sensitivity analysis suggests that technical barriers exert the strongest influence on DT implementation, followed by personnel and industry barriers, while policy barriers exhibit the lowest sensitivity. These findings can be interpreted through the theoretical lens introduced in Section 2.4. From a socio-technical systems perspective, the dominance of technical barriers suggests that DT implementation in the Chinese construction industry is currently constrained primarily by the technological subsystem—that is, the foundational digital infrastructure, data interoperability, and system reliability have not yet reached a maturity level sufficient to enable widespread adoption. The relatively high sensitivity of personnel and industry barriers reflects the tight coupling between the technical and social subsystems: technical deficiencies create downstream challenges in human skills, collaboration, and organizational coordination. The lower sensitivity of organizational and policy barriers suggests that these factors are currently less critical than technical and personnel constraints, though they may gain importance as DT adoption scales up. Economic barriers show a moderate sensitivity (ranked fourth), while organizational and policy barriers play a comparatively smaller role (ranked fifth and sixth, respectively). This interpretation suggests that interventions targeting technical barriers—particularly the most sensitive factors such as insufficient supporting technologies (B6) and system maintenance difficulties (B9)—are likely to yield the highest marginal returns, consistent with the socio-technical principle that technical subsystem improvements must precede or accompany social subsystem adaptations.
Based on the sensitivity ranking presented in Figure 2, Figure 3, Figure 4, Figure 5, Figure 6, Figure 7 and Figure 8, technical barriers exhibit the strongest influence on DT implementation. Among them, uncertainty regarding data quality and dependability (B5) and heterogeneity of data from multiple sources (B2) are the most sensitive factors. To address these priority constraints:
For B5 (uncertainty regarding data quality and dependability): Project-level data quality protocols should be established, specifying standardized data collection procedures, validation frequency, and anomaly reporting mechanisms. Real-time data verification tools should be deployed to ensure that the data feeding into DT models remain reliable and accurate throughout the project lifecycle.
For B2 (heterogeneity of data from multiple sources): Industry-wide data standards and interoperability protocols should be developed to facilitate seamless integration of heterogeneous data from BIM, IoT sensors, RFID systems, and other sources. This requires collaboration among technology providers, construction firms, and standardization bodies to define common data formats and exchange interfaces.
In addition, the following technical factors also warrant attention. For B6 (insufficient supporting technologies): Technology providers and R&D institutions should prioritize scenario-based testing and iterative optimization of DT platforms, with a recommended timeline of 12–18 months for pilot implementations. For B9 (system maintenance difficulties): Project-level maintenance teams should be established with dedicated personnel responsible for system diagnostics and routine updates, and automated error-detection tools should be deployed to reduce manual intervention. For B10 (inaccuracies in performance simulation): Data quality protocols introduced at the planning stage should specify validation frequency and anomaly reporting procedures to continuously improve simulation accuracy.
Personnel barriers rank second in sensitivity, with inadequate knowledge levels (B16) and gaps in interdisciplinary collaboration (B19) identified as the most critical sub-factors.
For B16 (inadequate knowledge): Construction enterprises should develop tiered training programs: foundational DT literacy for all project staff (4–8 h), technical skills for BIM/DT operators (40–60 h), and strategic understanding for project managers (2–3 days).
For B19 (gaps in interdisciplinary collaboration): Cross-functional integration mechanisms should be institutionalized, including regular coordination meetings between design, construction, and IT teams, and shared data access protocols. Pilot projects should designate “DT champions” within each functional unit.
For B17 (low technology acceptance): Awareness campaigns and visual demonstrations of DT benefits using completed case studies should be organized at the project kick-off stage, targeting both management and frontline staff.
Industry barriers rank third in sensitivity, with absence of standardized tools and methodologies (B22) and ambiguity in the value proposition of DTs (B23) identified as the key sub-factors. The high sensitivity of B22 suggests that the lack of industry-wide standards for DT implementation creates significant uncertainty for project-level adoption. To address this, industry associations and regulatory bodies should collaborate on developing unified technical standards and best practice guidelines for DT deployment in construction. Clarifying the value proposition of DTs (B23) requires systematic collection and dissemination of successful case studies, demonstrating clear return on investment and operational benefits across different project types.
Economic barriers rank fourth in sensitivity, with difficulties in obtaining financial investment (B27) showing greater influence than elevated implementation costs (B28). While economic factors are less sensitive than technical and personnel barriers, they remain relevant, particularly for small and medium-sized enterprises. To mitigate these constraints, governments could provide targeted financial incentives—such as subsidies, tax reductions, or low-interest loans—specifically for DT adoption in construction. Public–private partnerships could also be explored to share the initial investment burden.
Organizational barriers rank fifth in sensitivity, with inconsistencies in project-related data (B26) identified as the most sensitive factor, followed by high project complexity (B24) and stringent building codes (B25). The dominance of B26 suggests that improving data consistency across project phases—through unified data management platforms and standardized data entry protocols—would yield the greatest organizational benefits. For B24 and B25, simplifying approval workflows and providing regulatory guidance specifically for DT-enabled projects could reduce administrative barriers.
Policy and regulatory barriers show the lowest sensitivity among all subsystems. Among the three policy factors, data governance and privacy protection (B15) is the most sensitive, followed by legal and ethical issues (B14) and insufficient government incentives (B13). The relatively low sensitivity of policy barriers may reflect that existing regulatory frameworks, while not specifically designed for DT, are not currently the primary bottleneck to implementation. Nonetheless, developing clearer data governance guidelines for DT applications and strengthening incentive mechanisms for early adopters would address potential future constraints as DT adoption scales up.
In summary, the simulation results suggest that intervention efforts should prioritize technical barriers (particularly B6 and B9), followed by personnel barriers (B16 and B19), and then industry barriers (B22 and B23). Economic barriers (B27–B28) rank fourth, with organizational barriers (B26) and policy barriers (B13–B15) exhibiting the lowest sensitivity in this model. This prioritization applies primarily to large-scale building projects in the Chinese construction context. For smaller projects, the relative importance of economic barriers may increase. For projects at different lifecycle stages—design versus construction versus operation—these recommendations should be interpreted with caution, as our model aggregates barriers across the full lifecycle without stage-level disaggregation.
5. Conclusions
This study identifies and analyzes the factors impeding the development and implementation of building digital twin (BDT) technology in the construction industry through a combination of systematic literature review and expert interviews. A comprehensive set of 28 barrier factors is established and classified into six subsystems: technical, policy and regulatory, personnel, industry, organizational, and economic barriers. By examining the hypothesized interactions among these factors, a system dynamics model is developed to explore the interdependencies and relative influence pathways that link individual barriers into an integrated system. Theoretically, the study contributes by operationalizing the TOE framework and socio-technical systems theory in the context of construction DT implementation, demonstrating how external environmental factors (policy, economy, industry), technological conditions, and organizational-human factors interact to shape implementation outcomes.
Simulation results provide insights into the operation of these barriers. Technical factors are found to have the strongest influence on BDT implementation, followed by personnel and industry barriers, with economic barriers ranking fourth, organizational barriers fifth, and policy barriers exhibiting the lowest sensitivity. The study highlights how interactions among barriers amplify or mitigate the overall challenges, offering a deeper understanding of the underlying mechanisms and supporting targeted strategies to overcome critical constraints. This perspective contributes to a reference for prioritization for promoting the adoption and sustainable development of digital twin technologies in construction.
Despite these contributions, the study has several limitations. As noted in Section 3.3, while the perceived influence loop diagram (Figure 1) depicts hypothesized interconnections among barriers, the quantitative system dynamics model does not explicitly parameterize every individual barrier-to-barrier pathway. Instead, it operationalizes barrier interrelationships at an aggregated level, where auxiliary variables influence subsystem-level rate variables through regression-estimated coefficients. Consequently, the model captures the net contribution of each barrier to subsystem-level accumulation rather than the detailed propagation channels between any two individual barriers. In addition, the analysis relies on expert scoring, which may introduce subjective bias, and the absence of empirical validation from real construction projects—including observed adoption outcomes, implementation failure/success cases, or comparative analysis across project types—means that the findings remain exploratory. Furthermore, while the study draws on TOE and socio-technical systems theory to frame the barrier interactions, the hypothesized perceived influence directions and mediating relationships have not been empirically tested with longitudinal data; the theoretical model presented here should therefore be viewed as a propositional framework requiring future empirical validation. The model also produces continuously increasing barrier levels over the 100-month horizon without saturation or ceiling effects. This simplifying assumption reflects the linear structure of the model and the absence of feedback mechanisms that would naturally limit barrier growth. In reality, managerial and technical barriers cannot grow without bound; future research should incorporate saturation effects and capacity constraints to better reflect real-world dynamics. Given the modest sample size (n = 20), the regression coefficients should be interpreted as exploratory estimates of relative influence rather than precise effect sizes. Dynamic contextual factors such as regional policies, project types, and organizational maturity are also not considered, which could affect barrier impacts in practice. The structured literature search was conducted in January 2025, and the taxonomy of 28 barriers was derived from studies available at that time. Although a supplementary search identified additional recent studies, no new barrier categories emerged. We acknowledge that the literature in this rapidly evolving field continues to grow, and future reviews should update the taxonomy periodically. The literature search was also limited to CNKI and Web of Science; although these databases provide broad coverage, the exclusion of Scopus and other databases may have resulted in the omission of some relevant studies. Future research could address these limitations by incorporating more granular, case-specific data, validating the model across diverse construction contexts, integrating quantitative performance metrics to capture dynamic barrier evolution over time, testing the theoretical propositions with independent expert panels or project-level empirical evidence, and broadening the literature search to include additional databases.
Supplementary Materials
The following supporting information can be downloaded at: https://www.mdpi.com/article/10.3390/infrastructures11100374/s1, Figure S1: PRISMA-style flow diagram of the study selection process; Table S1: Regression results for auxiliary variable relationships; Table S2: Regression results for subsystem rate equations; Supplementary File S1: Complete regression outputs (.xlsx).
Author Contributions
C.Z.: Conceptualization, Methodology, Funding acquisition, Supervision. J.L.: Writing—original draft, Investigation, Data curation. L.Y.: Writing—review and editing, Formal analysis. H.F.: Investigation, Formal analysis. Y.T.: Funding acquisition, Project administration, Data curation. Y.A.: Writing—review and editing, Methodology. All authors have read and agreed to the published version of the manuscript.
Funding
This research was funded by the Application Development and Research Project of the Fifth National Economic Census in Sichuan Province, grant number SCJP14; the National Natural Science Foundation of China, grant number 72171028; and the Yibin Intelligent Logistics Research Institute, grant number YW2024ZD05.
Institutional Review Board Statement
The study was conducted in accordance with the Declaration of Helsinki. Ethical review was waived/exempted for this study by the Institutional Review Board of Xihua University, as it involved an anonymous expert questionnaire survey.
Informed Consent Statement
Informed consent was obtained from all subjects involved in the study. The questionnaire clearly stated the purpose of the research and ensured anonymity.
Data Availability Statement
All system dynamics model files, equations, parameter values, regression outputs, and anonymized summary statistics supporting the findings of this study are provided in the Supplementary Materials to ensure reproducibility. The raw, item-level expert scoring data are subject to institutional ethical restrictions and are not publicly accessible; however, they are available upon reasonable request to the corresponding author, subject to approval from the institutional ethics committee.
Acknowledgments
This research was supported by the Application Development and Research Project of the Fifth National Economic Census in Sichuan Province (SCJP14), National Natural Science Foundation of China (72171028), and the project of Yibin Intelligent Logistics Research Institute (YW2024ZD05). We thank LetPub (www.letpub.com.cn) for linguistic assistance and pre-submission expert review.
Conflicts of Interest
The authors declare that there are no competing financial interests or personal relationships that may have influenced the work presented in this study.
References
- Dixit, S.; Mandal, S.N.; Sawhney, A.; Singh, S. Relationship between skill development and productivity in construction sector: A literature review. Int. J. Civ. Eng. Technol. 2017, 8, 649–665. [Google Scholar]
- Tezel, A.; Aziz, Z. Visual management in highways construction and maintenance in England. Eng. Constr. Archit. Manag. 2017, 24, 486–513. [Google Scholar] [CrossRef] [Scilit]
- Ministry of Housing and Urban-Rural Development, National Development and Reform Commission, Ministry of Science and Technology, Ministry of Industry and Information Technology, Ministry of Human Resources and Social Security, Ministry of Ecology and Environment, Ministry of Transport, Ministry of Water Resources, State Taxation Administration, State Administration for Market Regulation, China Banking and Insurance Regulatory Commission, National Railway Administration, and Civil Aviation Administration of China. Guidance on Promoting the Collaborative Development of Intelligent Construction and Building Industrialization. 28 July 2020. Available online: https://www.gov.cn/zhengce/zhengceku/2020-07/28/content_5530762.htm (accessed on 13 October 2026). (In Chinese)
- Opoku, D.-G.J.; Perera, S.; Osei-Kyei, R.; Rashidi, M.; Famakinwa, T.; Bamdad, K. Drivers for digital twin adoption in the construction industry: A systematic literature review. Buildings 2022, 12, 113. [Google Scholar] [CrossRef] [Scilit]
- Allen, B.D. Digital twins and living models at NASA. In Proceedings of the Digital Twin Summit, Virtual, 3–4 November 2021. [Google Scholar]
- Grieves, W.M. Product lifecycle management: The new paradigm for enterprises. Int. J. Prod. Dev. 2005, 2, 71–84. [Google Scholar] [CrossRef] [Scilit]
- Borth, M.; Verriet, J.; Muller, G. Digital twin strategies for SoS 4 challenges and 4 architecture setups for digital twins of SoS. In Proceedings of the 14th Annual Conference System of Systems Engineering (SoSE); IEEE: Piscataway, NJ, USA, 2019; pp. 164–169. [Google Scholar]
- Canedo, A. Industrial IoT lifecycle via digital twins. In Proceedings of the 11th IEEE/ACM/IFIP International Conference on Hardware/Software Codesign and System Synthesis; Association for Computing Machinery: New York, NY, USA, 2016; p. 1. [Google Scholar]
- Tao, F.; Sui, F.; Liu, A.; Qi, Q.; Zhang, M.; Song, B.; Guo, Z.; Lu, S.C.-Y.; Nee, A.Y.C. Digital twin-driven product design framework. Int. J. Prod. Res. 2019, 57, 3935–3953. [Google Scholar] [CrossRef] [Scilit]
- Han, D.C.; Zhang, H.; Liu, Y.; Cui, W. From BIM to BDT: A conceptual study on building digital twin (BDT). Archit. J. 2020, 10, 95–101. (In Chinese) [Google Scholar]
- Corrado, C.R.; DeLong, S.M.; Holt, E.G.; Hua, E.Y.; Tolk, A. Combining green metrics and digital twins for sustainability planning and governance of smart buildings and cities. Sustainability 2022, 14, 12988. [Google Scholar] [CrossRef] [Scilit]
- Martinelli, I.; Campi, F.; Checcacci, E.; Presti, G.M.L.; Pescatori, F.; Pumo, A.; Germani, M. Cost estimation method for gas turbine in conceptual design phase. Procedia Cirp 2019, 84, 650–655. [Google Scholar] [CrossRef] [Scilit]
- Liu, Z.S.; Shi, G.L.; Sun, J.J. Digital twin technology and its application in intelligent construction. Ind. Constr. 2021, 51, 184–192. (In Chinese) [Google Scholar]
- Sacks, R.; Brilakis, I.; Pikas, E.; Xie, H.S.; Girolami, M. Construction with digital twin information systems. Data-Centric Eng. 2020, 1, e14. [Google Scholar] [CrossRef] [Scilit]
- Khajavi, S.H.; Motlagh, N.H.; Jaribion, A.; Werner, L.C.; Holmstrom, J. Digital twin: Vision, benefits, boundaries, and creation for buildings. IEEE Access 2019, 7, 147406–147419. [Google Scholar] [CrossRef] [Scilit]
- Zhang, Y.F. A review of digital twin applications across the whole lifecycle of the construction industry. Constr. Econ. 2023, 44, 479–483. (In Chinese) [Google Scholar]
- Adeniyi, O.; Rathnasiri, P.; Ojo, L.D.; Akindehinde, A.; Thurairajah, N. The evolution of digital twin applications in construction and the built environment: Analysis of trends, research clusters and future directions. Intell. Build. Int. 2025, 1–29. [Google Scholar] [CrossRef] [Scilit]
- Tornatzky, L.G.; Fleischer, M. The Processes of Technological Innovation; Lexington Books: Lexington, MA, USA, 1990. [Google Scholar]
- Trist, E.L.; Bamforth, K.W. Some social and psychological consequences of the longwall method of coal-getting. Hum. Relat. 1951, 4, 3–38. [Google Scholar] [CrossRef] [Scilit]
- Tuhaise, V.V.; Tah, J.H.M.; Abanda, F.H. Technologies for digital twin applications in construction. Autom. Constr. 2023, 152, 104931. [Google Scholar] [CrossRef] [Scilit]
- Omrany, H.; Al-Obaidi, K.M.; Husain, A.; Ghaffarianhoseini, A. Digital twins in the construction industry: A comprehensive review of current implementations, enabling technologies, and future directions. Sustainability 2023, 15, 10908. [Google Scholar] [CrossRef] [Scilit]
- Opoku, D.-G.J.; Perera, S.; Osei-Kyei, R.; Rashidi, M.; Bamdad, K.; Famakinwa, T. Barriers to the adoption of digital twin in the construction industry: A literature review. Informatics 2023, 10, 14. [Google Scholar] [CrossRef] [Scilit]
- Marocco, M.; Garofolo, I. Integrating disruptive technologies with facilities management: A literature review and future research directions. Autom. Constr. 2021, 131, 103917. [Google Scholar] [CrossRef] [Scilit]
- Shahzad, M.; Shafiq, M.T.; Douglas, D.; Kassem, M. Digital twins in built environments: An investigation of the characteristics, applications, and challenges. Buildings 2022, 12, 120. [Google Scholar] [CrossRef] [Scilit]
- Boje, C.; Guerriero, A.; Kubicki, S.; Rezgui, Y. Towards a semantic construction digital twin: Directions for future research. Autom. Constr. 2020, 114, 103179. [Google Scholar] [CrossRef] [Scilit]
- Sacks, R.; Girolami, M.; Brilakis, I. Building information modelling, artificial intelligence and construction tech. Dev. Built Environ. 2020, 4, 100011. [Google Scholar] [CrossRef] [Scilit]
- Opoku, D.-G.J.; Perera, S.; Osei-Kyei, R.; Rashidi, M. Digital twin application in the construction industry: A literature review. J. Build. Eng. 2021, 40, 102726. [Google Scholar] [CrossRef] [Scilit]
- Greif, T.; Stein, N.; Flath, C.M. Peeking into the void: Digital twins for construction site logistics. Comput. Ind. 2020, 121, 103264. [Google Scholar] [CrossRef] [Scilit]
- Rafsanjani, H.N.; Nabizadeh, A.H. Towards digital architecture, engineering, and construction (AEC) industry through virtual design and construction (VDC) and digital twin. Energy Built Environ. 2023, 4, 169–178. [Google Scholar] [CrossRef] [Scilit]
- Wu, Y.; Shang, J.; Xue, F. Regard: Symmetry-based coarse registration of smartphone’s colorful point clouds with cad drawings for low-cost digital twin buildings. Remote Sens. 2021, 13, 1882. [Google Scholar] [CrossRef] [Scilit]
- Jiang, Y.; Liu, X.; Kang, K.; Wang, Z.; Zhong, R.Y.; Huang, G.Q. Blockchain-enabled cyber-physical smart modular integrated construction. Comput. Ind. 2021, 133, 103553. [Google Scholar] [CrossRef] [Scilit]
- Li, M.; Lu, Q.; Bai, S.; Zhang, M.; Tian, H.; Qin, L. Digital twin-driven virtual sensor approach for safe construction operations of trailing suction hopper dredger. Autom. Constr. 2021, 132, 103961. [Google Scholar] [CrossRef] [Scilit]
- Meža, S.; Mauko Pranjić, A.; Vezočnik, R.; Osmokrović, I.; Lenart, S. Digital twins and road construction using secondary raw materials. J. Adv. Transp. 2021, 2021, 8833058. [Google Scholar] [CrossRef] [Scilit]
- Tao, F.; Zhang, C.; Qi, Q.; Zhang, H. Digital twin maturity model. Comput. Integr. Manuf. Syst. 2022, 28, 1267. [Google Scholar]
- Tao, F. Digital twin standard system. Comput. Integr. Manuf. Syst. 2019, 25, 2405. [Google Scholar]
- Jiang, Y.; Li, M.; Guo, D.; Wu, W.; Zhong, R.Y.; Huang, G.Q. Digital twin-enabled smart modular integrated construction system for on-site assembly. Comput. Ind. 2022, 136, 103594. [Google Scholar] [CrossRef] [Scilit]
- Teisserenc, B.; Sepasgozar, S. Adoption of blockchain technology through digital twins in the construction industry 4.0: A PESTELS approach. Buildings 2021, 11, 670. [Google Scholar] [CrossRef] [Scilit]
- Xia, H.; Liu, Z.; Maria, E.; Liu, X.; Lin, C. Study on city digital twin technologies for sustainable smart city design: A review and bibliometric analysis of geographic information system and building information modeling integration. Sustain. Cities Soc. 2022, 84, 104009. [Google Scholar] [CrossRef] [Scilit]
- Hoeft, M.; Trask, C. Safety built right in: Exploring the occupational health and safety potential of BIM-based platforms throughout the building lifecycle. Sustainability 2022, 14, 6104. [Google Scholar] [CrossRef] [Scilit]
- Cruz, H.; Raheem, A.A.; Nazarian, S. Digital twin technology applications for transportation infrastructure—A survey-based study. In Computing in Civil Engineering 2021; ASCE Library: Reston, VA, USA, 2021; pp. 350–357. [Google Scholar]
- Nguyen, H.X.; Trestian, R.; To, D.; Tatipamula, M. Digital twin for 5G and beyond. IEEE Commun. Mag. 2021, 59, 10–15. [Google Scholar] [CrossRef] [Scilit]
- Turner, C.J.; Oyekan, J.; Stergioulas, L.; Griffin, D. Utilizing industry 4.0 on the construction site: Challenges and opportunities. IEEE Trans. Ind. Inf. 2020, 17, 746–756. [Google Scholar] [CrossRef] [Scilit]
- Zhao, J.; Feng, H.; Chen, Q.; de Soto, B.G. Developing a conceptual framework for the application of digital twin technologies to revamp building operation and maintenance processes. J. Build. Eng. 2022, 49, 104028. [Google Scholar] [CrossRef] [Scilit]
- Deng, M.; Menassa, C.C.; Kamat, V.R. From BIM to digital twins: A systematic review of the evolution of intelligent building representations in the AEC-FM industry. J. Inf. Technol. Constr. 2021, 26, 58–83. [Google Scholar] [CrossRef] [Scilit]
- Xie, M.; Qiu, Y.; Liang, Y.; Zhou, Y.; Liu, Z.; Zhang, G. Policies, applications, barriers and future trends of building information modeling technology for building sustainability and informatization in China. Energy Rep. 2022, 8, 7107–7126. [Google Scholar] [CrossRef] [Scilit]
- Kang, K.; Besklubova, S.; Dai, Y.; Zhong, R.Y. Building demolition waste management through smart BIM: A case study in Hong Kong. Waste Manag. 2022, 143, 69–83. [Google Scholar] [CrossRef] [Scilit] [PubMed]
- He, R.; Li, M.; Gan, V.J.L.; Ma, J. BIM-enabled computerized design and digital fabrication of industrialized buildings: A case study. J. Clean. Prod. 2021, 278, 123505. [Google Scholar] [CrossRef] [Scilit]
- Lu, Q.; Chen, L.; Li, S.; Pitt, M. Semi-automatic geometric digital twinning for existing buildings based on images and CAD drawings. Autom. Constr. 2020, 115, 103183. [Google Scholar] [CrossRef] [Scilit]
- Hunhevicz, J.J.; Motie, M.; Hall, D.M. Digital building twins and blockchain for performance-based (smart) contracts. Autom. Constr. 2022, 133, 103981. [Google Scholar] [CrossRef] [Scilit]
- Al-Geddawy, T. A digital twin creation method for an opensource low-cost changeable learning factory. Procedia Manuf. 2020, 51, 1799–1805. [Google Scholar] [CrossRef] [Scilit]

Disclaimer/Publisher’s Note: The statements, opinions and data contained in all publications are solely those of the individual author(s) and contributor(s) and not of MDPI and/or the editor(s). MDPI and/or the editor(s) disclaim responsibility for any injury to people or property resulting from any ideas, methods, instructions or products referred to in the content. |
© 2026 by the authors. Licensee MDPI, Basel, Switzerland. This article is an open access article distributed under the terms and conditions of the Creative Commons Attribution (CC BY) license.