


Abstract
Increasing enclosure closure can compromise heat removal in compact robotic joints. This study assesses the thermal limitations of an existing low-cost Delta-robot joint with an additively manufactured ABS enclosure. Under an equivalent constant thermal load of W the predicted steady-state driver temperatures were C with forced ventilation, C with open natural convection, and C with closed natural convection. The driver remained the dominant numerical hotspot, reaching C after 300 s in the closed transient simulation. These predictions exclude thermal radiation and protection-related shutdown; the closed steady-state result, therefore, represents a numerical limiting condition rather than an attainable operating temperature. Preliminary measurements and thermography identified the electronics region as thermally critical and documented shutdown following ventilation removal, but did not provide quantitative CFD validation. The findings establish a baseline for redesigning the joint’s heat-removal paths as environmental protection is increased; IP54 remains a future design target rather than a demonstrated rating.
1. Introduction
Collaborative robots have become increasingly relevant in modern manufacturing because of their flexibility, ease of integration, and suitability for environments shared by humans and robotic systems [1,2]. Within this context, low-cost Delta robots manufactured using additive manufacturing technologies have attracted interest for educational, research, and small-scale industrial applications. Their reduced manufacturing costs, low structural mass, geometric flexibility, and ease of customization make them suitable for rapid development and experimental implementation. Additively manufactured Delta-robot platforms can therefore provide accessible and adaptable solutions for manipulation and pick-and-place applications [3].
Despite these advantages, the active-joint architecture considered here was developed primarily for clean indoor environments and incorporates openings that permit direct air exchange with the surroundings. Future use in environments exposed to dust and water splashes motivates a redesign of the enclosure to achieve IP54 protection under IEC 60529 [4]. IP54 denotes protection against dust ingress sufficient to impair satisfactory operation or safety, and against harmful effects of water splashing from any direction; it does not imply impermeability or complete exclusion of dust. Authors in [5] identify the IP rating as a key physical characteristic when selecting industrial inspection robots and relate the required protection to the operating environment. Moreover, the methodology in [6] proposes the investigation of photovoltaic cleaning robots operating in desert environments, highlighting inadequate enclosure protection against dust and moisture, together with associated thermal and operational vulnerabilities, and emphasizes the need for improved environmental protection of electronic enclosures. Ingress-protection targets should reflect the intended exposure conditions and be considered alongside thermal reliability [5,6].
A further limitation arises from the use of acrylonitrile butadiene styrene (ABS) as the enclosure material. ABS offers several advantages for low-cost robotic applications, including reduced mass, ease of manufacturing, electrical insulation, and compatibility with fused-filament fabrication. However, its relatively low thermal conductivity limits heat transfer through the enclosure walls when compared with metallic housings, external heat sinks, etc. [7]. This problem is particularly relevant in a compact active joint that contains several heat-generating components, including the stepper motor, motor driver, and microcontroller. When direct air exchange is reduced, heat generated by these components must be dissipated mainly through internal natural convection, conductive transfer through structural interfaces, and heat rejection from the external enclosure surfaces.
Thermal management in robotics has been mainly investigated in aerospace applications through dedicated heat-transfer paths, radiating surfaces, thermal isolation, phase-change cooling, and temperature-aware control. For a space manipulator joint, the dimensions of a radiating surface are evaluated by using numerical analysis and thermal balance testing, demonstrating the importance of sizing the heat-rejection surface for the operating conditions [8]. Similarly, the proposed approach in [9] investigates conductive and radiative isolation, heat-spreading structures, radiator fins, and compensation heaters for a solar radiation monitor. These studies illustrate the importance of coordinating heat transport, heat rejection, and thermal isolation, although their operating environments differ substantially from those of terrestrial robotic joints [10]. Recent robotic studies have also investigated more localized or operational approaches [11].
However, these studies do not directly demonstrate how restricting ventilation affects a low-cost, additively manufactured joint housing the motor, driver, and control electronics within a common ABS enclosure. The relevant question is how this change affects the temperature distribution, the location of the limiting thermal region, and the early heating response. The present work addresses this application-specific question by comparing forced ventilation, open natural convection, and closed natural convection, and by supplementing this with a transient analysis of the closed configuration.
The main baseline assessment of the existing architecture prior to the enclosure redesign. The numerical results characterize its sensitivity to ventilation restriction, while preliminary measurements and thermography identify the regions most affected by heating. Together, these findings inform subsequent investigation of heat-removal paths compatible with increased environmental protection; they do not establish an optimized or IP54-compliant enclosure.
The remainder of this paper is organized as follows. Section 2 outlines the system specification, material properties, and the methodology employed to investigate heat transfer in the active joint. Section 3 exhibits the experimental and SolidWorks 2024 Flow Simulations results. Section 4 presents a discussion of the results and contributions. Section 5 concludes the article.
2. Materialsand Methods
This section describes the active-joint architecture, geometric simplification, prescribed thermal loads, material properties, and numerical and experimental methods.
2.1. Target System
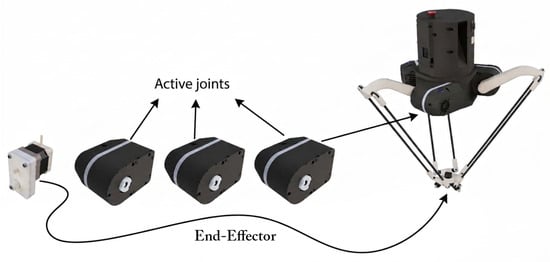
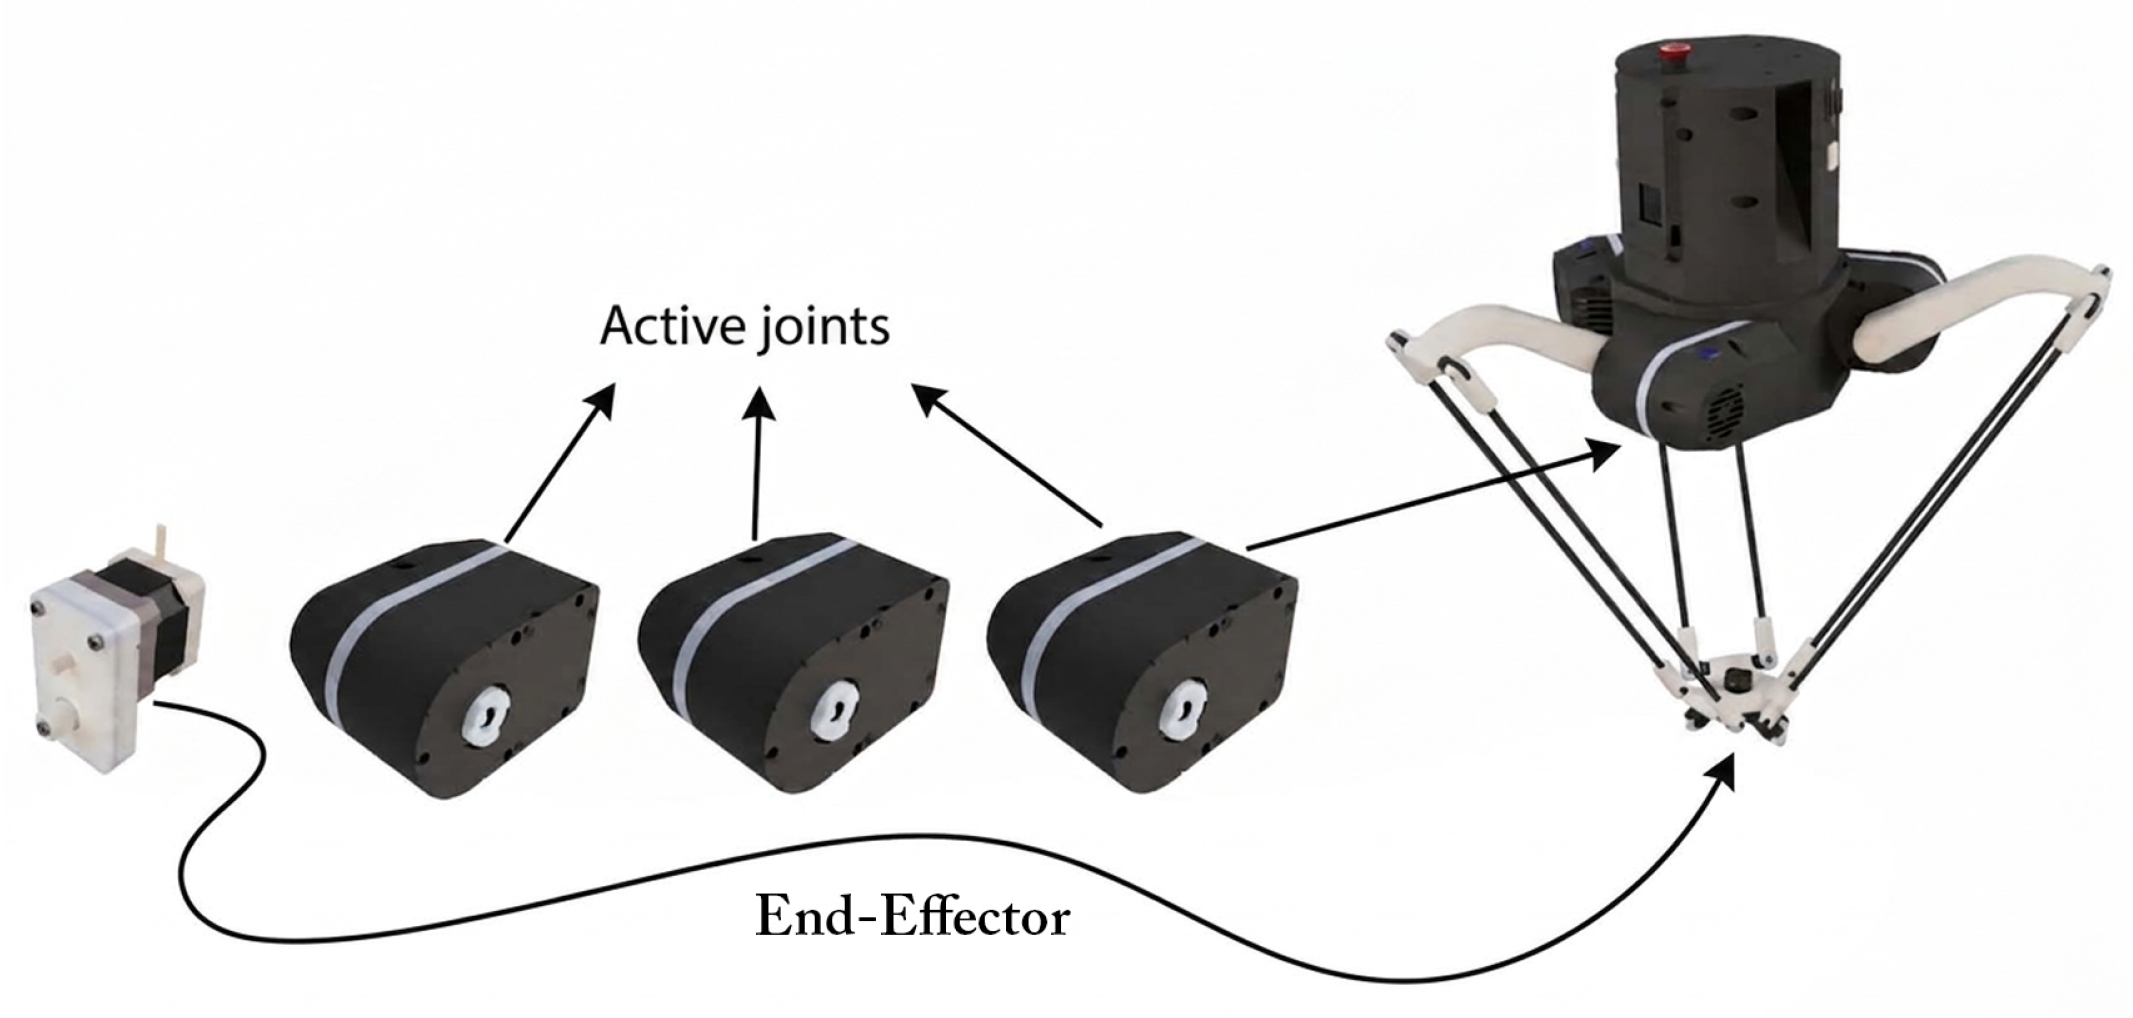
The system under study is an active joint integrated into a collaborative Delta robot intended for manipulation and assembly applications [3], as depicted in Figure 1. The joint contains the actuator, structural supports, motor-driving electronics, control hardware, electrical wiring, and an external polymeric enclosure. The components primarily responsible for heat generation during operation are the stepper motor, the TB67S109A motor driver (Toshiba Electronic Devices & Storage Corporation, Tokyo, Japan), and the STM32F103 microcontroller (STMicroelectronics, Geneva, Switzerland).
Figure 1.
Target studied system: Oscar Delta robot and the target active joint in [3].
The existing joint case was originally developed for operation under laboratory conditions. It is manufactured from acrylonitrile butadiene styrene (ABS), selected because of its low cost, reduced mass, electrical insulation, and compatibility with additive manufacturing. The joint’s openings permit direct air exchange between the internal volume and the surrounding environment, thereby contributing to heat dissipation but providing only limited resistance to the ingress of dust and liquids. The purpose of the present study is not to demonstrate an improved ingress protection rating, but to determine the thermal consequences of restricting these ventilation paths within the existing architecture. However, ABS’s relatively low thermal conductivity limits heat transfer through the enclosure walls compared with metallic housings.
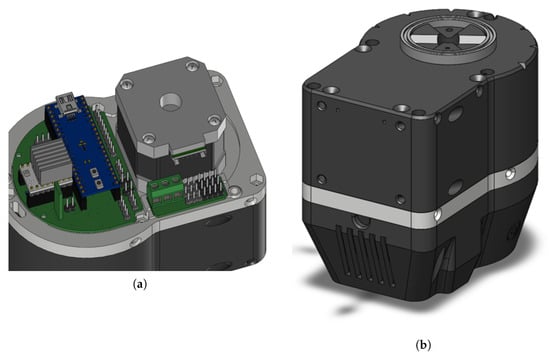
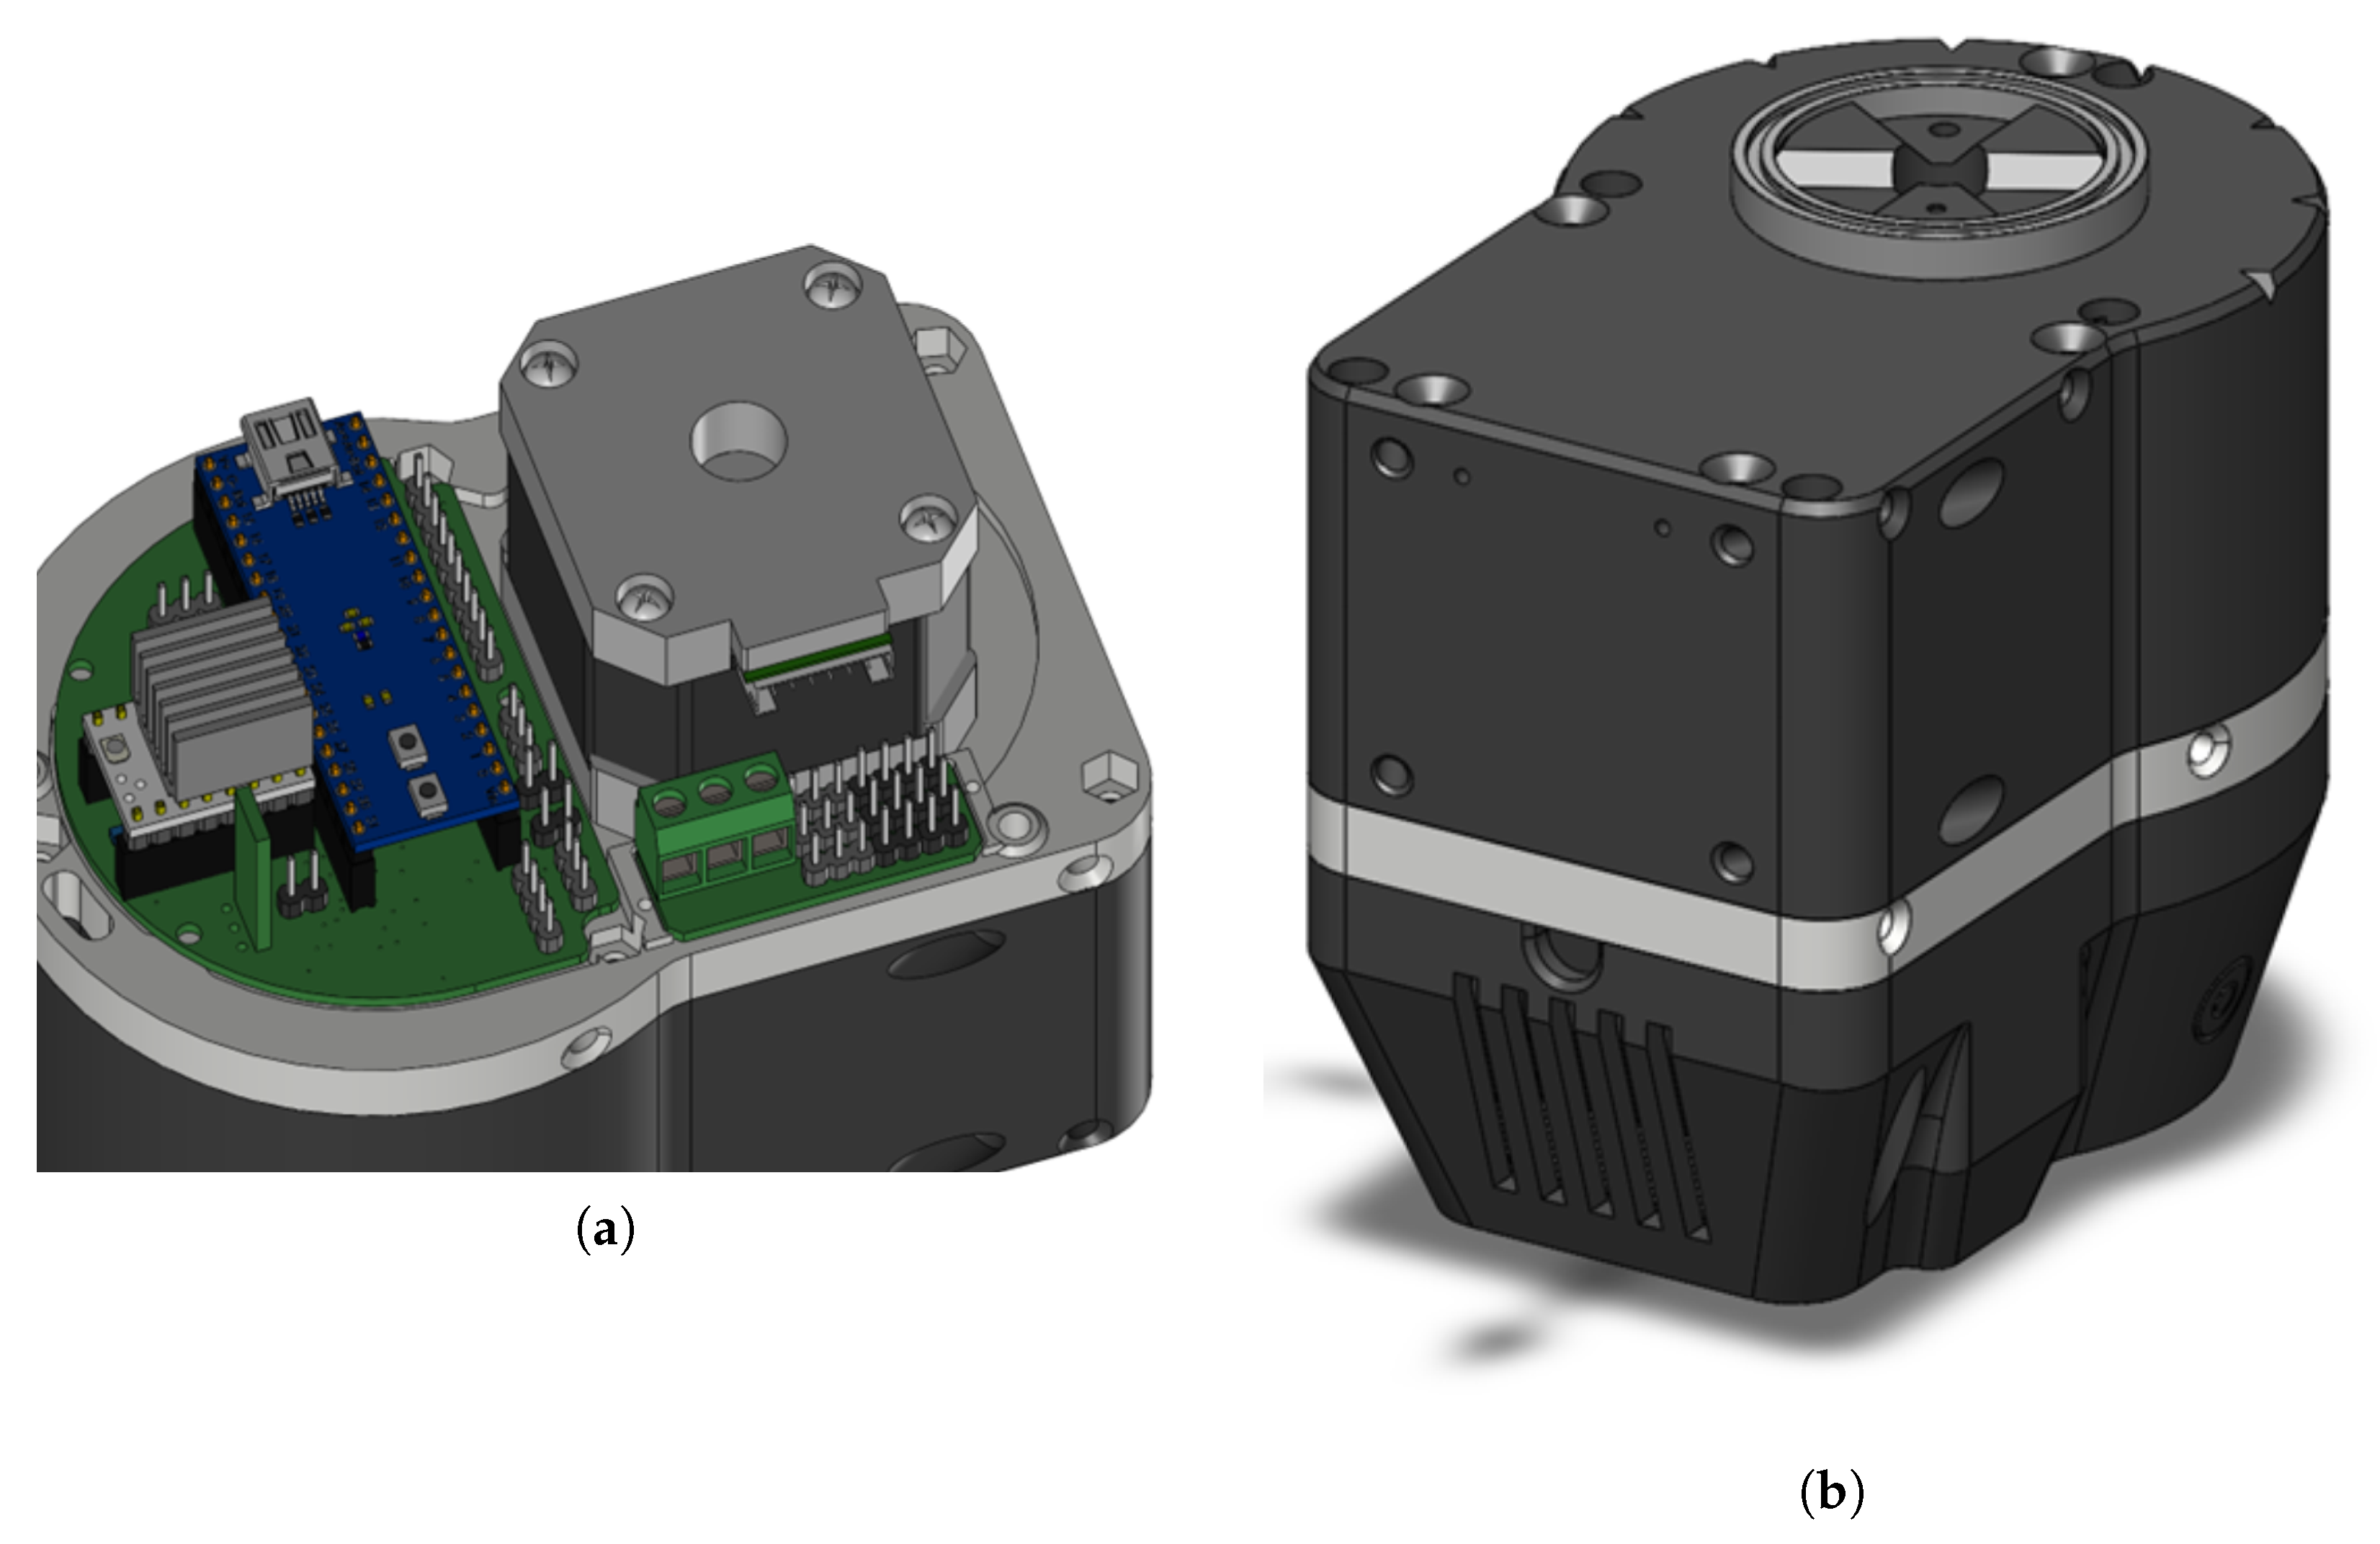
The original CAD model of the study exhibited a high level of geometric detail and comprised 58 distinct components (see Figure 2). For thermal analysis, the geometry was simplified to retain only the elements relevant to heat generation, heat transfer, and enclosure behavior. After the geometric cleaning and simplification stage, the working model was reduced to 18 components, as illustrated in Figure 3. In addition, more than 80 chamfers, fillets, and other thermally non-critical geometric details were removed.
Figure 2.
Original CAD representation of the baseline active-joint adopted for thermal study: (a) internal arrangement showing the principal heat-generating components; and (b) external geometry and ventilation features.
Figure 3.
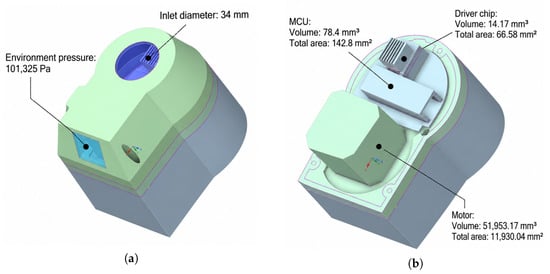
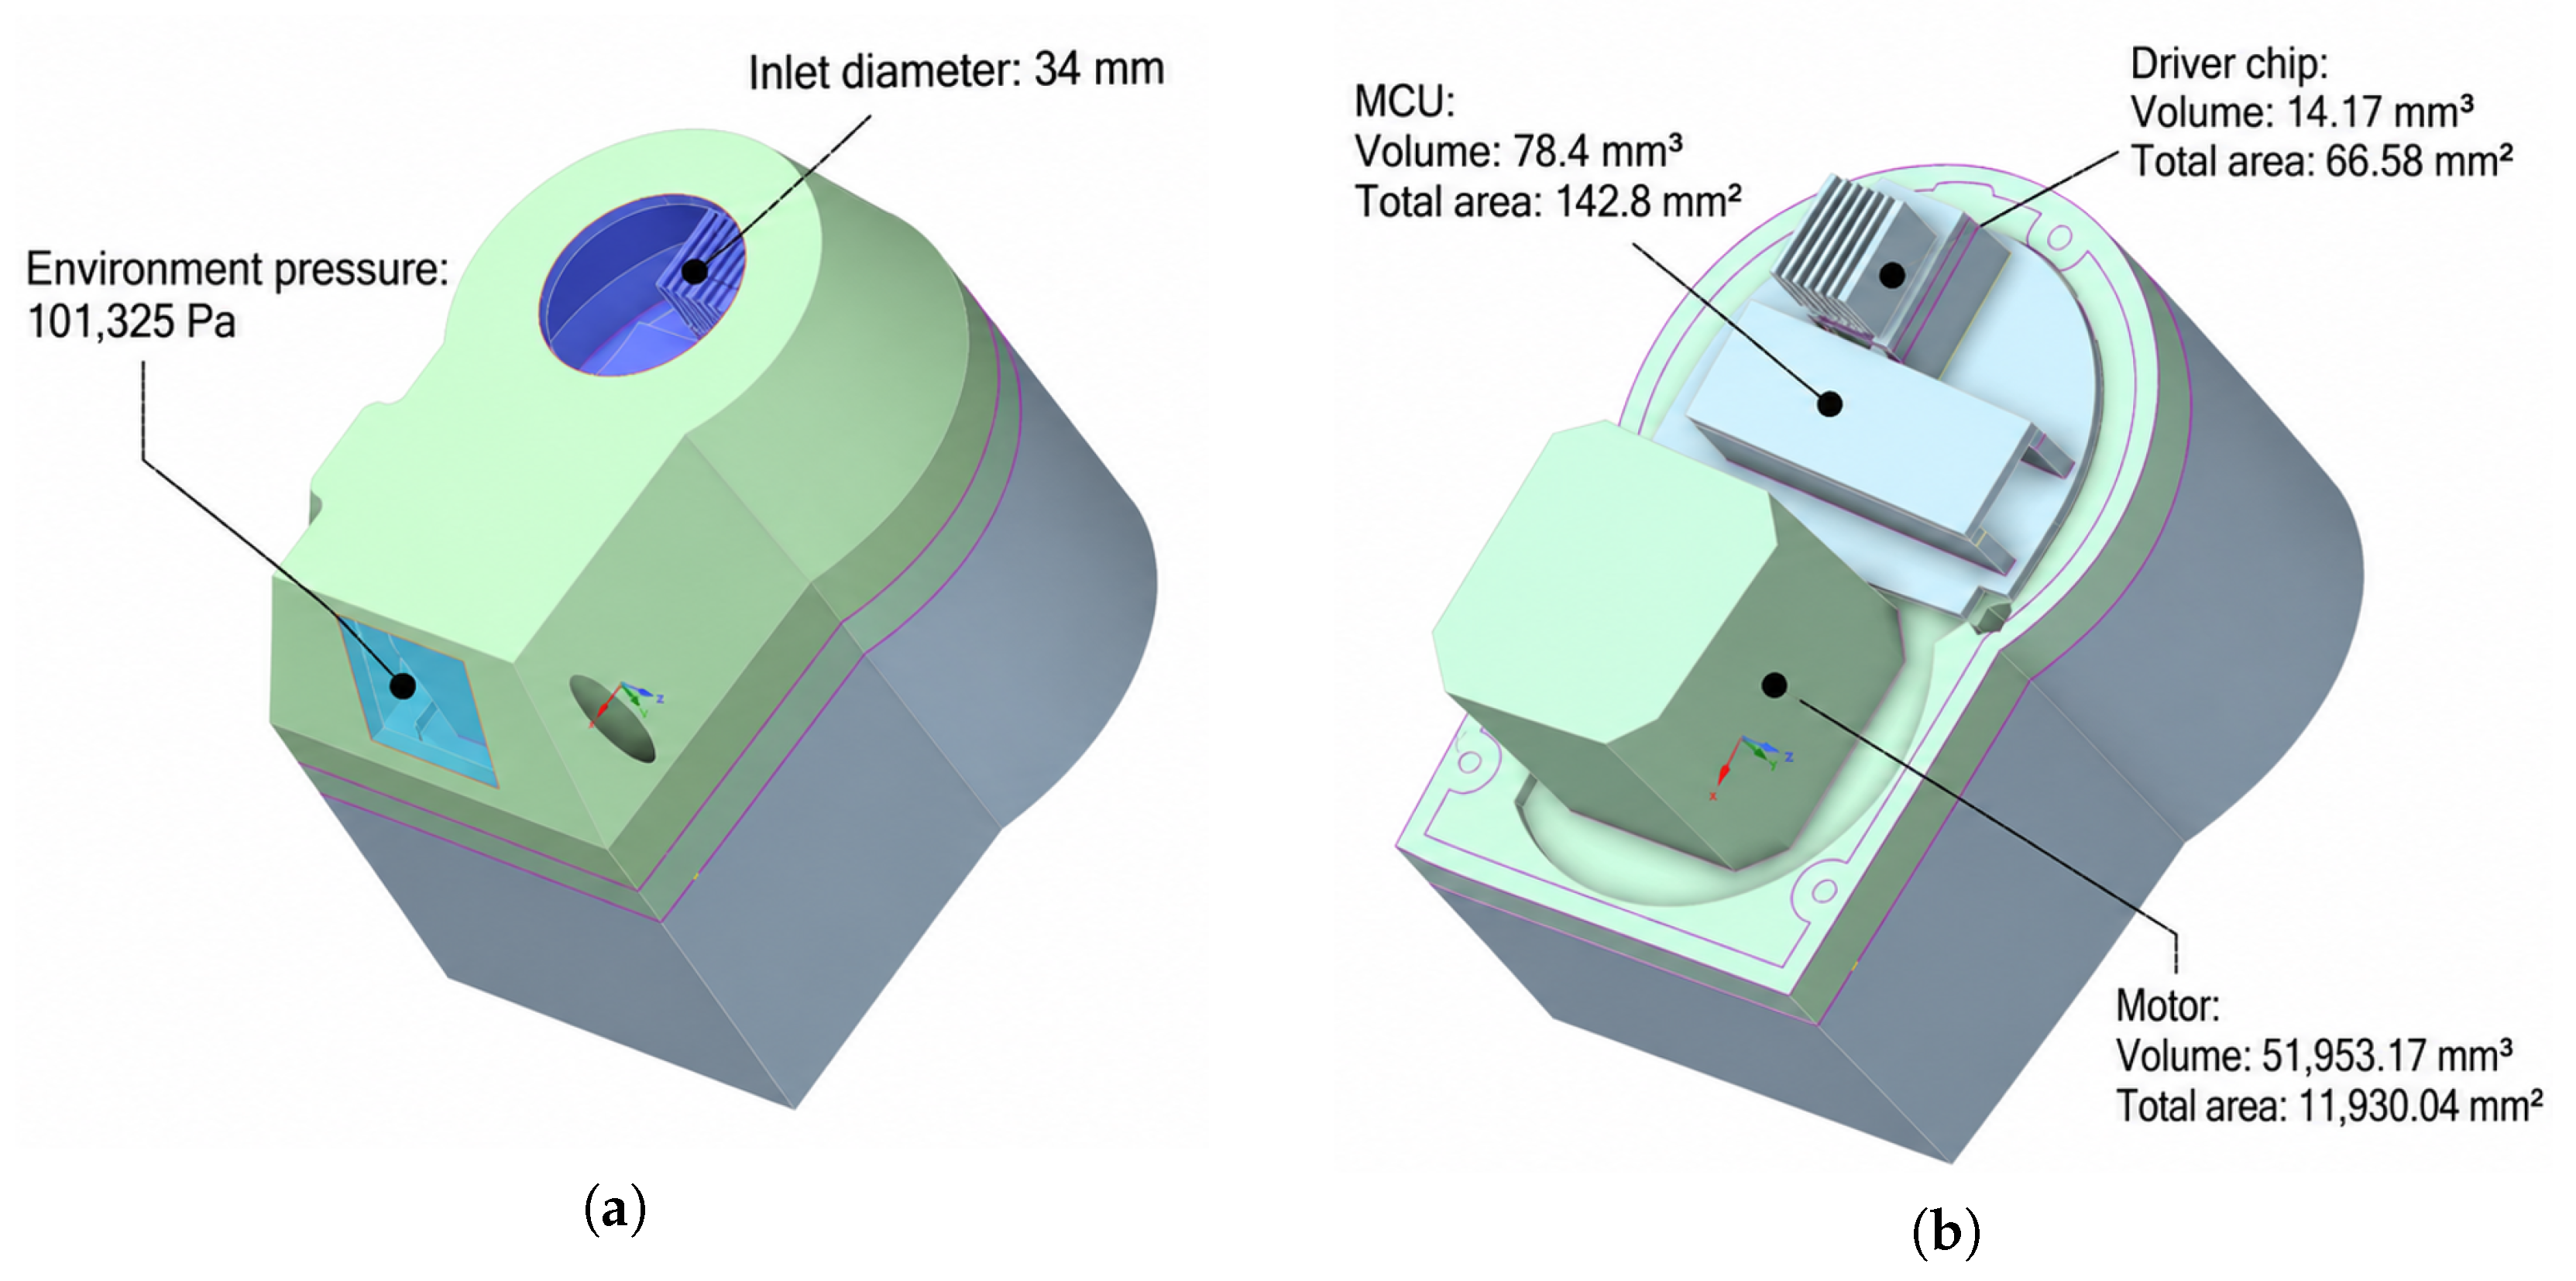
Simplified CAD representation of the baseline active-joint used in the thermal study: (a) external geometry indicating the 34 mm inlet diameter and the ambient-pressure outlet boundary (101,325 Pa) for the forced-ventilation configuration; and (b) internal arrangement view showing the spatial arrangement of the motor, microcontroller, and driver assembly, with respective volumes and surface areas of the modeled heat-source components.
Removing cables, connectors, and small structural details may reduce the modeled airflow resistance and alter micro-local recirculation and conductive heat-transfer paths, potentially affecting predicted hotspot temperatures. Because these effects were not quantified through a comparison with the original geometry, the simplified model is used for comparative assessment of ventilation configurations rather than precise reproduction of local temperatures.
2.2. Assessment of the Heat Sources
The active joint’s thermal model included three principal heat sources, namely the stepper motor, the TB67S109A driver, and the STM32F103 microcontroller. Table 1 outlines the nominal thermal load of these components, adopted from manufacturer data [12,13].
Table 1.
Main heat sources and their corresponding maximum heat generation power, considered in the active joint.
Hence, the total thermal power considered in the model is given by
By adopting values from Table 1, one has
where is the maximum total thermal power dissipated from the internal electronic components of the joint, adopted as a constant thermal load for the numerical analysis. Preliminary electrical measurements were also performed to assess whether the magnitude of the adopted thermal loads was in an acceptable order. With the joint energized under idle conditions (where the motor is not operating), a voltage of 23.995 V and a current of 0.076 A were measured, corresponding to an electrical input power of 1.824 W, which relatively aligns with the adopted nominal thermal power of the MCU and the driver while the motor is not producing heat. Table 2 summarizes the measured values of voltage, current, and power loss for the joint in different conditions. By supplying the joint with 24 V, 0.18 A was derived from the power supply, leading to the total power consumption of 4.32 W. An deviation from the total nominal thermal power is a system-level comparison of power magnitudes of the adopted values, considering the geometry simplification discussed in Section 2.1.
Table 2.
Comparison between adopted and measured electrical power values.
Remark 1.
The adopted values in (2) were treated as constant thermal inputs to provide a common, reproducible basis for comparison across the numerical configurations. In particular, the studied model did not account for variations. It should be noted that the adopted value represents an equivalent upper-bound thermal loading condition rather than the exact instantaneous heat dissipation of the complete joint during a particular motion cycle. However, the electrical input power is not considered equivalent to the thermal dissipation of the individual components; specifically, the electrical input to the motor may include mechanical output power. Therefore, the 4.32 W measurement is used only as a system-level magnitude check for the adopted thermal loading, not as an explicit validation of the individual component-level heat-generation values.
2.3. Material Properties
In the preliminary thermal characterization, the enclosure was modeled using representative thermophysical properties for ABS. The remaining components were represented using the material definitions assigned within the CAD and simulation environment. The ABS enclosure was treated as a homogeneous and isotropic solid with constant properties over the investigated temperature range. This representation is not explicitly influenced by additive manufacturing parameters such as raster orientation, infill pattern, porosity, interlayer interfaces, or direction-dependent thermal conductivity. The adopted values are summarized in Table 3.
Table 3.
Material properties for the ABS enclosure, motor body, electronic boards, connector housings, and microcontroller and driver bodies.
2.4. Numerical Modeling Framework
The numerical thermal model was developed in SolidWorks Flow Simulation, version 2024 SPx (Dassault Systèmes, Vélizy-Villacoublay, France) [14] as an external conjugate heat-transfer analysis, with fluid flow and solid conduction enabled. The air domain included the regions inside and outside the enclosure, allowing heat conduction through the solid components to be coupled with convective heat transfer to the surrounding air. Gravity was applied along the negative z-direction with an acceleration of − to account for buoyancy-driven flow. External heat rejection was therefore accounted for in the coupled fluid–solid model.
The numerical thermal model was evaluated in SolidWorks Flow Simulation, v. 2024. The model was developed as a conjugate heat-transfer problem, in which heat conduction through the solid components was coupled with heat transfer within the surrounding air domain. The thermal behavior was subsequently modeled as the interaction among the prescribed heat generation of the internal components, conduction through the enclosure’s solid interface, and convection within the fluid domain around the active joint.
Heat conduction through the solid areas is described as
where is the solid density, is the specific heat capacity, is the solid material’s thermal conductivity, T is the temperature, and is the volumetric heat-generation rate. Note that is the partial derivative of a function with respect to time, and ∇ is the gradient operator. Moreover, Heat transfer within fluid convection is governed by
where is the fluid density, h is the specific enthalpy, u is the fluid velocity, and is the thermal conductivity of air; and the heat flux according to Fourier’s law is calculated as . The continuity and momentum equations are discussed in [7].
All calculations were performed using SI units, and the initial and ambient temperatures were set to C. The numerical model included heat conduction within the solid components and convection within the air domain. Moreover, a transient simulation was performed for the fully closed case. This approach made it possible to analyze the temporal evolution of the temperatures in the main components and the enclosure, rather than only the final thermal equilibrium. Note that thermal radiation was not explicitly included in the present numerical model. This represents a simplifying assumption and a limitation of the analysis, particularly for the elevated temperatures predicted in the natural-convection and fully closed configurations. Consequently, the absolute steady-state temperatures obtained from the radiation-neglected model should not be interpreted as exact physical operating temperatures.
Assumption 1.
The fully closed steady-state results in Section 3 should be interpreted as a radiation-neglected numerical limiting condition rather than an exact estimation of the attainable operating temperature. At the predicted temperature levels, radiative heat transfer may contribute to heat rejection from both the internal components and the external enclosure surfaces. Therefore, this modeling constraint must be considered when interpreting absolute temperature values. The primary aim of the current framework is to quantify the thermal penalty associated with eliminating direct air exchange, while maintaining the same adopted heat load as in Section 3.3.3.
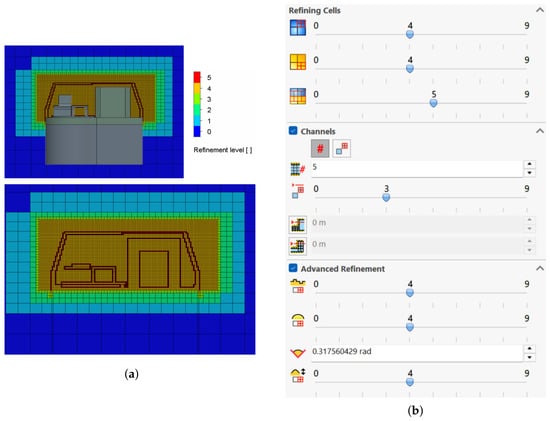
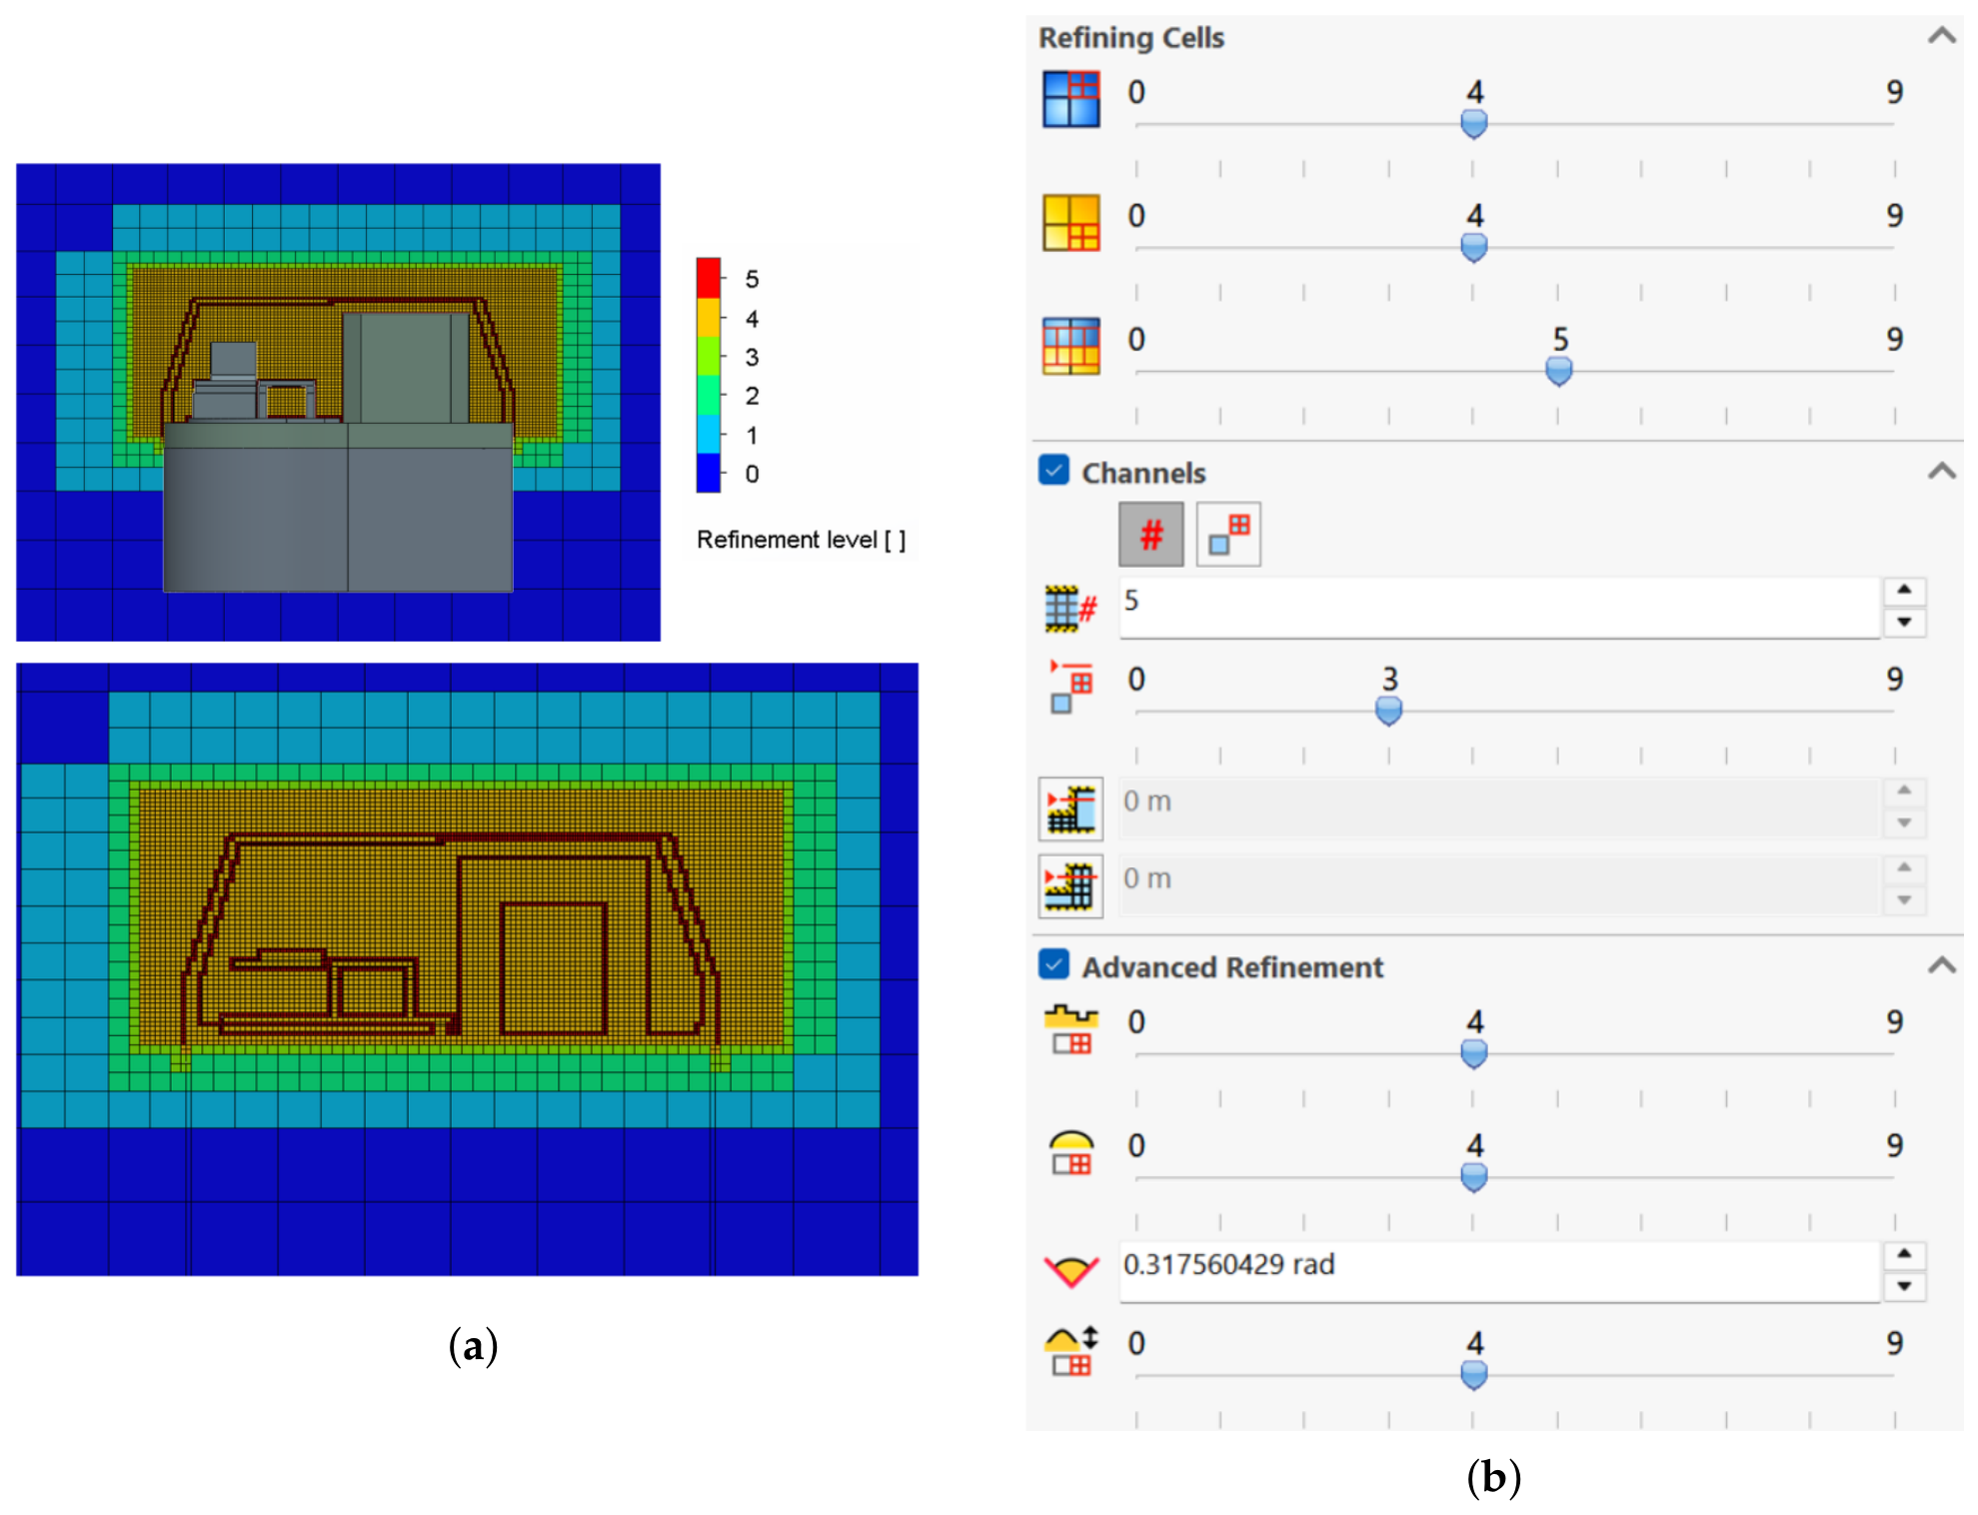
Local mesh refinement was applied to regions expected to exhibit significant thermal and flow gradients, particularly around the heat-generating components, the internal air volume, and the enclosure boundaries. A mesh sensitivity assessment was subsequently performed for the closed configuration by comparing solutions obtained at different mesh refinement levels. The resulting temperature predictions and mesh-dependence analysis are presented in Section 3.3. Also, the refined mesh configuration and the computational mesh settings are depicted in Figure 4.
Figure 4.
(a) Refined mesh configuration for the active joint; (b) mesh setting in SolidWorks’ environment.
2.5. Experimental Temperature Acquisition System
To interpret thermal behavior in detail and obtain indicative temperature levels, an experimental acquisition system was developed. The central acquisition unit was an ESP32 microcontroller (Espressif Systems, Shanghai, China), powered and connected through micro-USB. The system was designed to measure both air and surface temperatures at selected points on the active joint.
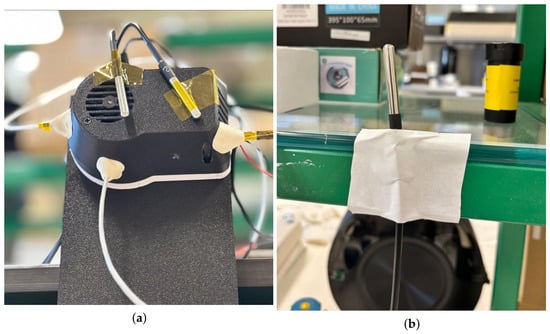
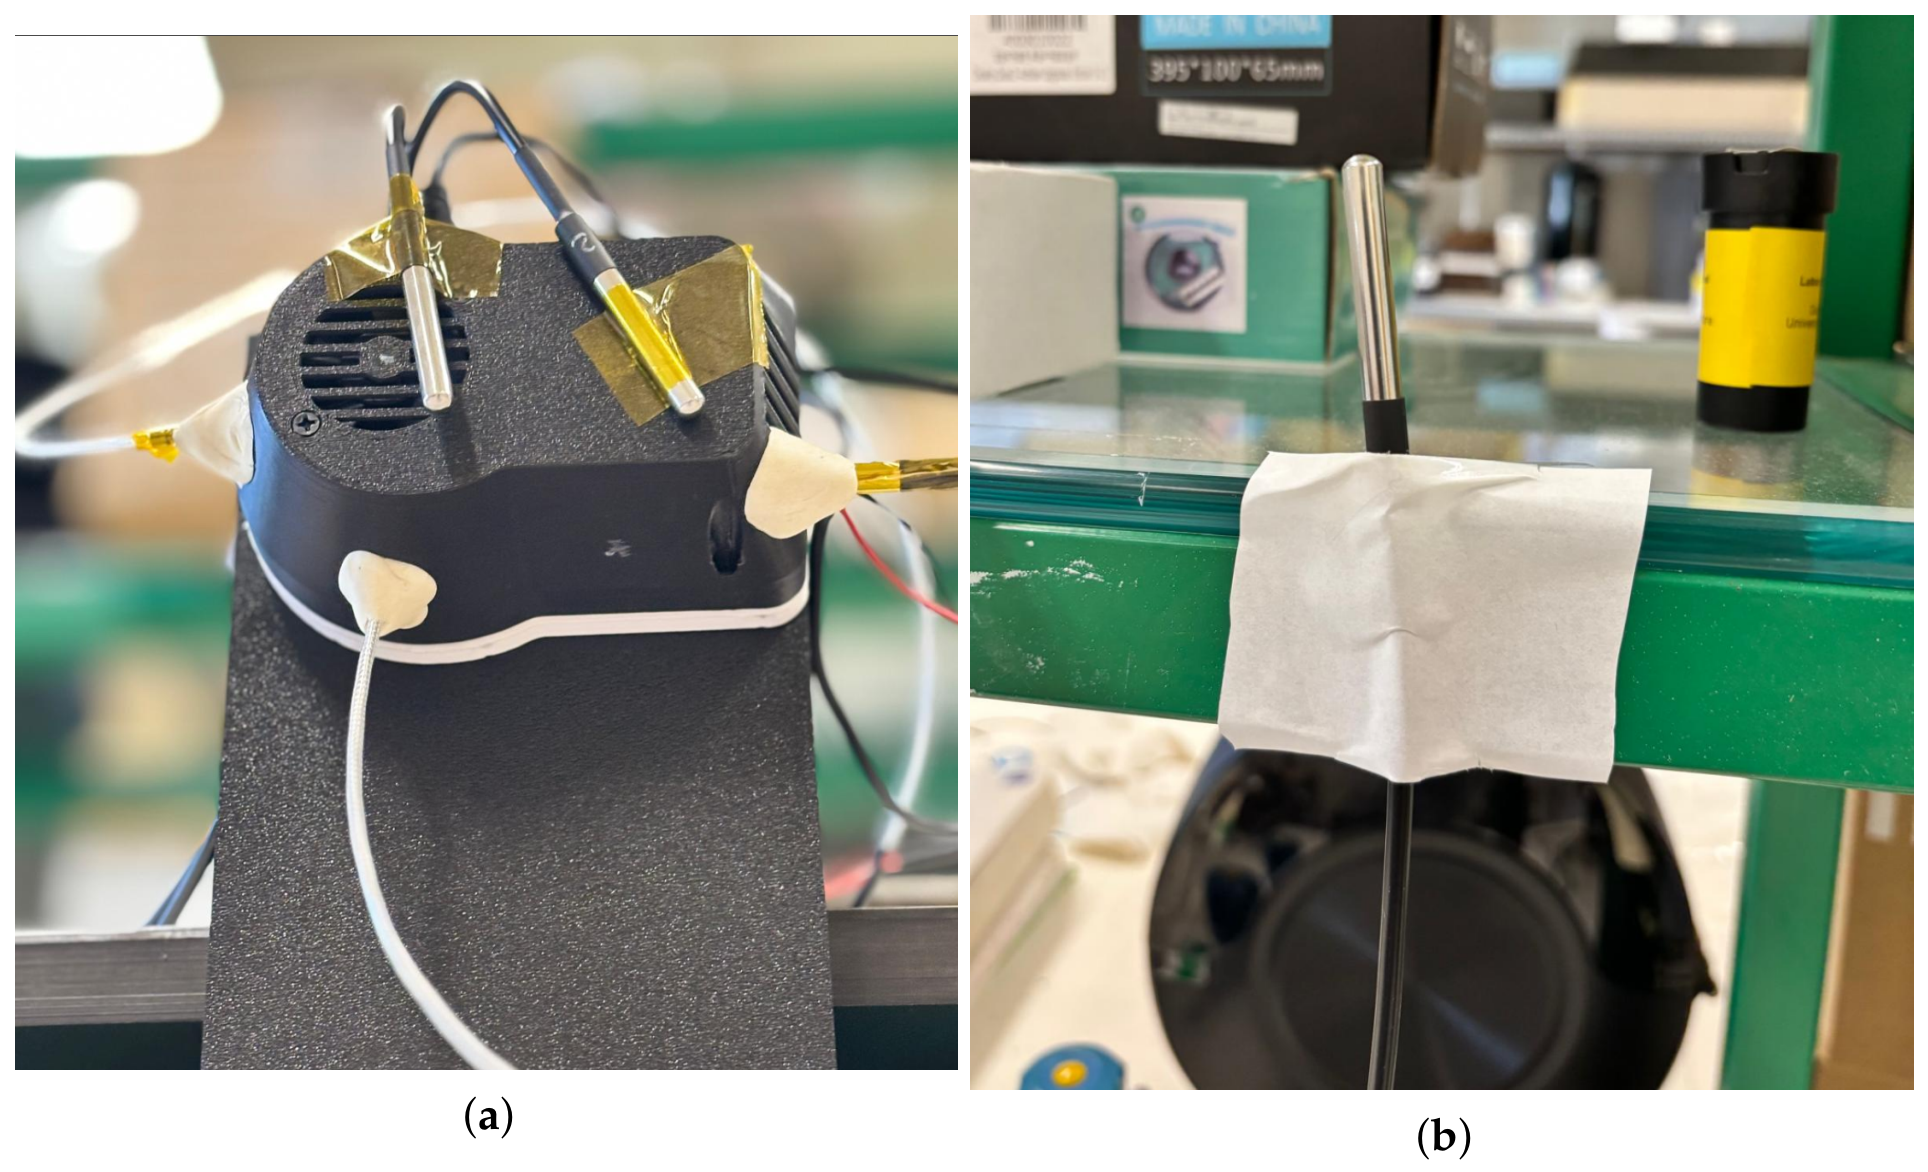
For air temperature measurements, four DS18B20 digital sensors (Maxim Integrated, San Jose, CA, USA) were used (see Figure 5), connected to the ESP32 through a 1-Wire bus and a 4.7 k pull-up resistor. These sensors were intended to monitor the temperature of the air outside the joint, near the motor windings, electronic components, and inside the joint’s case. According to the manufacturer’s information, the nominal accuracy of the DS18B20 sensor is approximately C within its operating range [15].
Figure 5.
Experimental setup of the active joint with the temperature sensors positioned for (a) internal and external air (three DS18B20) and surface (two PT100) measurements; and (b) ambient air temperature around the active joint with a DS18B20 sensor.
For surface temperature measurements, two 3-wire PT100 sensors connected to MAX31865 modules (Analog Devices, Wilmington, MA, USA) were used. These modules communicated with the ESP32 through the SPI interface, sharing the main communication lines while using independent chip-select pins [16].
A complete uncertainty budget for the PT100/MAX31865 measurement channels could not be established because the probe’s accuracy class and the reference resistor’s tolerance were not documented. These measurements are therefore treated as preliminary surface-temperature observations rather than quantitative CFD validation data, with the relevant uncertainty sources discussed in Section 2.6.
Firmware was developed in Arduino IDE to read all sensors and transmit the temperature data to a computer. The experimental setup included an ESP32-based acquisition system, four DS18B20 sensors for air temperature measurements, and two PT100 sensors for surface temperature measurements.
2.6. Experimental Mounting and Thermography
To better reproduce the real operating position of the active joint, a dedicated support was designed and manufactured in PLA using 3D printing. This support allowed stable positioning of the joint and the associated acquisition hardware during testing. Sensors were then placed at the predefined measuring points, as depicted in Figure 5.
Surface temperatures were measured using two three-wire PT100 probes connected to MAX31865 resistance-to-digital converter modules through an SPI interface. The measurement-channel uncertainty includes contributions from the PT100 element tolerance, converter accuracy, reference-resistor tolerance and drift, residual lead-resistance mismatch, and probe self-heating. For surface measurements, thermal contact and heat exchange between the probe and its surroundings introduce additional installation effects. Although the three-wire configuration compensates for matched lead resistances, it does not eliminate all wiring-related errors. The available documentation does not establish the probe accuracy class or the reference-resistor tolerance, and a complete channel uncertainty budget could therefore not be determined. The PT100 measurements are consequently reported as preliminary observations without an assigned expanded uncertainty and are not used to establish quantitative agreement with the CFD predictions. One measured the enclosure surface temperature adjacent to the inlet opening, while the second measured the motor surface temperature. These locations were selected to monitor the local enclosure response near the ventilation inlet and the actuator’s surface heating, respectively; neither probe measured the driver or MCU surface temperature.
DS18B20 sensors are primarily used to measure air temperature at various locations around the active joint, including the external environment and the internal regions associated with the main heat-generating components. The ambient air temperature was measured using a DS18B20 positioned outside the enclosure, 20 cm laterally from the joint and at approximately the same vertical level as the joint. The sensor was maintained without physical contact with the structure and positioned away from the direct airflow path.
In addition to the discrete temperature sensors, an FLIR E5 thermal camera (FLIR Systems, Wilsonville, OR, USA) was used as a complementary diagnostic tool [17]. Unlike point measurements from sensors, thermography enables qualitative and semi-quantitative visualization of the surface temperature distribution. It facilitates the identification of localized hot spots, especially in electronics and dissipator regions. Moreover, the thermographic observations were interpreted primarily as semi-quantitative data, accounting for uncertainties in emissivity, reflected radiation, and measurement conditions. Therefore, the thermographic data were used to identify the heating pattern and critical regions, rather than as a high-accuracy quantitative validation tool.
3. Results
3.1. Preliminary Experimental Results
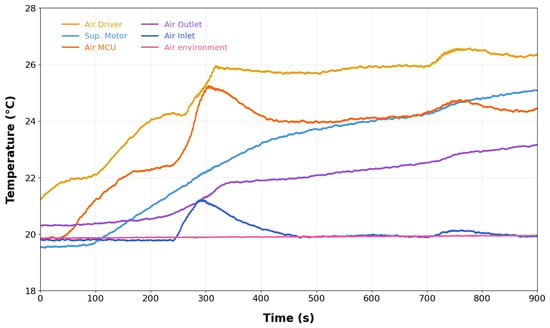
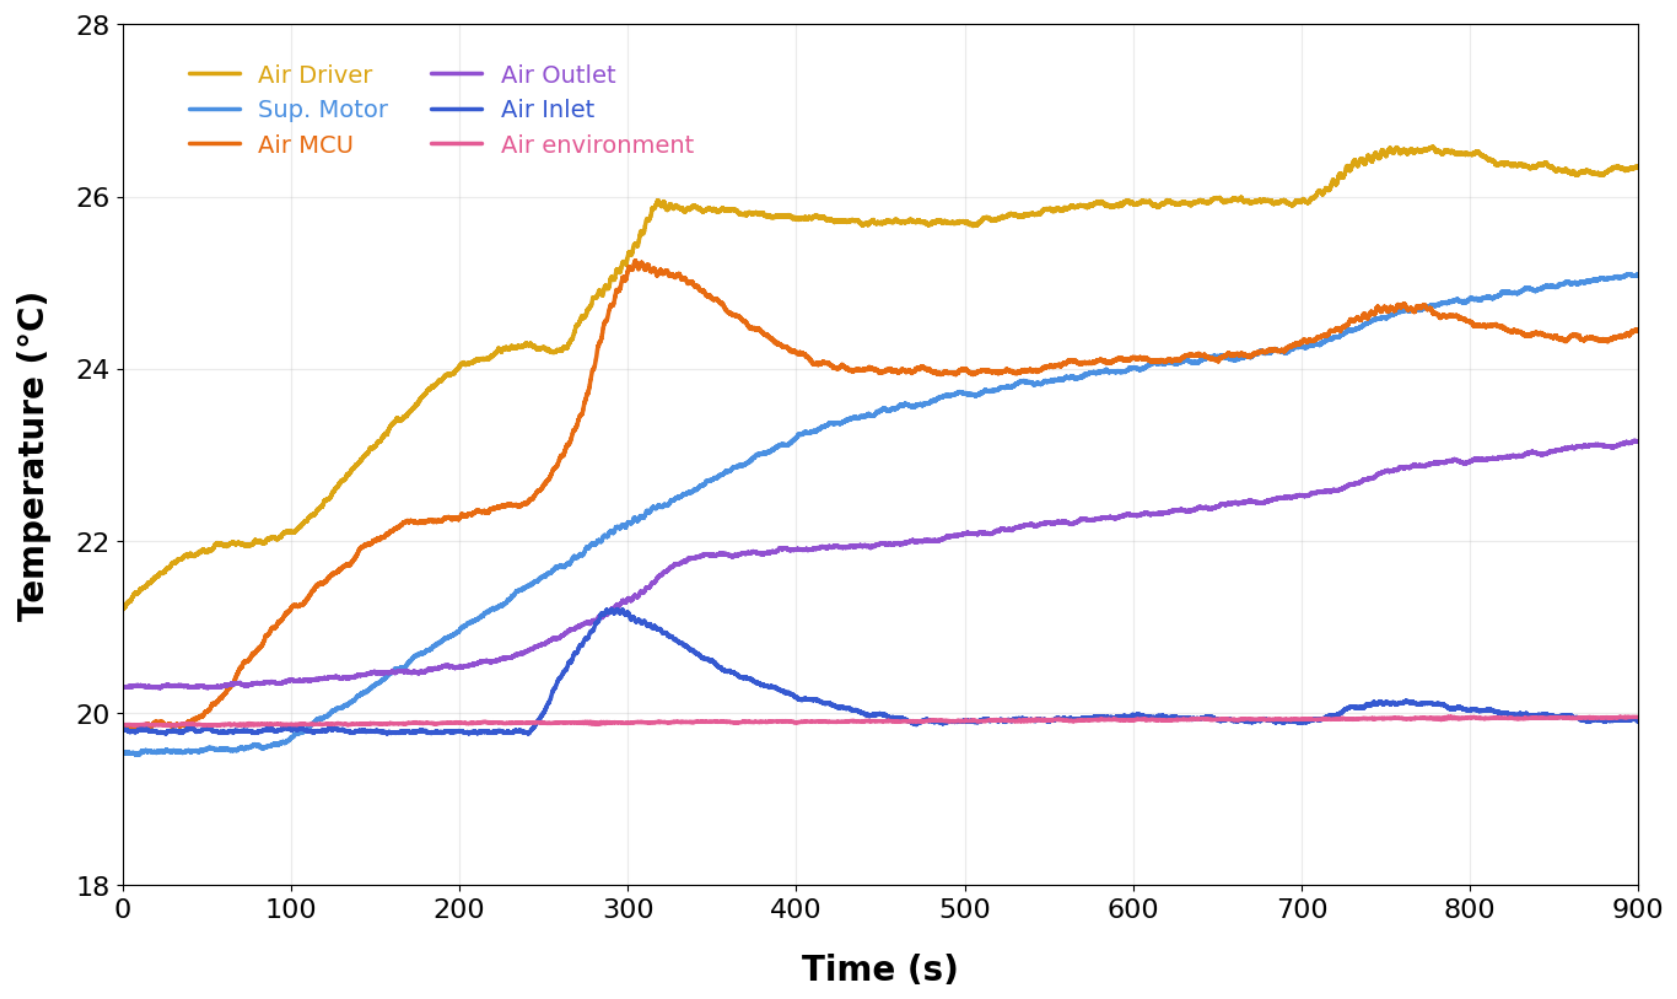
The preliminary experiment comprised two consecutive stages: operation with forced ventilation from 0 to 900 s, followed by operation with the fan switched off from 900 to 1300 s. During the first stage, the air near the driver and MCU exhibited the highest measured air temperatures, while the inlet and ambient temperatures remained comparatively low (Figure 6).
Figure 6.
Experimental temperature evolution of the active joint from 0 to with activated forced ventilation. The curves correspond to the temperatures of the air near the inlet (Dark Blue), the motor surface (Light Blue), the outlet air (Purple), the ambient air (Pink), air near the MCU (Red), and the surrounding air around the driver (Yellow).
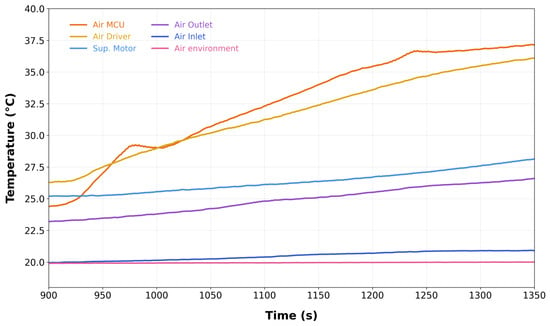
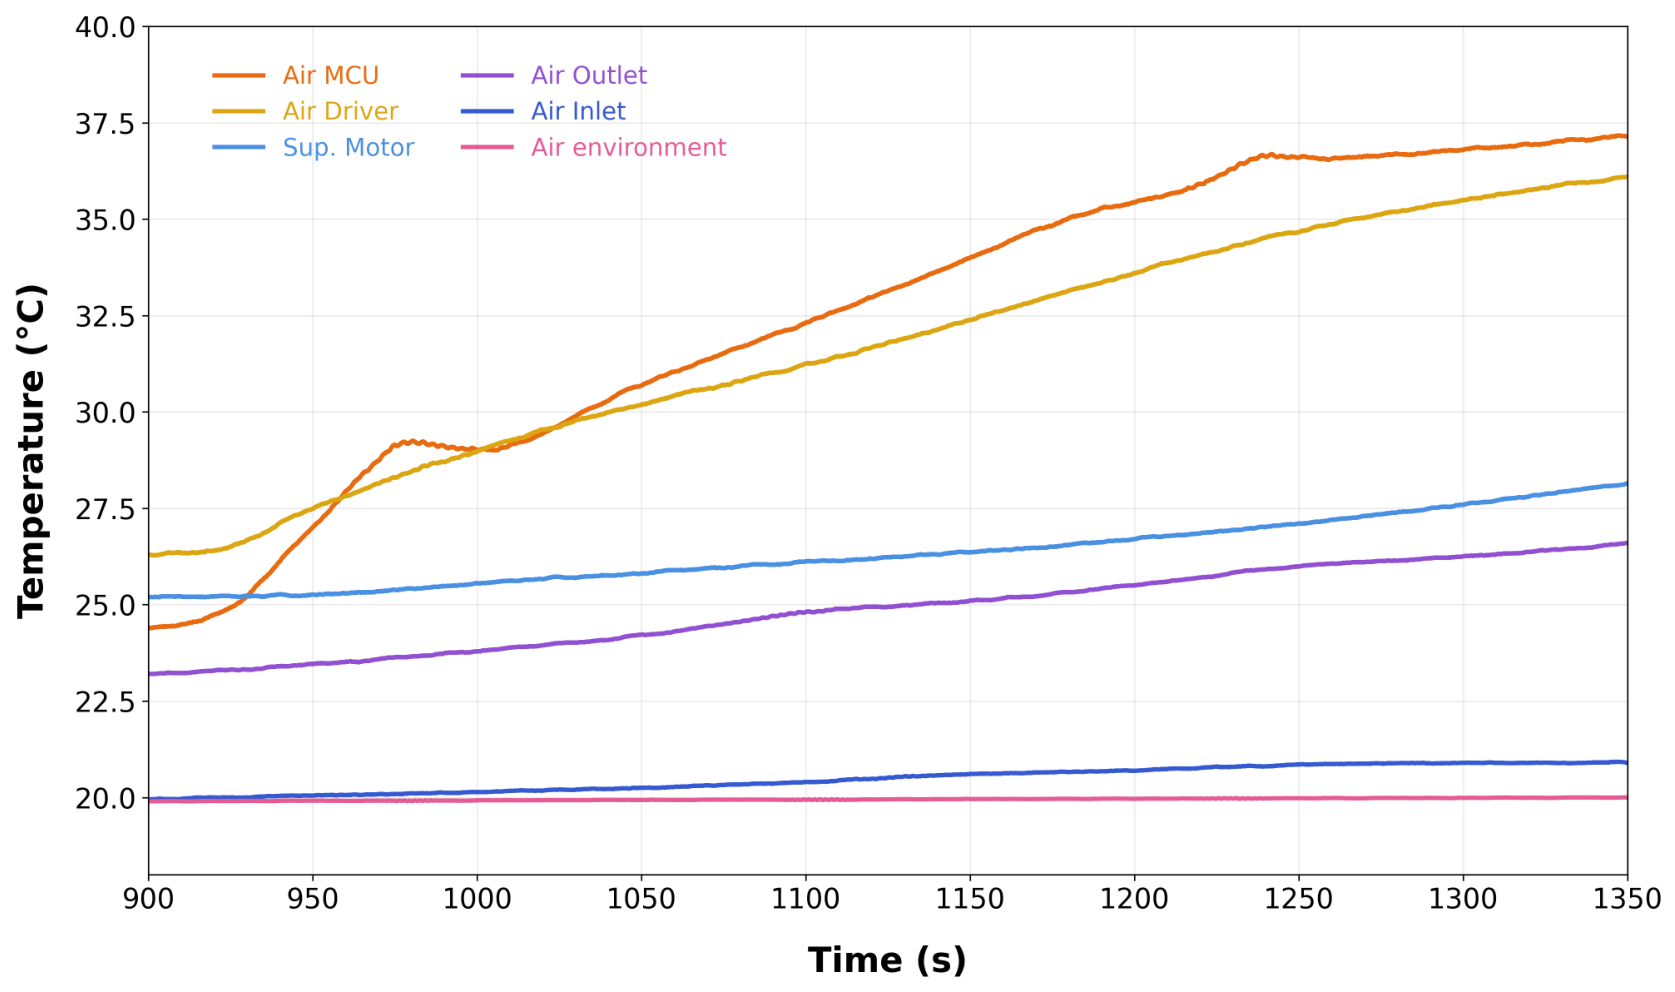
After the fan was switched off, heating intensified around the electronics, and the motor-surface and outlet-air temperatures continued to increase despite a comparatively stable ambient temperature (Figure 7). An automatic shutdown occurred during this stage. The principal experimental observation was therefore the deterioration in the joint’s thermal response following the removal of ventilation. The air-temperature measurements near the electronics should be distinguished from component-surface or junction temperatures.
Figure 7.
Experimental temperature evolution of the active joint from 900 to after switching off forced ventilation. The curves correspond to the temperatures of the air near the inlet (Dark Blue), the motor surface (Light Blue), the outlet air (Purple), the ambient air (Pink), air near the MCU (Red), and the surrounding air around the driver (Yellow).
After 900 s, the fan was switched off while the motor maintained the operating condition of the previous stage. This transition produced a clear thermal accumulation, as shown in Figure 7. During the second stage, the temperatures in the electronics region increased more rapidly, particularly around the MCU and driver. At the same time, the motor surface and outlet air temperatures also continued to rise. The ambient temperature remained comparatively stable. As the driver temperature approached the protection threshold, the system eventually triggered an automatic shutdown to prevent further thermal escalation. These observations indicate that removing forced ventilation substantially deteriorates the thermal behavior of the active joint and may lead to protection-related interruption of operation.
The experimental assembly used a Sanyo Denki 109P0412H902 axial fan (SANYO DENKI Co., Ltd., Tokyo, Japan), measuring 40 × 40 × 10 mm and rated for 12 V DC operation. The manufacturer specifies a maximum free-air airflow of /min and a maximum static pressure of 41.2 Pa [18]. These values correspond to different endpoints of the fan characteristic and do not define the operating airflow through the assembled joint. The installed airflow was not measured independently, which limits quantitative comparison between the experimental and numerical ventilation conditions.
Consequently, the experimental results provide an initial indication that the thermal behavior of the current architecture is strongly dependent on active airflow. Importantly, the electronics region exhibited the highest temperatures throughout the test, suggesting that the thermal distribution is not uniform throughout the joint but is concentrated around the driver and adjacent electronics.
3.2. Thermographic Observations
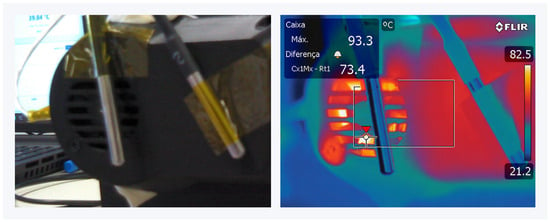
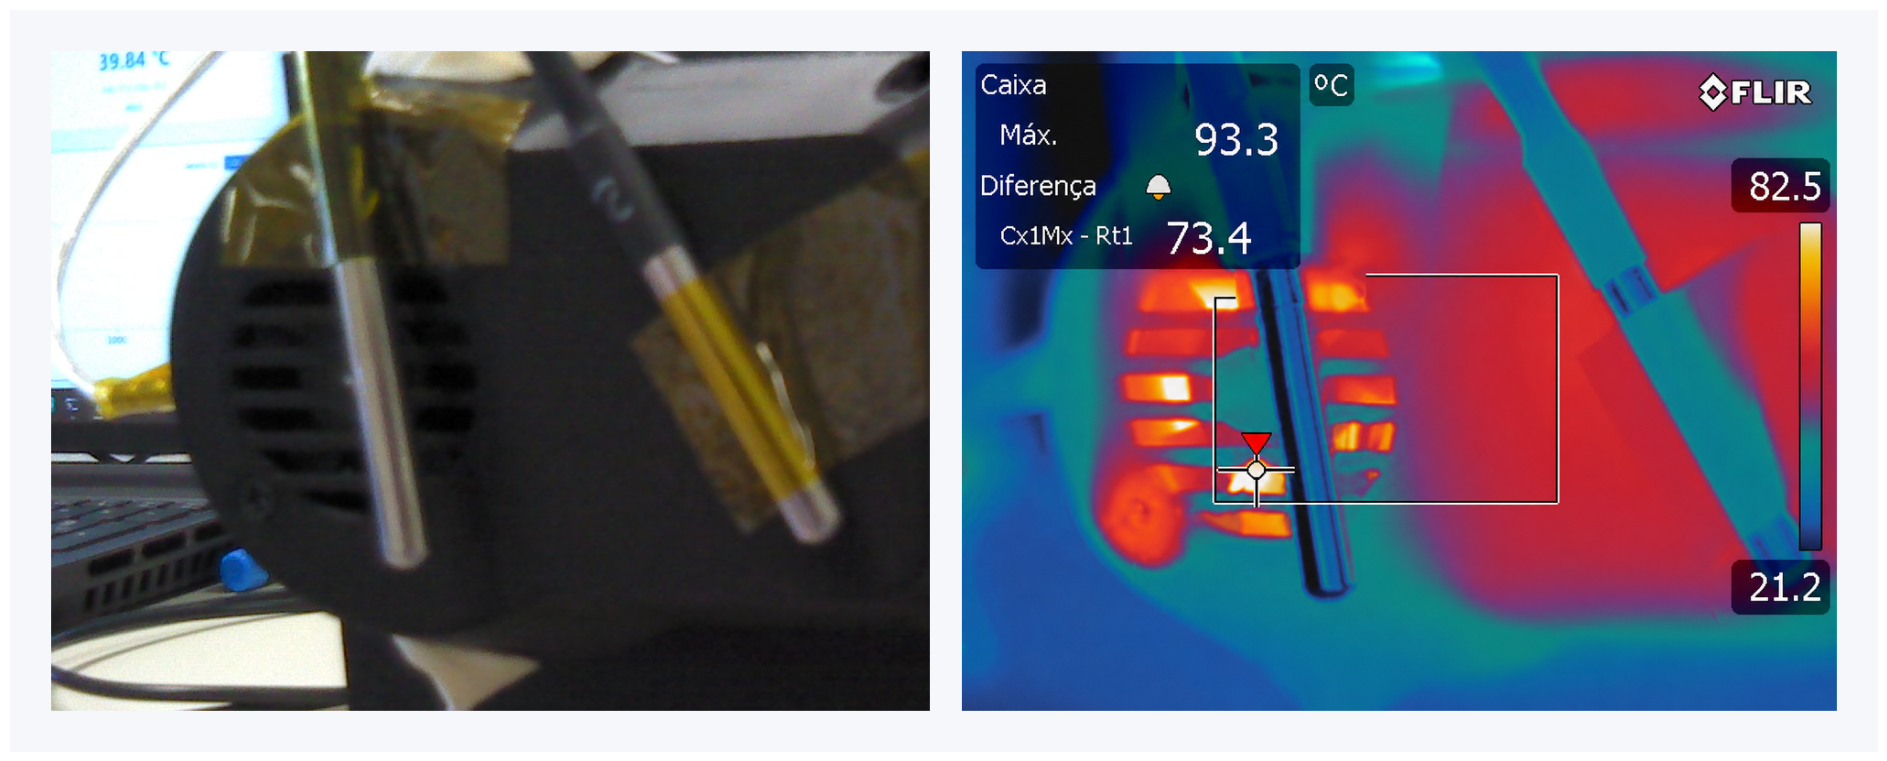
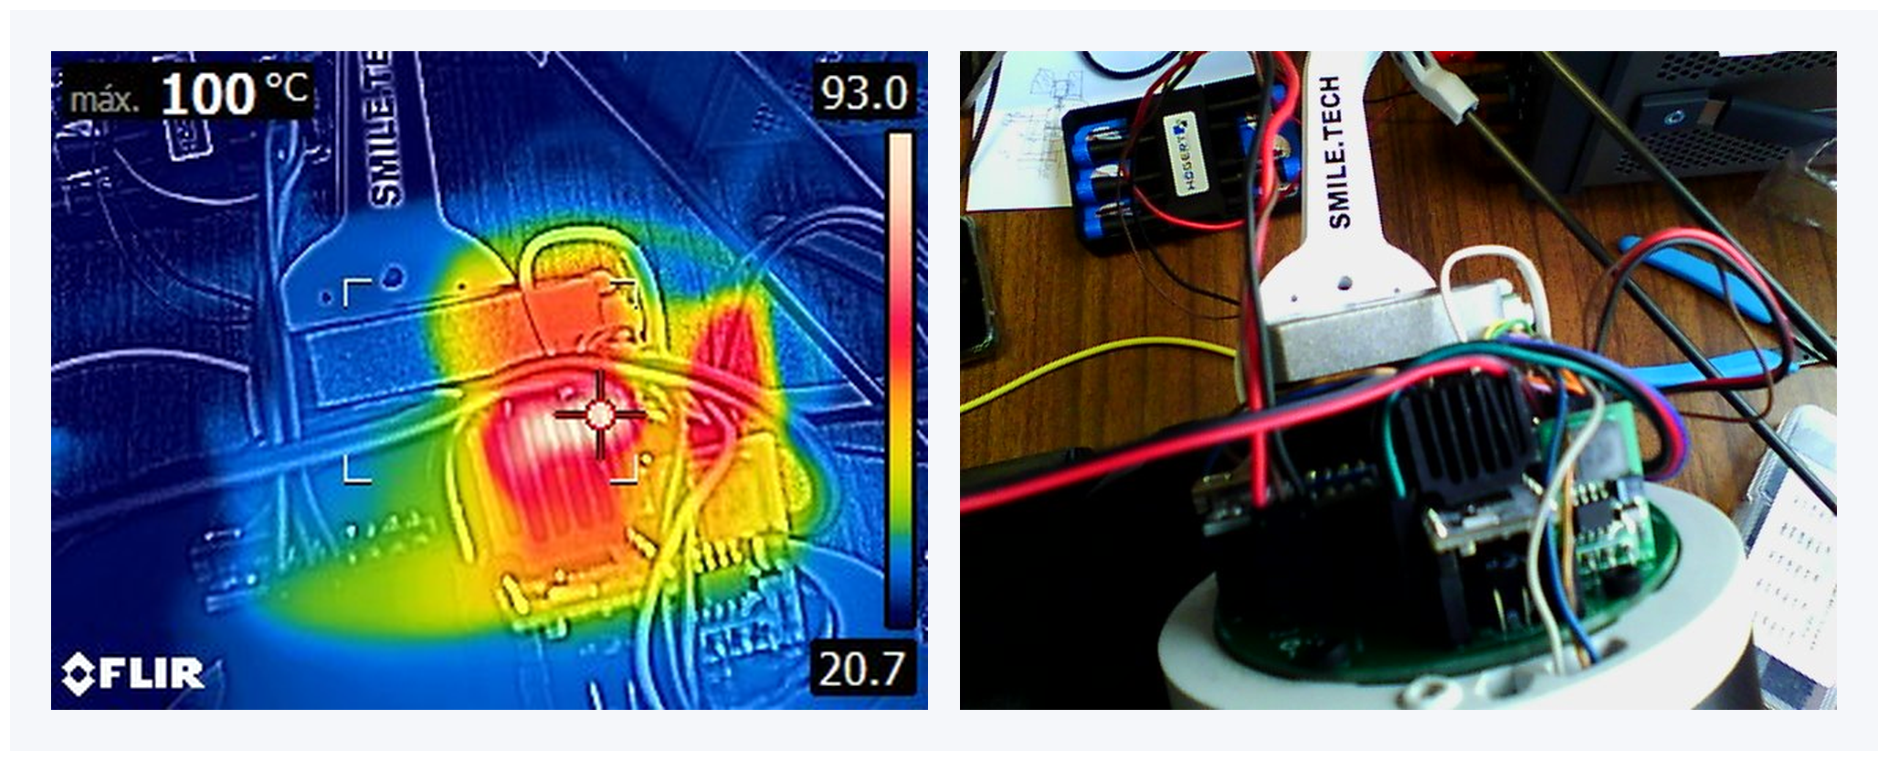
Thermography complemented the sensor measurements by identifying surface heating in the electronics and dissipator region. This region remained the dominant hotspot with forced ventilation (Figure 8) and exhibited further heating after the fan was switched off (Figure 9). The images provide spatial evidence of the critical thermal region, complementing the temporal response presented in Section 3.1; they do not establish the driver junction temperature or its protection threshold.
Figure 8.
Visible-light and thermographic views of the active joint, showing localized heating in the electronics and dissipator region.
Figure 9.
Thermographic observation with deactivated forced ventilation, showing temperatures approaching C in the critical region and the corresponding protection-related shutdown condition.
Figure 9 shows a temperature increase to approximately C after the ventilation fan is deactivated, which triggered the automatic shutdown of the system as a protection mechanism. This observation is consistent with the sensor measurements, which identified the driver and MCU region as the most thermally critical part of the joint.
The thermographic results support the experimental measurements and further indicate that thermal management is a critical constraint as enclosure sealing and protection levels increase. In particular, the thermographic analysis provided clear qualitative evidence that the absence of forced ventilation leads to a rapid increase in temperature in the electronics region, resulting in a significant deterioration of thermal conditions.
3.3. SolidWorks Flow Simulation Results
The numerical results compare forced ventilation, open natural convection, and closed natural convection under the prescribed thermal loads. A 300 s transient analysis additionally examines the early response of the closed configuration. Detailed component temperatures and flow quantities are reported in this section; the following discussion focuses on differences in temperature distribution and airflow. As explained in Section 2.4, omitting radiation limits the interpretation of absolute temperatures, particularly in the natural-convection cases.
3.3.1. Forced Convection
Forced ventilation was represented using an External Inlet Fan boundary condition with the pressure–flow characteristics of the Sanyo Denki 109P0412H902 axial fan. The boundary was applied normal to the circular inlet face, whose diameter of 34 mm corresponds to a gross cross-sectional area of 9.08 × . The resulting airflow depended on the fan characteristic and the flow resistance of the modeled enclosure, rather than on a prescribed constant velocity, volumetric flow rate, or mass flow rate. An Environment Pressure boundary of 101,325 Pa was assigned at the outlet.
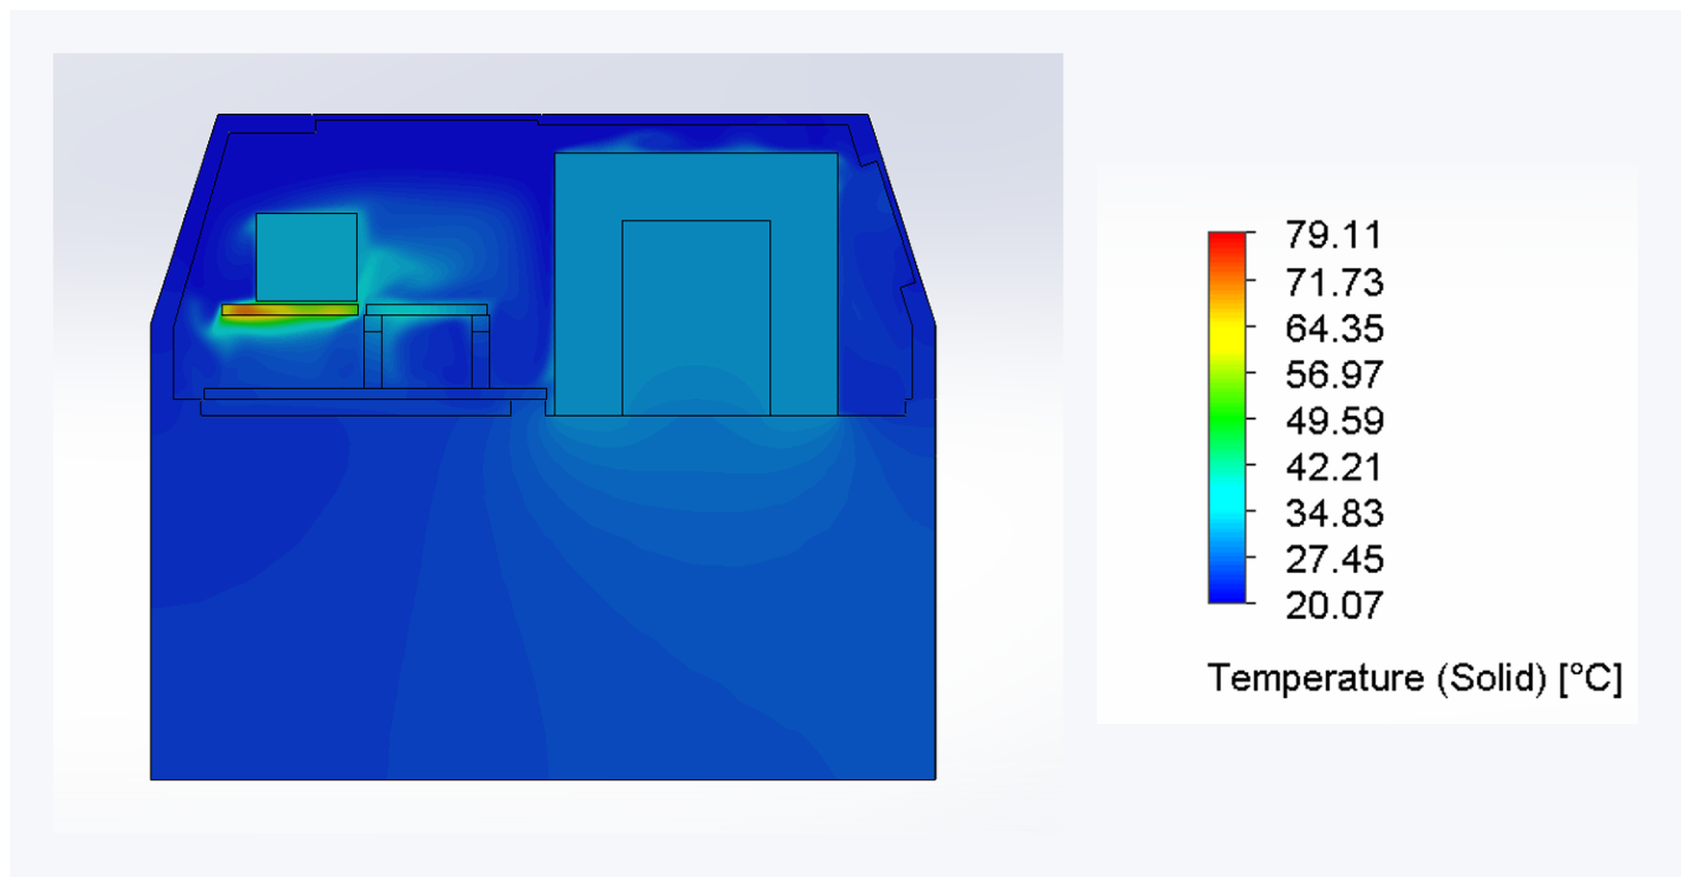
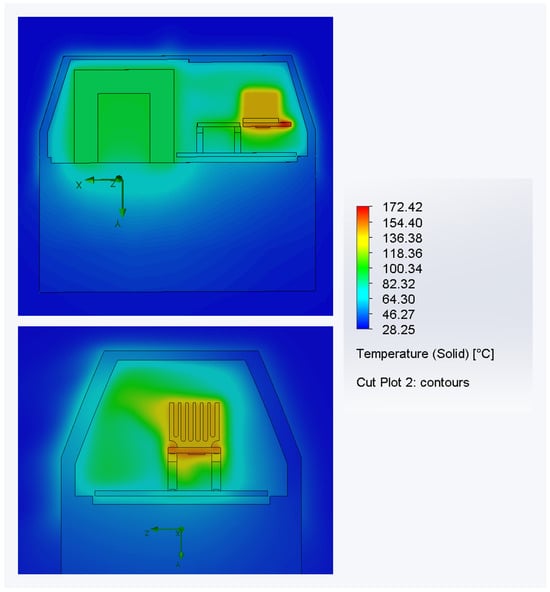
The temperature distribution in Figure 10 shows that, regardless of the ventilation condition, the driver remained the most thermally critical component, reaching a maximum temperature of C. However, the remaining components exhibited significantly lower temperatures: C for the motor and C for the microcontroller. The enclosure itself reached only C, indicating that forced ventilation substantially reduced the outer casing’s heating.
Figure 10.
Temperature distribution inside the active joint for the forced ventilation.
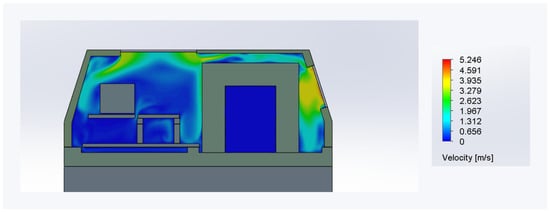
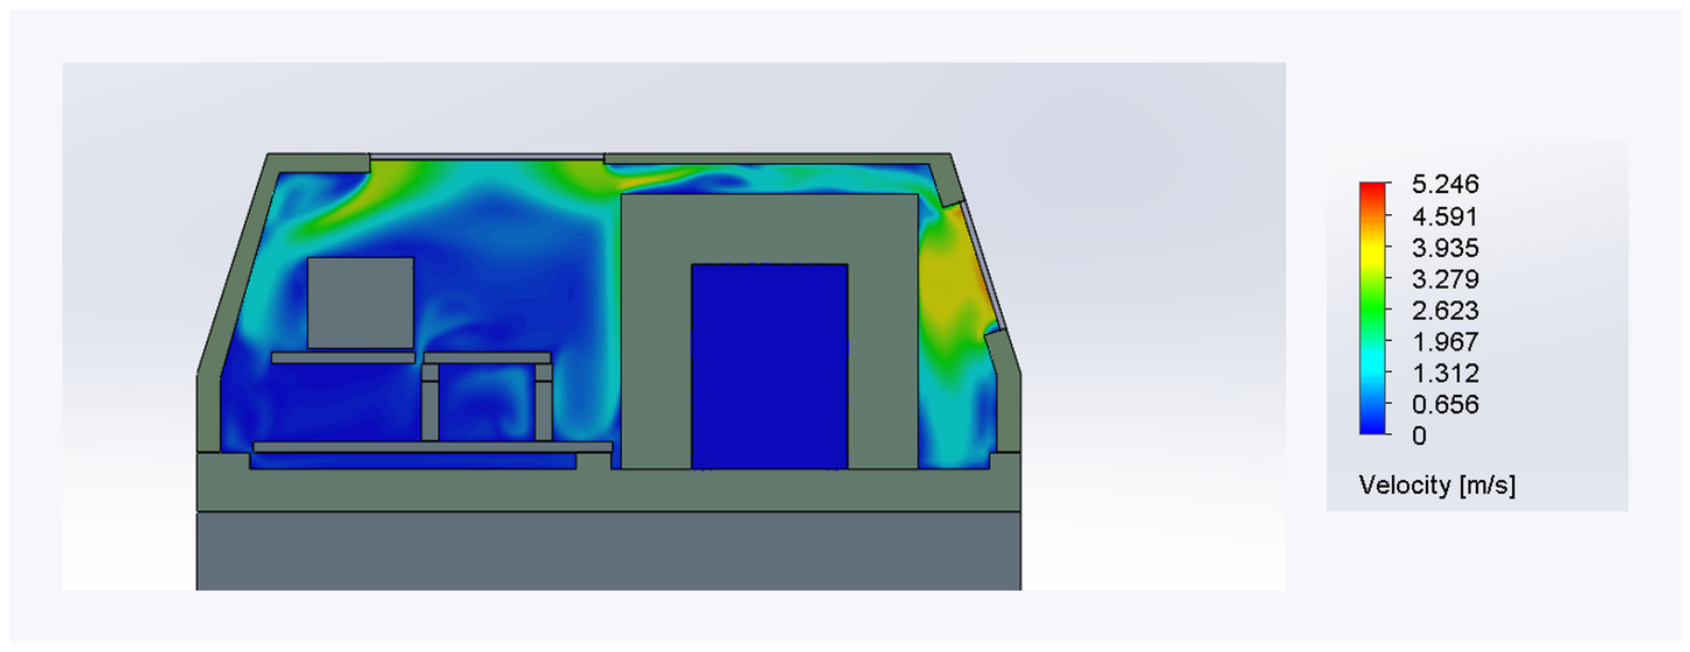
According to Figure 11, the velocity field confirms the strong influence of forced airflow. Higher air velocities were observed along the preferential internal flow paths, increasing convective heat transfer in the regions exposed to the imposed flow. The maximum local velocity in the computed flow field was 5.246 m/s; this value is a simulation output and should not be interpreted as a prescribed or average inlet velocity.
Figure 11.
Velocity distribution inside the active joint for the forced-convection case.
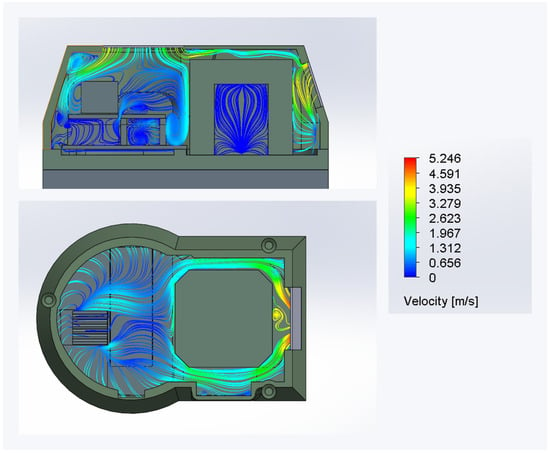
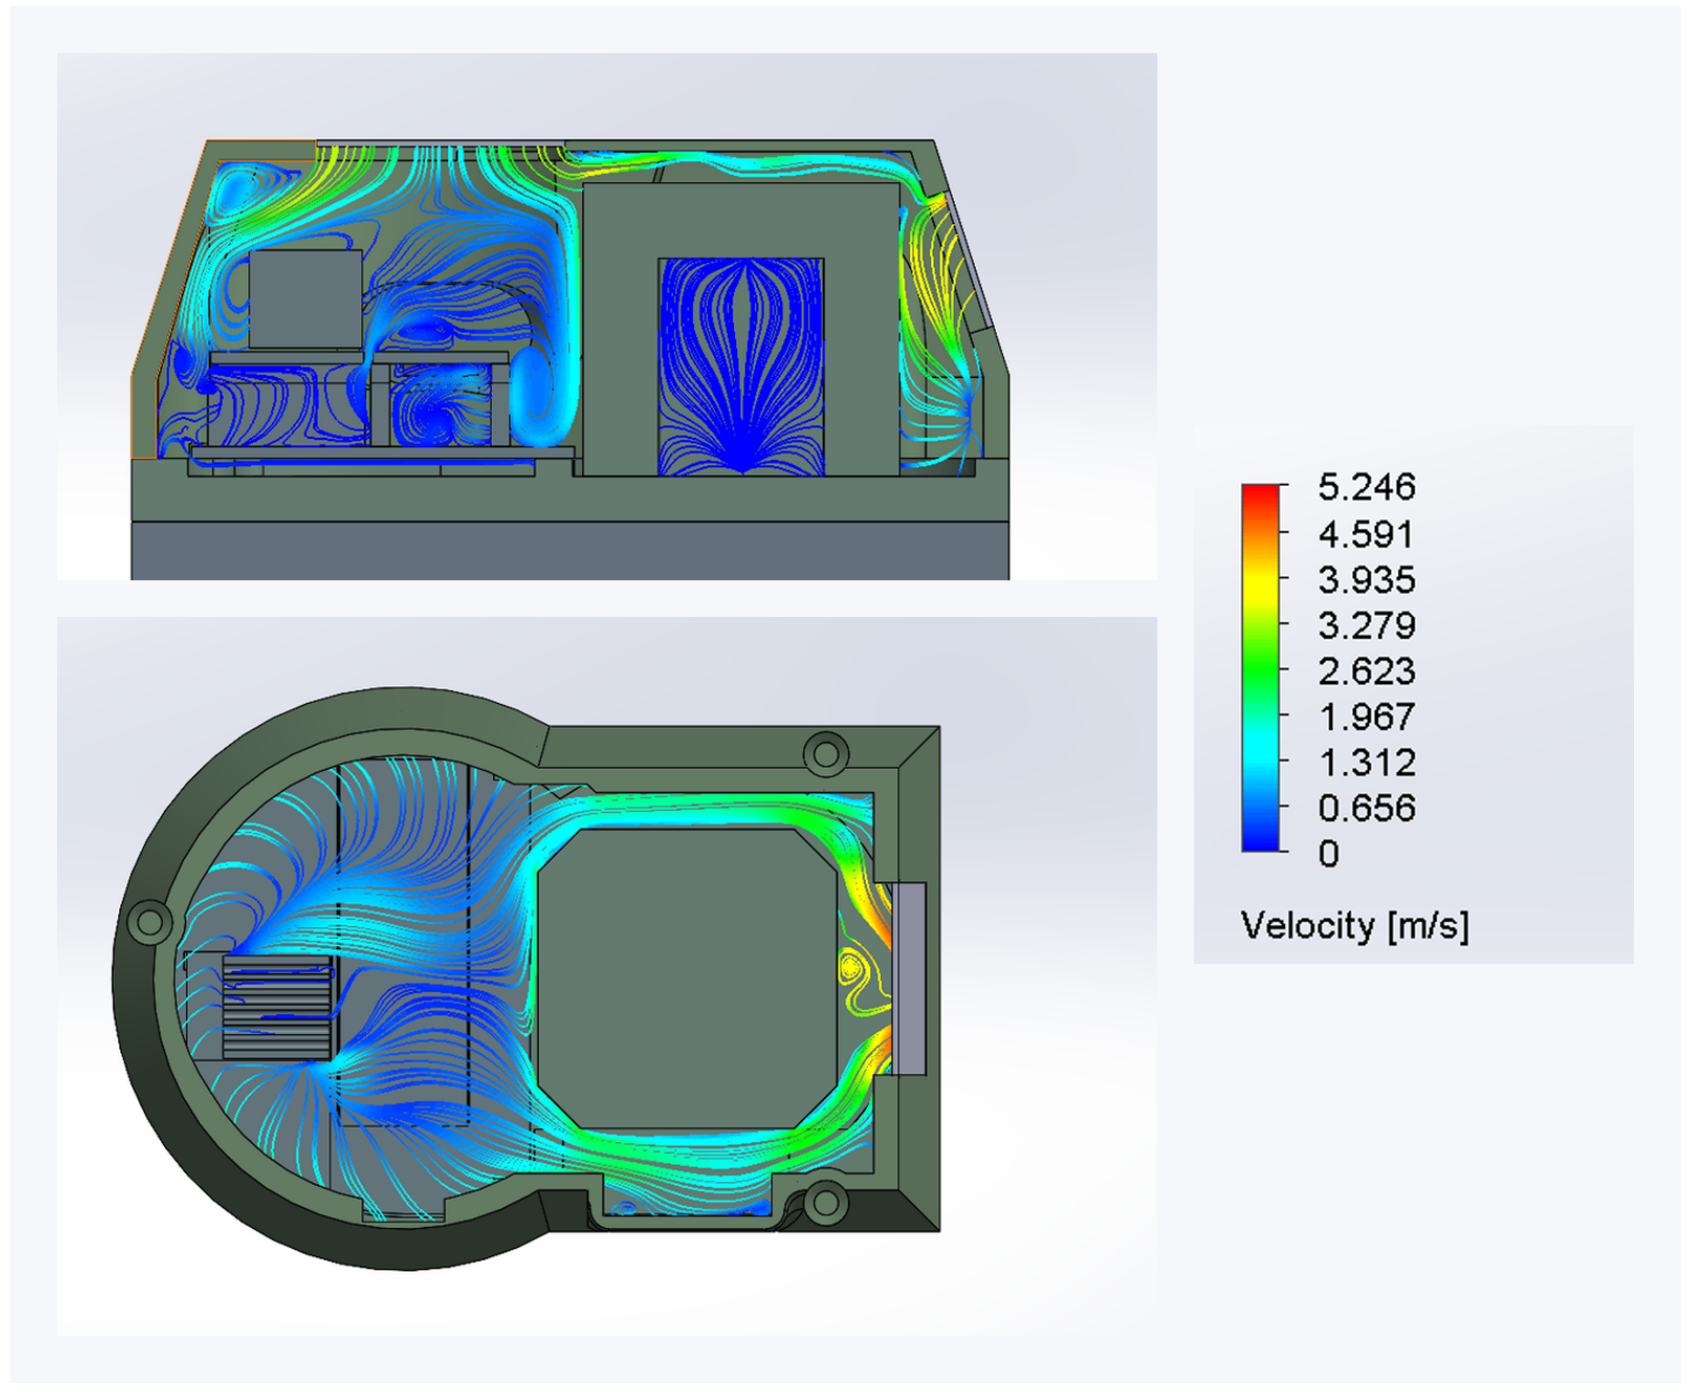
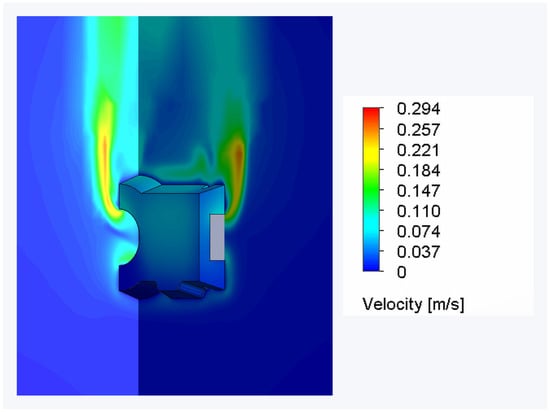
The flow trajectories in Figure 12 also show the areas of recirculation and regions where airflow bypassed internal components. However, imposed airflow ensured much more effective air renewal than in the natural-convection cases, reducing heat accumulation inside the enclosure.
Figure 12.
Flow trajectories inside the active joint for the forced-convection case.
Forced ventilation produced the lowest component temperatures among the three steady-state configurations (Table 4). The temperature field remained strongly localized around the driver, while the motor, MCU, and enclosure were substantially cooler (Figure 11). The velocity field and trajectories show a preferential inlet-to-outlet flow path, together with recirculation and regions bypassed by the main airflow (Figure 11 and Figure 12). Thus, airflow limited temperature rise throughout much of the assembly but did not eliminate the localized driver hotspot.
Table 4.
Main results obtained for the forced-convection simulation.
Remark 2.
The driver hotspot reflects the concentration of its prescribed heat load within a small component and the limited heat spreading and cooling available at that location in the modeled assembly. Its higher temperature, therefore, depends on the local heat-transfer paths and airflow exposure, rather than on total dissipated power alone.
3.3.2. Natural Convection
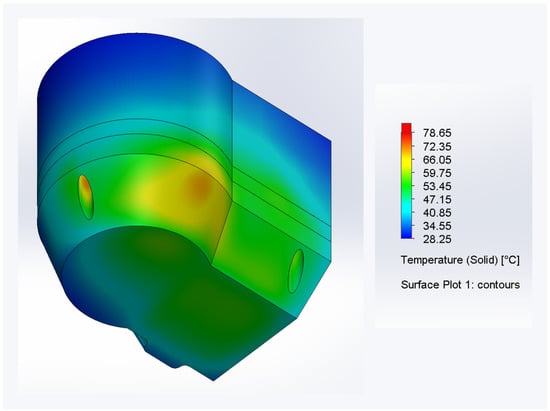
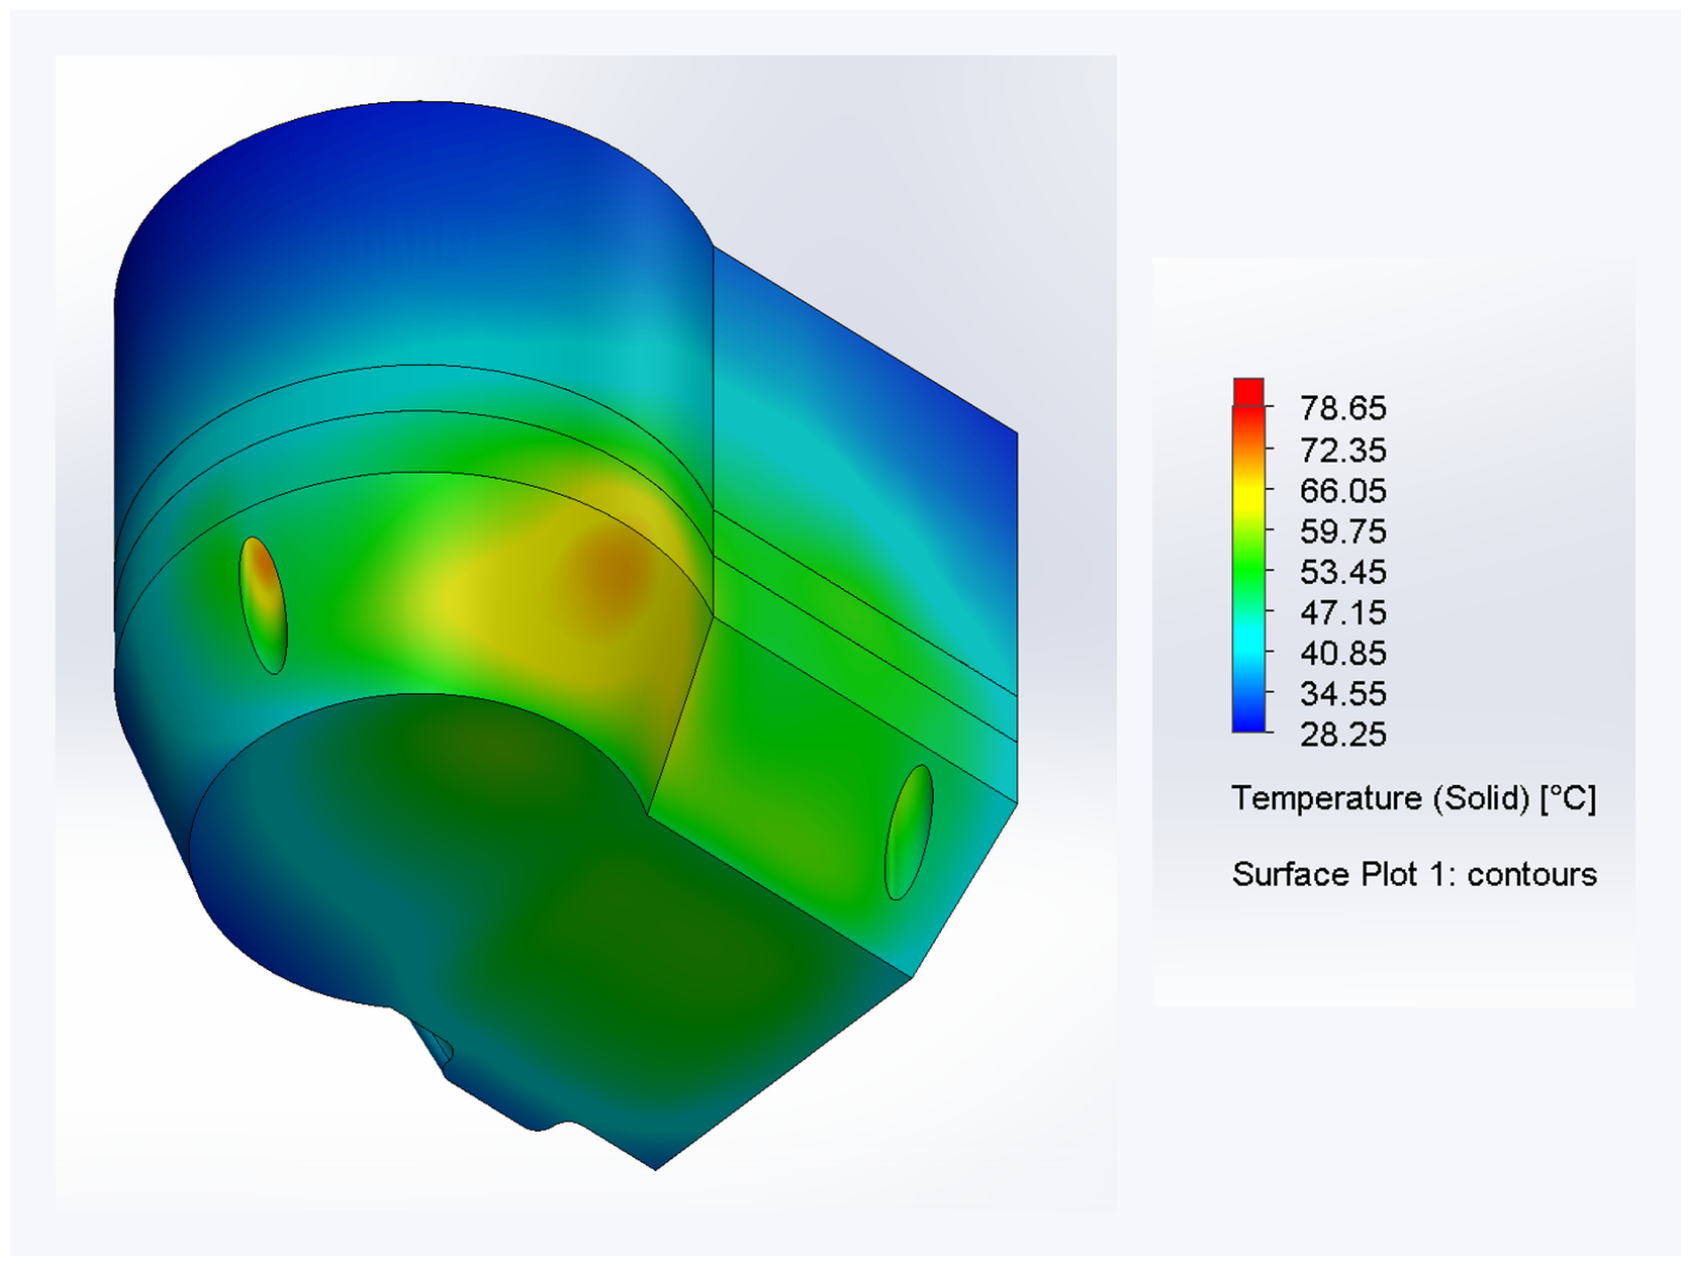
Removing forced airflow while retaining the ventilation openings increased the temperatures of all monitored components relative to the forced-ventilation case (Table 4 and Table 5). The driver remained the dominant hotspot, but elevated temperatures extended to the MCU, motor, and enclosure (Figure 13). The outer surface exhibited a non-uniform temperature distribution, with warmer regions near the internal heat sources and toward the upper enclosure (Figure 14).
Table 5.
Main results obtained for the natural-convection simulation.
Figure 13.
Temperature distribution inside the active joint for the natural-convection case.
Figure 14.
Outer-surface temperature distribution for the natural-convection case.
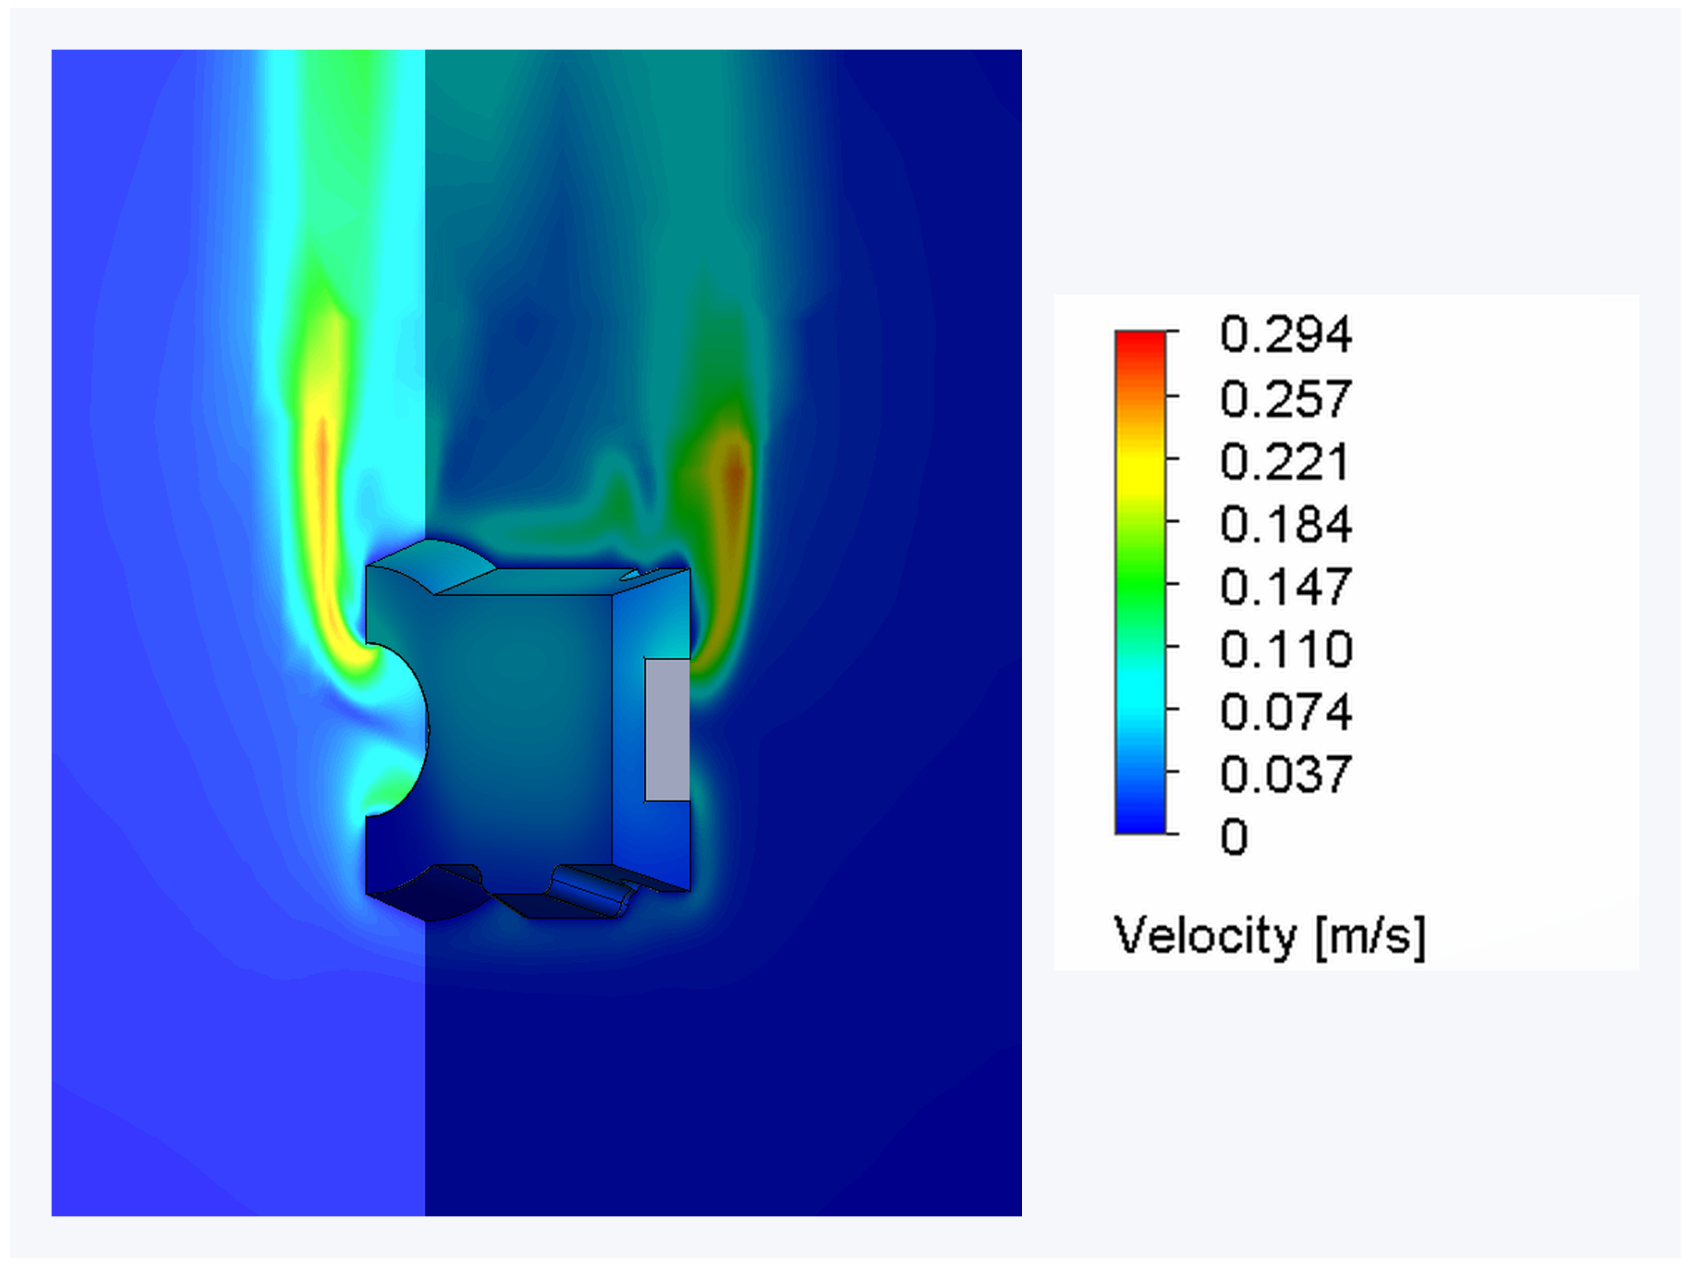
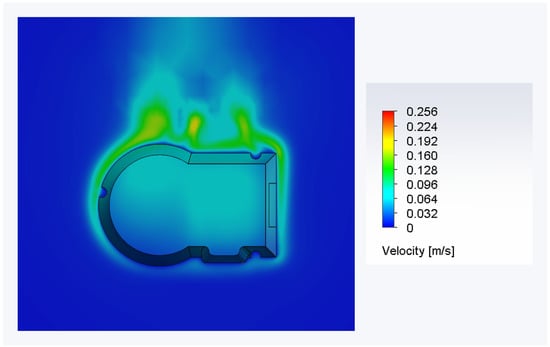
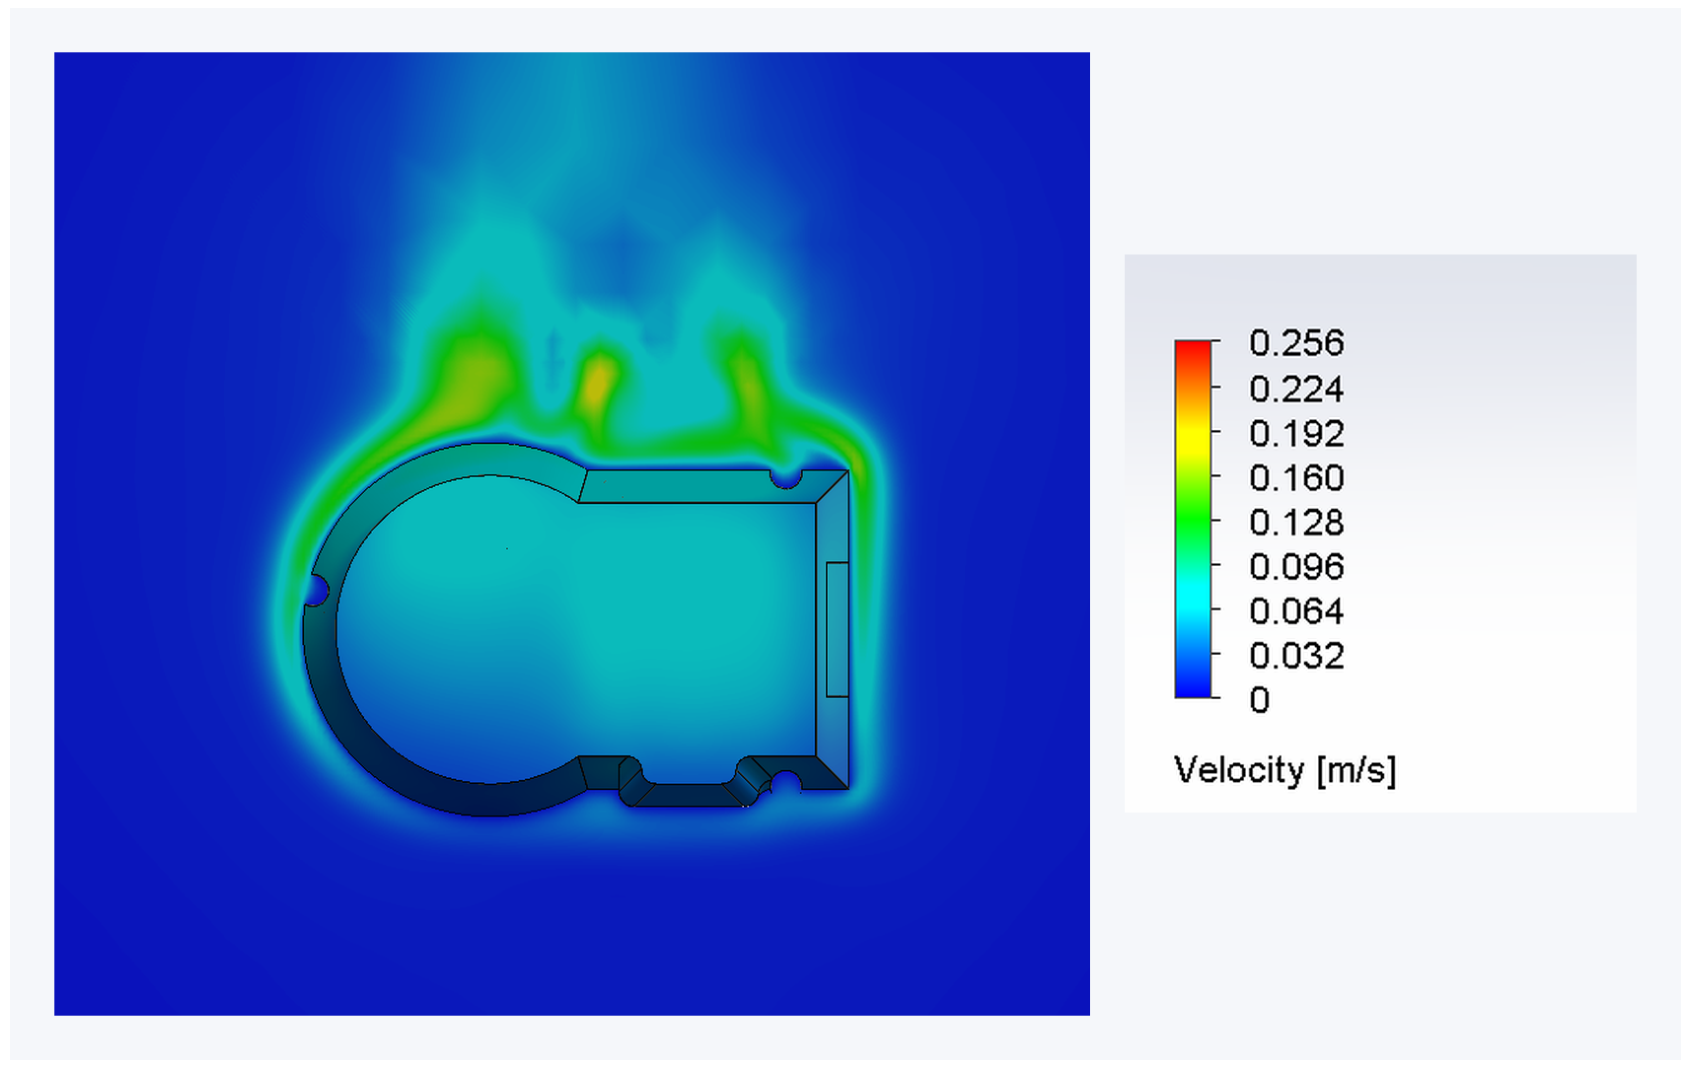
The buoyancy-driven flow was weaker than the imposed flow in the forced-ventilation case (Figure 15). Under the adopted model assumptions, the open configuration therefore provided less effective heat removal once fan-driven air exchange was removed.
Figure 15.
Flow behaviour for the natural-convection case.
3.3.3. Natural Convection with Fully Closed Enclosure
Closing the ventilation openings further increased component and enclosure temperatures relative to open natural convection (Table 5 and Table 6). The driver remained the dominant hotspot (Figure 16). With direct air exchange through the openings removed, heat rejection depended on transfer through the enclosure and its structural interfaces to the surroundings; the external buoyancy-driven flow and enclosure-surface temperature distribution are shown in Figure 17 and Figure 18 respectively.
Table 6.
Main results obtained for the natural-convection simulation with a fully closed case.
Figure 16.
Temperature distribution inside the active joint for the natural-convection case with fully closed enclosure.
Figure 17.
Flow behavior for the natural-convection case with fully closed enclosure.
Figure 18.
Outer-surface temperature distribution for the natural-convection case with fully closed enclosure.
This configuration produced the highest steady-state temperatures among the cases examined. These results represent a radiation-neglected numerical limiting condition under continued prescribed heat generation, rather than an experimentally demonstrated operating state. The calculation does not reproduce the heating interruption associated with the protection shutdown.
3.3.4. Transient Simulation for the Fully Closed Enclosure
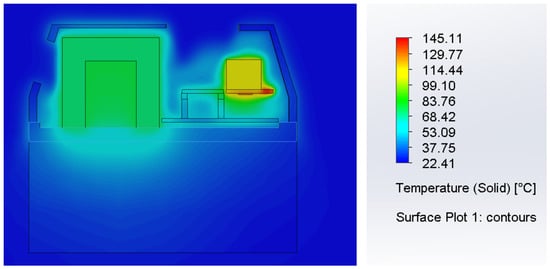
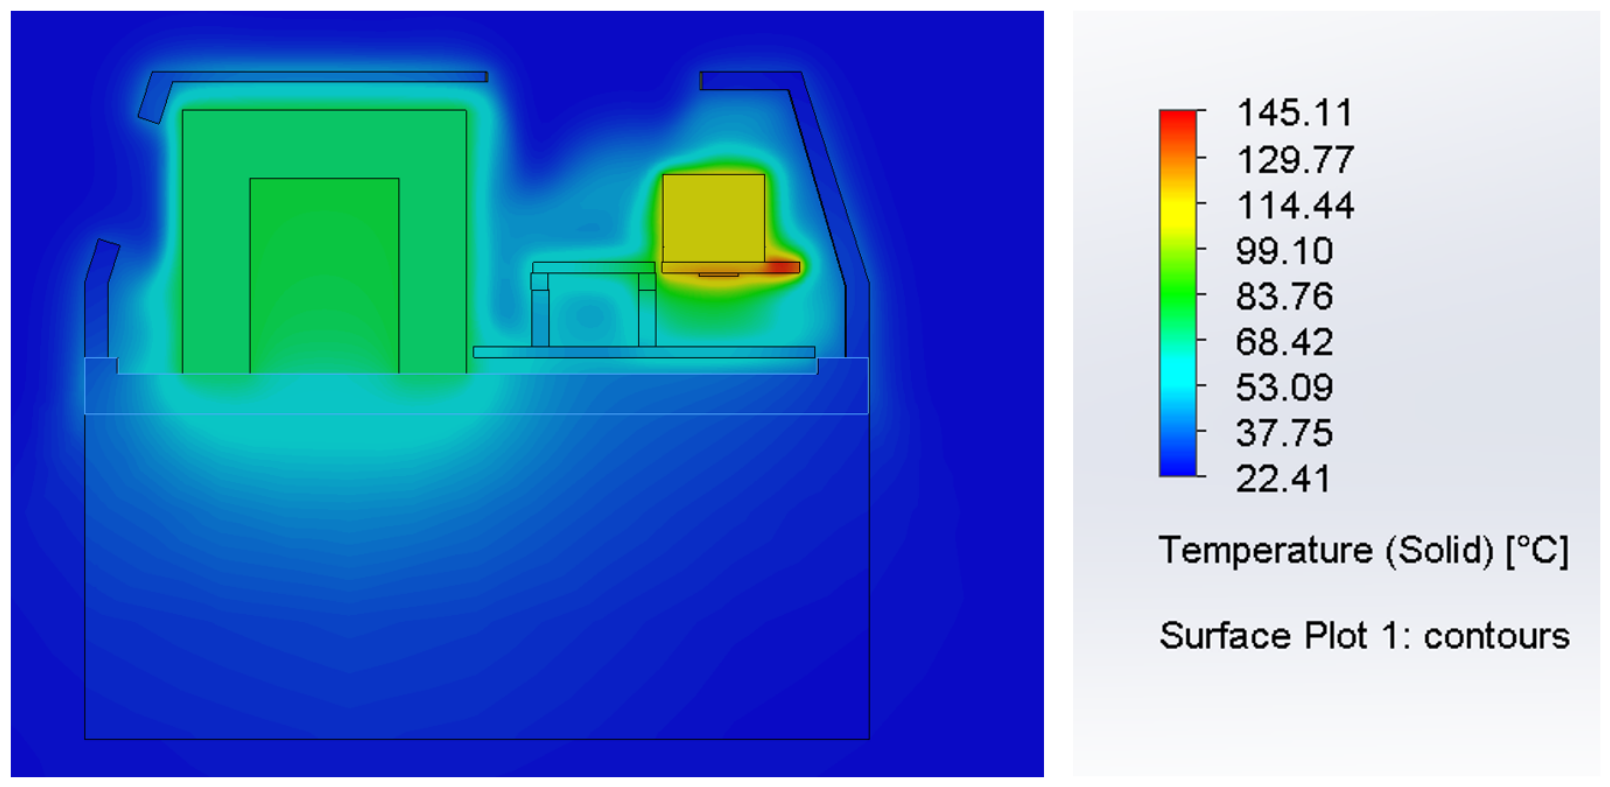
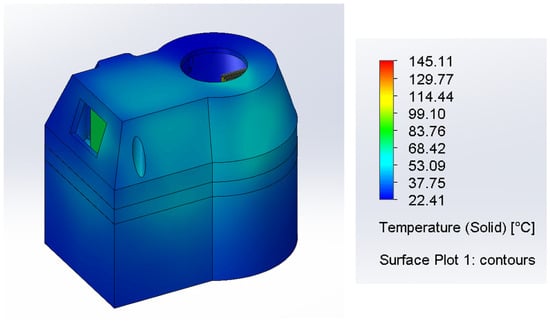
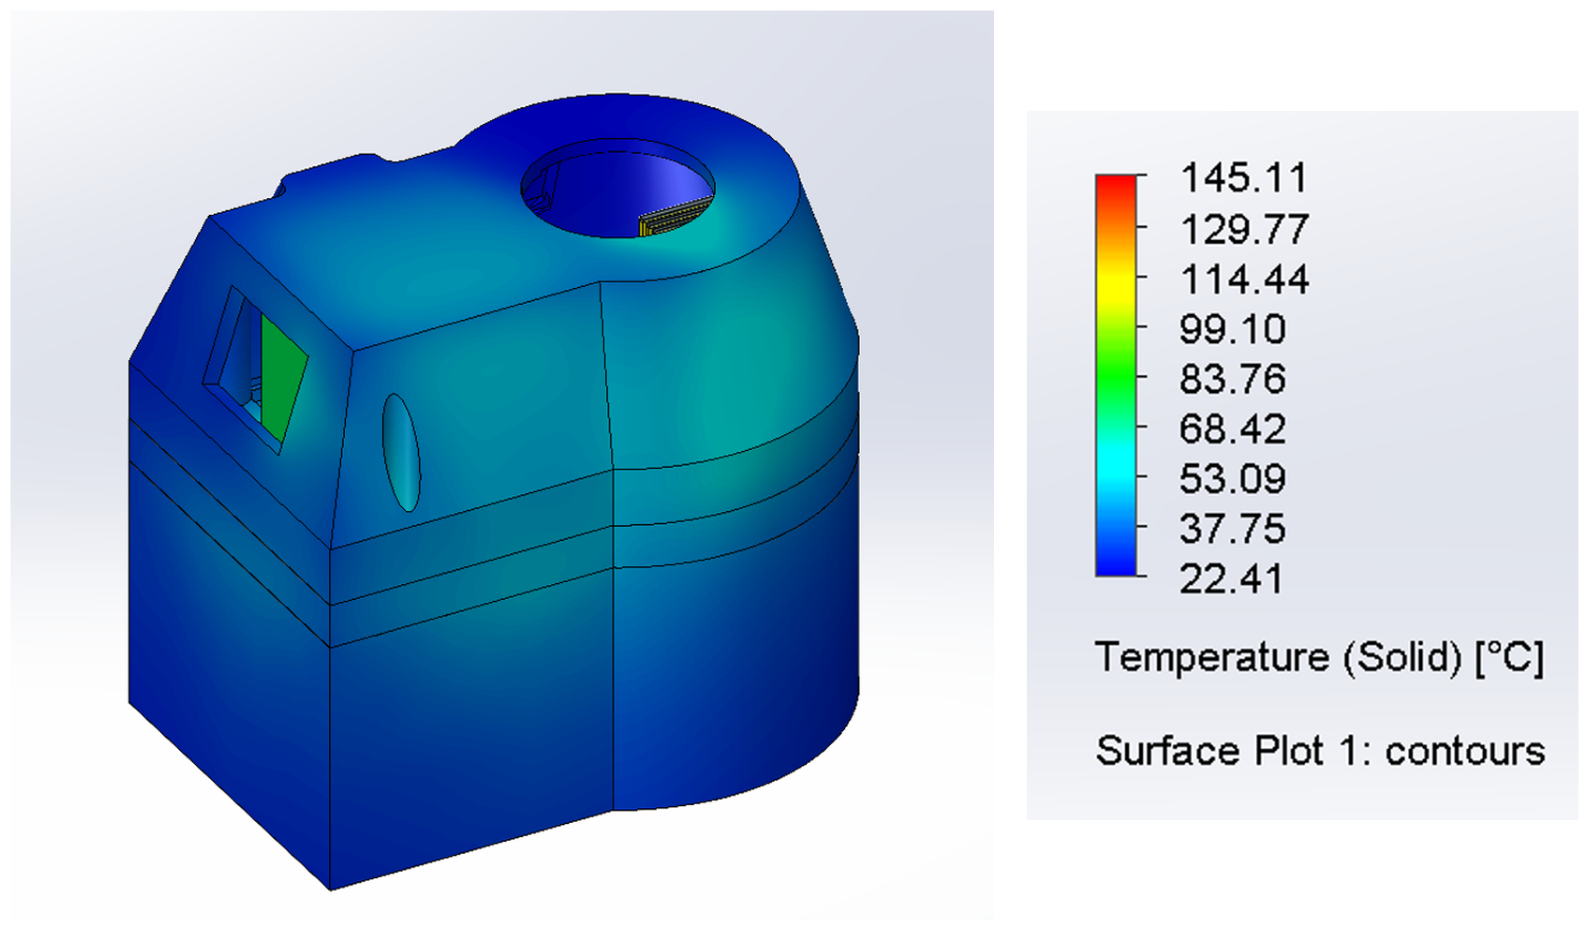
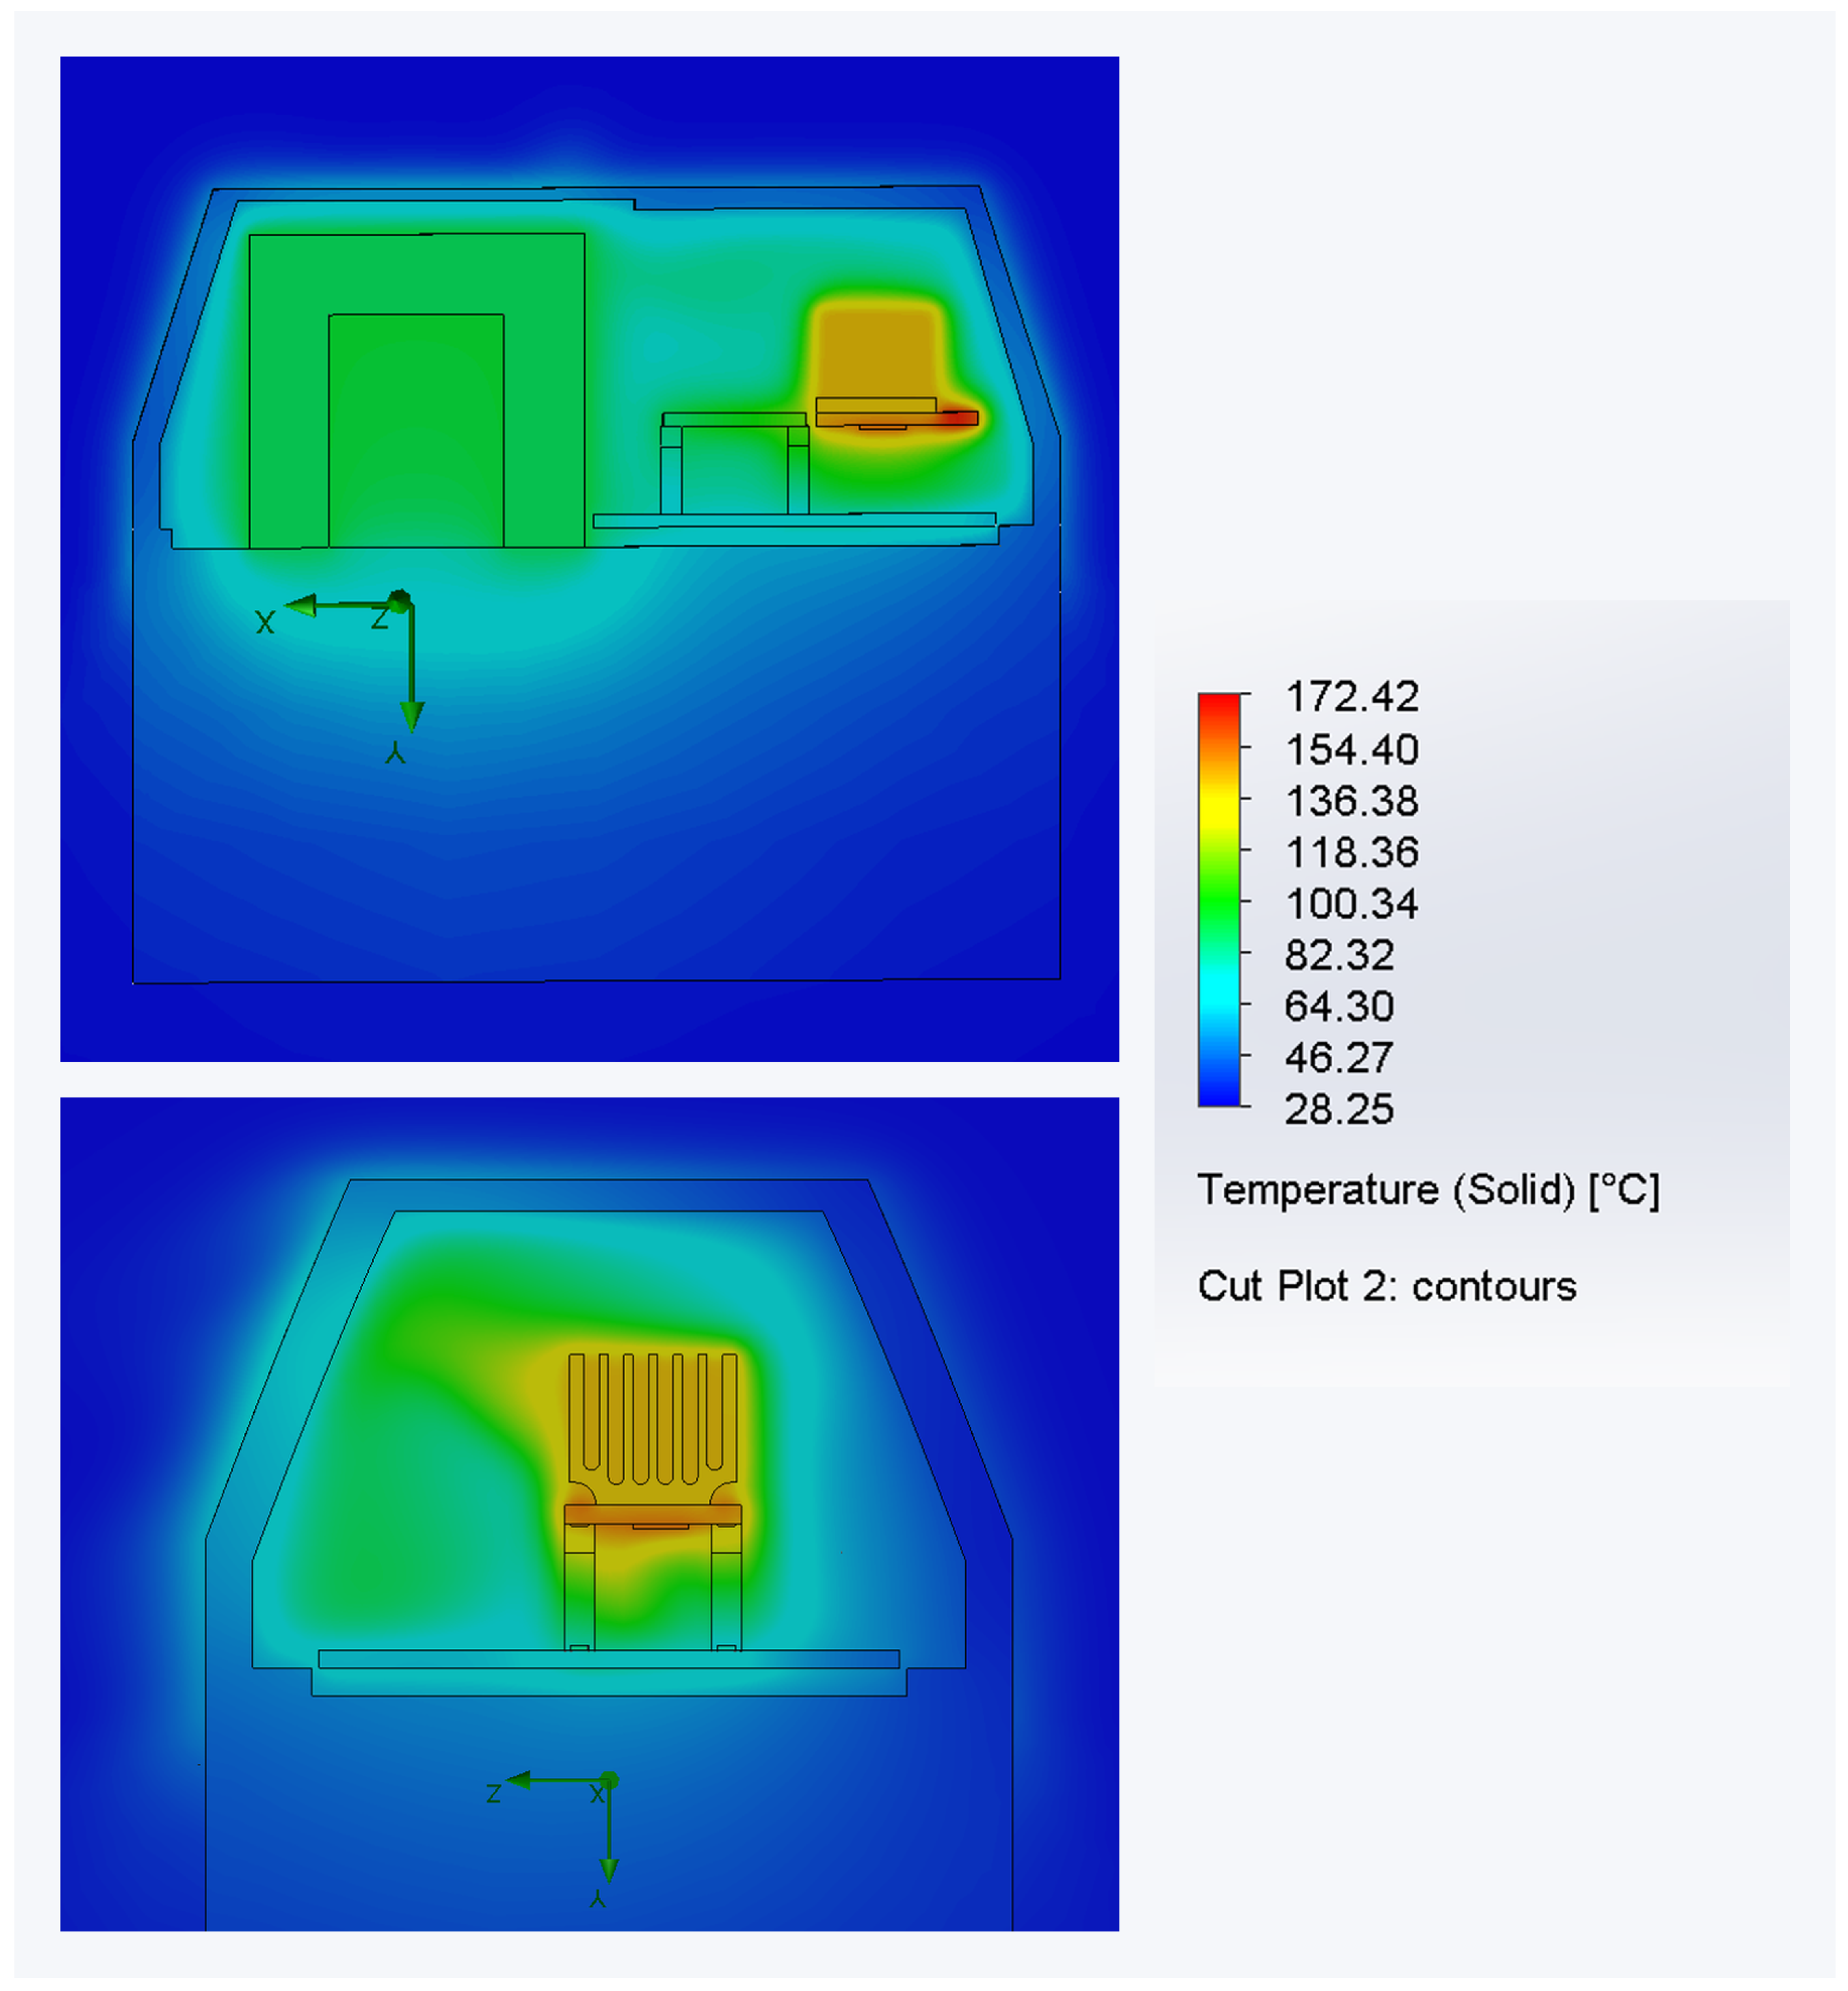
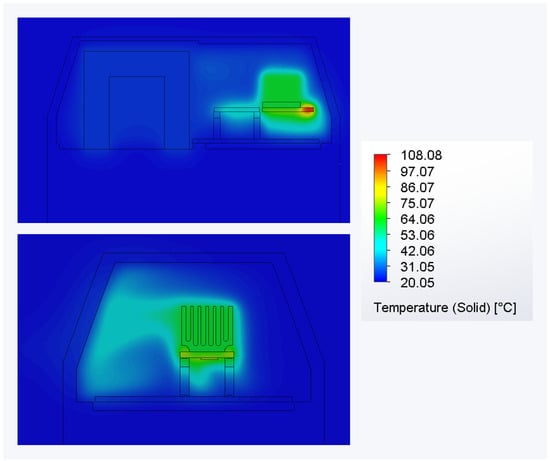
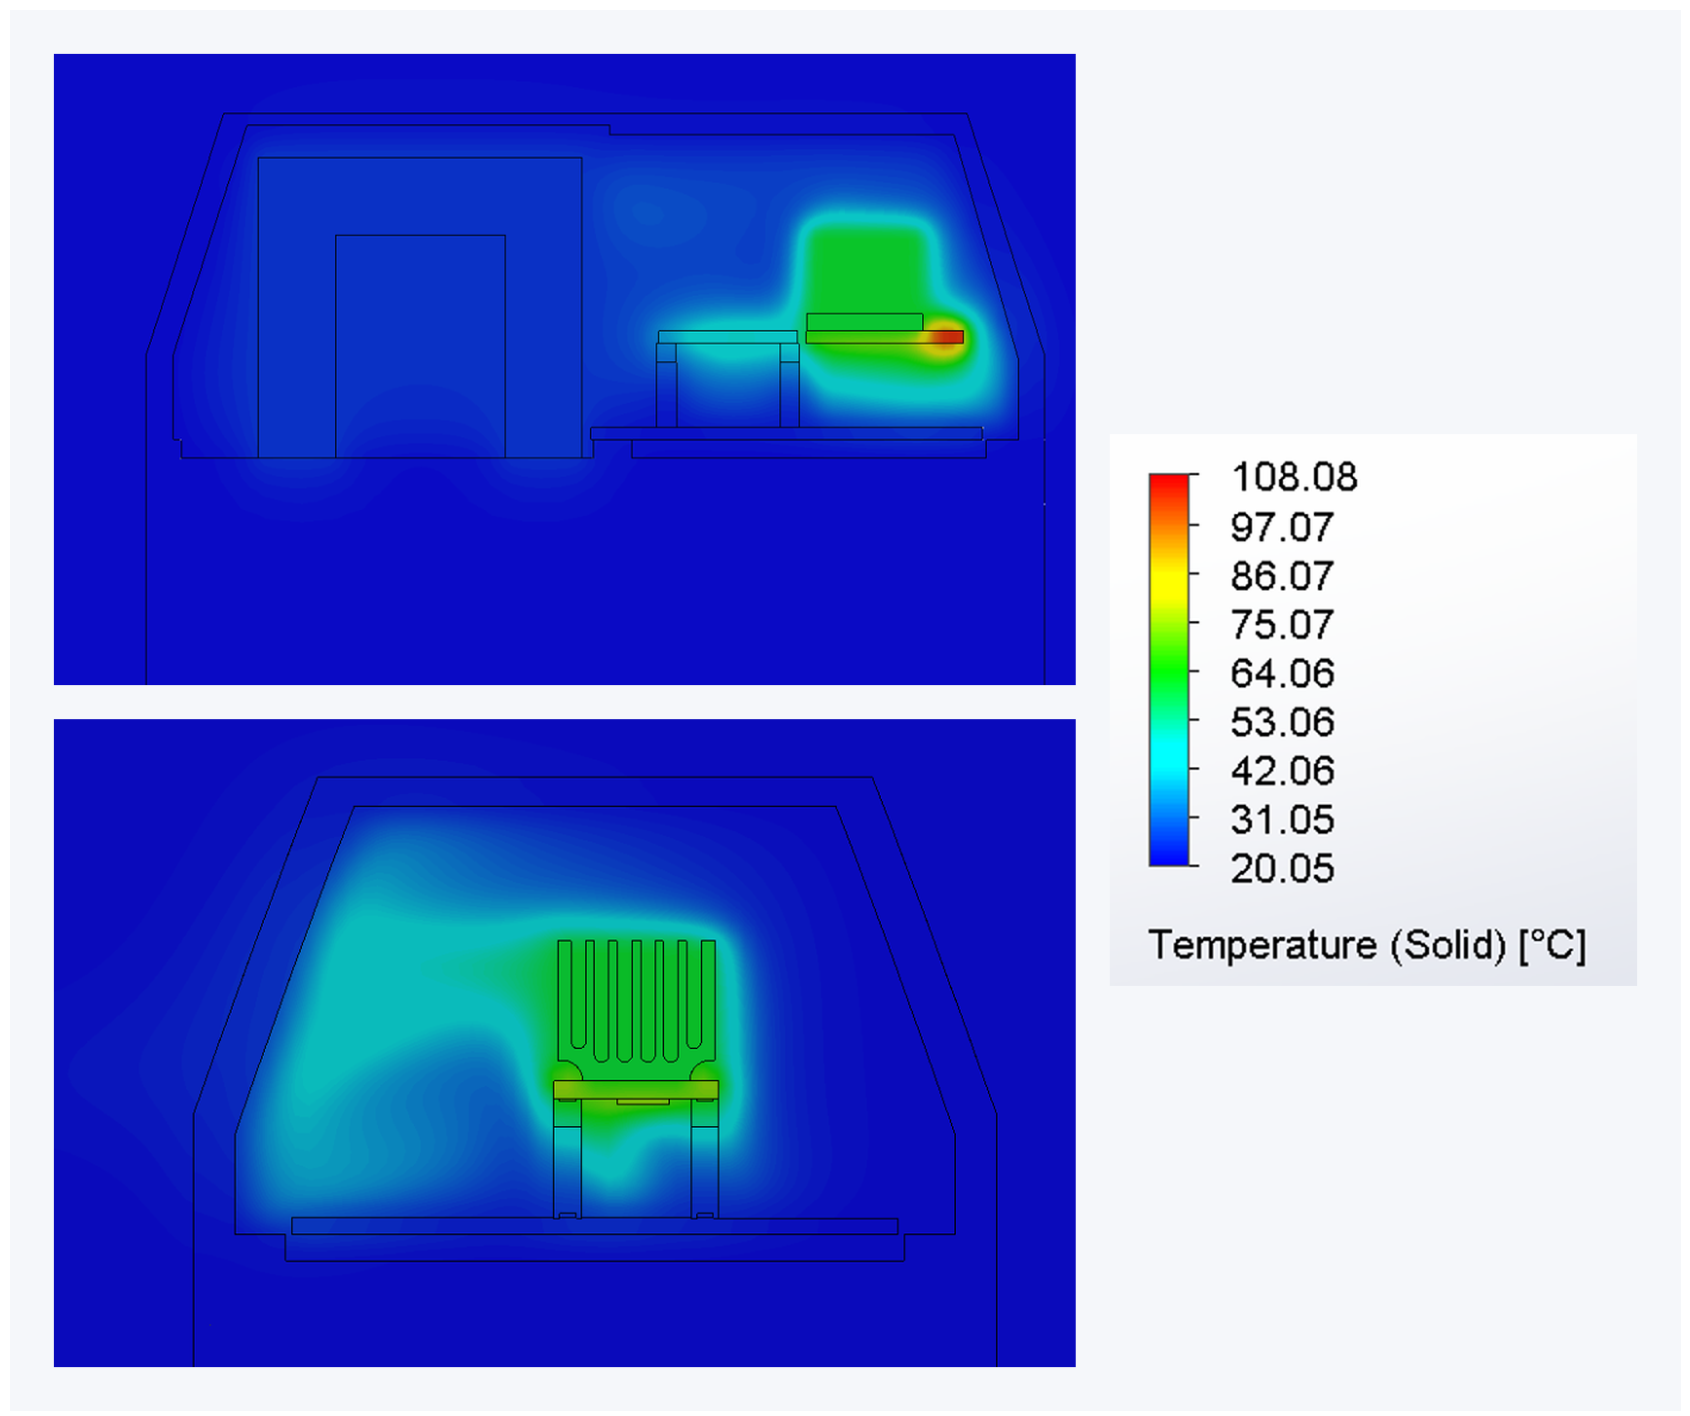
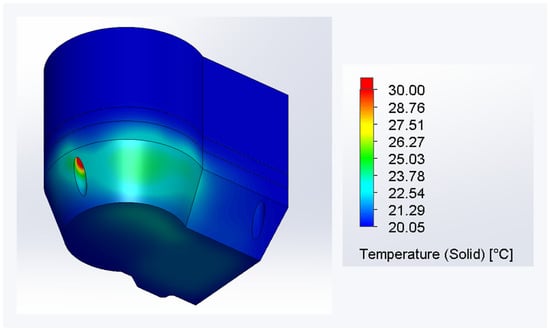
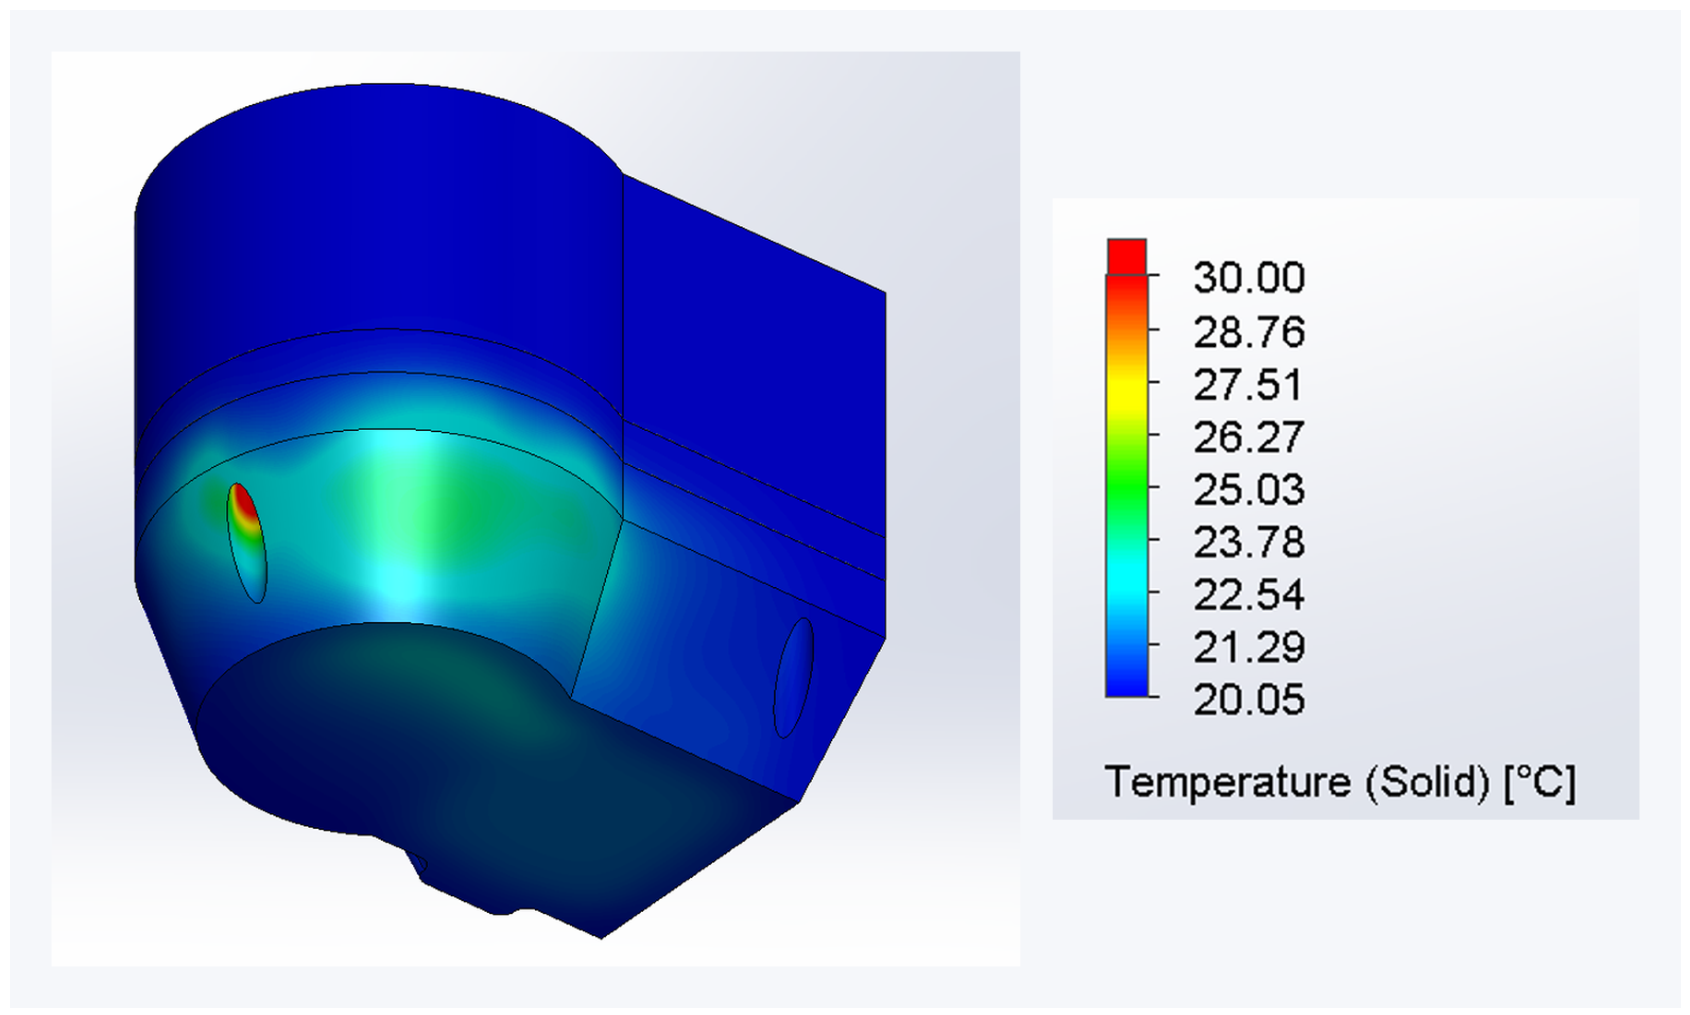
The 300 s transient simulation showed a pronounced difference between internal component heating and the enclosure-surface response. By the end of the simulated interval, the driver was substantially hotter than the motor and the external enclosure, while the MCU was at an intermediate temperature. Figure 19 depicts the internal temperature distribution, while Figure 20 shows the temperature distribution on the outer surface of the fully closed enclosure. Table 7 outlines the maximum values for this configuration.
Figure 19.
Temperature distribution inside the active joint in the transient simulation for the fully closed enclosure.
Figure 20.
Outer-surface temperature distribution in the transient simulation for the fully closed enclosure.
Table 7.
Main results obtained for the transient simulation of the fully closed enclosure.
This temperature separation indicates that a comparatively cool enclosure surface does not necessarily imply moderate temperatures within the electronics region.
3.3.5. Mesh-Sensitivity Study
A mesh sensitivity study was carried out for the fully closed-enclosure case, which represented the most thermally critical scenario. Four mesh levels were compared: coarse, medium, Fine_1, and Fine_2. Table 8 summarizes the results based on different mesh configurations.
Table 8.
Comparison of the results obtained in the mesh-sensitivity study for the fully closed enclosure case.
Since the Fine_1 mesh presented a mean error of only and a maximum error of relative to the most refined case, it was considered an adequate compromise between numerical precision and computational cost. Therefore, the Fine_1 mesh was adopted for the transient simulation and was regarded as sufficiently representative of the fully closed configuration. Table 9 outlines the mean and the maximum errors for different mesh settings.
Table 9.
Mean and maximum error relative to the finest mesh.
3.3.6. Comparison Between Numerical and Experimental Trends
Table 10 summarizes the qualitative correspondence between the numerical and experimental findings, principally the location of the critical electronics region and the deterioration in thermal response after ventilation removal. This correspondence does not constitute quantitative CFD validation because the experimental configuration and measured quantities were not fully matched to the numerical model.
Table 10.
Qualitative comparison between the main numerical and experimental trends.
Hardware failure during the second experimental test prevented completion of the planned repeated measurements. Repeatability statistics were therefore unavailable, and no point-by-point CFD error metrics are reported. Quantitative validation requires matched geometry, operating conditions, boundary conditions, and measurement locations, together with repeated tests and an assessment of measurement uncertainty.
3.4. Thermal Mitigation Alternatives
The concentration of heating around the driver makes this region the first priority for subsequent thermal redesign. A candidate approach is to connect the driver or its heat spreader to an external heat-rejection surface through a dedicated conductive path. Thermal pads, metal inserts, and external fins should be assessed as parts of this complete path, since their usefulness depends on the interfaces and enclosure structure through which heat must pass. This priority follows from the hotspot location and does not imply that a particular modification has already been shown to be effective.
Changes to the enclosure material and separation of the electronics from the actuator provide further options. Their evaluation should account for added mass, available space, wiring, manufacturing cost, and environmental protection. Higher through-thickness conductivity is a possible design variable, but its benefit was not evaluated by the present isotropic ABS model. Fan-driven exchange with ambient air provides a useful thermal reference; its compatibility with a protected enclosure would require separate assessment.
These alternatives remain proposals for future investigation. A meaningful comparison should quantify component temperatures and transient heating under common operating conditions, account for relevant thermal interfaces and radiation, and experimentally assess the selected design.
4. Discussion
The results show that the thermal performance of the active joint is strongly influenced by airflow and enclosure sealing, highlighting the trade-off between improved environmental protection and reduced heat dissipation. Forced ventilation provided the most effective thermal management, whereas natural convection—particularly in the fully closed configuration—caused significant heat accumulation. The numerical model identified the driver as the dominant hotspot. The low thermal conductivity of the ABS enclosure further limits passive heat dissipation, making a fully-closed enclosure containing both the motor and electronics thermally challenging without additional cooling strategies or improved heat-dissipation pathways.
The experimental observations provided further evidence of the strong dependence of the current joint on active airflow, with the removal of ventilation causing a rapid temperature rise and eventual thermal shutdown. Therefore, formal experimental uncertainty and quantitative point-to-point validation remain limitations of the present study. Future work should therefore focus on optimizing the active-joint enclosure geometry and developing materials or material structures with enhanced out-of-plane thermal conductivity, enabling heat to be dissipated more effectively through the enclosure walls while targeting IP54 protection, subject to separate verification.
5. Conclusions
This study establishes a baseline thermal assessment of an existing additively manufactured Delta-robot joint with restricted ventilation paths. Under the adopted thermal load, the numerical comparison identifies the driver as the dominant hotspot and shows an additional thermal penalty when the openings are closed after forced ventilation is removed. The transient analysis further indicates that substantial internal heating can develop while the enclosure surface remains comparatively cool. These findings identify the electronics region and its heat-transfer paths as priorities for subsequent redesign.
Preliminary measurements and thermography also identified the electronics and dissipator region as thermally critical, with shutdown occurring after ventilation removal. However, the experimental configuration did not fully match the numerical model. The numerical temperatures, therefore, remain conditional on the prescribed loads and modeling assumptions, particularly the exclusion of radiation, and are not quantitatively validated against operating limits.
The next stage should establish a matched experimental baseline, assess sensitivity to thermal loads, radiation, and contact resistance, and compare selected conductive heat-removal paths. Material anisotropy and printing parameters should, where relevant, be incorporated into the proposed enclosure. The selected design will require thermal testing and separate verification of the intended IP54 Protection.
Author Contributions
Conceptualization, C.M.A.V., A.M.S.C., F.A.V.F. and M.J.C.T.; methodology, C.G.F.M., C.M.A.V., A.M.S.C. and M.J.C.T.; software, C.G.F.M., H.R.A. and M.J.C.T.; validation, C.G.F.M., H.R.A., A.M.S.C., F.A.V.F. and M.J.C.T.; investigation, C.G.F.M., H.R.A. and M.J.C.T.; writing—original draft preparation, C.G.F.M. and H.R.A.; writing—review and editing, H.R.A., A.M.S.C. and M.J.C.T.; supervision, C.M.A.V., A.M.S.C. and M.J.C.T.; funding acquisition, C.M.A.V. and A.M.S.C.; resources, C.M.A.V., F.A.V.F., A.M.S.C. and M.J.C.T. All authors have read and agreed to the published version of the manuscript.
Funding
This research received funding from Drivolution Agenda.
Institutional Review Board Statement
Not applicable.
Informed Consent Statement
Not applicable.
Data Availability Statement
Data supporting the reported results are available from the corresponding author upon reasonable request.
Acknowledgments
The authors gratefully acknowledge the funding provided by the Foundation for Science and Technology (FCT), Portugal, through the Research Unit in Materials, Energy and Environment for Sustainability (proMetheus) at the Polytechnic University of Viana do Castelo (UniPVC), Viana do Castelo, Portugal, and through the Centre for Mechanical Technology and Automation (TEMA) at the University of Aveiro, Aveiro, Portugal. Additional support was provided within the scope of the project “Agenda DRIVOLUTION: Transition to the Factory of the Future” (project no. C632394276-0046698; operation code 02/C05-i01.02/2022.PC644913740-00000022), under the Agendas/Mobilizing Alliances for Reindustrialization initiative of the Portuguese Recovery and Resilience Plan (PRR).
Conflicts of Interest
The authors declare no conflicts of interest.
References
- Taesi, C.; Aggogeri, F.; Pellegrini, N. COBOT Applications—Recent Advances and Challenges. Robotics 2023, 12, 79. [Google Scholar] [CrossRef] [Scilit]
- Keshvarparast, A.; Battini, D.; Battaia, O.; Pirayesh, A. Collaborative Robots in Manufacturing and Assembly Systems: Literature Review and Future Research Agenda. J. Intell. Manuf. 2024, 35, 2065–2118. [Google Scholar] [CrossRef]
- Vasques, C.M.A.; Figueiredo, F.A.V. The 3D-Printed Low-Cost Delta Robot Óscar: Technology Overview and Benchmarking. Eng. Proc. 2021, 11, 43. [Google Scholar] [CrossRef] [Scilit]
- International Electrotechnical Commission (IEC). IEC 60529: Degrees of Protection Provided by Enclosures (IP Code); IEC: Geneva, Switzerland, 2013. [Google Scholar]
- Silveira, F.; Gago, R.M.; De Moura, R.L.; Freitas, G.M. A Framework for Selecting and Implementing Ground Mobile Inspection Robots in Industrial Applications. In 2024 IEEE Latin American Robotics Symposium; IEEE: New York, NY, USA, 2024; Volume LARS, pp. 1–6. [Google Scholar] [CrossRef] [Scilit]
- Bhaduri, S.; Adothu, B.; Aly, S.P.; Alberts, V. Performance and safety evaluation of PV cleaning robots in desert environment. Sol. Energy 2026, 317, 114968. [Google Scholar] [CrossRef] [Scilit]
- Cengel, Y.A. Heat Transfer: A Practical Approach, 2nd ed.; McGraw-Hill: New York, NY, USA, 2002. [Google Scholar]
- Zhang, M.; Liu, C.; Hu, R.; Wu, Q. Analysis of a heat dissipation scheme for a space manipulator joint. Appl. Therm. Eng. 2023, 226, 120214. [Google Scholar] [CrossRef] [Scilit]
- Xu, P.; Li, Y.; Xin, Y.; Yang, D.; Jia, R.; Liu, S.; Chen, L. Design and thermal test of thermal control system for solar radiation monitor. Appl. Therm. Eng. 2025, 298, 129026. [Google Scholar] [CrossRef] [Scilit]
- Li, Q.; Zhou, H.; Mei, D.; Wang, Y. Highly efficient evaporative cooling of humanoid robot joint motors based on phase change hydrogels. Appl. Therm. Eng. 2026, 298, 131111. [Google Scholar] [CrossRef] [Scilit]
- Sevinchan, E.; Dincer, I.; Lang, H. A Review on Thermal Management Methods for Robots. Appl. Therm. Eng. 2018, 140, 799–813. [Google Scholar] [CrossRef] [Scilit]
- STMicroelectronics. STM32F103x8/xB Medium-Density Performance Line ARM®-Based 32-Bit MCU Datasheet; STMicroelectronics: Geneva, Switzerland, 2023; Available online: https://www.st.com (accessed on 10 March 2026).
- Toshiba Electronic Devices & Storage Corporation. TB67S109AFTG Stepping Motor Driver IC Datasheet; Toshiba: Tokyo, Japan, 2021; Available online: https://toshiba.semicon-storage.com (accessed on 10 March 2026).
- Dassault Systèmes. SOLIDWORKS Flow Simulation Technical Reference; Dassault Systèmes: Vélizy-Villacoublay, France, 2024; Available online: https://www.solidworks.com (accessed on 10 March 2025).
- Maxim Integrated. DS18B20 Programmable Resolution 1-Wire Digital Thermometer Datasheet; Maxim Integrated: San Jose, CA, USA, 2019; Available online: https://www.analog.com/media/en/technical-documentation/data-sheets/ds18b20.pdf (accessed on 12 March 2026).
- Analog Devices. MAX31865 RTD-to-Digital Converter Datasheet; Analog Devices: Wilmington, MA, USA, 2023; Available online: https://www.analog.com/media/en/technical-documentation/data-sheets/max31865.pdf (accessed on 10 March 2026).
- FLIR Systems. FLIR E5 User Manual and Technical Datasheet; FLIR Systems: Wilsonville, OR, USA, 2023; Available online: https://www.flir.com (accessed on 3 February 2024).
- Nakamura, H. Cooling fan model for thermal design of compact electronic equipment: Improvement of modeling using PQ Curve. In Proceedings of the ASME 2009 InterPACK Conference Collocated with the ASME 2009 Summer Heat Transfer Conference and the ASME 2009 3rd International Conference on Energy Sustainability; ASME: New York, NY, USA, 2021; Volume 43604, pp. 221–228. [Google Scholar] [CrossRef] [Scilit]

Disclaimer/Publisher’s Note: The statements, opinions and data contained in all publications are solely those of the individual author(s) and contributor(s) and not of MDPI and/or the editor(s). MDPI and/or the editor(s) disclaim responsibility for any injury to people or property resulting from any ideas, methods, instructions or products referred to in the content. |
© 2026 by the authors. Licensee MDPI, Basel, Switzerland. This article is an open access article distributed under the terms and conditions of the Creative Commons Attribution (CC BY) license.