


Abstract
Background and Objectives: This study evaluated a field workflow for obtaining video-derived movement descriptors during functional training (FT) classes and examining their relationships with independently measured indicators of internal load. Methods: In a cross-sectional observational study, 25 practitioners were recorded during one class each across six training days. A fixed smartphone camera and the previously developed Movement Description Language (MDL) pipeline were used to derive set-level repetition counts, timing measures, image-plane joint-angle proxies, and angular-speed descriptors. Video-derived descriptors were paired with Polar H10 heart-rate (HR) measurements at the set level; post-session perceived-exertion and fatigue ratings were analysed at the participant level. Pooled correlations were treated as descriptive, and linear mixed-effects models accounted for repeated sets within participants. Results: Video-derived data were available for 551 exercise sets; 532 sets from 24 participants could be linked to HR. Some pooled set-level descriptors correlated with HR, including peak shoulder angle with mean HR (Spearman’s ) and peak HR (; 78 sets for which a shoulder angle was defined). Associations involving post-session ratings were exploratory and were assessed at the participant level. No video-derived descriptor met the false-discovery-rate criterion in the participant-clustered mixed-effects models (all ). In separately fitted models, HR increased with round index (), a session-progression variable that was not derived from the video descriptors. Conclusions: This study documents the field application of an end-to-end workflow linking smartphone video acquisition, pose estimation, MDL-based segmentation, extraction of set-level movement descriptors, and alignment with independently measured heart rate and post-session ratings during scheduled functional-training classes. The present evidence defines the current boundary of the extracted variables and does not support claims of predictive validity or individual internal-load estimation. The documented workflow, field dataset, and identified measurement limitations provide a methodological basis for criterion validation, exercise-balanced repeated observations, and future individual-level evaluation.
1. Introduction
Functional training (FT) is a widely adopted method in physical exercise that emphasizes movement patterns replicating daily activities and sport-specific tasks. This approach is characterized by multi-joint, multi-planar movements intended to enhance strength, balance, coordination, and overall functional performance [1].
A FT class typically integrates compound lower-body movements, such as squats and deadlifts, with upper-body pulling and pushing exercises, cardiovascular activities, and core stability work. These exercises are performed at high intensity within a group setting [2,3]. The variety of exercises, movement in different planes (frontal, transverse, and sagittal), and group participation make FT a challenging setting for video-based kinematic monitoring. A single fixed camera has to capture many body positions and movement directions, which raises the chances of occlusion, perspective distortion, and less accurate tracking compared to controlled, single-plane lab tasks. These challenges also make it hard for coaches to monitor each participant’s physiological response during group sessions, which limits their ability to adjust exercise intensity and workload for individual fitness levels [4].
Monitoring internal training load, defined as the physiological and perceived stress experienced during exercise, is essential for promoting both safety and effectiveness in training [5,6]. In FT contexts, heart rate (HR) monitoring and Rating of Perceived Exertion (RPE) scales, including the Borg category-ratio scale (CR10) and session-RPE (sRPE), are the most frequently employed methods [7,8]. HR offers an objective indicator of cardiovascular effort and is widely used to estimate training intensity [9,10]. RPE reflects how an individual personally rates the difficulty of exercise, including factors like muscle fatigue, trouble breathing, and overall effort [11,12]. Feeling fatigued can lower power output, reduce exercise performance, and raise the risk of injury [13]. Muscle fatigue can also change movement patterns, which may further increase injury risk [14]. Detecting fatigue early during exercise allows for timely changes in training to help prevent injuries [15]. Together, HR and RPE-based methods are practical and widely used for tracking training load in group fitness. Along with a short post-session fatigue rating, these are the internal-load indicators used in this study.
Although widely used, these monitoring tools show a significant limitation: they quantify the physiological and perceptual demands of exercise but provide minimal information regarding movement execution. HR and RPE assess exercise intensity; however, they do not capture movement execution [4]. Consequently, two practitioners may report similar HR and RPE values while demonstrating substantially different movement patterns, proxy joint ranges of motion, and repetition timing. This limitation is particularly important because training load quantification based only on internal indicators such as HR and RPE does not directly correspond to movement execution. The same internal load may be achieved through distinctly different movement strategies [9,16].
This limitation is particularly important because fatigue influences not only physiological and perceptual responses but also movement mechanics. Previous research demonstrates that fatigue can alter proxy joint range of motion, decrease movement velocity, impair inter-joint coordination, and increase movement variability [17,18,19]. In resistance training, reductions in repetition velocity serve as sensitive indicators of neuromuscular fatigue and are closely associated with physiological markers such as blood lactate concentration and perceived exertion [16,20]. Fatigue-related changes have also been documented in jump-landing biomechanics and squat movement patterns, including significant alterations in hip, knee, and ankle joint angles at initial contact and peak stance [21,22]. Additionally, fatigue in squat movements results in greater forward trunk lean, reduced joint range of motion, and slower linear joint velocity [23]. These findings indicate that kinematic data provide critical insights into fatigue and exercise performance that are not captured by HR or perceived exertion measures alone [4].
The main challenge in integrating movement analysis into FT is predominantly practical. Although the value of kinematic information for exercise monitoring is well established, capturing such data in real-world group training contexts typically requires one of two approaches, each with significant limitations. Laboratory-based optical motion capture systems, widely regarded as the gold standard for kinematic analysis, are costly, have limited capture volumes, and require placing up to 50 reflective markers at anatomically specific locations on each participant. These requirements render them impractical for routine coaching use [24,25]. Research-grade marker-based systems may be expensive, including maintenance and the need for specialists [25]. Alternatively, wearable sensors help some obstacles but introduce others: sensor attachment can burden participants, interfere with natural movement patterns, and is logistically challenging to manage across multiple individuals performing varied, high-intensity exercises simultaneously [24,26]. Consequently, translating biomechanical research findings into applied training practice remains a persistent challenge, as reliance on laboratory-based equipment is impractical for most coaches and fitness practitioners [26].
In recent years, deep learning-based markerless pose estimation has emerged as a more accessible and ecologically valid alternative. Systems such as MediaPipe BlazePose, OpenPose, and MoveNet extract body landmark positions directly from standard video footage in real time, eliminating the need for markers, wearable devices, or specialized infrastructure [27]. The body landmarks generated by these models enable the derivation of proxy joint angles and other temporal movement features, which can be used to characterize movement patterns across participants and exercises.
Several studies have shown that markerless pose estimation closely matches traditional marker-based motion capture, especially for lower-limb movements in the sagittal plane. Liu et al. reported strong cross-correlation for knee and hip flexion during squat, lunge, and hinge tasks, concluding that markerless systems can reliably capture major sagittal-plane movement patterns [28]. Other research comparing markerless and marker-based systems during jumping tasks also found high agreement for lower-limb joint kinematics in the sagittal plane [26,29]. Data on markerless capture during single-leg squat and landing tasks show measurement errors and reliability similar to those seen in marker-based studies [30]. Agreement between markerless and marker-based systems is generally stronger for sagittal-plane movements than for frontal or transverse planes, but several key errors limit how well monocular pose estimation works for more complex, multi-planar tasks [25]. First, perspective distortion happens because a single 2D camera flattens three-dimensional motion, so joint angles can be over- or underestimated when a limb moves toward or away from the camera instead of parallel to it. This effect is less of a problem in sagittal-plane movements viewed from the side, but it becomes more pronounced in frontal or transverse-plane exercises. Second, where the camera is placed has a big impact on measurement accuracy. A camera set up for one movement plane may not give a good view for other exercises in the same session, which is common in FT classes where the exercise changes every 30–45 s. Third, occlusion occurs when body parts are hidden from the camera by other limbs, equipment, or people, which can cause tracking errors, especially during fast, multi-directional, or rotational movements. Fourth, depth ambiguity means monocular systems cannot directly measure motion along the camera’s line of sight, so they struggle to capture out-of-plane compensations or subtle changes in posture that depend on depth. Fifth, most validation studies for markerless pose estimation focus on controlled, single-plane, single-exercise lab tasks like squats, jumps, or lunges [28,30]. However, errors are likely to differ across the wide range of multi-planar exercises typical of FT classes, such as rotational core exercises, lateral movements, or overhead pressing, and there is not yet enough evidence for these cases. These limitations are important for this study, which uses a single fixed monocular camera to measure kinematics across a variety of multi-planar FT exercises.
Beyond validation, new research shows that these systems have practical uses in fitness and rehabilitation. Pose estimation models have been used for counting exercise repetitions [31,32], assessing movement execution by analyzing joint angles [33], and providing automated real-time feedback during exercise and rehab [34]. These advances make markerless pose estimation a useful tool for kinematic monitoring outside the lab, including in group fitness settings.
Turning raw pose-estimation data into useful kinematic metrics for FT classes takes more than just a pose-estimation model. Since each session includes many different exercises, there is a need for a system that can detect the phases of each movement, determine when a repetition starts and ends, and adapt to different ways people move and to the various camera angles found in real group settings. To solve this, previous work introduced an MDL, a formal system that models each exercise as a finite-state machine. In this setup, changes between movement phases are triggered by proxy joint-angle thresholds calculated from standard video using MediaPipe [35]. Instead of needing large labelled datasets or retraining models, MDL uses clear, adjustable rules to define exercises, making it easy to understand and apply to new types of exercises. The system was tested on 1513 videos covering 12 functional exercises, achieving an overall repetition-counting accuracy of 97.2%, with a mean per-exercise accuracy of 98.8% (ranging from 95 to 100%). It stayed accurate even when execution speed, camera view, or individual movement style changed [35]. Previous work introduced the MDL and evaluated exercise-phase detection and repetition counting across videos from several sources, including recordings in real-world environments [35]. That evaluation did not establish the measurement accuracy of the image-plane angle, angular-speed, or timing descriptors used in the present study, nor did it examine their relationship with physiological and perceptual indicators of internal load during complete FT classes.
The present study represents the next methodological step following the initial development and evaluation of the MDL framework. Previous work established the language, exercise-phase representation, and repetition-counting performance across a defined set of exercises [35]. The present work extends that programme to a complete field process during heterogeneous, scheduled functional-training classes. The process includes smartphone video acquisition, pose estimation, MDL-based segmentation, extraction of set-level movement descriptors, temporal pairing with wearable heart-rate data, and participant-level treatment of post-session ratings.
The objectives were to document the application of this workflow under real class conditions, describe the movement information that could be obtained from the recordings, and explore how the resulting descriptors related to independently measured heart rate and post-session ratings at their respective measurement levels. The association analyses therefore form part of the assessment of the current workflow and of the inferences that its outputs presently support. The study does not evaluate the criterion validity of the image-plane kinematic and timing descriptors, predictive validity for heart rate, or a coaching decision rule. Its field design also does not isolate the effects of exercise type, session structure, or external load. These boundaries define the validation and study-design requirements for the next stage of the research programme.
2. Materials and Methods
2.1. Participants and Data Collection
This study used a cross-sectional, observational, ecological field-based design. Participants were observed during their regular functional training sessions at the MAREBox (https://mare.fit/) facility, where all data collection took place. Data collection took place over one calendar week, covering six consecutive training days, to include all types of scheduled FT classes. Each participant was recorded during only one class on one day, and no one was followed across multiple sessions. There was no experimental intervention, and practitioners followed their usual training program set by the coaches. The lesson plan and daily participant numbers are shown in Table 1. The participant numbers for each day represent the number of classes recorded, since data were collected from only one participant per class.
Table 1.
Overview of functional training sessions. Exercises marked “one participant” were performed by a single participant as individual exercise modifications. Sit-up (Tuesday, Thursday, Friday), squat (Tuesday, Wednesday) and single-arm dumbbell hang clean and jerk (Tuesday, Saturday) were performed on more than one day.
Although each FT class typically included multiple participants, this study served as an initial exploratory step to evaluate the MDL pipeline in real class settings under tightly controlled video-recording conditions. For each recorded class, a single volunteer who met the inclusion criteria and provided informed consent was designated as the focal participant for video analysis. This individual was positioned in a controlled area of the room with a dedicated camera to maximize landmark visibility and minimize occlusion and interference from other practitioners and equipment. At the MAREBox facility, each FT class format (exercise list and work–rest structure) was repeated several times throughout the day with different groups. Consequently, over the course of the week, 25 unique participants were sampled from repeated classes performing the same exercise templates under comparable conditions, rather than sampling multiple participants within a single class.
Throughout the week, a wide range of exercises were included in each session, as shown in Table 1. Monday featured box jumps, deadlifts, planks and thrusters. Tuesday’s workout had band-resisted sprints, bear plank shoulder taps and foot taps, single-arm dumbbell hang clean and jerk, sit-ups, SkiErg and squats. On Wednesday, participants did burpees, jump rope and squats. Thursday included dumbbell plank drag-throughs, medicine ball tosses over the shoulder, rogue echo bike, sit-ups, and Total Resistance Exercise (TRX) bicep curls. Friday’s session included kneeling TRX rollouts, lunges, rowing and sit-ups. Saturday wrapped up the week with kettlebell gorilla rows, medicine ball kneeling lateral slams, side jump burpees, single-arm dumbbell hang clean and jerk and TRX Superman. This variety reflects the broad range of movement patterns typical of FT classes.
Each class lasted approximately 45 min and included a 10-min warm-up consisting of low-intensity aerobic activity and dynamic mobility, a 20 to 30-min main circuit block, and a 5-min cool-down with stretching and breathing exercises. During the main circuit, participants completed the exercises listed in Table 1 for that day, performing each exercise for 30 s followed by 15 s of rest before proceeding to the next exercise. An additional 1 min and 30 s of rest was provided midway through the main circuit, after approximately half of the exercises, before continuing with the remaining stations. The number of circuit rounds varied by day: Monday, 8 rounds; Tuesday, 4 rounds; Wednesday, 6 rounds; Thursday, 4 rounds; Friday, 5 rounds; and Saturday, 4 rounds. The exercise order in Table 1 reflects the sequence performed by the first recorded participant each day; other participants completed the same set of exercises but progressed through the stations in different orders. Within each class, all participants performed the same exercises, durations, and number of rounds, although the sequence of stations varied among individuals. The exercise set, prescribed work and rest durations, and number of circuit rounds were standardized within each recorded class. In contrast, external loads or resistances, as well as exercise regressions, progressions, and other modifications, were determined according to standard coaching practice and individual participant needs. These factors were neither standardized across participants nor systematically recorded. Consequently, they could not be included as covariates in the analyses.
The study included 25 practitioners (P1–P25) aged 24–58 years (median: 42 years; IQR: 37–49 years). The first and third quartiles were calculated from the ages of the 25 participants listed below. The sample comprised 13 female (52%) and 12 male (48%) participants. The age distribution was as follows: 24, 25, 26, 29, 30, 35, 37, and 38 years (one participant each); 40 years (three participants); 41, 42, 43, and 44 years (one participant each); 46 and 49 years (two participants each); 50 years (one participant); 52 years (two participants); and 54, 56, and 58 years (one participant each). In terms of training experience, 60% of participants () reported advanced experience (two or more years of regular functional training practice), while 40% () reported intermediate experience (six months to two years). No participants classified themselves as beginners (fewer than six months of experience), which aligns with recruitment from an established facility with a regular, ongoing client base. Training-level classification was determined by a single self-report item in the pre-session questionnaire, in which participants selected their experience category (Beginner: less than 6 months; Intermediate: 6 months to 2 years; Advanced: 2 or more years) based on predefined duration thresholds. Body mass and stature were not collected, as the study protocol focused on kinematic and physiological monitoring rather than anthropometric predictors of movement or load. This omission is acknowledged as a limitation, since body mass and stature can influence both movement kinematics and heart rate response. Their inclusion is recommended in future studies. Data were collected over six training days, with each participant recorded during one class per day: Monday (P1–P5), Tuesday (P6–P9), Wednesday (P10–P13), Thursday (P14–P18), Friday (P19–P23), and Saturday (P24–P25). Each of the 25 participants took part only once. No one was recorded on more than one day or contributed data to more than one session. All participants regularly attended the facility and were familiar with the exercises in their sessions. Before data collection, participants were informed about the procedures and gave written consent. Inclusion criteria required habitual participation in functional training classes at the facility. All participants were adults who regularly attended MAREBox sessions and had been cleared for high-intensity functional exercise according to the facility’s standard procedures. No additional research-specific medical screening, such as an electrocardiogram or physician examination, was conducted because the study did not introduce any new exercise stimulus or intensity beyond the participants’ usual training program. The only additions were non-invasive video and heart-rate monitoring during regular sessions. Coaches were present throughout each session, and participants were instructed to train at their usual self-selected intensity and to stop or modify exercises if they experienced discomfort.
2.2. Video Processing Pipeline
All sessions were recorded on video with a fixed smartphone camera that captured each participant’s full body during the FT class. The rear camera of an Apple iPhone 14 was used to record at 30 frames per second and 1920 × 1080 pixel resolution in vertical (portrait) orientation. Overhead LED lighting in the facility was used and this minimize variation in illumination. The smartphone was mounted on a tripod at a height of 106 cm and positioned approximately 2 to 3 m from the participant, with the camera oriented between 0° and 45° relative to the primary plane of movement, depending on the exercise and available space. A recording zone was defined for each class and maintained as consistently as possible. However, because data were collected during actual functional training sessions, participants naturally changed position, distance, and orientation relative to the camera as they moved within the room. This controlled but non-fixed configuration was selected to reflect the practical conditions of markerless video monitoring in group training.
The recordings were then analyzed using the MDL, a formal framework that breaks down each exercise into a sequence of movement phases. Earlier work developed and validated the MDL on a set of common functional exercises, demonstrating it could accurately detect repetitions and segment phases [35]. In this study, the MDL was expanded to include additional exercises performed in the classes, and the state definitions and angle thresholds were updated as needed to cover a wider range of movement patterns.
The MDL was defined and validated for 12 fundamental functional exercises, including squats, deadlifts, lunges, shoulder presses, planks, push-ups, pull-ups, bent-over rows, box jumps, thrusters, overhead squats, and burpees. Each exercise was represented as a finite-state machine driven by pose-derived proxy joint-angle thresholds. For the current study, all additional exercises present in the recorded class plans but not included in the original MDL library, such as single-arm dumbbell hang clean and jerk, bear plank shoulder taps, SkiErg, band-resisted sprint, Rogue Echo Bike, medicine ball toss over shoulder, dumbbell plank drag-through, TRX bicep curl, kneeling TRX rollout, kettlebell gorilla row, TRX Superman, side jump burpee, and medicine ball kneeling lateral slam, were encoded as new MDL exercise models using the same rule-based procedure. For both the original and newly added exercises, state-transition thresholds were defined by analyzing the time series of the relevant proxy joint angles. The evolution of these angles over time within correctly executed repetitions was inspected to identify typical maximum and minimum values for each movement phase. Phase boundaries were established based on these extrema and the characteristic shape of the angle trajectories. These definitions were finalized prior to applying the MDL pipeline to the present dataset.
Human body landmarks were extracted from each video frame using the MediaPipe model. This model estimates 33 keypoints to represent the head, trunk, and limbs and does not require reflective markers or specialised camera systems. Then, proxy joint angles were calculated as the relative angles between neighbouring body segments at the knee, hip, shoulder, elbow, and trunk. These angles give an indirect view of movement mechanics.
Human pose was represented within the two-dimensional image coordinate system provided by MediaPipe, with the origin located at the top-left corner of each frame. The horizontal axis increased to the right, and the vertical axis increased downward. Video data were processed every third frame from recordings acquired at 30 frames per second, resulting in an effective sampling frequency of approximately 10 Hz. For each processed frame, two-dimensional landmark coordinates were used to construct segment vectors. Proxy joint angles were calculated as the enclosed angle between two vectors using the dot-product formulation:
where and are the two vectors originating at the joint of interest; angles were expressed in degrees. Knee angle was calculated from the hip–knee and ankle–knee segments; hip angle from the shoulder–hip and knee–hip segments; elbow angle from the shoulder–elbow and wrist–elbow segments; and shoulder angle from the elbow–shoulder and hip–shoulder segments. For bilateral knee, hip, elbow, and shoulder measures, left- and right-side angles were first calculated separately. If both sides met the landmark-visibility criterion (visibility ), their mean was used. If only one side met this criterion, the available side was used. If neither side met the criterion, the angle was recorded as unavailable for that frame. For exercises requiring side-specific lower-limb information, left and right knee angles, or front and rear knee angles in split-stance movements, were calculated and retained separately. Trunk inclination was calculated using the angle between a vertical vector extending downward from the hip and the shoulder–hip segment. The left shoulder and hip were used when both were visible; otherwise, the right shoulder and hip were used. No additional temporal smoothing or filtering was applied to landmark coordinates or proxy-angle time series. Frames for which MediaPipe did not return pose landmarks were not interpolated and did not contribute angle observations. To reduce the sensitivity of phase classification to brief unmatched frames, a candidate phase was required to meet its conditions for a minimum number of consecutive processed frames before confirmation (default: two frames unless otherwise specified for an exercise). After confirmation, the finite state machine (FSM) retained the last valid phase for up to 12 consecutive unmatched processed frames before resetting the current phase.
Figure 1 summarizes the complete processing workflow used in this study. Raw monocular video footage from the FT classes is first processed by the pose estimation model to obtain body landmarks, which are then fed into the MDL finite-state machine to segment exercises and identify repetitions. From these segments, set-level kinematic metrics (repetition counts, timing variables, proxy joint angles, and angular velocity descriptors) are derived. Set onset and offset times were determined using MDL segmentation, with frame indices converted to elapsed time based on a 30 fps sampling rate. These times were used to extract corresponding intervals from the continuously recorded Polar H10 HR signal, aligning each exercise set with its respective HR segment. Video and HR recordings were initiated simultaneously by the same experimenter. Synchronization was verified by visually confirming agreement between major changes in movement intensity, such as the start of the main circuit or a mid-session break, and the HR trace. The combined dataset was finally analysed using correlation and mixed-effects models to examine relationships between video-derived kinematic metrics and established indicators of internal load.
Figure 1.
Overview of the pipeline, from smartphone video acquisition and pose estimation to MDL-based exercise segmentation, kinematic metric extraction, and statistical analysis of associations with internal load.
2.3. Video-Derived Kinematic Metrics
From the videos, it was possible to extract a set of kinematic variables for each exercise and set in the dataset. For every set, the following metrics were calculated:
- Repetition count (Reps): The total number of completed repetitions, counted by tracking full cycles of the MDL state machine.
- Set duration (s): The elapsed time from the first to the last repetition in the set.
- Work time (s): The cumulative time spent in active movement states.
- Rest time (s): The cumulative time spent in rest or non-movement states between repetitions.
- Work-to-rest ratio: The ratio of work time to rest time within the set.
- Inter-repetition rest (s): The average pause duration between consecutive repetitions.
- Mean and peak angular velocity (deg/s): Calculated from the main proxy joint angle time series for each exercise.
- Proxy joint angle means and peaks (deg): The average and maximum angles for all joints relevant to the exercise (e.g., left and right knee, front and rear knee in split stances, hip, elbow, shoulder, and torso).
Some kinematic fields fields were not applicable to all exercises. For example, elbow and shoulder angles were computed only for exercises in which upper-limb motion was central to the movement pattern, such as shoulder press, push-up, pull-up, bent-over row, and TRX bicep curl. These angles were structurally undefined for lower-body-dominant exercises, including squat, deadlift, and lunge. In such cases, the corresponding fields were deliberately excluded from exercise-specific analyses rather than estimated or imputed, as no meaningful value exists for a joint not engaged by the task.
Angular velocity was calculated independently for each detected repetition using the primary proxy joint angle designated for each exercise. Specifically, knee angle was used for squats, thrusters, box jumps, Echo Bike, side-jump burpees, and jump rope; hip angle for band-resisted sprints, bear-plank foot taps, and kettlebell swings; elbow angle for upper-limb pulling and pushing exercises, such as shoulder press, push-up, bent-over row, pull-up, TRX bicep curl, and kettlebell gorilla row; shoulder angle for exercises primarily involving shoulder movement, including SkiErg, medicine-ball toss over shoulder, dumbbell plank drag-through, kneeling TRX rollout, TRX Superman, and medicine-ball kneeling lateral slam; and torso angle for deadlifts, planks, sit-ups, and rowing. For lunges, the front-knee angle was used. Video data were processed every third frame from recordings acquired at 30 frames per second, resulting in an effective sampling frequency of approximately 10 Hz. The original timestamp of each processed frame was retained. Instantaneous proxy angular velocity was estimated using absolute first-order numerical differentiation between consecutive processed frames:
where is the selected proxy angle at processed frame i, is its timestamp, and is expressed in degrees per second. No additional temporal smoothing or filtering was applied to the angle or velocity time series. For each repetition, mean angular velocity was calculated as the arithmetic mean of the instantaneous absolute angular-velocity values. Peak angular velocity was defined as the maximum absolute value observed during the entire repetition, without restriction to a specific movement phase. Set-level mean angular velocity was calculated as the mean of repetition-level mean angular velocities, and set-level peak angular velocity was defined as the maximum of repetition-level peak angular velocities within that set.
To reduce processing demands, every third frame from the native 30-fps videos was retained, yielding an effective sampling rate of approximately 10 fps and a temporal resolution of approximately 100 ms. Instantaneous angular velocity was estimated by first-order finite differences between consecutive retained frames using the original timestamps. This sampling rate may underestimate brief peak angular velocities and may not fully resolve rapid cyclic or ballistic movements.
For the knee-angle convention used in this study, values closer to 180° indicate a more extended knee, whereas smaller values indicate greater knee flexion. Thus, a higher mean knee angle across a set reflects, on average, less knee flexion and may indicate a shallower squat or lunge position rather than greater lower-limb range of motion. Torso angle was defined relative to the vertical axis: values closer to 0° indicate a more upright trunk, whereas larger values indicate greater forward trunk inclination.
2.4. Internal Load Measurements
While the video was being recorded, each participant’s heart rate was also measured continuously with a Polar H10 chest-strap monitor. The Polar H10 is commonly used in sports and exercise research and has been shown to provide accurate beat-to-beat intervals and HR values during dynamic exercise [36]. For each exercise and set, the raw HR data were segmented to align with the set timing. The mean and peak HR (in beats per minute (bpm)) were calculated and stored with the corresponding kinematic data. Absolute mean and peak HR, measured in bpm, were utilized in descriptive and correlation analyses and retained as raw dependent variables in the mixed-effects models. Individual resting and maximal HR values were not obtained through standardized testing procedures; therefore, HR was not expressed relative to maximal HR (HRmax) or HR reserve. To clarify within-participant variation in movement execution, each video-derived kinematic predictor was standardized within each participant prior to mixed-effects modeling. This standardization was applied exclusively to the kinematic predictors, while mean and peak HR values remained in raw bpm. As a result, each kinematic fixed-effect coefficient represents the estimated change in raw HR, in bpm, associated with a one standard deviation increase within a participant for the corresponding predictor. Participant-specific random intercepts were included to account for between-participant differences in baseline HR. Set-level Spearman correlations were calculated as pooled descriptive associations across available exercise sets and should not be interpreted as strictly within-participant effects. No additional HR smoothing procedures were implemented.
Immediately after each FT session, participants completed an online questionnaire named “Assessment of stress and fatigue after functional training” made in Google Forms. All questionnaire items were administered in Portuguese. A questionnaire was developed for this study, incorporating two validated components: single-item scales utilizing the Borg CR10 category-ratio format and the sRPE method, as well as a study-specific fatigue composite consisting of four items rated from 0 to 4, inspired by but not equivalent to the BRUMS fatigue subscale. Additional items assessed target intensity, recovery status, and included open-ended questions regarding fatigue location and movement changes.
First, participants gave basic information such as their anonymous code, age, sex, session date, class type, session duration, and their own level of experience in FT (beginner, intermediate, or advanced). After that, they answered several single-item scales using the Borg CR10 format, rating the following:
- Global effort of the session from 0 (very easy) to 10 (maximal effort);
- Current muscular fatigue from 0 (no muscle fatigue) to 10 (extreme muscle fatigue);
- Current cardiovascular fatigue, anchored by breathing and heart rate, from 0 to 10;
- Current mental fatigue or cognitive tiredness from 0 to 10.
These items measure different aspects of perceived exertion by separating overall effort from muscular, cardiorespiratory, and mental components. They still use the familiar 0–10 Borg CR10 scale. The Borg CR10 scale has demonstrated high test–retest reliability across various exercise settings, with intraclass correlation coefficients ranging from 0.90 to 0.95 during resistance training sessions [37]. It also has strong concurrent validity with physiological markers like surface electromyography, HR, and blood lactate. A meta-analysis of 118 studies found a weighted mean validity coefficient of r = 0.88 (95% CI: 0.84–0.91) [38].
Participants then rated how well they could perform the exercises at their intended intensity on a 0–10 scale (“below my usual capacity” to “above my usual capacity”), and indicated their current recovery status using categorical options (energized and recovered, moderately fatigued but functional, very fatigued and needing recovery, extremely fatigued).
Internal training load was quantified using the sRPE method as originally proposed by Foster et al. [39]. In accordance with this method, participants rated their overall effort for each session on the 0–10 Borg CR10 scale a few minutes after completion. This rating was multiplied by the total session duration (in minutes) to calculate the sRPE load, which is expressed in arbitrary units (AU), consistent with the original Foster methodology. Both the raw Borg overall rating and the derived sRPE load (AU) were retained in the dataset. In this manuscript, sRPE refers specifically to the load variable (Borg overall rating multiplied by session duration), rather than the raw perceptual rating alone; it was recorded for descriptive purposes and was not used in the correlation or mixed-effects analyses. The sRPE method is one of the most validated subjective measures of training load: a review of 36 studies confirmed its validity and reliability across many sports and physical activities for both men and women [7]. Studies have consistently found correlations between sRPE and HR-based TRIMP (Training Impulse) indices in the range of r = 0.68–0.90 across different sports and exercise types, including functional training [7,39,40].
Additional 0–4 Likert items measured current feelings of fatigue, tiredness, exhaustion, and being drained. The items were adapted from fatigue-related constructs described in the BRUMS fatigue subscale literature. However, they do not replicate the standard wording (worn out, exhausted, sleepy, tired) and were not derived from a validated translation of the instrument. The items were summed to create a study-specific fatigue composite score (range 0–16), which was reported descriptively as the post-session fatigue measure.
The BRUMS is a 24-item questionnaire that measures mood states across six subscales: fatigue, vigour, tension, depression, anger, and confusion. Each item is rated on a 5-point Likert scale from 0 (“not at all”) to 4 (“extremely”) [41,42]. The standard fatigue subscale includes four items, worn out, exhausted, sleepy, and tired, each scored from 0 to 4, for a total score between 0 and 16 [43]. The BRUMS subscales demonstrate strong internal consistency in exercise and sport contexts, with Cronbach’s alpha values typically ranging from 0.74 to 0.90 [41,42,43]. Validity has been established through confirmatory factor analysis and correlations with other measures of positive and negative affect across diverse cultural and exercise settings [43,44]. Four study-specific items, fatigued, tired, exhausted, and drained, each rated on a 0 to 4 scale, were developed to capture a construct similar to the BRUMS fatigue subscale in a concise format suitable for post-session field data collection. These items specifically assessed the extent of physical tiredness and exhaustion experienced by participants after exercise, which is conceptually distinct from the general RPE that measures perceived effort rather than fatigue. Responses to these four items were summed to create a composite fatigue score (range 0–16), which served as the primary post-session fatigue measure in the analyses.
The questionnaire also asked open-ended questions to help identify and describe where participants felt fatigue during the session. Participants reported which body areas felt most tired, such as the lower legs, thighs, hips, back, shoulders, arms, core, neck, or their whole body. They also indicated which types of exercises were hardest, including strength, cardio, circuit endurance, balance, or flexibility. Participants noted when they felt the most fatigued, whether at the start, middle, end, during cool-down, or throughout the session. They were also asked whether they noticed changes in movement execution, strength, coordination, or technique, and to select specific changes such as reduced strength, reduced control, poorer balance, worse form, slower movement, or reduced range of motion. Finally, three open-ended questions let them describe these changes and their overall fatigue in their own words. The items were collected to provide descriptive and contextual information regarding participants’ subjective fatigue experiences, thereby complementing the quantitative heart rate and kinematic analyses. These items were not included as outcome variables in the correlation or mixed-effects models. Section 3.3 presents a summary of response frequencies, along with the full item wording and distributions.
The numerical items from the questionnaire were mapped to the structured dataset as follows: Borg overall, Borg muscle, Borg cardiovascular, Borg mental, sRPE load (AU), target intensity achieved, and the study-specific fatigue composite score, which encompassed feelings of fatigue, tiredness, exhaustion, and being drained. Each participant’s scores were entered once and linked to all corresponding sets. As a result, the Borg variables were used exclusively in participant-level correlations () and were not included as outcomes in set-level analyses (). The Borg ratings served as the perceptual outcome measures for the correlation analyses; sRPE and the fatigue composite score were reported descriptively.
2.5. Statistical Analysis
The raw data were organized in a spreadsheet, with each row corresponding to a specific exercise-set combination. Participant characteristics and post-session perceptual or fatigue scores were recorded once per participant. These session-level variables were retained for participant-level analyses and were not considered as independently measured set-level observations. The dataset comprised 25 participants observed across 6 class days, resulting in a multilevel structure where exercise-set combinations () were nested within both exercises and participants. Participants served as the primary statistical unit of inference, while sets were treated as repeated observations within participants rather than as 532 independent units.
The study employed two analytical levels to align with the measurement structure of the data. Heart-rate variables and MDL-derived kinematic metrics were analyzed at the set level, as both were measured for each exercise set. These observations were treated as repeated measures clustered within participants and exercises. Borg CR10 ratings, sRPE, and post-session fatigue measures were collected once per participant after the class and were therefore analyzed exclusively at the participant level. For these exploratory participant-level analyses, set-level kinematic and heart-rate variables were averaged across all sets to generate a single summary value per participant (; 24 for HR, and 13–25 for kinematic descriptors depending on whether the descriptor was defined for that participant’s exercises).
All analyses were performed in Python (version 3.11) using the pandas, scipy, statsmodels, pingouin, and matplotlib libraries. Statistical significance was set at throughout.
For each participant, video-derived kinematic variables used as mixed-effects predictors were standardised using Z-score normalisation prior to model fitting:
where represents the value of a kinematic predictor for set i of participant j, denotes the participant’s mean value across available sets, and is the corresponding within-participant standard deviation. This transformation was applied exclusively to kinematic predictors to facilitate interpretation of within-participant variation in movement execution. Mean HR and peak HR were not standardised for the mixed-effects models and were retained as raw bpm outcomes. Participant-specific random intercepts were incorporated into the mixed-effects models to account for clustering of sets within participants and differences in baseline HR between participants. Participant-level summaries, including participant-mean HR and kinematic values used in correlation analyses, were calculated from raw, non-standardised set-level values. For participants exhibiting zero or negligible within-participant variation in a given kinematic predictor, the corresponding Z-scores were treated as missing and excluded solely from models requiring that predictor.
Descriptive statistics, including means, standard deviations (SD), and coefficients of variation (CV%) were computed for all continuous variables at both the set and participant levels.
Set number was included as an untransformed continuous covariate in the mixed-effects analyses to represent progression through a participant’s session. It was defined as the recorded round index within that participant’s training session (Set 1, Set 2, Set 3), irrespective of the exercise performed within each round. In the data sheet, the round index was entered only on the first exercise set of each round; it was therefore carried forward to all exercise sets of the same round before modelling, so that the set-number models used all 532 HR-linked sets from 24 participants. Set number was not Z-standardised. Its fixed-effect coefficient therefore represents the estimated change in raw HR, in bpm, associated with one additional set-number unit.
The Shapiro–Wilk test [45] was employed to assess the distributional properties of continuous variables, specifically skewness and deviations from normality, prior to conducting correlation analyses. The majority of variables did not exhibit normal distributions, which aligns with the small participant sample size () and the ordinal nature of the Borg and fatigue scales. Nevertheless, the selection of the correlation model was determined primarily by the measurement level and the potential for non-linear yet monotonic relationships, rather than by the results of normality tests alone.
Spearman’s rank correlation coefficient () [46] was employed to assess bivariate associations, offering a robust, rank-based summary of monotonic relationships for both continuous and ordinal variables. Spearman’s was used to summarize monotonic associations. Pooled set-level correlations among video-derived descriptors and HR were treated as descriptive because multiple sets were contributed to by the same participants. These pooled coefficients are presented without p-values, FDR significance labels, or confidence intervals calculated under an independent-observation assumption. Formal inference about set-level HR associations was based on the participant-clustered mixed-effects models. Participant-level correlations used one summary value per participant and were reported with confidence intervals and multiplicity-adjusted p-values where specified. Analyses were performed at two levels, each aligned with the measurement level of the variables. At the set level, the association between kinematic variables (both raw and Z-scored within-participant) and heart rate (HR) was evaluated using data from individual exercise sets. These set-level observations were recognized as clustered within participants and thus not statistically independent. Therefore, the set-level Spearman coefficients serve as descriptive summaries of association rather than as independent-sample inferential tests. Formal inference regarding the relationships between kinematic variables and HR is based on the mixed-effects models described below. At the set level, only variables directly measured for each set, such as HR and MDL-derived kinematics, were included in the correlation analysis. Perceptual and post-session fatigue variables were analysed exclusively at the participant level, as previously described.
Relationships between angular velocity and heart rate (HR) or perceptual measures were examined at both the participant and exercise levels by averaging data per participant for each exercise, thereby facilitating the identification of exercise-specific patterns. At the participant level, kinematic and HR variables across all sets were averaged to yield a single value per participant, which was then correlated with post-session perceptual and fatigue measures. These measures included Borg overall, Borg muscle, Borg cardio and Borg mental, each collected once per participant. Participants with missing data for either variable in a given comparison were excluded from that analysis. Participant-mean HR and participant-mean peak HR were also correlated with post-session Borg overall, muscle, cardio, and mental ratings; the eight resulting HR–Borg correlations were considered a single prespecified family for Benjamini–Hochberg false discovery rate (FDR) adjustment. For the specified participant-level correlation families, p-values were adjusted using the Benjamini–Hochberg FDR procedure at [47]. This approach controls the expected proportion of false discoveries among rejected null hypotheses and is generally less conservative than the Bonferroni correction, which controls the family-wise error rate.
To evaluate associations between video-derived descriptors and heart rate (HR) while accounting for repeated sets within participants, a series of linear mixed-effects (LME) models was fitted using the statsmodels MixedLM module [48]. Separate models were estimated for each combination of HR outcome (mean HR, peak HR) and MDL-derived kinematic predictor at the set level. Each model specified raw mean HR or raw peak HR (in bpm) as the dependent variable. Video-derived kinematic predictors were entered as within-participant Z-scored variables, so fixed-effect coefficients represent the estimated change in raw HR per one within-participant standard deviation increase in the predictor. Set number was analyzed separately as an untransformed continuous predictor, with its coefficient representing the estimated bpm change per additional set. The initial random-effects structure included a random intercept and a random slope for the kinematic predictor for each participant, yielding models of the form:
where and are fixed effects, is the predictor value for set i of participant j, and are participant-specific random intercept and slope terms, and is the residual error. The random intercept–random slope specification was determined a priori as the maximal random-effects structure consistent with the study design. A predefined simplifying rule was implemented, such that models were refitted with random intercepts only if the maximal structure failed to converge. If the random intercept–random slope specification did not converge, a predefined simplification to a random-intercept-only model was applied:
while retaining the same fixed effect. All models were estimated using restricted maximum likelihood (REML) with the default unstructured covariance for the random effects and the “lbfgs” optimiser. Models were only fitted when there were at least 10 observations and at least 3 participants. Convergence was determined from the optimiser output. Residual assumptions were evaluated by inspecting residual distributions and by applying the Shapiro–Wilk test to model residuals in a separate diagnostic step. Fixed-effect results from the LME models are reported as regression coefficients () with corresponding 95% confidence intervals and p-values, and are visualised as coefficient plots with 95% confidence intervals. The p-values of all 34 fitted HR models (16 video-derived predictors and set number, each for mean and peak HR) were treated as one family and adjusted with the Benjamini–Hochberg procedure; an association was considered to meet the FDR criterion when . Confidence intervals are nominal (not adjusted for multiplicity).
As this study involved a secondary analysis of an existing dataset, the sample size was fixed and an a priori power calculation was not conducted. A simulation-based sensitivity analysis was therefore performed for the Mean HR–work-time linear mixed-effects model, which included 23 participants and 484 sets. Simulated datasets preserved the model’s random-intercept and random-slope structure, estimated intercept-slope covariance, residual variance, and a two-sided alpha level of 0.05. Power was estimated across standardized fixed-effect sizes equivalent to Cohen’s d values of 0.20, 0.50, and 0.80, using 500 simulations per effect size.
Exercise type was not included in the reported mixed-effects models. The number of observations and the availability of individual descriptors varied substantially across exercises and participants.
The complete numerical results for all fitted models, including fixed-effect estimates, standard errors, 95% confidence intervals, Benjamini–Hochberg FDR-adjusted p-values, random-effect variance components, residual variance, and model-fit statistics such as log-likelihood, AIC, and BIC, are reported in Section 3.6.
Given that perceptual and fatigue measures were collected once per participant, these outcomes were analysed at the participant level using correlation methods rather than mixed-effects models. Exercise type was not included as a covariate in the main LME models because the data were sparse and highly unbalanced across exercise types. Some exercise types occurred on more than one class day (Table 1), so exercise type was not completely confounded with day. Because the reported models do not adjust for exercise type, their coefficients describe associations across the observed exercise sets and may include differences between exercises performed by the same participant. They should not be interpreted as within-exercise, exercise-independent, or causal effects.
The strength of all correlation coefficients was interpreted using the thresholds from Hopkins et al. [49]: trivial (), small (0.10–0.29), moderate (0.30–0.49), large (0.50–0.69), very large (0.70–0.89), and nearly perfect (≥0.90).
3. Results
Video-derived data were available for 551 exercise sets from 25 participants; 532 sets from 24 participants were available for analyses involving HR. Kinematic metrics were calculated for each set, while perceived exertion and fatigue were evaluated once per session using a post-class questionnaire. The subsequent sections detail the primary descriptive and inferential findings for video-derived kinematic metrics, heart rate, and perceptual measures.
3.1. Video-Derived Kinematic Metrics by Exercise
Video-derived metrics varied substantially across exercises, including work and rest durations, work-to-rest ratio, repetition count, and proxy joint-angle descriptors. These differences reflect the distinct temporal and biomechanical demands of each exercise and demonstrate the ability of the proposed pipeline to characterize heterogeneous movement patterns in real functional training sessions, as shown in Figure 2.
Figure 2.
Video-derived metrics by exercise (set-level; all 551 video-derived sets from 25 participants, including the participant without HR data). Each panel shows the distribution of work time, rest time, work-to-rest ratio, and repetition count across exercises; the number of sets with a valid value is given in each panel title (500–501 sets for timing metrics, 550 for repetitions).
Since the number of set-level observations varies a lot between exercises, ranging from just 1 or 2 sets for some exercises to over 50 sets for sit-ups, see Table 2, comparisons between exercises should be made with caution and not treated as equally powered.
Table 2.
Number of set-level observations and unique participants per exercise ( sets, 25 participants).
Video-derived kinematic data were available for 551 exercise sets from 25 participants. However, HR data could not be obtained for one participant (P13) because of a technical recording issue. Therefore, the HR-linked analytic dataset used for HR correlations and linear mixed-effects models comprised 532 exercise sets from 24 participants. P13 was retained in descriptive analyses of video-derived kinematic metrics but was excluded from all analyses requiring HR data.
Exercise representation was uneven across participants and class days. Several exercise types occurred on more than one day (Table 1), while many participant-by-exercise combinations contained few observations. Between-exercise comparisons are therefore descriptive and cannot isolate effects attributable to exercise type from differences in participants or session context.
Bear plank shoulder taps had the highest work time (median about 55 s), followed by medicine ball kneeling lateral slam (about 37 s). Other exercises with longer durations included jump rope and kettlebell gorilla row (about 28 s each) and bear plank foot taps (about 24 s). In contrast, TRX Superman, burpee, and dumbbell plank drag-through had median work times close to zero, indicating much shorter periods of active movement than the other exercises. Considerable inter-individual variability was observed for certain exercises. In particular, bear plank shoulder taps and sit-ups showed wide interquartile ranges and several outliers, suggesting substantial differences in work duration among participants. Overall, the distribution of work times varied markedly across exercises, reflecting differences in movement characteristics and execution patterns.
Rest times were longest for SkiErg and band-resisted sprints, with median values of approximately 56 to 58 s; the single rest-time value above 200 s belonged to a single-arm dumbbell hang clean and jerk set. This matches their sprint-interval format, which needs full recovery between efforts. In contrast, exercises like bear plank foot taps, medicine ball kneeling lateral slam, and kettlebell gorilla row had almost no rest between them, indicating they were performed continuously. The work-to-rest ratio was highest for medicine ball kneeling lateral slam and bear plank shoulder taps, with medians of approximately 15 and 12, followed by bear plank foot taps at about 7. For exercises without clearly discrete repetitions or with movement patterns not adequately captured by the repetition-based MDL segmentation, including plank and SkiErg, the algorithm sometimes did not identify a valid active-work interval. This produced spuriously low work-time estimates and, consequently, spuriously low work-to-rest ratios. These values should not be interpreted as characteristics of the exercises or as evidence of low movement demand. Timing-derived metrics for such exercise sets were flagged as invalid and excluded from timing-based descriptive and inferential analyses. Repetition counts were highest for jump rope (median about 65 to 70 reps per set) and bear plank shoulder taps (about 50 reps). Compound and technical exercises such as thrusters, burpees, box jumps, single-arm dumbbell hang clean and jerk, and dumbbell plank drag-through consistently had low counts, with medians at or below 10 reps per set. These clear differences in all four kinematic metrics show that the MDL pipeline can capture unique training patterns for each exercise type.
3.2. Heart Rate by Exercise
Mean heart rate at the set level showed a median of 135 bpm across all exercises, with notable variation by exercise type, shown in Figure 3.
Figure 3.
Mean HR by exercise (set-level, sets). Dashed line indicates overall median (135 bpm).
Jump rope, burpees, deadlifts, planks, thrusters, and box jumps elicited the highest average heart rates, with median values exceeding 150 bpm. These exercises are generally classified as multi-joint, whole-body movements. However, in this study, exercise intensity, external load, and physiological demand were not standardized or independently quantified. Therefore, the observed heart rate differences should be interpreted descriptively rather than as evidence of causal effects related to exercise type. Bear plank, medicine ball toss over the shoulder, dumbbell plank drag-through, and Rogue Echo Bike produced heart rates near the overall median. Kettlebell gorilla row, SkiErg, and medicine ball kneeling lateral slam resulted in lower average heart rates (median 110–125 bpm). Sit-ups demonstrated the widest range of heart rates (approximately 60–180 bpm), which may reflect their function as a transition exercise within circuits and their performance by a diverse participant group.
3.3. Perceived Effort and Fatigue
Figure 4 summarizes pooled set-level Spearman coefficients. Peak shoulder angle had positive descriptive correlations with mean HR () and peak HR (; 78 sets), while mean torso angle was positively associated with mean HR (; 99 sets). These estimates describe the recorded sets. Because several sets came from each participant, the pooled correlations are not treated as independent-sample tests or as evidence that these descriptors predict HR.
Figure 4.
Pooled set-level Spearman correlations between video-derived descriptors and mean and peak HR. Up to 532 HR-linked exercise sets contributed to these descriptive estimates; the number of sets for each descriptor is shown next to its label (78 sets for shoulder angles). No significance markers are shown. Repeated sets within participants preclude interpreting the pooled coefficients as independent-sample tests.
Borg CR10 ratings and the study-specific fatigue composite were collected once following the functional training session. As these measures were obtained at the participant level, they were excluded from the set-level correlation analysis. For exploratory analysis, kinematic metrics were averaged across all sets completed by each participant and correlated with the corresponding post-session Borg measures (up to 25 participants; 13–25 depending on the descriptor; Figure 5).
Figure 5.
Exploratory participant-level Spearman correlations between participant-mean video-derived kinematic metrics and post-session Borg CR10 perceived-exertion measures. Participant means were calculated across all available sets of each participant. The number of participants contributing to each coefficient is shown in each cell (13–25), because some descriptors were defined only for certain exercises. No coefficient met the Benjamini–Hochberg FDR criterion across the 72 correlations (all ); 95% bootstrap confidence intervals are reported in Supplementary Table S1.
The largest exploratory participant-level coefficients were positive correlations of mean knee angle with Borg cardio (, 95% CI [0.10, 0.83]) and Borg muscle (, 95% CI [0.02, 0.91]) (), and of mean shoulder angle with Borg muscle (, 95% CI [, 0.89]; ). Work-to-rest ratio was negatively correlated with Borg cardio (, 95% CI [, ]), Borg mental (, 95% CI [, ]) and Borg muscle (, 95% CI [, 0.00]) (). None of these participant-level correlations met the Benjamini–Hochberg FDR criterion (all ).
To examine physiological–perceptual correspondence at the participant level, mean HR and participant-mean peak HR were calculated by averaging the corresponding set-level values across all available exercise sets for each participant. These heart-rate summaries were then correlated with post-session Borg overall, muscle, cardio, and mental ratings (Table 3). Twenty-four participants had complete HR and Borg data. Mean HR showed positive correlations with Borg overall (, 95% CI [0.25, 0.78], ), Borg muscle (, 95% CI [0.02, 0.71], ), Borg cardio (, 95% CI [0.06, 0.67], ), and Borg mental (, 95% CI [0.06, 0.72], ). Participant-mean peak HR showed positive correlations with Borg overall (, 95% CI [0.26, 0.76], ), Borg muscle (, 95% CI [0.06, 0.73], ), Borg cardio (, 95% CI [0.11, 0.65], ), and Borg mental (, 95% CI [0.11, 0.70], ). These participant-level associations were exploratory because each participant contributed data from one session only.
Table 3.
Exploratory participant-level Spearman correlations between participant-mean heart-rate measures and post-session Borg CR10 ratings (). Mean HR and participant-mean peak HR were calculated by averaging the corresponding set-level values across all available exercise sets for each participant. Confidence intervals are 95%; values were adjusted using the Benjamini–Hochberg procedure across the eight HR–Borg correlations. One participant was excluded because heart-rate data were unavailable.
Borg Overall RPE scores (Figure 6) ranged from 4 to 9 among participants. Most ratings clustered between 7 and 8, while several lower values indicated substantial variability between participants. The group mean was 6.9, with a median of 7.0, which suggests most found the effort hard to very hard. Participants P15 and P14 gave the highest exertion ratings (9), while P20 gave the lowest (4). Most participants (17 out of 25) rated their exertion at 7 or higher.
Figure 6.
Borg Overall RPE per participant (session level, ).
The Borg subscale results (Figure 7) showed that the average cardio score was 5.0 (median 5.0), muscle fatigue was 4.8 (median 5.0), and mental effort was 3.5 (median 3.0). The distributions were broad. Cardio and muscle scores were concentrated near the midpoint of the 0–10 scale, yet individual values ranged from low to high. In contrast, mental effort scores exhibited the greatest variability, with some participants reporting minimal mental fatigue and others indicating high levels. Overall Borg scores were narrowly distributed, with most responses between 7 and 8. However, the subscales, particularly mental effort, demonstrated greater dispersion.
Figure 7.
Perceived exertion score distributions across participants (, session level).
The radar profiles for each participant (Figure 8) showed a wide range of exertion patterns across the group, with markedly different shapes and magnitudes across individuals on the same 0–10 scale. All data were plotted on the same 0–10 Borg CR10 scale for easy comparison. Participants P14 and P15, who had the highest overall Borg scores (9), had large profiles with high scores on all four subscales, suggesting they felt high demand in every area. In contrast, P13 had a profile that was much higher on the mental exertion axis (Borg mental = 10) but lower on cardiovascular and muscular scores. P5 and P8 showed the opposite, with higher muscular and cardiovascular scores compared to their mental fatigue ratings. On the other hand, participants like P19, P9, and P20 had small, compact profiles with low scores in all four areas, showing they felt little exertion even though they did the same class. These individual profiles suggest that the global, muscular, cardiovascular, and mental ratings may capture partially distinct aspects of perceived exertion. However, the Borg subscales were moderately to strongly intercorrelated ( to ), indicating substantial shared variance. Therefore, the incremental value of subscale-specific ratings beyond a single global RPE rating remains to be established in larger, independent samples.
Figure 8.
Perceived exertion profile per participant (session level). All axes use the Borg CR10 scale (0–10).
Fatigue composite scores averaged (observed range 0–14; possible range 0–16) across participants, indicating moderate post-session fatigue that varied between individuals. Because fatigue composite score is a session-level measure collected once per participant, it is reported here alongside Borg measures and analysed exclusively at the participant level ().
Analysis of the open-ended and multi-select items on fatigue characteristics indicated that the quadriceps/thighs, abdominals/core, and arms/biceps were the most frequently reported fatigued body regions. Cardiovascular and strength exercises were most often identified as the most challenging to perform. Peak fatigue was typically reported near the end of the session. Decreased movement speed and reduced strength were the most commonly perceived changes in execution quality. The complete frequency and percentage distributions for all categories are provided in Table 4.
Table 4.
Frequency of self-reported fatigue characteristics and movement changes, as measured by a Google Forms questionnaire ( participants). Percentages indicate the proportion of participants selecting each option. Because items allowed multiple selections, totals do not sum to 100%.
3.4. Associations Between Video-Derived Metrics and Heart Rate
3.4.1. Set-Level Associations
The set-level correlation matrix (Figure 9) includes only variables measured at the set level, specifically video-derived kinematic metrics and mean and peak HR. Perceived exertion and post-session fatigue measures were excluded, as these were collected once per participant after the session and analyzed separately at the participant level. Set-level Spearman coefficients are reported as descriptive pooled summaries across the available exercise sets, given that sets are clustered within participants. Mixed-effects models provide adjusted, model-based estimates of associations between kinematic metrics and HR.
Figure 9.
Descriptive matrix of pooled set-level Spearman correlations among available video-derived descriptors and HR measures. Video-only comparisons could include up to 551 sets; comparisons involving HR could include up to 532 sets from 24 participants. Pairwise availability may vary by descriptor (from 9 to 546 sets per pair; pairs of descriptors that were never defined for the same exercise are left blank). No independent-sample significance tests are presented.
Work time and rest time had a negative correlation (). The work-to-rest ratio was strongly positively correlated with work time () and strongly negatively correlated with rest time (). Inter-repetition rest showed a positive correlation with work time () and the work-to-rest ratio () and a negative correlation with rest time (). For angular kinematics, mean and peak angular velocity were strongly correlated (), whereas torso angle mean and torso angle peak were moderately correlated () and hip angle mean and hip angle peak were essentially uncorrelated (). Mean knee angle was strongly associated with mean hip angle (). The mean and peak HR were highly collinear (), as expected.
3.4.2. Participant-Level Associations with Perceived Effort
Exploratory between-participant patterns were examined by aggregating video-derived metrics for each participant and correlating these with post-session perceived-exertion ratings. As each participant contributed a single session and the availability of individual kinematic metrics varied by exercise type, the effective sample size differed across correlations. These analyses are descriptive and intended to generate research questions for future studies; correlation estimates were interpreted using two-sided 95% confidence intervals and Benjamini–Hochberg FDR-adjusted p-values, rather than relying solely on statistical significance labels.
All participant-level correlations with perceived exertion were considered exploratory, as Borg ratings were collected only once per participant. The number of participants contributing to each correlation varied because certain kinematic metrics were not applicable to all exercise types. Correlation coefficients are presented in Figure 5. Two-sided 95% confidence intervals and Benjamini–Hochberg FDR-adjusted p-values were used to interpret the estimates. Due to small and variable sample sizes, including limited data for several angle metrics, these results are presented as descriptive and intended to inform future research questions rather than as confirmatory evidence of associations between movement metrics and perceived exertion.
At the participant-mean level (Figure 5, –25 depending on the descriptor), several correlations demonstrated moderate to large estimated magnitudes. Specifically, positive associations were observed between mean knee angle and both Borg muscle () and Borg cardio (; ) scores, while negative associations were found between work-to-rest ratio and selected Borg subscales ( to ; ). However, the corresponding 95% confidence intervals were imprecise, and no participant-level correlation remained significant following Benjamini–Hochberg FDR correction. Consequently, these findings are presented as exploratory effect estimates rather than as evidence of reproducible associations. The work-to-rest ratio estimates should also be interpreted in the context of differences in exercise selection and session structure, as previously discussed.
3.5. Descriptive Patterns of Mean Angular Velocity and Heart Rate by Exercise
Figure 10 presents participant-exercise mean values for mean angular velocity and mean HR. These plots are provided to illustrate the heterogeneity of observed movement-velocity and HR patterns across different exercises. Due to the small and highly uneven number of participant-level observations per exercise, with several exercises represented by only two or three participants, no exercise-specific correlation coefficients, regression lines, p-values, or inferential conclusions were calculated or interpreted. Therefore, the figure should not be used to infer exercise-specific velocity–HR relationships.
Figure 10.
Participant-exercise mean angular speed and mean HR by exercise. Each point represents one participant’s mean across available sets for that exercise; panel labels report the number of contributing participants. The panels show descriptive variation and do not present exercise-specific regression lines, correlation coefficients, p-values or inferential tests.
3.6. Mixed-Effects Modelling
The mixed-effects models accounted for repeated observations within participants but did not adjust for exercise type. No video-derived descriptor met the stated false-discovery-rate criterion for association with mean or peak HR. Round index met that criterion in separately fitted models. Because round index and the video-derived descriptors were not fitted jointly, and because exercise composition varied, these models do not identify an exercise-independent predictor of HR.
Pairwise correlations identified several candidate relationships, but these analyses do not account for the nested structure of the data. LME models were therefore used to examine associations between individual video-derived descriptors and heart-rate variation while accounting for repeated measurements within participants shown in Figure 11. All kinematic predictors were Z-scored within each participant to compare effect sizes on the same scale.
Figure 11.
Fixed-effect estimates (95% confidence intervals) from the separately fitted linear mixed-effects models of set-level mean HR (left) and peak HR (right); values are identical to Table 5. Upper panels: Video-derived predictors, standardised within participant (bpm per one within-participant SD). Lower panels: Set number (round index; bpm per additional round, unstandardised). Blue: Benjamini–Hochberg FDR-adjusted across the 34 models; grey: . Confidence intervals are nominal.
In the simulation-based sensitivity analysis of the reference Mean HR–work-time model, estimated power was 96.2% to detect a small standardized fixed effect of , and 100% for effects of and . The estimated standardized effect size associated with 80% power was approximately . These estimates apply to the reference model with 23 participants and 484 sets; analyses involving fewer sets may have lower power.
Among the 34 fitted HR mixed-effects models (32 video-derived predictor models and 2 set-number models), the majority converged using the maximal random-intercept and random-slope structure. Two models (mean HR × mean shoulder angle and peak HR × peak knee angle) required simplification to a random-intercept-only model, following the pre-specified fallback rule. Complete model-fit information is provided in Table 5. In both set-number models, which used all 532 HR-linked sets from 24 participants, the fixed-effect confidence interval excluded zero and the association met the FDR criterion (mean HR: bpm per round, 95% CI , , ; peak HR: bpm per round, 95% CI , , ). One kinematic coefficient, peak angular velocity in the peak-HR model, had a nominal 95% confidence interval excluding zero ( bpm, 95% CI [, ]; ). It did not meet the false-discovery-rate criterion (), and no video-derived coefficient met that criterion. The reported confidence intervals are nominal and were not adjusted for multiplicity. The nominal 95% confidence intervals of all other video-derived coefficients included zero, and none of the 32 video-derived coefficients met the FDR criterion (all ). The positive association of round index with HR was obtained in separate models and cannot be attributed specifically to fatigue accumulation or distinguished from changes in exercise composition.
Table 5.
Linear mixed-effects models of set-level mean and peak heart rate. Each row is a separate model. RE: Random-effects structure (R + S, random intercept and random slope; R, random intercept only). : Fixed-effect coefficient in bpm per within-participant SD (video-derived predictors) or per additional round (set number). p: Nominal p-value; q: Benjamini–Hochberg FDR-adjusted p-value across all 34 models. AIC and BIC are from maximum-likelihood refits and should not be compared across rows with different samples; – indicates that the ML refit did not converge.
Thus, apart from the single nominal exception described above, the confidence intervals of the video-derived coefficients included zero, and no video-derived descriptor showed an association with HR that met the FDR criterion after accounting for repeated sets within participants. These results should be considered along with the correlations discussed in Section 3.4. The correlations found at the set and participant levels probably reflect differences between exercises and sessions, rather than changes within each participant. In this dataset, inclusion of exercise type as a covariate in the linear mixed-effects (LME) models was not feasible due to the limited and uneven number of observations per participant-exercise combination, as well as the absence of certain kinematic descriptors for some exercises. Consequently, the reported mixed-effects coefficients represent average effects across all exercises, rather than effects adjusted for exercise type. Future models that include exercise type as a fixed effect or group data by exercise category may be better able to identify true within-exercise kinematic predictors of HR.
4. Discussion
This study documents the application of an acquisition-to-analysis workflow during scheduled FT classes: smartphone video was processed through pose estimation and MDL-based segmentation to obtain set-level movement descriptors, which were paired with wearable HR measurements. Post-session perceptual ratings were analysed separately at the participant level. The field application produced video-derived data for 551 sets across varied exercises, with HR available for 532 sets. The application also exposed practical limits of the descriptors: timing outputs depend on successful segmentation of discrete repetitions, and image-plane angle and angular-speed outputs have not been validated against reference biomechanical measurements. The contribution is therefore a documented application and assessment of this integrated field process, with explicit boundaries on how its outputs may be interpreted. Pooled descriptive correlations suggested relationships between some video-derived descriptors and HR. However, no kinematic coefficient met the stated false-discovery-rate criterion in models accounting for repeated sets within participants. Those models did not adjust for exercise type or external load, and round index was fitted separately from the kinematic descriptors. Thus, the results do not establish exercise-independent associations or predictive validity. They show why pooled relationships observed across heterogeneous exercise sets should not, on their own, be treated as reliable physiological monitoring signals.
Participants reported moderate to high training demands, with a mean Borg score of 6.9 (median = 7.0). Cardiovascular and muscular exertion were rated similarly (means of 5.0 and 4.8, respectively), whereas mental fatigue was consistently lower (mean = 3.5). Fatigue composite scores ranged from 0 to 14 (possible range 0–16), indicating substantial between-participant variability in post-session perceived fatigue. Together, these findings confirm that the recorded sessions covered a broad spectrum of perceived internal load, providing suitable conditions for investigating associations with movement characteristics extracted from video.
Heart rate and perceived exertion represent related yet distinct components of training load. At the participant level, higher participant-mean HR and higher participant-mean peak HR were associated with elevated post-session Borg ratings for overall, muscle, cardiovascular, and mental exertion (Table 3). These correlations were calculated using one HR summary and one post-session Borg score per participant, which prevented pseudoreplication that could arise from assigning a single session-level Borg rating to multiple exercise sets. The results demonstrate an exploratory descriptive correspondence between physiological and perceived internal-load measures across participants. However, since participants completed different functional-training sessions and each participant contributed data from only one session, these associations may be influenced by between-session differences in exercise composition, sequencing, or overall session demand. Therefore, these findings should not be interpreted as evidence of set-level agreement, causal relationships, validation, or interchangeability between HR and Borg measures. Similarly, the fatigue composite score was measured after each session and therefore could not be meaningfully analysed at the set level. This highlights an important methodological consideration for future multimodal studies: perceptual and mood-based measures should ideally be collected at temporal resolutions that match the physiological and kinematic variables under investigation.
Interpretation of the work-to-rest ratio requires particular caution. This metric was developed for individual exercise sets, whereas Borg CR10 ratings, sRPE, and the study-specific fatigue composite were collected once after the entire training session. Participants completed various functional-training sessions that differed in exercise composition, number of rounds, and circuit structure. Therefore, any descriptive association at the participant level between mean work-to-rest ratio and post-session perceived exertion may reflect differences in session or exercise type within programme design, rather than an individual-level physiological relationship. The current exploratory design does not allow for determination of an independent effect of work-to-rest ratio on perceived exertion. Future research should employ standardised session protocols or repeated observations within specific exercise and session categories.
Interpretation of timing-derived metrics requires particular caution because work time, rest time, and work-to-rest ratio depend on successful repetition-based MDL segmentation. For sustained isometric or non-discrete movement patterns, failure to identify an active interval can mechanically yield near-zero work-time and work-to-rest values; these artefactual values were not interpreted as movement characteristics and were excluded or flagged in timing-based analyses.
The contribution of these findings is not a ranking of candidate physiological predictors. These descriptors illustrate what the workflow can extract and examine during field sessions; they are not validated markers of internal load. Peak shoulder angle and some torso descriptors showed comparatively large pooled correlations, but the exercise sets contributing to these estimates were heterogeneous, and the corresponding video-derived coefficients did not meet the adjusted inferential criterion in the participant-clustered models. Likewise, the participant-level relationships with post-session ratings describe correspondence at the session level and cannot be transferred to individual sets.
In separately fitted models, a higher round index was associated with higher HR. This association may reflect elapsed time, exercise order, differences in exercise composition, recovery, or accumulated demand; the current design cannot distinguish among these explanations. Specifically, HR may vary across successive sets due to accumulated physiological demand, recovery patterns, exercise order, or changes in the exercises performed. However, the current data cannot distinguish among these potential influences because exercise type was not included as a model covariate. The models account for repeated observations within participants but do not separate within-exercise variation from differences among exercises performed by the same participant. Several factors probably contribute to this outcome, including the limited number of observations for each participant-exercise combination, the absence of exercise type as a model covariate, and the inherent measurement uncertainty associated with markerless pose estimation during complex functional movements. The observed results therefore define a useful boundary for subsequent studies: interpretation of movement–internal-load relationships will require validated descriptors, recorded exercise conditions and external loads, and repeated observations that permit exercise-specific assessment. The present analyses do not establish that movement contains no information about physiological effort. One limitation of the mixed-effects analysis is the omission of exercise type as an explicit model factor. Due to the sparse and unbalanced distribution of sets across various exercises, incorporating exercise type as either a fixed or random effect would have significantly increased model complexity relative to the available data, thereby reducing model convergence and interpretability. As a result, the current LME findings cannot separate exercise-type effects from kinematic, class-day, participant-group, sequencing, or time-of-day differences. They should therefore be interpreted as exploratory global associations across the observed sessions, rather than as exercise-type-adjusted estimates or evidence of exercise-independent kinematic–HR relationships. Future research should ensure sufficient repetitions per exercise or establish pre-defined exercise groupings to enable models that explicitly account for exercise type.
Distinguishing among feasibility, association, prediction, and validation is essential when interpreting these findings. The study establishes the feasibility of extracting movement-execution descriptors from monocular smartphone video during real functional-training sessions. Correlation analyses revealed exploratory descriptive associations. However, mixed-effects models did not identify a consistent kinematic predictor of heart rate across participants and exercises. The current design did not assess predictive validity, practical accuracy for monitoring internal load, superiority to established methods, replacement of wearable sensors, or validated assessment of movement execution. Addressing these questions will require independent validation against reference measures and prospective evaluation in larger, longitudinal, and exercise-balanced datasets.
This study has several limitations. The study employed a convenience sample of 25 participants from a single functional-training facility, which restricts generalisability to other populations, facilities, and training formats. However, the repeated set-level observations were analysed using linear mixed-effects models that accounted for clustering within participants and estimated within-participant associations rather than treating all sets as independent observations. In a simulation-based sensitivity analysis, the reference Mean HR–work-time model (23 participants; 484 sets) showed high sensitivity to a standardized effect of . This model-specific result does not apply uniformly to all analyses, because the number of available sets and participants differed across kinematic predictors. Accordingly, the precision of predictor-specific estimates should be evaluated from their effect sizes and 95% confidence intervals, together with FDR-adjusted p-values, rather than solely from whether results meet a statistical-significance threshold. Each participant was recorded during only one class on a single day; as a result, the study does not assess within-person reproducibility, longer-term changes, or the stability of kinematic–internal-load relationships across repeated sessions. Another limitation is the strong, although incomplete, confounding of exercise type with class day and participant group. Most exercises were observed on only one class day and were performed by one to five participants; only sit-up (three days, 14 participants), squat (two days, 5 participants) and single-arm dumbbell hang clean and jerk (two days, 6 participants) were recorded on more than one day (Table 1 and Table 2). Therefore, differences in heart rate, work time, rest patterns, or video-derived kinematics across exercises may reflect day-specific conditions, participant characteristics, instructor sequencing, or time of day rather than exercise type. Accordingly, between-exercise findings should be interpreted as descriptive. Frame subsampling reduced the effective video sampling rate from 30 frames per second to approximately 10 frames per second. As a result, brief velocity peaks and rapid movement transitions may have been underestimated or insufficiently resolved, particularly in fast cyclic or ballistic exercises such as jump rope, box jumps, jumping jacks, and half burpees. Timing metrics derived from MDL state transitions also have an effective temporal resolution of approximately 100 milliseconds. Future research should retain higher-frame-rate video and validate velocity and timing estimates against an appropriate reference system. The dataset included a heterogeneous range of exercises, exercise orders, circuit structures, and numbers of rounds. While this reflects real-world functional training, it complicates interpretation because exercise type and session characteristics may influence both kinematic measures and heart rate. Exercise type was not explicitly included as a covariate in the mixed-effects models due to the sparse and unbalanced participant-by-exercise data structure. Therefore, the models cannot disentangle exercise-specific effects from the observed kinematic–heart rate relationships. Future studies with larger and more balanced datasets across exercises should explicitly model exercise-specific effects rather than relying on global, exercise-pooled estimates. Heart rate and kinematic variables were measured repeatedly at the set level, whereas each participant’s Borg ratings, sRPE, and fatigue measures were collected once after the session. Consequently, pooled set-level correlations involve repeated observations within participants and should be interpreted as descriptive associations rather than independent-sample evidence. Correlations involving post-session perceptual measures may primarily reflect between-session differences. Accordingly, these variables should be interpreted as exploratory video-derived descriptors of movement execution rather than validated biomechanical measurements, measures of movement quality, or accurate physiological proxies of internal load. The measurement accuracy, reliability, and sensitivity of these metrics to meaningful changes in movement execution have yet to be established. The data processing pipeline relied on monocular video from a single fixed smartphone camera. This approach cannot directly recover three-dimensional movement, and pose-estimation accuracy may be affected by camera angle, participant distance and orientation, occlusion, lighting, rapid multi-planar movements, and errors in two-dimensional landmark detection. Although the Borg CR10 and sRPE approaches are established measures, several questionnaire components, including the fatigue composite, were study-specific and were not administered as validated instruments or validated translations. These perceptual and fatigue measures should be regarded as exploratory contextual outcomes rather than validated clinical or psychometric assessments. Collectively, these limitations indicate that the results should be interpreted as exploratory and intended to inform future research questions, requiring confirmation in larger, longitudinal, exercise-balanced studies with validated kinematic and perceptual measures.
The objective of this study was not to isolate the effects of standardized external load but to characterize movement metrics under the natural variability of functional training classes. Consequently, differences in exercise prescription, resistance, and individual pacing form part of the ecological context represented in the dataset. In addition, although the circuit format, prescribed work–rest structure, and number of rounds were standardized within each class, external loads or resistances and exercise regressions, progressions, or other modifications were neither standardized nor systematically recorded. These unmeasured factors may have influenced both movement-execution descriptors and heart-rate responses and may therefore partly account for the observed associations. Accordingly, the present analyses cannot isolate a direct relationship between the video-derived kinematic variables and internal load independently of actual external training load or exercise scaling. Future studies should standardize or record prescribed and completed external loads, relative loads where relevant, and all exercise modifications, and should include these factors in analytical models.
Because this exploratory study was conducted in a real-world functional-training setting, the sample size was determined by the number of eligible participants available during the data-collection period rather than by an a priori statistical power calculation.
The current contribution of the workflow lies in the structured acquisition, extraction, and alignment of movement and internal-load data under real class conditions. The previously validated component is MDL-based repetition counting for the discrete exercise definitions evaluated in the earlier study, which achieved 97.2% accuracy across 1513 videos [35]. In the present field application, the workflow extended this process to the calculation of set duration, work and rest intervals, image-plane joint-angle proxies, and angular-speed descriptors, and paired those outputs temporally with heart-rate measurements. The resulting 551 video-derived sets, of which 532 were paired with heart rate, describe the outputs available for analysis rather than a validated extraction-success rate, because no independently annotated record of all attempted sets was available. This provides a reproducible structure for documenting what was recorded, organising multimodal exercise data, and examining relationships at the measurement level at which each variable was collected.
The field application also clarifies the present measurement scope of these outputs. Timing descriptors depend on successful segmentation of discrete repetitions and were unreliable for isometric or continuous exercises such as the plank, rowing, and SkiErg. The image-plane angle, angular-speed, and timing descriptors were not validated against reference biomechanical or timing systems. They are therefore treated in this study as research descriptors generated by the workflow. Heart rate and perceived exertion retain their established role as indicators of internal response, while the video-derived variables provide movement and session context for retrospective examination.
The association results contribute to this methodological assessment. Some pooled descriptive relationships were observed across heterogeneous exercises, but no video-derived descriptor met the false-discovery-rate criterion in participant-clustered models (all ). The study therefore does not establish predictive validity, exercise-independent associations, or individual-level internal-load estimation. This result defines the current evidential boundary of the extracted descriptors and prevents pooled correlations from being interpreted as evidence that the same relationship applies within an individual athlete.
The workflow and field dataset provide a concrete starting point for the next validation stage. Measurement accuracy should be established against reference biomechanical and timing systems. Subsequent studies should record prescribed and completed external load and exercise modifications, obtain balanced repeated observations within exercise categories, and determine whether the addition of video-derived descriptors contributes reliable information at the individual level. These steps will allow future work to build directly on the acquisition, segmentation, extraction, and multimodal alignment process documented here.
5. Conclusions
This study documents the field application of a complete acquisition-to-analysis workflow in which smartphone video from scheduled functional-training classes was processed through pose estimation and MDL-based segmentation to obtain set-level movement descriptors and align them with independently measured indicators of internal load. The workflow produced video-derived data for 551 exercise sets, of which 532 sets from 24 participants could be paired with heart rate.
The principal contribution is methodological. The study shows how repetition, timing, image-plane joint-angle, and angular-speed information can be generated and organised from real class recordings, how set-level video and heart-rate data can be aligned, and how post-session ratings can be retained at the participant level. It also documents the measurement and analytical constraints encountered when the workflow is applied across heterogeneous exercises and sessions.
No video-derived descriptor met the false-discovery-rate criterion in the participant-clustered models (all ). This result defines the current evidential boundary of the extracted variables: the present study does not establish predictive validity, exercise-independent relationships with internal load, or individual-level physiological estimation. Repetition counting remains the most established output within the exercise definitions evaluated in the previous MDL validation, while the angle, angular-speed, and timing outputs remain research descriptors requiring criterion validation.
The documented field process and dataset provide a reproducible basis for subsequent work. Future studies can build on this workflow by validating the derived measures against reference systems, recording external loads and exercise modifications, balancing repeated observations within exercises, and evaluating whether the descriptors add reliable information at the individual level. In this way, the present study establishes the current scope of the MDL-based field workflow and the empirical starting point for its continued development.
Supplementary Materials
The following supporting information can be downloaded at https://www.mdpi.com/article/10.3390/jfmk11040449/s1: Table S1: Exploratory participant-level Spearman correlations between participant-mean video-derived kinematic metrics and post-session Borg CR10 ratings, with 95% bootstrap confidence intervals and Benjamini–Hochberg FDR-adjusted q-values.
Author Contributions
Conceptualization, L.S., D.C. and A.J.R.N.; Methodology, L.S., D.C. and A.J.R.N.; Software, L.S.; Validation, L.S., D.C. and A.J.R.N.; Formal Analysis, L.S., D.C. and A.J.R.N.; Investigation, L.S., D.C. and A.J.R.N.; Resources, P.S. (access to the training facility and its scheduled classes); Data Curation, L.S.; Writing—Original Draft Preparation, L.S.; Writing—Review and Editing, L.S., P.S., D.C. and A.J.R.N.; Visualization, L.S., D.C. and A.J.R.N.; Supervision, D.C. and A.J.R.N. All authors have read and agreed to the published version of the manuscript.
Funding
This work was funded by FEDER—Fundo Europeu de Desenvolvimento Regional—funds through Programa Inovação e Transição Digital of the projects COMPETE 2030-FEDER-03106400, ALGARVE-FEDER-03106400. This work was also supported by the research unit IEETA (UIDB/00127/2020). Additional support for our research unit was provided by national funds through FCT under project UI/BD/154659/2023.
Institutional Review Board Statement
This study was conducted in accordance with the Declaration of Helsinki and was approved by the Ethics Committee for Clinical Research of the University of Aveiro (CEIC-UA): approval number 6-CEIC-UA/2026-D, approved on 30 January 2026.
Informed Consent Statement
Informed consent was obtained from all subjects involved in the study. Written informed consent has been obtained from the subjects to publish this paper.
Data Availability Statement
The dataset can be found at https://1drv.ms/f/c/671361ff08034f89/IgCfPQHy_znWSqywftuwK-BCAT8KT3YRNBlppqDaihuwrMk?e=Ms4EUy (accessed on 24 July 2026).
Acknowledgments
The authors would like to thank the staff and athletes of the training facility that hosted the data collection sessions for their availability, collaboration, and constructive feedback during the recording of the functional training exercises. The authors also acknowledge the support of the University of Aveiro and IEETA/DETI for providing the computational and laboratory infrastructure required to develop and test the MDL framework. Finally, the authors thank their colleagues who contributed valuable discussions throughout the project and the anonymous reviewers whose comments helped improve the clarity and quality of the manuscript.
Conflicts of Interest
The authors declare no conflicts of interest. Pedro Santos is the owner of the functional training facility (MAREBox) where all data collection took place. The collaboration was established through a research protocol agreement, with no financial compensation or commercial interest associated with this study. The remaining authors declare no competing interests. All authors confirm that the study design, data collection, analysis, and interpretation were conducted independently of any commercial influence. To eliminate potential bias, participant recruitment was conducted independently through a neutral forum post shared with all facility members. Registration forms for study participation were openly available, with no incitement, persuasion, or preferential treatment by the facility owner. Only participants who voluntarily registered for specific dates and times were included, and the owner had no influence on individuals’ decisions to participate or not. His contribution to this study was limited to providing access to the facility and its scheduled classes (Resources) and to reviewing the manuscript. The owner did not participate in annotation protocol development, manual repetition counting, video inclusion/exclusion decisions, data analysis, or result interpretation. All analyses were conducted independently at university facilities.
Abbreviations
The following abbreviations are used in this manuscript:
| MDL | Movement Description Language |
| FT | Functional Training |
| HR | Heart Rate |
| bpm | beats per minute |
| HRmax | Maximal Heart Rate |
| RPE | Rating of Perceived Exertion |
| sRPE | Session Rating of Perceived Exertion |
| TRIMP | Training Impulse |
| CR10 | Category-Ratio |
| BRUMS | Brunel Mood Scale |
| HRV | Heart Rate Variability |
| TRX | Total Resistance Exercise |
| SD | Standard Deviations |
| CV | Coefficients of Variation |
| FDR | False Discovery Rate |
| LME | Linear Mixed-Effects |
| REML | Restricted maximum likelihood |
References
- Pereira, H.V.; Teixeira, D.S.; Fisher, J.; Fleck, S.J.; Helms, E.; Ide, B.N.; Izquierdo, M.; Nedergaard, A.; Philips, S.; Pinto, R.S. International consensus on the definition of functional training: Modified e-Delphi method. J. Sports Sci. 2025, 43, 767–775. [Google Scholar] [CrossRef] [Scilit] [PubMed]
- Dominski, F.H.; Tibana, R.A.; Andrade, A. “Functional Fitness Training”, CrossFit, HIMT, or HIFT: What Is the Preferable Terminology? Front Sports Act. Living 2022, 4, 882195, Erratum in Front Sports Act. Living 2026, 8, 1888508. [Google Scholar] [CrossRef] [Scilit] [PubMed]
- Soriano, M.A.; Boullosa, D.; Amaro-Gahete, F. Functional fitness/high intensity functional training for health and performance. Front. Physiol. 2022, 13, 1024809. [Google Scholar] [CrossRef] [Scilit] [PubMed]
- Rios, M.; Pyne, D.B. Integrative Physiological Strategies for Monitoring Demands in Functional Fitness. Sports 2025, 13, 381. [Google Scholar] [CrossRef] [Scilit] [PubMed]
- Hamlin, M.J.; Wilkes, D.; Elliot, C.A.; Lizamore, C.A.; Kathiravel, Y. Monitoring training loads and perceived stress in young elite university athletes. Front. Physiol. 2019, 10, 34. [Google Scholar] [CrossRef] [Scilit] [PubMed]
- Macedo, A.G.; Almeida, T.A.F.; Massini, D.A.; de Oliveira, D.M.; Espada, M.C.; Robalo, R.A.M.; Hernández-Beltrán, V.; Gamonales, J.M.; Terra, A.M.S.V.; Filho, D.M.P. Load monitoring methods for controlling training effectiveness on physical conditioning and planning involvement: A narrative review. Appl. Sci. 2024, 14, 10465. [Google Scholar] [CrossRef] [Scilit]
- Haddad, M.; Stylianides, G.; Djaoui, L.; Dellal, A.; Chamari, K. Session-RPE method for training load monitoring: Validity, ecological usefulness, and influencing factors. Front. Neurosci. 2017, 11, 612. [Google Scholar] [CrossRef] [Scilit] [PubMed]
- Neto, F.; Henrique, J.; Tibana, R.A.; Frade de Sousa, N.M.; Prestes, J.; Voltarelli, F.A.; Kennedy, M.D. Session rating of perceived exertion is a superior method to monitor internal training loads of functional fitness training sessions performed at different intensities when compared to training impulse. Front. Physiol. 2020, 11, 919. [Google Scholar] [CrossRef] [Scilit] [PubMed]
- Buchheit, M. Monitoring training status with HR measures: Do all roads lead to Rome? Front. Physiol. 2014, 5, 71297. [Google Scholar] [CrossRef] [Scilit] [PubMed]
- Fisher, K.M.; Fuller, L.; Chandler, J.P. A review of the relationship between heart rate monitoring, training load, and injury in field-based team sport athletes. Int. J. Sport Exerc. Health Res. 2022, 6, 43–54. [Google Scholar] [CrossRef] [Scilit]
- Borg, G.A. Psychophysical bases of perceived exertion. Med. Sci. Sports Exerc. 1982, 14, 377–381. [Google Scholar] [CrossRef] [Scilit]
- Ni, Z.; Sun, F.; Li, Y. Heart rate variability-based subjective physical fatigue assessment. Sensors 2022, 22, 3199. [Google Scholar] [CrossRef] [Scilit] [PubMed]
- Sun, J.; Liu, G.; Sun, Y.; Lin, K.; Zhou, Z.; Cai, J. Application of surface electromyography in exercise fatigue: A review. Front. Syst. Neurosci. 2022, 16, 893275. [Google Scholar] [CrossRef] [Scilit] [PubMed]
- Cowley, J.C.; Gates, D.H. Proximal and distal muscle fatigue differentially affect movement coordination. PLoS ONE 2017, 12, e0172835. [Google Scholar] [CrossRef] [Scilit] [PubMed]
- Jiang, Y.; Hernandez, V.; Venture, G.; Kulić, D.; Chen, B.K. A data-driven approach to predict fatigue in exercise based on motion data from wearable sensors or force plate. Sensors 2021, 21, 1499. [Google Scholar] [CrossRef] [Scilit] [PubMed]
- Sanchez-Medina, L.; González-Badillo, J.J. Velocity loss as an indicator of neuromuscular fatigue during resistance training. Med. Sci. Sports Exerc. 2011, 43, 1725–1734. [Google Scholar] [CrossRef] [Scilit] [PubMed]
- Cowley, J.C.; Gates, D.H. Inter-joint coordination changes during and after muscle fatigue. Hum. Mov. Sci. 2017, 56, 109–118. [Google Scholar] [CrossRef] [Scilit] [PubMed]
- Choudhary, P.K.; Choudhary, S.; Saha, S.; Rajpoot, Y.S.; Ciocan, V.-C.; Nicolae-Lucian, V.; Pavel, S.-I.; Șufaru, C. Lower-limb biomechanical adaptations to exercise-induced fatigue during running: A systematic review of injury-relevant mechanical changes. Life 2026, 16, 272. [Google Scholar] [CrossRef] [Scilit] [PubMed]
- Chen, S.-H.; Chou, L.-S. Inter-joint coordination variability during a sit-to-stand fatiguing protocol. J. Biomech. 2022, 138, 111132. [Google Scholar] [CrossRef] [Scilit] [PubMed]
- Jukic, I.; Castilla, A.P.; Ramos, A.G.; Van Hooren, B.; McGuigan, M.R.; Helms, E.R. The acute and chronic effects of implementing velocity loss thresholds during resistance training: A systematic review, meta-analysis, and critical evaluation of the literature. Sports Med. 2023, 53, 177–214. [Google Scholar] [CrossRef] [Scilit] [PubMed]
- Jin, L.; Yang, B. The effects of muscle fatigue on lower extremity biomechanics during the three-step layup jump and drop landing in male recreational basketball players. Biomechanics 2025, 5, 81. [Google Scholar] [CrossRef] [Scilit]
- Vermeulen, S.; De Bleecker, C.; De Blaiser, C.; Kilinç, Ö.O.; Willems, T.; Vanrenterghem, J.; Roosen, P.; De Ridder, R. The effect of fatigue on trunk and pelvic jump-landing biomechanics in view of lower extremity loading: A systematic review. J. Hum. Kinet. 2023, 86, 73. [Google Scholar] [CrossRef] [Scilit] [PubMed]
- Erman, B.; Vural, F.; Dopsaj, M.; Ozkol, M.Z.; Kose, D.E.; Aksit, T. The effects of fatigue on linear and angular kinematics during bilateral squat. PLoS ONE 2023, 18, e0289089. [Google Scholar] [CrossRef] [Scilit] [PubMed]
- Hindle, B.R.; Keogh, J.W.L.; Lorimer, A.V. Inertial-based human motion capture: A technical summary of current processing methodologies for spatiotemporal and kinematic measures. Appl. Bionics Biomech. 2021, 2021, 6628320. [Google Scholar] [CrossRef] [Scilit] [PubMed]
- Armitano-Lago, C.; Willoughby, D.; Kiefer, A.W. A SWOT analysis of portable and low-cost markerless motion capture systems to assess lower-limb musculoskeletal kinematics in sport. Front. Sports Act. Living 2022, 3, 809898. [Google Scholar] [CrossRef] [Scilit] [PubMed]
- Drazan, J.F.; Phillips, W.T.; Seethapathi, N.; Hullfish, T.J.; Baxter, J.R. Moving outside the lab: Markerless motion capture accurately quantifies sagittal plane kinematics during the vertical jump. J. Biomech. 2021, 125, 110547. [Google Scholar] [CrossRef] [Scilit] [PubMed]
- Oliosi, E.; Ferreira, S.; Giordano, A.P.; Viveiros, G.; Parraca, J.; Pereira, P.; Guede-Fernández, F.; Azevedo, S. Evaluation of smartphone camera positioning on artificial intelligence pose estimation accuracy for exercise detection: Observational study. JMIR mHealth uHealth 2026, 14, e82412. [Google Scholar] [CrossRef] [Scilit] [PubMed]
- Liu, K.; Hirsch, S.; Singh, P.; Chan, T.C.; Burkhart, T.A.; Hutchison, M.G. A comparison of lower extremity squat, lunge, and hip hinge kinematics between marker based and markerless motion capture systems. Proc. Inst. Mech. Eng. Part P J. Sport. Eng. Technol. 2025. [Google Scholar] [CrossRef] [Scilit]
- Yang, C.; Wei, L.; Huang, X.; Tu, L.; Xu, Y.; Li, X.; Hu, Z. Comparison of lower limb kinematic and kinetic estimation during athlete jumping between markerless and marker-based motion capture systems. Sci. Rep. 2025, 15, 18552. [Google Scholar] [CrossRef] [Scilit] [PubMed]
- Yoma, M.; Herrington, L.; Starbuck, C.; Llurda, L.; Jones, R. Between-day reliability of kinematic variables using markerless motion capture for single-leg squat and single-leg landing tasks. Int. J. Sports Phys. Ther. 2025, 20, 1160. [Google Scholar] [CrossRef] [Scilit] [PubMed]
- Alatiah, T.; Chen, C. Recognizing exercises and counting repetitions in real time. arXiv 2020, arXiv:2005.03194. [Google Scholar]
- Ferreira, B.; Ferreira, P.M.; Pinheiro, G.; Figueiredo, N.; Carvalho, F.; Menezes, P.; Batista, J. Deep learning approaches for workout repetition counting and validation. Pattern Recognit. Lett. 2021, 151, 259–266. [Google Scholar] [CrossRef] [Scilit]
- Ullah, R.; Asghar, I.; Nawaz, R.; Stacey, C.; Akbar, S.; Bishop, P. A real time action scoring system for movement analysis and feedback in physical therapy using human pose estimation. Sci. Rep. 2025, 15, 44784. [Google Scholar] [CrossRef] [Scilit] [PubMed]
- Huong, P.T.; Tuan, H.C.; Nguyen, T.Q. Real-time deep learning framework for physical therapy motion evaluation using MediaPipe pose and LSTM-CNN architectures. Biomed. Signal Process. Control 2026, 123, 110549. [Google Scholar] [CrossRef] [Scilit]
- Sousa, L.; Canedo, D.; Santos, P.; Neves, A. A Movement Description Language for Functional Training Exercise Analysis. J. Funct. Morphol. Kinesiol. 2026, 11, 162. [Google Scholar] [CrossRef] [Scilit] [PubMed]
- Schweizer, T.; Gilgen-Ammann, R. Wrist-worn and arm-worn wearables for monitoring heart rate during sedentary and light-to-vigorous physical activities: Device validation study. JMIR Cardio 2025, 9, e67110. [Google Scholar] [CrossRef] [Scilit] [PubMed]
- Shariat, A.; Cleland, J.A.; Danaee, M.; Alizadeh, R.; Sangelaji, B.; Kargarfard, M.; Ansari, N.N.; Sepehr, F.H.; Tamrin, S.B.M. Borg CR-10 scale as a new approach to monitoring office exercise training. Work 2018, 60, 549–554. [Google Scholar] [CrossRef] [Scilit] [PubMed]
- Lea, J.W.D.; O’Driscoll, J.M.; Hulbert, S.; Scales, J.; Wiles, J.D. Convergent validity of ratings of perceived exertion during resistance exercise in healthy participants: A systematic review and meta-analysis. Sports Med.-Open 2022, 8, 2. [Google Scholar] [CrossRef] [Scilit] [PubMed]
- Foster, C.; Florhaug, J.A.; Franklin, J.; Gottschall, L.; Hrovatin, L.A.; Parker, S.; Doleshal, P.; Dodge, C. A new approach to monitoring exercise training. J. Strength Cond. Res. 2001, 15, 109–115. [Google Scholar] [CrossRef] [Scilit]
- Tibana, R.A.; De Sousa, N.M.F.; Cunha, G.V.; Prestes, J.; Fett, C.; Gabbett, T.J.; Voltarelli, F.A. Validity of session rating perceived exertion method for quantifying internal training load during high-intensity functional training. Sports 2018, 6, 68. [Google Scholar] [CrossRef] [Scilit] [PubMed]
- Terry, P.C.; Lane, A.M.; Lane, H.J.; Keohane, L. Development and validation of a mood measure for adolescents. J. Sports Sci. 1999, 17, 861–872. [Google Scholar] [CrossRef] [Scilit] [PubMed]
- Terry, P.C.; Lane, A.M.; Fogarty, G.J. Construct validity of the Profile of Mood States—Adolescents for use with adults. Psychol. Sport Exerc. 2003, 4, 125–139. [Google Scholar] [CrossRef] [Scilit]
- Vlachopoulos, S.P.; Lane, A.M.; Terry, P.C. A Greek translation of the Brunel Mood Scale: Initial validation among exercise participants and inactive adults. Sports 2023, 11, 234. [Google Scholar] [CrossRef] [Scilit] [PubMed]
- Sahli, H.; Sahli, F.; Saidane, M.; Rebhi, M.; Guelmami, N.; Trabelsi, K.; Jahrami, H.; Ammar, A.; Terry, P.C.; Zghibi, M. Testing the psychometric properties of an Arabic version of the Brunel Mood Scale among physical education students. Eur. J. Investig. Health Psychol. Educ. 2023, 13, 1539–1552. [Google Scholar] [CrossRef] [Scilit] [PubMed]
- Shapiro, S.S.; Wilk, M.B. An analysis of variance test for normality (complete samples). Biometrika 1965, 52, 591–611. [Google Scholar] [CrossRef] [Scilit]
- Spearman, C. The Proof and Measurement of Association Between Two Things; Appleton-Century-Crofts: New York, NY, USA, 1961. [Google Scholar]
- Benjamini, Y.; Hochberg, Y. Controlling the false discovery rate: A practical and powerful approach to multiple testing. J. R. Stat. Soc. Ser. B (Methodol.) 1995, 57, 289–300. [Google Scholar] [CrossRef] [Scilit]
- Pinheiro, J.C.; Bates, D.M. Mixed-Effects Models in S and S-PLUS; Springer: New York, NY, USA, 2000. [Google Scholar]
- Hopkins, W.G.; Marshall, S.W.; Batterham, A.M.; Hanin, J. Progressive statistics for studies in sports medicine and exercise science. Med. Sci. Sports Exerc. 2009, 41, 3–12. [Google Scholar] [CrossRef] [Scilit] [PubMed]
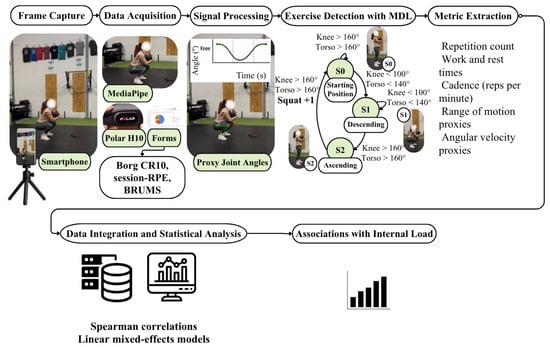
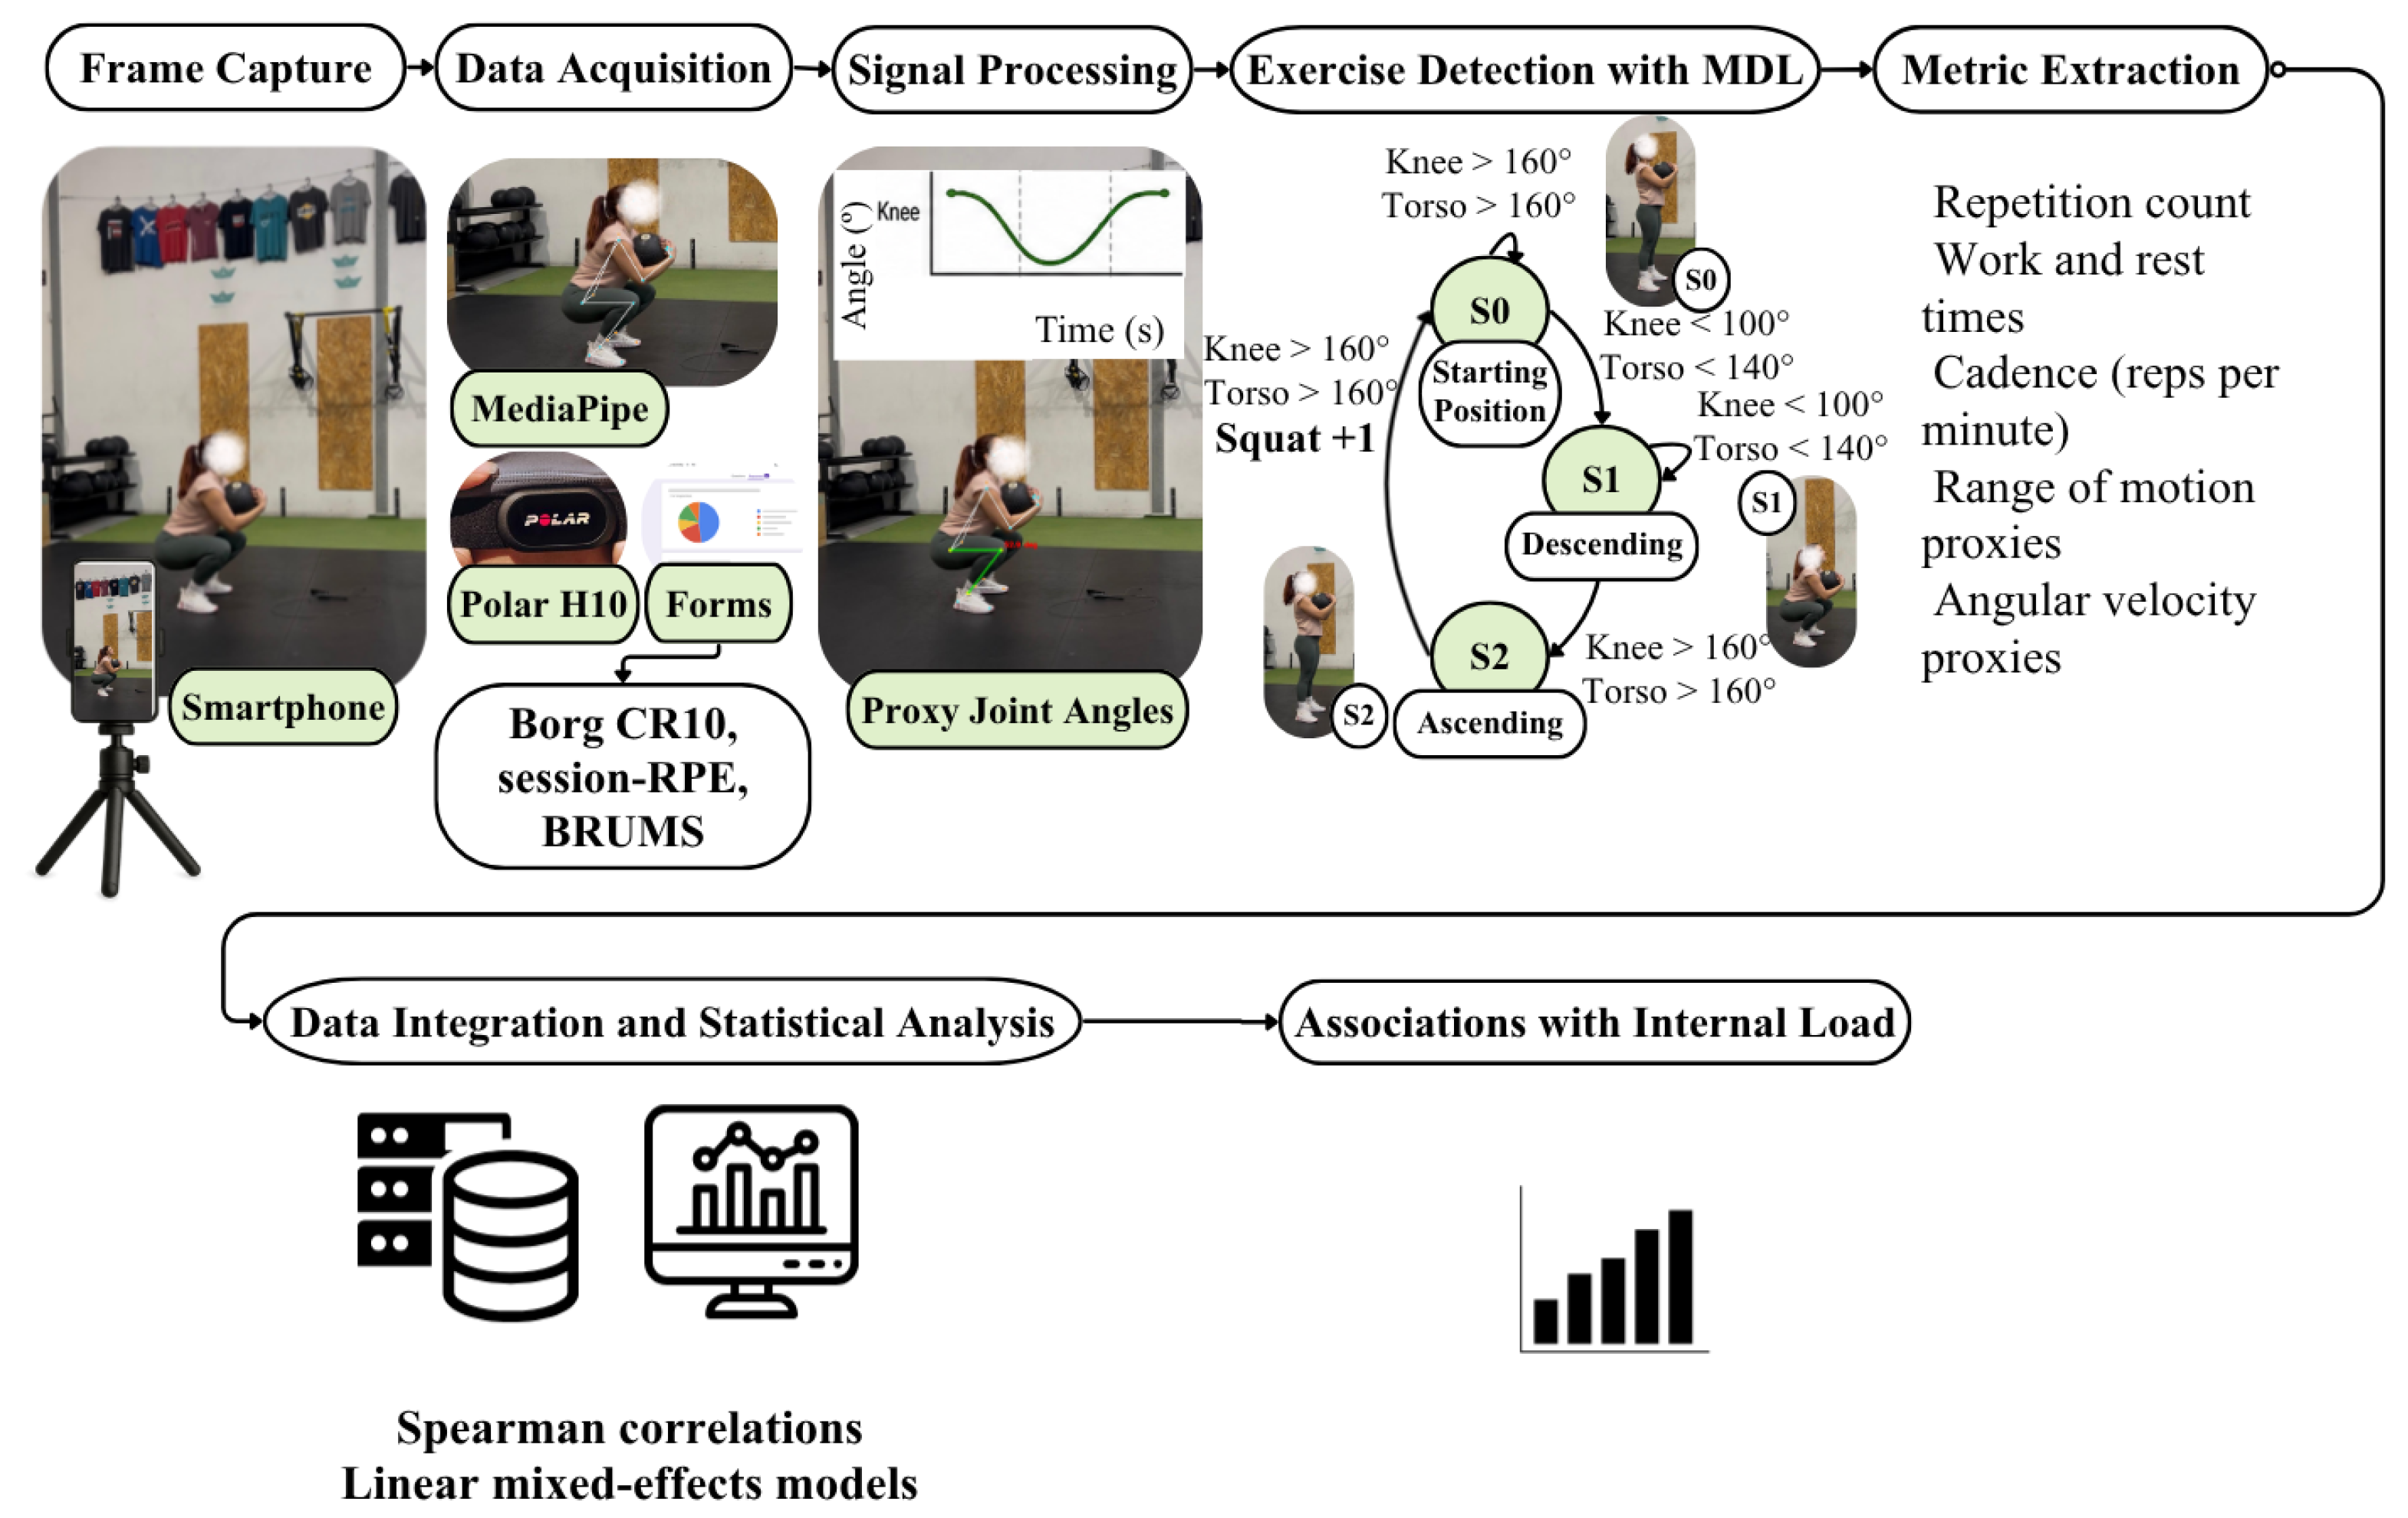
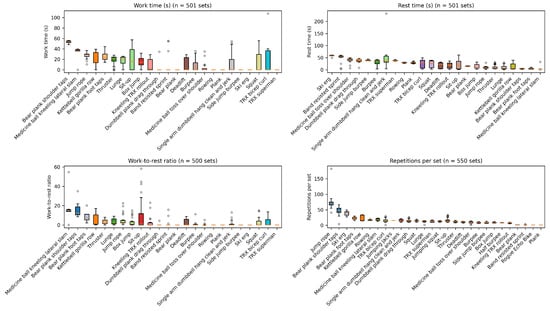
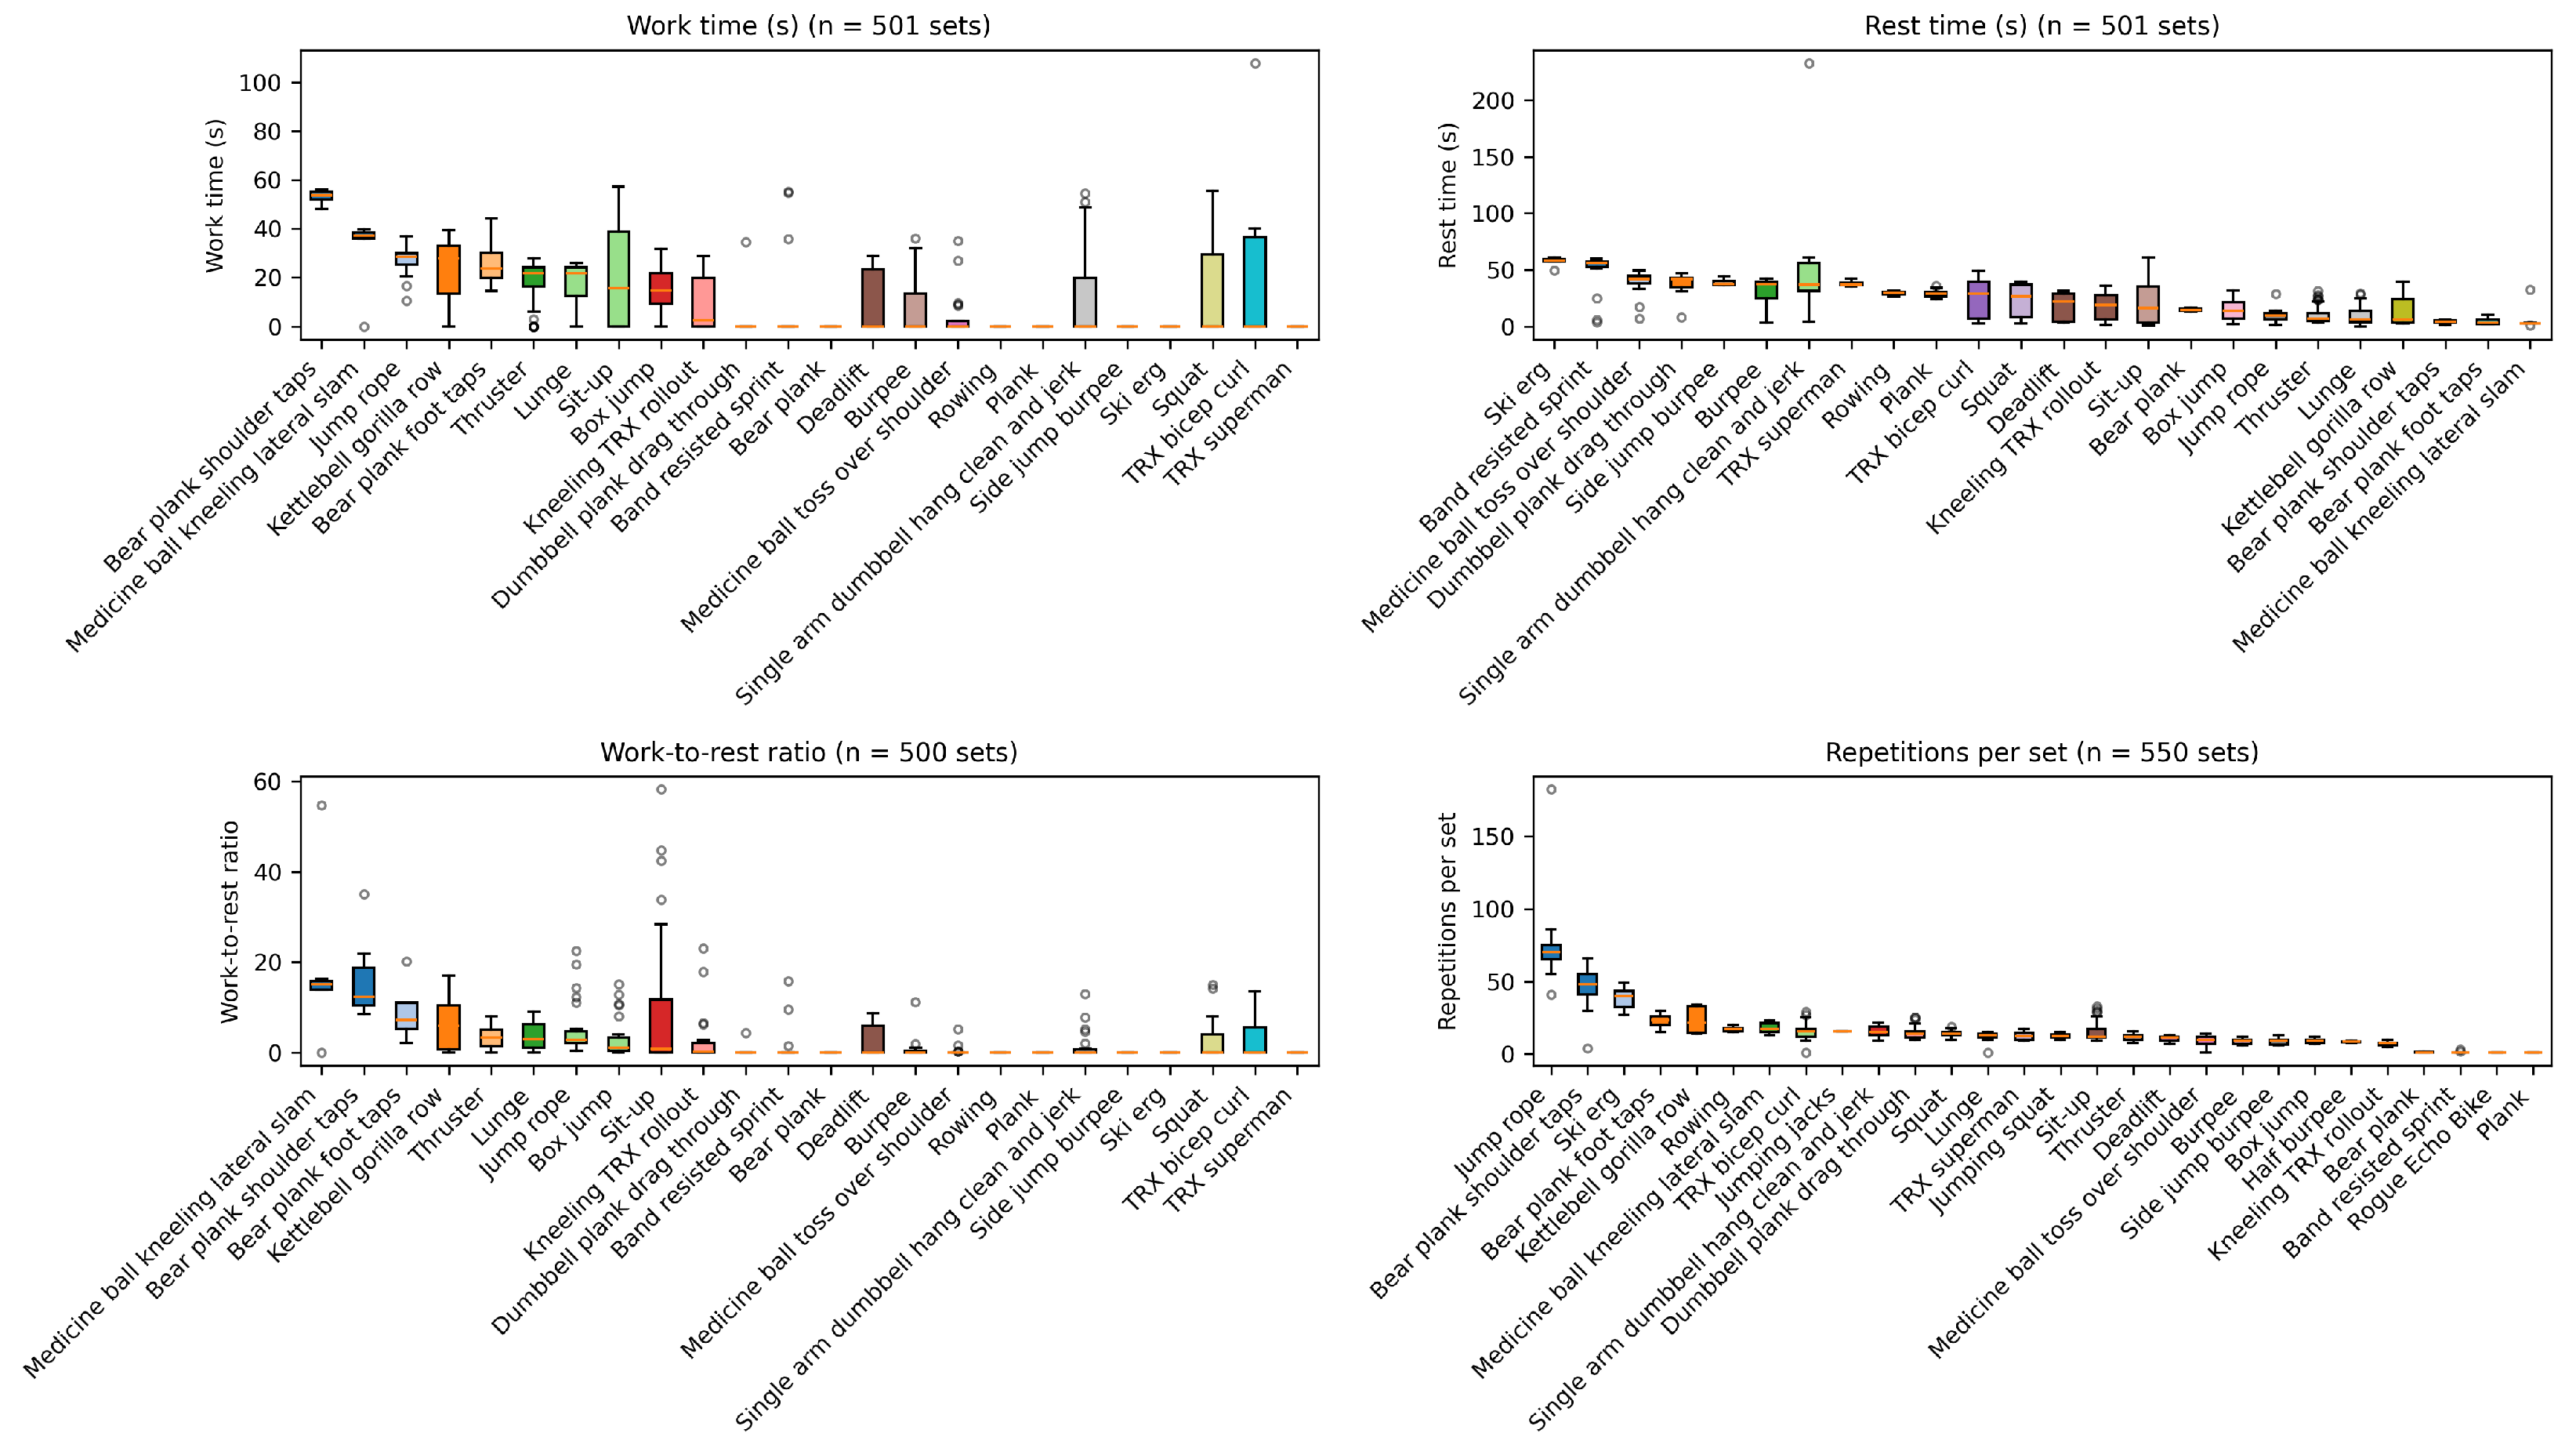
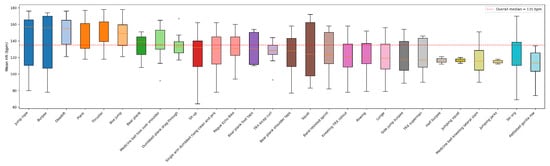
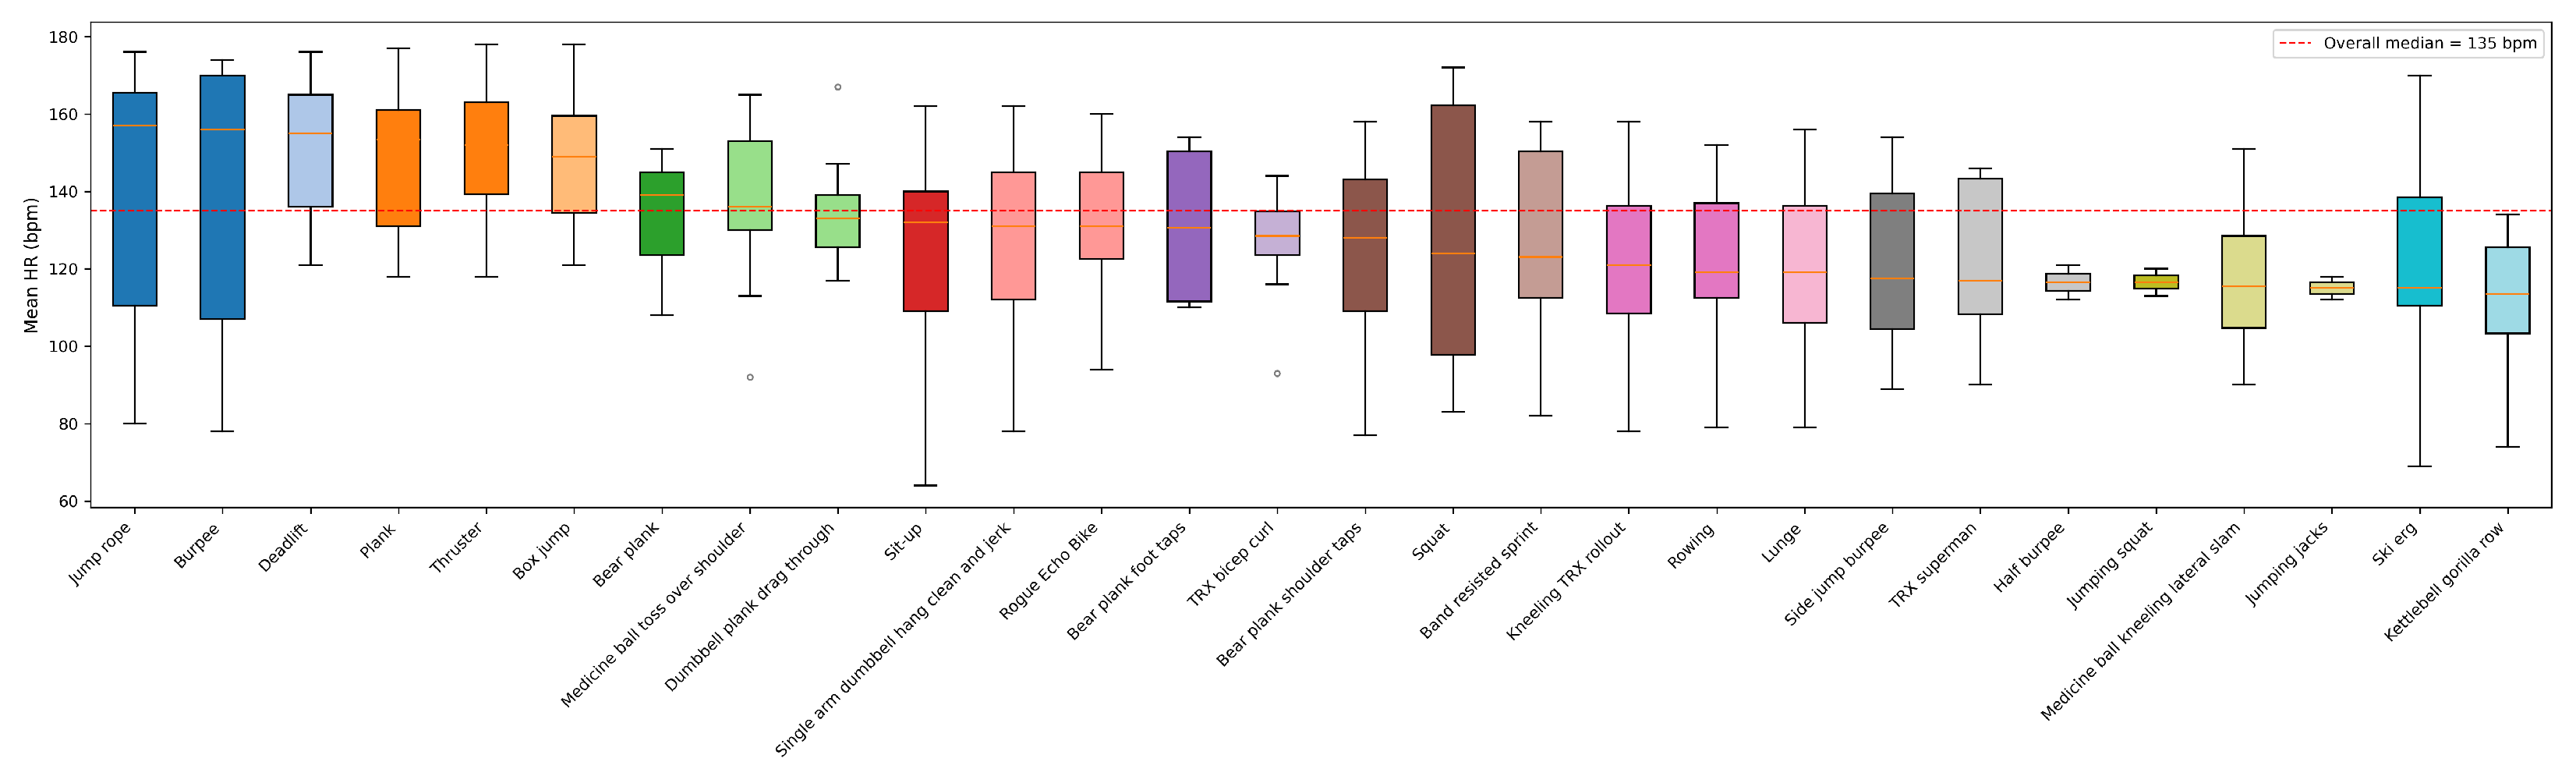
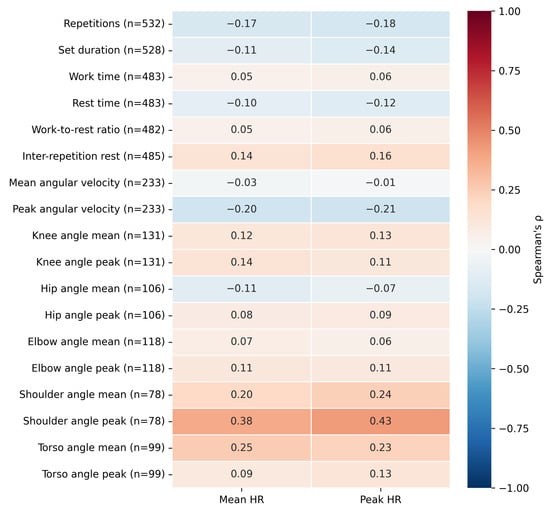
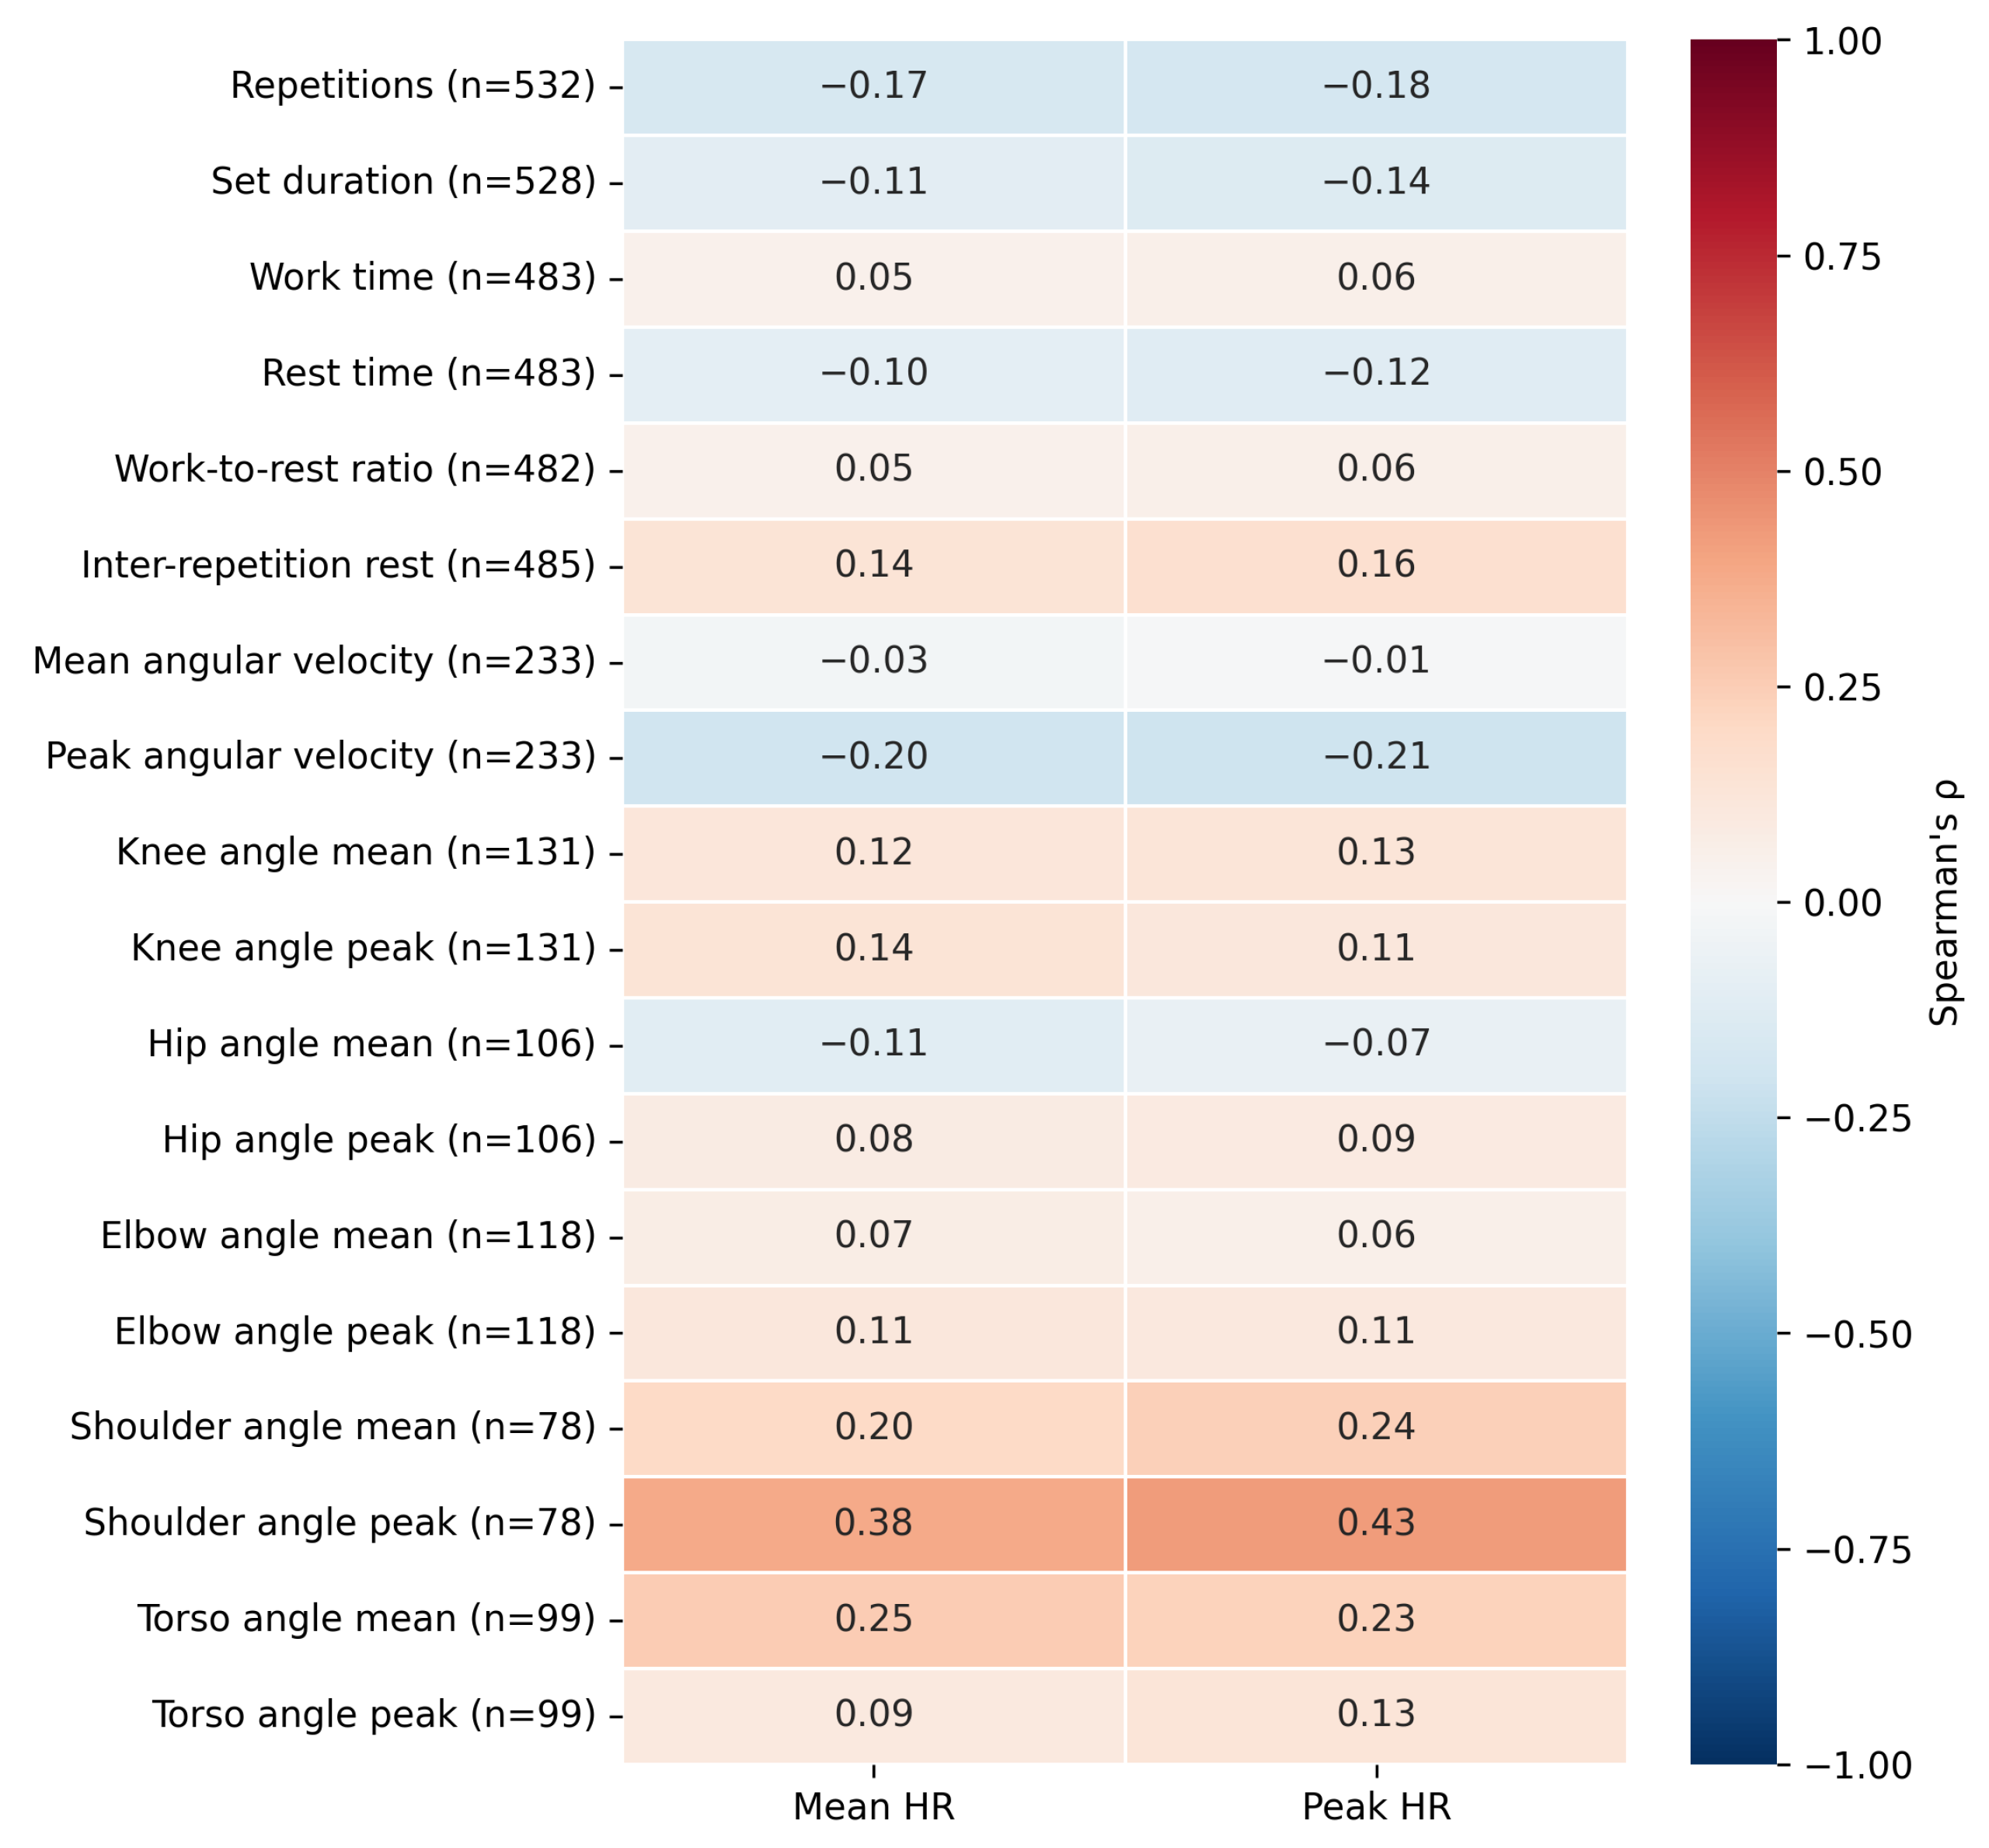
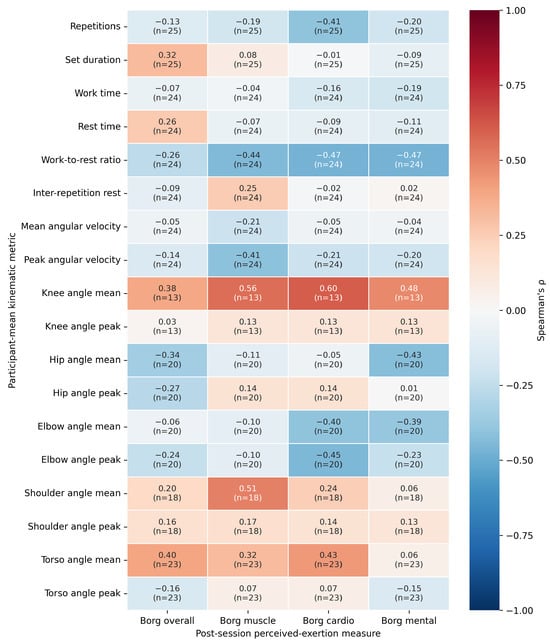
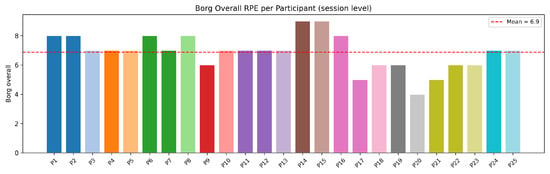
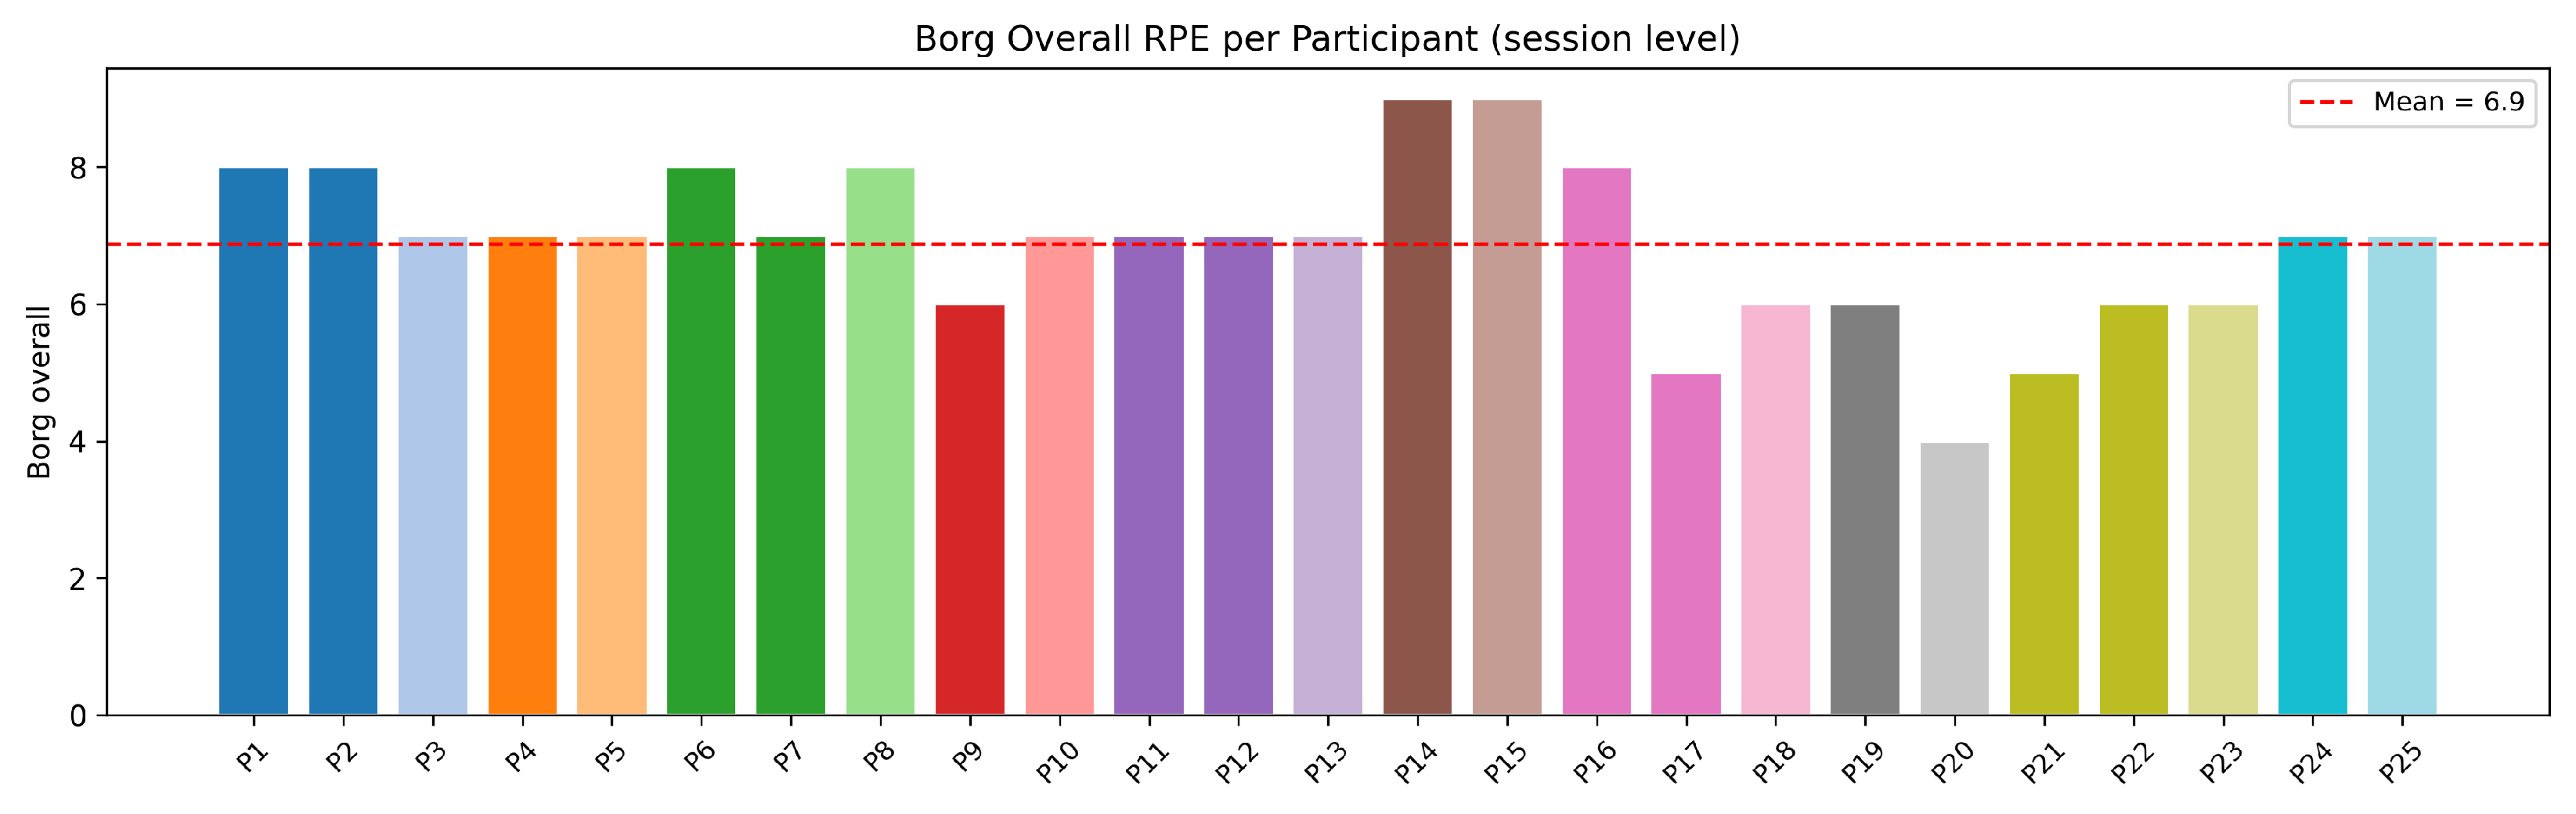
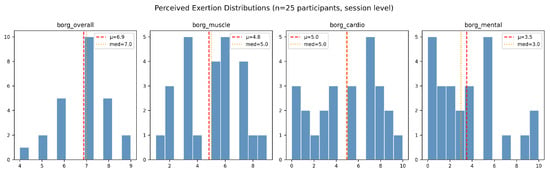
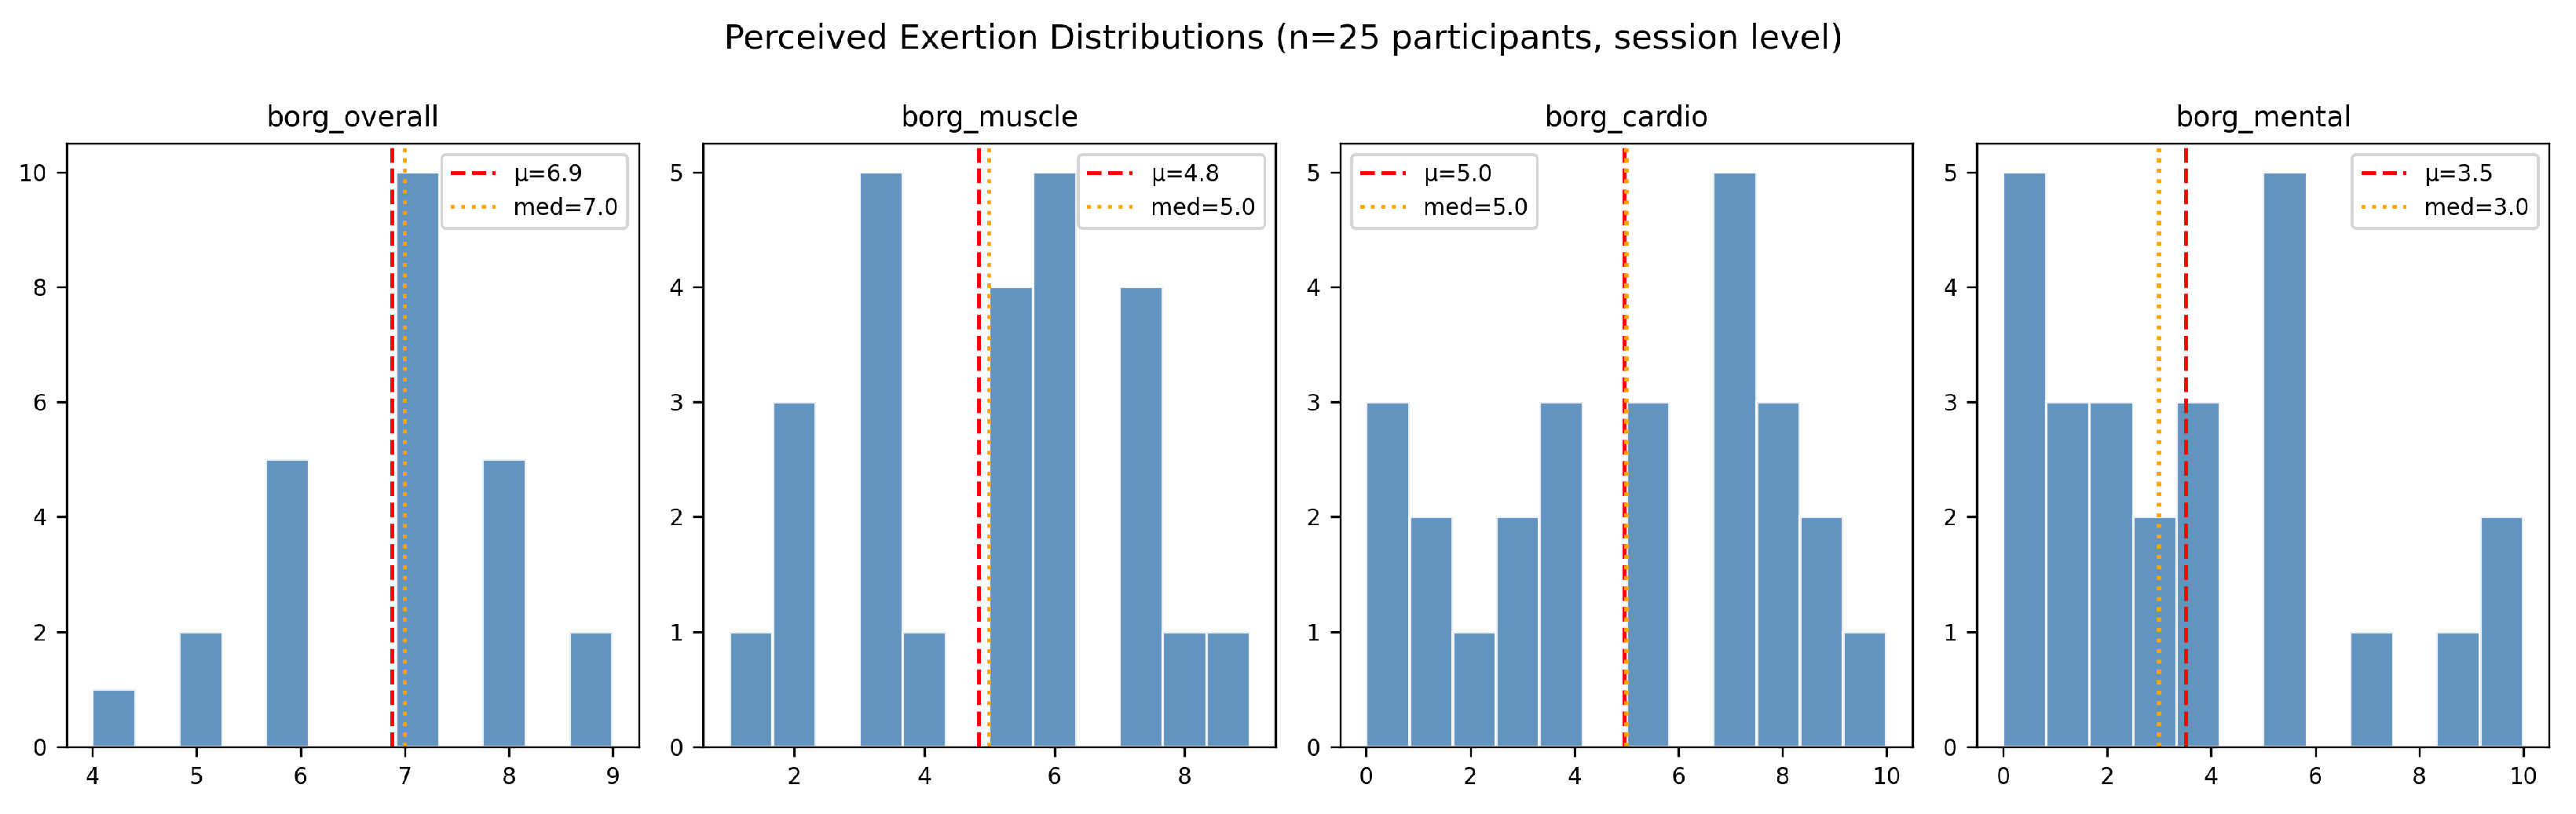
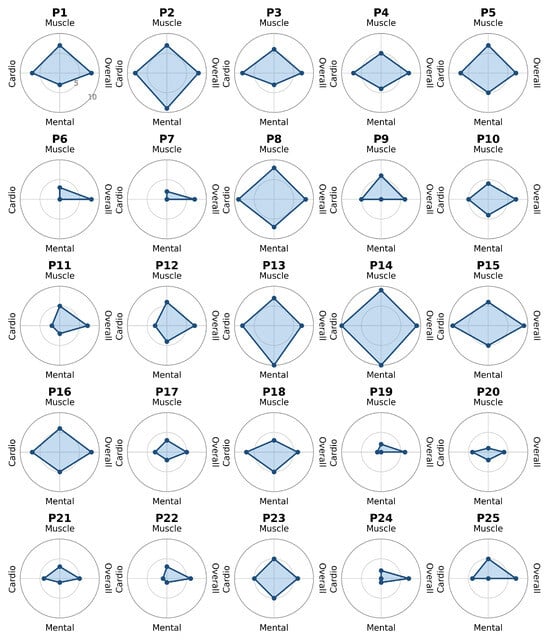
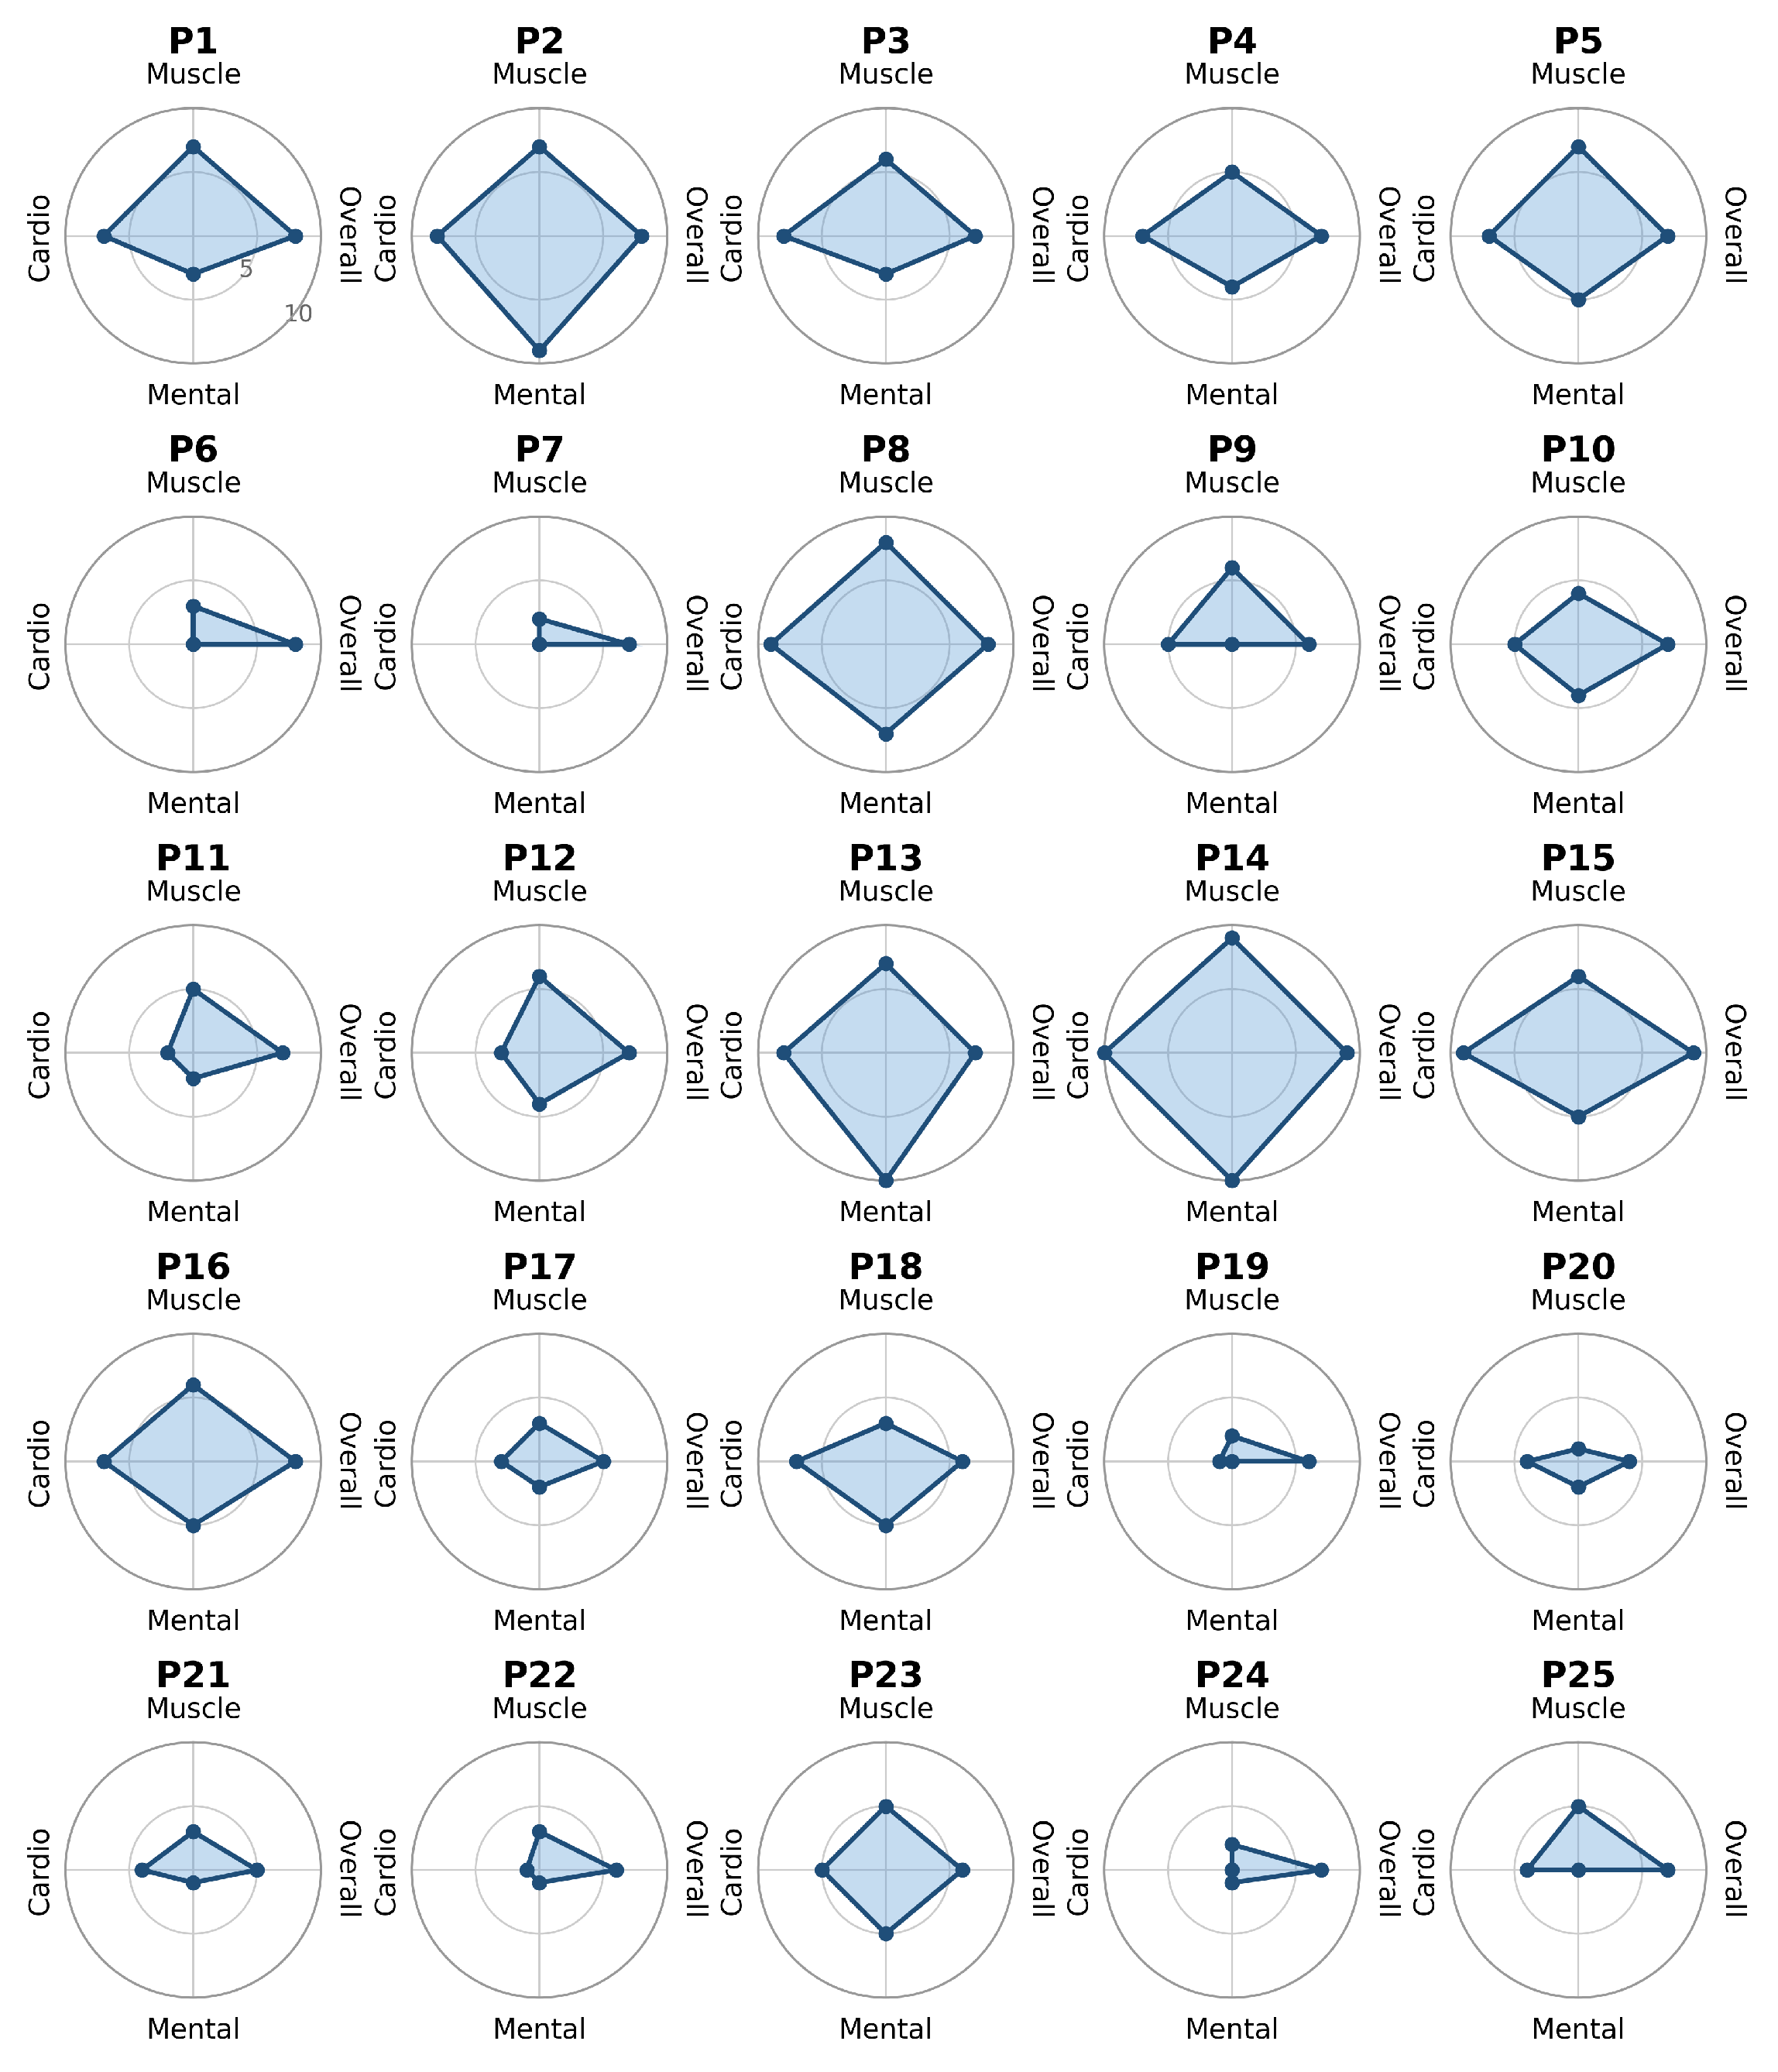
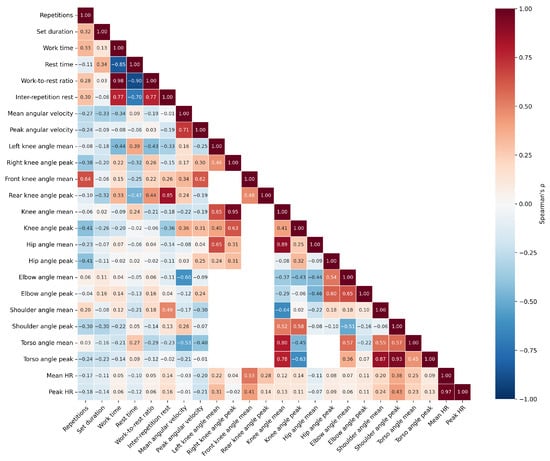
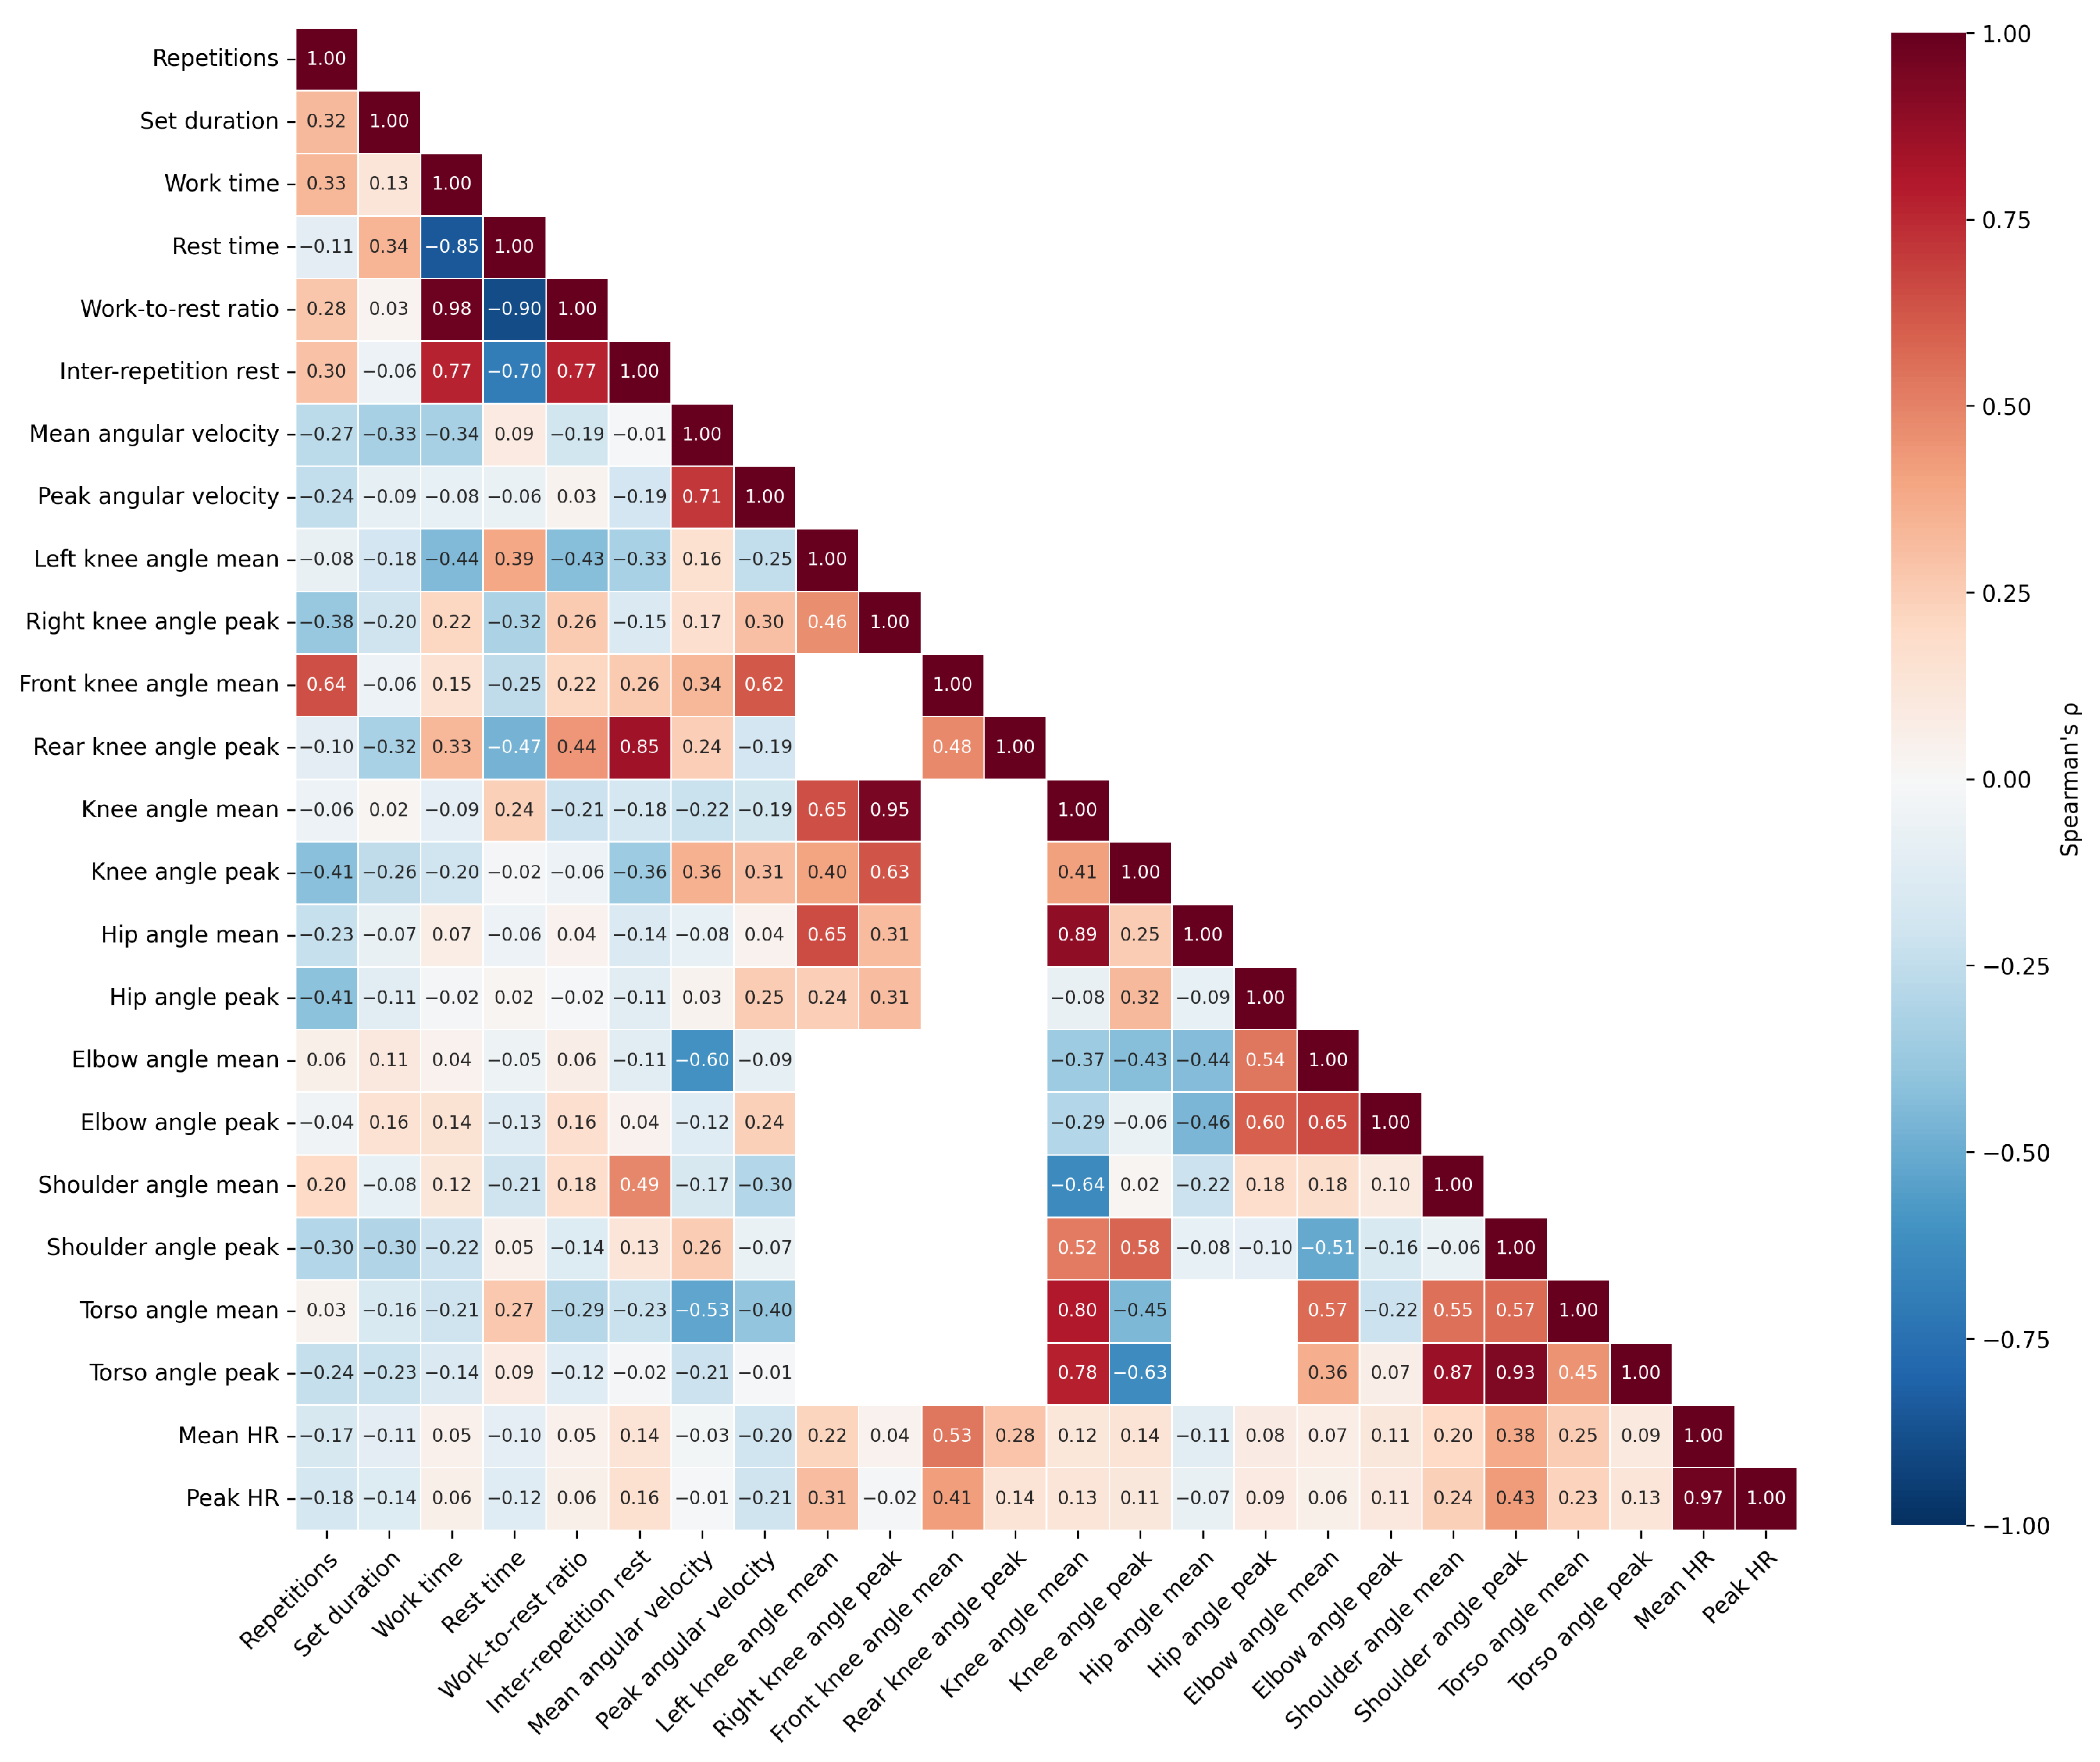
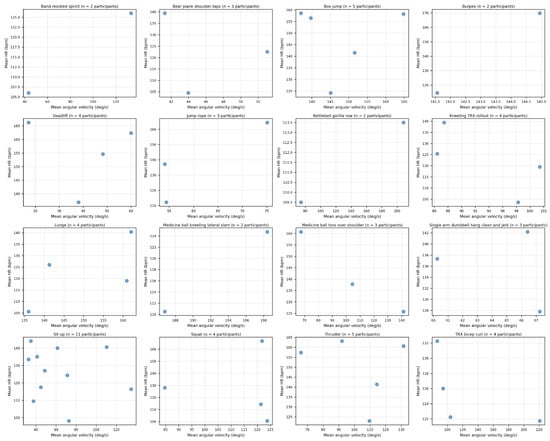
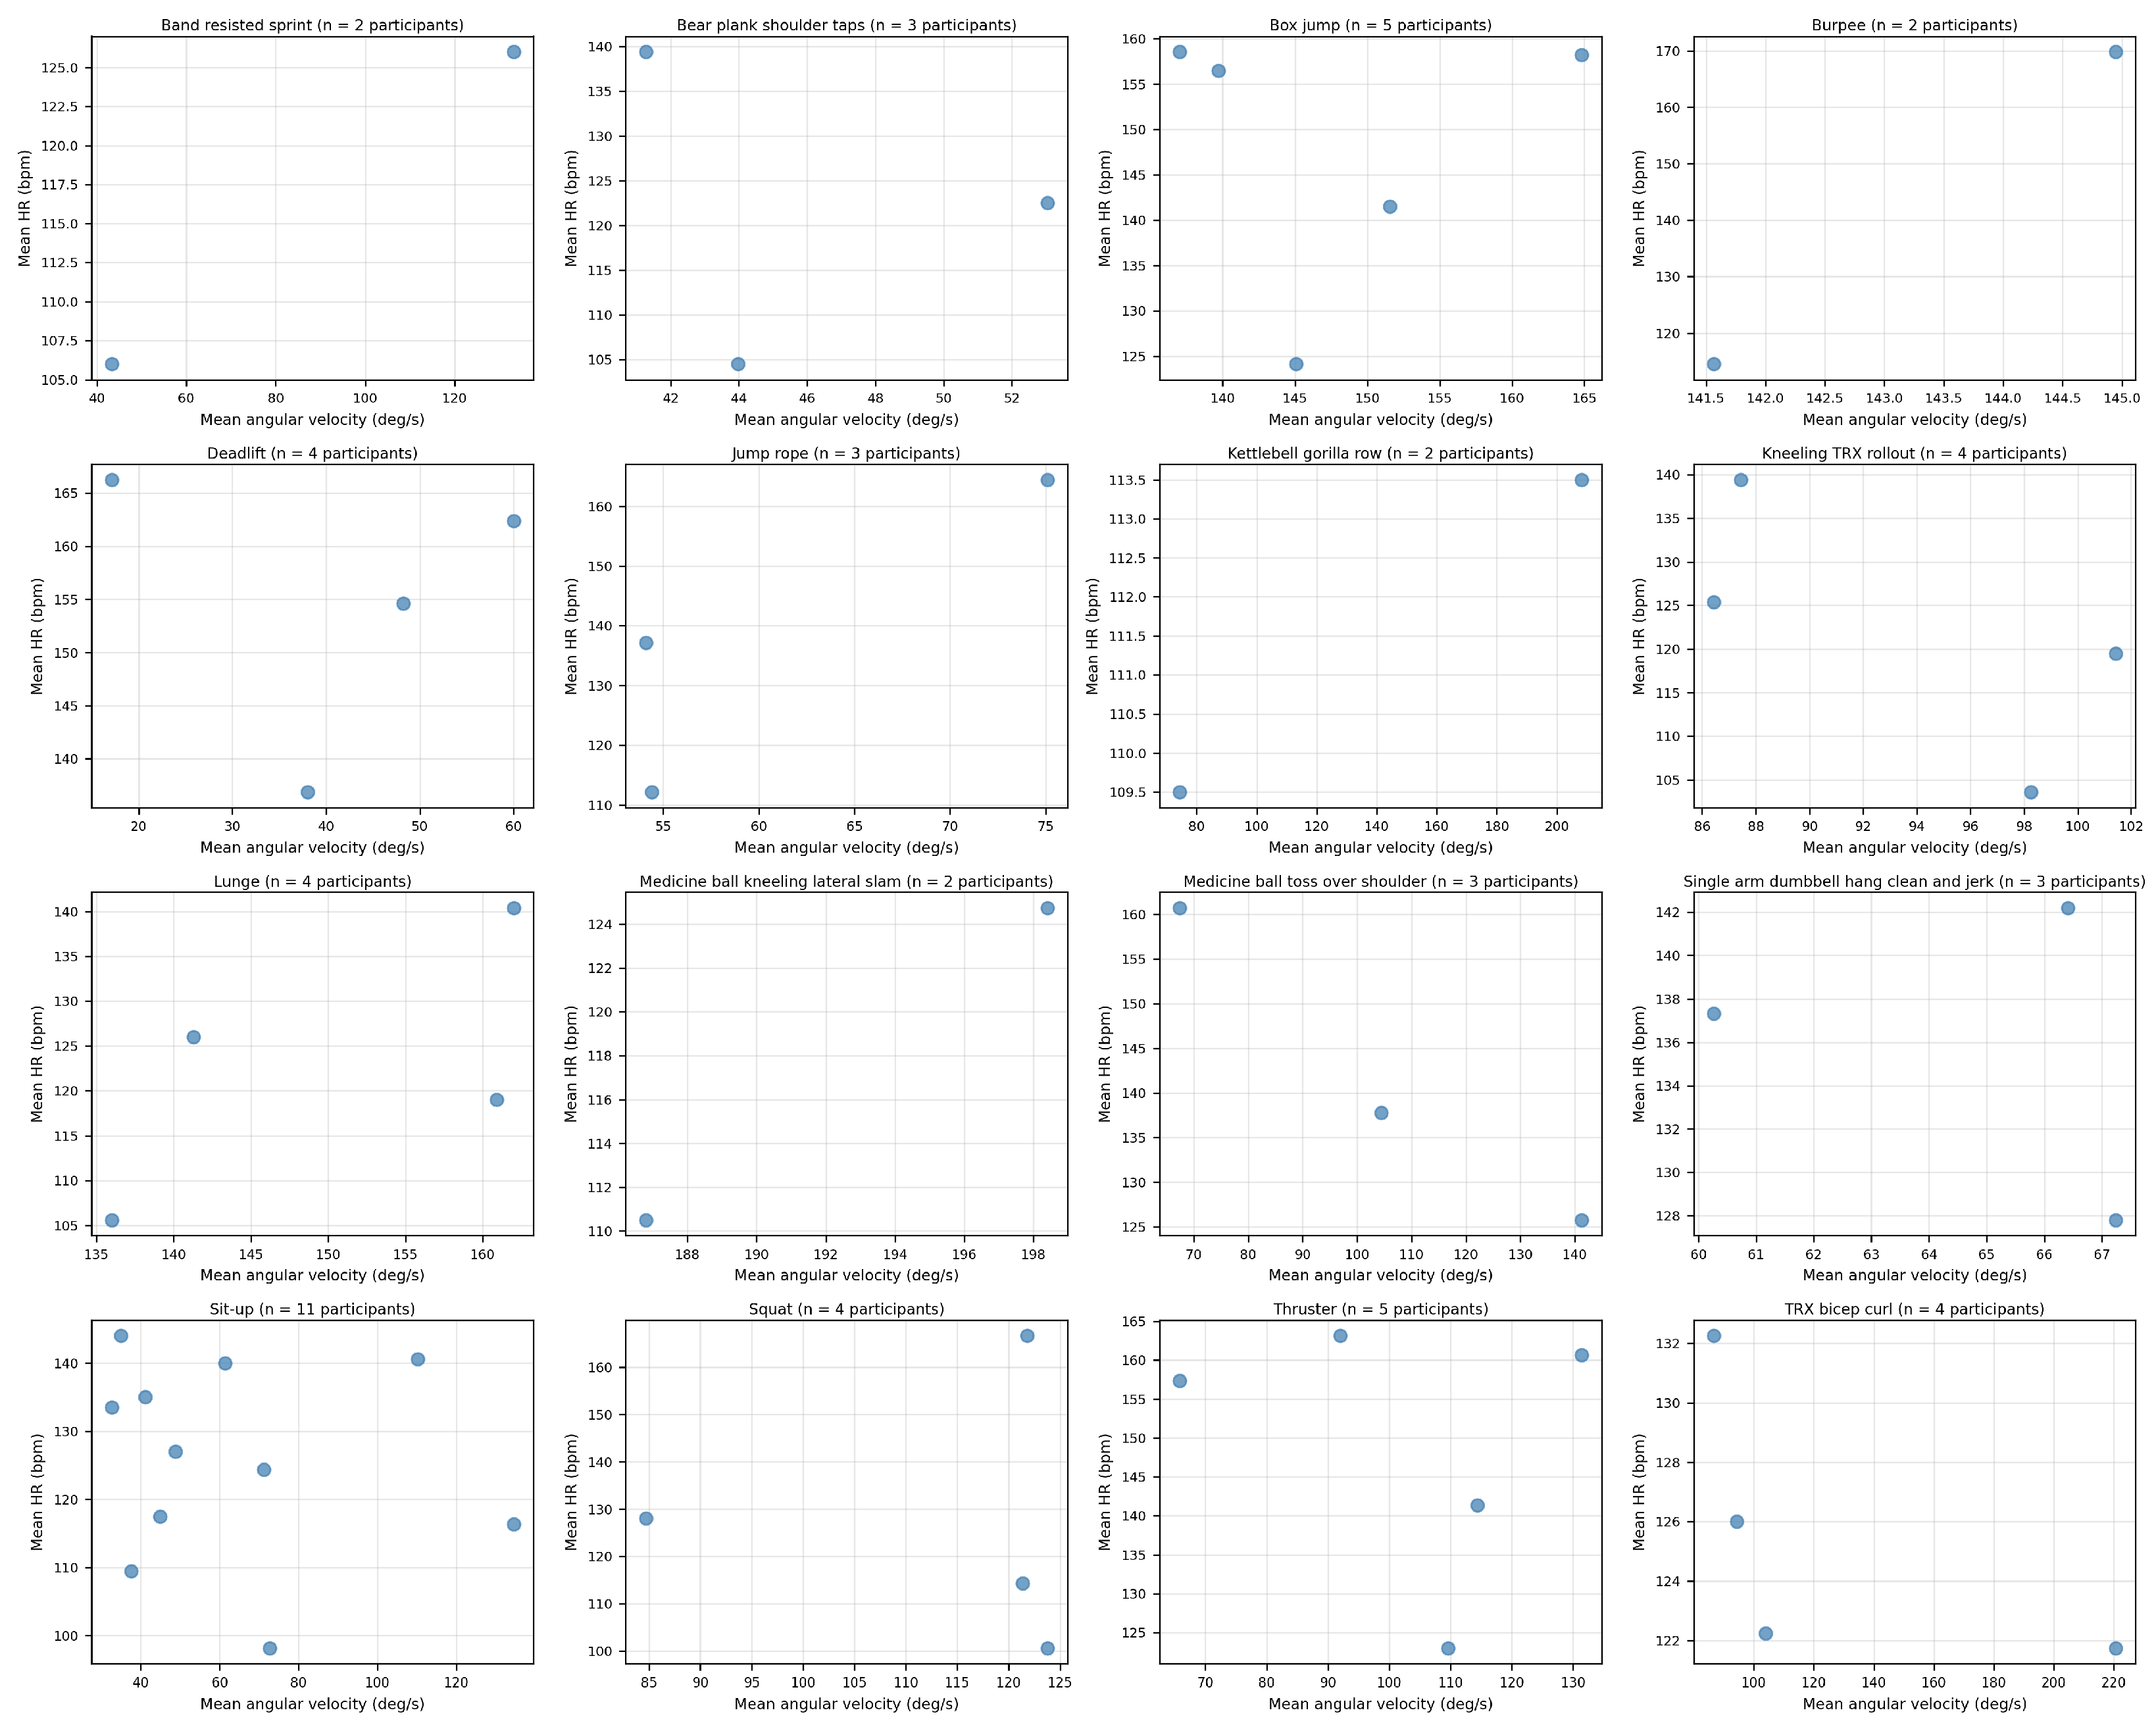
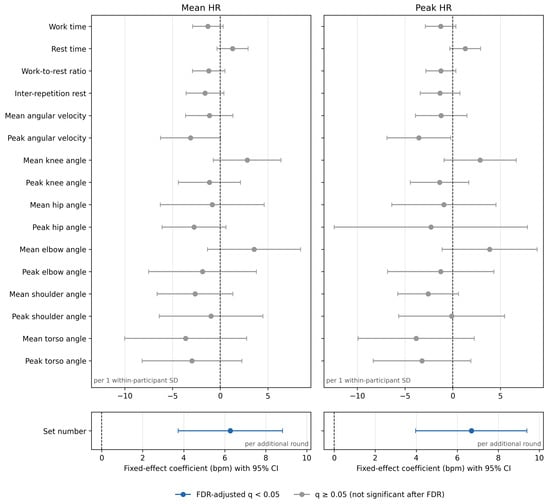
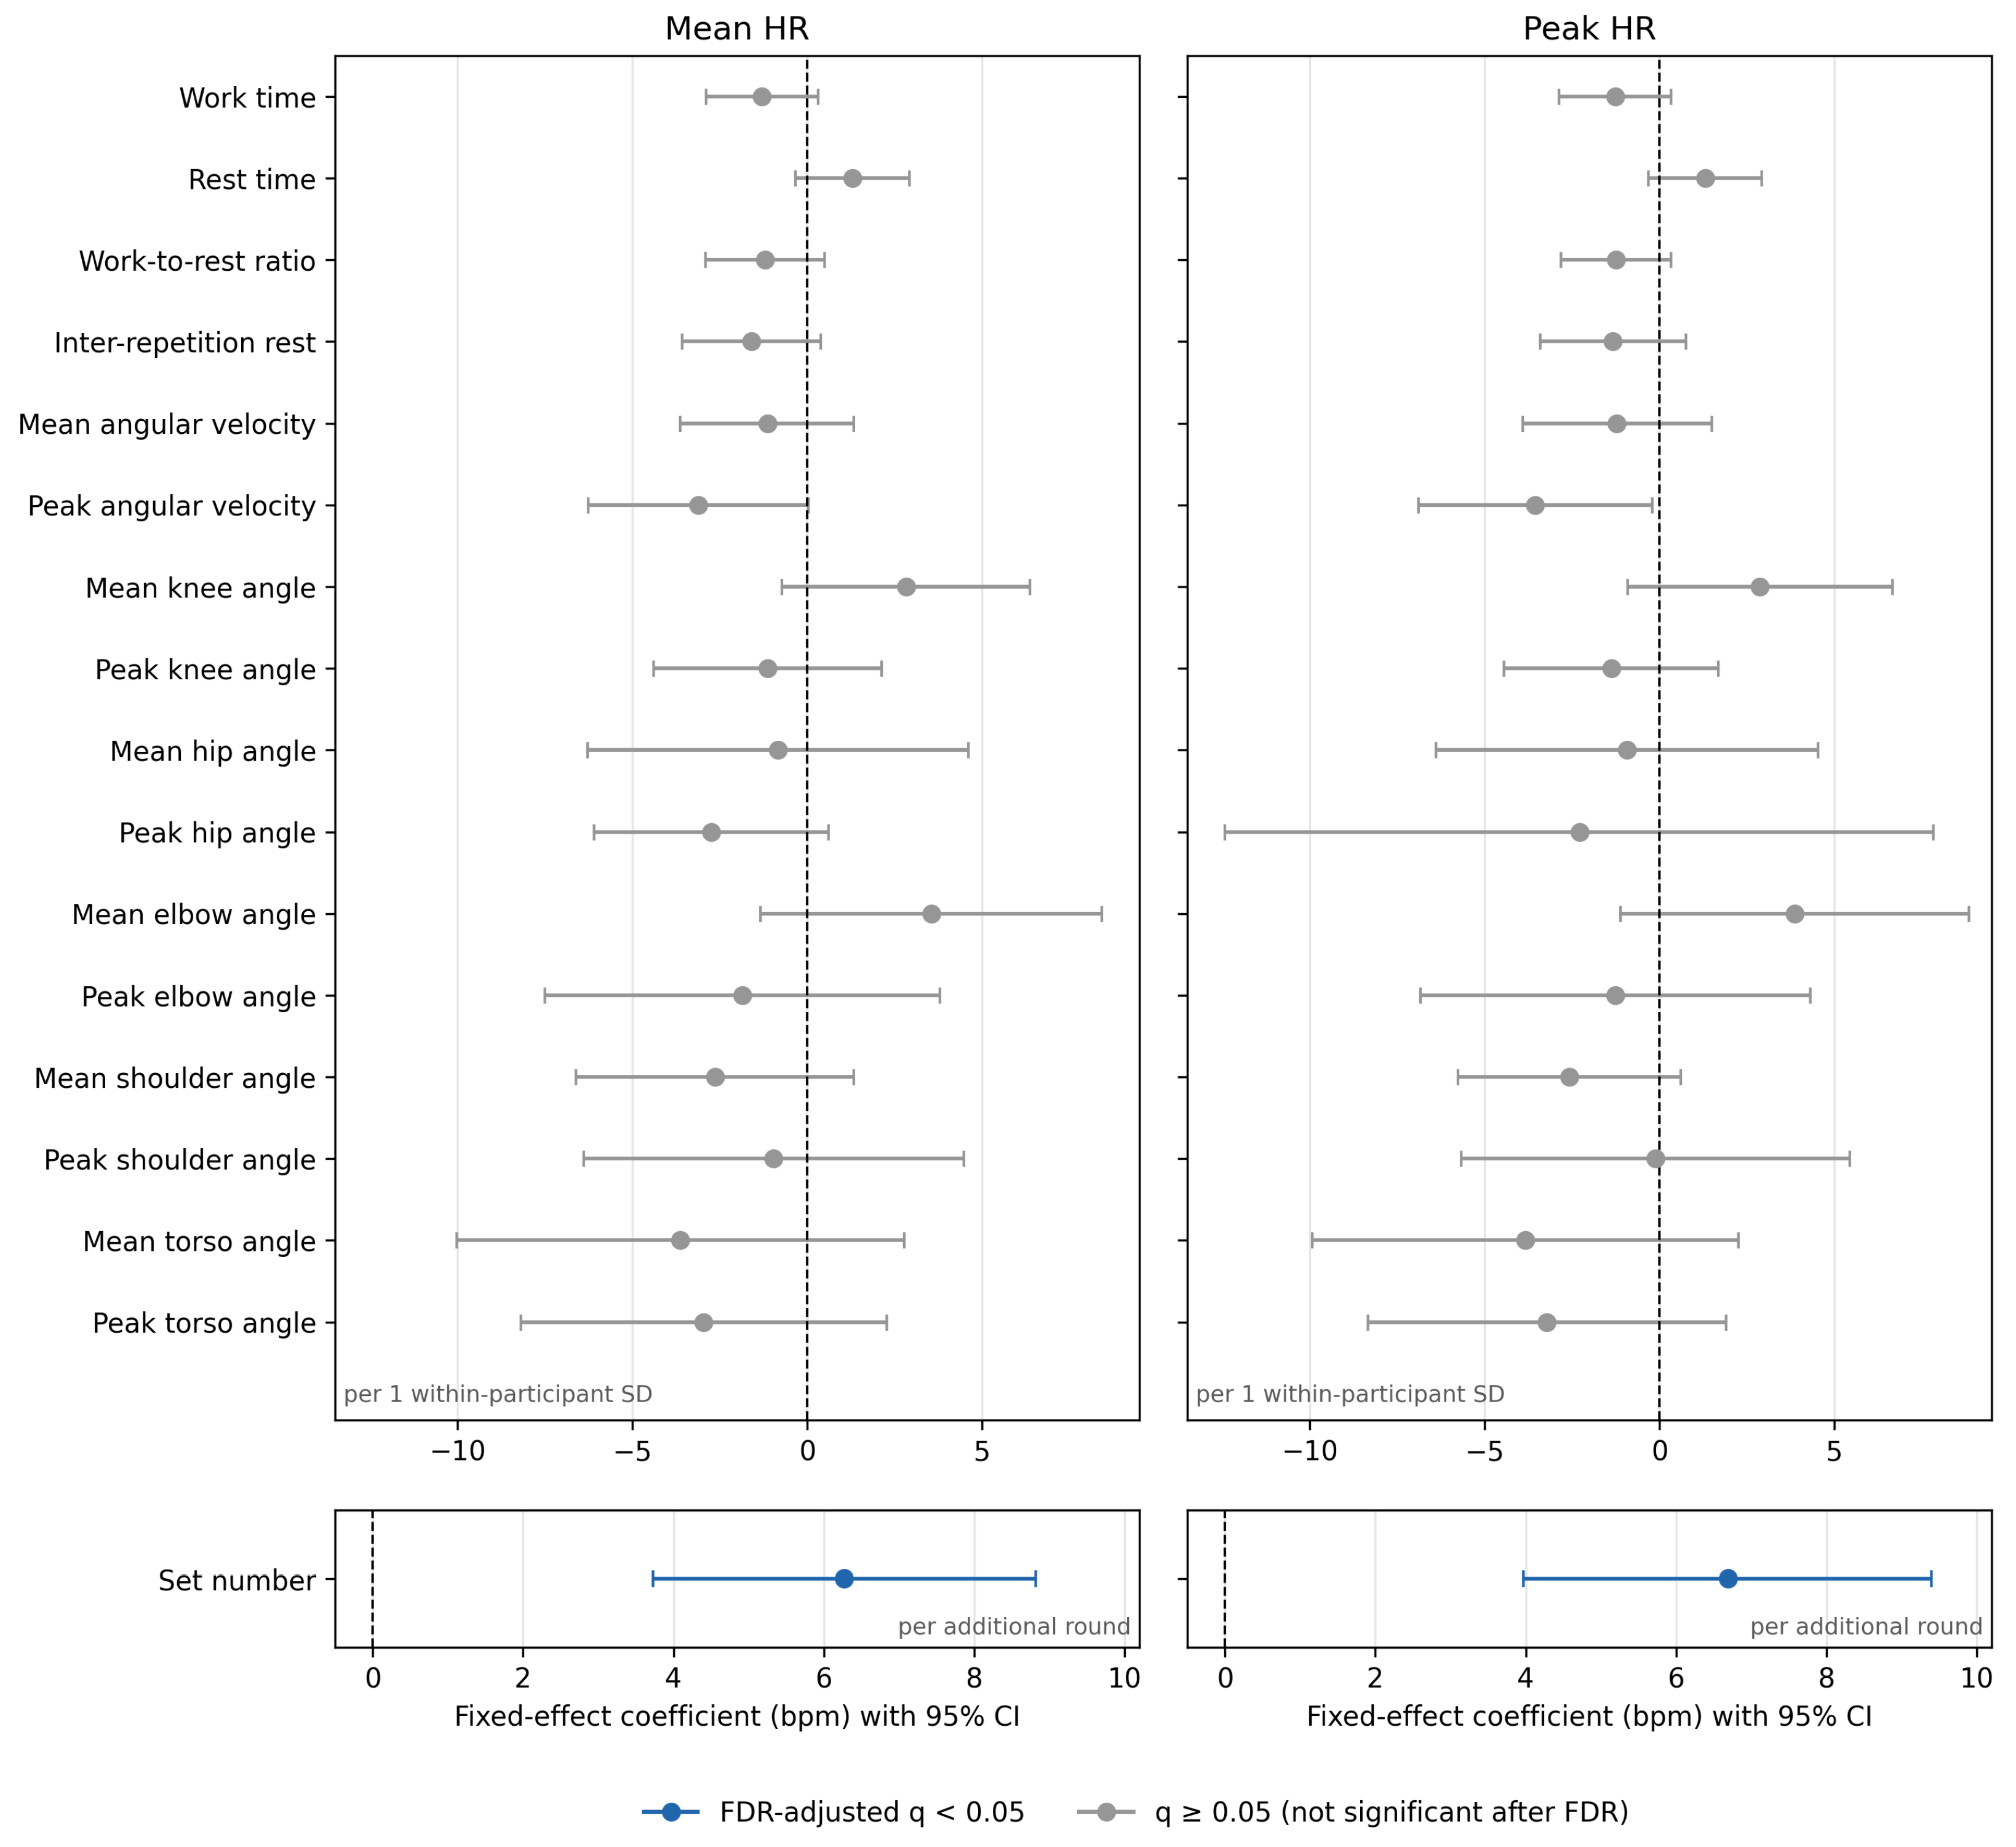

Disclaimer/Publisher’s Note: The statements, opinions and data contained in all publications are solely those of the individual author(s) and contributor(s) and not of MDPI and/or the editor(s). MDPI and/or the editor(s) disclaim responsibility for any injury to people or property resulting from any ideas, methods, instructions or products referred to in the content. |
© 2026 by the authors. Licensee MDPI, Basel, Switzerland. This article is an open access article distributed under the terms and conditions of the Creative Commons Attribution (CC BY) license.