


Abstract
A previously reported allele-specific qPCR (AS-qPCR) dataset for red seabream (Pagrus major) reference-group assignment was reanalyzed to develop a two-marker statistical classifier. Mean Ct values for two previously selected markers, SNP001 and SNP008, from Korean and Japanese reference samples were integrated using logistic regression, and model performance was evaluated by ROC curve analysis, Youden index-based cutoff optimization, confusion matrix analysis, and repeated stratified 10-fold cross-validation. Single-marker analyses yielded AUCs of 0.869 for SNP001 and 0.891 for SNP008, whereas the two-SNP logistic model showed an AUC of 0.943. At the optimal P(Korea) cutoff of 0.387, the model achieved 87.08% accuracy, 92.22% sensitivity for the Korean reference group, and 81.82% specificity for the Japanese reference group in the model-development dataset. Internal validation by repeated stratified 10-fold cross-validation yielded a mean AUC of 0.9396 ± 0.0580. In a small separately collected market-sourced confirmation set, 18 of 20 samples were evaluable, with an accuracy of 72.22%, sensitivity of 77.78%, and specificity of 66.67%, all calculated relative to the country-of-purchase labels. Addition of Ct standard deviation or coefficient of variation did not improve cross-validated discrimination. These results support a parsimonious two-marker mean Ct-based framework for reference-group assignment while indicating that further validation using provenance-verified independent samples is required before routine application.
Key Contribution:
A two-SNP AS-qPCR logistic model integrated mean Ct values from two previously selected markers into an interpretable probability-based framework for assigning red seabream to Korean and Japanese reference groups, with internal cross-validation and a separately collected market-sourced confirmation experiment used to characterize its performance and limitations.
1. Introduction
Red seabream, Pagrus major, is an economically important marine fish species widely consumed in East Asia [1]. In Korea, domestic and imported red seabream are distributed through similar seafood markets, and mislabeling of geographical origin can undermine consumer confidence, fair trade, and regulatory enforcement [1]. Because external morphology, market labels, and distribution records are not always sufficient to verify origin after harvest and distribution, objective analytical methods are required for seafood authentication [2,3]. DNA-based approaches are particularly useful for this purpose because genetic markers are relatively stable and can provide sample-level evidence for distinguishing populations or geographical sources [2].
A quantitative polymerase chain reaction (qPCR)-based method for discriminating Korean and Japanese red seabream was recently developed using single nucleotide polymorphism (SNP) markers selected from genotyping-by-sequencing data [1]. In that study, two allele-specific qPCR (AS-qPCR) markers, SNP001 and SNP008, were selected and evaluated for distinguishing Korean and Japanese reference groups [1]. Gaussian mixture modeling was used to establish marker-specific classification thresholds, and each marker was applied independently for classification [4]. The reported overall accuracy, sensitivity, and specificity were 81.67, 87.78, and 75.56%, respectively, for SNP001, and 77.78, 74.44, and 81.11%, respectively, for SNP008 [1]. These results demonstrated the practical applicability of AS-qPCR for red seabream reference-group assignment while also indicating that each single marker alone produced incomplete discrimination.
Single-marker Ct thresholding is operationally simple and useful for routine interpretation; however, it does not fully exploit the combined information provided by multiple qPCR markers [1,5]. In the previously reported assay, SNP001 and SNP008 showed different directional patterns between Korean and Japanese samples, suggesting that the two markers may provide complementary discriminatory signals [1]. A multivariable statistical model can integrate these signals into a single probability score and may therefore improve classification compared with independent marker-level decisions [3,5]. Logistic regression is particularly suitable for this purpose because it provides an interpretable probability of class membership from continuous predictor variables, such as mean cycle threshold (Ct) values [6]. In addition, receiver operating characteristic (ROC) curve analysis [7] and Youden index-based cutoff optimization can be used to define a probability threshold for practical reference-group assignment [8].
Therefore, this study aimed to reanalyze the previously generated qPCR Ct dataset for SNP001 and SNP008 and to develop a two-marker logistic regression model for assigning red seabream to Korean and Japanese reference groups [1]. Single-marker ROC performance was compared with that of the combined logistic regression model [7]. Classification performance was further evaluated using a Youden index-optimized probability cutoff, confusion matrix analysis, and repeated stratified 10-fold cross-validation [8]. In addition, models incorporating Ct standard deviation or coefficient of variation were examined to determine whether technical variability among qPCR replicates contributed additional discriminatory information [9,10]. This study provides a statistical extension of the previously developed AS-qPCR assay and proposes a compact two-SNP mean Ct-based framework for assigning red seabream samples to Korean and Japanese reference groups.
2. Materials and Methods
2.1. qPCR Ct Dataset
This study reanalyzed qPCR data generated from a previously reported AS-qPCR assay for assigning red seabream to Korean and Japanese reference groups [1]. Briefly, the original model-development dataset consisted of 180 red seabream samples, including 90 samples from Korea and 90 samples from Japan. As reported in the original study, the Korean reference samples were collected from three locations (Pohang, Tongyeong, and Busan), whereas the Japanese reference samples were collected from Owase City, Japan [1]. Two single nucleotide polymorphism (SNP) markers, SNP001 and SNP008, which had been selected from genotyping-by-sequencing data and validated by AS-qPCR, were used for the present analysis.
In the original study, AS-qPCR was performed in triplicate for each sample and marker according to the previously described assay protocol [1]. For the present reanalysis, sample-level mean cycle threshold (Ct) values were reconstructed directly from the available raw technical-replicate Ct measurements. Omitted wells and non-numeric or undetermined Ct measurements were excluded, and mean Ct values were calculated from the remaining valid technical replicates. The dataset used for statistical modeling contained the following variables: sample identifier, reference group (Korea or Japan), SNP001 mean Ct, and SNP008 mean Ct.
Korea was defined as the positive class (Korea = 1, Japan = 0) for classification analyses, such that model probabilities represented P(Korea). SNP001 mean Ct values were available for all 180 samples, whereas SNP008 mean Ct values were unavailable for two Japanese samples. Therefore, single-marker ROC analysis for SNP001 was performed using 180 samples, single-marker ROC analysis for SNP008 was performed using 178 samples, and all two-marker logistic regression analyses were performed using 178 samples with complete mean Ct data for both markers. To allow direct comparison of single-marker and two-marker discrimination using an identical sample set, an additional complete-case ROC comparison was performed using the same 178 samples.
2.2. Single-Marker ROC Analysis
The discriminatory performance of each SNP marker was first evaluated by receiver operating characteristic (ROC) curve analysis [7]. Korea was treated as the positive class throughout the ROC analyses. For SNP001, higher mean Ct values were associated with a greater likelihood of assignment to the Korean reference group; therefore, the original SNP001 mean Ct values were used as ROC scores. For SNP008, lower mean Ct values were associated with a greater likelihood of assignment to the Korean reference group; therefore, the negative of the SNP008 mean Ct values was used as the ROC score so that higher ROC scores consistently represented a greater likelihood of assignment to the Korean reference group.
The area under the ROC curve (AUC) was calculated for each marker. The optimal marker-specific cutoff was determined using the Youden index, defined as sensitivity + specificity − 1 [11]. If multiple thresholds yielded the same maximum Youden index, the threshold with the smallest absolute difference between sensitivity and specificity was selected. If a tie remained, the threshold closest to the median ROC score was selected.
For classification, SNP001 mean Ct values greater than or equal to the selected cutoff were assigned to the Korean reference group, whereas SNP008 mean Ct values less than or equal to the selected cutoff were assigned to the Korean reference group.
In addition to the primary single-marker analyses using all available observations for each marker, single-marker AUCs were additionally calculated using the same 178 complete-case samples with valid mean Ct values for both SNP001 and SNP008. These complete-case AUCs were used for direct comparison with the two-marker logistic regression model evaluated on the identical 178 samples.
2.3. Logistic Regression Model
A two-marker logistic regression model was constructed to integrate SNP001 and SNP008 mean Ct values into a single probability score for assignment to the Korean reference group. Logistic regression was selected because it allows continuous marker values to be converted into an interpretable probability of class membership. The model was fitted using complete-case data from 178 samples. SNP001 and SNP008 were prespecified predictors that had been selected and validated in the previous AS-qPCR study [1]; no additional marker selection was performed using the present model-development dataset.
Korea was defined as the positive class, and the dependent variable was coded as Korea = 1 and Japan = 0. Accordingly, the model output represented P(Korea), the predicted probability of assignment to the Korean reference group. The predictor variables were SNP001 mean Ct and SNP008 mean Ct. An unpenalized logistic regression model was fitted using the predictors in their original Ct units.
The logistic regression model was expressed as follows:
where XSNP001 and XSNP008 denote the mean Ct values for SNP001 and SNP008, respectively. The predicted probability of assignment to the Korean reference group was calculated as follows:
logit[P(Korea)] = β0 + β1XSNP001 + β2XSNP008,
P(Korea) = 1/[1 + exp (−(β0 + β1XSNP001 + β2XSNP008))].
The fitted coefficients were used to calculate P(Korea) for each sample. Samples with P(Korea) greater than or equal to the probability cutoff optimized in the model-development dataset were assigned to the Korean reference group, whereas samples with probabilities below the cutoff were assigned to the Japanese reference group.
2.4. ROC-Based Probability Cutoff and Classification Performance
The ROC curve of the logistic regression model was generated using P(Korea). The AUC was calculated to evaluate overall model discrimination. The optimal probability cutoff was determined using the Youden index [11]. The cutoff was optimized using the complete model-development dataset. Based on this cutoff, samples were assigned to predicted reference groups, and a confusion matrix was generated. The resulting accuracy, sensitivity, and specificity were considered apparent classification performance because both model fitting and cutoff optimization were performed using the model-development dataset. Sensitivity was defined as the proportion of Korean samples correctly assigned to the Korean reference group, whereas specificity was defined as the proportion of Japanese samples correctly assigned to the Japanese reference group.
To quantify uncertainty, 95% confidence intervals (CIs) for accuracy, sensitivity, and specificity were calculated using the Wilson score method. For AUC estimates, 95% CIs were obtained using stratified bootstrap resampling with 5000 resamples, with the 2.5th and 97.5th percentiles of the bootstrap distribution used as the confidence limits. For the two-marker logistic regression model, the model was refitted within each bootstrap resample before AUC calculation.
2.5. Cross-Validation
To evaluate the internal predictive performance of the two-marker logistic regression model, repeated stratified 10-fold cross-validation was performed on the 178 complete-case samples using 10 repeats (100 held-out evaluations in total; random state = 42). Stratification was used to preserve the proportions of Korean and Japanese reference samples within each fold.
In each iteration, SNP001 and SNP008 mean Ct predictors were standardized using the mean and standard deviation estimated from the training folds only. The held-out samples were subsequently transformed using these training-derived parameters. An unpenalized logistic regression model was fitted to the standardized training data.
The probability cutoff was determined from the training data only using the Youden index and the predefined tie-breaking procedure and was then applied without modification to the corresponding held-out fold. AUC was calculated from the held-out P(Korea) values, whereas accuracy, sensitivity, and specificity were calculated from the resulting class assignments. Thus, no information from the held-out fold was used for predictor standardization, model fitting, or probability cutoff selection.
Sensitivity represented the correct assignment of Korean samples, and specificity represented the correct assignment of Japanese samples. Mean and standard deviation values were summarized across the 100 held-out evaluations. This procedure represented internal validation of the classifier conditional on the two SNP markers previously selected in the original AS-qPCR study [1]. Marker selection was not repeated within the cross-validation procedure; therefore, the cross-validation results do not account for uncertainty associated with the original marker-selection process.
2.6. Evaluation of Ct Variability Variables
To determine whether technical variability among qPCR replicates provided additional discriminatory information, Ct standard deviation (Ct SD) and coefficient of variation (Ct CV) were evaluated as additional variables.
For each sample and marker, mean Ct and Ct SD were calculated directly from the available valid technical-replicate Ct measurements. Ct SD was calculated as the sample standard deviation of the valid replicate measurements, and Ct CV was calculated as Ct SD divided by mean Ct.
Three feature sets were compared: mean Ct only, mean Ct plus Ct SD, and mean Ct plus Ct CV. For direct comparison among the three feature sets, all models were evaluated using the same complete-case subset of 178 samples.
Model performance was evaluated using repeated stratified 10-fold cross-validation with 10 repeats. The same 100 cross-validation splits used for the primary two-marker model were reused for all three feature sets. Predictor variables were standardized within each training fold, and the same unpenalized logistic regression procedure was applied to each feature set. This ensured that differences in model performance reflected differences in predictor composition rather than differences in sample composition or cross-validation partitioning.
2.7. Separately Collected Market-Sourced Confirmation Experiment
To further examine the applicability of the fixed logistic regression model to newly collected samples, a separate confirmation experiment was performed using 20 red seabream samples that were not included in the model-development dataset. The confirmation set consisted of 10 samples purchased in Masan, Korea, and 10 samples purchased in Matsuyama, Japan. All specimens were obtained from local seafood markets during a sampling event separate from that used for the model-development dataset. Country-of-purchase labels for the confirmation samples were assigned according to the country of purchase because farm-level, supplier-level, or traceability documentation confirming the biological origin of individual specimens was not available. For performance calculations, these country-of-purchase labels were used as the reference labels. Accordingly, the confirmation experiment should be interpreted as an assessment using separately collected market-sourced samples rather than as a traceability-verified external validation of geographical origin.
SNP001 and SNP008 qPCR measurements were obtained using the same AS-qPCR approach used for the model-development samples [1]. Each 20 μL reaction contained 10 μL of 2× GreenStar Master Mix with SYBR Green dye (Bioneer, Daejeon, Korea), 1 μL of genomic DNA at 10 ng/μL, 1 μL each of the forward and reverse primers (10 pmol each), and 7 μL of distilled water. All reactions were performed in technical triplicate. The qPCR conditions followed those described previously [1]. Reactions were performed using a QuantStudio 6 Flex Real-Time PCR system (Applied Biosystems, Thermo Fisher Scientific, Waltham, MA, USA) with an initial denaturation at 95 °C for 10 min, followed by 40 cycles at 95 °C for 15 s, 58 °C for SNP001 or 65 °C for SNP008 for 30 s, and 72 °C for 30 s. For melting-curve analysis, the products were heated to 95 °C for 15 s and then held at 60 °C for 1 min, followed by a gradual increase from 60 to 95 °C at a rate of 0.05 °C/s while fluorescence was recorded. Mean Ct values for each marker were calculated from the available valid technical-replicate Ct measurements using the same procedure applied to the model-development dataset.
The confirmation samples were analyzed in a separate qPCR batch from the model-development samples using the same instrument platform and assay conditions. DNA input concentration was standardized to 10 ng/μL before each assay.
The previously fitted logistic regression equation and the predefined Youden index-based probability cutoff were applied to the market-sourced confirmation samples without model retraining or cutoff reoptimization. Samples with complete SNP001 and SNP008 mean Ct data were assigned according to P(Korea). Samples with P(Korea) greater than or equal to the fixed probability cutoff were assigned to the Korean reference group, whereas those with P(Korea) below the cutoff were assigned to the Japanese reference group.
A sample was considered evaluable only when mean Ct values were available for both SNP001 and SNP008 because both predictors were required to calculate P(Korea). Two confirmation samples did not yield sufficient valid SNP008 Ct measurements to calculate a sample-level mean Ct and were therefore treated as not determined. These samples were excluded from accuracy, sensitivity, and specificity calculations among evaluable samples, while the proportion of evaluable samples was additionally reported to characterize practical assay performance. The confirmation samples were not used for model fitting, coefficient estimation, cutoff optimization, or any other stage of model development.
2.8. Statistical Analysis
All statistical analyses were performed using Python 3.10.19. Data handling was conducted using pandas 2.3.3 [12] and NumPy 2.2.5 [13], and logistic regression, ROC analysis, confusion matrix analysis, and repeated stratified cross-validation were performed using scikit-learn 1.7.1 [14]. Figures were generated using Matplotlib 3.10.8.
The primary two-marker model was fitted using unpenalized logistic regression with SNP001 and SNP008 mean Ct values as predictors. Korea was defined as the positive class throughout the classification analyses, and predicted probabilities therefore represented P(Korea). During cross-validation, predictor standardization was performed within each training fold only to prevent information leakage.
AUC, accuracy, sensitivity, and specificity were used as the main performance metrics. Sensitivity represented the proportion of Korean samples correctly assigned to the Korean reference group, whereas specificity represented the proportion of Japanese samples correctly assigned to the Japanese reference group. For the market-sourced confirmation set, these metrics were calculated relative to the country-of-purchase labels among evaluable samples. Evaluability was calculated as the proportion of confirmation samples with valid mean Ct values for both markers, and the overall correct-assignment yield was calculated as the proportion of all confirmation samples that produced a correct assignment relative to their country-of-purchase labels.
To quantify uncertainty in the classification performance estimates, 95% confidence intervals (CIs) for accuracy, sensitivity, specificity, evaluability, and overall correct-assignment yield were calculated using the Wilson score method. For AUC estimates, 95% CIs were obtained using stratified bootstrap resampling with 5000 resamples, with the 2.5th and 97.5th percentiles of the bootstrap distribution used as the confidence limits. For the two-marker logistic regression model, the model was refitted within each bootstrap resample before calculation of the AUC. Bootstrap resampling was performed using a fixed random seed of 42 to ensure reproducibility.
Model calibration was additionally assessed using held-out P(Korea) values generated during repeated cross-validation. Because each sample was evaluated once in each of the 10 repeats, the 10 held-out probabilities for each sample were averaged to obtain one cross-validated probability per sample. Calibration was summarized using the Brier score and visually examined using a calibration plot based on five equal-frequency probability groups, comparing the mean predicted probability with the observed proportion of Korean reference samples within each group.
All analyses used complete-case data for the corresponding model or comparison.
3. Results and Discussion
3.1. Single-Marker Assignment Performance of SNP001 and SNP008
The discriminatory performance of SNP001 and SNP008 was first evaluated individually using receiver operating characteristic (ROC) curve analysis [7]. These two markers were previously developed as AS-qPCR markers for distinguishing Korean and Japanese red seabream (P. major) [1]. The primary single-marker ROC analyses used all available data for each marker: 180 samples for SNP001 and 178 samples for SNP008. Korea was defined as the positive class. For SNP001, higher mean Ct values were associated with assignment to the Korean reference group; therefore, the original SNP001 mean Ct values were used as ROC scores. In contrast, lower SNP008 mean Ct values were associated with assignment to the Korean reference group; therefore, the negative of the SNP008 mean Ct values was used as the ROC score.
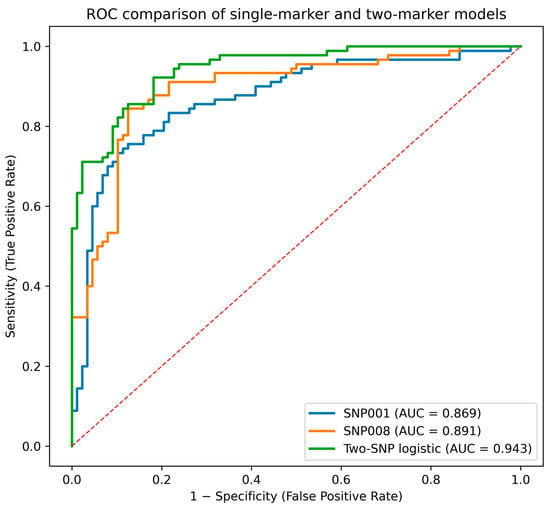
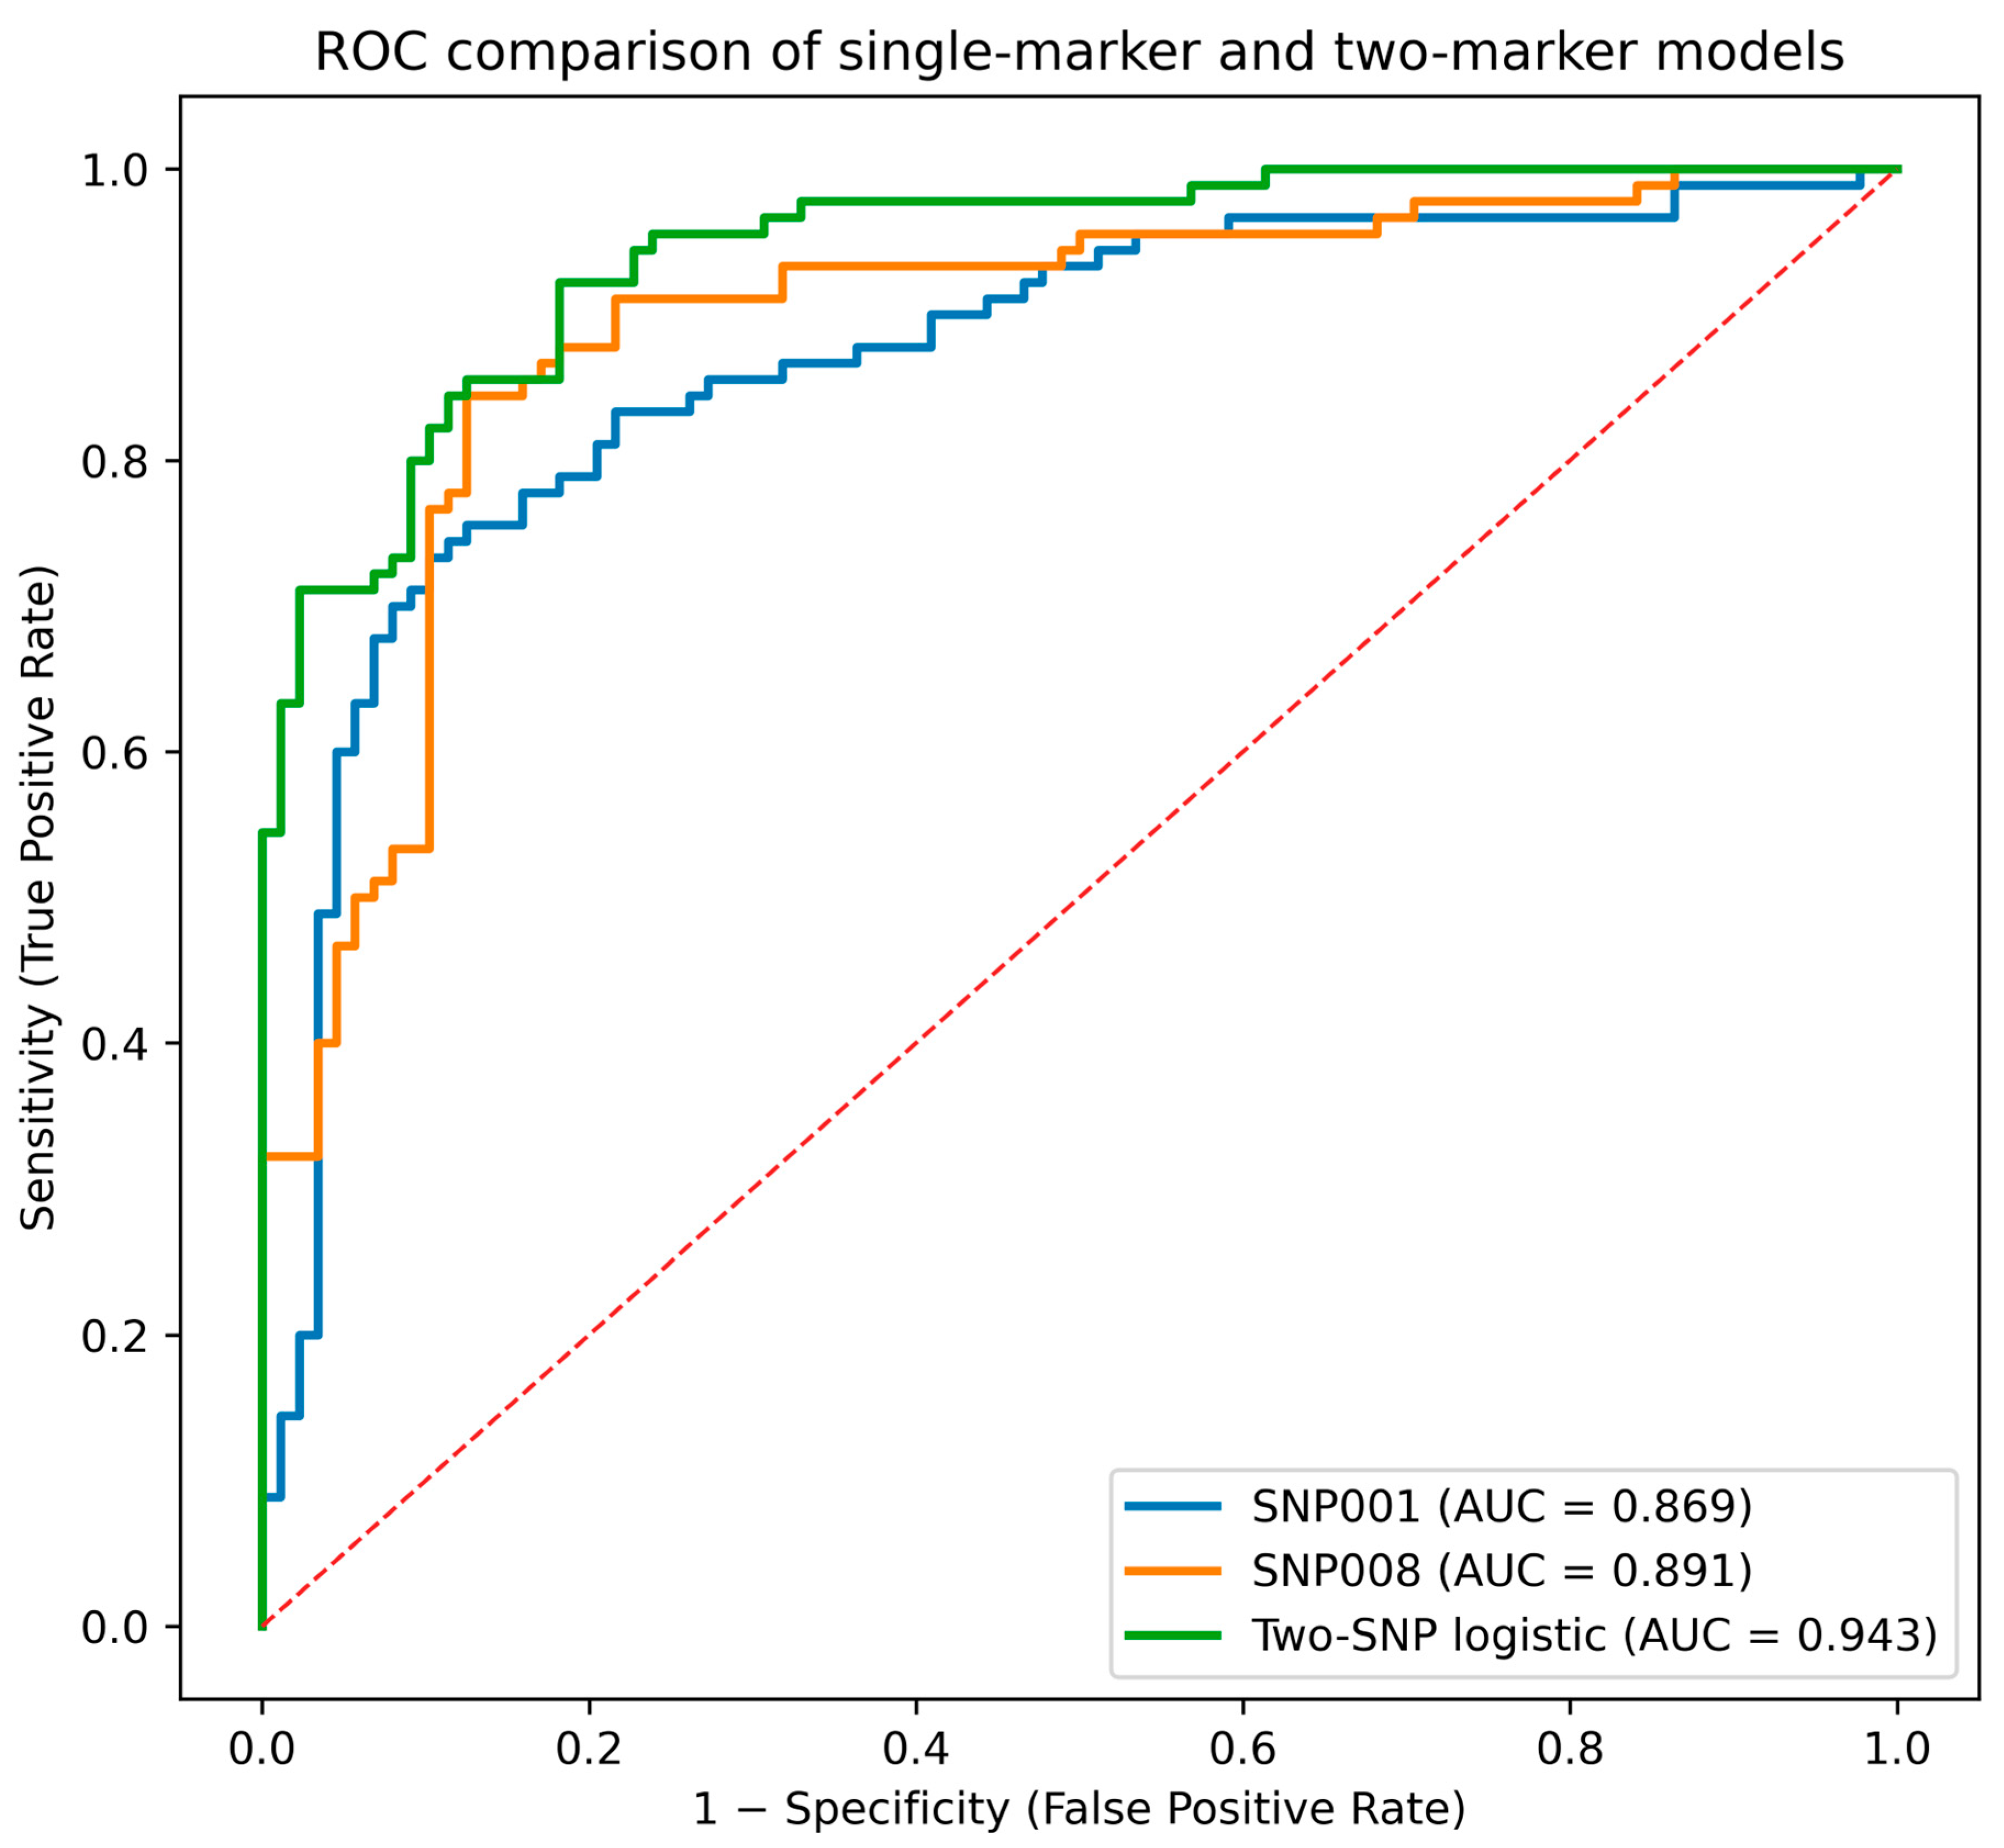
Both markers showed discriminatory potential for assignment to Korean and Japanese reference groups (Table 1 and Figure 1). SNP001 showed an area under the ROC curve (AUC) of 0.869, with a 95% confidence interval (CI) of 0.813–0.920. SNP008 showed an AUC of 0.891, with a 95% CI of 0.840–0.937. The optimal single-marker cutoffs indicated that samples with SNP001 mean Ct values greater than or equal to 28.579 were assigned to the Korean reference group, whereas samples with SNP008 mean Ct values less than or equal to 31.442 were assigned to the Korean reference group. These opposite directional patterns indicate that SNP001 and SNP008 provide complementary qPCR signals for reference-group discrimination.
Table 1.
Classification performance of single-marker and two-marker qPCR mean Ct models for assigning red seabream to Korean and Japanese reference groups.
Figure 1.
Receiver operating characteristic (ROC) curves for SNP001, SNP008, and the two-SNP logistic regression model evaluated using the same 178 complete-case samples. AUC values were 0.869 for SNP001, 0.891 for SNP008, and 0.943 for the two-SNP logistic model. Korea was defined as the positive class.
To provide a direct comparison using an identical sample set, AUCs were additionally calculated using the 178 complete-case samples available for both markers. The complete-case AUCs were 0.869 (95% CI, 0.814–0.921) for SNP001 and 0.891 (95% CI, 0.840–0.937) for SNP008, compared with 0.943 (95% CI, 0.914–0.972) for the two-SNP logistic model. Thus, the higher observed discrimination of the combined model was retained when all models were evaluated using the same samples.
The single-marker results of the present reanalysis should be distinguished from those reported in the original AS-qPCR study [1]. The original study used Gaussian mixture modeling to establish marker-specific classification thresholds and reported accuracy, sensitivity, and specificity values of 81.67%, 87.78%, and 75.56% for SNP001 and 77.78%, 74.44%, and 81.11% for SNP008, respectively [1]. In contrast, the present study recalculated single-marker thresholds using ROC analysis and the Youden index, with Korea defined as the positive class. Accordingly, the performance estimates obtained under the two analytical frameworks are method-specific and should not be interpreted as directly interchangeable. However, neither marker alone achieved complete separation of Korean and Japanese samples, supporting the need for a multi-marker classification approach that integrates the mean Ct values of both markers into a single predictive model.
3.2. Two-SNP Logistic Regression Model and ROC-Based Cutoff Optimization
To integrate the two qPCR markers into a single classification framework, a logistic regression model was constructed using SNP001 and SNP008 mean Ct values as continuous predictor variables [1]. The fitted model was expressed as follows:
logit[P(Korea)] = −3.583809 + 0.654457(SNP001 mean Ct) − 0.487187(SNP008 mean Ct)
Accordingly, the predicted probability of assignment to the Korean reference group was calculated as
where P(Korea) represents the predicted probability of assignment to the Korean reference group, and XSNP001 and XSNP008 represent the mean Ct values for SNP001 and SNP008, respectively. The positive coefficient for SNP001 indicates that higher SNP001 mean Ct values increased P(Korea), whereas the negative coefficient for SNP008 indicates that higher SNP008 mean Ct values decreased P(Korea). These coefficient directions were consistent with the single-marker ROC results, confirming that the two markers contributed opposite but complementary signals to the classification model [7].
P(Korea) = 1/[1 + exp (−(−3.583809 + 0.654457XSNP001 − 0.487187XSNP008))]
The two-SNP logistic regression model showed higher discriminatory performance than either single-marker model. The AUC of the logistic model was 0.943 (95% CI, 0.914–0.972), compared with complete-case AUC values of 0.869 (95% CI, 0.814–0.921) for SNP001 and 0.891 (95% CI, 0.840–0.937) for SNP008 (Table 1 and Figure 1). This result indicates that statistical integration of SNP001 and SNP008 mean Ct values captured additional discriminatory information that was not fully used by independent single-marker thresholding.
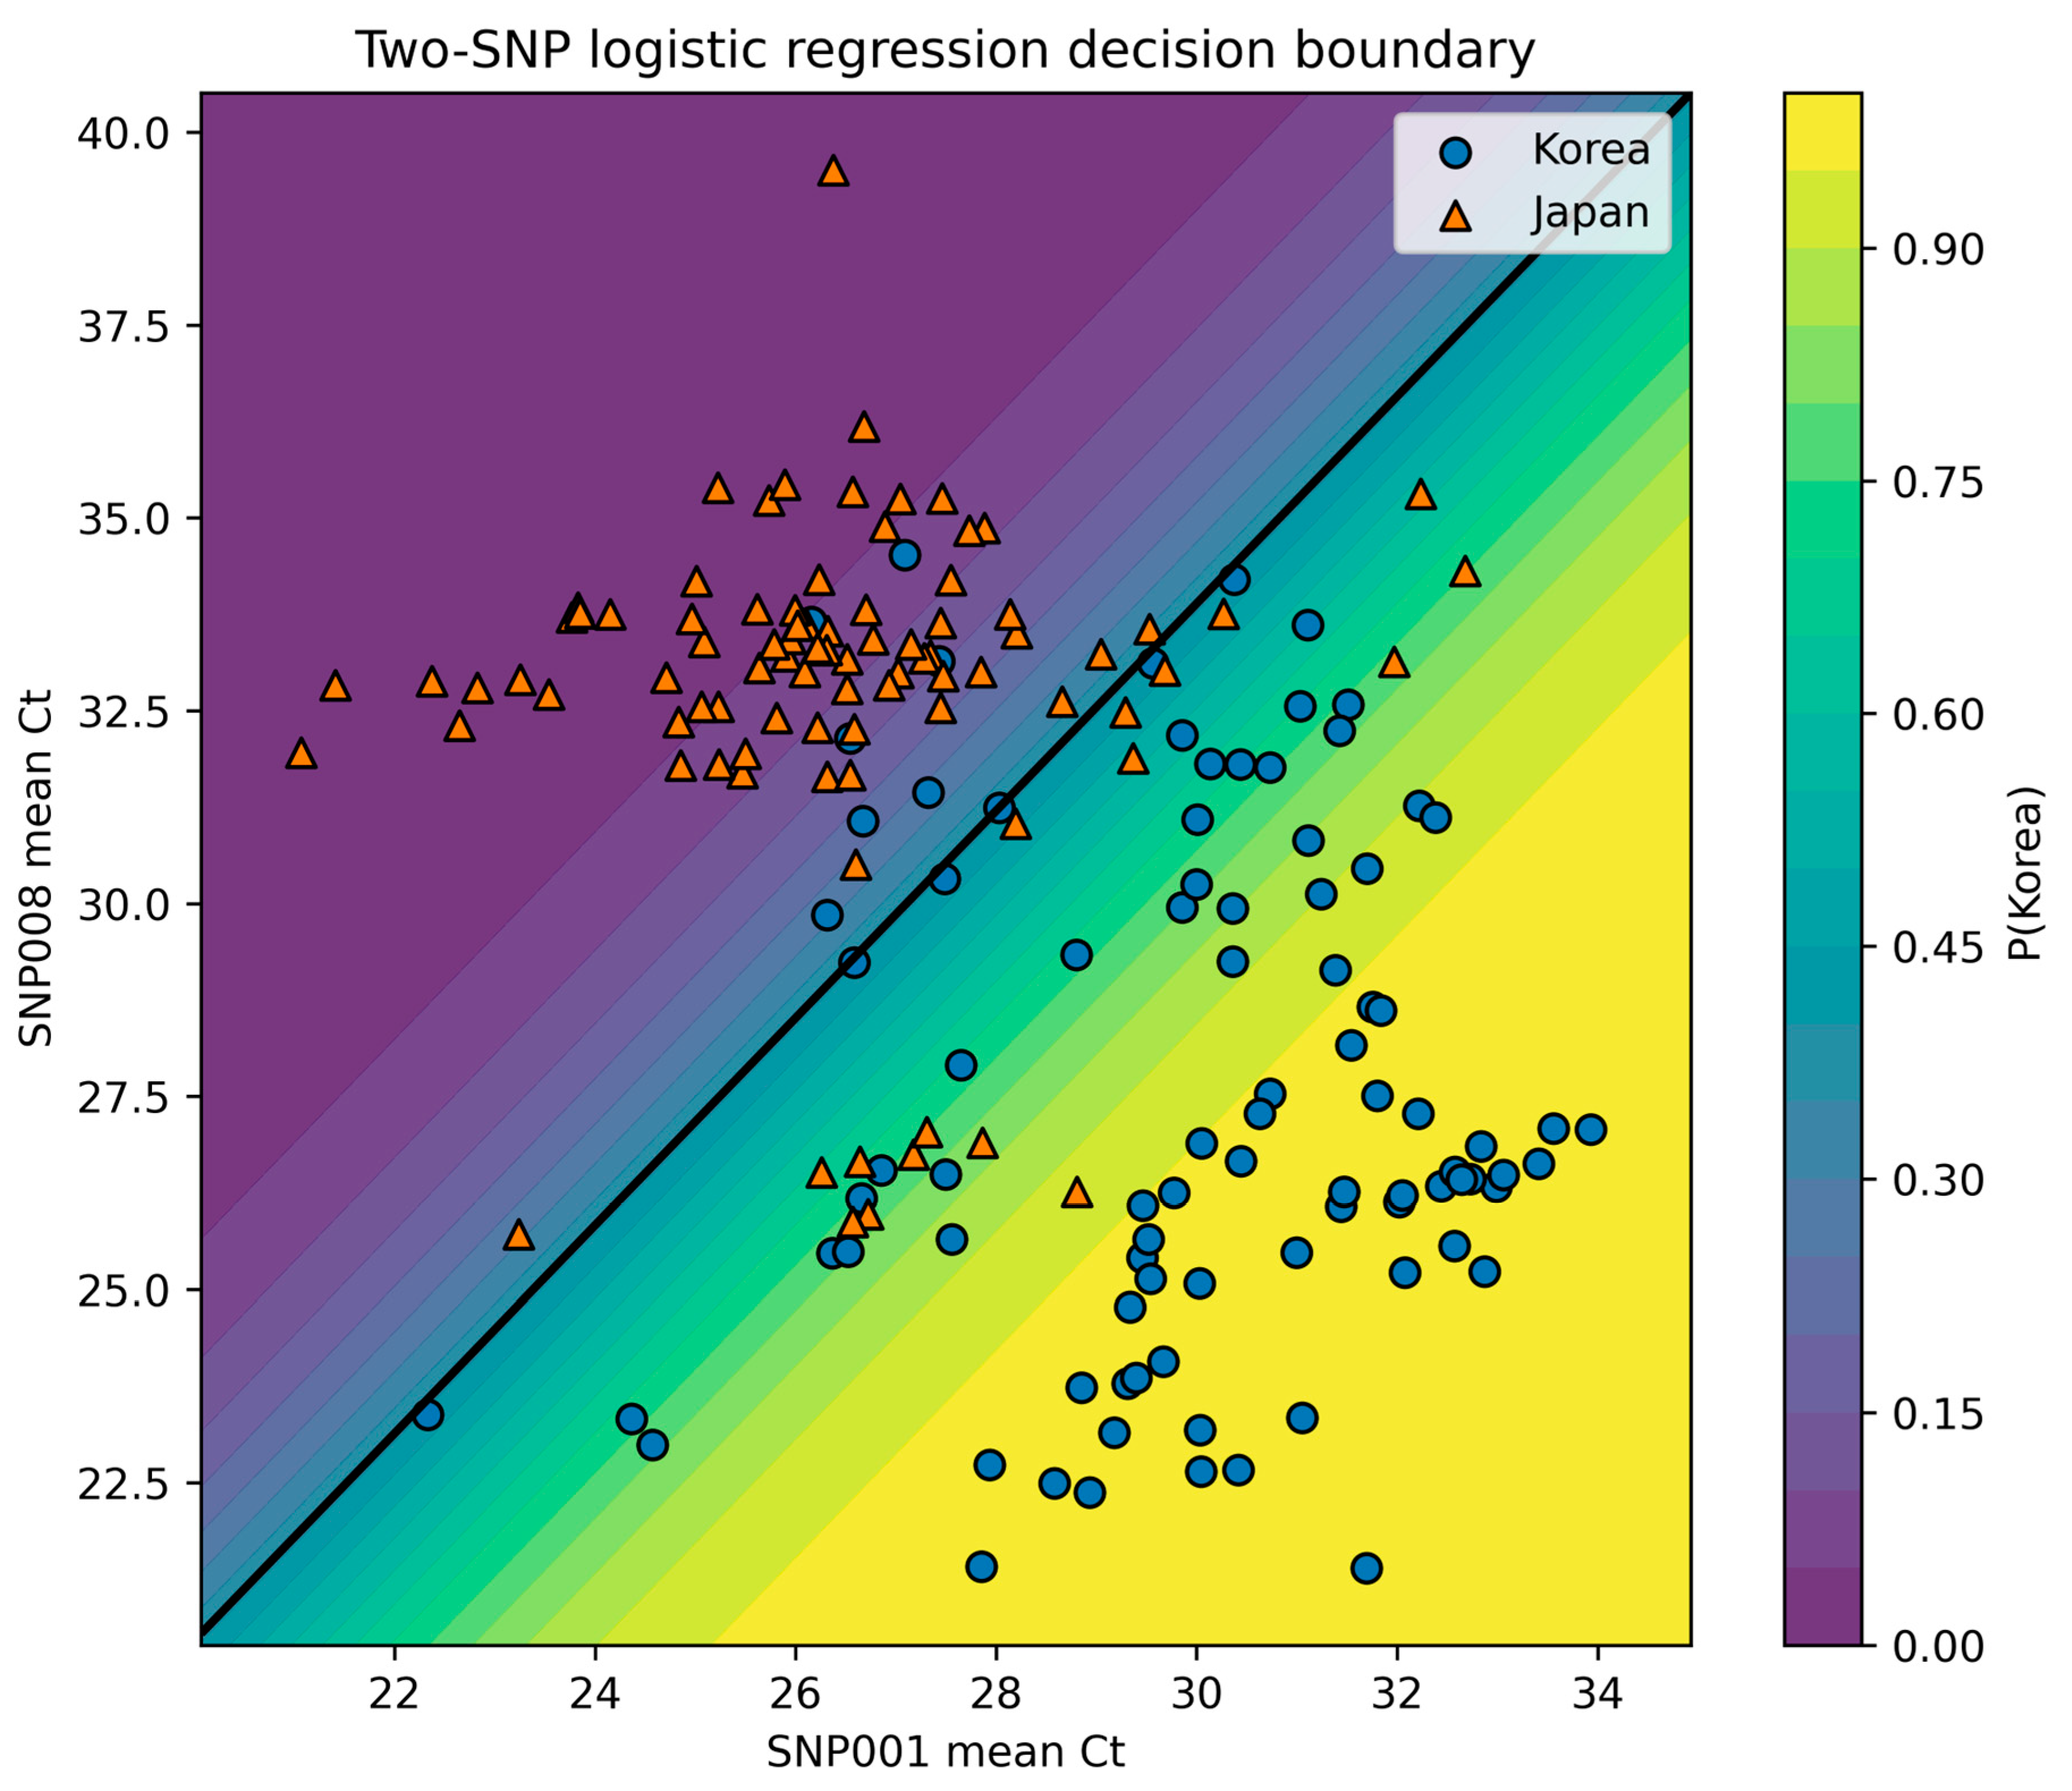
The optimal probability cutoff for the logistic regression model was determined using the Youden index [11]. The cutoff maximizing the balance between sensitivity and specificity was P(Korea) = 0.3869. Therefore, samples with P(Korea) values greater than or equal to 0.3869 were assigned to the Korean reference group, whereas those with P(Korea) values below 0.3869 were assigned to the Japanese reference group. This ROC-optimized cutoff was lower than the default probability threshold of 0.5, with the data-driven threshold selected to balance sensitivity and specificity in the model-development dataset. Korean and Japanese reference-group assignments in this dataset. Because single-marker AUCs were additionally recalculated on the same 178 complete-case samples, the higher observed discrimination of the two-SNP model was retained under a direct like-for-like comparison. At the same time, this cutoff was derived from the model-development dataset and should therefore be interpreted as a dataset-specific decision threshold that requires further evaluation in additional independently sourced samples.
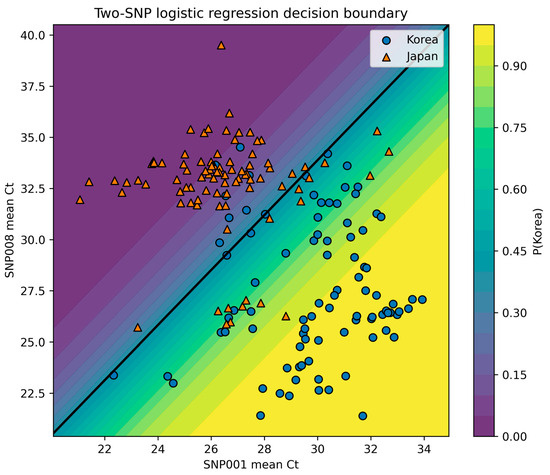
The logistic decision boundary based on this cutoff is shown in Figure 2. The boundary illustrates how SNP001 and SNP008 mean Ct values were jointly used to assign samples to Korean or Japanese reference groups. Compared with single-marker interpretation, the two-dimensional decision boundary provides a more informative classification rule because it considers the combined contribution of both markers rather than applying separate marker-level cutoffs [6]. These findings support the use of a two-SNP mean Ct-based logistic regression model as a compact statistical extension of the previously developed AS-qPCR assay.
Figure 2.
Decision boundary of the two-SNP logistic regression model based on SNP001 and SNP008 mean Ct values. Points represent Korean and Japanese reference samples, and the background indicates the predicted probability of assignment to the Korean reference group, P(Korea). The black line represents the decision boundary at P(Korea) = 0.3869.
3.3. Classification Performance and Cross-Validation
Using the Youden index-based probability cutoff of P(Korea) = 0.3869, the two-SNP logistic regression model was applied to assign samples to the Korean or Japanese reference group. The resulting confusion matrix showed that 83 of 90 Korean samples and 72 of 88 Japanese samples were correctly classified, whereas 7 Korean samples were assigned to the Japanese reference group and 16 Japanese samples were assigned to the Korean reference group. Based on these classifications, the model achieved an accuracy of 87.08% (95% CI, 81.36–91.23%), sensitivity of 92.22% (95% CI, 84.81–96.18%), and specificity of 81.82% (95% CI, 72.49–88.49%) (Table 1). Because both model fitting and probability cutoff optimization were performed using the model-development dataset, these values represent apparent classification performance. Because Korea was defined as the positive class, sensitivity represented the proportion of Korean samples correctly assigned to the Korean reference group, whereas specificity represented the proportion of Japanese samples correctly assigned to the Japanese reference group.
To further evaluate internal predictive performance, repeated stratified 10-fold cross-validation was performed. The mean cross-validated AUC was 0.9396 ± 0.0580, which was close to the full-data AUC of 0.943. The mean cross-validated accuracy, sensitivity, and specificity were 84.25 ± 8.54%, 85.44 ± 13.94%, and 82.99 ± 12.13%, respectively. Across the 100 held-out evaluations, the mean AUC remained close to the full-data AUC, although the observed variability in the cross-validated performance metrics, particularly sensitivity, indicates uncertainty across data partitions. This internal validation was conditional on the two prespecified SNP markers and did not repeat the marker-selection process performed in the original AS-qPCR study [1].
Calibration was additionally assessed using the mean held-out P(Korea) value obtained for each sample across the 10 cross-validation repeats. The cross-validated Brier score was 0.1014. The calibration plot showed deviations from perfect calibration in some intermediate probability ranges (Figure S1), indicating that the predicted probabilities should be interpreted with caution as absolute probability estimates.
These results indicate that combining SNP001 and SNP008 mean Ct values into a single probability-based classifier showed higher observed discrimination than either single-marker model when evaluated using the same 178 complete-case samples. At the optimized cutoff, sensitivity for the Korean reference group was higher than specificity for the Japanese reference group in the model-development dataset. Nevertheless, the cross-validation results should be interpreted as internal validation of the model-development dataset rather than evidence of performance in independent samples. The performance of the fixed model in separately obtained market-sourced samples was therefore examined separately using the separately collected market-sourced confirmation set.
3.4. Ct Variability Assessment and Market-Sourced Confirmation
Because qPCR measurements were performed in triplicate, we further examined whether replicate-level technical variability contributed additional discriminatory information beyond mean Ct values. Three feature sets were compared using repeated stratified 10-fold cross-validation: mean Ct only, mean Ct plus Ct standard deviation (SD), and mean Ct plus Ct coefficient of variation (CV). The mean-only model showed an AUC of 0.9396 ± 0.0580, whereas the mean plus Ct SD and mean plus Ct CV models showed AUC values of 0.9336 ± 0.0595 and 0.9303 ± 0.0613, respectively. The mean Ct-only model therefore showed the highest mean cross-validated AUC among the three feature sets. Thus, inclusion of Ct SD or CV did not improve mean cross-validated discrimination. This result indicates that replicate-level Ct variability provided little additional discriminatory information beyond the two mean Ct predictors and supports the use of the simpler mean Ct-based logistic regression model.
To further examine the practical applicability of the fixed logistic regression model, a separately collected market-sourced confirmation experiment was performed using 20 red seabream samples that were not included in the model-development dataset. Ten samples were purchased in Masan, Korea, and 10 were purchased in Matsuyama, Japan. Because farm-, supplier-, or traceability-level documentation confirming the geographical origin of individual specimens was unavailable, country-of-purchase labels were used as the reference labels for this confirmation analysis. Accordingly, these samples should not be interpreted as a provenance-verified external validation set. The predefined logistic regression equation and the Youden index-based probability cutoff of P(Korea) = 0.3869 were applied without model retraining or cutoff reoptimization. Complete two-marker mean Ct data were obtained for 18 of the 20 samples, corresponding to an evaluability of 90.00% (95% CI, 69.90–97.21%), and 13 of these 18 evaluable samples were correctly assigned. The accuracy among evaluable samples was 72.22% (95% CI, 49.13–87.50%), with a sensitivity of 77.78% (95% CI, 45.26–93.68%) for samples labeled as Korean by country of purchase and a specificity of 66.67% (95% CI, 35.42–87.94%) for samples labeled as Japanese by country of purchase. The overall correct-assignment yield was 65.00% (13/20; 95% CI, 43.29–81.88%). Two samples were not evaluated because complete SNP008 mean Ct data were unavailable. Because both marker measurements are required to calculate P(Korea), samples lacking a valid mean Ct value for either marker cannot be assigned by the present two-marker model unless valid measurements are subsequently obtained.
The lower performance observed in this small market-sourced confirmation set, compared with the model-development and cross-validation results, indicates that classification performance may vary when the fixed model is applied to separately collected samples. The relatively wide confidence intervals further reflect the uncertainty associated with the small number of evaluable confirmation samples. In addition, because the reference labels were based on country of purchase rather than independently verified geographical origin, the observed performance should be interpreted as agreement with country-of-purchase labels rather than as validated geographical-origin accuracy. This finding supports interpreting the classifier as a reference-group assignment tool rather than as a definitive geographical-origin diagnostic assay.
The difference between the market-sourced confirmation results and the model-development and cross-validation results also indicates that internal discrimination does not necessarily translate directly to separately collected samples. This discrepancy may reflect biological heterogeneity, sampling differences, or assay-level variation that was not fully represented in the model-development dataset. Because mean Ct values are quantitative assay measurements, differences among assay batches or other analytical conditions may also affect probability estimates and should be evaluated in future multi-batch and multi-site validation studies. Accordingly, the present two-SNP model should be considered a compact reference-group assignment framework rather than a definitive geographical-origin diagnostic assay. Furthermore, the P(Korea) cutoff of 0.3869 was optimized within the model-development dataset and should not be regarded as a universally transferable threshold. Its operating characteristics may vary with population composition and assay conditions. Although the unchanged equation and cutoff were applied to the market-sourced confirmation samples without retraining or reoptimization, broader validation using provenance-verified samples is required before routine application.
4. Conclusions
Overall, the two-SNP logistic regression model provided a compact and interpretable approach for integrating SNP001 and SNP008 mean Ct values for assigning red seabream to Korean and Japanese reference groups. The combined model showed higher discriminatory performance than either single-marker model when evaluated using the same 178 complete-case samples, while inclusion of Ct SD or Ct CV did not improve cross-validated performance. Repeated stratified cross-validation supported the internal discriminatory performance of the model, whereas the lower accuracy observed in the small separately collected market-sourced confirmation set, together with its wide confidence intervals and two non-evaluable samples, highlighted the need for further evaluation in additional samples with independently verified provenance. Because the confirmation reference labels were based on country of purchase rather than verified geographical origin, the confirmation results should not be interpreted as validation of geographical-origin accuracy. These findings suggest that ROC-optimized logistic modeling provides a practical probability-based framework for integrating AS-qPCR marker information, although the model and its dataset-derived probability cutoff require broader validation using provenance-verified samples across additional populations and assay conditions before routine implementation.
Supplementary Materials
The following supporting information can be downloaded at: https://www.mdpi.com/article/10.3390/fishes11100601/s1, Figure S1: Cross-validated calibration of the two-SNP logistic regression model. Predicted probabilities represent the mean held-out P(Korea) values obtained for each sample across 10 repeats of stratified 10-fold cross-validation. Samples were grouped into five equal-frequency probability groups. The dashed diagonal line represents perfect calibration, and the solid line with markers represents the observed proportion of Korean reference samples within each probability group.
Author Contributions
Conceptualization, Y.B.S.; methodology, Y.B.S.; software, Y.-S.L.; validation, Y.B.S. and Y.-S.L.; formal analysis, Y.-S.L.; investigation, G.-D.K.; resources, Y.B.S.; data curation, Y.-S.L.; writing—original draft preparation, Y.-S.L.; writing—review and editing, Y.B.S. and G.-D.K.; visualization, Y.-S.L.; supervision, Y.B.S.; project administration, G.-D.K.; funding acquisition, G.-D.K. All authors have read and agreed to the published version of the manuscript.
Funding
This research was funded by the Korea Institute of Marine Science & Technology Promotion (KIMST), which is funded by the Ministry of Oceans and Fisheries, grant number RS-2022-KS221671.
Institutional Review Board Statement
The sample used for this study was a dead fish, and as per the animal experimental ethics in the Republic of Korea (Standard operating guideline; IACUC-Institutional Animal Care and Use Committee, Book no. 11-1543061-000457-01, effective from December 2020), it does not require approval from an Ethics Committee.
Data Availability Statement
The qPCR data analyzed in this study were derived from the previously published study [1]. The reconstructed model-development dataset used for statistical analysis, the market-sourced confirmation dataset, and the analysis code supporting the present study are provided in the Supplementary Materials.
Acknowledgments
During the preparation of this manuscript, the authors used ChatGPT v5.5 for the purposes of grammar checking, typographical error correction, and language polishing. The authors have reviewed and edited the output and take full responsibility for the content of this publication.
Conflicts of Interest
The authors declare no conflicts of interest.
References
- Yoo, S.H.; Kim, J.G.; Park, Y.J.; Kim, J.-O.; Seo, Y.B.; Kim, G.-D. A quantitative polymerase chain reaction approach for distinguishing the geographical origin of Pagrus major from Korea and Japan. Food Sci. Biotechnol. 2025, 34, 2657–2666. [Google Scholar] [PubMed]
- Cusa, M.; St John Glew, K.; Trueman, C.; Mariani, S.; Buckley, L.; Neat, F.; Longo, C. A future for seafood point-of-origin testing using DNA and stable isotope signatures. Rev. Fish Biol. Fish. 2022, 32, 597–621. [Google Scholar] [CrossRef] [Scilit]
- Gopi, K.; Mazumder, D.; Sammut, J.; Saintilan, N. Determining the provenance and authenticity of seafood: A review of current methodologies. Trends Food Sci. Technol. 2019, 91, 294–304. [Google Scholar] [CrossRef] [Scilit]
- Prabakaran, I.; Wu, Z.; Lee, C.; Tong, B.; Steeman, S.; Koo, G.; Zhang, P.J.; Guvakova, M.A. Gaussian mixture models for probabilistic classification of breast cancer. Cancer Res. 2019, 79, 3492–3502. [Google Scholar] [CrossRef] [Scilit] [PubMed]
- Pepe, M.S.; Cai, T.; Longton, G. Combining predictors for classification using the area under the receiver operating characteristic curve. Biometrics 2006, 62, 221–229. [Google Scholar] [CrossRef] [Scilit] [PubMed]
- Hosmer, D.W., Jr.; Lemeshow, S.; Sturdivant, R.X. Applied Logistic Regression; John Wiley & Sons: Hoboken, NJ, USA, 2013. [Google Scholar]
- Fawcett, T. An introduction to ROC analysis. Pattern Recognit. Lett. 2006, 27, 861–874. [Google Scholar] [CrossRef] [Scilit]
- Ruopp, M.D.; Perkins, N.J.; Whitcomb, B.W.; Schisterman, E.F. Youden Index and optimal cut-point estimated from observations affected by a lower limit of detection. Biom. J. J. Math. Methods Biosci. 2008, 50, 419–430. [Google Scholar] [CrossRef] [Scilit] [PubMed]
- Bustin, S.A.; Benes, V.; Garson, J.A.; Hellemans, J.; Huggett, J.; Kubista, M.; Mueller, R.; Nolan, T.; Pfaffl, M.W.; Shipley, G.L.; et al. The MIQE Guidelines: Minimum Information for Publication of Quantitative Real-Time PCR Experiments. Clin. Chem. 2009, 55, 611–622. [Google Scholar] [CrossRef] [Scilit] [PubMed]
- Ruiz-Villalba, A.; Ruijter, J.M.; van den Hoff, M.J. Use and misuse of Cq in qPCR data analysis and reporting. Life 2021, 11, 496. [Google Scholar] [CrossRef] [Scilit] [PubMed]
- Youden, W.J. Index for rating diagnostic tests. Cancer 1950, 3, 32–35. [Google Scholar] [CrossRef] [Scilit]
- McKinney, W. pandas: A foundational Python library for data analysis and statistics. Python High Perform. Sci. Comput. 2011, 14, 1–9. [Google Scholar]
- Harris, C.R.; Millman, K.J.; Van Der Walt, S.J.; Gommers, R.; Virtanen, P.; Cournapeau, D.; Wieser, E.; Taylor, J.; Berg, S.; Smith, N.J.; et al. Array programming with NumPy. Nature 2020, 585, 357–362. [Google Scholar] [CrossRef] [Scilit] [PubMed]
- Pedregosa, F.; Varoquaux, G.; Gramfort, A.; Michel, V.; Thirion, B.; Grisel, O.; Blondel, M.; Prettenhofer, P.; Weiss, R.; Dubourg, V.; et al. Scikit-learn: Machine learning in Python. J. Mach. Learn. Res. 2011, 12, 2825–2830. [Google Scholar]

Disclaimer/Publisher’s Note: The statements, opinions and data contained in all publications are solely those of the individual author(s) and contributor(s) and not of MDPI and/or the editor(s). MDPI and/or the editor(s) disclaim responsibility for any injury to people or property resulting from any ideas, methods, instructions or products referred to in the content. |
© 2026 by the authors. Licensee MDPI, Basel, Switzerland. This article is an open access article distributed under the terms and conditions of the Creative Commons Attribution (CC BY) license.