


Abstract
This article presents a novel framework for encrypting color images to enhance digital data security using deep learning and artificial intelligence techniques. The system employs a two-model neural architecture: the first, a Convolutional Neural Network (CNN), verifies sender authenticity during user authentication, while the second extracts unique fingerprint features. These features are converted into high-entropy encryption keys using Particle Swarm Optimization (PSO), minimizing key similarity and ensuring that no key is reused or transmitted. Keys are generated in real time simultaneously at both the sender and receiver ends, preventing interception or leakage and providing maximum confidentiality. Encrypted images are secured using the Advanced Encryption Standard (AES-256) with keys uniquely bound to each user’s biometric identity, ensuring personalized privacy. Evaluation using security and encryption metrics yielded strong results: entropy of 7.9991, correlation coefficient below 0.00001, NPCR of 99.66%, UACI of 33.9069%, and key space of 2256. Although the final encryption employs an AES-256 key (key space of 2256), this key is derived from a much larger deep-key space of 28192 generated by multi-layer neural feature extraction and optimized via PSO, thereby significantly enhancing the overall cryptographic strength. The system also demonstrated robustness against common attacks, including noise and cropping, while maintaining recoverable original content. Furthermore, the neural models achieved classification accuracy exceeding 99.83% with an error rate below 0.05%, confirming the framework’s reliability and practical applicability. This approach provides a secure, dynamic, and efficient image encryption paradigm, combining biometric authentication and AI-based feature extraction for advanced cybersecurity applications.
1. Introduction
We rely more and more on digital media and data transmission across modern networks, thus it is important to protect digital information from unauthorized access [1]. To keep visual data safe, encryption is necessary. The idea is to make it impossible to read the original image until the proper key is pressed. Because of this [2], the data stays secret and cannot be changed or stolen. AES, DES, and XOR are examples of traditional encryption methods that have a lot of problems. The most important thing about them is that they employ fixed or randomly generated keys that do not rely on the picture’s main features. Because of this constraint [3], the system may not be as safe against pattern analysis and brute-force attacks. Some older encryption algorithms may have had problems with data loss or worse image quality following encryption and decryption [4]. To make encryption safer, you should look at new AI and deep learning techniques [5]. We can make photographs more resistant to cryptographic assaults by using CNNs to extract features and the PSO approach to improve encryption keys. Because of this, each picture will have a high entropy and be one of a kind [6]. This article presents a unique method for photo encryption and decryption that maintains image quality via the integration of CNNs with PSO. The objective is to create a strong and unique AES key for each photo. We may look forward to new scientific discoveries on how to protect digital data, a better encryption method that works with more types of photos, and a big step forward in security compared to prior methods [7].
AES is one of the most popular systems of its type because it is so hard to break using brute-force attacks. Why? Because its base is built on methods that employ permutations and substitutions [8]. The XOR approach is straightforward and fast, but it does not work well with short keys or patterns that repeat [9]. The DES algorithm, which was formerly an important part of early encryption technologies, is not good enough for today’s security demands since its key length is too short and it is vulnerable to parallel computing assaults [10]. Traditional methods work, but they put the security of certain mission-critical applications at risk because they employ static or random keys that do not take into consideration the unique features of the encrypted pictures [11].
CNNs, on the other hand, are great at processing pictures because they can recognize patterns and features very well [12]. This capability has been employed in security applications like fingerprint identification and face recognition, but it is still not widely used for generating encryption keys [13]. Identifying unique traits using CNNs might lead to better and more data-connected encryption keys, which could make the data safer [14]. But when it comes to hard areas, the PSO approach has been quite good at finding the best solutions and optimizing parameters [15]. Some of its uses are to make neural networks operate better, tweak algorithm settings, and create hybrid encryption systems [16]. PSO is a suitable option for improving encryption keys because it can adapt to different space exploration needs [17]. This lets it keep a lot of randomness while making the keys less alike. The literature does not present a cohesive methodology that amalgamates the advantages of CNNs for feature extraction, PSO for feature optimization to produce optimal encryption keys, and the subsequent incorporation of these keys into the prevalent AES algorithm for enhanced security [6]. This clearly shows that further study needs to be done in this area. We believe that this gap calls for the creation of a new research paradigm for photo encryption that makes full use of AI and deep learning methods. Table 1 shows the main results and shows how this research is better than and different from earlier ones.
Table 1.
Summarizes the most relevant studies and highlights the features and innovations that distinguish the current research from them.
This study may utilize a person’s fingerprint to build an encryption key, which would let them communicate private photographs to someone else. The first thing you should do to verify the sender’s identity is to look it up in the main CNN model. The second model employs fingerprint data to produce an encryption key once authentication is done. To protect the secret picture, an AES key is created and utilized. This guarantees the greatest degree of data protection and privacy. Combining the speed of AES encryption with the capacity of deep learning to find unique fingerprint traits makes dynamic and user-specific keys. Because of this, the data that was delivered is kept hidden, and it is difficult to attack. Even if past attempts have made encryption better, the problem of producing picture-specific AES keys utilizing a mix of CNN feature extraction, PSO optimization, and direct application has not been addressed. This initiative is new because it wants to fill a gap in knowledge.
This study also has these additional things:
- (1)
- Proposing a dynamic mechanism for AES key generation based on deep features extracted from images using Convolutional Neural Networks (CNNs), thereby directly linking the encryption key to the image content.
- (2)
- Integrating the Particle Swarm Optimization (PSO) algorithm to optimize the generated encryption keys, ensuring high entropy levels and reduced statistical correlation between successive keys.
- (3)
- Introducing a key management model that does not require key storage, transmission, or reuse, where a unique key is generated for each transmission, thereby enhancing security against key interception attacks.
- (4)
- Adding an independent security layer on top of the standard AES framework without affecting its internal structure or proven cryptographic efficiency.
- (5)
- Demonstrating the effectiveness of the proposed framework through experimental evaluations and benchmark comparisons, showing improved resistance to brute-force attacks and pattern analysis compared to conventional approaches.
The article is organized as follows: Section 1 provides the introduction, which includes Section 2, the background, and Section 3, the research objective, outlining the motivation, problem statement, and purpose of the study. Section 4 describes the methodology, detailing the theoretical framework, model architecture, and implementation procedures adopted in the proposed encryption framework. Section 5 presents the results and analysis, including the performance evaluation of the neural models, encryption metrics, and comparative assessments demonstrating the system’s effectiveness. Finally, Section 6 delivers the conclusion, summarizing the key findings and offering recommendations for future research directions aimed at enhancing the proposed system’s scalability and adaptability to emerging security challenges
2. Theoretical Background
This section reviews the theoretical foundations of the proposed image encryption framework, focusing on classical techniques and the integration of artificial intelligence to enhance security.
2.1. Image Encryption
Image encryption is a basic part of information security since it changes original images into a format that cannot be understood and can only be put back together with the right decryption key. In this case, traditional algorithms like AES, DES, and XOR have been used [24]. But these methods have problems since they use fixed key structures and may find patterns, which makes the overall security weaker. So, there has been a rising demand to combine encryption with artificial intelligence approaches to make randomness and privacy better [25].
2.2. Convolutional Neural Networks (CNNs)
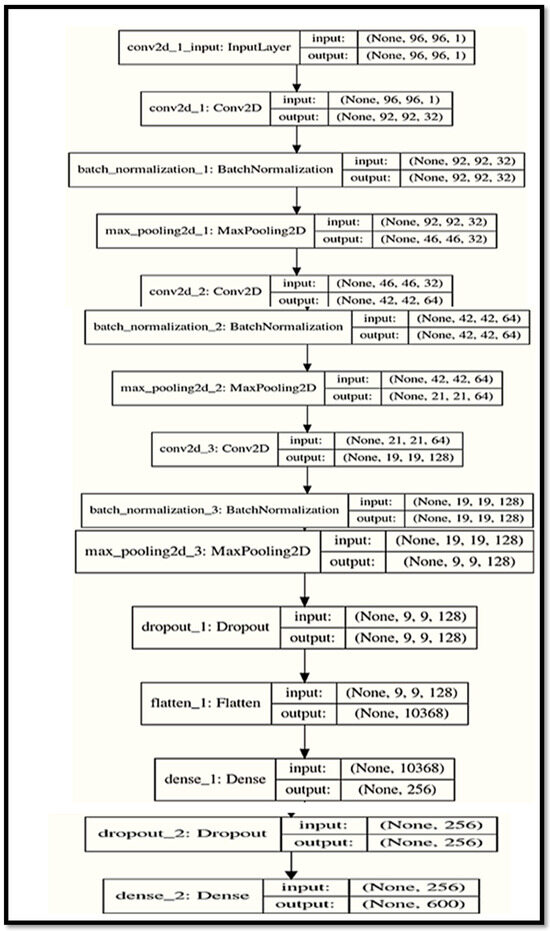
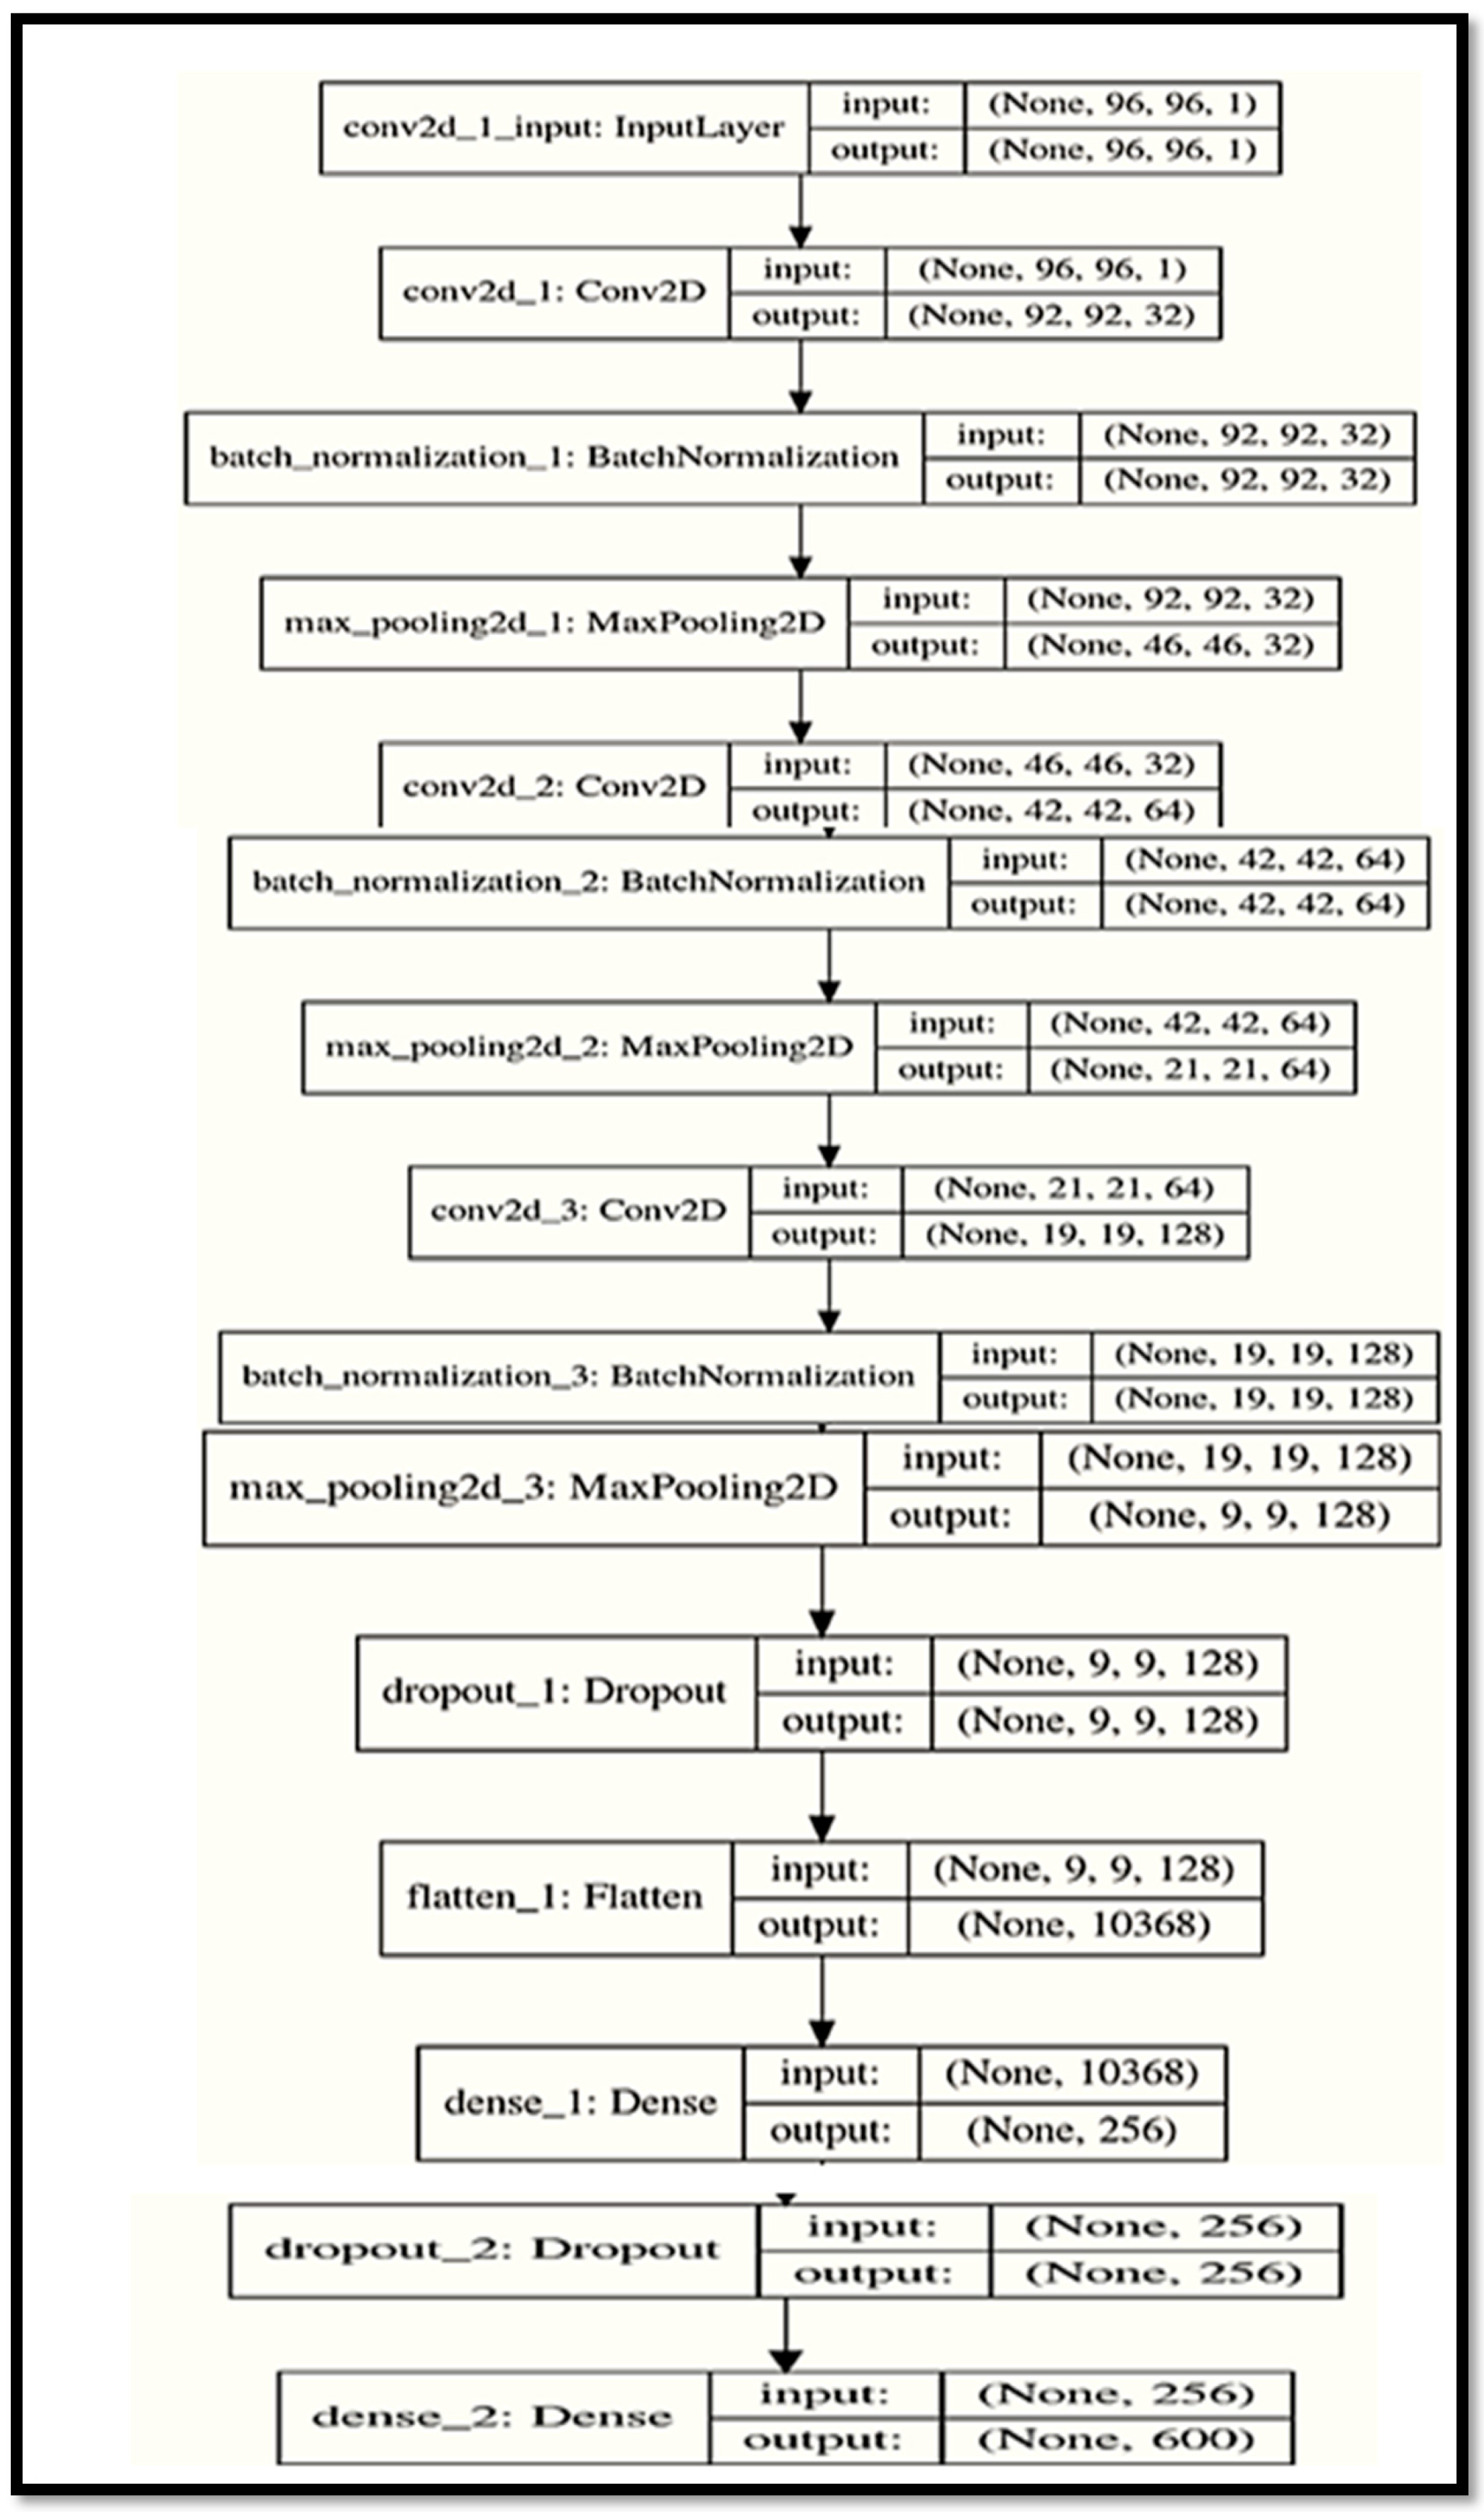
This is because they can learn features from visual input on their own, thus there is no need for humans to do feature engineering [26]. CNNs commonly link convolutional layers that can find edges, textures, and basic forms in pictures so that they can find local patterns. After that, pooling layers maintain the most important information and make the data less complex. Because of this, the model is stronger and easier to figure out as the items in the image move about [27]. You can make an accurate feature vector that shows the picture’s properties by putting the derived representations into fully connected layers that combine the features you got [28]. CNNs may help with picture identification and classification, but they can also build encryption keys by looking at each image’s unique features. The features taken from the photographs are always changing, thus it is hard to guess what keys will be made. This strategy is less likely to lead to repetition or key prediction than more traditional methods [14]. This study employs two CNN models to decipher fingerprint images. Check out Figure 1 to see how many levels there are, what sorts of layers there are, and how each layer takes features from the image. It also gives a summary of how all the models utilized in this research were made.
Figure 1.
Components of CNN models used.
The initial model figures out who someone is by looking at their ID number. The second model gets the detailed fingerprint attributes when the identification check is done. They both use convolutional layers to automatically and progressively pull out essential features from the input data. This makes things more efficient and helps build strong encryption keys by looking at minor visual patterns. The two models are trained using the backpropagation method, using loss functions that are specific to each task. This idea uses the unique identifier in the file name to accurately identify the fingerprint’s owner.
2.3. Theoretical Background on PSO
PSO is one of the most widely recognized swarm intelligence algorithms, initially introduced in 1995 by Kennedy and Eberhartp [29]. The fundamental idea of PSO is inspired by collective behaviors observed in nature, such as bird flocking or fish schooling during migration or foraging, where particles cooperate to converge toward the global optimum [30]. In this algorithm, each potential solution is represented as a particle that moves within the search space. The movement of each particle is guided by two main factors:
- (1)
- Personal Best (pBest): The best solution identified by the particle itself.
- (2)
- Global Best (gBest): The best solution found by the entire swarm [31]. The velocity and position of each particle are updated using dynamic mathematical equations, most notably
vi(t + 1) = w × vi(t) + c1 × r1 × (pBesti − xi(t)) + c2 × r2 × (gBest − xi(t))
xi(t + 1) = xi(t) + vi(t + 1)
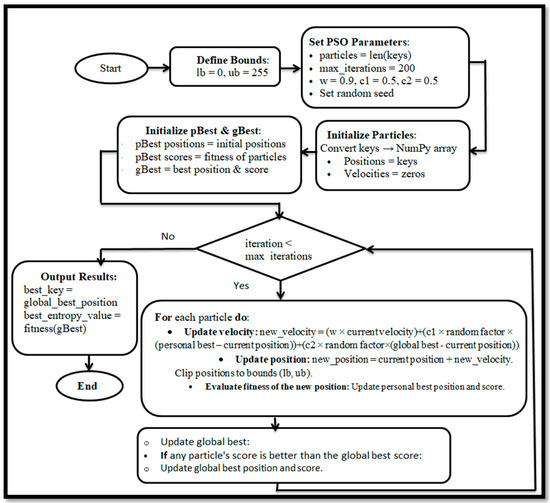
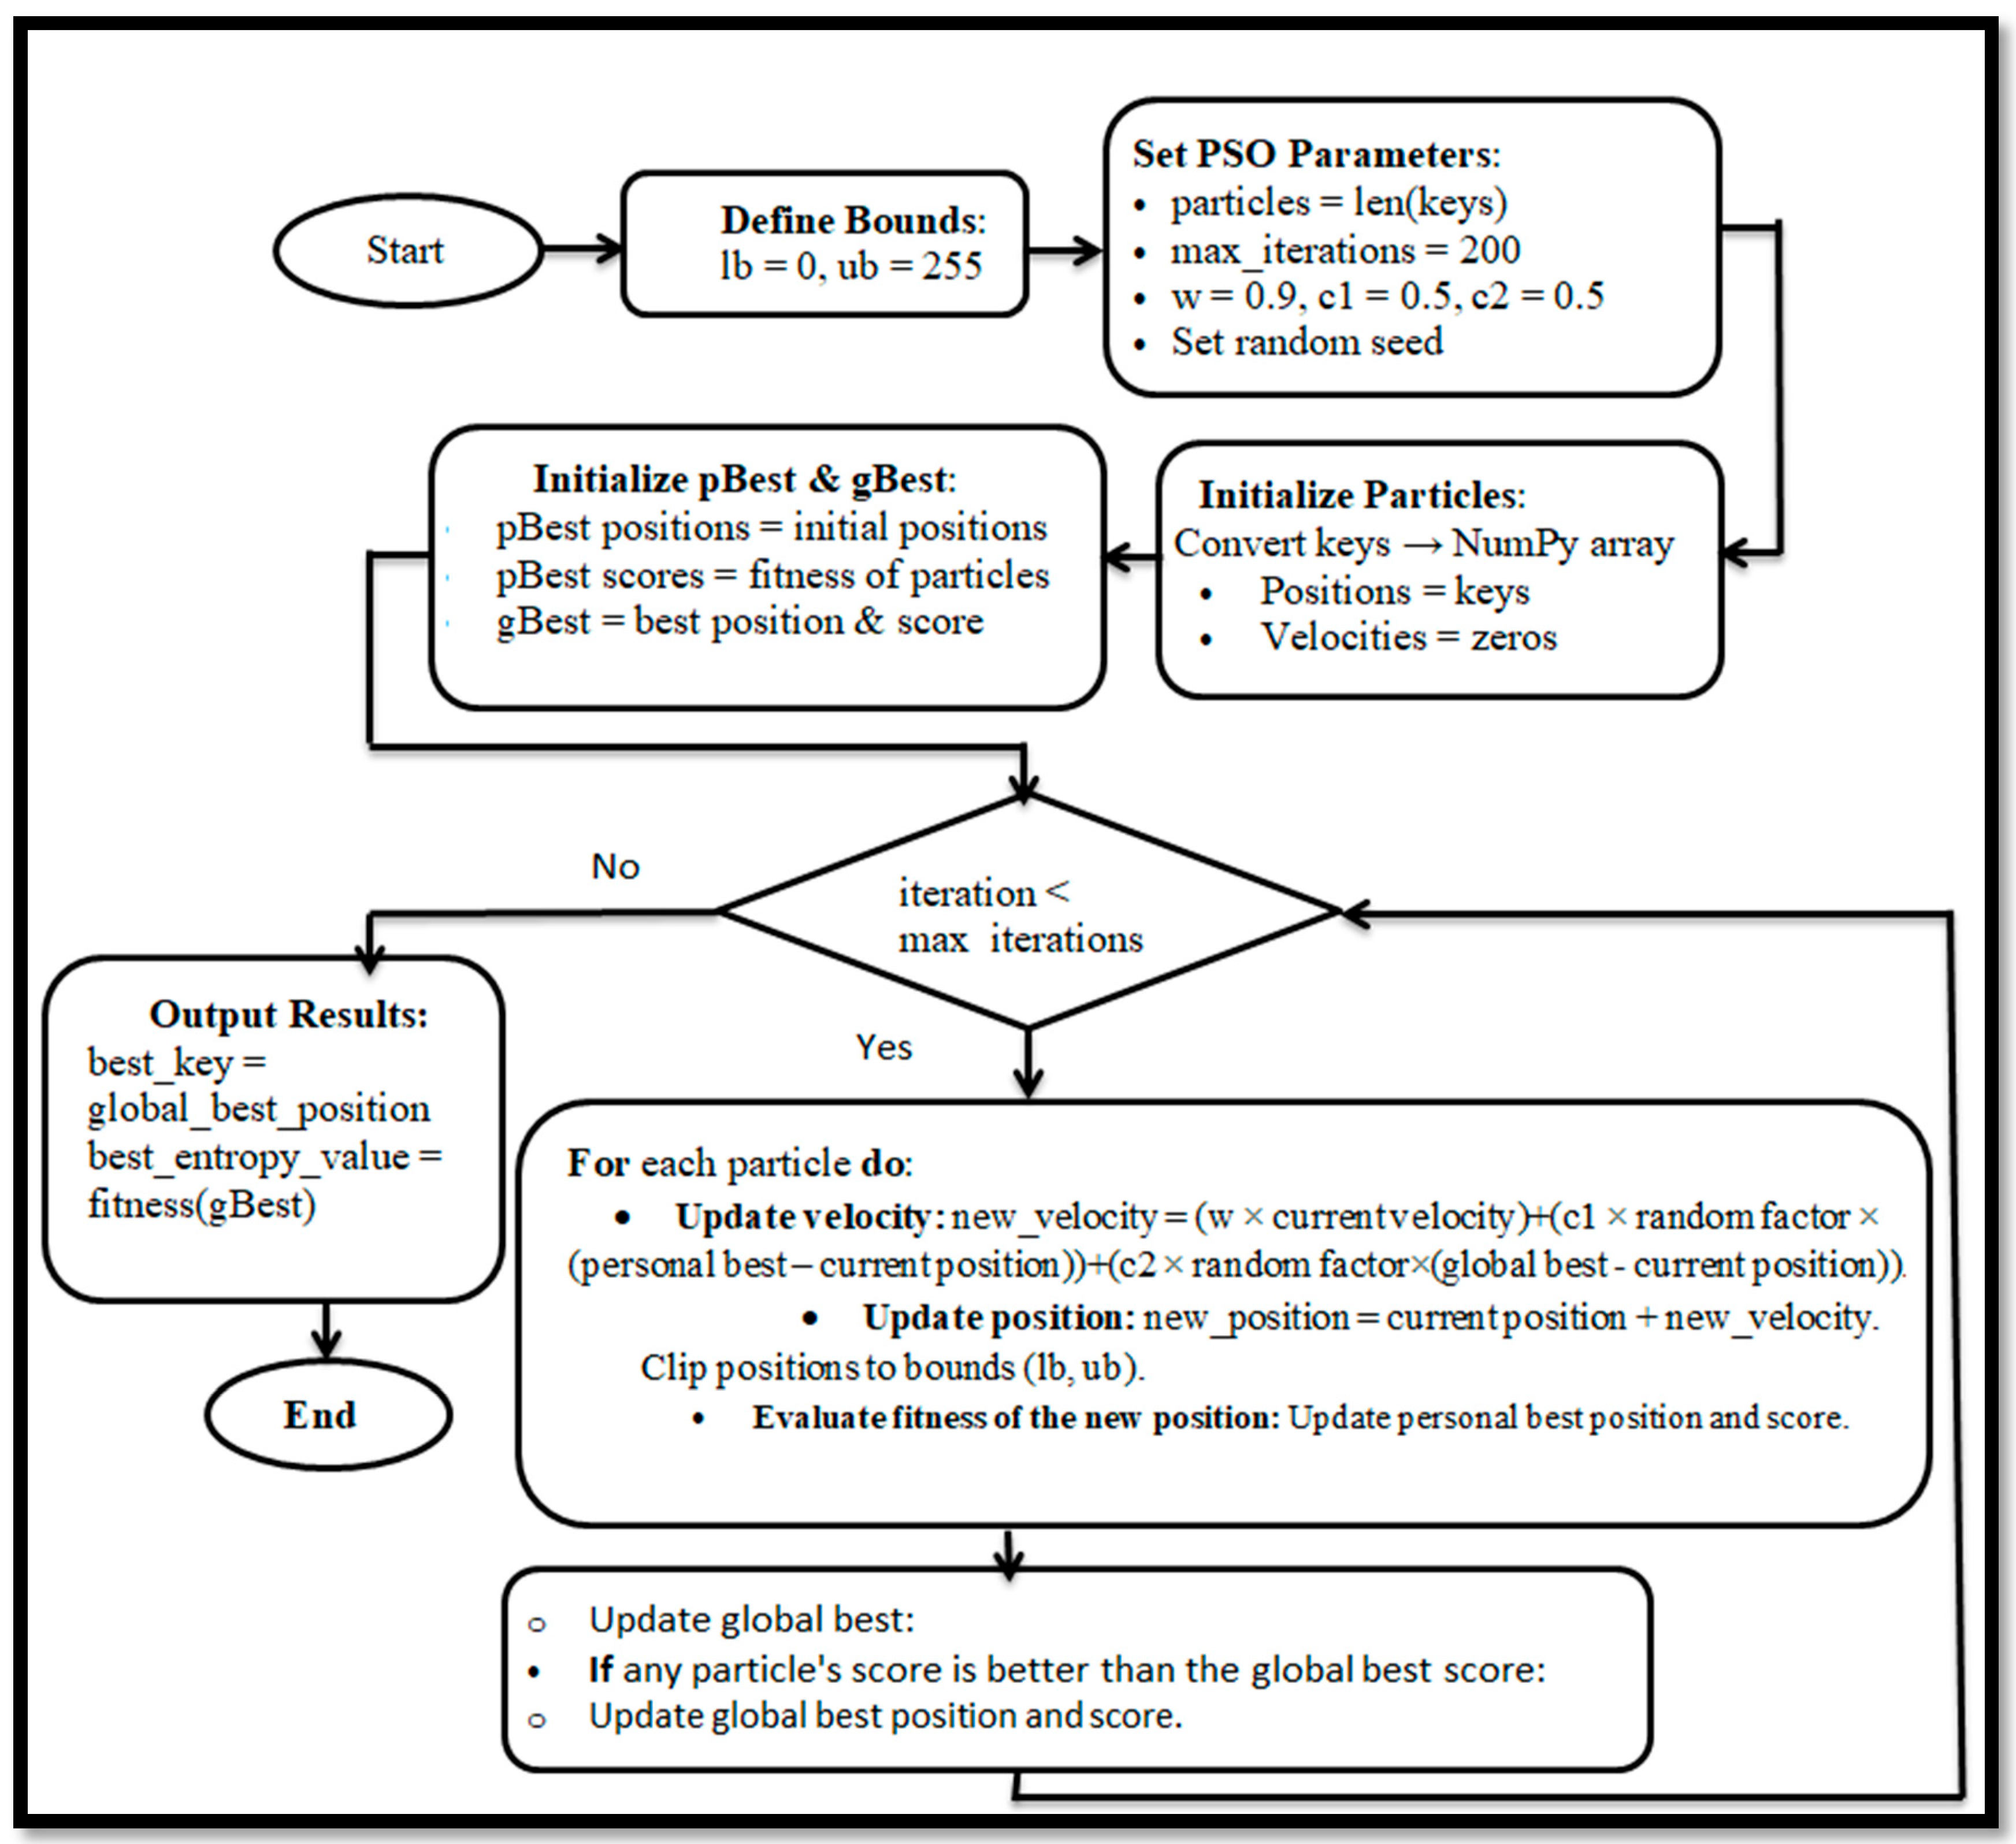
In this case, xi is the particle’s position, vi is its speed, and www is the inertia weight that controls the balance between exploration and exploitation. Parameters c1 and c2 control how individual and group experiences affect the movement of particles on the solution space and progressively move toward the best placements when the position update is included in the iterative process. This is possible because they learn both individually and as a group [32]. PSO improves key generation for image encryption by changing the positions of particles, which stand for potential encryption keys, over and over again until it finds the optimum safe solution [33]. This makes the recommended encryption method stronger and protects it from both classic and new cryptographic attacks [34]. Figure 2 displays the flow diagram of the process for optimizing encryption keys using the PSO approach.
Figure 2.
Flowchart of the PSO-based encryption key optimization process.
2.4. Fitness Function for PSO in Key Generation
In the proposed PSO-based optimization for image encryption, the fitness function is defined as the Shannon entropy of the generated encryption key. This ensures that each key is highly random, unpredictable, and resistant to statistical attacks. The entropy (H) is calculated as follows:
where p(xi) is the probability distribution of the value xi in the key. If the entropy equals 8 bits, it means the key is completely random. The PSO algorithm iteratively updates particle positions, each particle representing a potential key to maximize the entropy-based fitness function. This process ensures that the selected keys are adaptive, unique for each transmission, and not permanently stored, thereby enhancing the overall security of the encryption system.
3. Research Objective
This research aims to develop a robust framework for digital image encryption based on deep learning and artificial intelligence, with the goal of enhancing data security and achieving a high level of confidentiality without relying on traditional key exchange. The proposed system employs two neural models: the first for user authentication, and the second for extracting fingerprint features and converting them into high-entropy encryption keys using Particle Swarm Optimization (PSO), which are then applied with the Advanced Encryption Standard (AES-256) [35] to secure images. The main objective is to integrate artificial intelligence with traditional encryption methods to generate dynamic and unique keys in real time, preventing interception or reuse while providing strong resistance to differential and statistical attacks. The research also seeks to enhance performance and classification accuracy, as the neural models achieved an accuracy exceeding 99.83% with an error rate below 0.05%, confirming the system’s reliability and practical applicability. This framework aims to establish an intelligent and dynamic encryption model that combines biometric identity, deep learning, and optimization algorithms, making it applicable to diverse fields such as cloud systems, the Internet of Things (IoT), and military communications, while being resilient to future quantum computing threats. It represents a significant step toward a new generation of secure, self-learning encryption systems.
4. Proposed System
The proposed encryption system consists of two main stages: the encryption stage and the decryption stage. Each stage represents a fundamental component in the system’s operation to ensure data confidentiality and integrity. Below, the details of each stage are presented, and their steps are explained in a systematic and precise manner.
4.1. Encryption Stage
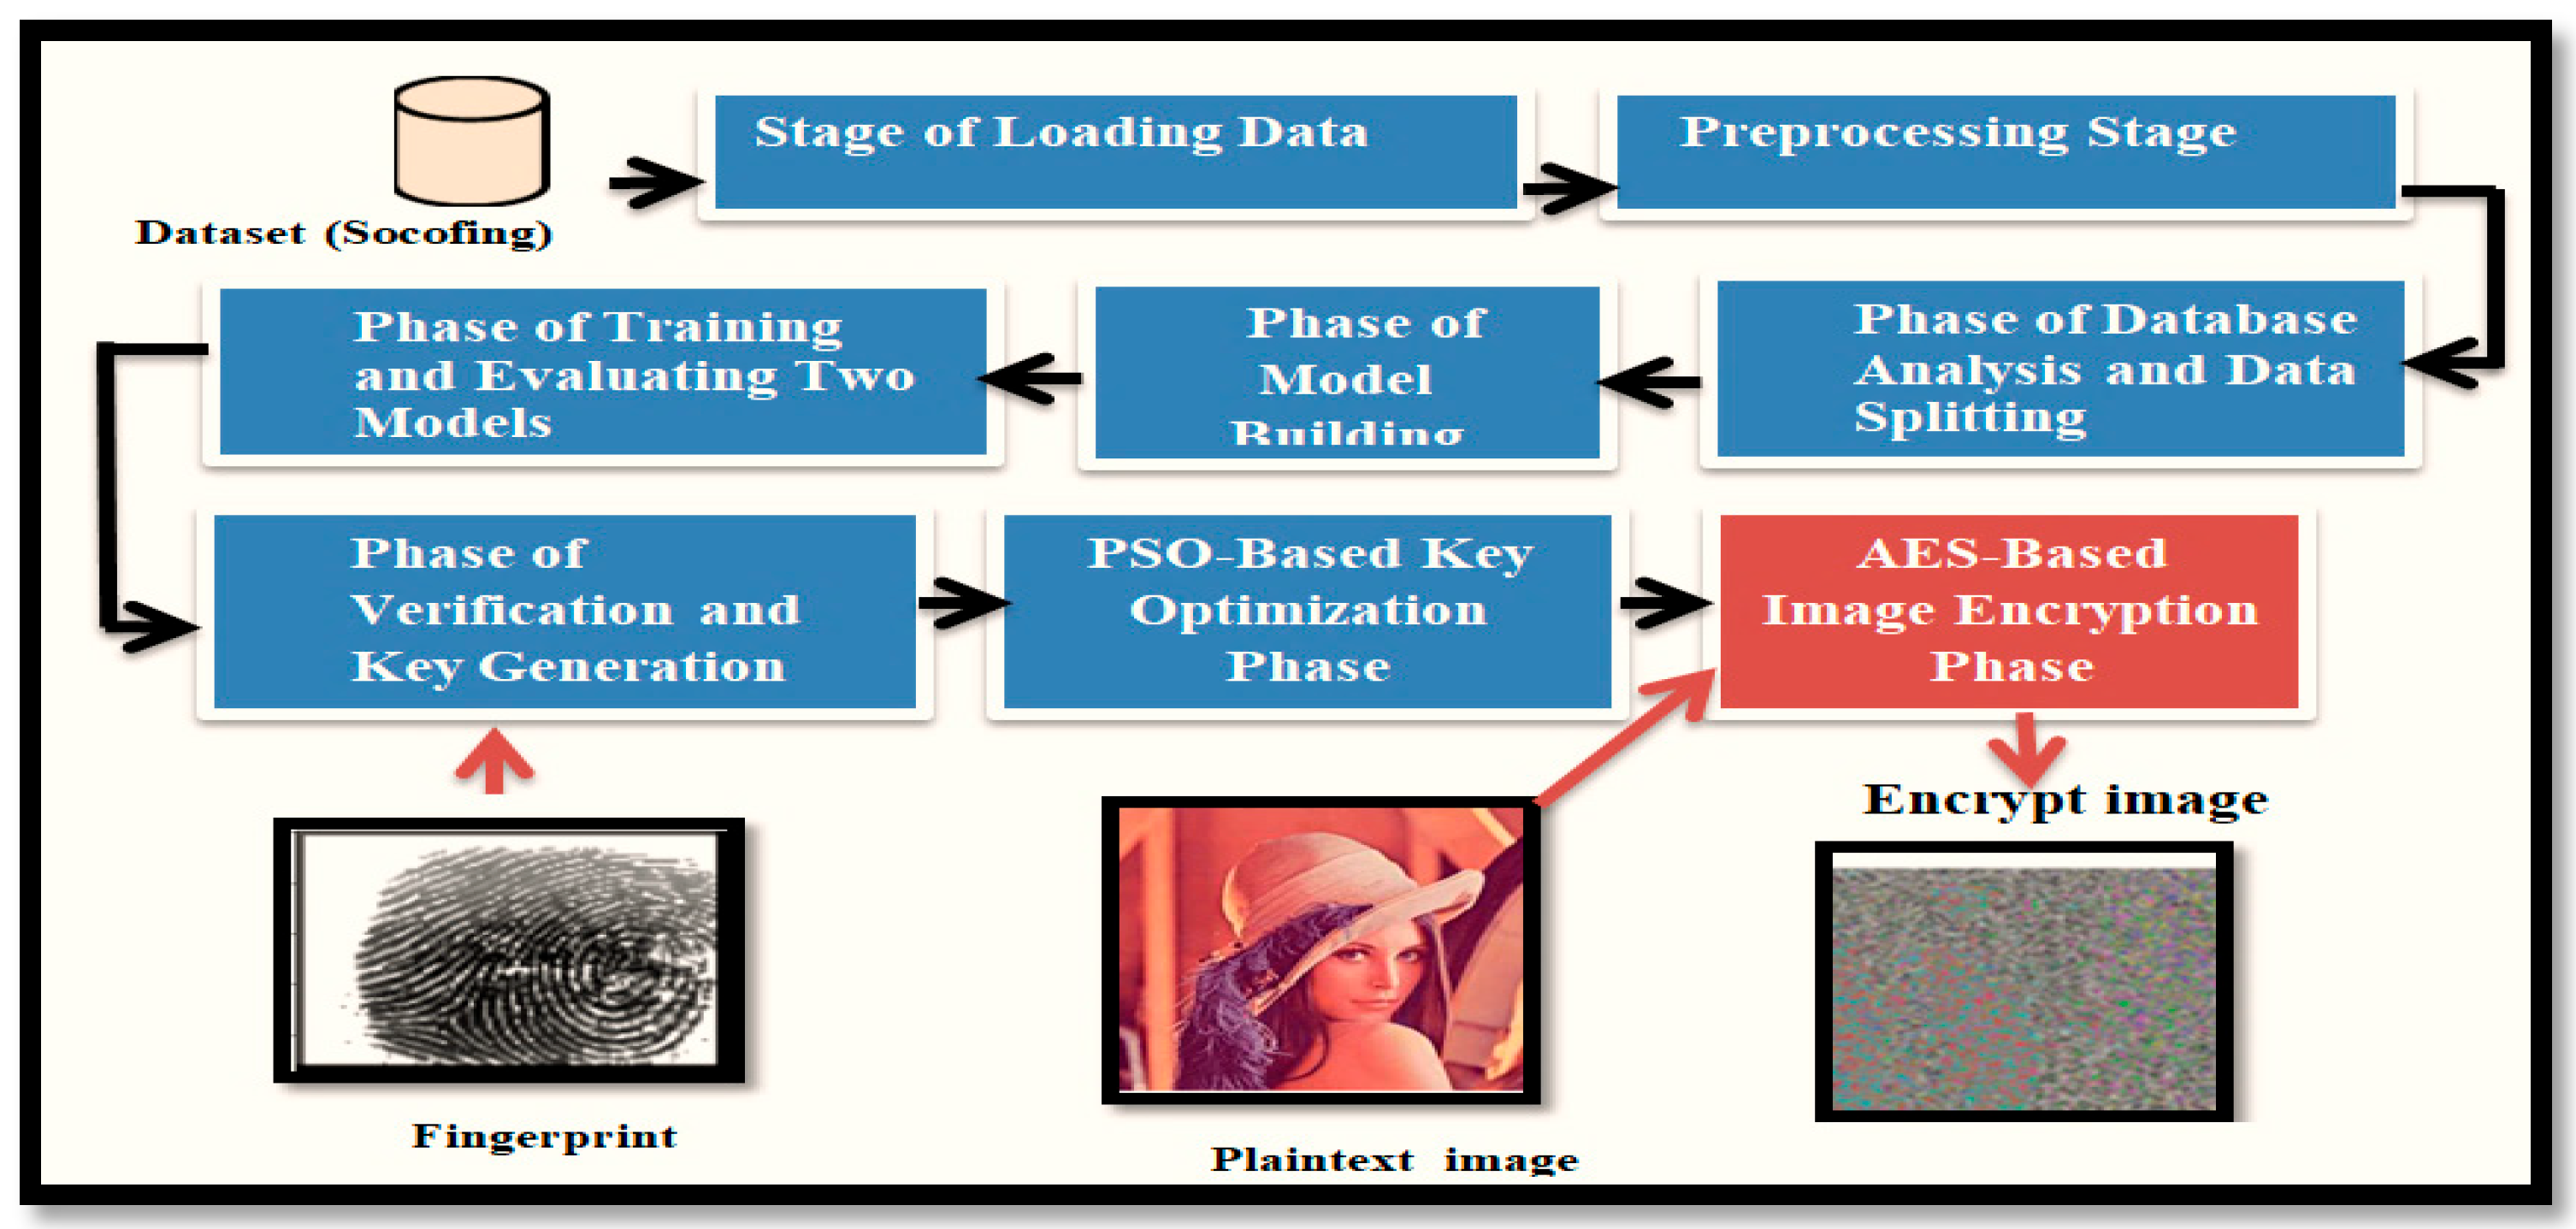
Figure 3 below illustrates the constituent stages of the encryption phase in the proposed system and the sequence of operations within it. Figure 3 consists of several interconnected stages, providing a comprehensive view of the methodological sequence of this phase. These stages begin with data loading, followed by preprocessing, analysis, and segmentation, then model building, training, and performance evaluation, proceeding to key verification, generation, and optimization using the PSO algorithm, and finally image encryption using the AES algorithm. Each of these stages will be explained in detail in the following sections. This stage represents the core pillar of the proposed system, as it involves generating the encryption key based on a CNN built on fingerprint data, which is then used in the encryption process. The flowchart in the first stage of the system illustrates the constituent phases of this process, which can be summarized as follows:
Figure 3.
Flowchart illustrating the steps of the proposed system.
4.1.1. Database Loading Stage
One of the most important things to do before starting is to make sure that the right data is ready to make key creation as accurate and secure as possible. The SOCOFing database utilized in this analysis has six thousand unique fingerprints from six hundred persons (ten fingerprints apiece). To provide additional variety to the training data, around 49,270 fake fingerprints are made with three degrees of variation: easy (very little variation), medium (moderate variation), and hard (very high variation). For model training, we utilize the synthetic fingerprints, and for testing, we exclusively use the actual fingerprints.
4.1.2. Data Preprocessing Stage
This stage aims to prepare the images in a way that makes them suitable for processing by the CNN model and includes the following steps:
A. Image Dimension Standardization
All images are resized to uniform standard dimensions (96 × 96 pixels) to ensure compatibility with the model requirements and processing efficiency. Equation (4) represents the resizing process as follows:
where
I′(x′,y′) = I (y/Sy,x/Sx)
- I(x,y): The original image.
- I′(x′,y′): The image after resizing.
- Sx and Sy: Scaling factors for the image dimensions [36].
B. Image Enhancement via Histogram Equalization
To enhance the clarity of fine fingerprint details, the histogram equalization technique is applied. This method aims to improve the distribution of gray levels within the image, thereby increasing contrast and enhancing pattern distinguishability. In low-contrast images, gray values are often confined to a narrow range, causing loss of fine details in dark or bright areas. Histogram equalization redistributes these values over a wider range, contributing to clearer visualization of fingerprint details. Equation (5) [37] mathematically represents this process.
where
- H′(I): Represents the new gray value after the transformation.
- CDF(I): The Cumulative Distribution Function (CDF) of gray levels at intensity I.
- CDFmin: Denotes the smallest non-zero value of the cumulative distribution function.
- N × M: Refers to the total number of pixels in the image (its size).
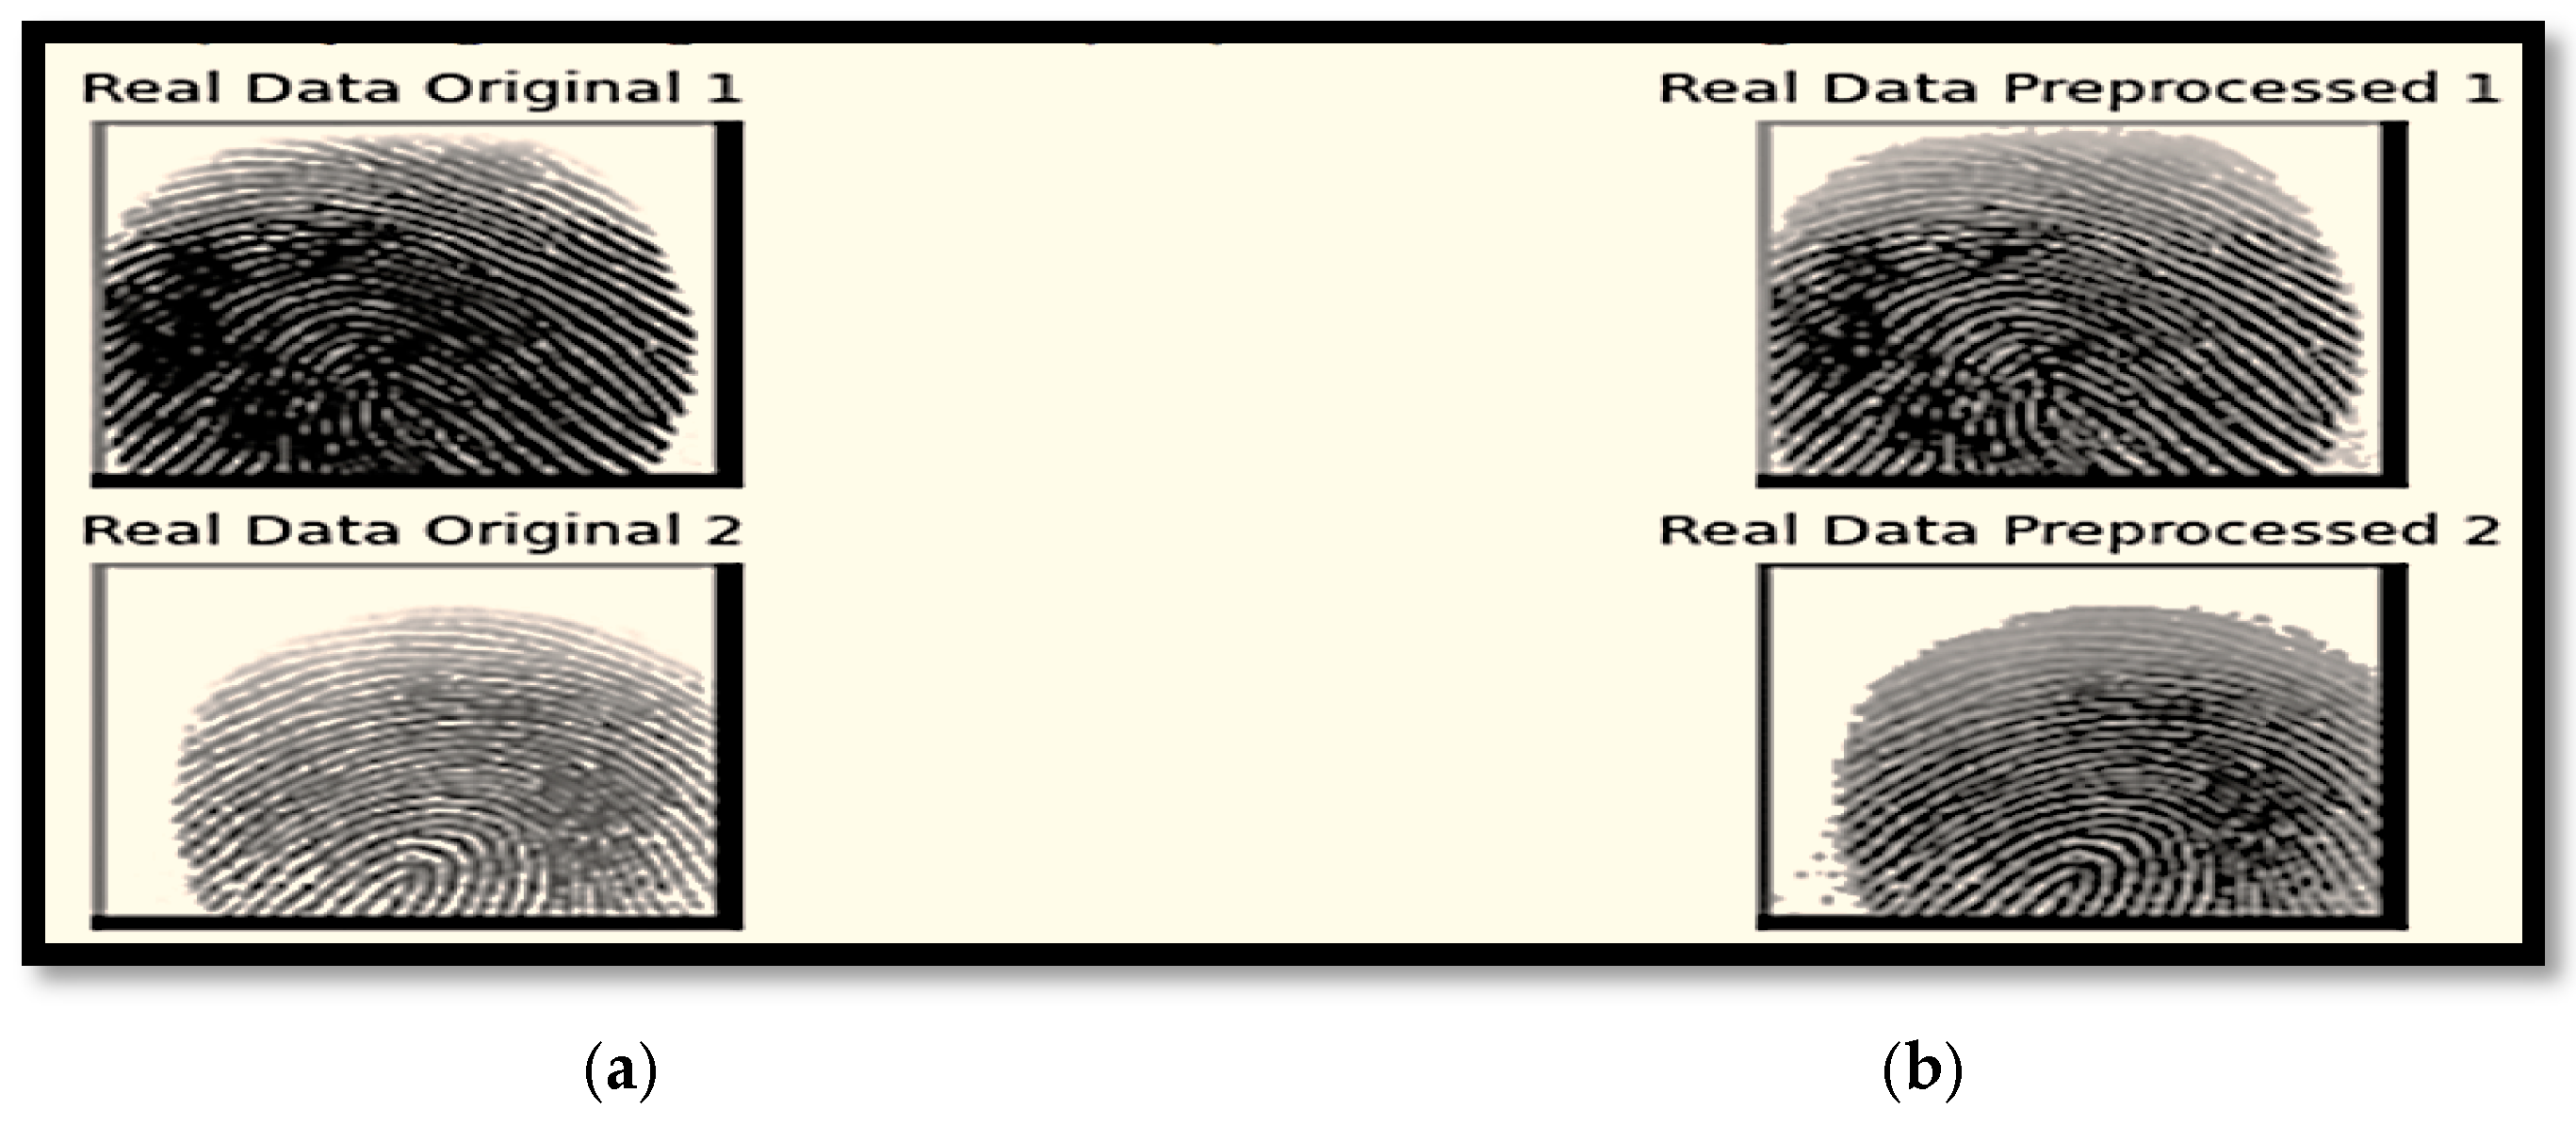
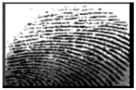
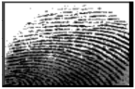
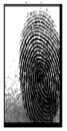
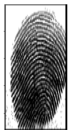
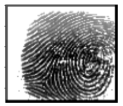
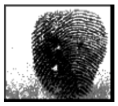
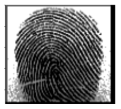
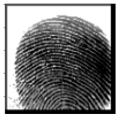
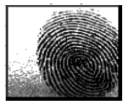
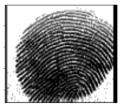
- L: The number of available gray levels in the image, typically 256 for 8-bit depth images. The purpose of this equation is to map the original intensity values to new values that are approximately uniformly distributed over the gray scale range [0, L−1], thereby enhancing contrast and improving the input image quality before it is used in subsequent encryption stages. Figure 4 illustrates the effect of applying histogram equalization on fingerprint images. It shows that the enhanced images exhibit higher contrast, highlighting fine details such as edges and linear patterns, which contributes to better feature extraction and increases the efficiency of fingerprint recognition systems.
Figure 4.
(a) Original fingerprint images. (b) Images after applying histogram equalization.
4.1.3. Database Analysis Stage
At this essential point in the proposed system, each enhanced fingerprint is carefully examined to find unique features like patterns and significant places inside the fingerprint. This method aims to create a database rich in intrinsic information so that the models can pick up on the unique traits of each fingerprint. To get basic information like the person’s identity, finger type, and hand (right or left), you look at the file names. This design makes it simpler to get the data ready since one model learns to identify the individual, and the other learns to tell what sort of finger it is. After doing these things, the data is split into two groups: one for testing and one for training. The synthetic fingerprints are utilized for practice, while the real fingerprints are only used for testing. This lets us know that we are judging the models’ performance fairly and appropriately.
4.1.4. Model Construction Phase
After completing the database preparation, image preprocessing, and enhancement, the process transitions to the model construction phase using CNNs. In this phase, two independent models are developed to achieve specific objectives:
- The first model is dedicated to identifying the individual’s identity (SubjectID) through deep learning of the unique fingerprint characteristics.
- The second model focuses on determining the finger number (FingerNum) and extracting distinctive features related to the internal fingerprint structure, such as patterns and minutiae.
Each model consists of a set of carefully organized layers to ensure high performance in feature recognition and optimal accuracy, as illustrated in Figure 2. To further enhance learning efficiency and stabilize the models, hyperparameters are meticulously fine-tuned according to the criteria presented in Table 2. This phase ensures that each model is capable of systematically and accurately extracting essential information from fingerprints, thereby paving the way for the subsequent stage of generating encryption keys and employing them for data protection.
Table 2.
Hyperparameter settings of the CNNs used in the system.
4.1.5. Model Training and Evaluation Phase
The training and evaluation phase of the two models is one of the most critical steps to ensure the efficiency and accuracy of the system in fingerprint recognition and encryption key generation. The performance of each model is evaluated using standard performance metrics such as Accuracy, Validation, and Error Rate, in order to guarantee the reliability of the results. The first model is validated for its ability to accurately recognize the identities of authorized individuals when requesting an encryption key, thereby ensuring a high level of system security. The second model is assessed based on its performance in correctly identifying the finger associated with the verified identity provided by the first model. This ensures accurate feature extraction and alignment with the individual’s identity. These evaluations are conducted using the test set to verify the models’ performance in a simulated real-world environment, thus guaranteeing the reliability and robustness of the system before proceeding to the key generation and data encryption phase.
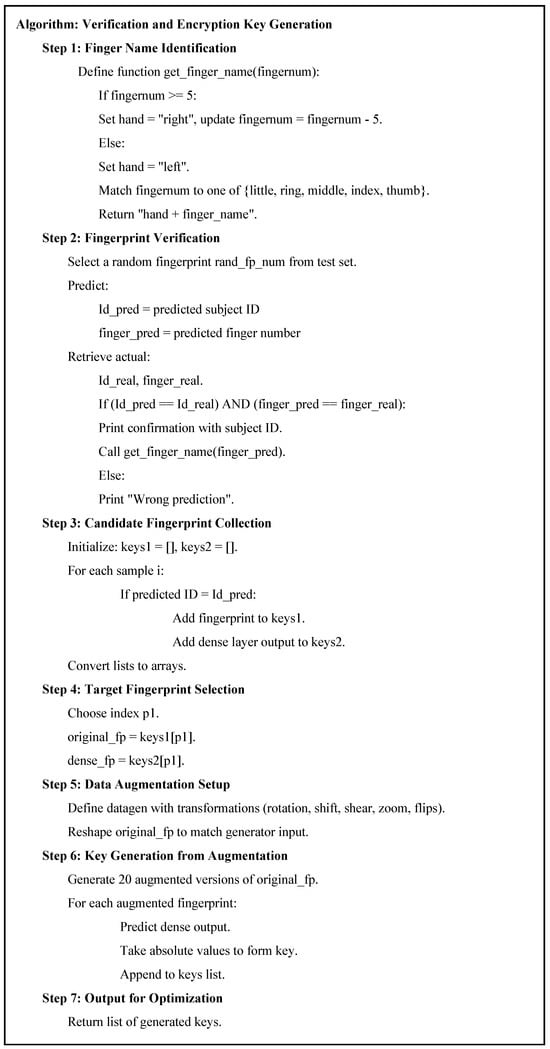
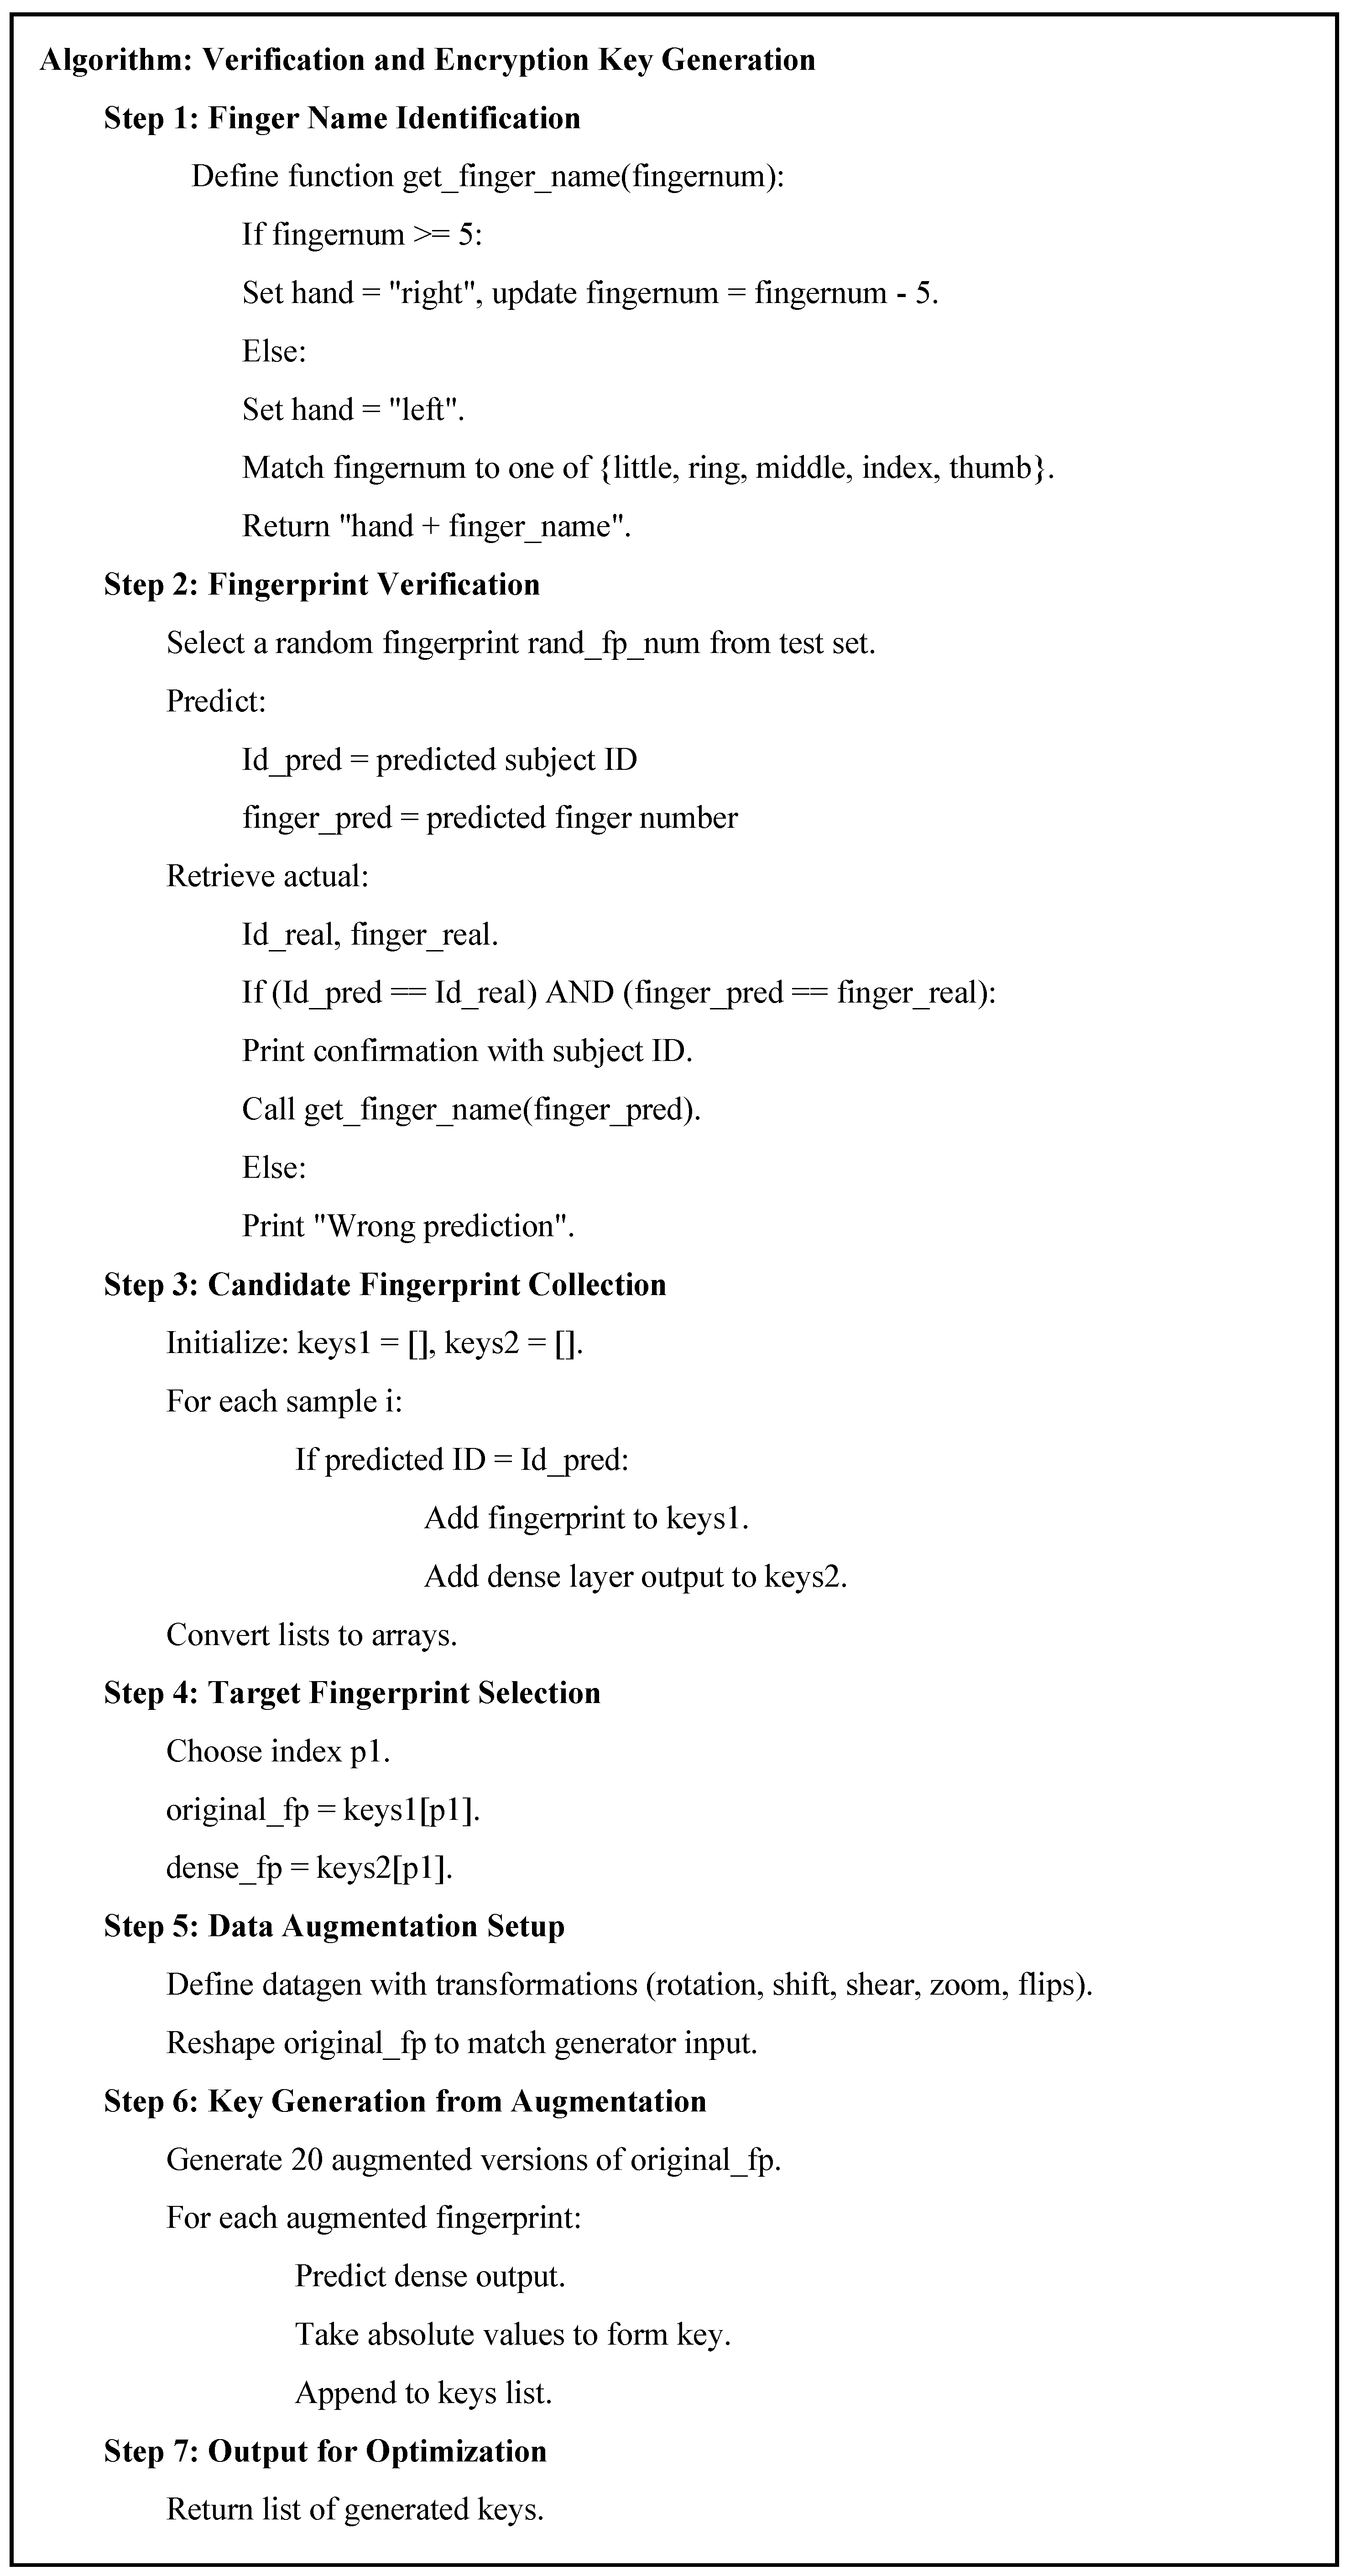
4.1.6. Identity Verification and Encryption Key Generation
The individual and fingerprint are verified against the registered name using two deep learning models. This step represents a fundamental stage in the process of generating the encryption key from fingerprints, as illustrated in Figure 5.
Figure 5.
Biometric identity verification and key generation process.
4.1.7. Key Optimization Using PSO Algorithm
To strengthen the initial encryption key and ensure higher security, the PSO algorithm is employed as an optimization mechanism. This algorithm enhances the random distribution of the key and improves its cryptographic robustness, thereby making it highly resistant to prediction or compromise. The optimization process relies on iteratively updating the positions and velocities of particles derived from individual fingerprints, as illustrated in Figure 2. Through continuous refinement based on both local and global best positions, the algorithm produces encryption keys with greater complexity and resilience. This raises a critical research question: “How effectively can the proposed system withstand statistical attacks?” The approach is specifically designed to minimize the likelihood of repetitive patterns that could otherwise be exploited by such attacks. The set of hyperparameters adopted for this optimization process, determined through extensive experimental trials, is summarized in Table 3.
Table 3.
Optimization algorithm hyperparameters adopted in the system.
4.1.8. AES-Based Image Encryption Phase
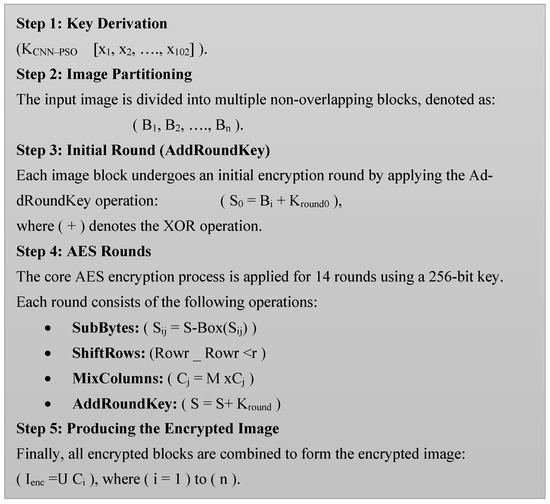
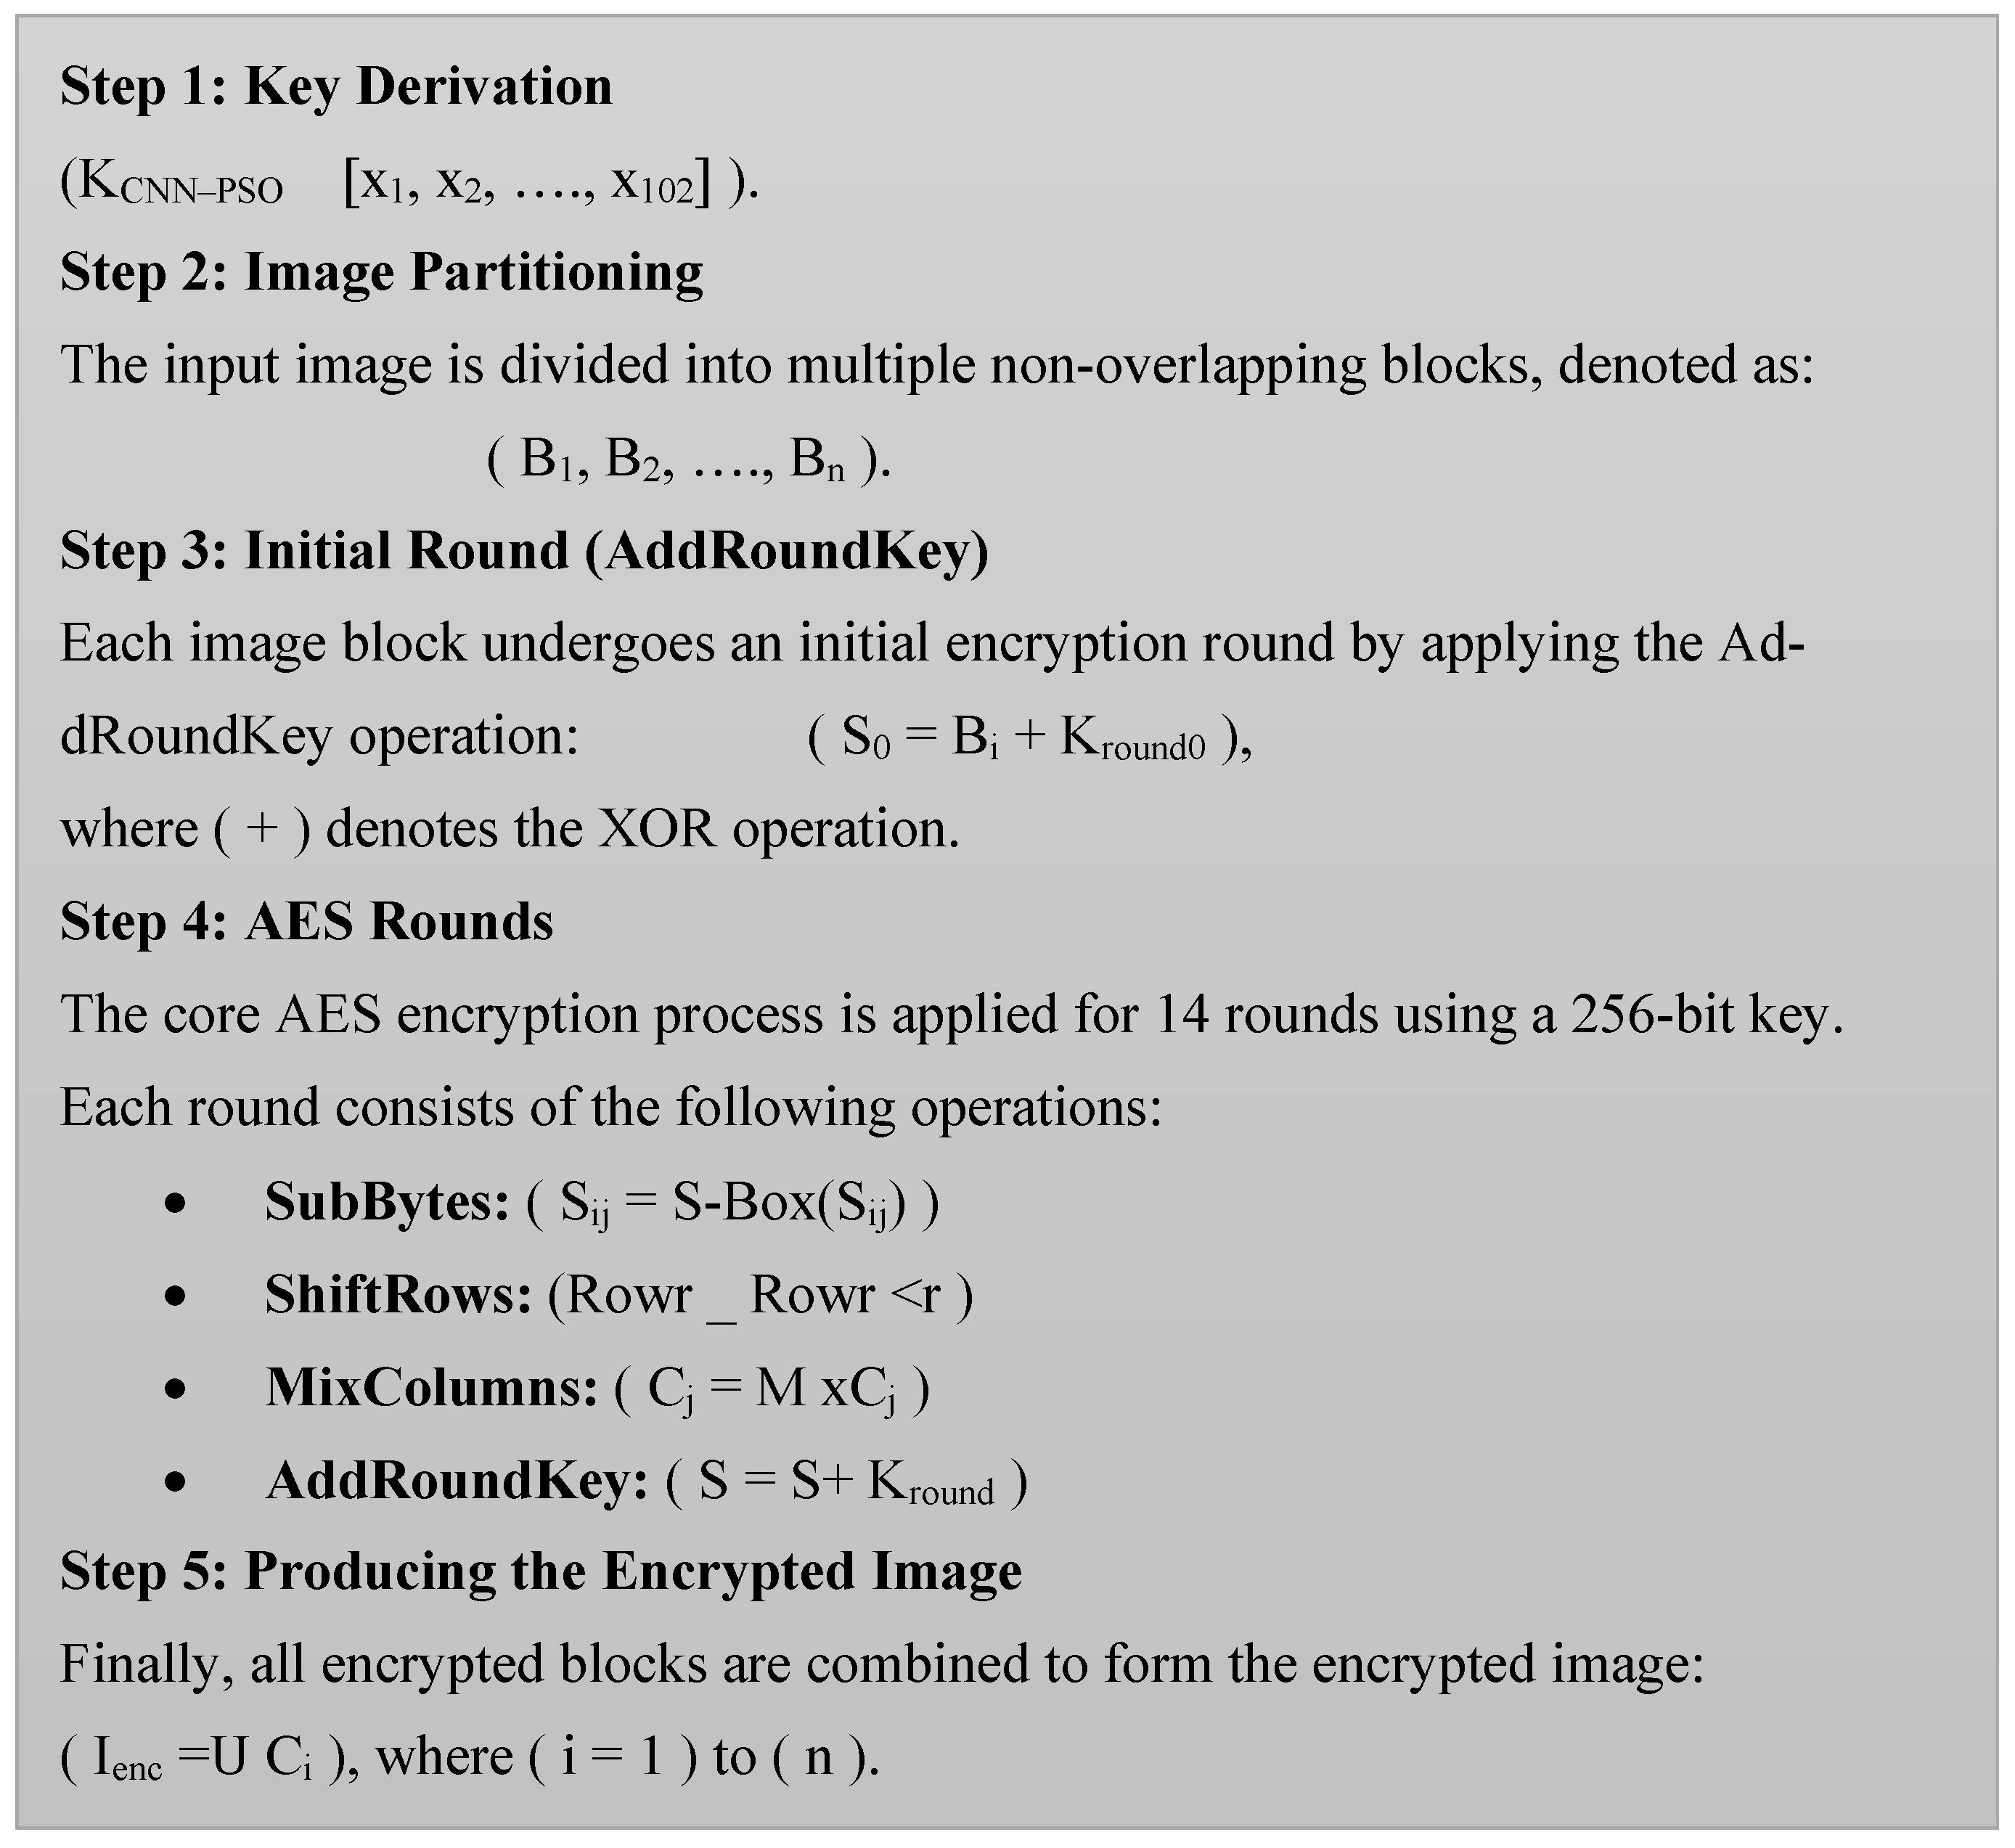
After completing the previous steps, during which a 1024-element key vector is generated using the CNN and then optimized via the PSO algorithm to enhance randomness and entropy, the encryption phase begins using the AES with a 256-bit key. The integration of neural networks and swarm algorithms makes the key unpredictable and computationally hard to break, as illustrated in Figure 6, which shows the encryption phase using the AES algorithm.
Figure 6.
Flowchart of the AES-based image encryption phase.
The following provides an explanation of each step of the AES algorithm:
Step 1: Key Derivation
The optimized key from CNN + PSO is denoted as KCNN+PSO = [x1, x2, …, x1024]
First, this vector is converted into a byte representation.
Then, a hash function (SHA-256) is applied to extract a 256-bit key as follows: KAES = SHA-256(KCNN+PSO)
Step 2: Image Partitioning
The image data is divided into equal-sized blocks, each 128 bits (16 bytes) long.
Each block is denoted as Bi, where Bi ∈ {0, 1}128, i = 1, 2, …, n
Step 3: Initial Round (AddRoundKey)
Each block Bi is combined with the initial round key Kround0 using XOR: S0 = Bi ⊕ Kround0
Step 4: AES Rounds
Since the key is 256 bits long, the algorithm performs 14 iterative rounds. Each round (except the last) includes the following:
- SubBytes: Replace each byte using the substitution box (S-Box): S′ij = S − Box(Sij)
- ShiftRows: Row r is shifted left by r positions: Rowr → Rowr ≪ r
- MixColumns: Each column (Cj) is multiplied by a fixed matrix (M) in GF(28): C′j = M × Cj
- AddRoundKey: The state matrix (S) is combined with the round key: S = S ⊕ Kround
The final round includes only SubBytes + ShiftRows + AddRoundKey (without MixColumns).
Step 5: Producing the Encrypted Image
After completing all rounds, the encrypted blocks Ci are obtained. By combining them, the final encrypted image is formed: Ienc = ⋃ Ci, where i = 1 to n.
Advantages of the Proposed Method
- Increased entropy of the encryption key: H(KAES) → maximum value
- High resistance against brute-force and statistical attacks.
- Homogeneous distribution of the encrypted image histogram.
- Strong balance between computational efficiency and security level.
4.2. Decryption Phase
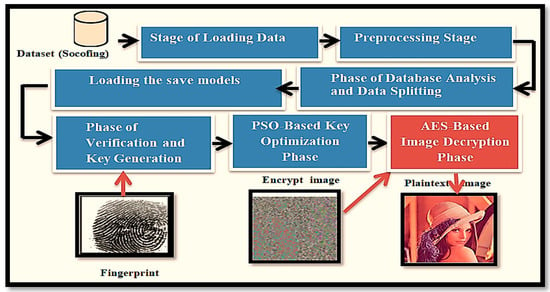
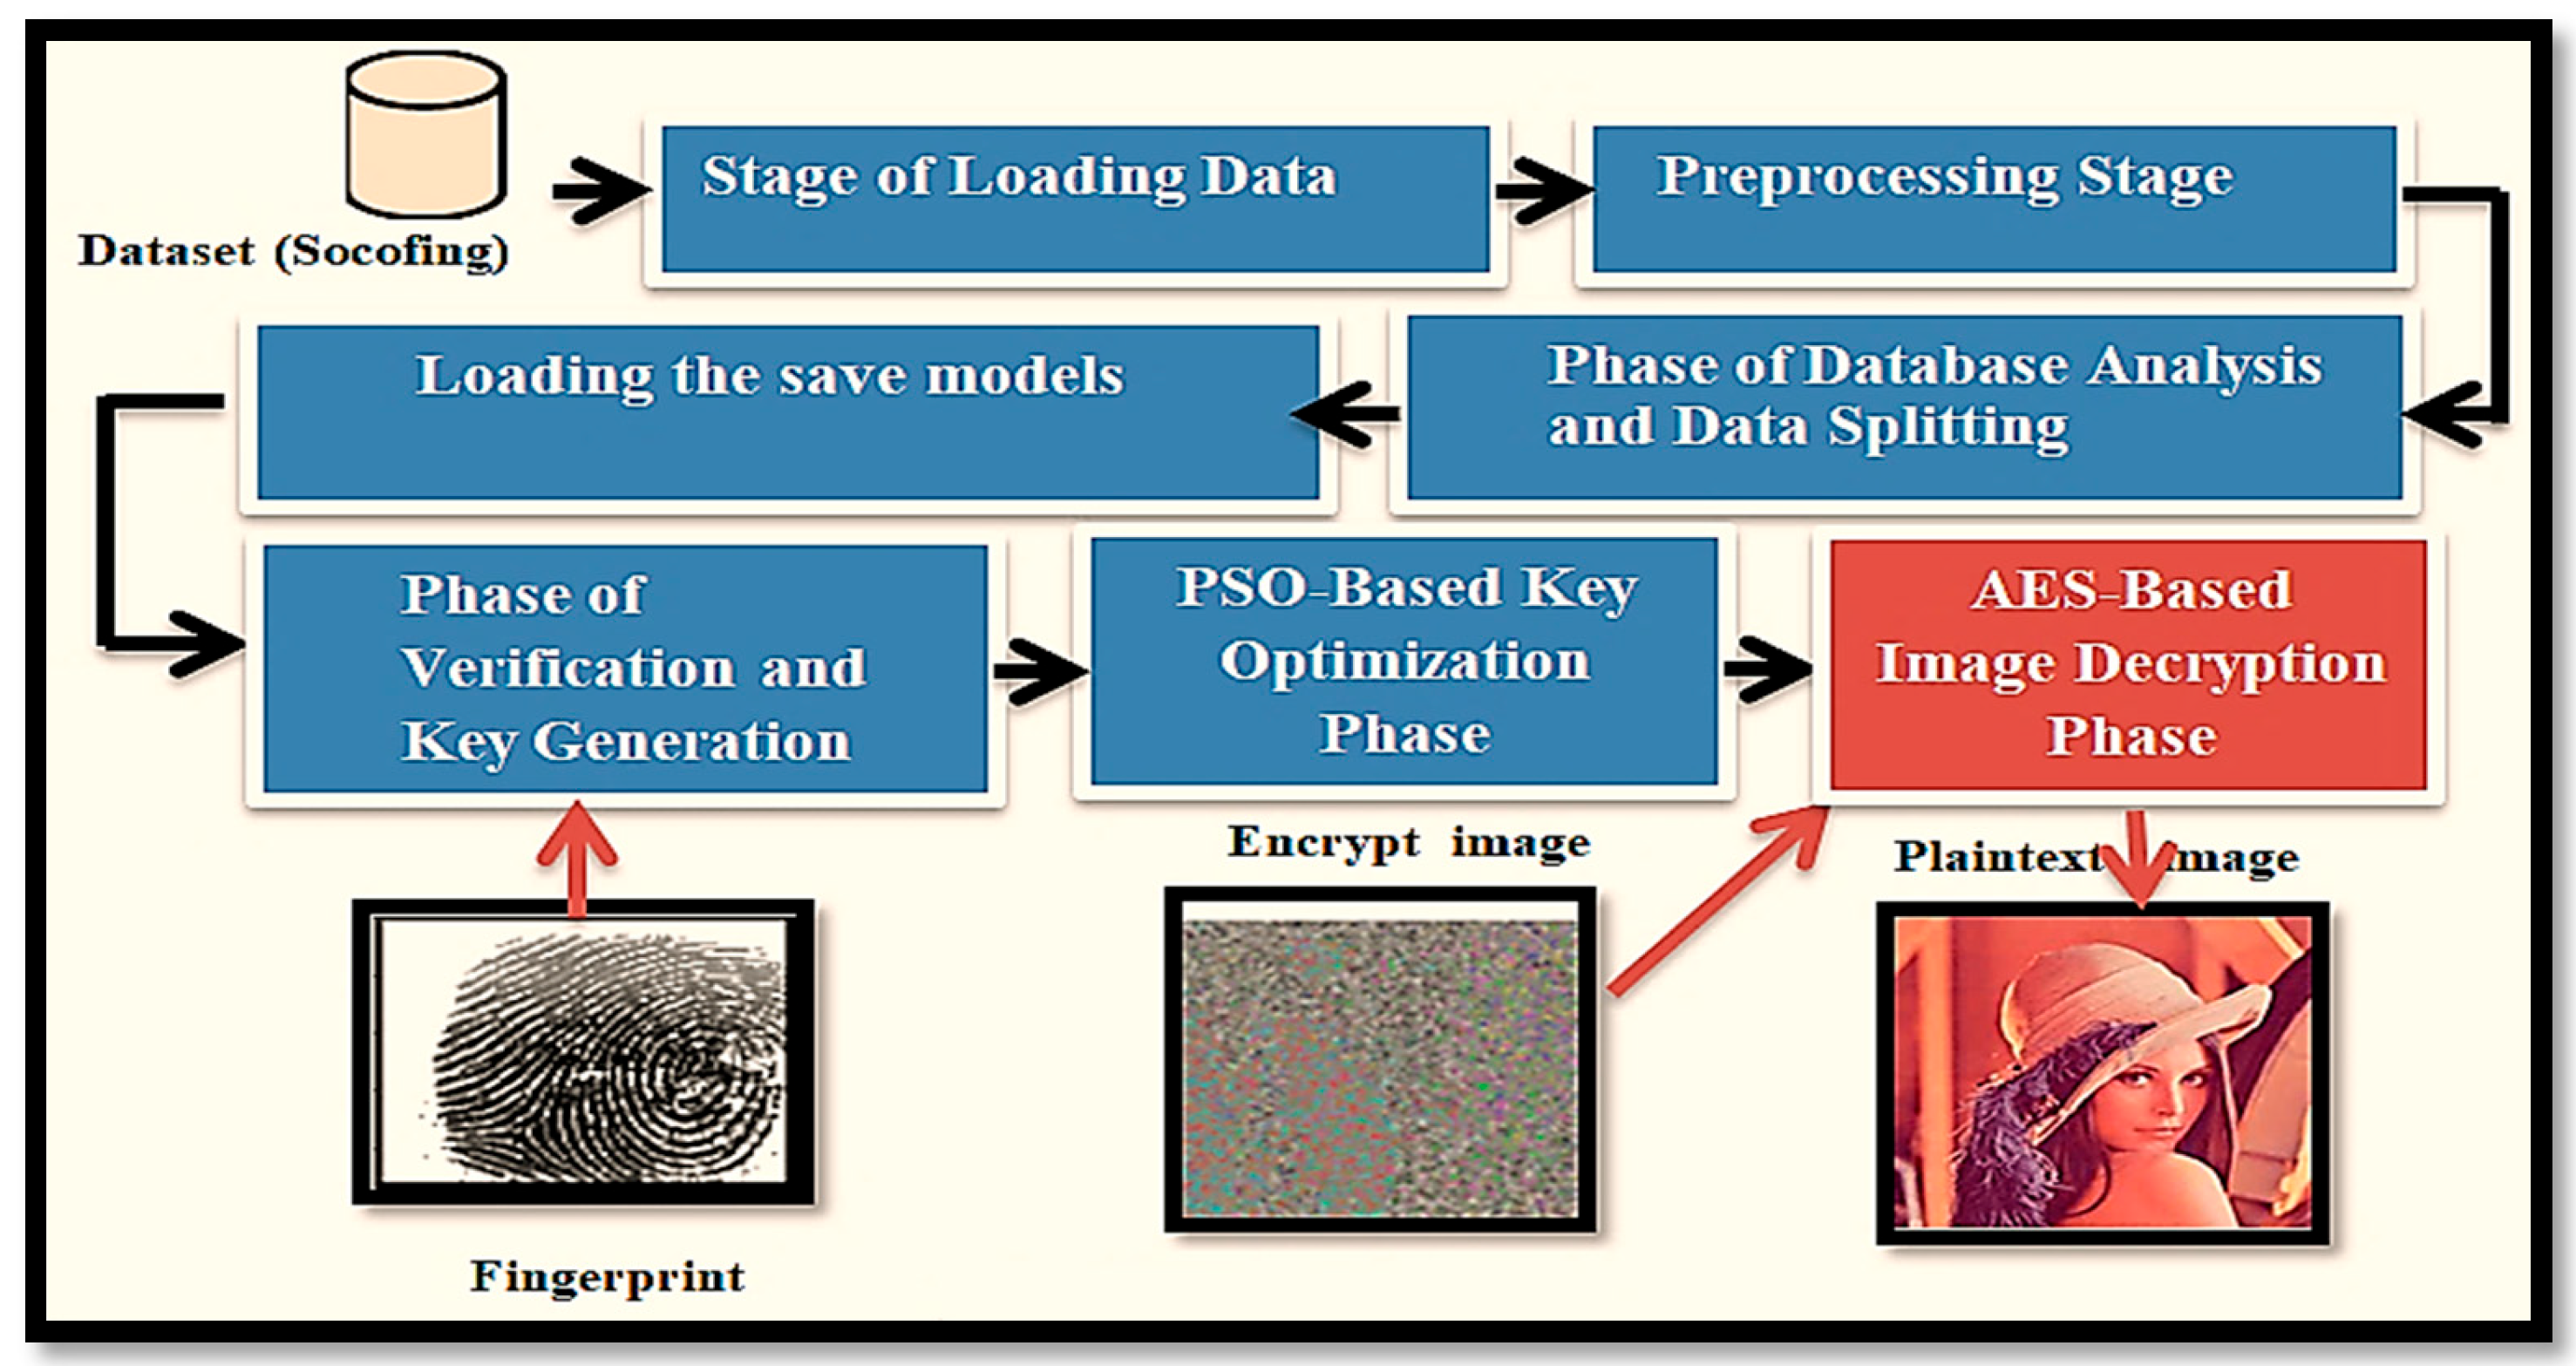
This phase is critical for verifying the overall reliability and robustness of the encryption-decryption framework. This phase is similar to the stages described in the encryption section, with the main difference being that the models are not rebuilt or retrained but loaded from previously saved copies. The encryption stage is replaced by the decryption phase to ensure accurate recovery of the original data. Figure 7 illustrates this phase and its sub-stages.
Figure 7.
Stages of the decryption process.
- Data loading phase: Limited to loading only the encrypted data produced during the previous encryption phase.
- Data preprocessing phase: The encrypted data is prepared and processed for the subsequent decryption stage.
- Data analysis phase: The encrypted data is analyzed to extract the necessary information for key matching and ensure accurate retrieval.
- Loading the previously saved models: Models trained during the encryption phase are loaded for use in the decryption process.
- Verification and key generation: The data is verified, and the decryption key is regenerated.
- Key optimization stage using PSO: The key is optimized using the PSO algorithm to enhance randomness and retrieval accuracy.
- Image decryption phase using AES: Decryption is performed using the AES algorithm, restoring the original image with high quality and precision. This framework ensures the integrity of the decryption process while maintaining model stability and reliable data recovery, thereby enhancing security and efficiency in the proposed system.
- Performance evaluation and comparison: The decrypted images and keys are evaluated against security and quality metrics to ensure consistency with the encryption phase and to benchmark the framework against conventional methods. All operations in this phase are designed to maintain consistency and minimize potential errors during the decryption process.
5. Analysis and Results
This section aims to evaluate the efficiency and reliability of the proposed encryption system through a series of carefully designed experiments. The evaluation includes testing the strength of the generated keys, the security level against statistical, visual, and brute-force attacks, and the system’s ability to accurately recover the original images after decryption without any loss of quality. To demonstrate the effectiveness of the proposed hybrid model, benchmark images from widely recognized datasets are utilized, along with visual and graphical examples illustrating the encryption and decryption processes. All experiments are implemented in Python (3.11) using the Kaggle cloud environment, which provides advanced resources for machine learning applications. The experimental setup included an NVIDIA Tesla P100 GPU (16 GB), dual Intel Xeon processors (2.0 GHz), and 32 GB RAM. This infrastructure enabled efficient execution of experiments within the allocated computational time. For practical evaluation, two primary databases are employed: the SOCOFing Fingerprint Database, which is used to generate encryption keys based on data from 600 individuals and 49,270 synthetic fingerprints, and the USC-SIPI Image Database, which is used to assess encryption effectiveness through metrics such as entropy and pixel correlation, in addition to testing system resistance against statistical, visual, and differential attacks. The analysis is conducted on two complementary levels: neural key analysis, to assess randomness and entropy strength, and encryption analysis, to evaluate the system’s efficiency and security in protecting and recovering data. To avoid any ambiguity, it is important to note that the comparative evaluation presented throughout the experimental analysis is entirely quantitative. For each security evaluation metric, including entropy, correlation, NPCR, UACI, and key sensitivity, numerical comparison tables with recent state-of-the-art methods are provided. These quantitative results enable an objective, measurable, and fair assessment of the proposed framework, rather than a qualitative or descriptive comparison.
5.1. Neural Key Analysis
This section consists of four main components:
- The performance of the CNN model.
- Results of the encryption key evaluation and related metrics.
- Results of applying the PSO algorithm to enhance the encryption key.
- Comparison of the accuracy of the proposed models with other systems.
5.1.1. The Performance of the CNN Model
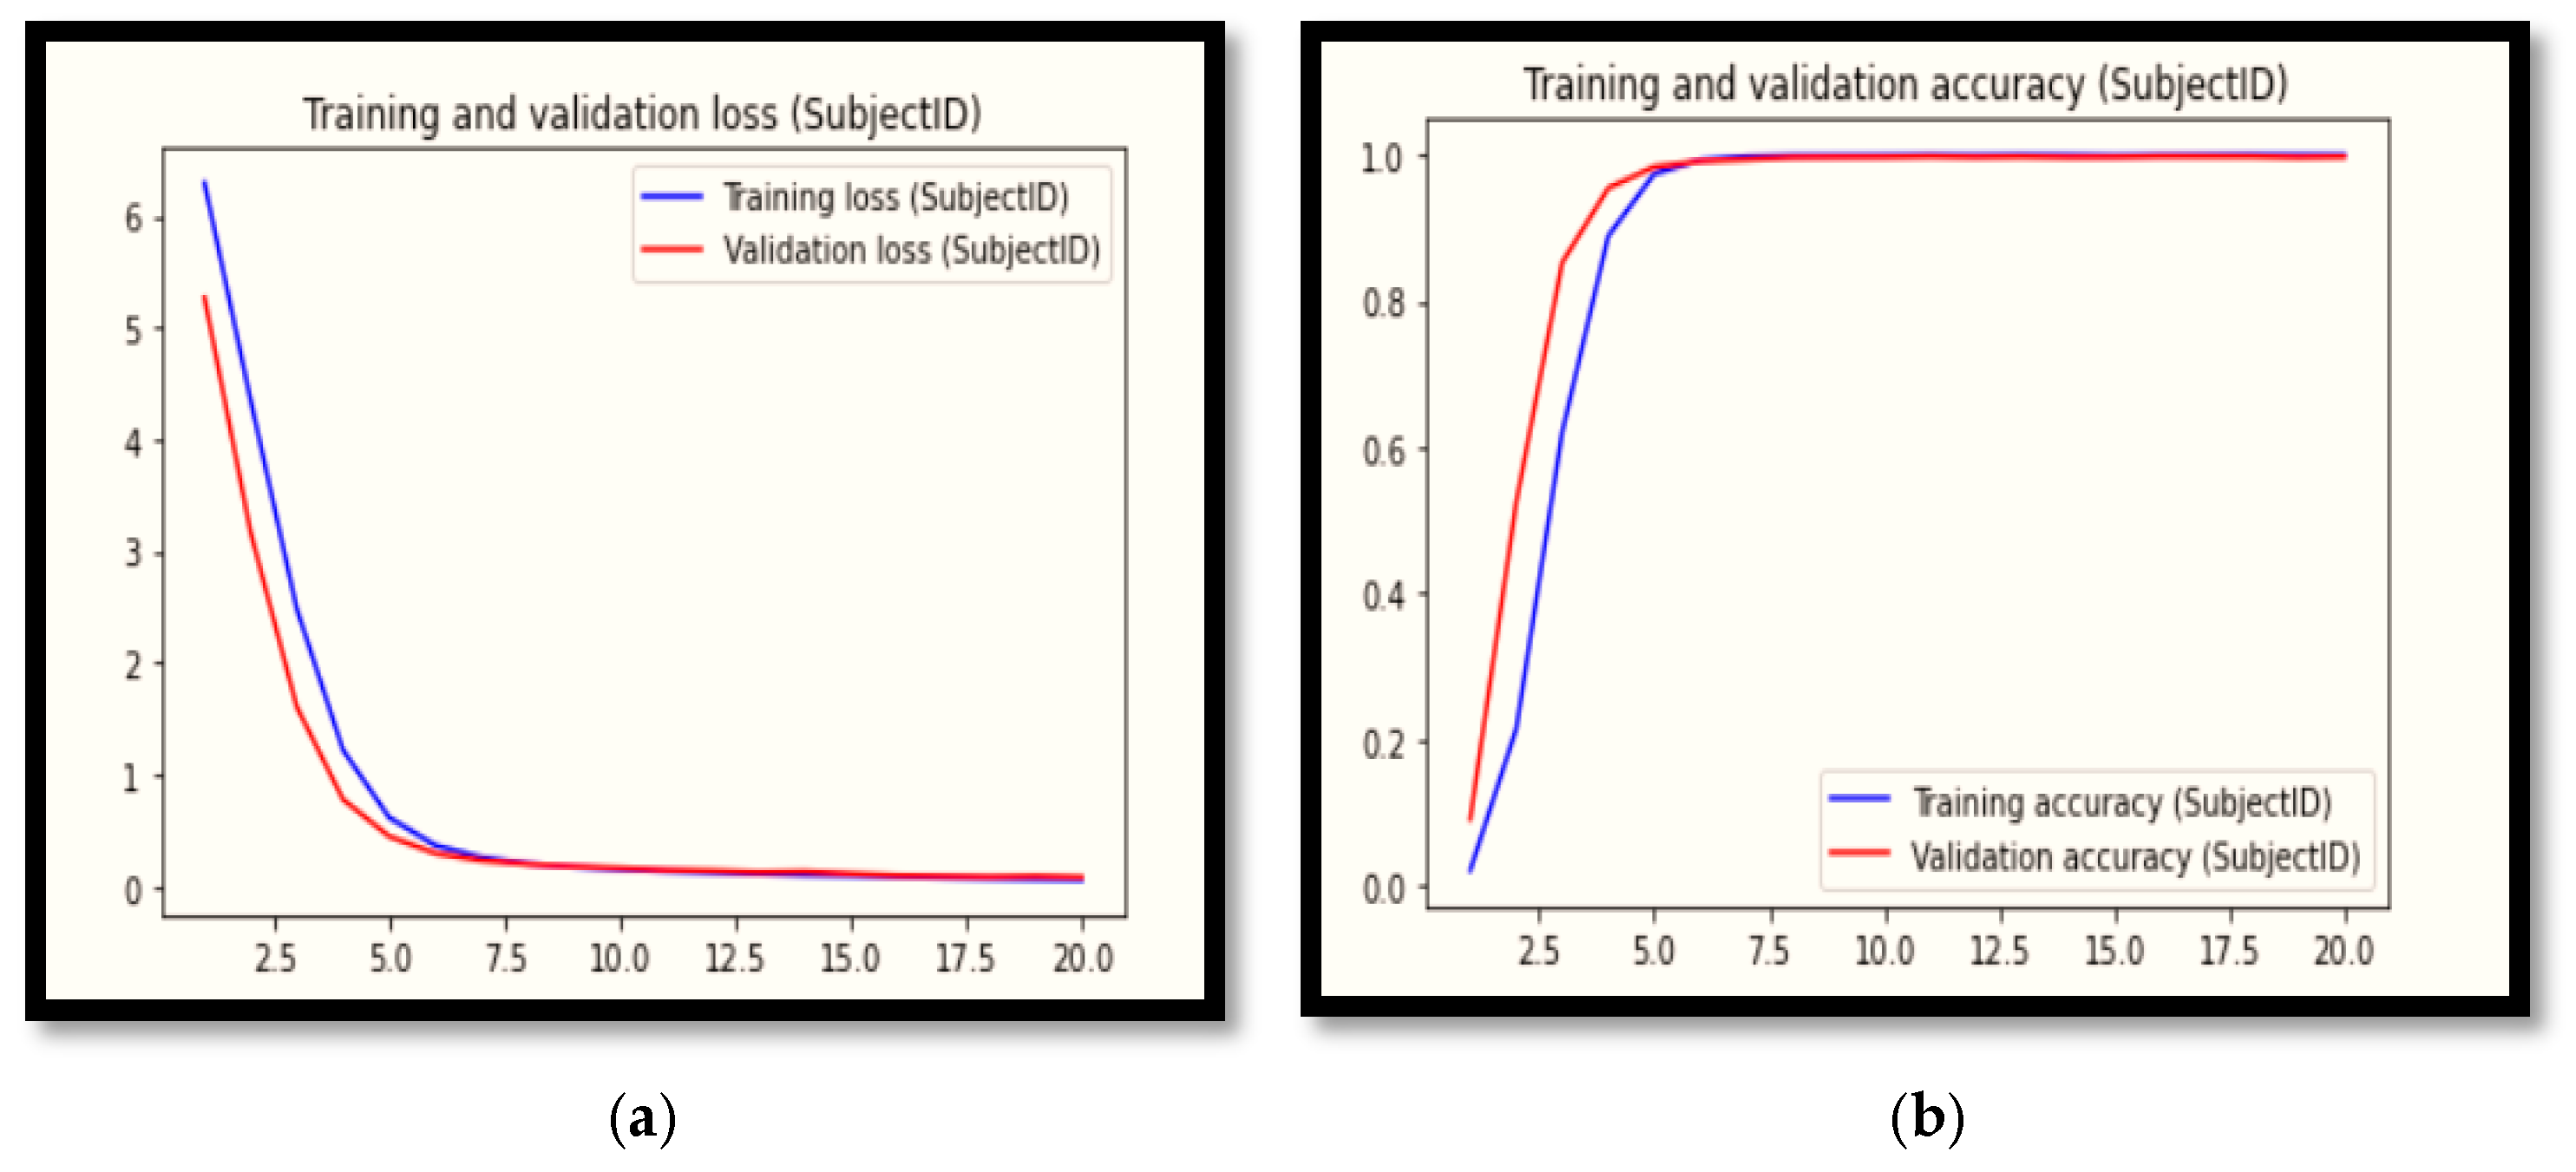
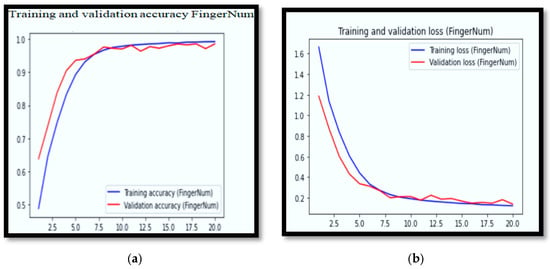
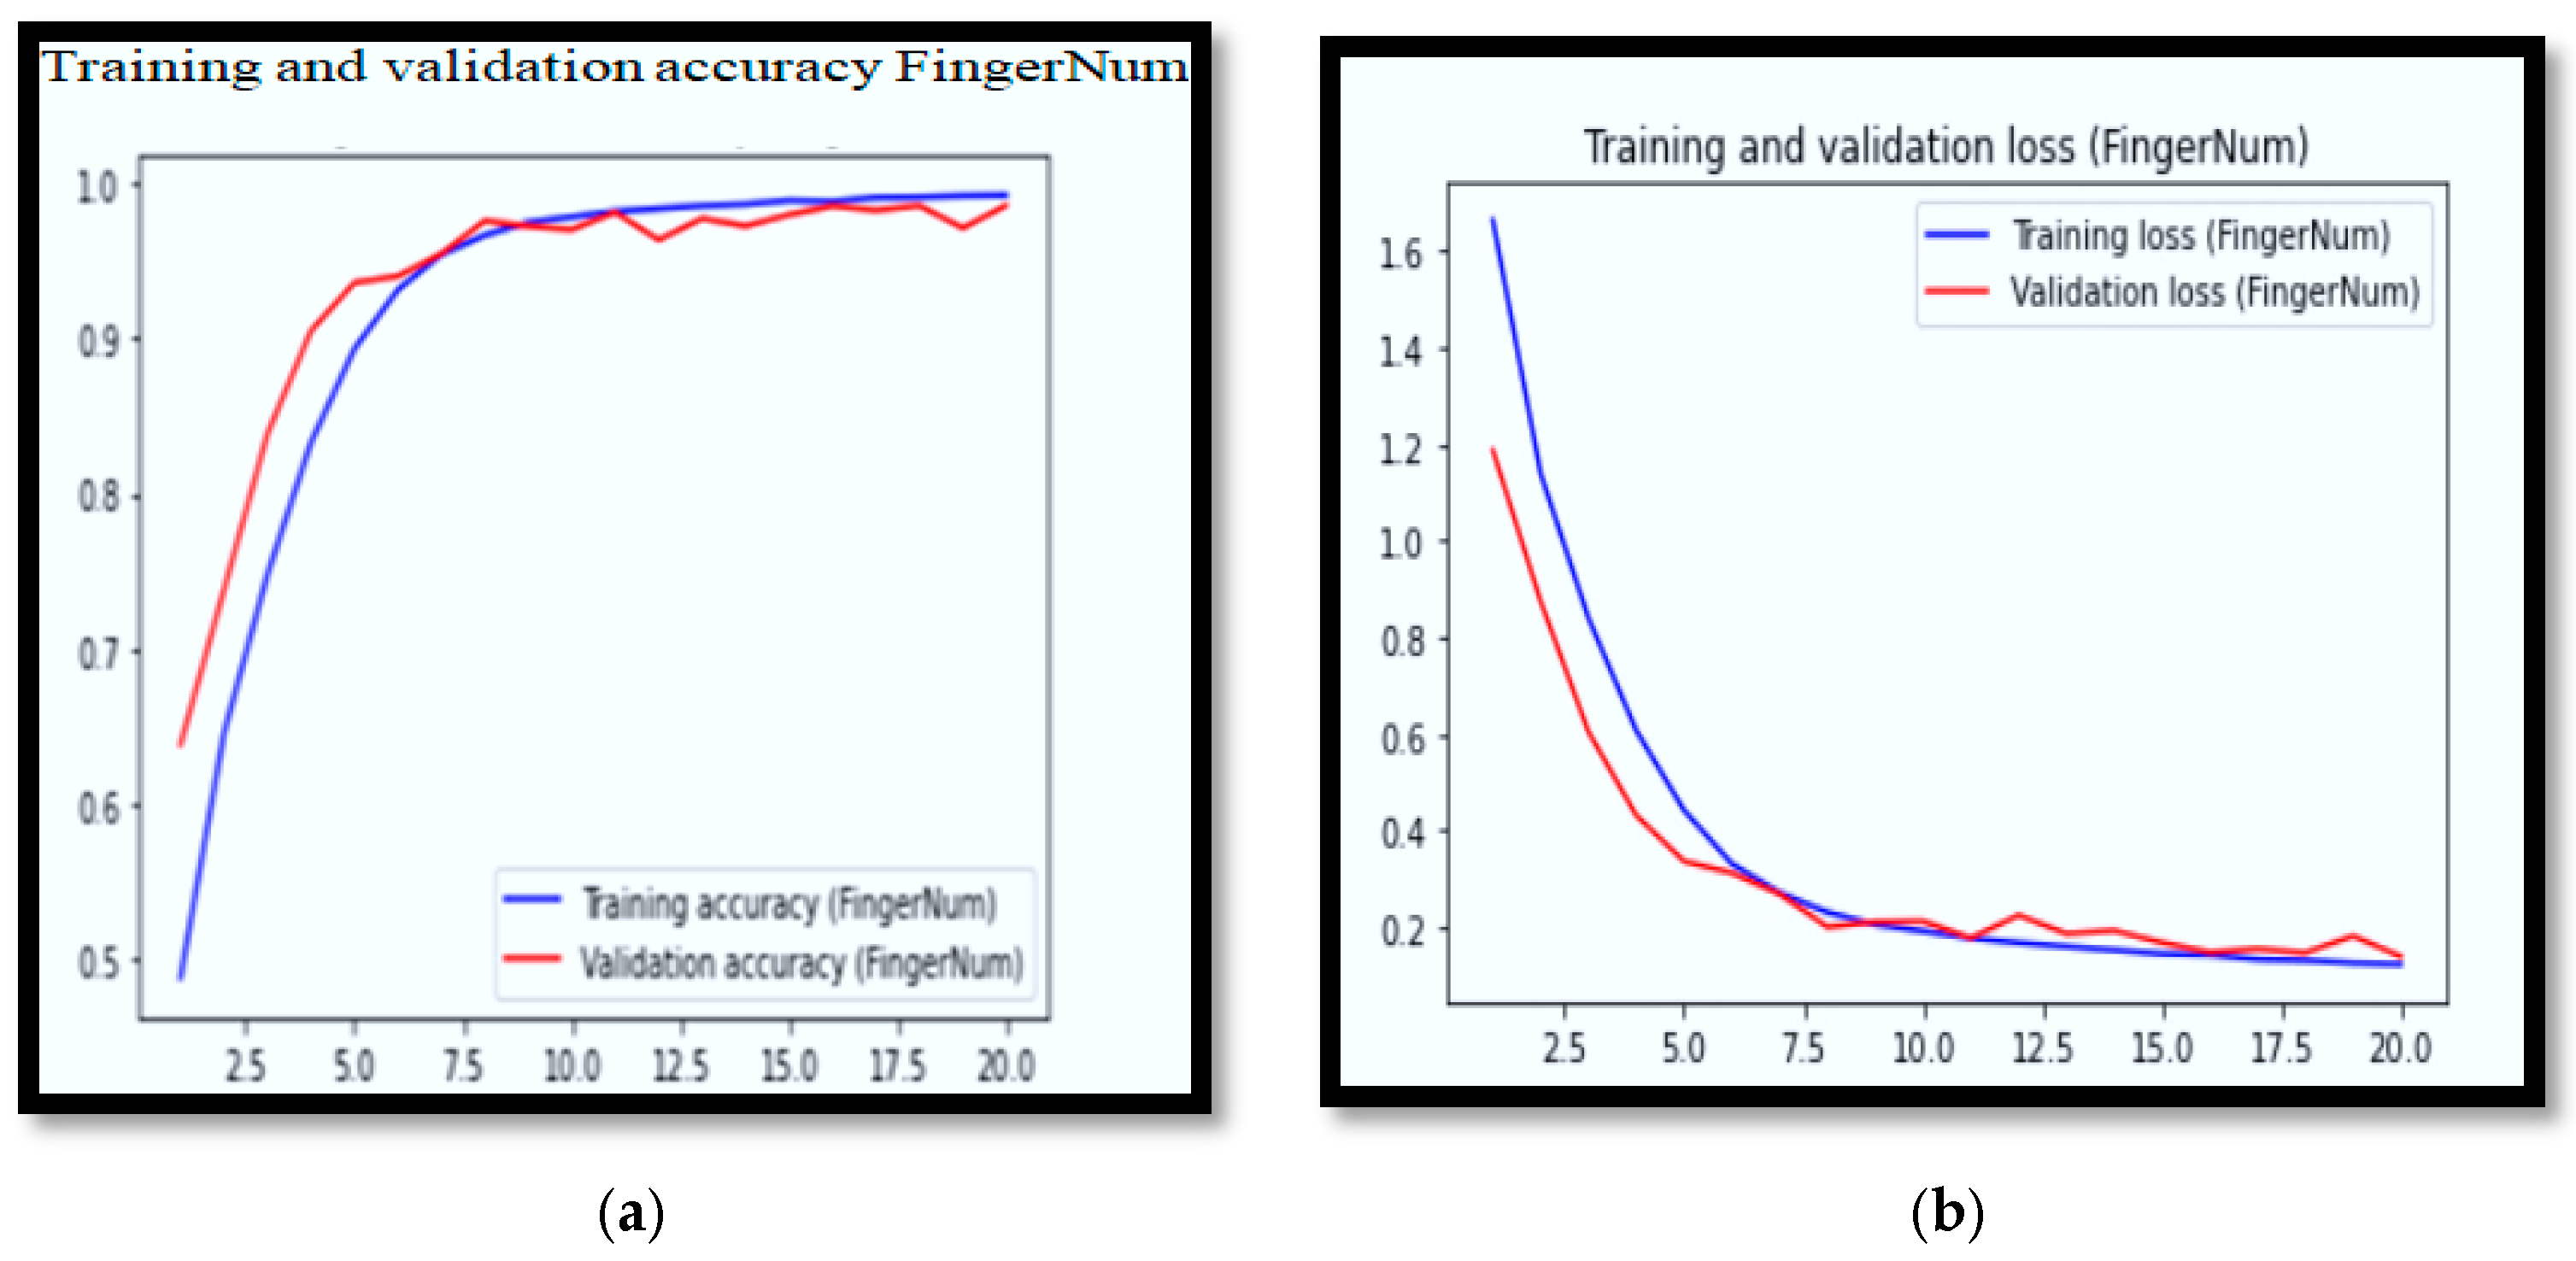
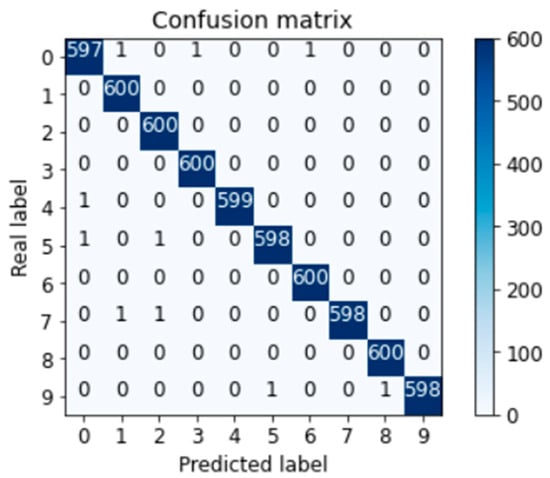
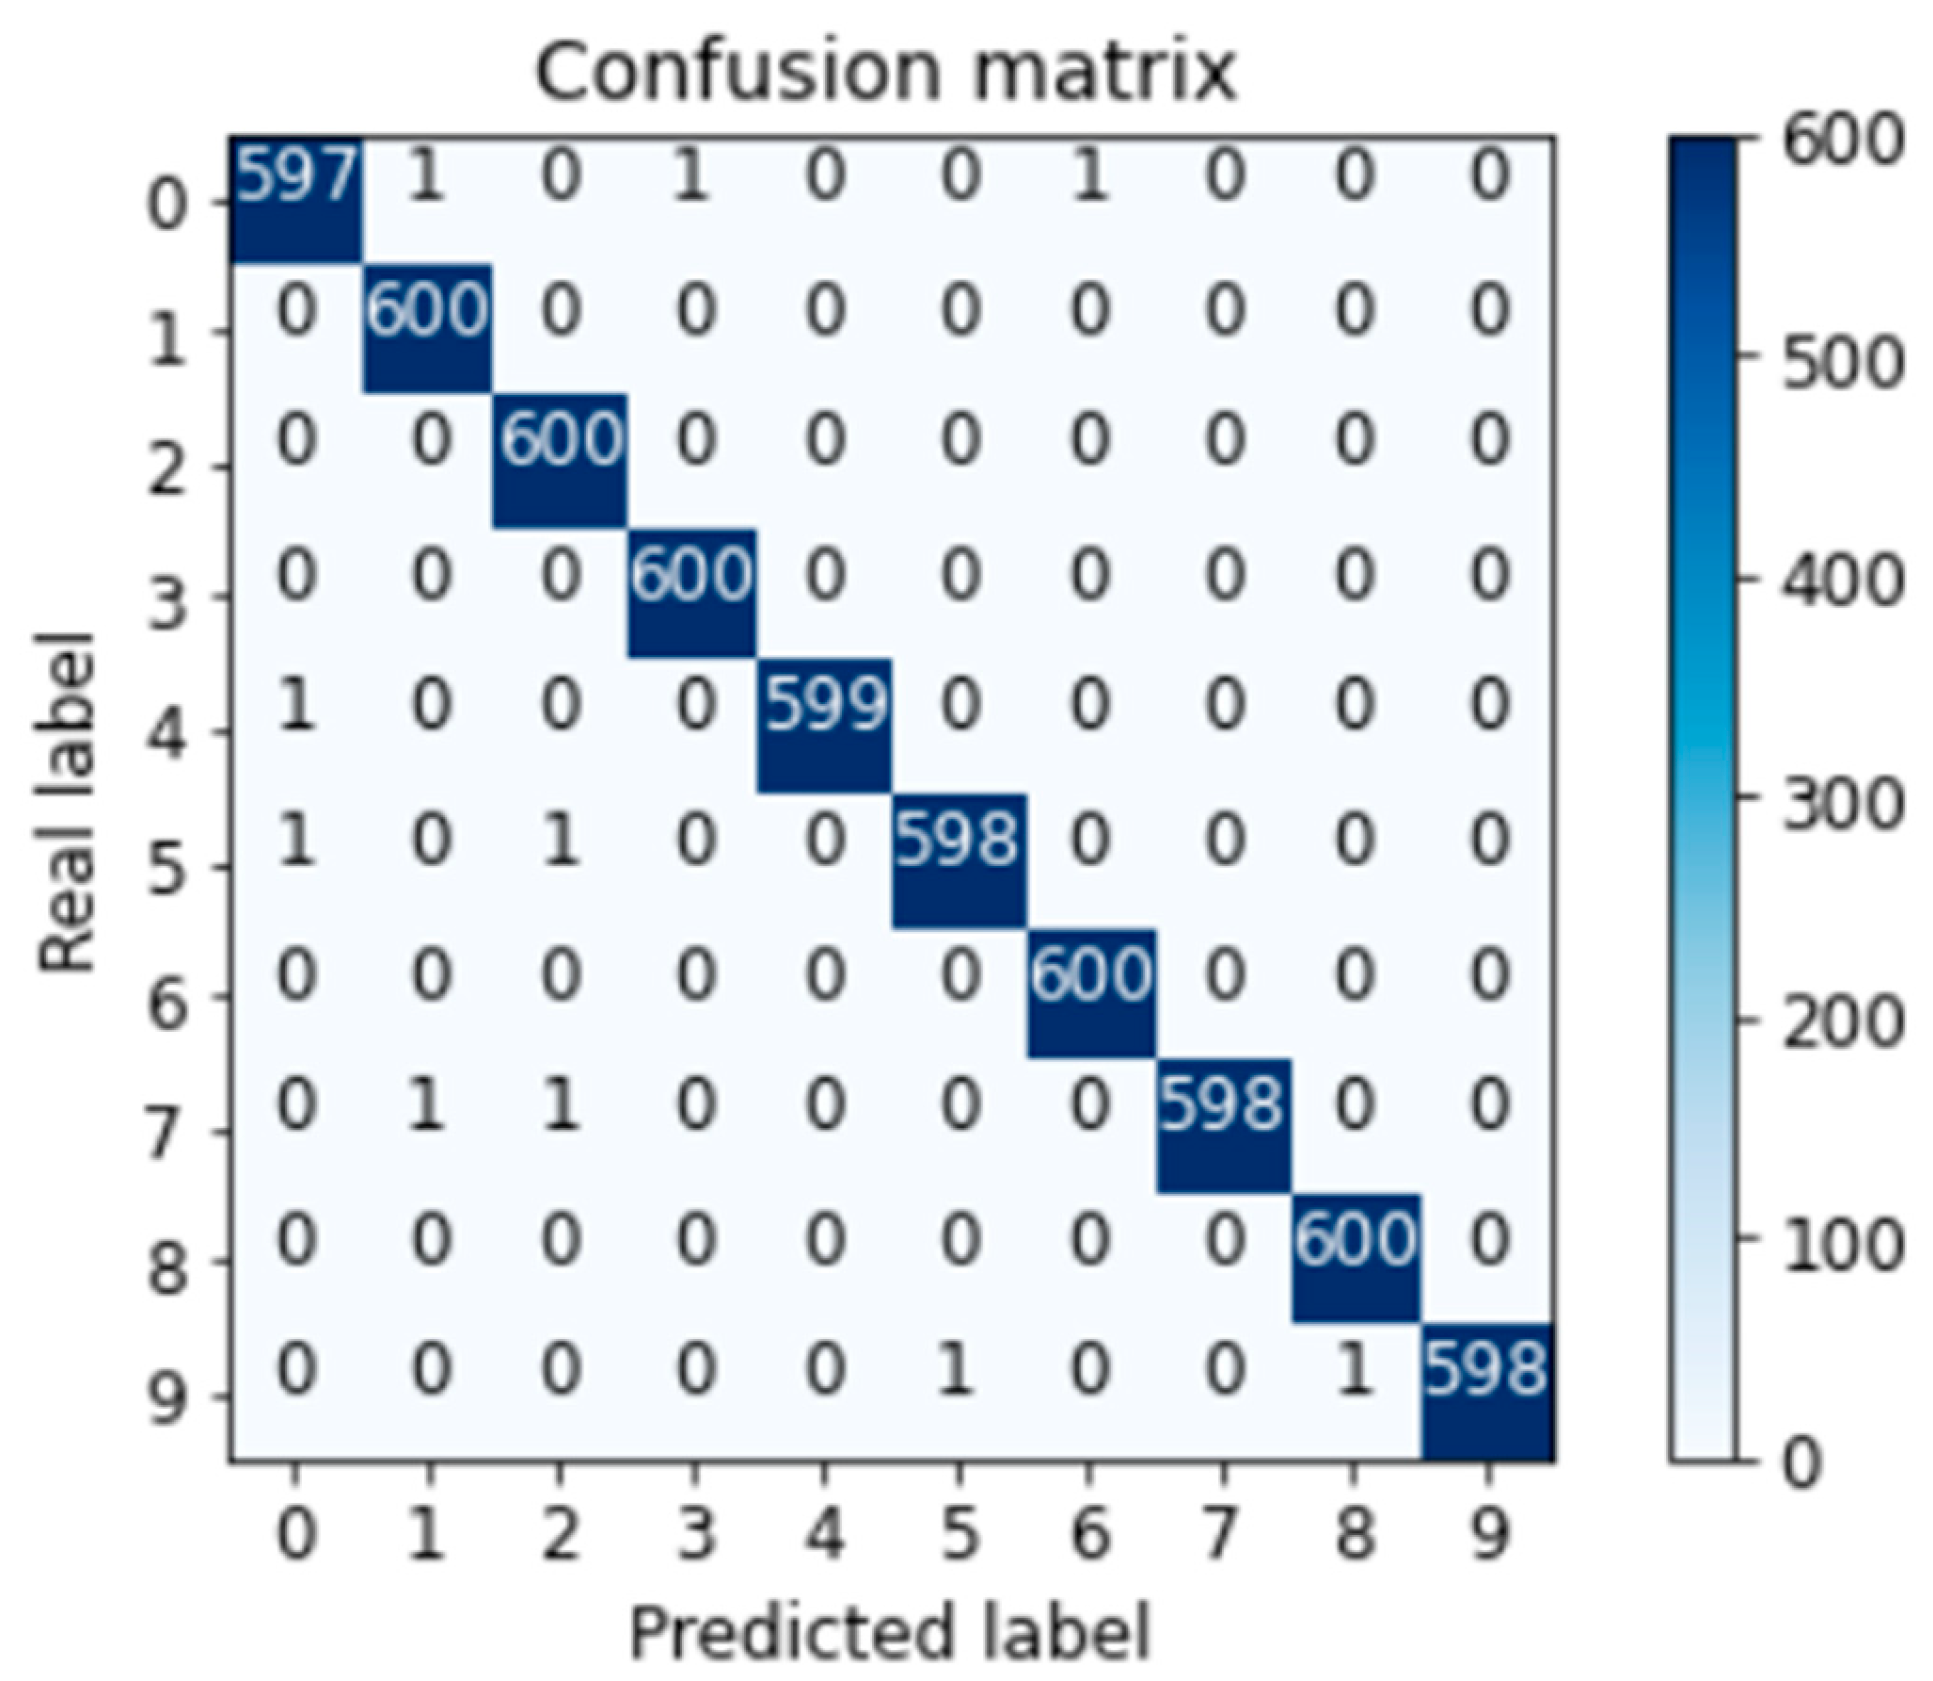
The results of each component are presented and explained in detail. The dataset is split into 80% for training and 20% for testing to ensure neutrality and avoid bias. After training, the models’ performance is evaluated using the Accuracy function from the TensorFlow library, with TensorBoard employed to continuously monitor performance accuracy and loss values during both training and testing. The results showed high accuracy and gradual improvement in performance across different epochs. Table 4 and Figure 8, Figure 9 and Figure 10 displayed the accuracy and loss values. The false-positive rate reached 0.000185, confirming the reliability of the proposed models and their efficiency in generating strong and effective encryption keys.
Table 4.
Model performance comparison: accuracy and loss.
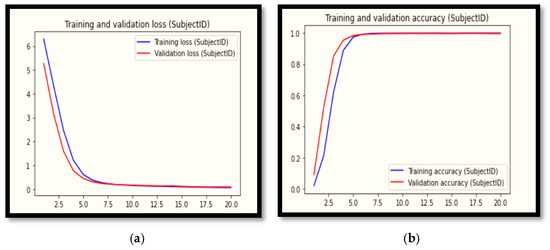
Figure 8.
Accuracy (a) and loss (b) curves of the subjectID model.
Figure 9.
Accuracy (a) and loss (b) curves of the FingerNum model.
Figure 10.
Confusion matrix and accuracy metric.
The testing and training loss values are very low, indicating that the model learns efficiently and generalizes well to new data. The testing and training accuracy values are very high, exceeding 99 percent, which shows that the model provides highly accurate and reliable fingerprint classification results. Overall, the model demonstrates strong and stable performance with excellent efficiency on both training and testing data. The SubjectID and FingerNum recognition models achieved perfect or near-perfect ac-curacy, with precision, recall, and F1-score reaching 1.00 across all classes, confirming the effectiveness of the proposed recognition framework. Figure 8 illustrates the accuracy (a) and loss (b) curves of the subjectID model. It can be observed that both training and validation accuracy increased rapidly from the beginning of training, reaching approximately 100%, indicating that the model learned the patterns with high precision. Moreover, the loss values gradually decreased for both training and validation data until approaching zero, demonstrating that the model has excellent learning efficiency and a high ability to generalize without signs of overfitting.
Figure 9 shows the accuracy (a) and loss (b) curves for the FingerNum model, where the training and validation accuracy gradually increased until they approached 100%, while the loss clearly decreased until it neared zero, indicating that the model has strong performance and excellent stability in the process of finger type recognition.
The confusion matrix in Figure 10 shows that the model correctly recognizes most classes, with very few errors between some classes, reflecting high accuracy and strong performance in finger type classification.
5.1.2. Results of the Encryption Key Evaluation and Related Metrics
The neural key generated from the CNN model is evaluated using specialized metrics to ensure its quality and effectiveness against cyberattacks, including key size and randomness tests such as entropy and repetition. Experiments are conducted in the Kaggle environment using fingerprint images sized 96 × 96.
- (1)
- Key Space Analysis
The designed key consists of 1024 values (0–255), yielding a total size of 1024 bytes and an extremely large key space (28192, providing strong resistance against brute-force attacks). Despite this high theoretical security, practical performance evaluation is essential to ensure compliance with modern security requirements.
- (2)
- Privacy, Template Security, and Key Revocability Considerations
The proposed framework relies on deep features extracted from biometric images without using or storing raw biometric data, thereby reducing privacy risks. These features are transformed through nonlinear mechanisms using the Particle Swarm Optimization (PSO) algorithm, making the generated encryption keys non-invertible and difficult to reconstruct. To support key revocability, multiple encryption keys can be derived from the same biometric input by introducing controlled randomness during the key generation framework, which avoids permanent storage of biometric templates, further enhancing template security and resistance to biometric-specific attacks.
- (3)
- Encryption Key Tests
Six fingerprint samples are used to generate six encryption keys, each evaluated across eight metrics to assess quality and randomness. All keys successfully passed the tests, demonstrating high unpredictability and suitability for high-security encryption applications.
Entropy Test
Entropy is used to measure the randomness of the key, where the ideal value is 8 bits, indicating complete randomness. The entropy of the key is calculated using Equation (3) in Section 2.4.
The results, summarized in Table 5, confirm the robustness of the proposed keys against security threats.
Table 5.
Entropy test results for the generated keys.
Repetition Test
The repetition test is conducted to evaluate the presence of repeated segments within the key sequence, whether adjacent or non-adjacent, ensuring no patterns reduce randomness or compromise security. The repetition index (R) is calculated as follows [38]:
R = Number of repeated segments in the key/Total number of segments
A value of (R) close to zero indicates high key randomness. The results for all generated keys confirm low predictability and strong security, with all values obtained from the test being zero when executed.
Uniformity Test Using the Chi-Squared Method
The uniformity test is a key statistical approach to evaluate the homogeneity of encryption key values. It compares the observed distribution of key values with the expected ideal distribution using the Chi-squared test, calculated as
where:
- χ2: Represents the Chi-Square statistic.
- Qi: The observed frequency or value for category i.
- Ei: The expected frequency or value for category i.
- k: The total number of categories.
- If the chi-square (χ2) value is low, it indicates that the actual distribution of values is close to the ideal distribution, meaning the key is evenly distributed [39]. At a significance level of 0.05, keys with χ2 < 293.25 are considered to have passed the test, confirming a uniform distribution. The detailed outcomes are presented in Table 5: Results of the uniformity test.
Adjacent Repetition Test
The Adjacent Repetition Test is a fundamental tool for assessing the randomness of encryption keys, as it measures the occurrence of consecutive repetitions between bits or segments. The metric is calculated as follows:
where
N denotes the key length, and represents the bit or segment at position (i). High values of (R) indicate weak randomness due to repeated patterns, whereas values approaching zero reflect minimal repetition, signifying a stronger key with enhanced security. The practical results of this test, presented in Table 5, confirm the high randomness of the generated keys, with values close to zero indicating minimal adjacent repetition.
Pearson Correlation Test
The Pearson Correlation Test is a statistical measure used to assess the degree of linear dependence between two variables. In the context of encryption keys, it evaluates the correlation between consecutive segments, where a coefficient close to zero indicates minimal correlation, reflecting high randomness and strong resistance against analytical attacks. The test is calculated as
where:
- R: Pearson correlation coefficient.
- Xi: Individual values in the first series.
- Yi: Individual values in the second series (e.g., lagged values in time series).
- X−: Mean of the Xi values.
- Y−: Mean of the Yi values [40]. The results demonstrate that the generated keys achieve coefficients close to zero, confirming minimal linear dependence and enhanced cryptographic strength, as presented in Table 5.
Stability Test
The stability test is designed to verify the reliability of the key generation process by ensuring that identical input data consistently produces the same key. Conversely, even minor variations in the input must result in significantly different keys, thereby strengthening the system’s resistance to potential attacks. For a fixed input I, the system should always generate the same key K: F(I) = K. Repeated key generation using the same input I must yield identical results across all trials:
K1 = K2 = ⋯ = Kn
The practical results of this evaluation are summarized in Table 6, confirming the stability and security efficiency of the generated keys.
Table 6.
Stability and security evaluation of generated keys.
Sensitivity to Minor Changes (Inclusivity Effect)
The sensitivity test assesses the encryption system’s response to slight input variations. A minor modification applied to input (I) produces a new input (I’), generating a different key (K’) such that
F(I′) = K′
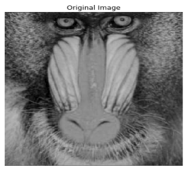
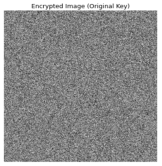
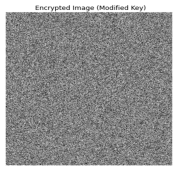
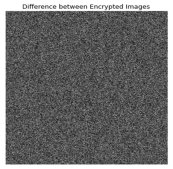
The difference between the original key (K) and the modified key (K’) is quantified using the Bit Change Rate (BCR). For a secure encryption system, the BCR should exceed 50%, ensuring that even minimal changes in the input lead to significant differences in the generated keys, thereby reinforcing resistance against analytical attacks. The outcomes of this evaluation are presented in Table 5, while the encryption results using both original and modified keys are shown in Table 7.
Table 7.
Results of encryption with original and modified keys.
Range Test
The range test measures the variability of key values, where a wider range indicates stronger exploration of the key space, while a narrower range reflects weaker randomness. It is calculated as
where (K) denotes the generated key values, and (max(K)) and (min(K)) represent the maximum and minimum values, respectively [41]. A wider range serves as a key indicator of value diversity, enhancing encryption strength and reducing the likelihood of repetitive patterns. The outcomes of this test are presented in Table 5.
Range = max(K) − min(K)
Autocorrelation Test:
The autocorrelation test measures the similarity between a sequence and its shifted version. Low autocorrelation across different shifts indicates high randomness and minimal predictability. It is defined as
where (R(d)) is the autocorrelation coefficient at lag (d), (Xi) and (Xd+i) are sequence values, and (n) is the sequence length. Values of (R(d) approximately 0) confirm strong randomness in the encryption key [42]. The outcomes of this test are reported in Table 8.
Table 8.
Results of the autocorrelation test.
5.1.3. Results of Applying PSO to Enhance the Encryption Key
After the predefined iterations, the PSO algorithm converges to the optimal encryption key, identified as the solution achieving the highest fitness value. The fitness function plays a central role in guiding the swarm toward keys with improved randomness and security. The effectiveness of PSO in refining and strengthening the generated key is presented in Table 5.
5.1.4. Comparison of Accuracy Between the Proposed Models and Existing Systems
This section presents a rigorous comparative analysis of the proposed system models against state-of-the-art approaches reported in recent literature. Experimental results show that the proposed models achieve accuracy rates exceeding 99%, underscoring their high effectiveness and reliability. This analysis further highlights the impact of modern deep learning architectures on fingerprint data processing and cybersecurity. The results confirm that advanced neural networks not only enhance encryption accuracy but also consistently outperform traditional methods, demonstrating significant improvements in both efficiency and security. Table 9 provides a detailed comparison of the proposed models relative to other contemporary approaches.
Table 9.
Comparative analysis of the proposed models and recent approaches.
Discussion of the Results of the Key Generated by the CNN Model
The results demonstrate that the key generated by the CNN model integrated with PSO achieved high accuracy, ranging between 99.73% and 99.83% within only 20 training epochs, outperforming most modern models listed in Table 9. For instance, the enhanced VGG-16 model reached 99.98% accuracy but required 100 epochs, while DeepFKTNet 98.89% in 60 epochs. This highlights the efficiency of the proposed approach in achieving high accuracy with reduced training time, attributed to the synergy between CNN and PSO, which enhanced feature extraction and supported the generation of strong, highly random keys. Moreover, the biometric key derived from CNN parameters extracted from fingerprints demonstrated uniqueness, resistance to tampering, and advanced security with low risk of duplication or replication. Overall, the proposed framework provides an effective solution for generating biometric encryption keys that combine computational efficiency, randomness, and robustness.
The Role of the PSO Algorithm in Key Enhancement
The integration of PSO with CNNs plays a pivotal role in enhancing the quality of encrypted keys by optimizing the extracted parameters during generation, thereby improving randomness, independence, and robustness. On one hand, CNNs provide a powerful capability for extracting fine biometric features, while PSO strengthens key security through parameter optimization, increasing their efficiency against cyber threats. As a result of this synergy, the system achieves higher classification accuracy with reduced training time, alongside the generation of strong keys that are difficult to replicate or manipulate. This raises the protection level of biometric data and establishes a comprehensive framework that combines computational efficiency with security resilience. Accordingly, the proposed approach offers an effective solution to address contemporary cybersecurity challenges, including advanced and adversarial attacks.
5.2. Results of the Proposed Encryption Method
The experiments conducted on standard images from the USC-SIPI database confirmed the effectiveness of the proposed color image encryption method, where the encrypted images achieved high randomness based on entropy measurements and low correlation between adjacent pixels. The method also demonstrated strong resistance against brute-force, statistical, differential, and noise attacks. Moreover, it showed remarkable computational efficiency, Moreover, the proposed method demonstrated remarkable computational efficiency across different image sizes, as detailed in Table 10, which presents the execution time analysis of the proposed encryption system for images with varying resolutions, confirming its scalability and suitability for practical applications.
Table 10.
Encryption execution time for different image sizes.
Table 11 presents the details of the adopted images, confirming that the proposed method achieves a balance between security strength and computational efficiency, highlighting its applicability in modern encryption systems.
Table 11.
Details of the images utilized in the experiments of the proposed technique.
5.2.1. Information Entropy
Information entropy is a key measure of randomness and thus an important indicator of encryption efficiency. For color images, entropy is calculated for each channel (R, G, B), and values close to the ideal 8.0 signify high unpredictability, making statistical analysis and data recovery without the correct key infeasible. As shown in Table 12, the entropy values of the encrypted images consistently approach 8.0 across all channels, confirming the proposed method’s ability to ensure high randomness, strong confidentiality, and robustness against entropy-based attacks.
Table 12.
Entropy values of colored images across different channels.
In an additional experiment, the proposed method is applied to the Baboon color image, as shown in Table 13 The results demonstrated that the proposed algorithm achieved a higher average entropy compared to other recent approaches, with values very close to the ideal 8.0. These findings confirm the efficiency of the method in generating encrypted images with high randomness and ensuring strong confidentiality.
Table 13.
Entropy comparison for the encrypted baboon image.
Table 13 shows that the proposed algorithm achieved an entropy value of 7.9989, which is very close to the ideal value of 8.0, indicating strong randomness in the encrypted images. It also outperformed most recent methods and produced results comparable to the best, confirming its efficiency in strengthening resistance against statistical attacks.
5.2.2. Correlation Analysis
Original images exhibit strong correlation between adjacent pixels, while an effective encryption algorithm aims to remove this correlation. In the encrypted images, the correlation coefficients in horizontal, vertical, and diagonal directions for each color channel (R, G, and B) are close to zero, indicating high randomness and preventing statistical prediction. The results in Table 14 show that the proposed algorithm successfully breaks pixel correlation, enhancing the system’s resistance to statistical attacks.
Table 14.
Correlation coefficients of color images.
The results in Table 15 clearly show that the proposed method outperforms other recent techniques in terms of correlation coefficients.
Table 15.
Comparison of correlation coefficients for the baboon image.
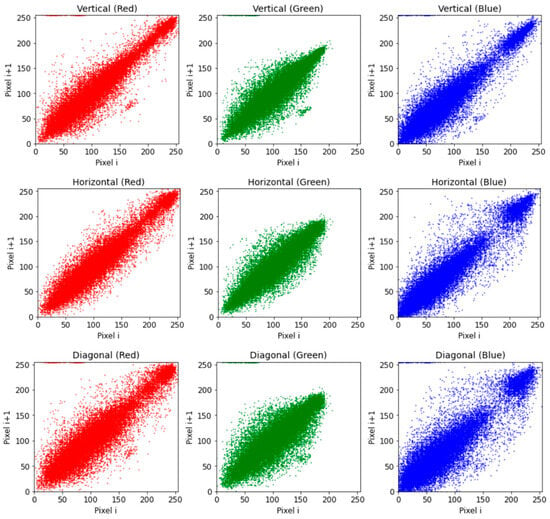
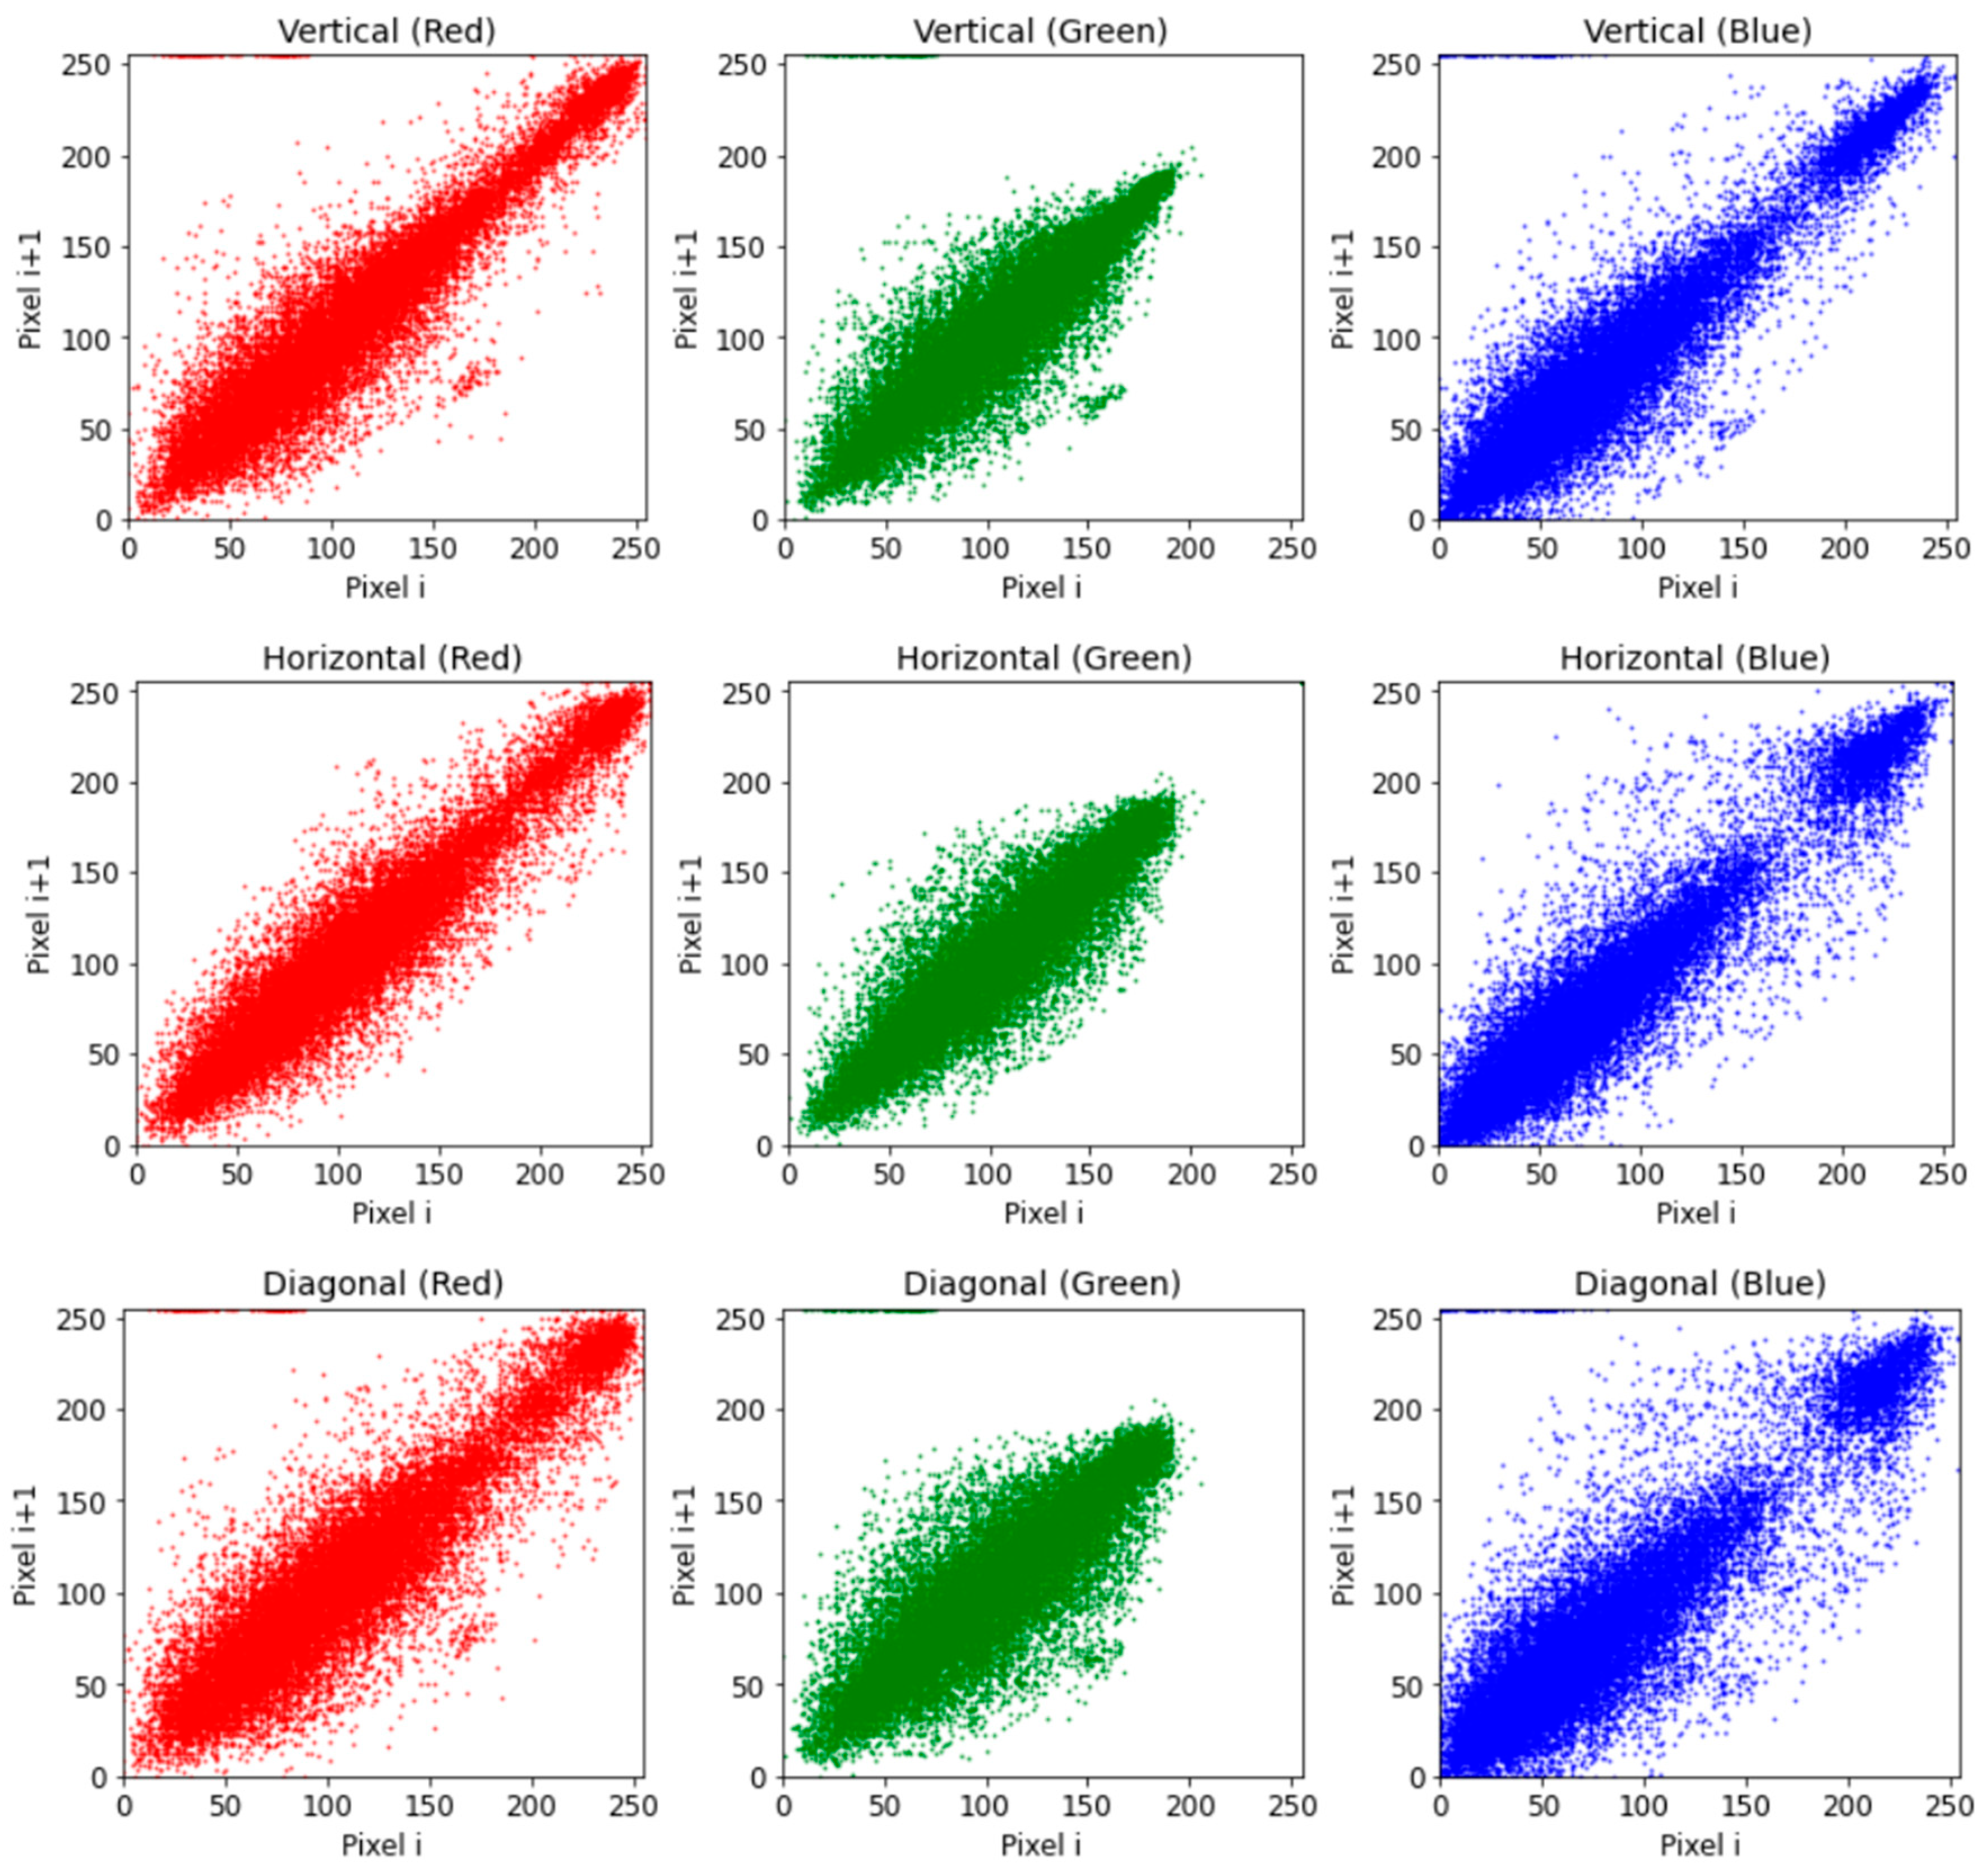
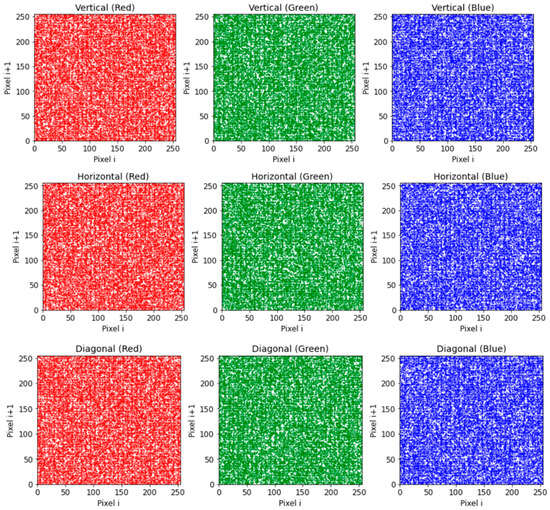
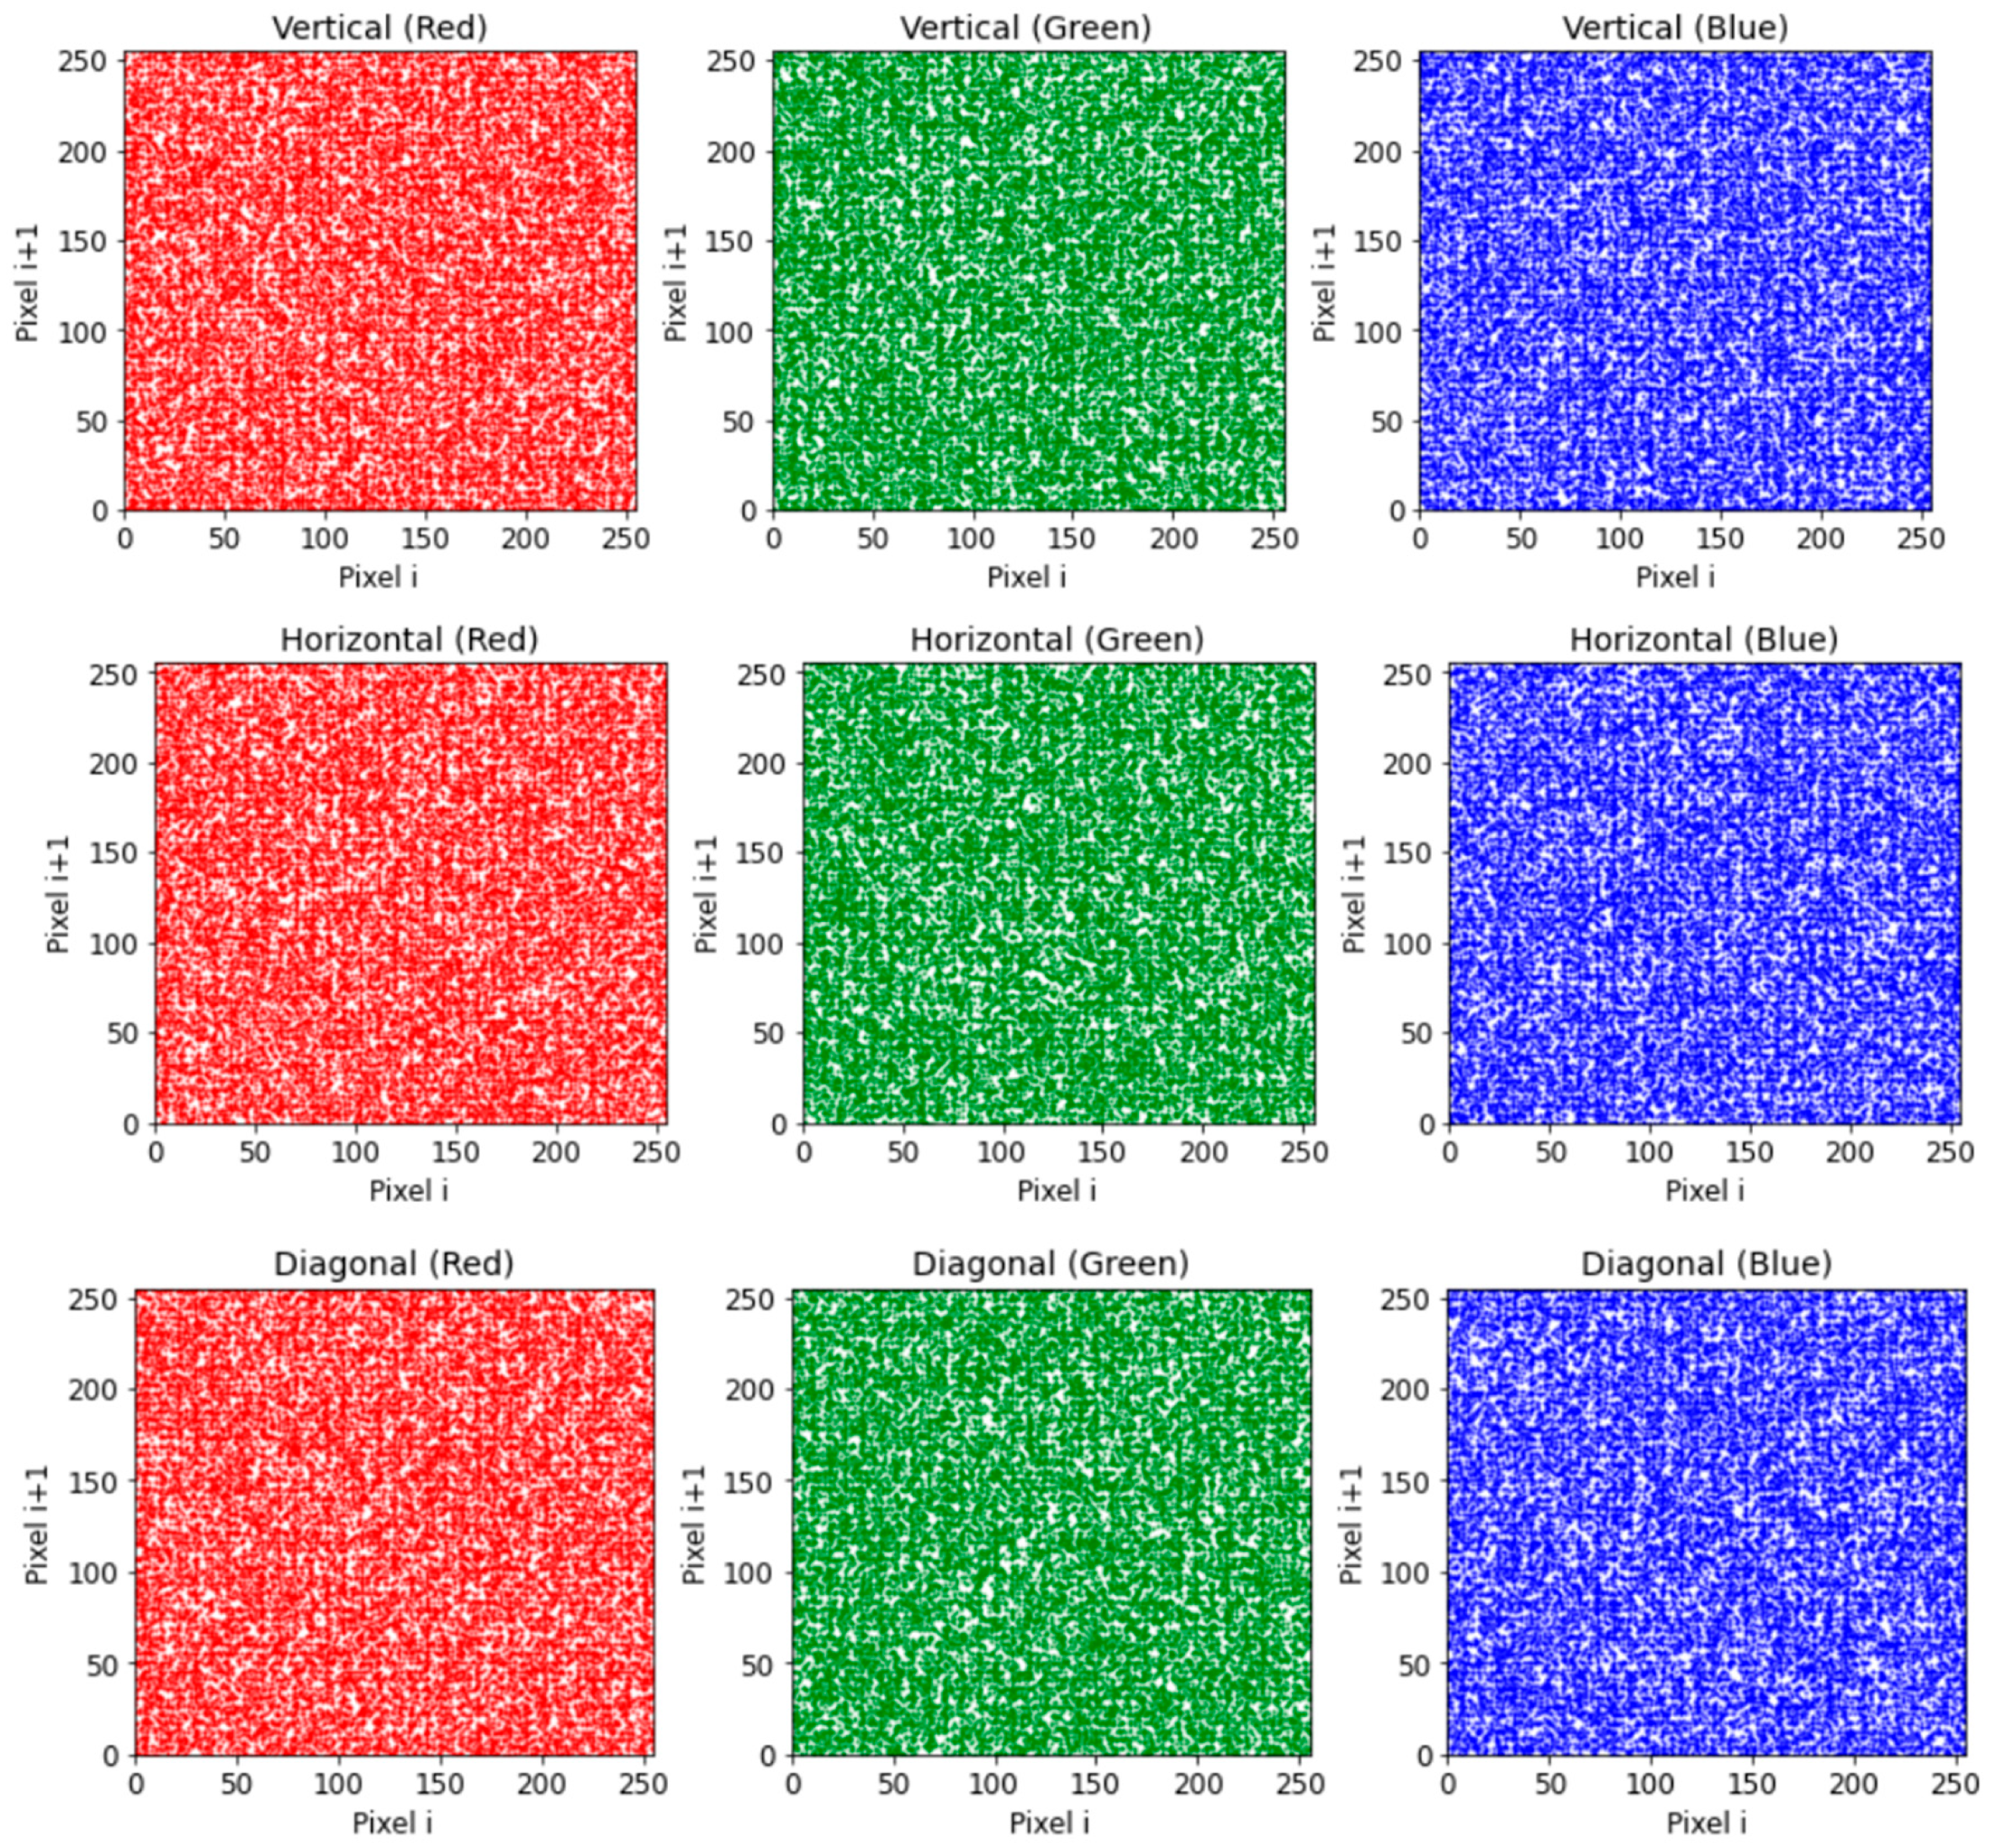
We conducted a comparative analysis with the method of F. Saeed et al. [48]. Table 15 highlights the superiority of the proposed approach in terms of correlation coefficients. The proposed method achieved lower values across most directions (H, V, D) and color channels, with significant improvements in the vertical and diagonal orientations. This reduction demonstrates a stronger ability to break inter-pixel dependencies, thereby enhancing randomness and limiting statistical predictability. As shown in Table 15 and Figure 11 and Figure 12, the encrypted image exhibits a clear reduction in pixel clustering compared to the original, confirming the effectiveness of the algorithm in correlation suppression and strengthening encryption robustness.
Figure 11.
Correlation analysis of the baboon image across three directions (RGB channels).
Figure 12.
Correlation analysis of the encrypted baboon image in three directions for the color channels.
5.2.3. Differential Attack Resistance
Resistance to differential attacks is measured using NPCR (Number of Pixels Change Rate) and UACI (Unified Average Changing Intensity), which quantify how much the encrypted image changes when a minor modification is applied to the input.
where D(i, j) is defined as
Here, (E1) and (E2) are two encrypted versions of the original image generated by altering a single random pixel [57]. High NPCR and UACI values indicate strong resistance to differential attacks, as confirmed by the results summarized in Table 16.
Table 16.
NPCR and UACI results for various color images.
The results in Table 16 show that NPCR and UACI values for all three color channels (R, G, B) closely match the theoretical benchmarks, with NPCR exceeding 99.5% and UACI around 33%. These high values confirm the proposed method’s strong resistance to differential attacks, as minor input changes produce substantial variations in the encrypted output, enhancing randomness and overall security. A comparative analysis with recent methods is summarized in Table 17.
Table 17.
NPCR and UACI comparison for the baboon image using various methods.
Table 17 shows that the proposed method achieves NPCR and UACI values near the ideal, confirming strong resistance to differential attacks and enhanced encryption security.
5.2.4. Histogram Analysis
The histogram of a color image represents the distribution of pixel intensities across grayscale levels. For an encryption algorithm to be effective, the histogram of the encrypted image should differ significantly from that of the original image. While the histogram of the original image typically shows a non-uniform distribution due to its inherent structure and patterns, the histogram of a securely encrypted image should exhibit a nearly uniform distribution, indicating that pixel values have been effectively randomized without bias or distortion. Histogram variance is used as a quantitative measure to assess the degree of uniformity, calculated as follows:
where
- (Y): Pixel intensity frequencies (counts of each grayscale level).
- (N): Number of levels in (Y) (usually 256 for grayscale images).
- (Yi, Yj): Individual values in the set [62].
- Low variance → uniform histogram → strong resistance to statistical attacks.
- High variance → patterns present → weaker encryption.
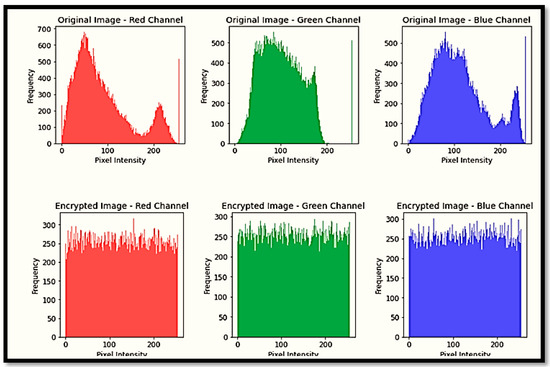
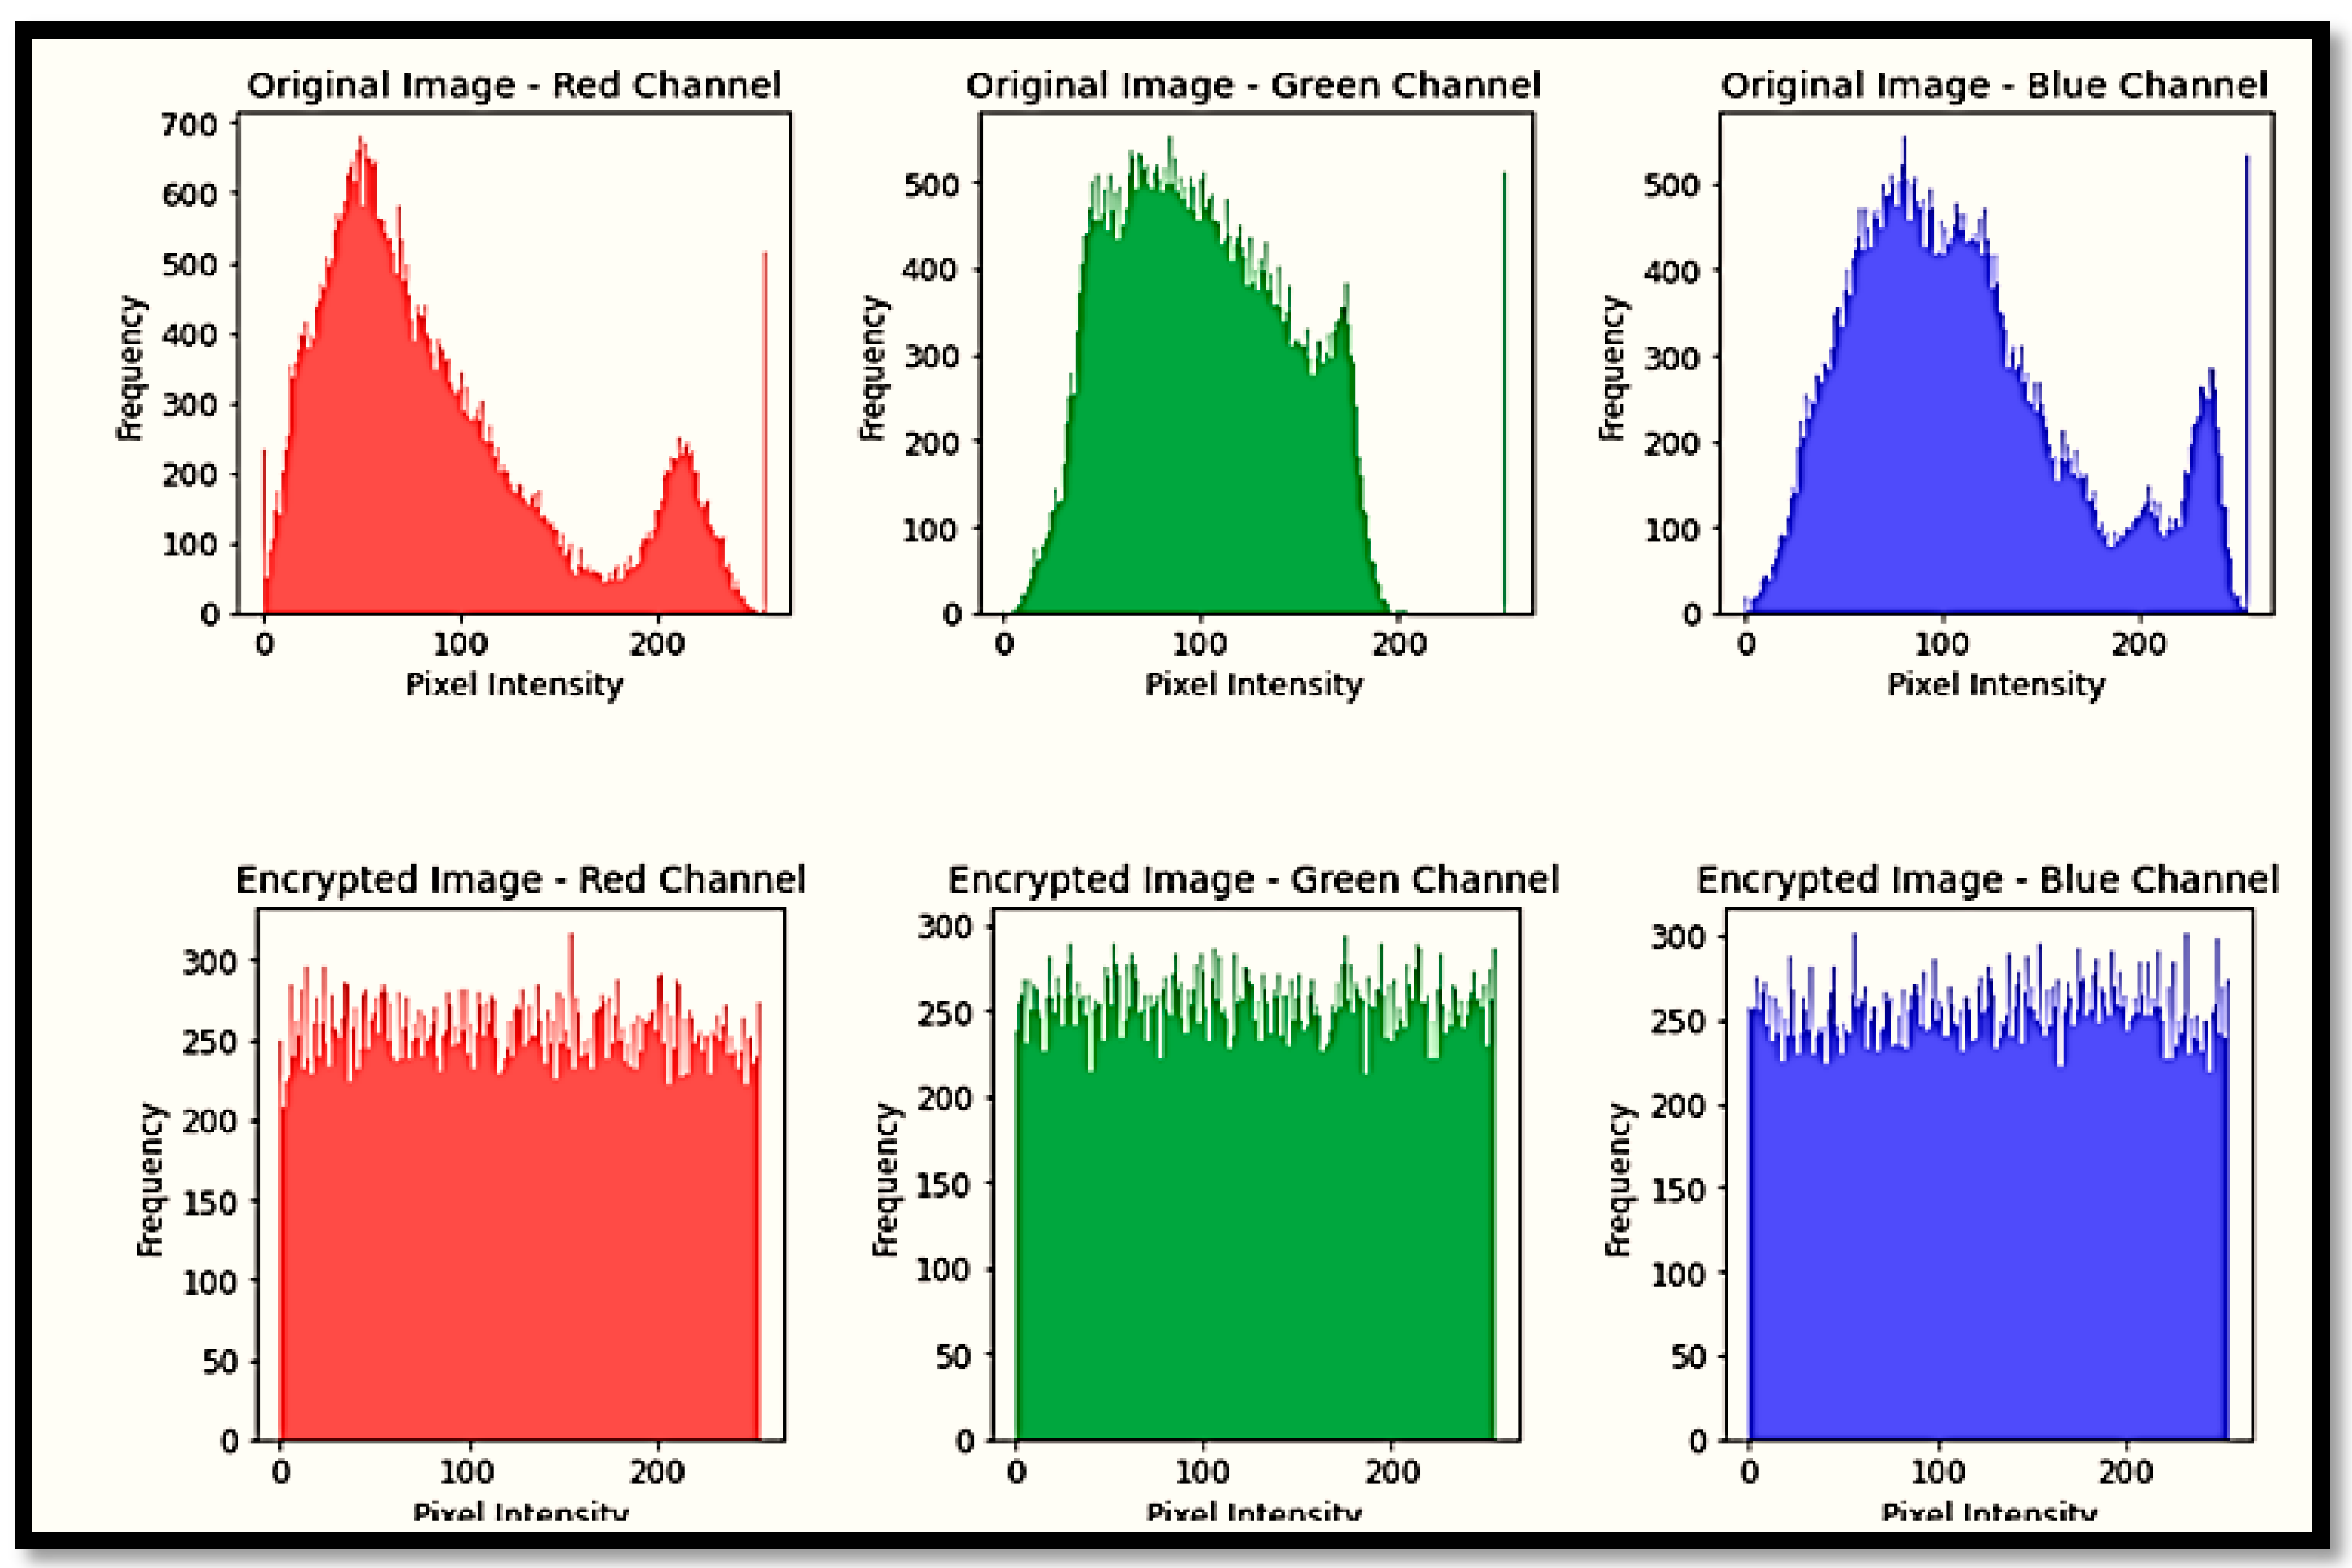
As presented in Table 18, the encrypted images obtained using the proposed method achieve significantly lower variance values compared to the original images, confirming their enhanced uniformity. Furthermore, Table 19 provides a comparative evaluation against an existing method, where the proposed scheme demonstrates superior performance. Additionally, Figure 13 shows the histograms of the R, G, and B channels of the original and encrypted baboon image. While the original histograms reveal non-uniform distributions, the encrypted ones display near-uniform behavior. This combination of statistical evidence (Table 18 and Table 19) and visual validation (Figure 13) strongly supports the effectiveness of the proposed encryption algorithm and its robustness against statistical attacks.
Table 18.
Histogram variance of images with the proposed method.
Table 19.
Histogram variance comparison between proposed and previous methods.
Figure 13.
Histograms of the original vs. encrypted “baboon” image.
The results in Table 19 show that the proposed method achieves lower variance than both the original images and Hussain, M et al., (2022) [44], ensuring more uniform pixel distribution, higher randomness, and stronger resistance to statistical attacks.
5.2.5. Noise and Data Cropping Attacks
The ability to resist noise and partial data loss is a key criterion for evaluating the strength of any image encryption algorithm. Encrypted images transmitted over networks may be subjected to random interference or partial cropping, which can affect their accurate recovery. To assess the efficiency of the proposed system, the Peak Signal-to-Noise Ratio (PSNR) is employed, calculated as
where MSE (Mean Squared Error) is defined as
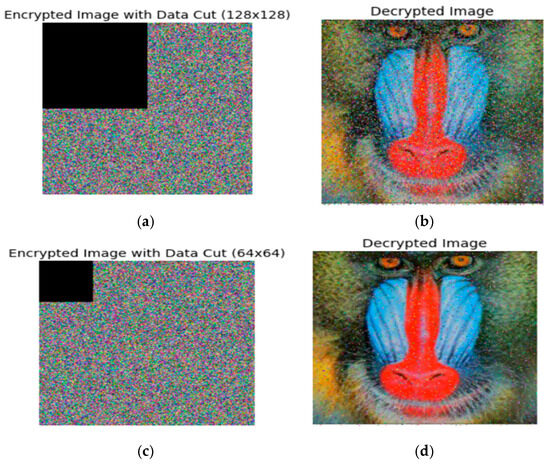
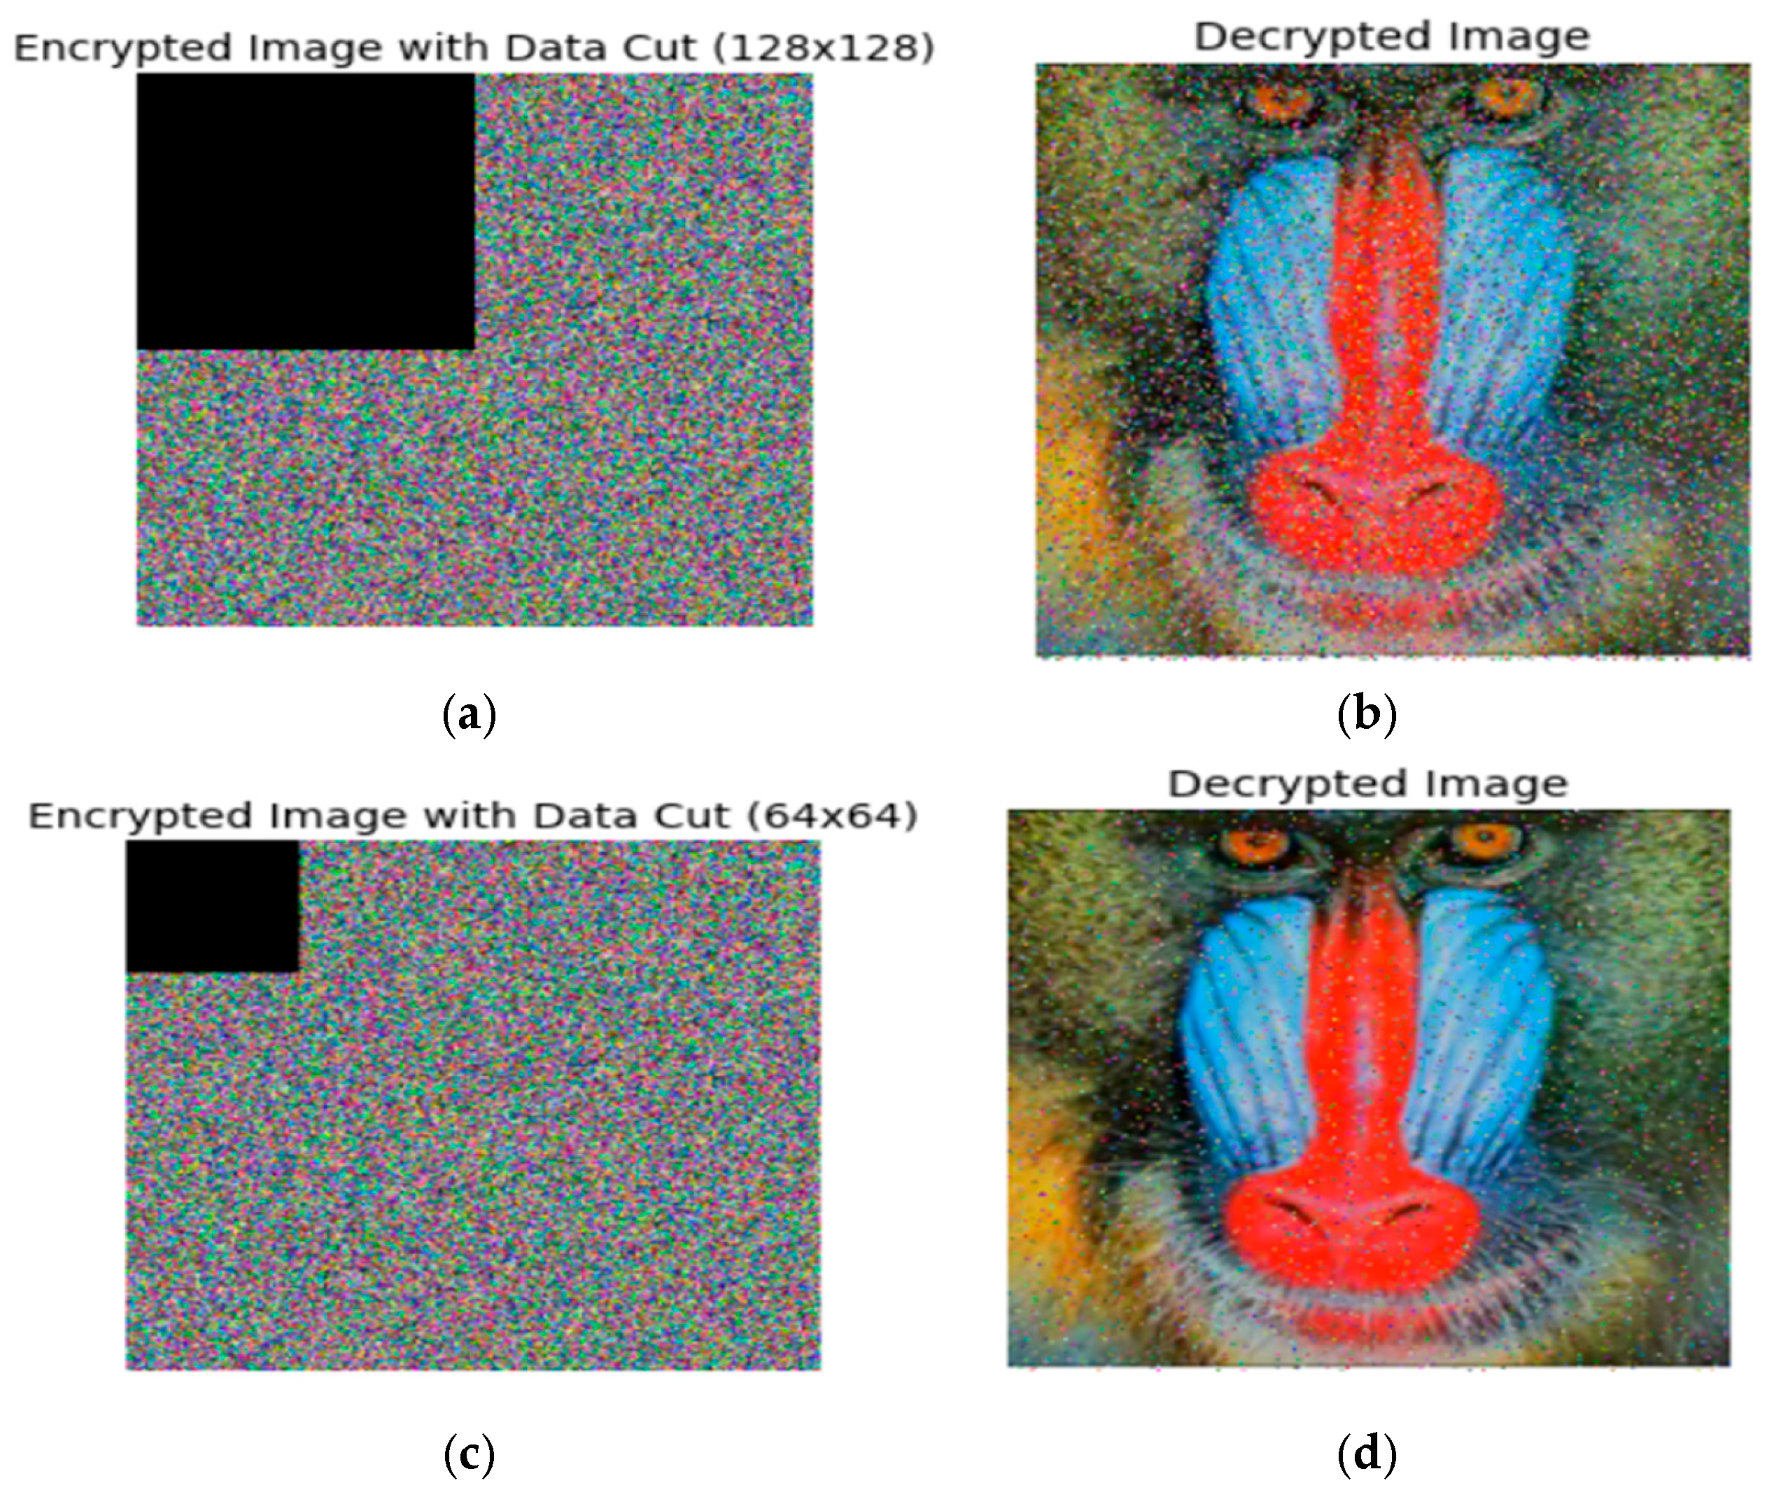
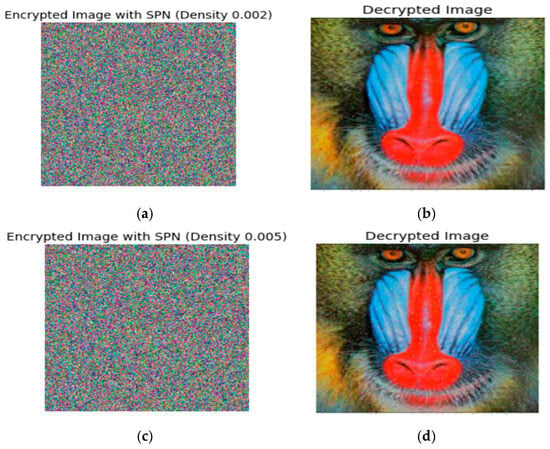
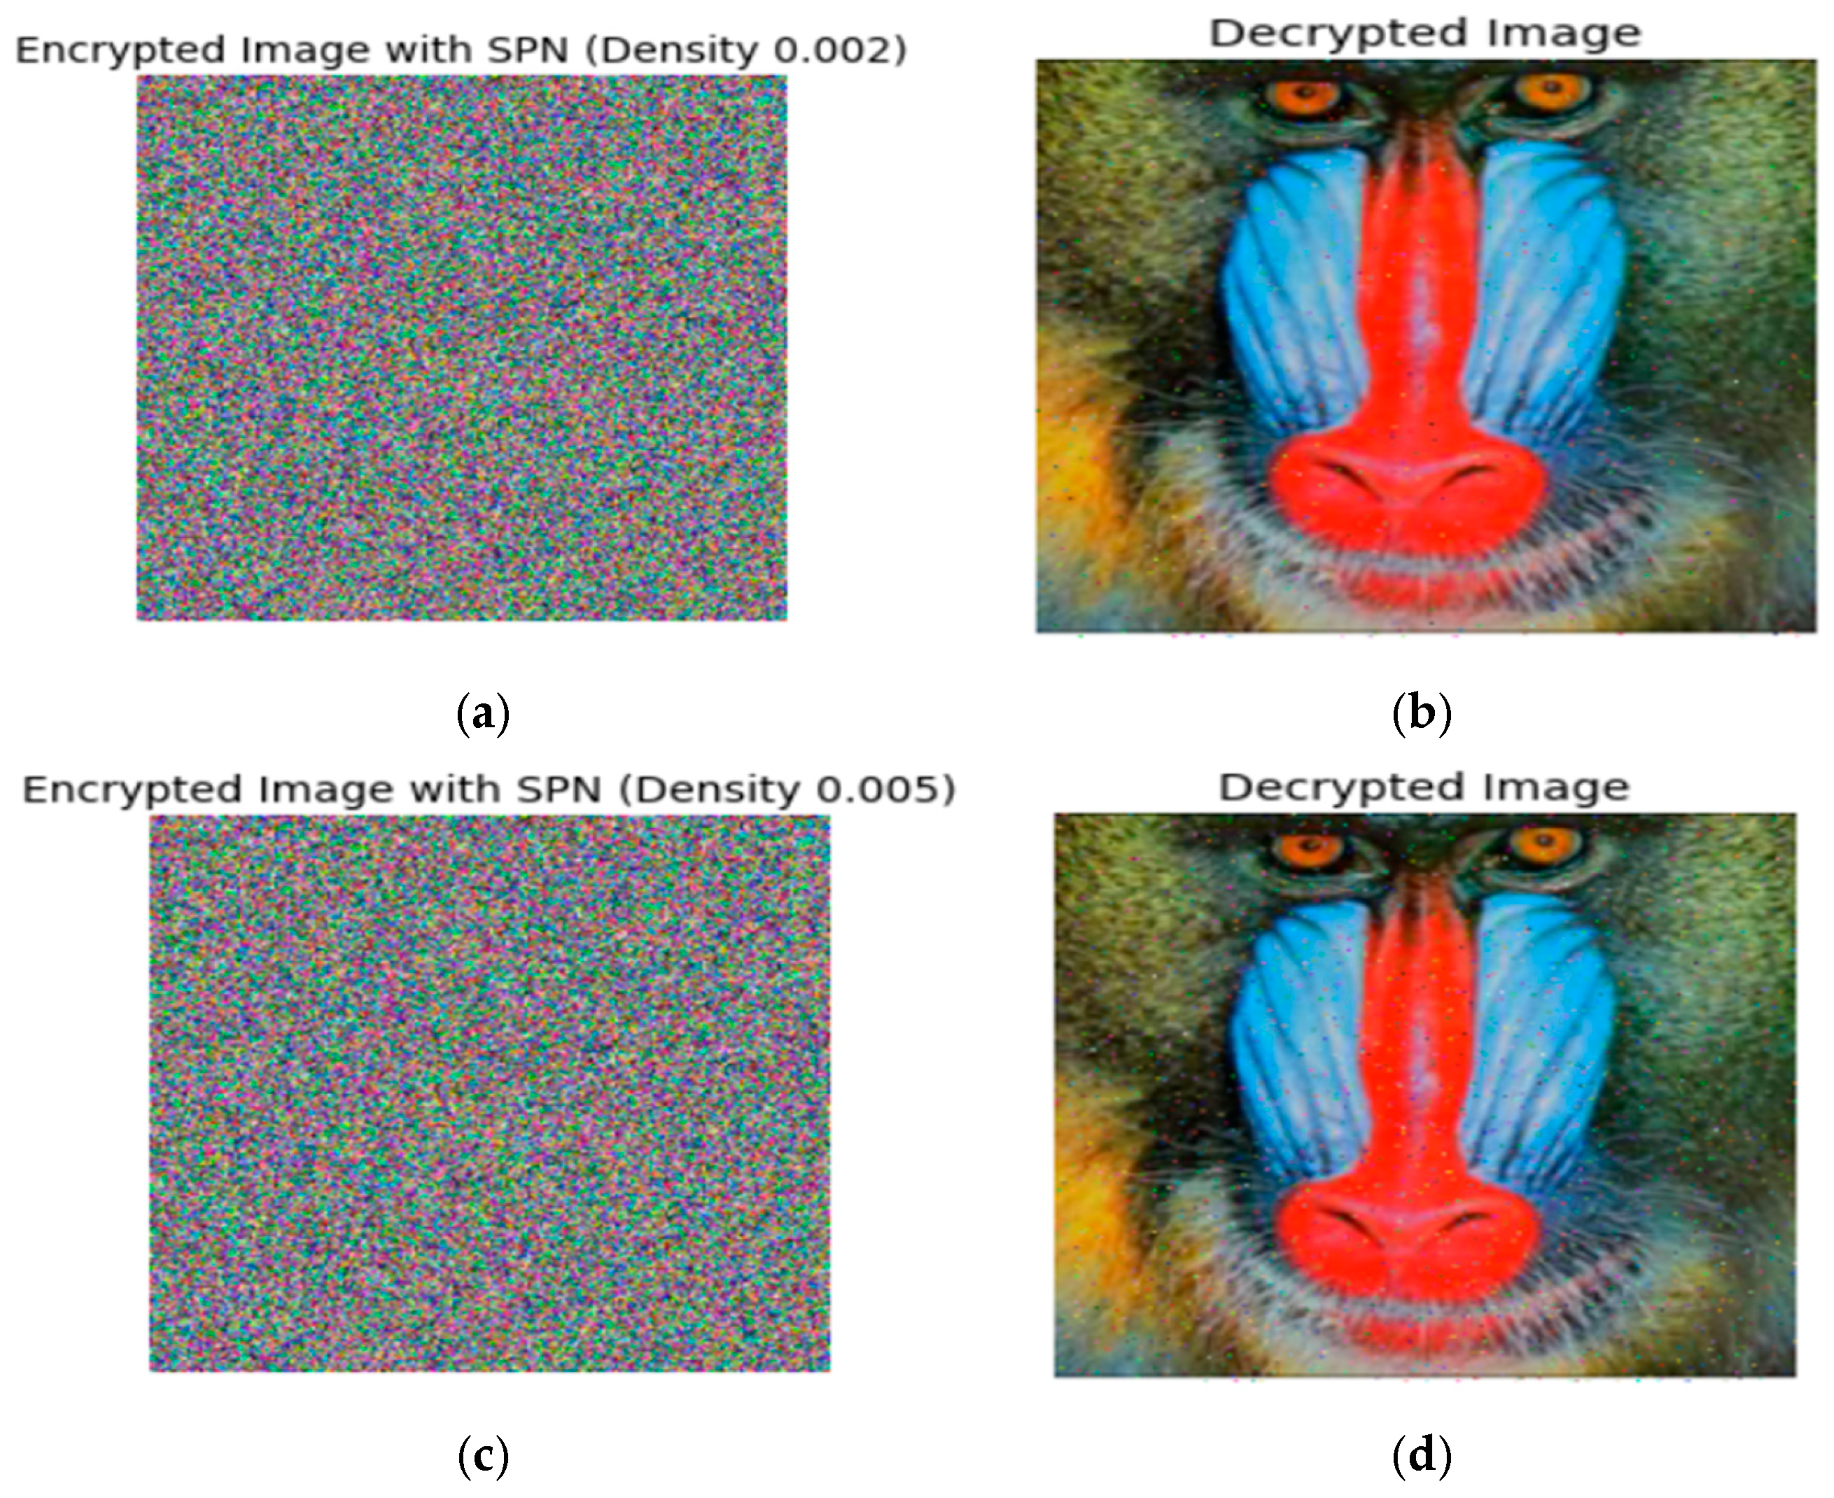
with (Io) and (Id) representing the original and decrypted images, respectively. Higher PSNR values indicate more accurate recovery, with values above 35 dB generally signifying near-perfect visual similarity. The experimental results (Figure 14 and Figure 15, and Table 20) demonstrate the robustness of the proposed algorithm against both noise (including “salt and pepper”) and data cropping attacks, confirming its strong performance and reliable recovery even under highly adverse conditions.
Figure 14.
Effect of data cropping on the “baboon” image: (a) cropped region 128 × 128, (b) corresponding decrypted image, (c) cropped region 64 × 64, (d) corresponding decrypted image.
Figure 15.
Impact of salt-and-pepper noise on the “baboon” image: (a) noise level 0.05, (b) corresponding decrypted image, (c) noise level 0.02, (d) corresponding decrypted image.
Table 20.
Assessment of encryption resilience to noise and data cropping.
According to standard PSNR benchmarks, image recovery quality can be classified as excellent when PSNR values exceed 45 dB, indicating near-perfect reconstruction; very good when values surpass 42 dB, with negligible visual differences; and acceptable around 34 dB, where minor degradation is observed but main features remain discernible. Based on these standards, the results in Table 20 demonstrate that the proposed encryption scheme exhibits remarkable resistance to various attacks, including noise interference and data loss. Even when subjected to distortion or cropping, the decrypted images retain high visual fidelity and structural clarity. Moreover, the method shows strong resilience against a wide range of cryptographic attacks—KPA, CPA, differential, statistical, and brute-force—due to the generation of a unique key for each transmission, effectively preventing key reuse and pattern prediction. This dynamic key strategy eliminates fixed dependencies exploitable by attackers. The consistently high PSNR values across RGB channels further validate the robustness of the approach, confirming excellent image restoration even under Salt & Pepper noise and cropping conditions, where both image clarity and essential features are effectively preserved.
6. Conclusions
This study demonstrates that integrating biometric techniques with deep learning represents a significant breakthrough in encryption key generation. The proposed system dynamically creates a unique key for each transmission based solely on the recipient’s fingerprint, eliminating the need for key transfer or reuse and ensuring an exceptionally high level of security. The generated keys exhibit high randomness and are resistant to replication or guessing, further strengthened by the PSO algorithm. Activation functions play a crucial role, with the tanh function outperforming ReLU by distributing values more evenly, increasing randomness, and enhancing training stability, while Batch Normalization may reduce key strengths in this context. This research clearly highlights the substantial advantage of using CNNs to enhance traditional methods such as AES. CNNs extract highly distinctive and unique features from biometric data, increasing the strength of the resulting keys and making them more resistant to both traditional and digital attacks. This integration of deep learning and AES not only improves randomness but also enhances personalized protection for each user through keys directly linked to their biometric identity, achieving a level of security unattainable with conventional methods alone.
Table 21 presents the abbreviations used in the proposed image encryption system. Furthermore, this approach has broad applicability across multiple domains, including IoT devices, secure cloud storage, financial transactions, medical imaging, and military communications. It demonstrates system flexibility and adaptability to future developments, including lightweight encryption for embedded systems and resilience against emerging threats such as quantum computing. Despite some limitations related to dataset specificity and computational demands for generating very large keys, the proposed framework proves to be an innovative, robust, and scalable solution, with exceptional potential to strengthen the security and efficiency of conventional digital encryption.
Table 21.
Abbreviations of the proposed image encryption system.
Author Contributions
S.A.S.A., H.A.Y. and R.S.K. designed the study, performed the experiments, analyzed the data, and wrote and revised the manuscript. All authors have read and agreed to the published version of the manuscript.
Funding
This research received no external funding.
Data Availability Statement
The original contributions presented in this study are included in the article. Further inquiries can be directed to the corresponding author.
Acknowledgments
The authors would like to thank all individuals who contributed to this work.
Conflicts of Interest
The authors declare no conflicts of interest.
References
- Blay, K.B.; Darko, A.; Hwang, S.; Brilakis, I.; Foster, F.; Wei, R. Ensuring information security resilience in Digital-enabled Construction Projects (DCP) through quantum security technologies. Autom. Constr. 2025, 179, 106480. [Google Scholar] [CrossRef] [Scilit]
- Li, K. Digital media system design and visual art analysis based on information security. Meas. Sensors 2024, 31, 100978. [Google Scholar] [CrossRef] [Scilit]
- Ramesh, S.; Sukanth, B.N.; Jaswanth, S.S.; Singh, R.P. Enhancing Secure Data Transmission Through Deep Learning-Based Image Steganography and Super-Resolution Generative Adversarial Networks. SN Comput. Sci. 2024, 5, 1138. [Google Scholar] [CrossRef] [Scilit]
- Zhou, Z.; He, G.; Dou, Y. Advanced image encryption algorithm for Web3.0. Clust. Comput. 2025, 28, 634. [Google Scholar] [CrossRef] [Scilit]
- Alghamdi, Y.; Munir, A. Evaluating ASCON Lightweight Encryption Algorithm for Image Encryption. SN Comput. Sci. 2024, 5, 1043. [Google Scholar] [CrossRef] [Scilit]
- Hu, J.; Mo, X.; Lei, Y.; Huang, X.; Wang, D. Dynamically scattering medium-based security-enhanced optical image encryption using orbital angular momentum and deep learning. Results Phys. 2025, 69, 108100. [Google Scholar] [CrossRef] [Scilit]
- Feng, L.; Zhang, G.; Gu, H.; Feng, M.; Wang, C. Logistics supply chain security risk warning system based on CNN-PSO encryption algorithm. Neural Comput. Appl. 2025, 37, 28553–28583. [Google Scholar] [CrossRef] [Scilit]
- Sardar, T.H.; Dar, S.A.; Indhumathi, R.; Dhasmana, G.; Prasad, G.; Kumar, P. Integrating Blockchain and Quantum Key Exchange with Deep Learning for Enhanced Medical Data. Procedia Comput. Sci. 2025, 259, 1208–1217. [Google Scholar] [CrossRef] [Scilit]
- Huo, X.; Wang, X. Internet of things for smart manufacturing based on advanced encryption standard (AES) algorithm with chaotic system. Results Eng. 2023, 20, 101589. [Google Scholar] [CrossRef] [Scilit]
- Sharma, M.; Chawla, P. An image encryption algorithm using a XOR enhanced 2D-Henon map. Clust. Comput. 2025, 28, 367. [Google Scholar] [CrossRef] [Scilit]
- Biryukov, A.; De Cannière, C. Data Encryption Standard (DES). In Encyclopedia of Cryptography, Security and Privacy; Springer Nature: Cham, Switzerland, 2025; pp. 555–562. [Google Scholar] [CrossRef] [Scilit]
- Yogi, B.; Khan, A.K. Advancements in image encryption: A comprehensive review of design principles and performance metrics. Comput. Sci. Rev. 2025, 57, 100759. [Google Scholar] [CrossRef] [Scilit]
- Kumar, R.R.; Shankar, S.V.; Jaiswal, R.; Ray, M.; Budhlakoti, N.; Singh, K.N. Advances in Deep Learning for Medical Image Analysis: A Comprehensive Investigation. J. Stat. Theory Pract. 2025, 19, 9. [Google Scholar] [CrossRef] [Scilit]
- Badreddine, A.; Boukezzoula, N.-E.; Bekkouche, T. Enhancing multimodal biometric security through fundamental transforms and modified sigmoid fusion. Clust. Comput. 2025, 28, 768. [Google Scholar] [CrossRef] [Scilit]
- Liu, G.; Xu, G.; Wang, C.; Xu, G. Hyper-Chaos and CNN-Based Image Encryption Scheme for Wireless Communication Transmission. Comput. Mater. Contin. 2025, 84, 4851–4868. [Google Scholar] [CrossRef] [Scilit]
- Yang, X.; Li, H. LEM-PSO: A lightweight evolutionary-state-driven multiple information learning particle swarm optimization algorithm. Neural Comput. Appl. 2025, 37, 22667–22688. [Google Scholar] [CrossRef] [Scilit]
- Natarajan, N.; Venugopal, M. Hybrid butterfly optimization and back propagation neural network for enhanced smart city data classification. Environ. Sci. Pollut. Res. 2025, 32, 16469–16488. [Google Scholar] [CrossRef] [Scilit]
- David, P.F.; Kothandapani, S.D.; Pugalendhi, G.K. Crayfish optimization-based secure encryption of medical images with 7D hyperchaotic maps. Int. J. Mach. Learn. Cybern. 2025, 16, 7369–7389. [Google Scholar] [CrossRef] [Scilit]
- Saini, A.; Sehrawat, R. An intelligent and efficient CNN-AES framework for image block encryption with a multi-key approach. Eng. Res. Express 2025, 7, 015206. [Google Scholar] [CrossRef] [Scilit]
- Vishnupriya, V.; Sarathambekai, S. Optimized AES with GAN Model for Secure Medical Image Transmission. Int. J. Recent Innov. Trends Comput. Commun. 2025, 13, 95–100. [Google Scholar]
- Alghamdi, Y.; Munir, A. Image Encryption Algorithms: A Survey of Design and Evaluation Metrics. J. Cybersecur. Priv. 2024, 4, 126–152. [Google Scholar] [CrossRef] [Scilit]
- Wang, J.; Song, X.; El-Latif, A.A.A. Single-Objective Particle Swarm Optimization-Based Chaotic Image Encryption Scheme. Electronics 2022, 11, 2628. [Google Scholar] [CrossRef] [Scilit]
- Nair, B.V.; Muni, S.S.; Durdu, A. Deep learning and chaos: A combined approach to image encryption and decryption. arXiv 2024, arXiv:2406.16792. [Google Scholar]
- Asaolu, O.O.; Adanigbo, O.S.; Oyewole, T.O.; Soladoye, A.A. Convolutional Neural Network-Based Data Encryption Model for Multimedia Files Using Advanced Encryption Standard Algorithm. UNIABUJA J. Eng. Technol. 2025, 2, 114–126. [Google Scholar]
- Odeh, A.; Taleb, A.A.; Alhajahjeh, T.; Navarro, F.; Ayesh, A. Lightweight secure image encryption: A tent map chaos theory approach. Multimed. Tools Appl. 2025, 84, 42379–42398. [Google Scholar] [CrossRef] [Scilit]
- Singh, M.; Sood, S.K.; Bhatia, M. Post-quantum Cryptography: A Review on Cryptographic Solutions for the Era of Quantum Computing. Arch. Comput. Methods Eng. 2025, 1–42. [Google Scholar] [CrossRef] [Scilit]
- Bhadauria, P.K.S.; Zanjad, N.; Kalamkar, S.G.; Ranit, A.; Chaudhary, P. Neural networks, CNNs, and hybrid models in structural retrofitting: A deep learning perspective. Asian J. Civ. Eng. 2025, 26, 4499–4516. [Google Scholar] [CrossRef] [Scilit]
- Mahdi, A.A.; Hoobi, M.M. Robust and Efficient Methods for Key Generation using Chaotic Maps and A2C Algorithm. Mesopotamian J. Cybersecur. 2025, 5, 301–318. [Google Scholar] [CrossRef] [Scilit]
- Li, H.; Jiang, L.; Ganaa, E.D.; Li, P.; Shen, X.-J. Robust feature enhanced deep kernel support vector machine via low rank representation and clustering. Expert Syst. Appl. 2025, 271, 126612. [Google Scholar] [CrossRef] [Scilit]
- Cai, Y.; Zhou, Q.; Deng, Y. PSO-ECM: Particle swarm optimization-based evidential C-means algorithm. Int. J. Mach. Learn. Cybern. 2024, 15, 4133–4153. [Google Scholar] [CrossRef] [Scilit]
- El Romeh, A.; Snášel, V.; Mirjalili, S. Dholes-inspired optimization (DIO): A nature-inspired algorithm for engineering optimization problems. Clust. Comput. 2025, 28, 853. [Google Scholar] [CrossRef] [Scilit]
- Twumasi, E.; Frimpong, E.A.; Prah, N.K.; Gyasi, D.B. A novel improvement of particle swarm optimization using an improved velocity update function based on local best murmuration particle. J. Electr. Syst. Inf. Technol. 2024, 11, 42. [Google Scholar] [CrossRef] [Scilit]
- Guo, W.; Li, L.; Chen, M.; Ni, W.; Wang, L.; Li, D. Balancing convergence and diversity preservation in dual search space for large scale particle swarm optimization. Appl. Soft Comput. 2025, 169, 112617. [Google Scholar] [CrossRef] [Scilit]
- Gouse, N.K.; Chandra Sekaran, G.K. Secured and effective task scheduling in cloud computing using Levy Flight—Secretary Bird Optimization and Hash-based Message Authentication Code—Secure Hash Authentication 256. Sustain. Comput. Inform. Syst. 2025, 48, 101211. [Google Scholar] [CrossRef] [Scilit]
- Jirdehi, M.A.; Abdi, H.; Dousti, H. Adaptive energy management for battery swapping stations using HMDE-PSO: Optimizing charge-discharge control against cyber-physical attacks. Expert Syst. Appl. 2026, 298, 129860. [Google Scholar] [CrossRef] [Scilit]
- Si, Y.; Xu, M.; Yang, F. Hierarchical contrastive learning and color standardization for single image sand-dust removal. Pattern Anal. Appl. 2024, 27, 5. [Google Scholar] [CrossRef] [Scilit]
- Singh, P.; Dutta, S.; Pranav, P. Optimizing GANs for Cryptography: The Role and Impact of Activation Functions in Neural Layers Assessing the Cryptographic Strength. Appl. Sci. 2024, 14, 2379. [Google Scholar] [CrossRef] [Scilit]
- Aslan, M.; Doğanaksoy, A.; Saygı, Z.; Sönmez Turan, M.; Sulak, F. Observations on NIST SP 800-90B entropy estimators. Cryptogr. Commun. 2025. [Google Scholar] [CrossRef] [Scilit]
- Taylor, O.E.; Igiri, C.G. Enhancing image encryption using histogram analysis, adjacent pixel autocorrelation test in chaos-based framework. Int. J. Comput. Appl. 2024, 186, 22. [Google Scholar]
- Al-Mahmood, H.H.; Alsaad, S.N. Innovative Lightweight Encryption Schemes Leveraging Chaotic Systems for Secure Data Transmission. Intell. Autom. Soft Comput. 2025, 40, 53–74. [Google Scholar] [CrossRef] [Scilit]
- Foreman, C.; Yeung, R.; Curchod, F.J. Statistical Testing of Random Number Generators and Their Improvement Using Randomness Extraction. Entropy 2024, 26, 1053. [Google Scholar] [CrossRef] [Scilit]
- Dong, H.; Kotenko, I.; Dong, S. A lightweight vision transformer with weighted global average pooling: Implications for IoMT applications. Complex Intell. Syst. 2025, 11, 215. [Google Scholar] [CrossRef] [Scilit]
- Hashem, M.I.; Hasen Kuban, K. Key generation method from fingerprint image based on deep convolutional neural network model. Nexo Rev. Científica 2023, 36, 906–925. [Google Scholar] [CrossRef] [Scilit]
- Saeed, F.; Hussain, M.; Aboalsamh, H.A. Automatic Fingerprint Classification Using Deep Learning Technology (Deep-FKTNet). Mathematics 2022, 10, 1285. [Google Scholar] [CrossRef] [Scilit]
- Wu, Z.; Lv, Z.; Kang, J.; Ding, W.; Zhang, J. Fingerprint bio-key generation based on a deep neural network. Int. J. Intell. Syst. 2022, 37, 4329–4358. [Google Scholar] [CrossRef] [Scilit]
- Saini, A.; Sehrawat, R. Enhancing Data Security through Machine Learning-based Key Generation and Encryption. Eng. Technol. Appl. Sci. Res. 2024, 14, 14148–14154. [Google Scholar] [CrossRef] [Scilit]
- Nguyen, H.T.; Nguyen, L.T. Fingerprints Classification through Image Analysis and Machine Learning Method. Algorithms 2019, 12, 241. [Google Scholar] [CrossRef] [Scilit]
- Saeed, F.; Hussain, M.; Aboalsamh, H.A. Classification of live scanned fingerprints using histogram of gradient descriptor. In Proceedings of the 2018 21st Saudi Computer Society National Computer Conference (NCC), Riyadh, Saudi Arabia, 25–26 April 2018; IEEE: New York, NY, USA, 2018; pp. 1–5. [Google Scholar] [CrossRef] [Scilit]
- Saeed, F.; Hussain, M.; Aboalsamh, H.A. Classification of Live Scanned Fingerprints using Dense SIFT based Ridge Orientation Features. In Proceedings of the 2018 1st International Conference on Computer Applications & Information Security (ICCAIS), Riyadh, Saudi Arabia, 4–6 April 2018; IEEE: New York, NY, USA, 2018; pp. 1–4. [Google Scholar] [CrossRef] [Scilit]
- El Ghouate, N. A high-entropy image encryption scheme using optimized chaotic maps with Josephus permutation strategy. Sci. Rep. 2025, 15, 29439. [Google Scholar] [CrossRef] [Scilit]
- Song, R.; Zhao, H. Security-Enhanced Image Encryption: Combination of S-Boxes and Hyperchaotic Integrated Systems. IEEE Access 2025, 13, 105151–105164. [Google Scholar] [CrossRef] [Scilit]
- Alexan, W.; ElBeltagy, M.; Aboshousha, A. RGB Image Encryption through Cellular Automata, S-Box and the Lorenz System. Symmetry 2022, 14, 443. [Google Scholar] [CrossRef] [Scilit]
- Rakhra, M.; Singh, P.; Singhal, A.; Singh, P.; Sarkar, T.; Kumar, A. Optimizing Energy Efficiency in Public Sector Cloud Data Centers Through Machine Learning Driven Steganographic Manner. In Proceedings of the 2025 3rd International Conference on Communication, Security, and Artificial Intelligence (ICCSAI), Greater Noida, India, 4–6 April 2025; IEEE: New York, NY, USA, 2025; pp. 1–6. [Google Scholar] [CrossRef] [Scilit]
- Hayatdavoudi, M.; Niri, M.E.; Kalhor, A. Comparative analysis of sandstone microtomographic image segmentation using advanced convolutional neural networks with pixelwise and physical accuracy evaluation. Sci. Rep. 2025, 15, 22164. [Google Scholar] [CrossRef] [Scilit]
- Guo, L.; Zhang, J.; Zhu, T.; Xiao, S.; Liu, Y.; Li, B. Study on the Influence of Collision Scene on the Energy Dissipation Process for Train Collision. Appl. Sci. 2024, 15, 84. [Google Scholar] [CrossRef] [Scilit]
- Fan, W.; Li, T.; Wu, J.; Wu, J. Chaotic Color Image Encryption Based on Eight-Base DNA-Level Permutation and Diffusion. Entropy 2023, 25, 1268. [Google Scholar] [CrossRef] [Scilit] [PubMed]
- Jasim, O.A.; Amer, S.R.; Hussein, S.F.; Mehdi, S.A. Enhanced Image Encryption Using a Novel Chaotic System and Scramble Dithering Technique. Int. J. Saf. Secur. Eng. 2024, 14, 1465–1476. [Google Scholar] [CrossRef] [Scilit]
- Abed, Q.K.; Al-Jawher, W.A.M. Optimized Color Image Encryption Using Arnold Transform, URUK Chaotic Map and GWO Algorithm. J. Port Sci. Res. 2024, 7, 219–236. [Google Scholar] [CrossRef] [Scilit]
- Belam, M. Deimos Cipher: A High-Entropy, Secure Encryption Algorithm with Strong Diffusion and Key Sensitivity. Cryptol. Eprint Arch. 2025. [Google Scholar]
- Al-Dayel, I.; Nadeem, M.F.; Khan, M.A.; Abraha, B.S. An image encryption scheme using 4-D chaotic system and cellular automaton. Sci. Rep. 2025, 15, 19499. [Google Scholar] [CrossRef] [Scilit]
- Zhang, H.; Wang, X.; Wang, X.; Yan, P. Novel multiple images encryption algorithm using CML system and DNA encoding. IET Image Process. 2020, 14, 518–529. [Google Scholar] [CrossRef] [Scilit]
- Moya-Albor, E.; Romero-Arellano, A.; Brieva, J.; Gomez-Coronel, S.L. Color Image Encryption Algorithm Based on a Chaotic Model Using the Modular Discrete Derivative and Langton’s Ant. Mathematics 2023, 11, 2396. [Google Scholar] [CrossRef] [Scilit]














Disclaimer/Publisher’s Note: The statements, opinions and data contained in all publications are solely those of the individual author(s) and contributor(s) and not of MDPI and/or the editor(s). MDPI and/or the editor(s) disclaim responsibility for any injury to people or property resulting from any ideas, methods, instructions or products referred to in the content. |
© 2026 by the authors. Licensee MDPI, Basel, Switzerland. This article is an open access article distributed under the terms and conditions of the Creative Commons Attribution (CC BY) license.