


Abstract
This study examines the transformation of youth employment in Greece between 2000 and 2024, encompassing the pre-crisis period, the global financial and sovereign-debt crises, the economic adjustment programmes, the subsequent recovery, and the COVID-19 pandemic. Using harmonised Eurostat data for people aged 15–29, it analyses youth unemployment, the share of unemployed young people without work for at least twelve months, the proportion neither in employment nor in education or training (NEET), temporary employment, and part-time employment. The analysis traces changes across historically defined periods, identifies approximate changes in the direction of annual trends, and compares Greece’s trajectory with developments in other European Union countries. Principal component analysis (PCA), a statistical technique that summarises variation across related indicators, provides a supplementary measure of labour-market exclusion. Youth unemployment and the NEET rate peaked in 2013, whereas the long-term-unemployed share peaked in 2014, revealing delayed accumulation of labour-market exclusion. By 2024, youth unemployment had declined substantially, but the unemployment rate, long-term-unemployed share, and part-time-employment rate remained above their respective 2008 values. The study distinguishes exclusion from employment from the contractual and working-time arrangements of those in work. The supplementary index summarises unemployment, prolonged unemployment, and NEET status; it does not measure every aspect of insecure employment. Comparative estimates indicate substantial Greek divergence during the sovereign-debt crisis and only partial convergence thereafter. The crisis is therefore interpreted as an acceleration and restructuring of pre-existing youth labour-market vulnerabilities rather than a temporary interruption followed by complete restoration.
1. Introduction
The position of young people in the Greek labour market changed profoundly during the first quarter of the twenty-first century. Between 2000 and 2024, Greece experienced participation in the euro area, the global financial crisis, the sovereign-debt crisis, three economic adjustment programmes, extensive labour-market reforms, a prolonged recession, a gradual economic recovery, and the COVID-19 pandemic. These successive episodes affected not only young people’s access to employment but also the duration of unemployment, participation in education and training, and the contractual forms through which young workers entered employment.
Precarious employment is commonly associated with uncertainty regarding employment continuity, unstable or inadequate earnings, restricted access to employment-related protection, and limited control over working conditions (Kalleberg 2009). Nevertheless, non-standard and precarious employment should not be treated as equivalent. Temporary and part-time work may be voluntarily chosen or may provide a route into stable employment. Such arrangements are more appropriately interpreted as precarious when they are involuntary, recurrent, poorly protected, or associated with limited opportunities for advancement. Consequently, aggregate temporary- and part-time-employment rates indicate changes in employment form but do not, independently, demonstrate deterioration in job quality.
Young workers are especially exposed to economic downturns because they generally possess less work experience, shorter employment histories, weaker bargaining power, and fewer accumulated social-insurance entitlements. Their employment prospects depend heavily on new recruitment, which employers can postpone rapidly when economic uncertainty increases. Adjustment may therefore occur through reduced hiring, temporary contracts, shorter working hours, repeated transitions between employment and unemployment, or withdrawal from labour-force participation.
In Greece, the vulnerability of young workers preceded the sovereign-debt crisis. Before 2009, the labour market combined relatively strong protection for parts of the established workforce with high unemployment among labour-market entrants, extensive small-firm and seasonal employment, occupational segmentation, and limited institutional representation of workers outside standard employment relationships. Kretsos showed that traditional trade-union structures and regulatory mechanisms frequently failed to protect young people in insecure forms of work (Kretsos 2011). The crisis therefore did not create youth labour-market vulnerability from nothing. Rather, it interacted with structural weaknesses that had already restricted young people’s transition into stable employment.
The economic contraction beginning in 2008–2009 nevertheless represented a decisive historical turning point. Falling output, declining investment, firm closures, and fiscal consolidation caused an exceptional reduction in labour demand. The economic adjustment programmes were accompanied by reforms affecting wage determination, collective bargaining, minimum wages, dismissal procedures, and employment protection (Dedoussopoulos et al. 2013; Yannakourou and Tsimpoukis 2014). Because young people were disproportionately dependent on new hiring and frequently occupied marginal employment positions, they absorbed a substantial part of this adjustment. Youth unemployment increased dramatically, while long-term unemployment and the proportion of young people neither in employment nor in education or training also rose.
The consequences of this transformation cannot be evaluated through the headline unemployment rate alone. The unemployment rate covers individuals without work who are available for and actively seeking employment; it excludes economically inactive young people and provides no information about the employment conditions of those classified as employed (Eurostat n.d.). NEET stands for ‘neither in employment nor in education or training’. In this study, the NEET rate measures the percentage of people aged 15–29 who are not employed and have not participated in formal or non-formal education or training during the four weeks ending with the survey reference week (Eurostat 2026f). It includes both unemployed young people and those outside the labour force, provided that they are also outside education and training. Unlike the unemployment rate, its denominator is the corresponding youth population rather than only economically active young people (Eurostat 2026f). The long-term-unemployed share provides evidence of persistence among unemployed young people, whereas temporary- and part-time-employment rates describe changes in the contractual and working-time composition of youth employment. These indicators measure conceptually distinct processes and should therefore be examined separately before any attempt is made to combine them.
The temporal sequence of these outcomes is historically significant. An increase in unemployment may occur rapidly when recruitment collapses, whereas long-term unemployment accumulates only after individuals remain without work for an extended period. Similarly, unemployment may fall during a recovery even while temporary or part-time employment remains elevated. Improvement in one indicator therefore does not necessarily demonstrate a complete restoration of youth labour-market security. This distinction is especially important in Greece, where the recovery from the sovereign-debt crisis was gradual and where youth employment remained influenced by tourism seasonality, small-enterprise structures, family-based welfare provision, and comparatively limited unemployment protection (Demetriades 2018; OECD 2020).
The COVID-19 pandemic introduced a further but institutionally different interruption. Unlike the sovereign-debt crisis, the pandemic was met with employment-retention measures, business support, income assistance, contract suspensions, and restrictions on dismissals. Using Greek administrative, survey, and vacancy data, Betcherman et al. found that the initial employment decline resulted primarily from reduced hiring rather than increased separation rates (Betcherman et al. 2023). The pandemic thus illustrates why annual unemployment statistics may understate disruption affecting labour-market entrants: employment relationships already in place can be protected while opportunities for young people attempting to enter employment contract sharply.
Comparative evidence is also necessary because deterioration in Greece occurred within broader European economic shocks. Papadopoulos’s comparison of Greece and Ireland demonstrated that similar external pressures and policy agendas produced different youth-employment outcomes when they interacted with different welfare institutions, activation systems, and political conditions (Papadopoulos 2016). Changes in Greek indicators should consequently be assessed against contemporaneous European developments rather than interpreted entirely as country-specific effects. At the same time, Greece’s distinctive institutional trajectory means that comparative differences cannot automatically be attributed causally to any single reform or adjustment programme.
Against this background, the study addresses four research questions:
- i.
- How did youth unemployment, the long-term-unemployed share, NEET status, temporary employment, and part-time employment evolve in Greece between 2000 and 2024?
- ii.
- Do empirically estimated turning points in these indicators correspond to the conventional historical periodisation of the Greek crisis and recovery?
- iii.
- Did the post-crisis decline in youth unemployment coincide with improvement across other dimensions of labour-market exclusion and employment form?
- iv.
- How did the Greek trajectory differ from contemporaneous developments elsewhere in the European Union?
The study is a quantitative economic-history analysis of youth labour-market change in Greece. Its principal evidence consists of annual trajectories, historical-period comparisons, and European differentials for five harmonised Eurostat indicators. The statistical analyses have supporting roles: exploratory breakpoint selection describes candidate changes in trend, segmented regressions summarise the direction and pace of the historical trajectories, and fixed-effects models provide conditional comparative descriptions. PCA offers a supplementary summary of common variation among related indicators. These procedures do not independently validate the historical narrative or identify the causal effects of particular reforms.
Although the central crisis episode unfolded between 2008 and 2014, the investigation covers 2000–2024 to place that episode within a longer historical trajectory. The pre-crisis years establish whether youth disadvantage preceded the sovereign-debt crisis, while the subsequent decade shows which outcomes improved and which remained above their pre-crisis levels. This wider timeframe makes it possible to distinguish the immediate employment collapse from the slower accumulation of prolonged unemployment and the uneven course of recovery. The historical question is therefore how successive economic and institutional changes reshaped young people’s access to employment over time.
The study makes three contributions. First, it provides a longitudinal account extending from the pre-crisis period to the post-pandemic recovery. Second, it distinguishes labour-market exclusion—represented by unemployment, long-term unemployment, and NEET status—from contractual and working-time forms of employment. This distinction prevents a mechanical classification of every temporary or part-time position as precarious. Third, it compares statistical turning points with the institutional chronology of the period, thereby treating crisis and recovery as historically differentiated processes rather than as single binary events.
The central argument is that the sovereign-debt crisis accelerated and restructured vulnerabilities already embedded in the Greek youth labour market. The subsequent recovery produced substantial improvement in access to employment, but recovery was asynchronous: the decline in headline unemployment preceded the full reversal of long-term exclusion and changes in employment form. The historical significance of the period therefore lies not only in the scale of the initial employment collapse but also in the uneven timing and incomplete character of the recovery.
2. Historical and Institutional Context
2.1. Structural Characteristics Before the Sovereign-Debt Crisis
The severe deterioration in youth employment after 2009 developed within a labour market that already contained important structural vulnerabilities. Before the sovereign-debt crisis, Greece exhibited comparatively high youth unemployment, pronounced labour-market segmentation, a large share of employment in small enterprises and self-employment, and substantial dependence on seasonal sectors. Young people frequently entered employment through temporary, informal, family-based, or otherwise weakly protected arrangements. At the same time, stable employment and social-insurance entitlements remained more accessible to established workers with longer employment histories.
This configuration resembled the broader Southern European pattern in which employment protection and social insurance were historically connected to stable employment, while responsibility for supporting unemployed or economically inactive young adults fell heavily on families. In Greece, this model was reinforced by weak unemployment protection for new labour-market entrants and limited institutional representation of workers in non-standard employment. Kretsos found that conventional trade-union structures had difficulty representing young workers whose employment relationships were temporary, fragmented, or located in small workplaces (Kretsos 2011).
During the years preceding the crisis, economic expansion and lower aggregate unemployment did not eliminate these structural disadvantages. The improvement in youth unemployment and NEET rates between 2000 and 2008 therefore represented partial cyclical progress rather than the disappearance of labour-market segmentation. This distinction is important because the crisis affected a youth labour market that had become more favourable in quantitative terms but remained institutionally fragile.
2.2. Economic Collapse and the Adjustment Programmes
The international financial crisis reached Greece through a combination of deteriorating financing conditions, fiscal instability, declining confidence, and the exposure of longstanding weaknesses in the country’s productive and administrative structures. From 2010 onward, financial assistance was linked to economic adjustment programmes negotiated with the European Commission, European Central Bank, and International Monetary Fund. These programmes combined fiscal consolidation with reforms to product markets, pensions, public administration, wage determination, employment protection, and collective bargaining (Dedoussopoulos et al. 2013; European Commission 2012).
The chronology of financial assistance distinguishes several stages within this transformation. The first adjustment programme began in May 2010, the second in March 2012, and the third in August 2015, continuing until August 2018. The years surrounding the unemployment peak therefore belonged to an ongoing period of adjustment rather than a completed crisis episode. In particular, the statistical turning points around 2013–2014 should not be interpreted as marking the end of programme conditionality or an immediate restoration of young people’s employment prospects.
The scale and duration of the contraction sharply reduced labour demand. Young people were especially vulnerable because they depended disproportionately on new hiring and were more likely to hold temporary or marginal employment positions. Employers could respond to falling demand by cancelling vacancies, not renewing fixed-term contracts, reducing working hours, or postponing labour-market entry. As a result, the employment consequences extended beyond dismissals among incumbent workers.
Labour-market reforms constituted an important institutional component of the adjustment. Measures introduced during the crisis affected minimum-wage determination, collective agreements, arbitration, dismissal costs, probationary employment, and the hierarchy of collective bargaining (Dedoussopoulos et al. 2013; Yannakourou and Tsimpoukis 2014). The statutory minimum wage was reduced in 2012, with a larger reduction applied to workers younger than 25. Although the stated purpose was to reduce labour costs and encourage recruitment, the measure also institutionalised an age-related wage differential at a time when youth bargaining power was already weak.
The International Labour Organization expressed concern about the weakening of collective bargaining and the limited role of social dialogue in the reform process (International Labour Organization 2011). Comparative analysis has similarly shown that the crisis altered not only particular labour-market rules but also the institutional capacity of employers, trade unions, and the state to regulate employment jointly (Koukiadaki et al. 2016). For young workers, these changes occurred simultaneously with an exceptional shortage of jobs, making it difficult to separate the consequences of institutional reform from those of the macroeconomic collapse.
2.3. Persistence, NEET Status, and Familial Support
The initial collapse in recruitment was followed by the accumulation of long-term unemployment. This temporal sequence matters because the stock of long-term-unemployed young people could continue increasing even after the overall unemployment rate had stopped rising. Individuals who entered unemployment during the early crisis years remained exposed to skill deterioration, weakened professional networks, discouragement, and repeated failure to obtain employment.
NEET status captures an additional dimension of this process. Some young people remained unemployed and actively seeking work, while others moved into economic inactivity without participating in education or training. These groups are heterogeneous: they include short-term jobseekers, discouraged workers, people with care responsibilities, individuals with health limitations, and young people facing multiple forms of disadvantage. NEET status should therefore be interpreted as an indicator of potential disengagement rather than as a homogeneous social category.
Family support mitigated the immediate consequences of unemployment but could not replace stable labour-market integration. Extended co-residence and intrahousehold transfers helped young adults absorb income loss, while also transferring part of the burden of adjustment to households. In a context of simultaneous reductions in wages, pensions, and public expenditure, however, the capacity of families to provide support was itself weakened. The result was prolonged dependence, delayed household formation, and restricted economic autonomy among younger adults (Demetriades 2018; OECD 2020).
These developments locate youth employment within the wider social history of the crisis. When employment-based income and protection were difficult to obtain, families assumed a larger role in supporting young adults. Yet the same crisis also placed pressure on household resources. As discussed in the accounts cited above (Demetriades 2018; OECD 2020), prolonged unemployment consequently affected more than access to paid work: it also constrained economic independence and the transition to establishing a separate household. These social consequences provide context for interpreting the aggregate indicators; they are not measured directly by the present analysis.
2.4. Youth-Employment Policies and the Youth Guarantee
The policy response gradually shifted from general labour-market flexibilisation toward targeted activation, training, subsidised employment, apprenticeships, and entrepreneurship programmes. The European Youth Guarantee, adopted in 2013, called on member states to ensure that young people received an offer of employment, education, apprenticeship, or traineeship within four months of becoming unemployed or leaving education (Council of the European Union 2013).
In Greece, implementation occurred under difficult conditions. Public-employment services confronted exceptionally high caseloads, limited administrative capacity, and a shortage of private-sector vacancies. Training and subsidised-employment programmes expanded, but programme participation could not by itself demonstrate durable labour-market integration. Appropriate evaluation requires evidence concerning employment retention, contract stability, earnings, working hours, and participants’ outcomes after subsidies end.
The Youth Guarantee nevertheless marked an institutional change by placing greater emphasis on early intervention and coordinated assistance. Its extension through the reinforced Youth Guarantee to people aged 15–29 corresponded more closely to the prolonged school-to-work transitions experienced in Greece (Council of the European Union 2020). However, the effectiveness of such initiatives remained dependent on the availability of sustainable employment and on the capacity of institutions to identify and support heterogeneous groups of unemployed and inactive young people.
2.5. Recovery and Partial Institutional Reversal
Economic stabilisation and renewed growth gradually improved labour demand during the second half of the 2010s. Youth unemployment began to decline after its crisis peak, and the conclusion of the third economic adjustment programme in 2018 marked an important institutional boundary. Some elements of collective-bargaining regulation were subsequently restored, while the age-differentiated subminimum wage was abolished in 2019.
These developments did not recreate the pre-crisis labour market. The prolonged recession had altered employment histories, firm structures, sectoral composition, migration decisions, and the relationship between young workers and labour-market institutions. Many young people accumulated extended periods without work, while others emigrated or accepted employment below their qualifications. Consequently, declining unemployment after 2013 should be interpreted as the beginning of recovery rather than evidence that the effects of the crisis had disappeared.
The persistence of long-term unemployment is particularly important. A recovery driven by new recruitment can reduce short-term unemployment while leaving people with long unemployment spells behind. Temporary or part-time employment may also remain elevated if employers continue to manage uncertainty through flexible forms of recruitment. The historical question is therefore whether the recovery restored both access to employment and the quality and durability of labour-market integration.
Recent assessments provide additional context for this recovery. OECD Economic Surveys: Greece 2024 documents continuing employment gains while identifying persistent skill mismatches and barriers to broader labour-market participation. These findings suggest that stronger labour demand does not automatically eliminate difficulties in matching workers to available jobs or integrating groups with weaker labour-market attachment. The recovery should therefore be examined through several indicators rather than inferred solely from declining unemployment.
2.6. The COVID-19 Interruption
The COVID-19 pandemic produced a sudden disruption concentrated in tourism, accommodation, food services, retail, transport, and other activities employing substantial numbers of younger workers. Its policy environment differed markedly from that of the sovereign-debt crisis. Rather than relying primarily on fiscal contraction and labour-market deregulation, the government introduced employment-retention measures, contract suspensions, income support, business assistance, and restrictions on dismissals.
Evidence from Greek administrative and survey data indicates that employment fell during the initial lockdown principally because hiring declined, not because separations increased (Betcherman et al. 2023). This mechanism was particularly relevant to young people entering the labour market, seasonal workers, and those moving between short-duration jobs. Employment-retention measures could protect an existing employment relationship but could not protect a job that had not yet been created.
The pandemic period must also be interpreted cautiously because the EU Labour Force Survey underwent a methodological revision in 2021 (Eurostat n.d.). Observed changes around that year may reflect both labour-market developments and measurement discontinuities. The pandemic therefore constitutes a distinct historical episode, but comparisons across 2020–2022 require sensitivity to statistical as well as institutional change.
2.7. Historical Periodisation
The empirical analysis uses the following periodisation as an interpretive framework rather than assuming that every indicator changed precisely at the same date (see Table 1).
Table 1.
Historical periodisation of Greek youth employment, 2000–2024.
This chronology provides historically meaningful periods against which descriptive and comparative results can be interpreted. It is not imposed as proof of statistical breaks. The segmented analysis subsequently examines whether data-selected turning points correspond to, precede, or follow these institutional boundaries.
3. Literature Review and Analytical Framework
3.1. Youth Unemployment and Cyclical Vulnerability
Youth unemployment is typically more sensitive to economic fluctuations than adult unemployment. Young people are disproportionately dependent on new recruitment, possess less firm-specific experience, and are more frequently employed under short-duration arrangements. During economic contractions, employers can reduce labour demand by postponing recruitment, terminating temporary contracts, or declining to replace departing workers. These mechanisms place labour-market entrants at the margin of employment adjustment.
Using a panel of approximately 70 countries, Choudhry et al. found that financial crises produced significant and persistent increases in youth unemployment, with particularly adverse effects during the second and third years following a crisis (Choudhry et al. 2012). Bruno et al. similarly identified substantial but geographically uneven increases in youth unemployment and NEET rates across European regions after the global financial crisis (Bruno et al. 2014). These findings indicate that macroeconomic shocks interact with national and regional institutions rather than generating uniform employment effects.
The Greek case represents an especially severe example of this cyclical sensitivity. However, the scale of the post-2009 deterioration cannot be attributed solely to ordinary business-cycle variation. The duration of the recession, the simultaneous implementation of fiscal consolidation, and changes in wage-setting and employment regulation intensified the contraction in labour demand. The appropriate analytical question is therefore not whether the crisis “caused” all youth labour-market vulnerability, but how it amplified and reorganised disadvantages that were already present.
3.2. Persistence and the Scarring of Early Unemployment
The effects of youth unemployment may continue after an individual returns to work. Potential mechanisms include lost work experience, depreciation of skills, weaker occupational networks, adverse signalling to employers, reduced confidence, and repeated movement between unemployment and low-quality employment. These processes are commonly described as employment or wage scarring.
Gregg and Tominey used longitudinal British data to show that early unemployment was associated with substantial wage penalties later in adult life, particularly when individuals experienced recurrent unemployment (Gregg and Tominey 2005). De Fraja et al., using administrative data, found that unemployment during the earliest years of labour-market entry produced especially persistent income losses and that the effects were concentrated among individuals at the lower end of the ability distribution (De Fraja et al. 2021).
These individual-level findings cannot be inferred directly from an aggregate long-term-unemployment series. Nevertheless, an increasing share of young unemployed people remaining without work for at least 12 months identifies the population exposed to conditions under which scarring may develop. It also provides evidence about the persistence of a labour-market shock. If total unemployment begins declining while the long-term-unemployed share remains high, recovery is not reaching all groups simultaneously.
This distinction underpins the paper’s temporal interpretation. Unemployment can increase immediately after recruitment collapses, whereas long-term unemployment necessarily accumulates with delay. A later peak in the long-term-unemployed share would therefore indicate that the social consequences of the crisis continued intensifying after the headline unemployment rate had begun to improve.
3.3. NEET Status and Labour-Market Disengagement
The NEET indicator extends analysis beyond active jobseekers by including young people who are neither employed nor participating in education or training. Its broader coverage is valuable in contexts where prolonged unemployment produces discouragement or withdrawal from active job search. However, the NEET population is highly heterogeneous and should not be interpreted as a single disadvantaged group.
Carcillo et al. distinguished between unemployed and inactive NEETs and demonstrated substantial variation in their characteristics, income support, and barriers to employment across OECD countries (Carcillo et al. 2015). Assmann and Broschinski showed that different European welfare and educational configurations were associated with different NEET profiles, including unemployment, discouragement, health-related inactivity, and care responsibilities (Assmann and Broschinski 2021). Thus, identical national NEET rates may conceal different institutional processes.
For the present study, the NEET rate is treated as an indicator of labour-market and educational disengagement rather than as a direct measure of employment precarity. Its inclusion is particularly important in Greece because the unemployment rate excludes inactive young people who have stopped seeking work. At the same time, changes in NEET status may reflect educational participation as well as labour-market conditions. Interpretation must therefore consider changes in enrolment, inactivity, and employment jointly.
3.4. Temporary and Part-Time Employment
Temporary employment has an ambiguous relationship with labour-market security. It can provide work experience, facilitate entry into an occupation, or serve as a bridge to permanent employment. Alternatively, repeated temporary contracts may generate unstable earnings, limited training, restricted access to social protection, and recurrent unemployment. A meta-analytical review by Filomena and Picchio found substantial heterogeneity in whether temporary work functions as a stepping stone or a dead end; outcomes depend on worker characteristics, institutional context, contract type, and the quality of the subsequent transition (Filomena and Picchio 2022).
Part-time employment is similarly heterogeneous. Some young people voluntarily choose reduced hours because they are studying, providing care, or combining employment with other activities. Others accept part-time work because full-time employment is unavailable. Total part-time employment therefore measures working-time structure, whereas involuntary part-time employment provides a more direct indication of labour underutilisation.
These qualifications are essential for the Greek analysis. An increase in temporary or part-time employment cannot automatically be interpreted as increasing precarity. It may, however, indicate a reorganisation of the routes through which young people enter employment, particularly when it coincides with weak recruitment, involuntariness, low pay, or repeated joblessness. Accordingly, the two indicators are reported as employment-form measures and are not assumed to belong to the same statistical dimension as unemployment and NEET status.
3.5. Multidimensional Precarity and Conceptual Boundaries
Precarious employment is multidimensional. It can involve employment instability, inadequate income, limited social protection, uncertain working hours, restricted worker control, or limited prospects for advancement (Kalleberg 2009). García-Pérez et al. demonstrated the value of multidimensional measurement, while also showing that the selection and weighting of dimensions materially influence the resulting classification (García-Pérez et al. 2017).
This insight creates an important measurement problem. Unemployment and NEET status represent exclusion from employment, whereas temporary and part-time employment describe characteristics of people who are employed. Combining these outcomes mechanically may obscure rather than clarify the historical process. For example, youth unemployment may decline because more young people obtain temporary or part-time positions. In this case, employment exclusion improves while the composition of employment changes.
The present study therefore begins with two conceptually distinct domains:
Labour-market exclusion: youth unemployment, the long-term-unemployed share, and NEET status.
Employment form and underutilisation: temporary employment and part-time employment.
The distinction between employment exclusion and employment form follows from the definitions and populations represented by the indicators; it does not depend on PCA. Appendix A describes their pooled common variation. Its exclusion index is an optional summary of related outcomes, while the individual indicators remain the basis for answering the research questions.
3.6. Crisis-Specific Transmission Mechanisms
Economic shocks affect youth employment through macroeconomic and institutional pathways. The first pathway is the decline in labour demand. Lower consumption, investment, production, and business confidence reduce vacancies and recruitment. The second pathway is institutional: wage-setting systems, employment-protection rules, job-retention measures, and social-protection arrangements influence which groups absorb the adjustment. The third pathway is persistence, through which unemployment and disengagement continue after the initial economic shock.
Figure 1 presents the resulting analytical framework.
Figure 1.
Analytical framework connecting economic shocks, institutional transmission mechanisms, and multidimensional youth labour-market outcomes.
3.7. Representative Empirical Studies and Research Gap
More recent research extends the discussion to post-pandemic conditions. Eurofound’s Becoming Adults: Young People in a Post-Pandemic World reports improved youth labour-market conditions alongside continuing obstacles to economic independence and concerns about employment quality. OECD Economic Surveys: Greece 2024 similarly identifies continuing skills and participation challenges despite employment gains. These studies reinforce the distinction between recovery in employment access and improvement in broader labour-market integration. The present study complements this evidence by tracing the timing of changes across multiple indicators over the longer period from 2000 to 2024.
Three gaps emerge. First, much of the literature examines either the initial sovereign-debt crisis or the COVID-19 shock rather than the complete trajectory from the pre-crisis period through 2024. Second, studies frequently focus on a single outcome, most commonly youth unemployment, even though unemployment, inactivity, long-term exclusion, and employment form may move differently. Third, limited attention has been paid to whether statistically estimated turning points correspond to the institutional chronology of the Greek crisis and recovery.
The present study addresses these gaps by combining long-run historical periodisation with separate examination of five labour-market indicators. It does not seek to estimate individual scarring or the causal effect of a specific reform. Instead, it identifies when different dimensions changed, whether their timing was synchronous, and how the Greek trajectory differed from contemporaneous European developments (see Table 2).
Table 2.
Representative empirical studies and contribution of the present study.
3.8. Empirical Expectations
The literature and historical framework generate four empirical expectations:
- Expectation 1—crisis intensification: Youth unemployment, NEET status, and the exclusion index should deteriorate sharply following 2009.
- Expectation 2—delayed persistence: The long-term-unemployed share should peak later than total youth unemployment because long-duration unemployment accumulates over time.
- Expectation 3—uneven recovery: Declining unemployment should not necessarily coincide with a complete return of temporary and part-time employment to their pre-crisis levels.
- Expectation 4—Greek divergence and partial convergence: Greek outcomes should deteriorate relative to other EU countries during the sovereign-debt crisis and subsequently converge only partially.
These expectations organise the empirical analysis but are not treated as causal hypotheses. The aggregate design identifies temporal patterns and conditional comparative differences; it cannot isolate the effect of every contemporaneous policy or institutional change.
4. Data and Empirical Methodology
4.1. Research Design
This study employs a quantitative historical design to examine changes in youth labour-market outcomes in Greece between 2000 and 2024. The empirical strategy combines four complementary components:
Descriptive analysis of five annual labour-market indicators;
Principal-component analysis of their common statistical structure;
Exploratory breakpoint identification and segmented time-series analysis for Greece;
Country- and year-fixed-effects comparisons between Greece and other EU countries.
Each method addresses a different historical question. Descriptive statistics establish when conditions deteriorated and how far they subsequently improved. Principal component analysis examines whether related indicators can be summarised in a single supplementary measure. Breakpoint analysis identifies approximate dates when the direction or pace of a trend changed, while segmented regression estimates the slopes of trends around specified historical boundaries. Finally, the comparative models examine whether Greece’s relative position changed alongside developments elsewhere in Europe. Together, these procedures organise the quantitative evidence without identifying the independent causal effect of any particular reform.
The presentation prioritises the methods that directly address the historical research questions. Descriptive trajectories establish the chronology and magnitude of change; segmented estimates summarise its approximate pace; and fixed-effects estimates provide conditional comparative descriptions. PCA has a supplementary role. The interpretation focuses on the principal historical findings rather than presenting each procedure as a separate contribution.
The design is observational. The adjustment programmes, labour-market reforms, and COVID-19 pandemic were not randomly assigned interventions, and several institutional and macroeconomic changes occurred simultaneously. The estimates are therefore interpreted as historically structured associations and comparative differentials, not as causal effects of individual policies.
During the preparation of this manuscript, the author used GPT-5.6 Sol for language editing and assistance with figure preparation.
4.2. Data Sources and Sample
The principal data source is Eurostat’s harmonised European Union Labour Force Survey, which provides annual labour-market indicators constructed according to common statistical definitions (Eurostat n.d.). Annual real-GDP data were obtained from Eurostat’s national-accounts database. The study covers 2000–2024, thereby including the pre-crisis period, the global financial and sovereign-debt crises, the economic adjustment programmes, the initial post-programme recovery, the COVID-19 interruption, and the subsequent recovery.
The principal population comprises people aged 15–29, with both sexes combined. This age range captures both the transition from education to employment and the early stage of establishing an employment history. It also corresponds to the population covered by the reinforced Youth Guarantee (Council of the European Union 2020). All five principal labour-market indicators were selected for the 15–29 age group.
The comparative dataset contains the 27 countries constituting the current EU27: Austria, Belgium, Bulgaria, Croatia, Cyprus, Czechia, Denmark, Estonia, Finland, France, Germany, Greece, Hungary, Ireland, Italy, Latvia, Lithuania, Luxembourg, Malta, the Netherlands, Poland, Portugal, Romania, Slovakia, Slovenia, Spain, and Sweden. This is a consistent geographical comparison sample rather than a reconstruction of EU membership in each historical year.
The panel is slightly unbalanced because some country-year observations are unavailable for particular indicators. The Greek series contains 25 annual observations for every principal outcome. Across the comparative models, the usable sample varies from 641 to 672 country-year observations. No missing value was replaced through interpolation.
4.3. Variables and Measurement
Table 3 defines the variables used in the principal analysis. Careful attention is given to their denominators because the indicators capture different populations and cannot be interpreted interchangeably.
Table 3.
Variables, definitions, and data sources.
Three measurement qualifications are important. First, the unemployment rate differs from the unemployment ratio: its denominator contains only economically active young people rather than the entire youth population. Second, the long-term indicator used here is the share of unemployed young people whose unemployment has lasted at least 12 months; it is not the percentage of the total youth population that is long-term unemployed. Third, total temporary and part-time employment should not be equated automatically with precarious or involuntary employment. These variables describe the form of employment, while the available aggregate series do not identify whether every arrangement was voluntarily chosen.
A percentage-point change is the arithmetic difference between two percentages: an increase from 10% to 15% is an increase of five percentage points.
The selected indicators are related but not interchangeable. Youth unemployment measures the incidence of unemployment among economically active young people, whereas the long-term-unemployed share measures the duration composition of the unemployed population. The latter can increase even when the unemployment rate declines, particularly when short-duration unemployment falls more rapidly than long-duration unemployment. NEET status overlaps partly with unemployment but additionally includes economically inactive young people outside education and training. Temporary and part-time employment may also overlap at the individual level, although they measure different characteristics: contract duration and working-time arrangements, respectively. Such relationships are expected because the indicators respond to common economic and institutional conditions. However, each indicator is analysed as a separate dependent variable; they are not entered jointly as explanatory variables in the segmented or fixed-effects regressions. Correlation between these outcomes therefore does not itself create regressor multicollinearity. The examination of related but distinct outcomes is consistent with earlier research analysing youth unemployment and NEET status together (Bruno et al. 2014) and distinguishing different forms of unemployment and inactivity within the NEET population (Carcillo et al. 2015; Assmann and Broschinski 2021).
4.4. Data Harmonisation
The Eurostat datasets were restricted to annual observations, both sexes combined, ages 15–29, and percentage units. Geographic codes and calendar years were harmonised before the datasets were merged. Duplicate observations were checked against the underlying dimensions of each Eurostat table, and extreme Greek values were retained when they corresponded to the published source. No observation was excluded merely because it represented an exceptional crisis-period outcome.
Real-GDP growth was calculated as the annual percentage change in chain-linked real GDP:
where c identifies the country and t the year.
The EU Labour Force Survey underwent a methodological revision in 2021 following the implementation of Regulation (EU) 2019/1700 (Eurostat n.d.). Movements around this date may combine labour-market change with measurement discontinuities whose extent can differ across countries and indicators. The observations are retained because they cover a historically important pandemic year, but interpretation around 2021 remains cautious.
4.5. Descriptive Historical Analysis
The first stage traces the annual Greek series and reports their means, standard deviations, minima, maxima, and peak years. Period means are calculated for six historically defined phases:
2000–2008: pre-crisis period;
2009–2013: crisis escalation;
2014–2018: prolonged adjustment and early recovery;
2019: initial post-programme recovery;
2020–2021: COVID-19 interruption;
2022–2024: post-pandemic recovery.
The year 2019 is shown separately as the first full calendar year after the conclusion of the third adjustment programme and the last year before the pandemic interruption. It also coincides with the abolition of the youth subminimum wage. This is a descriptive chronological distinction, not evidence of a separate statistical regime or the effects of those institutional developments. Results for this single-year category should not be given the same weight as patterns sustained over several years.
For selected years, the analysis also calculates the difference between Greece and the published EU27 aggregate:
where Xjt denotes indicator j in year t. The published EU27 aggregate is used as an official descriptive benchmark representing the broader European labour-market trajectory. However, Greece contributes to this aggregate, so it is not an independent comparison group. Eurostat calculates aggregate rates from the underlying national population totals rather than as an unweighted average of national percentages. Greece’s contribution therefore varies across indicators according to their respective denominators. Its inclusion mechanically reduces the absolute difference between Greece and the European benchmark relative to an otherwise equivalent aggregate excluding Greece. The magnitude of this attenuation is not quantified here. Accordingly, the reported differences are interpreted as descriptive distances from the published EU27 aggregate rather than as treatment effects. The comparative fixed-effects models use individual-country observations, with Greece’s trajectory assessed relative to those of the other 26 countries; the EU27 aggregate is not included as an additional panel observation.
Gapjt = Xj,Greece,t − Xj,EU27,t,
4.6. Principal-Component Analysis
Principal component analysis (PCA) is a statistical technique that reduces several related numerical indicators to a smaller number of summary measures, called components (Jolliffe and Cadima 2016). Each component is a weighted combination of the original indicators. The first component captures the largest possible proportion of their total statistical variation. Here, variation means differences across the observed countries and years, rather than the effect of a particular historical event.
The purpose of PCA in this study is to provide a supplementary summary of related forms of youth labour-market exclusion. Unemployment, the long-term-unemployed share, and NEET status describe different but overlapping aspects of difficulty obtaining work or participating in education and training. Their combined score helps readers follow the broad trajectory of exclusion, while the separate indicators remain necessary for identifying its timing and composition.
Before applying PCA, each indicator is standardised by subtracting its pooled mean and dividing by its pooled standard deviation. This places indicators with different statistical spreads on a comparable scale. The weights are estimated from complete observations across EU countries and years, rather than from the 25 Greek annual observations alone. The resulting weights are then used to calculate Greece’s annual scores. The pooled sample provides a broader basis for estimating these weights, although its relationships need not match those within Greece alone.
PCA therefore supports the historical description; it does not establish why exclusion changed or measure every aspect of precarious employment.
For each indicator j, country c, and year t, the standardised value was calculated as:
where and sj are the pooled mean and standard deviation. PCA was then applied to the correlation matrix of the standardised indicators. The first component was written as:
where wj is the estimated loading. The component’s sign was oriented so that higher values of unemployment, long-term unemployment, and NEET status corresponded to higher exclusion.
The initial model contained unemployment, the long-term-unemployed share, NEET status, temporary employment, and part-time employment. Its complete-case sample contained 639 observations from 27 countries. Sampling adequacy was evaluated using the Kaiser–Meyer–Olkin statistic, and Bartlett’s test was used to assess whether the correlation matrix differed from an identity matrix. The Kaiser–Meyer–Olkin (KMO) statistic assesses whether the correlation pattern is suitable for summarising the indicators through components. Bartlett’s test assesses whether the indicators are collectively uncorrelated; rejection supports examining their shared variation but does not establish the substantive validity of an index.
The five-indicator component was not adopted as a general precarity index because the indicators describe different populations and employment conditions, and their aggregation would require an independently justified interpretation of precarity. Opposing loading signs alone do not invalidate a component. A separate PCA of unemployment, the long-term-unemployed share, and NEET status was retained as a descriptive summary of conceptually related exclusion indicators. This model contained 642 complete country-year observations.
For PCA, correlation between the indicators is relevant because the procedure summarises their common variation. Nevertheless, the overlap between unemployment, long-term unemployment, and NEET status means that the exclusion index should not be interpreted as three independent measures confirming the same finding. It is a descriptive summary of related outcomes and is used alongside, rather than instead of, the constituent indicators. Furthermore, the pooled correlation structure combines differences between countries with changes over time and need not reproduce the relationships observed within Greece alone.
The exclusion index is a relative statistical score, not a percentage of young people. A higher score indicates greater exclusion according to the combined indicators, while zero represents the pooled reference average rather than an absence of exclusion. The finding that the first component explains 77.2% of total variance means that it summarises that proportion of the statistical variation in the three standardised indicators; it does not mean that the index explains 77.2% of the causes of youth exclusion.
4.7. Exploratory Breakpoint Identification
A breakpoint is a candidate date separating periods with different fitted trends. For example, a series may move from declining unemployment to rapidly increasing unemployment and later return to decline. The analysis approximates these movements using connected straight-line segments.
The annual Greek series contains only 25 observations. Formal multiple-break inference has limited power in such a short sample and can generate unstable results when numerous candidate breaks are permitted. The analysis therefore uses exploratory piecewise-linear models rather than claiming a definitive Bai–Perron test.
The analysis distinguishes observed peaks, model-selected turning points, and formally tested structural breaks. An annual peak identifies the largest observed value, whereas a selected breakpoint identifies a boundary in a fitted segmented representation. BIC selection does not itself establish rejection of a parameter-stability hypothesis. Accordingly, the dates reported here are described as candidate turning points rather than statistically established regime changes. A segmented approximation may represent either an abrupt change or a gradual transition, which the present analysis cannot distinguish conclusively.
For each indicator, models containing zero, one, or a maximum of two breakpoints were compared using the Bayesian information criterion. Candidate specifications were restricted so that each segment contained enough observations to estimate a trend. The Bayesian information criterion (BIC) balances how closely a model follows the observations against its complexity, penalising the addition of extra parameters. The preferred specification is the model with the lowest BIC.
The estimated dates are interpreted as approximate boundaries between fitted trend segments They are compared with the historically defined periods, but correspondence with 2009, 2014, or another institutional date does not demonstrate that a particular policy caused the change. Breakpoint selection is intended to reduce dependence on purely visual dating while remaining appropriately cautious about the short time series.
The retained results identify the selected specifications and candidate dates but do not contain the complete BIC comparison values. Consequently, the strength of preference between competing specifications cannot be assessed from the reported output. This reporting limitation further restricts the interpretation of the selected dates to exploratory, model-dependent summaries.
4.8. Segmented Greek Time-Series Models
To evaluate changes around the two principal historical boundaries, separate segmented regressions were estimated for every Greek indicator. Whereas the preceding analysis allows candidate turning points to be selected from the data, these models use the common historical boundaries of 2009 and 2014 to compare outcomes on the same chronological basis. A level change describes a shift in the fitted value at a boundary; a slope change describes a change in the annual pace of increase or decline. The coefficients therefore summarise the shape of the historical trajectory rather than the effect of a specific policy.
Here, Trendt is a continuous annual trend; Post2009t and Post2014t identify observations beginning in the corresponding years; and the post-break trend variables measure the number of years following each boundary. Real-GDP growth is included as a parsimonious macroeconomic control.
The models were estimated by ordinary least squares with Newey–West standard errors using two annual lags (Newey and West 1987). The specification permits changes in both levels and slopes around the stated historical boundaries and includes GDP growth as a macroeconomic control. This flexibility is substantial relative to the 25 annual observations. The specification is therefore retained only as an exploratory decomposition of the observed trajectory, rather than as a preferred forecasting model or a formally validated account of structural change.
The two-lag covariance specification allows for residual dependence extending over two years, but its adequacy has not been established through bandwidth sensitivity analysis. Newey–West corrections do not address overfitting, establish parameter stability, or incorporate uncertainty about selected break dates. Alternative-date, bandwidth, and observation-sensitivity checks are not available; the reported uncertainty estimates and historical boundaries must consequently be interpreted cautiously.
4.9. Comparative Fixed-Effects Models
The comparative analysis estimates the following model separately for each outcome:
where αc denotes country fixed effects, λt denotes year fixed effects, and Periodpt represents the five post-2008 historical periods. The omitted category is Greece’s pre-crisis differential during 2000–2008.
Country fixed effects absorb stable differences among national labour markets, while year fixed effects absorb shocks common to the comparison countries. The interaction coefficients estimate whether the Greek outcome differed during each phase relative to its pre-crisis differential and contemporaneous European changes. Standard errors are clustered by country.
In practical terms, the model asks whether Greece’s distance from the other countries widened or narrowed relative to its pre-crisis position. The reported period coefficients represent changes in that relative position, rather than Greece’s actual unemployment or NEET rates. For percentage-based outcomes, these changes are expressed in percentage points. For example, a positive unemployment coefficient indicates a less favourable Greek differential relative to the pre-crisis baseline, conditional on the included adjustments.
The fixed-effects model provides a conditional descriptive comparison rather than a causal difference-in-differences design. Its interaction coefficients describe changes in Greece’s relative position from the pre-crisis baseline after adjustment for country effects, common annual variation, and GDP growth. Year effects do not capture every heterogeneous national response to common shocks, and the historical periods are organised around the Greek chronology. The estimates therefore depend on the selected comparison countries, periods, and controls.
Greece is the sole focal country. Conventional country-clustered standard errors may therefore incompletely represent uncertainty surrounding Greece-specific period interactions. The estimates are interpreted as supplementary comparative summaries rather than independent confirmation of the historical explanation.
5. Empirical Results
5.1. Data Coverage and Dimensionality
The Greek dataset contains complete annual observations for the five principal indicators from 2000 through 2024. The pooled five-indicator PCA contains 639 complete country-year observations from 27 EU countries. The Kaiser–Meyer–Olkin statistic is 0.656, indicating moderate rather than strong sampling adequacy. Bartlett’s test refutes the hypothesis that the correlation matrix is an identity matrix, χ2(10) = 1528.83, p < 0.001, confirming sufficient correlation for exploratory component analysis.
The first component explains 53.5% of total variance. Unemployment, the long-term-unemployed share, and NEET status have positive loadings, whereas temporary and part-time employment have negative loadings. This pattern describes a contrast within the pooled covariance structure; it does not establish that the indicators cannot share a common statistical dimension. The component is not interpreted as a comprehensive precarity measure because the indicators have different denominators and substantive meanings.
The reported correlations provide further context for this loading pattern. Unemployment was positively correlated with NEET status (r = 0.689) and the long-term-unemployed share (r = 0.520). In contrast, part-time employment was negatively correlated with long-term unemployment (r = −0.511) and NEET status (r = −0.494). Temporary employment was positively correlated with part-time employment (r = 0.429) but negatively correlated with long-term unemployment and NEET status.
A separate PCA summarised the three conceptually related exclusion indicators: unemployment, the long-term-unemployed share, and NEET status. All three loadings were positive and similar in magnitude, and the first component explained 77.2% of total variance. This component is retained as a youth labour-market exclusion index. Its moderate KMO value nevertheless supports cautious use alongside, rather than instead of, the separate indicators.
Substantively, the component provides a compact description of the combined pattern in these three indicators. It does not replace their separate historical interpretation: similar index values may conceal different combinations of unemployment, unemployment duration, and NEET status.
5.2. Evolution of the Greek Indicators
The annual series demonstrate a marked but asynchronous deterioration after 2009. Youth unemployment declined from 23.0% in 2000 to 16.2% in 2008. It then increased to 34.8% in 2011 and reached 48.7% in 2013. By 2024, it had fallen to 19.1%, representing substantial recovery but remaining 2.9 percentage points above its 2008 level (Eurostat 2026e).
The long-term-unemployed share followed a delayed trajectory. It stood at 40.7% in 2008 and initially declined to 34.4% in 2009 before increasing rapidly. Its maximum of 65.6% occurred in 2014, one year after the unemployment peak. The share remained 59.3% in 2019 and declined to 42.5% by 2024. Thus, the proportion of unemployed young people experiencing prolonged unemployment remained 1.8 points above its 2008 value despite the recovery (Eurostat 2026b).
The NEET rate declined from 20.8% in 2000 to 14.8% in 2008, before increasing to 28.5% in 2013. It subsequently fell to 17.7% in 2019 and 14.2% in 2024. Among the three exclusion indicators, NEET status exhibited the most complete recovery, reaching a value 0.6 points below its 2008 level (Eurostat 2026f).
Temporary employment displayed no comparable crisis peak (see Table 4). It fluctuated within a relatively narrower range, from a minimum of 18.4% in 2003 and 2020 to a maximum of 26.9% in 2023. The value declined to 20.3% in 2024 (Eurostat 2026d). Part-time employment followed a clearer long-term rise, increasing from 6.4% in 2000 and 8.4% in 2008 to a maximum of 19.9% in 2017. It subsequently declined to 11.3% in 2024 but remained above its pre-crisis level (Eurostat 2026c).
Table 4.
Selected observations for Greek youth labour-market indicators, 2000–2024.
The exclusion index summarises the common movement of unemployment, long-term unemployment, and NEET status. It declined during 2000–2008, increased sharply after 2009, peaked in 2013, remained high in 2014, and then declined progressively. A small increase in 2020 interrupted but did not reverse the post-2014 improvement.
5.3. Historical-Period Comparisons
Period means confirm that different dimensions reached their highest levels in different phases. Mean unemployment increased from 19.48% during 2000–2008 to 34.08% during 2009–2013 and 38.52% during 2014–2018. The higher mean during the second period does not imply that unemployment was still increasing throughout 2014–2018; it reflects the exceptionally high starting level and gradual decline after the 2013 peak.
The long-term-unemployed share averaged 62.94% during 2014–2018, substantially above both the pre-crisis mean of 49.20% and the crisis-escalation mean of 47.78%. Part-time employment also reached its highest period average during 2014–2018. The exclusion index consequently attained its maximum period mean in 2014–2018, even though annual unemployment had already begun to decline (see Table 5).
Table 5.
Mean Greek youth labour-market indicators by historical period. All values except the PCA-derived index are percentages.
During 2022–2024, mean youth unemployment was 21.73%, above the 2000–2008 mean of 19.48%. By contrast, the long-term-unemployed share averaged 45.80%, below its pre-crisis period mean of 49.20%, and the NEET rate averaged 15.20%, below 18.22%. Temporary employment averaged 23.00%, compared with 20.57% before the crisis, while part-time employment averaged 13.07%, compared with 6.99%. Comparisons with 2008 alone give a different perspective: in 2024, unemployment, the long-term-unemployed share, and part-time employment remained above their respective 2008 values, whereas NEET and temporary employment were below them. Recovery was therefore uneven, and assessments of incomplete recovery depend on both the indicator and the benchmark.
5.4. Exploratory Breakpoint Results
The BIC comparisons selected two turning points for unemployment, long-term unemployment, NEET status, part-time employment, and the exclusion index. The retained BIC-selected specification contained no breakpoint for temporary employment (see Table 6).
Table 6.
BIC-selected candidate turning points in exploratory segmented models.
The first turning point in 2009 is common to the principal exclusion indicators and corresponds closely to the beginning of the economic contraction. The second turning point differs across outcomes. Unemployment, NEET status, and the exclusion index have candidate recovery turning points around 2014, while the long-term-unemployed share changes direction in 2015. Part-time employment has a candidate transition to a declining fitted trend around approximately 2018. These differences provide evidence against a single, simultaneous recovery date.
The selected years are approximate, model-dependent boundaries in fitted historical trends. They do not establish abrupt structural changes, precise regime dates, or causal effects of institutional events. With only 25 annual observations, nearby dates may be difficult to distinguish. The results are therefore interpreted alongside the observed trajectories and historical chronology, rather than as formal statistical validation of the periodisation.
5.5. Segmented Time-Series Estimates
The segmented regressions describe the observed trajectory under the fixed historical boundaries of 2009 and 2014. Their coefficients summarise fitted changes in levels and slopes, rather than independently confirming the historical periodisation. The substantive interpretation focuses on the direction and approximate pace of change and is considered alongside the annual observations.
The implied unemployment trend changed from approximately −0.75 percentage points annually before 2009 to +7.91 points during 2009–2013 and −2.41 points after 2014. The long-term-unemployed share changed from −1.28 points annually to +6.83 points after 2009 and approximately −2.29 points after 2014. The estimated NEET trends show the same reversal (see Table 7).
Table 7.
Selected segmented time-series estimates. Newey–West standard errors with two lags are in parentheses. Models also contain immediate level-change terms for 2009 and 2014; N = 25.
The high R2 values in several segmented specifications require cautious interpretation. These models fit a pronounced historical trajectory using an annual trend, level changes, slope changes, and GDP growth within a sample of only 25 observations. Their high explanatory power may therefore reflect the flexibility of the deterministic time structure and the persistence of the outcome series rather than strong evidence for a particular economic mechanism. Correlation between the five labour-market indicators does not directly explain these R² values because each indicator is modelled separately. Moreover, Newey–West standard errors adjust estimated uncertainty for heteroskedasticity and autocorrelation but do not correct overfitting or establish parameter stability. The estimates are consequently interpreted as exploratory descriptions of historical trends, with emphasis on the direction, magnitude, and timing of changes rather than on goodness of fit.
Temporary employment had a much lower model fit (R2 = 0.237) and did not exhibit a stable crisis-related trajectory. This is consistent with the retained BIC-selected specification containing no breakpoint for temporary employment; without complete model-selection comparisons or sensitivity checks, it does not establish the absence of structural change. GDP growth was not independently associated with the outcomes in most segmented specifications after the flexible time structure was included. Given the small sample and close correspondence between the regressors and observed historical phases, these estimates should be regarded as descriptive trend decompositions rather than causal estimates.
5.6. Greece Relative to the EU
Greece’s unemployment and NEET differentials relative to the published EU27 aggregate widened sharply during the crisis. The unemployment gap increased from 3.9 percentage points in 2008 to 29.0 points in 2013. It narrowed to 17.0 points in 2019 and 7.7 points in 2024. The NEET gap similarly increased from 1.8 points in 2008 to 12.4 points in 2013, before narrowing to 3.0 points in 2024.
These differentials measure Greece’s distance from the published EU27 benchmark. Because Greece contributes to that benchmark, their absolute magnitudes are mechanically smaller than differences calculated against an equivalent denominator-weighted aggregate excluding Greece. They should therefore be interpreted as descriptive comparisons rather than estimates against an independent control group.
The long-term-unemployment differential followed a more persistent pattern. Greece was 13.3 points above the EU aggregate in 2008, 20.9 points above it in 2013, and 30.2 points above it in 2019. The differential remained 23.3 points in 2024. Thus, convergence in total unemployment and NEET status occurred more rapidly than convergence in the duration of unemployment.
Greece remained below the EU aggregate in temporary and part-time employment throughout the selected years. These comparisons reinforce the finding that higher unemployment and employment exclusion in Greece did not mechanically coincide with higher prevalence of every non-standard employment form.
5.7. Fixed-Effects Results
The fixed-effects estimates measure the Greek differential during each historical phase relative to Greece’s pre-crisis differential and contemporaneous changes in the other 26 countries (see Table 8).
Table 8.
Country- and year-fixed-effects estimates. Reported country-clustered standard errors are in parentheses. Depending on the outcome, N = 641–672; 27 countries are included. Coefficients for percentage outcomes are expressed in percentage points; exclusion-index coefficients are expressed in index units. With Greece as the sole focal country, the standard errors may incompletely represent uncertainty surrounding Greece-specific period interactions. Estimates are interpreted as supplementary conditional comparative summaries.
The unemployment differential was largest during 2014–2018 rather than 2009–2013, reflecting the persistence of extremely high Greek unemployment after the 2013 peak. It declined during the subsequent phases but remained positive during 2022–2024. The long-term-unemployment differential was also largest after the initial crisis-escalation phase and remained positive in the post-pandemic period.
For NEET status, the conditional Greek differential declined from 4.67 percentage points during 2014–2018 to 0.39 points during 2022–2024. The final estimate is small relative to the earlier differential, although it does not establish complete convergence. Temporary employment showed negative point estimates across the post-2008 phases. Part-time employment showed larger positive differentials during 2014–2021 and a smaller estimate during 2022–2024. These patterns describe changes in Greece’s relative position within the specified model.
These coefficients should not be interpreted as causal treatment effects. With Greece as the sole focal country, conventional country-clustered inference may understate uncertainty surrounding Greece-specific period interactions. Interpretation therefore prioritises coefficient magnitudes and their relationship to the descriptive gaps, period means, and temporal sequencing, subject to the stated model and uncertainty limitations.
5.8. Summary of Empirical Findings
Five findings organise the historical interpretation. Youth unemployment and NEET status deteriorated sharply after 2009. The long-term-unemployed share peaked later. Recovery proceeded at different speeds across indicators. Greece diverged markedly from the broader European trajectory during the sovereign-debt crisis. Subsequent convergence was substantial but incomplete for several outcomes.
These findings are evident in the individual annual series, historical-period comparisons, and European differentials. The supporting statistical analyses summarise candidate changes in trend and conditional comparative patterns. They are not treated as independent validation of the historical narrative, and the substantive conclusions do not depend on the exclusion index.
6. Discussion
6.1. Crisis, Persistence, and Uneven Recovery
The asynchronous trajectories indicate that access to employment and the composition of unemployment changed on different timescales. The later peak in the long-term-unemployed share is consistent with the duration threshold defining long-term unemployment and with changes in the composition of those remaining unemployed. It does not, by itself, establish that the number of long-term-unemployed young people continued increasing.
The Greek experience is consistent with international evidence showing that young workers are especially vulnerable to financial crises because their employment depends heavily on recruitment (Choudhry et al. 2012). It also extends earlier European research by demonstrating that the crisis affected unemployment, inactivity, and employment form through different temporal processes (Bruno et al. 2014). The post-2009 deterioration should consequently be understood not as a single statistical shock but as a sequence involving labour-market entry collapse, accumulation of long-duration unemployment, and gradual but incomplete recovery.
The delayed peak in long-term unemployment has particular historical importance. Individual-level studies show that unemployment experienced during labour-market entry can generate persistent employment and earnings penalties (Gregg and Tominey 2005; De Fraja et al. 2021). The aggregate evidence presented here cannot identify individual scarring, but it demonstrates that a historically large proportion of unemployed young Greeks remained without work for prolonged periods. The high long-term-unemployed share indicates a concentration of prolonged unemployment among young people who remained unemployed. Without corresponding counts and individual histories, it does not establish an increasing number exposed to scarring or identify individual scarring effects.
6.2. Employment Exclusion and Employment Form
The distinction between employment exclusion and employment form is principally conceptual. Unemployment, long-term unemployment, and NEET status describe overlapping forms of exclusion, while temporary and part-time employment describe arrangements among employed people. Appendix A illustrates differences in pooled variation but is not needed to establish this distinction. Separate examination of the indicators avoids imposing a uniform interpretation on outcomes with different denominators and meanings.
Temporary employment did not display a stable crisis-related trajectory and remained below the EU aggregate. This finding does not establish that temporary jobs in Greece were secure or desirable. Aggregate prevalence provides no information about contract duration, pay, involuntariness, repeated renewals, or subsequent transitions. As Filomena and Picchio demonstrate, temporary employment can function either as a stepping stone or as a dead end depending on institutional and individual circumstances (Filomena and Picchio 2022).
Part-time employment increased during the crisis and remained elevated during the early recovery, but it subsequently declined. Because the available series measures total rather than involuntary part-time employment, it should be interpreted as a change in working-time structure rather than direct evidence of precarity. More detailed microdata would be required to determine whether reduced hours reflected preference, education, care responsibilities, or inability to obtain full-time work.
The differentiated recovery identified here is consistent with recent European evidence that improved youth labour-market conditions can coexist with continuing difficulties in employment quality and economic independence. Eurofound’s 2024 findings highlight this distinction (Eurofound 2024), while the OECD’s 2024 assessment of Greece identifies continuing skills and participation challenges despite employment gains (OECD 2024). These studies contextualise the observed recovery but do not establish its underlying mechanisms. In particular, the aggregate indicators used here cannot determine whether declining unemployment translated into adequate earnings, secure employment transitions, or greater financial autonomy.
6.3. Historical Periodisation
The empirical turning points broadly correspond to the institutional chronology, but not every outcome changed simultaneously. The 2009 turning point coincided with the beginning of the economic contraction, while the 2014–2015 turning points marked transition from rapid deterioration to gradual recovery. Part-time employment changed direction later, around 2018.
This differentiated chronology supports the interpretation of the sovereign-debt crisis as an acceleration of pre-existing vulnerability rather than the origin of youth disadvantage. Before 2009, unemployment and NEET status had improved, but young people remained dependent on a segmented labour market and weakly represented forms of employment (Kretsos 2011). The crisis transformed this structural vulnerability into mass employment exclusion.
The historical significance of this sequence lies in the different timing of immediate disruption and prolonged exclusion. Youth unemployment and NEET status reached their highest annual values in 2013, whereas the long-term-unemployed share peaked in 2014 and part-time employment in 2017. These staggered peaks show why a single crisis endpoint would obscure important differences in the experience of adjustment and recovery. They do not demonstrate that the same individuals moved through each condition, but they establish that the aggregate consequences of the crisis unfolded over several years.
The COVID-19 episode differed from the sovereign-debt crisis. Unemployment and the exclusion index increased only moderately, despite a severe decline in economic activity. Previous Greek microeconometric evidence indicates that employment-retention measures limited separations while the principal adjustment occurred through reduced hiring (Betcherman et al. 2023). This helps explain why young labour-market entrants could experience substantial disruption without a repetition of the post-2009 unemployment surge.
6.4. European Comparison
The comparative evidence reveals both divergence and partial convergence. Greece’s unemployment and NEET differentials widened sharply during the sovereign-debt crisis and narrowed thereafter. By 2024, the NEET differential was relatively small, but unemployment and especially long-term unemployment remained above the European benchmark.
This pattern reinforces Papadopoulos’s conclusion that common European pressures can generate divergent national outcomes when they interact with different welfare institutions, employment systems, and political conditions (Papadopoulos 2016). It also cautions against interpreting recovery solely through the unemployment rate. Greece’s youth unemployment-rate differential narrowed more rapidly than its differential in the long-term-unemployed share.
The fixed-effects estimates provide a supplementary description of the comparative trajectory. They do not independently confirm the historical explanation or isolate the effects of adjustment programmes. The principal comparative conclusion rests on the observed trajectories and differentials; the regression results show the comparison under the stated adjustments.
6.5. Policy Implications
The findings suggest that youth-employment monitoring should include unemployment, long-term unemployment, NEET status, labour-force participation, and indicators of involuntary non-standard work. Headline unemployment alone cannot show whether recovery reaches people with prolonged unemployment histories or whether new employment provides adequate hours and stability.
The persistence of long-term unemployment also indicates that general economic recovery may be insufficient for the most excluded young people. Policy responses should combine employment growth with early identification, individualised counselling, recognised training, employer-linked placements, and continued support after recruitment. The Youth Guarantee provides an institutional framework for such intervention, but its effectiveness should be assessed through sustained employment outcomes rather than programme entry alone (Council of the European Union 2020; Carcillo et al. 2015).
6.6. Limitations
The study has several principal limitations. First, annual aggregate data cannot identify individual transitions, wages, contract quality, or causal scarring. Second, the long-term-unemployed share excludes economically inactive young people and depends on the composition of unemployment. Third, total temporary and part-time employment do not distinguish voluntary from involuntary arrangements. Fourth, the 2021 EU-LFS methodological revision may affect temporal comparability (Eurostat n.d.). Fifth, the short Greek time series limits breakpoint precision, while the comparative estimates rely on a single focal country.
The exceptionally high in-sample fit of some segmented regressions is an additional limitation. With a short annual series and several deterministic trend terms, the specifications may be sensitive to individual observations and the selected historical boundaries. High R2 values should therefore not be interpreted as evidence of forecasting performance, causal identification, or stability outside the observed sample.
These limitations do not invalidate the observed chronology, but they restrict causal interpretation. Future research should combine the aggregate historical series with EU-LFS microdata, earnings information, longitudinal employment records, migration evidence, and programme-participation data.
7. Conclusions
This study examined four research questions concerning the transformation of youth labour-market outcomes in Greece between 2000 and 2024.
Regarding the first research question, the five indicators followed different trajectories. Youth unemployment and NEET status deteriorated sharply after 2009 and peaked in 2013, whereas the long-term-unemployed share peaked in 2014. Part-time employment reached its maximum later, in 2017, while temporary employment fluctuated without a stable crisis-related pattern. These differences demonstrate that youth labour-market change cannot be represented adequately by the unemployment rate alone.
Regarding the second research question, the exploratory turning points broadly corresponded to the historical chronology but varied across outcomes. The estimated 2009 boundary coincided with the onset of crisis-related deterioration. Recovery boundaries occurred around 2014 for unemployment and NEET status, 2015 for the long-term-unemployed share, and 2018 for part-time employment. These dates represent approximate changes in historical trends rather than precise causal effects of particular institutional events.
Regarding the third research question, declining unemployment coincided with substantial but uneven improvement across the other dimensions. By 2024, the NEET rate was below its 2008 level, whereas unemployment, the long-term-unemployed share, and part-time employment remained above their respective 2008 levels. Temporary employment followed a less systematic trajectory. Recovery was therefore asynchronous and depended on the indicator and benchmark considered.
Regarding the fourth research question, Greece diverged substantially from the published EU27 trajectory during the sovereign-debt crisis and subsequently experienced partial convergence. The unemployment differential narrowed from 29.0 percentage points in 2013 to 7.7 points in 2024, while the NEET differential narrowed from 12.4 to 3.0 points. These comparisons are descriptive because Greece contributes to the EU27 aggregate. The country-level fixed-effects estimates provide complementary conditional comparisons but do not identify the causal effects of adjustment programmes or individual reforms.
Taken together, the findings indicate that the sovereign-debt crisis intensified pre-existing youth labour-market vulnerabilities and that the subsequent recovery proceeded at different speeds across dimensions. Monitoring should therefore consider employment access, unemployment duration, educational disengagement, and employment forms together, while recognising that aggregate indicators cannot establish individual employment security or causal scarring.
Future research should combine the aggregate historical indicators with longitudinal or administrative microdata on employment transitions, earnings, migration, contract stability, and participation in employment programmes. Such evidence would clarify whether the observed recovery translated into durable labour-market integration for young people who entered adulthood during the Greek crisis.
Funding
This research received no external funding.
Institutional Review Board Statement
Not applicable.
Informed Consent Statement
Not applicable.
Data Availability Statement
The original data presented in the study are openly available in the Eurostat database at https://ec.europa.eu/eurostat/databrowser/ under the dataset codes nama_10_gdp (gross domestic product), lfsa_upgan (long-term unemployment), lfsa_eppga (part-time employment), lfsa_etpga (temporary employment), lfsa_urgan (unemployment rates), and edat_lfse_20 (young people neither in employment nor in education or training), corresponding to references Eurostat (2026a, 2026b, 2026c, 2026d, 2026e, 2026f). All datasets were accessed on 5 August 2026.
Acknowledgments
During the preparation of this manuscript, the author used GPT-5.6 Sol for language editing and assistance with figure preparation. The author reviewed and verified all outputs and takes full responsibility for the content of the publication.
Conflicts of Interest
The author declares no conflicts of interest.
Appendix A. Supplementary PCA Results
Table A1.
Principal-component analysis of youth labour-market indicators.
Figure A1.
Youth labour-market exclusion index for Greece. The index is based on pooled-EU standardisation and PCA loadings; higher values represent greater exclusion.
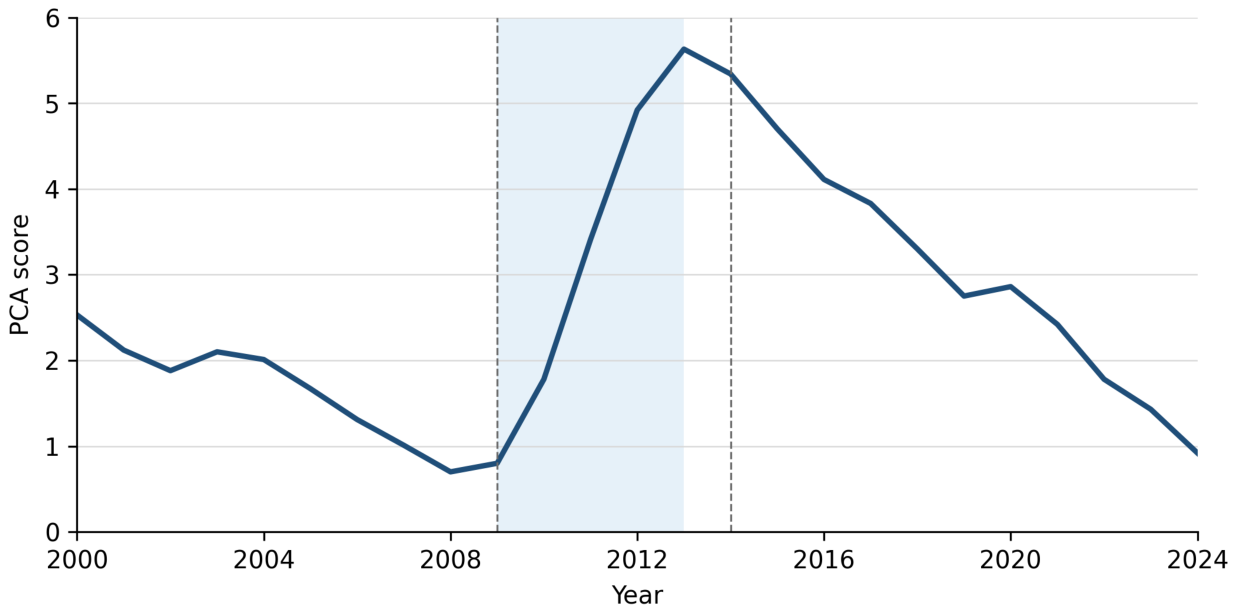
References
- Assmann, Marie-Luise, and Sven Broschinski. 2021. Mapping Young NEETs across Europe: Exploring the Institutional Configurations Promoting Youth Disengagement from Education and Employment. Journal of Applied Youth Studies 4: 95–117. [Google Scholar] [CrossRef] [Scilit]
- Betcherman, Gordon, Nicholas Giannakopoulos, Ioannis Laliotis, Ioanna Pantelaiou, Mauro Testaverde, and Giannis Tzimas. 2023. The Short-Term Impact of the 2020 Pandemic Lockdown on Employment in Greece. Empirical Economics 65: 1273–307. [Google Scholar] [CrossRef] [Scilit] [PubMed]
- Bruno, Giovanni S F, Enrico Marelli, and Marcello Signorelli. 2014. The Rise of NEET and Youth Unemployment in EU Regions after the Crisis. Comparative Economic Studies 56: 592–615. [Google Scholar] [CrossRef] [Scilit]
- Carcillo, Stéphane, Rodrigo Fernández, Sebastian Königs, and Andreea Minea. 2015. NEET Youth in the Aftermath of the Crisis: Challenges and Policies; OECD Social, Employment and Migration Working Papers No. 164. Paris: OECD Publishing. [Google Scholar] [CrossRef]
- Choudhry, Misbah Tanveer, Enrico Marelli, and Marcello Signorelli. 2012. Youth Unemployment Rate and Impact of Financial Crises. International Journal of Manpower 33: 76–95. [Google Scholar] [CrossRef] [Scilit]
- Council of the European Union. 2013. Council Recommendation of 22 April 2013 on Establishing a Youth Guarantee. Official Journal of the European Union C120: 1–6. [Google Scholar]
- Council of the European Union. 2020. Council Recommendation of 30 October 2020 on A Bridge to Jobs-Reinforcing the Youth Guarantee and Replacing the Council Recommendation of 22 April 2013. Official Journal of the European Union C372: 1–9. [Google Scholar]
- Dedoussopoulos, Apostolos, Valia Aranitou, Franciscos Koutentakis, and Marina Maropoulou. 2013. Assessing the Impact of the Memoranda on Greek Labour Market and Labour Relations; Governance and Tripartism Department Working Paper No. 53. Geneva: International Labour Office. [Google Scholar]
- De Fraja, Gianni, Sara Lemos, and James Rockey. 2021. The Wounds That Do Not Heal: The Lifetime Scar of Youth Unemployment. Economica 88: 896–941. [Google Scholar] [CrossRef] [Scilit]
- Demetriades, Stavroula. 2018. Youth in Greece. Dublin: Eurofound. Available online: https://www.eurofound.europa.eu/en/publications/all/youth-greece (accessed on 5 August 2026).
- Eurofound. 2024. Becoming Adults: Young People in a Post-Pandemic World. Luxembourg: Publications Office of the European Union. [Google Scholar]
- European Commission, Directorate-General for Economic and Financial Affairs. 2012. The Second Economic Adjustment Programme for Greece; European Economy, Occasional Papers No. 94. Luxembourg: Publications Office of the European Union. [Google Scholar] [CrossRef] [Scilit]
- Eurostat. 2026a. Gross Domestic Product at Market Prices, Dataset nama_10_gdp. Available online: https://ec.europa.eu/eurostat/databrowser/view/nama_10_gdp/default/table (accessed on 5 August 2026).
- Eurostat. 2026b. Long-Term Unemployment by Sex and Age—Annual Data, Dataset lfsa_upgan. Available online: https://ec.europa.eu/eurostat/databrowser/view/lfsa_upgan/default/table (accessed on 5 August 2026).
- Eurostat. 2026c. Part-Time Employment by Sex and Age—Annual Data, Dataset lfsa_eppga. Available online: https://ec.europa.eu/eurostat/databrowser/view/lfsa_eppga/default/table (accessed on 5 August 2026).
- Eurostat. 2026d. Temporary Employees by Sex and Age—Annual Data, Dataset lfsa_etpga. Available online: https://ec.europa.eu/eurostat/databrowser/view/lfsa_etpga/default/table (accessed on 5 August 2026).
- Eurostat. 2026e. Unemployment Rates by Sex, Age and Citizenship—Annual Data, Dataset lfsa_urgan. Available online: https://ec.europa.eu/eurostat/databrowser/view/lfsa_urgan/default/table (accessed on 5 August 2026).
- Eurostat. 2026f. Young People Neither in Employment nor in Education and Training—Annual Data, Dataset edat_lfse_20. Available online: https://ec.europa.eu/eurostat/databrowser/view/edat_lfse_20/default/table (accessed on 5 August 2026).
- Eurostat. n.d. EU Labour Force Survey—Methodology. Luxembourg: European Commission. Available online: https://ec.europa.eu/eurostat/statistics-explained/index.php?title=EU_labour_force_survey_-_methodology (accessed on 5 August 2026).
- Filomena, Mattia, and Matteo Picchio. 2022. Are Temporary Jobs Stepping Stones or Dead Ends? A Systematic Review of the Literature. International Journal of Manpower 43: 60–74. [Google Scholar] [CrossRef] [Scilit]
- García-Pérez, Carmelo, Mercedes Prieto-Alaiz, and Hipólito Simón. 2017. A New Multidimensional Approach to Measuring Precarious Employment. Social Indicators Research 134: 437–54. [Google Scholar] [CrossRef] [Scilit]
- Gregg, Paul, and Emma Tominey. 2005. The Wage Scar from Male Youth Unemployment. Labour Economics 12: 487–509. [Google Scholar] [CrossRef] [Scilit]
- International Labour Organization. 2011. Report on the High-Level Mission to Greece, Athens, 19–23 September 2011. Geneva: International Labour Organization. Available online: https://www.ilo.org/resource/report/report-high-level-mission-greece-athens-19-23-september-2011 (accessed on 5 August 2026).
- Jolliffe, Ian T., and Jorge Cadima. 2016. Principal Component Analysis: A Review and Recent Developments. Philosophical Transactions of the Royal Society A: Mathematical, Physical and Engineering Sciences 374: 20150202. [Google Scholar] [CrossRef] [Scilit] [PubMed]
- Kalleberg, Arne L. 2009. Precarious Work, Insecure Workers: Employment Relations in Transition. American Sociological Review 74: 1–22. [Google Scholar] [CrossRef] [Scilit]
- Koukiadaki, Aristea, Isabel Távora, and Miguel Martínez-Lucio, eds. 2016. Joint Regulation and Labour Market Policy in Europe During the Crisis. Brussels: European Trade Union Institute. [Google Scholar]
- Kretsos, Lefteris. 2011. Union Responses to the Rise of Precarious Youth Employment in Greece. Industrial Relations Journal 42: 453–72. [Google Scholar] [CrossRef] [Scilit]
- Newey, Whitney K., and Kenneth D. West. 1987. A Simple, Positive Semi-Definite, Heteroskedasticity and Autocorrelation Consistent Covariance Matrix. Econometrica 55: 703–8. [Google Scholar] [CrossRef] [Scilit]
- OECD. 2020. OECD Economic Surveys: Greece 2020. Paris: OECD Publishing. [Google Scholar] [CrossRef] [Scilit]
- OECD. 2024. OECD Economic Surveys: Greece 2024. Paris: OECD Publishing. [Google Scholar] [CrossRef] [Scilit]
- Papadopoulos, Orestis. 2016. Economic Crisis and Youth Unemployment: Comparing Greece and Ireland. European Journal of Industrial Relations 22: 409–26. [Google Scholar] [CrossRef] [Scilit]
- Yannakourou, Matina, and Chronis Tsimpoukis. 2014. Flexibility without Security and Deconstruction of Collective Bargaining: The New Paradigm of Labor Law in Greece. Comparative Labor Law & Policy Journal 35: 331–70. [Google Scholar]
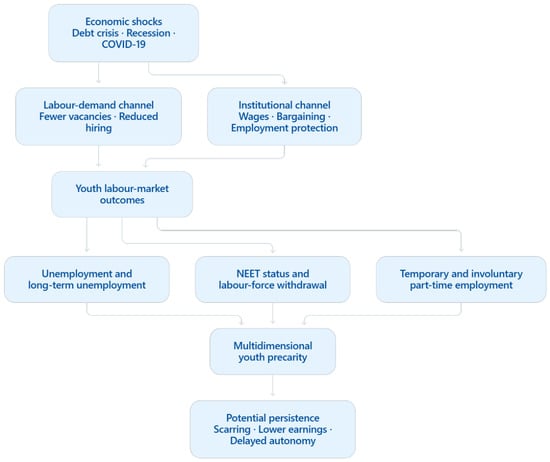
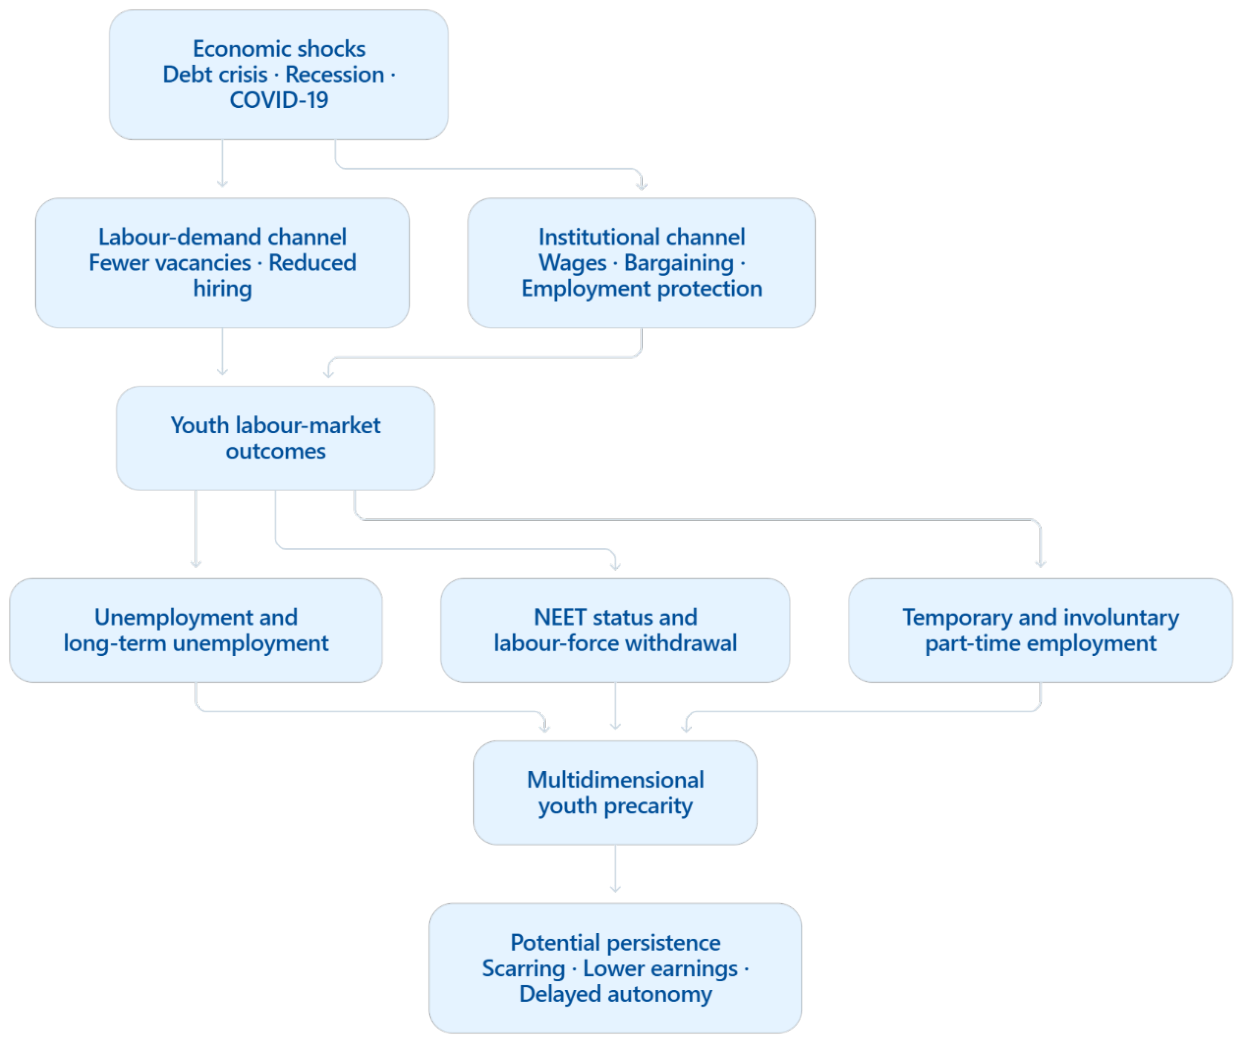

Disclaimer/Publisher’s Note: The statements, opinions and data contained in all publications are solely those of the individual author(s) and contributor(s) and not of MDPI and/or the editor(s). MDPI and/or the editor(s) disclaim responsibility for any injury to people or property resulting from any ideas, methods, instructions or products referred to in the content. |
© 2026 by the author. Licensee MDPI, Basel, Switzerland. This article is an open access article distributed under the terms and conditions of the Creative Commons Attribution (CC BY) license.