


Simple Summary
Tooth loss may be associated with changes in the distribution of masticatory forces and structural characteristics of the mandibular condyle. This study investigated whether different patterns of tooth loss were associated with changes in cone-beam computed tomography-derived gray values of the mandibular condyle. Condylar CBCT-derived gray values tended to be lower in completely edentulous individuals; however, the observed differences were not consistent across all tooth-loss patterns. These findings suggest that evaluation of the mandibular condyle on dental imaging may provide complementary information for prosthetic treatment planning and long-term assessment of joint health. Further longitudinal studies are needed to clarify the relationship between tooth loss, altered functional loading, and condylar bone remodeling.
Abstract
Background/Objectives: This study aimed to evaluate the relationship between tooth loss and mandibular condylar cone-beam computed tomography (CBCT)-derived gray values according to different patterns of edentulism. Methods: This retrospective study was conducted using the CBCT archive of the Department of Oral and Maxillofacial Radiology, Faculty of Dentistry, Harran University. All CBCT examinations were obtained using a single CBCT scanner and a standardized acquisition protocol. Demographic variables such as age and gender, along with edentulism status based on the Kennedy classification, were recorded to assess their relationship with mandibular condylar CBCT-derived gray values. The collected data were statistically analyzed using the independent t-test, Pearson’s chi-square test, one-way ANOVA with Bonferroni-adjusted post hoc comparisons, paired samples t-test, and multivariable linear regression analysis. Results: A total of 371 CBCT scans (144 males and 227 females) were included. The mean age was 41.67 years for females and 41.87 years for males. The mean CBCT-derived gray values of the right and left mandibular condyles were lower in males (right: 577.08 ± 161.18; left: 353.89 ± 181.41) compared to females (right: 702.02 ± 137.59; left: 460.47 ± 163.65) (p < 0.001 for both sides). In a secondary analysis, the mean CBCT-derived gray value of the right condyle (653.53 ± 159.13) was higher than that of the left condyle (419.10 ± 178.27) (unadjusted p < 0.001). A nominal overall association between maxillary dentition status and right condylar CBCT-derived gray values was observed after adjustment for age, sex, and mandibular dentition status (p = 0.024). However, this association was not corrected for multiple testing across study outcomes and should therefore be interpreted as exploratory. No significant overall adjusted associations were observed for mandibular dentition status or for left condylar gray values. Conclusions: Descriptively lower CBCT-derived gray values were observed in completely edentulous individuals; however, these differences were not statistically confirmed and were not consistent across all dentition classifications. These findings should also be interpreted cautiously, as CBCT-derived gray values are scanner- and protocol-dependent and do not represent absolute Hounsfield units or direct measurements of bone mineral density. Further longitudinal and calibrated imaging studies are needed to clarify the relationship between tooth loss and mandibular condylar bone changes.
1. Introduction
Tooth loss is a common health problem that can lead to nutritional deficiencies, speech difficulties, aesthetic and psychological issues, jawbone resorption, malocclusion due to tooth shifting, and general health problems [1]. The main causes of tooth loss include dental caries, periodontal diseases, trauma, and congenital anomalies.
With the increasing awareness of oral health, the preservation of natural teeth has become a priority, leading to a higher prevalence of partial edentulism rather than complete edentulism [1,2]. To ensure proper treatment planning in partial edentulism, classification systems are used, among which the Kennedy classification is the most widely accepted [1,3].
Tooth loss may be associated with changes in occlusal force distribution. Changes in dental arch configuration may also be associated with altered loading patterns on the temporomandibular joint (TMJ), particularly the mandibular condyle [4,5,6,7].
Loss of posterior occlusal support may also be associated with changes in occlusal vertical dimension, particularly in patients with extensive or unreplaced posterior tooth loss [6]. A reduction in posterior support may alter mandibular position and occlusal relationships and may modify the distribution of functional loads within the masticatory system. These changes may, in turn, influence the mechanical environment of the temporomandibular joint and mandibular condyle [4]. Therefore, potential alterations in vertical dimension should be considered when evaluating the relationship between posterior tooth loss and condylar adaptation.
The Kennedy classification provides a standardized framework for understanding these force distributions. While Class I and II edentulism involve posterior support loss, they may be associated with different remodeling responses in the condylar trabecular bone compared to tooth-supported scenarios [8,9].
Condylar morphology varies depending on factors such as age, sex, skeletal pattern, occlusal forces, and malocclusion type, and it possesses the ability to remodel throughout life in response to functional loading. Variations in condylar shape and volume have been reported to provide valuable information for understanding the etiology of TMJ disorders and for early diagnosis. Furthermore, the bone quality of the mandibular condyle plays a crucial role in determining the appropriate treatment approach for edentulous patients [8,9,10,11].
Bone mineral density (BMD) is a fundamental indicator for determining bone quality, and two main measurement methods are commonly used in clinical practice. Dual-energy X-ray absorptiometry (DEXA) evaluates the bone mineral content of specific regions in two dimensions using a low-dose X-ray, whereas quantitative computed tomography (QCT) utilizes computed tomography (CT) technology to provide three-dimensional and site-specific BMD analyses [12,13].
In conventional CT, the Hounsfield unit (HU) is a standardized quantitative measure used to assess tissue radiodensity. The extent to which a tissue attenuates X-rays depends on its physical density, and this property is represented as grayscale values on CT images [14]. HU values are calculated by normalizing the X-ray attenuation coefficients of tissues relative to water, where pure water is defined as 0 HU and air as −1000 HU. Dense structures such as bone exhibit positive HU values, while less dense tissues (e.g., adipose tissue or pulmonary parenchyma) display negative values. HU measurements allow the differentiation of tissues based on brightness and darkness levels, thereby playing a critical role in diagnostic CT interpretation [15].
Compared with conventional medical CT, CBCT offers advantages such as lower radiation exposure and lower cost, which have contributed to its widespread use in dental and maxillofacial imaging [16].
CBCT also provides high spatial resolution and three-dimensional visualization, enabling detailed assessment of anatomical structures and clinically relevant evaluation of osseous morphology, bone quantity, and proximity to critical anatomical structures during implant planning [17,18].
Assessment of bone mineral density (BMD) is vital for prosthetic prognosis. Although CBCT-derived gray values have been investigated as quantitative imaging parameters [19,20], they are not standardized in the same manner as Hounsfield units obtained from conventional CT. CBCT gray values may vary according to scanner- and acquisition-related factors, including the field of view and region of interest [21,22]. Previous studies have reported correlations between CBCT gray values and conventional CT Hounsfield units under specific conditions; however, these values should not be considered directly interchangeable without appropriate calibration or validation [21,22,23,24]. Therefore, CBCT-derived gray values are more appropriately interpreted as device- and protocol-specific quantitative imaging measurements rather than absolute Hounsfield units or direct measures of bone mineral density.
Accordingly, the present study utilized CBCT-derived gray values to investigate their relationship with different patterns of tooth loss and edentulism. By comparing mandibular condylar CBCT-derived gray values across different Kennedy classifications and dentition groups, this study aimed to determine whether specific tooth-loss patterns were associated with variations in condylar trabecular imaging characteristics. These findings may contribute to a better understanding of the relationship between tooth loss, altered functional loading, and condylar remodeling. The primary exposure was dentition status, classified separately for the maxillary and mandibular arches according to the Kennedy classification and complete or full dentition status. The primary outcome was the mean CBCT-derived gray value of the mandibular condyle. The primary comparison was the comparison of mean condylar CBCT-derived gray values across dentition categories, evaluated separately for the maxillary and mandibular classifications. Comparisons according to sex and between the right and left condyles were considered secondary analyses. The null hypothesis of this study was that different patterns of tooth loss, as classified by Kennedy, would not be associated with significant differences in the CBCT-derived gray values of the mandibular condyle.
2. Materials and Methods
Prior to the commencement of the study, ethical approval was obtained from the Harran University Clinical Research Ethics Committee (Protocol No: HRU/25.15.16, approval date: 15 September 2025). The study was conducted in full accordance with the Declaration of Helsinki (1964) and its subsequent revisions.
In this retrospective study, CBCT images of patients aged 18 years and older who visited the Department of Oral and Maxillofacial Radiology, Faculty of Dentistry, Harran University, for various diagnostic purposes between 2023 and 2024 were evaluated. The age threshold of 18 years was selected to restrict the study population to adults and to minimize the potential influence of ongoing craniofacial growth and developmental changes in the mandibular condyle on the evaluated imaging parameters. Patients with no genetic or chronic systemic diseases affecting bone metabolism and without any fractures or pathological findings in the examined region were included. Images with patient- or device-related artifacts or low resolution were excluded. Cases with evident pathological changes affecting the mandibular condyle or temporomandibular joint region on CBCT were not included in the study.
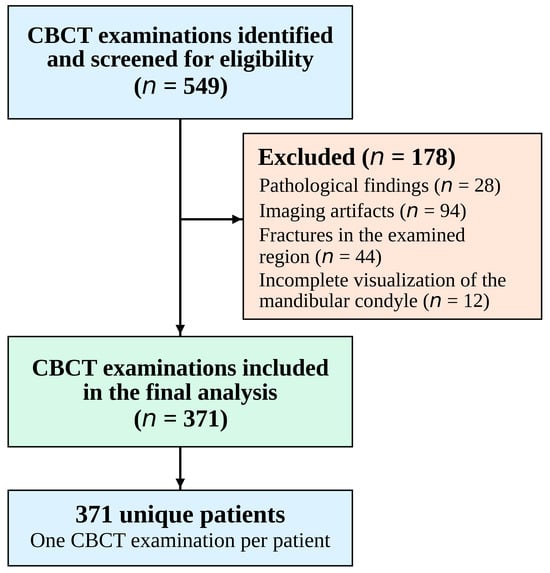
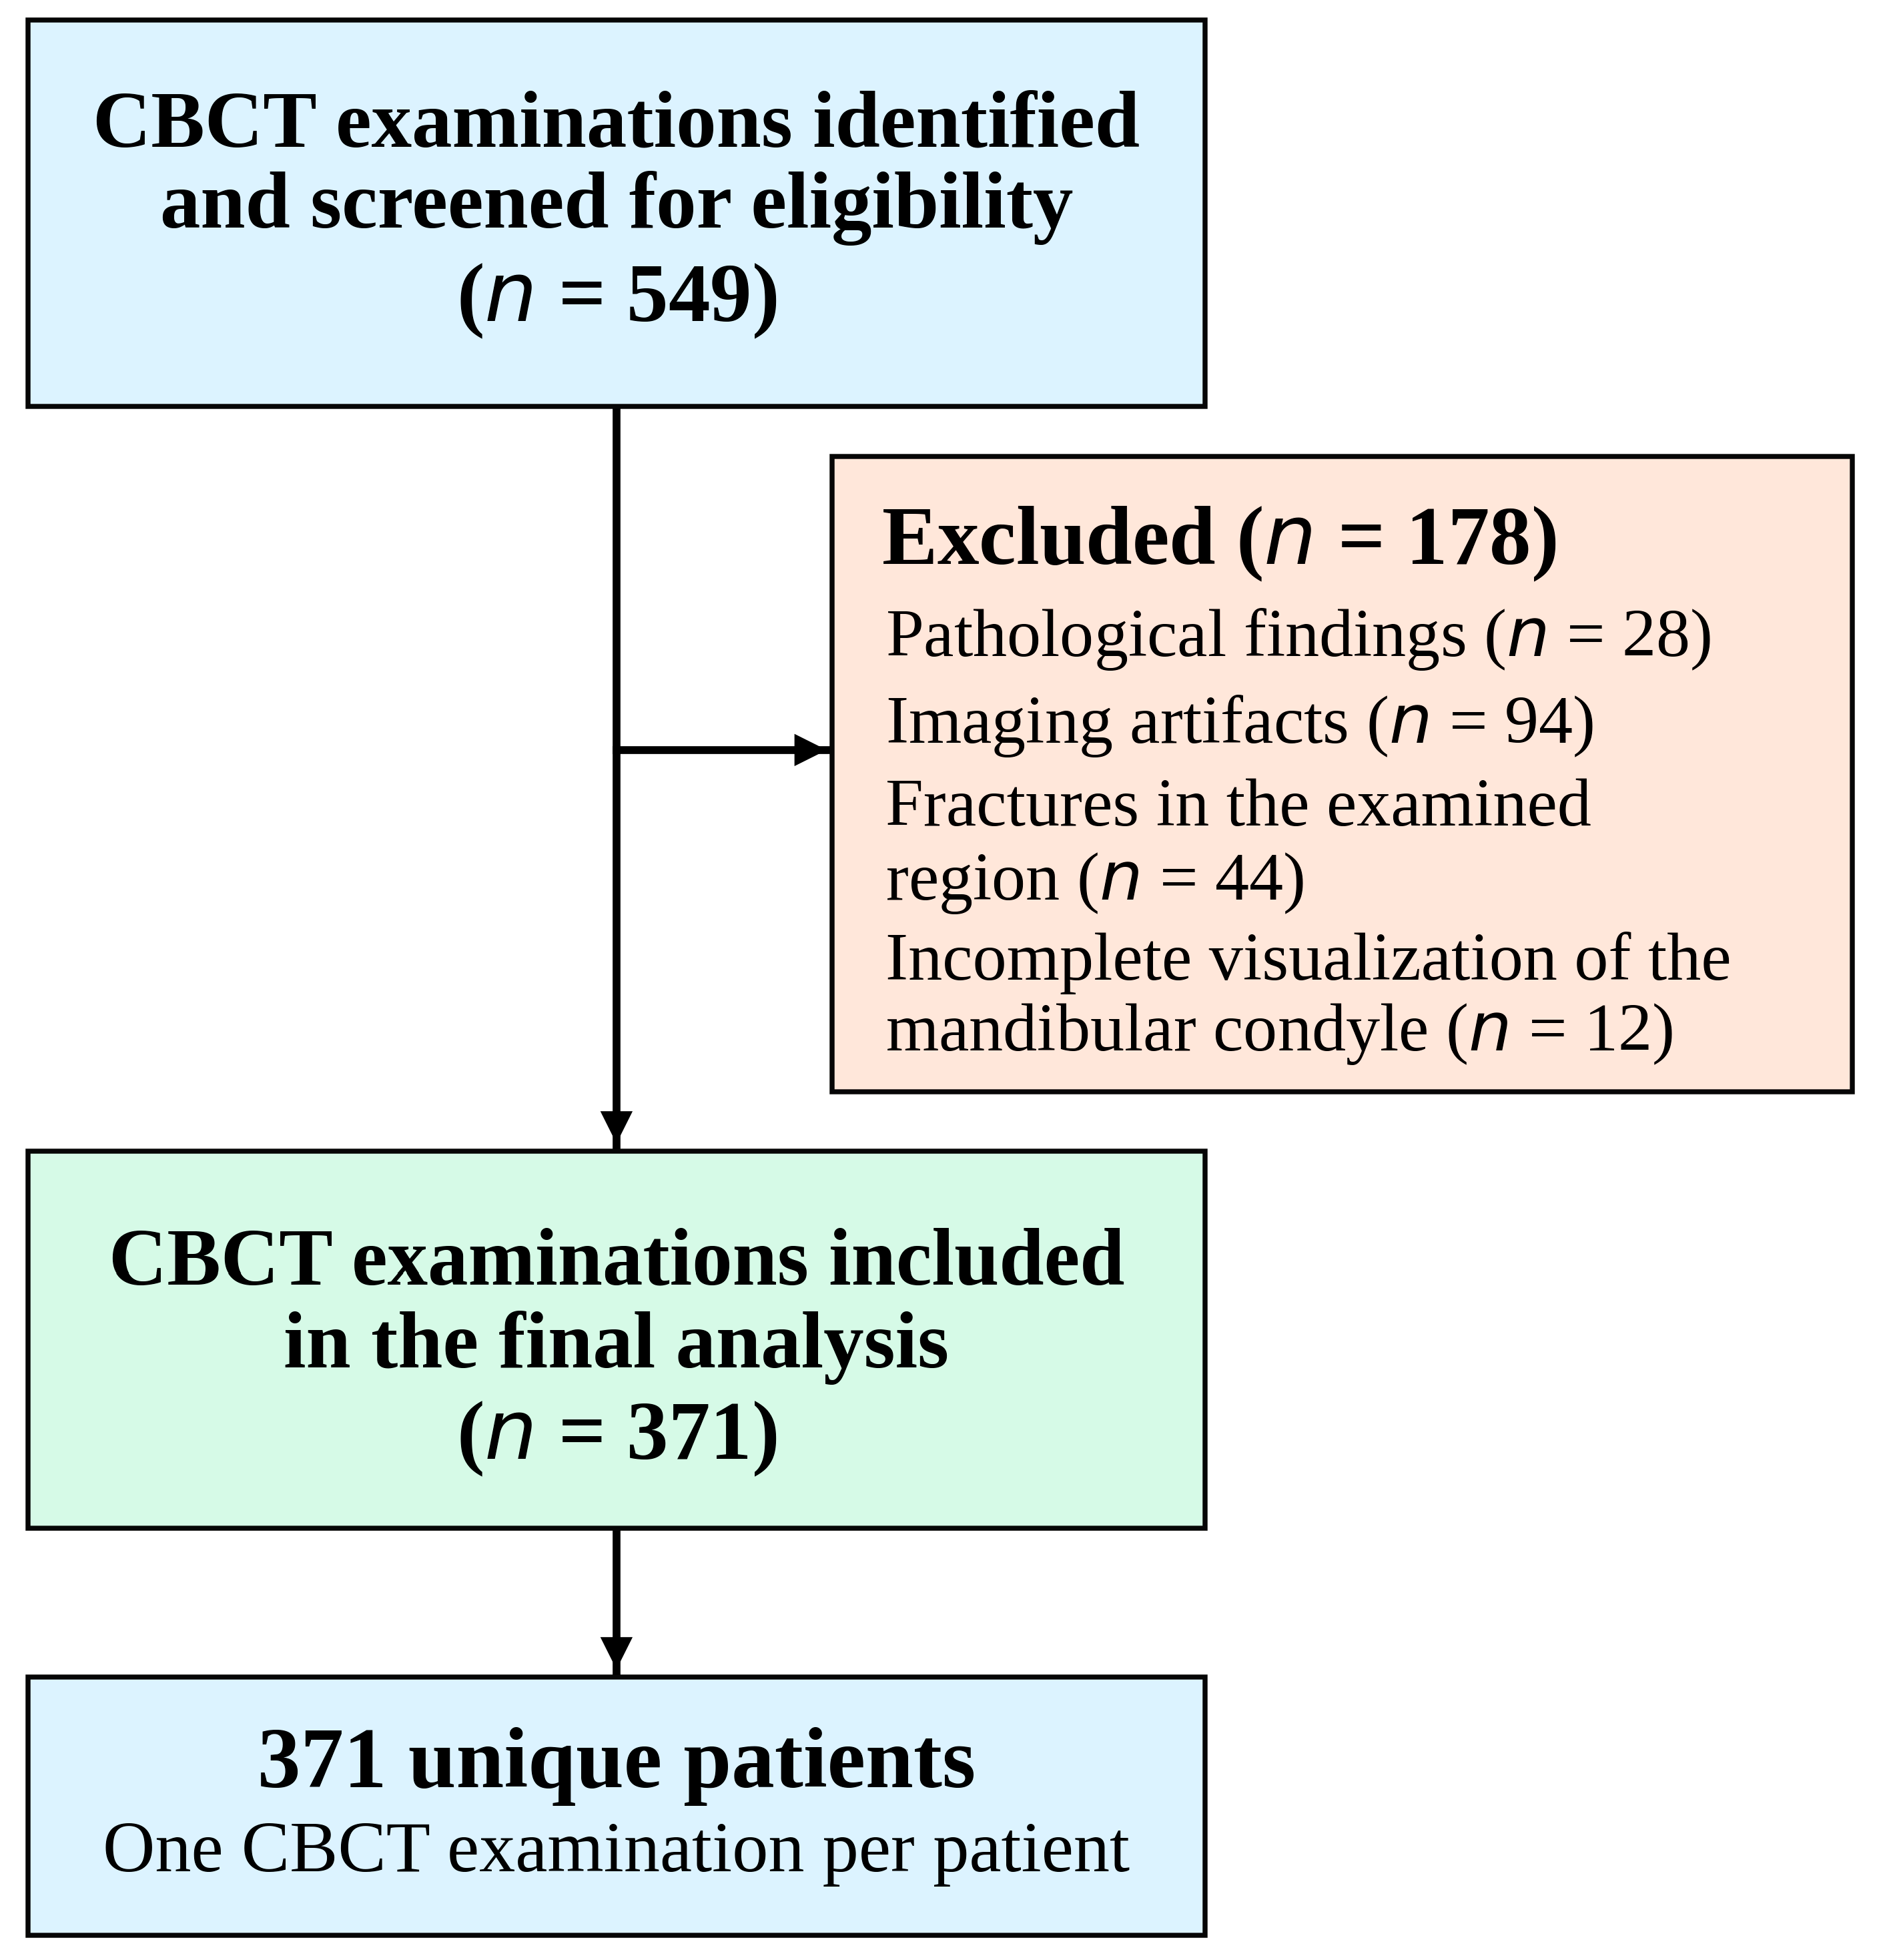
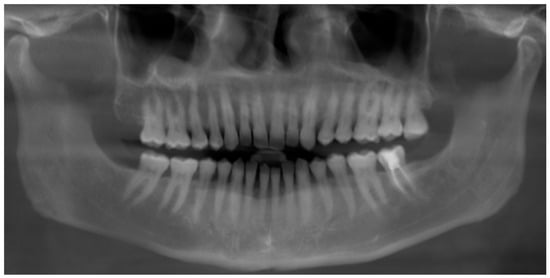
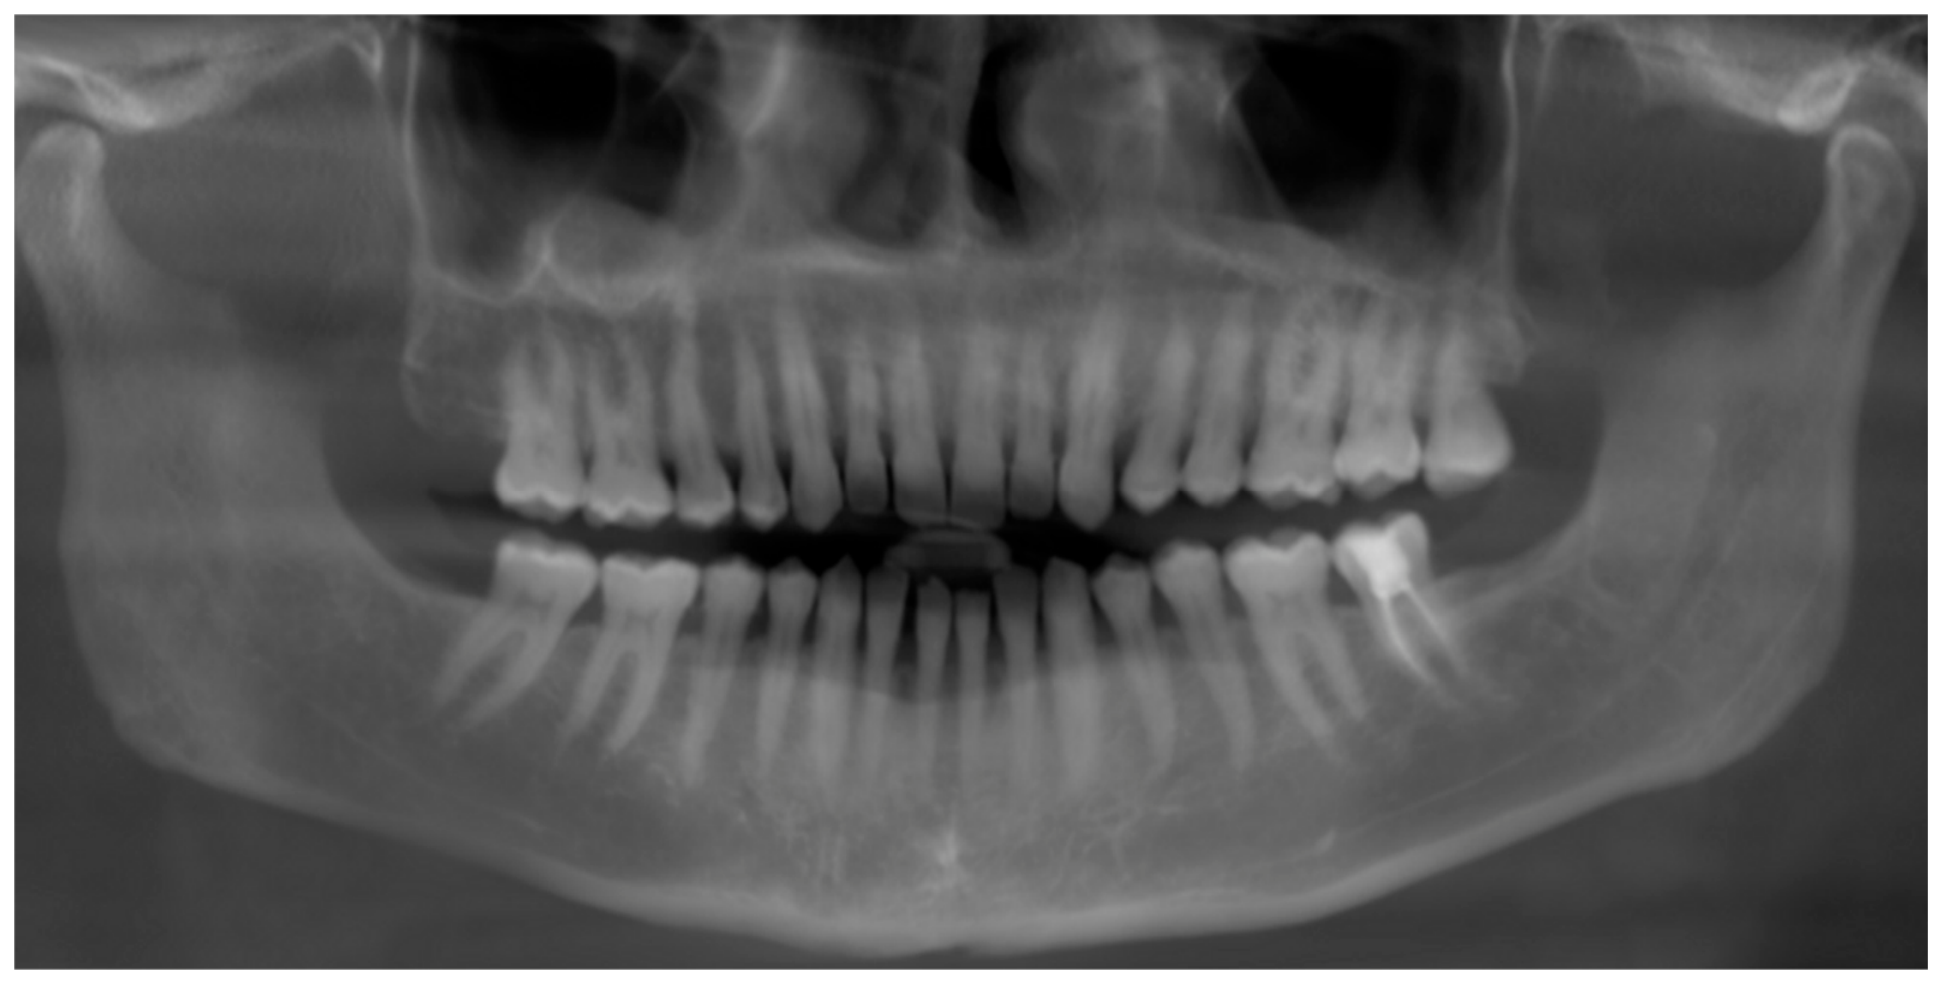
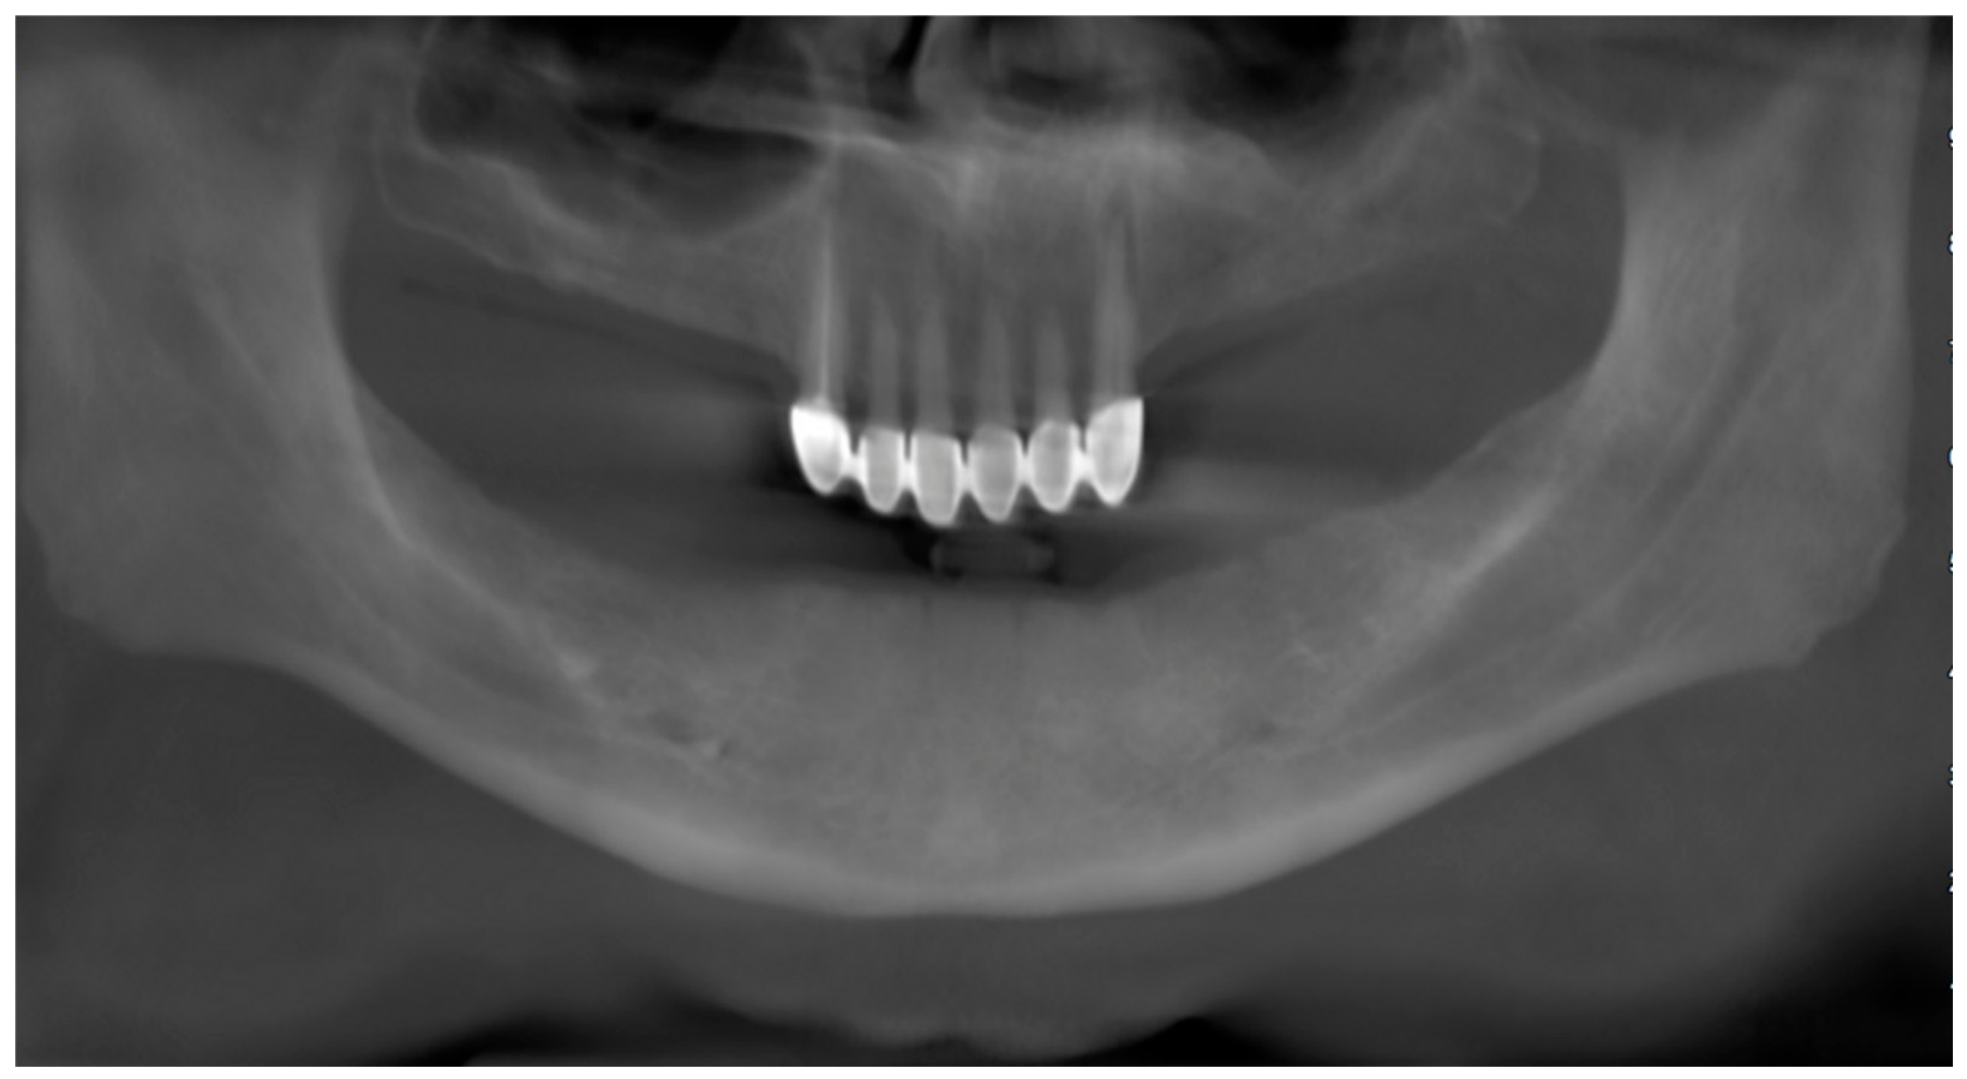
A total of 549 CBCT examinations were screened for eligibility. Of these, 178 examinations were excluded because of pathological findings (n = 28), imaging artifacts (n = 94), fractures in the examined region (n = 44), or incomplete visualization of the mandibular condyle (n = 12). The remaining 371 CBCT examinations were included in the final analysis (Figure 1). Each examination represented a unique patient, and no patient contributed more than one CBCT examination to the study. Multiplanar reconstructions (axial, sagittal, and coronal planes) were obtained, and panoramic reformatted images were generated. Based on these images, the cases were classified according to their dentition status as fully dentate, partially edentulous, or completely edentulous (Figure 2 and Figure 3). The maxillary and mandibular arches were evaluated and classified separately according to dentition status. Thus, the dental arch was considered the unit of dentition classification, while each patient remained the unit of inclusion in the study. A patient could therefore be assigned to different dentition categories in the maxilla and mandible (e.g., fully dentate in one arch and partially edentulous in the opposing arch). No attempt was made to assign such patients to a single combined dentition category; instead, maxillary and mandibular dentition classifications were analyzed separately. In partially edentulous patients, the types of edentulism were determined according to the Kennedy classification. In this classification, third molars were excluded from the evaluation, and modification areas were not considered. The Kennedy system defines partial edentulism according to the location and extent of the edentulous areas as follows:
Figure 1.
Flow diagram of the CBCT examination selection process. A total of 549 examinations were screened, and 371 unique patients were included in the final analysis.
Figure 2.
Panoramic radiograph of a dentate patient with both maxillary and mandibular arches.
Figure 3.
Panoramic radiograph of an edentulous mandible.
- Class I—Bilateral free-end edentulous areas located posterior to the remaining natural teeth;
- Class II—A unilateral free-end edentulous area located posteriorly;
- Class III—A unilateral bounded edentulous area with natural teeth remaining both anteriorly and posteriorly;
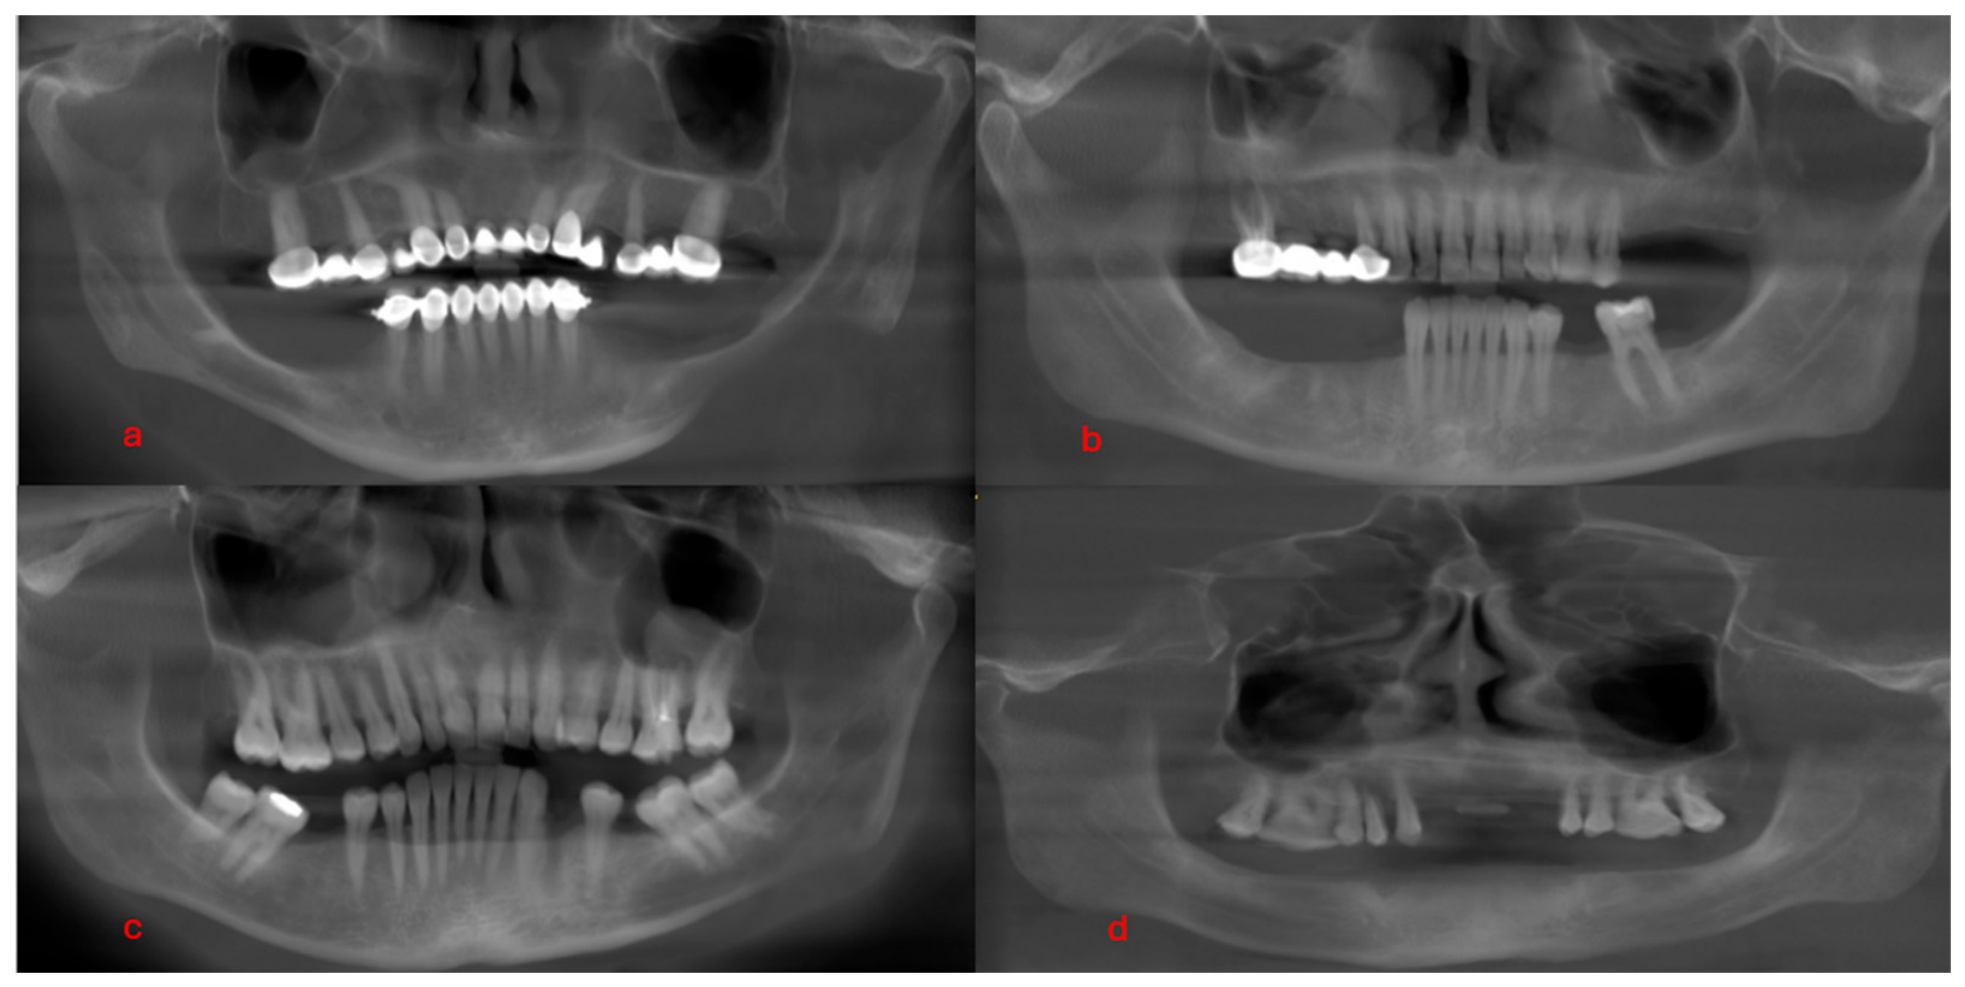
- Class IV—A single edentulous area located anteriorly and crossing the midline (Figure 4).
Figure 4.
Classification of partially edentulous patients according to the Kennedy classification: (a) mandibular Kennedy Class I, (b) maxillary and mandibular Kennedy Class II, (c) mandibular Kennedy Class III, (d) maxillary Kennedy Class IV.
CBCT images that met the inclusion criteria were acquired using a Castellini X-Radius Trio Plus CBCT unit (Imola, Italy) with the following exposure parameters: 16 mAs, 90 kVp, 0.3 mm voxel size, 1 mm slice thickness, and a field of view (FOV) of 13 × 16 cm. The images were evaluated using IRYS Viewer 15.1 software on a Full HD monitor with a maximum screen resolution of 1920 × 1080 pixels and a 15.6-inch display. All assessments were performed by two experienced oral and maxillofacial radiologists in a quiet, dimly lit room to ensure optimal viewing conditions. Before the main image evaluation, the two oral and maxillofacial radiologists reviewed a set of sample CBCT scans together to standardize the image-selection criteria, ROI placement, and measurement procedure. Any discrepancies were discussed until consensus was reached, and the agreed criteria were subsequently applied to all study images. The primary evaluations were performed jointly by consensus. Accordingly, the primary measurements were based on a consensus evaluation rather than on the averaging of two separate observer measurements. The observers were not blinded to dentition status because the dentition category was directly visible on the CBCT images. To assess measurement reproducibility, 20% of the CBCT examinations were randomly selected and independently re-evaluated by both observers after a two-week interval using the same standardized measurement protocol. Interobserver reliability was assessed using the intraclass correlation coefficient (ICC), calculated using a two-way random-effects model with absolute agreement for single measurements.
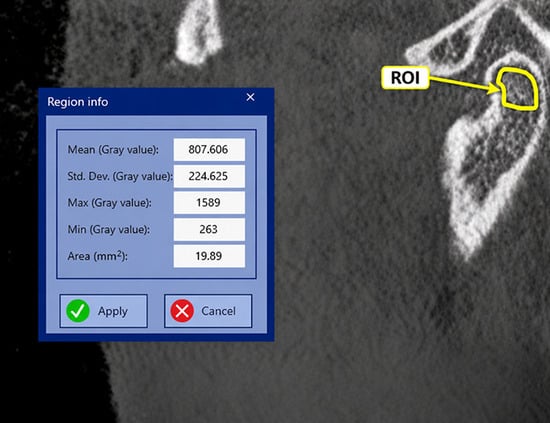
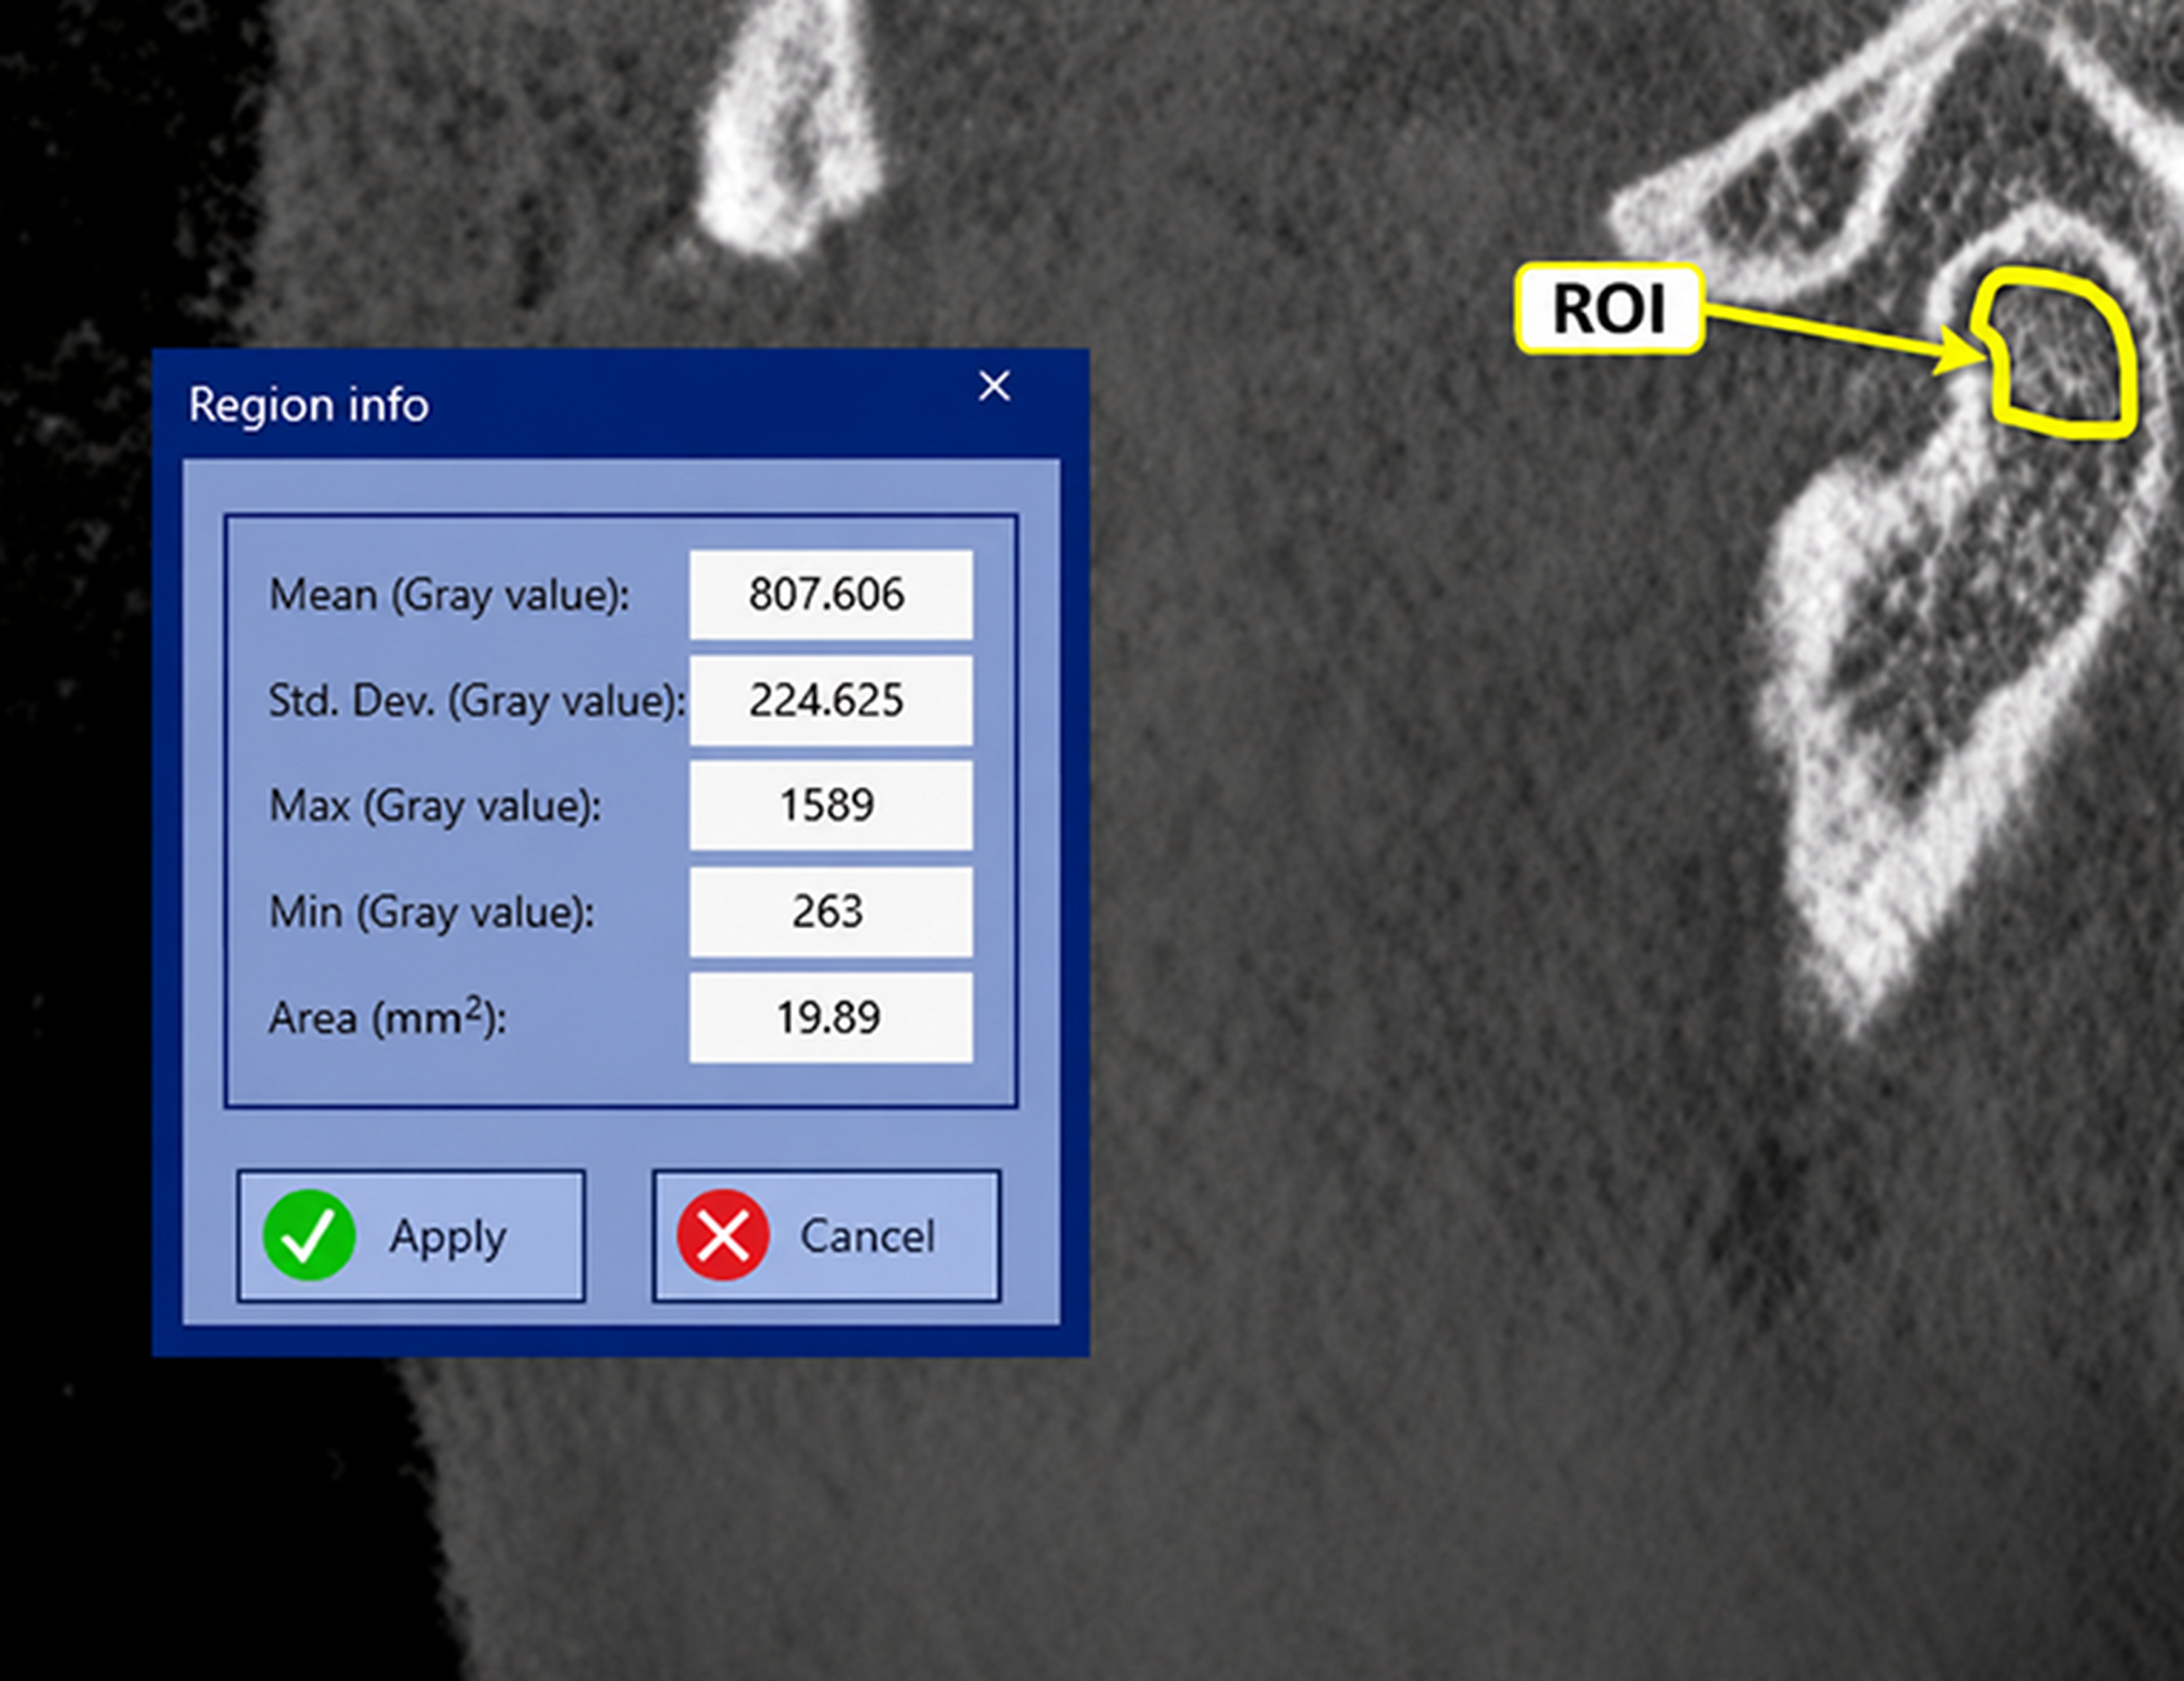
For all examinations, the sagittal slice in which the mandibular condylar head was most clearly visible was selected. An approximately 20 mm2 freehand ROI, generally circular in configuration, was placed within the trabecular bone of the mandibular condyle. Because the ROI was manually delineated to conform to the available trabecular compartment, its exact area could vary slightly between examinations; however, an approximately 20 mm2 target area and the same placement criteria were consistently applied to all measurements. The ROI was positioned in the central trabecular portion of the condylar head whenever possible. The ROI was manually delineated so that it remained entirely within the trabecular compartment without extending into the cortical bone. Areas showing erosion, sclerosis, pathological changes, or imaging artifacts were avoided. The same placement approach was applied to the right and left condyles. The software-generated mean voxel intensity within the ROI was recorded as a CBCT-derived gray value (Figure 5). The exact number of voxels included within each ROI was not recorded by the software and therefore could not be determined retrospectively. Although the software interface displayed the measurement as HU, no phantom-based calibration or validation against conventional CT was performed; therefore, the values were interpreted as device- and protocol-specific gray values rather than absolute Hounsfield units. The measurements were obtained from trabecular rather than cortical bone, as trabecular bone generally exhibits more extensive and faster modeling and remodeling responses, partly due to its larger surface-to-volume ratio [25,26].
Figure 5.
Measurement of mandibular condylar CBCT-derived gray values on a sagittal CBCT image. The region of interest (ROI) is highlighted within the trabecular portion of the mandibular condyle, excluding the cortical bone.
Statistical Analysis
The original sample-size calculation was performed a priori using a simplified two-group t-test framework, with a statistical power of 90% (1 − β = 0.90), a significance level of α = 0.05, and an effect size of d = 0.529, yielding a minimum required sample size of 346 participants. Because the final study included multiple dentition categories with markedly unequal subgroup sizes, this calculation should be regarded as an overall sample-size target rather than as a power justification for individual Kennedy-class comparisons. All statistical analyses were performed using SPSS software (IBM SPSS Statistics (version 23.0; IBM Corp., Armonk, NY, USA)). The primary analysis evaluated differences in mandibular condylar CBCT-derived gray values across dentition categories, whereas sex-based and right–left comparisons were treated as secondary analyses. The normality of the data distribution was assessed using the Kolmogorov–Smirnov test. For comparisons between two independent groups, the independent t-test was applied. Categorical variables were analyzed using Pearson’s chi-square test. For the comparison of two related variables, the paired samples t-test was employed. A p-value < 0.05 was considered statistically significant. For comparisons involving more than two groups (e.g., dentition status across Kennedy classes), one-way ANOVA was conducted. To adjust for multiple pairwise comparisons and control the Family-Wise Error Rate (FWER), Bonferroni post-hoc correction was applied. Adjusted p-values < 0.05 were considered statistically significant. However, no additional global correction for multiple testing across the different study outcomes and subgroup analyses was applied. Interobserver measurement reliability was assessed using the intraclass correlation coefficient (ICC), calculated using a two-way random-effects model with absolute agreement for single measurements. The ICC estimate and its corresponding 95% confidence interval (CI) were reported.
For the completely edentulous and Kennedy Class IV subgroups, 95% confidence intervals (CIs) for the mean CBCT-derived gray values were calculated using the subgroup means, standard deviations, and sample sizes based on Student’s t-distribution. To evaluate the independent associations between dentition status and mandibular condylar CBCT-derived gray values, separate multivariable linear regression models were constructed for the right and left condyles. Maxillary and mandibular dentition status were treated as nominal categorical variables, each comprising six categories: Kennedy Classes I–IV, fully dentate, and completely edentulous. Indicator (dummy) variables were used, with the fully dentate group serving as the reference category for each arch. Age was included as a continuous covariate, and sex was included as a binary categorical covariate, with males serving as the reference category.
Both models were adjusted for age, sex, and the dentition classifications of both arches. Overall associations of maxillary and mandibular dentition status were evaluated using partial F-tests. Unstandardized regression coefficients (B), 95% confidence intervals (CIs), and p-values were reported. Model fit was assessed using R2 and adjusted R2.
3. Results
Interobserver reliability analysis demonstrated excellent agreement between the two observers for CBCT-derived gray value measurements, with an intraclass correlation coefficient (ICC) of 0.988 (95% CI: 0.980–0.994).
Table 1 shows the distribution of participants according to maxillary and mandibular dentition status. In both arches, dentate individuals constituted the largest group, followed by Kennedy Class III cases, whereas Kennedy Class IV and completely edentulous cases represented the smallest subgroups.
Table 1.
Distribution of participants according to maxillary and mandibular dentition status.
Table 2 illustrates the distribution of mandibular condylar CBCT-derived gray values on the right and left sides according to sex and edentulism (based on Kennedy classification). In the evaluation by sex, the mean CBCT-derived gray values of the right and left mandibular condyles were lower in males (right: 577.08 ± 161.18/left: 353.89 ± 181.41) compared to females (right: 702.02 ± 137.59/left: 460.47 ± 163.65). CBCT-derived gray values were significantly higher in females than in males for both the right and left mandibular condyles (p < 0.001 for both comparisons).
Table 2.
Distribution of right and left mandibular condylar CBCT-derived gray values according to sex and edentulism status (based on Kennedy classification).
In the maxilla, right mandibular condylar CBCT-derived gray values varied across Kennedy classes, with generally lower values observed in the higher Kennedy classes.
The highest CBCT-derived gray values were recorded in fully dentate cases (679.71 ± 149.85), whereas the lowest values were observed in completely edentulous cases (514.41 ± 168.24). These results suggest lower CBCT-derived gray values in the completely edentulous group; however, they should not be interpreted as direct evidence of reduced condylar bone density. On the left side, CBCT-derived gray values of the mandibular condyle were relatively similar from Kennedy Class I to III (402.78 ± 144.46 ~ 402.91 ± 184.56 ~ 419.21 ± 169.23), with a slight increase in Kennedy Class IV cases (455.62 ± 230.59). Nevertheless, the lowest CBCT-derived gray values were observed in completely edentulous cases (378.13 ± 76.55).
In the evaluation of edentulism in the mandible, a gradual increase in right condylar CBCT-derived gray values was observed from Kennedy Class I to III (610.33 ± 195.50 → 670.49 ± 144.09), followed by a slight decrease in Kennedy Class IV and completely edentulous cases (593.47 ± 230.58 and 608.07 ± 134.08). Similarly, no significant differences were observed among Kennedy classes on the left condyle; however, fully dentate cases (449.88 ± 177.36) exhibited higher CBCT-derived gray values compared to other groups, whereas completely edentulous cases (438.18 ± 180.73) showed a relative decrease. These differences were not statistically significant (p > 0.05). One-way ANOVA showed a statistically significant difference in mean right condylar gray values across maxillary dentition categories (F = 4.279, p = 0.001). Post-hoc pairwise comparisons with Bonferroni adjustment revealed that mean right condylar CBCT-derived gray values were significantly higher in fully dentate individuals compared to individuals with Kennedy Class III partial edentulism (p_adjusted = 0.037). No other pairwise subgroup comparisons reached statistical significance after Bonferroni correction (Table 2).
For the maxillary Kennedy Class IV group, the 95% confidence intervals were 420.51–656.27 for the right condyle and 300.71–610.53 for the left condyle. In the completely edentulous maxillary group, the corresponding intervals were 337.85–690.97 and 297.80–458.46, respectively. For the mandibular Kennedy Class IV group, the 95% confidence intervals were 380.22–806.72 for the right condyle and 321.89–640.45 for the left condyle, while those for the completely edentulous mandibular group were 512.15–703.99 and 308.89–567.47, respectively. The relatively wide confidence intervals observed in these small subgroups indicate limited precision of the estimated mean CBCT-derived gray values. Therefore, findings concerning the completely edentulous and Kennedy Class IV subgroups should be considered descriptive and exploratory rather than confirmatory.
In a secondary, unadjusted paired analysis of 371 patients, the mean CBCT-derived gray value of the right mandibular condyle (653.53 ± 159.13) was higher than that of the left condyle (419.10 ± 178.27) (unadjusted p < 0.001) (Table 3). This difference should not be interpreted as evidence of biological asymmetry, as potential technical and measurement-related factors cannot be excluded.
Table 3.
Comparison of mandibular condylar CBCT-derived gray values between the right and left sides.
To evaluate the independent associations between dentition status and mandibular condylar CBCT-derived gray values, separate multivariable linear regression analyses were performed for the right and left condyles. Maxillary and mandibular dentition status were entered as nominal categorical variables, with the fully dentate group serving as the reference category. The overall regression model for the right condyle was statistically significant (F (12, 358) = 7.818, p < 0.001), explaining 20.8% of the variance (R2 = 0.208; adjusted R2 = 0.181). After adjustment for age, sex, and mandibular dentition status, maxillary dentition status showed a nominal overall association with right condylar CBCT-derived gray values (p = 0.024), which should be interpreted as exploratory because no global correction for multiple testing was applied, whereas mandibular dentition status showed no significant overall association (p = 0.625).
Compared with fully dentate individuals, those with maxillary Kennedy Class III partial edentulism exhibited lower right condylar gray values (B = −51.19, 95% CI: −87.97 to −14.41; nominal p = 0.007). This individual coefficient comparison was not adjusted for multiple testing and should therefore be interpreted as exploratory. The overall regression model for the left condyle was also statistically significant (F(12, 358) = 3.937, p < 0.001; R2 = 0.117; adjusted R2 = 0.087). However, neither maxillary nor mandibular dentition status demonstrated a statistically significant overall association with left condylar gray values (p = 0.805 and p = 0.448, respectively). Sex remained significantly associated with gray values on both sides, whereas age showed a significant negative association only with right condylar gray values. The detailed regression coefficients and confidence intervals are presented in Table 4.
Table 4.
Multivariable linear regression analysis of factors associated with right and left mandibular condylar CBCT-derived gray values.
4. Discussion
The TMJ is a complex joint that plays a critical role in functions such as mastication, speech, and swallowing [11]. This joint is constantly subjected to mechanical stress through both muscular activity and occlusal forces. Tooth loss, particularly in the posterior region, may be associated with changes in the direction and magnitude of occlusal forces and with altered load distribution transmitted to the TMJ. This may be associated with morphological and biomechanical adaptations in the articular disc, condyle, and glenoid fossa. Prolonged edentulism may be associated with structural and trabecular changes within the joint [8,27].
Alterations in the structural characteristics of the mandibular condyle may be relevant to joint stability, adaptive remodeling, and degenerative changes. Therefore, assessment of the condylar structure in edentulous individuals may be clinically relevant for prosthetic planning, occlusal rehabilitation, and maintenance of TMJ health. The present study aimed to evaluate the association between different patterns of edentulism and mandibular condylar CBCT-derived gray values. In our study, CBCT-derived gray values of the mandibular condyle were significantly higher in female participants than in males on both sides (p < 0.001).
Consistent with our findings, Ghasemzadeh et al. reported that HU values in the posterior region of the mandibular condyle were significantly higher in females than in males by 189.9 units [28]. In contrast, Alkhader et al. reported that the mean HU values of the mandibular condyle were nearly equal in males (0.649) and females (0.621) [29].
Regarding right–left asymmetry, Waghmare et al. reported greater right condylar volume than left condylar volume across age groups and sexes [30], while Shetty et al. similarly identified volumetric asymmetry between the mandibular condyles [31]. Although these studies evaluated condylar volume rather than gray values, they indicate that side-related differences may occur in the mandibular condyle. However, these volumetric findings do not fully explain the magnitude of the right–left gray-value difference observed in the present study. The same anatomical placement criteria were applied to the right and left condyles, and measurement reproducibility was assessed through repeated evaluations. Although separate multivariable regression models were performed for the right and left condyles, no covariate-adjusted analysis specifically examining the paired right–left difference was conducted. Therefore, it remains uncertain whether the observed side-to-side difference would persist after adjustment for potential confounding factors.
The observed right–left condylar difference in the present study may not be attributable solely to potential biological asymmetry; it may also have been influenced by scanner-specific characteristics, technical factors related to the image acquisition protocol, minor variations in ROI placement, and measurement-related variability.
In the present study, CBCT-derived gray values of the mandibular condyle were evaluated according to edentulism status, whereas much of the previous literature has focused on condylar volume and morphometric characteristics. The present findings therefore provide additional quantitative imaging information regarding the relationship between edentulism and mandibular condylar CBCT-derived gray values. Sugisaki et al., using CT imaging, reported that in dentate jaws, the mandibular condyle consists of trabeculae arranged in regularly aligned plates, whereas in edentulous jaws, irregularly aligned and thin rod-shaped trabeculae predominate [32]. These findings suggest that the reduction in masticatory function due to tooth loss may negatively affect the internal structure of the mandibular condyle [32]. Giesen et al. reported that the trabecular bone structure of the mandibular condyle in edentulous individuals is less dense compared to dentate individuals, indicating that edentulism-related microstructural changes become evident in the condylar trabecular architecture [33]. Similarly, Coşgunarslan et al. reported that the mean fractal dimension (FD) values of edentulous individuals were significantly lower than those of the control group, demonstrating a reduction in trabecular complexity in the condylar region [34].
Previous imaging studies have reported differences in condylar bone density in relation to TMJ status and dentition. Eisazadeh et al., using CBCT, reported higher quantitative imaging values in the condylar head of patients with TMD, whereas patients with TMD and posterior tooth loss showed lower values than those without tooth loss [35]. Similarly, Aggarwal et al., using multidetector CT, reported significantly higher cortical and medullary condylar bone density, expressed in Hounsfield units, in dentate than in edentulous individuals [36]. These findings are broadly consistent with the lower CBCT-derived gray values observed in some edentulous groups in the present study. However, direct quantitative comparisons should be made cautiously because the imaging modalities and measurement scales differed, and the CBCT-derived gray values in the present study were not calibrated to Hounsfield units. However, the Kennedy classification primarily describes the anatomical distribution of edentulous areas and does not directly quantify the functional or biomechanical consequences of tooth loss. Therefore, differences among Kennedy classes should not be interpreted as direct indicators of specific loading patterns. In the present study, occlusal force, masticatory function, and temporomandibular joint loading were not directly measured. Accordingly, any proposed relationship between dentition pattern, altered functional loading, and condylar CBCT-derived gray values should be regarded as a possible explanatory mechanism rather than a directly demonstrated causal pathway.
Joo et al [37], using panoramic radiography, evaluated gonial angle, ramus height, condylar height, and cortical bone thickness in elderly dentate and completely edentulous individuals. They reported greater condylar height on both sides and greater left cortical bone thickness in dentate individuals, whereas the gonial angle was greater in edentulous individuals. These morphometric findings are not directly comparable with the CBCT-derived gray values evaluated in the present study; however, they indicate that edentulism may be associated with mandibular morphological changes. In the present study, CBCT-derived gray values tended to be lower in completely edentulous individuals than in fully dentate individuals.
Overall, the present findings suggested a potential association between maxillary dentition status and right mandibular condylar CBCT-derived gray values, although this relationship was not consistently observed across both condyles or dentition classifications. The unadjusted one-way ANOVA revealed an overall difference in right condylar gray values across maxillary dentition categories (p = 0.001). Following adjustment for age, sex, and mandibular dentition status using multivariable linear regression with nominal categorical coding, a nominal overall association was observed (p = 0.024). However, because no global correction for multiple testing across study outcomes was applied, this association should be interpreted as exploratory rather than confirmatory. In the unadjusted analysis, the Bonferroni-adjusted pairwise comparison indicated a difference between fully dentate individuals and those with maxillary Kennedy Class III partial edentulism (p = 0.037). In the multivariable model, the corresponding coefficient also showed a nominal association (B = −51.19, 95% CI: −87.97 to −14.41; p = 0.007); however, this individual coefficient test was not adjusted for multiple comparisons and should therefore be interpreted cautiously. Although lower mean gray values were descriptively observed in some completely edentulous groups, the small subgroup sizes and imprecise estimates do not support a confirmed association between complete edentulism and reduced condylar gray values. Furthermore, no consistent adjusted association was identified for mandibular dentition status or for the left condyle. Given the retrospective and cross-sectional design and the absence of a global multiplicity correction, these findings should be regarded as exploratory associations rather than evidence of causality or direct changes in bone mineral density.
The lack of a consistent association across dentition classifications may reflect the multifactorial nature of condylar remodeling. Potential explanations include differences in the duration of edentulism, age, prosthetic rehabilitation status, individual masticatory loading patterns, temporomandibular disorder status, and biological variability among participants. In addition, the relatively small and uneven subgroup sizes, together with possible measurement-related variability in CBCT-derived gray values, may have contributed to the inconsistent findings. Therefore, the absence of a uniform pattern across Kennedy classes should be interpreted cautiously and may reflect both biological heterogeneity and methodological limitations.
In the present study, CBCT-derived gray values were used as device- and protocol-specific quantitative imaging measurements rather than absolute Hounsfield units. Although CBCT provides high spatial resolution and three-dimensional evaluation of osseous structures, gray values may be influenced by scanner- and acquisition-related factors [21,22]. Therefore, the observed voxel-intensity differences should not be interpreted as direct measurements of bone mineral density. Future studies incorporating phantom calibration, validation against conventional CT, and complementary densitometric, fractal, or morphometric analyses may provide a more comprehensive evaluation of edentulism-related condylar changes.
From a clinical perspective, the present findings raise the possibility that dentition-related variations in mandibular condylar CBCT-derived gray values may have relevance for future prosthetic and radiologic research. However, the present study did not evaluate prosthetic treatment outcomes, implant outcomes, temporomandibular joint symptoms, longitudinal condylar changes, treatment-planning decisions, or patient-reported outcomes. Therefore, no direct clinical utility can be inferred from these findings. Further longitudinal and clinically integrated studies are needed to determine whether assessment of condylar trabecular imaging characteristics may provide useful complementary information in prosthetic treatment planning or temporomandibular joint evaluation.
5. Conclusions
The findings suggest that mandibular condylar CBCT-derived gray values may differ according to dentition status, with generally lower values descriptively observed in completely edentulous groups. However, these differences were not statistically confirmed for the completely edentulous groups and were not consistent across all Kennedy classifications. After adjustment for age, sex, and mandibular dentition status, a nominal overall association was observed between maxillary dentition status and right condylar CBCT-derived gray values (p = 0.024). However, this association was not subjected to a global correction for multiple testing and should therefore be considered exploratory rather than confirmatory. Accordingly, the null hypothesis was not rejected for most comparisons, and the findings do not provide definitive evidence of an association between tooth loss patterns and condylar gray values. Given the retrospective design, unequal subgroup sizes, potential confounding factors, and the absence of phantom calibration or validation against conventional CT, the observed gray-value differences should not be interpreted as direct evidence of changes in bone mineral density. Further standardized, longitudinal studies incorporating calibrated imaging and adjustment for relevant clinical confounders are warranted.
6. Limitations
Due to the retrospective and cross-sectional design of the study, potentially relevant confounding factors, including age, duration of edentulism, masticatory habits, and other factors influencing bone metabolism, could not be fully controlled, and the observed associations cannot establish causality. The possibility of residual confounding, particularly by age, should therefore be considered when interpreting the findings. Clinical TMD status was not systematically available in the retrospective records and therefore could not be included as a covariate. Consequently, the possible influence of clinically present TMD without evident radiographic changes cannot be excluded. A separate intraobserver reliability analysis was not available because the primary measurements were performed jointly by consensus, while the repeated assessment was designed to evaluate interobserver reproducibility. In addition, subgroup sizes were uneven, with relatively small numbers of completely edentulous and Kennedy Class IV cases. The relatively wide confidence intervals observed in these subgroups indicate limited precision, and comparisons based solely on subgroup mean values should be interpreted cautiously. Moreover, the original sample-size calculation was based on a simplified two-group assumption and was not specifically designed to ensure adequate statistical power for comparisons among the individual Kennedy classes, particularly the smallest subgroups. Homogeneity of variance was not formally evaluated using a dedicated test such as Levene’s test, and robust alternatives such as Welch’s ANOVA were not applied; therefore, the potential influence of unequal variances, particularly in small and unbalanced subgroups, should be considered. Multiple statistical comparisons were also performed across several dentition groups and outcome measures. Although Bonferroni-adjusted post hoc comparisons were performed following ANOVA, no additional global correction for multiple testing across study outcomes and regression analyses was applied. Therefore, findings based on uncorrected p-values should be interpreted as nominal and exploratory, considering the potential risk of type I error.
Moreover, because the maxillary and mandibular arches were classified separately, the same patient could contribute to different dentition categories across the two arches, and the potential within-patient correlation arising from discordant maxillary and mandibular dentition patterns was not explicitly modeled. Finally, the CBCT-derived gray values were obtained from a single CBCT system and acquisition protocol without phantom-based calibration or validation against conventional CT. Therefore, these measurements should not be interpreted as absolute Hounsfield units or direct measurements of bone mineral density, and their numerical values may not be directly generalizable to other CBCT systems or acquisition protocols. Future studies using standardized calibration procedures, multiple CBCT systems, and conventional CT validation are warranted.
Author Contributions
Protocol/project development: Y.K. and S.K. Data collection and management: S.K., H.Ç. and M.E.D. Data analysis: H.Ç., Y.K. and M.E.D. Manuscript writing/editing: Y.K., H.Ç., S.K. and M.U. All authors have read and agreed to the published version of the manuscript.
Funding
This research received no external funding.
Institutional Review Board Statement
The study was conducted in accordance with the Declaration of Helsinki and approved by the Harran University Clinical Research Ethics Committee (protocol code HRU/25.15.16; date of approval: 15 September 2025).
Informed Consent Statement
Informed consent for participation is waived by the Harran University Clinical Research Ethics Committee due to the retrospective nature of this study.
Data Availability Statement
The data supporting the findings of this study are available from the corresponding author upon reasonable request. The data are not publicly available due to ethical and privacy considerations related to patient imaging data.
Acknowledgments
During the preparation of this manuscript, the authors used ChatGPT (ChatGPT (GPT-6; OpenAI, San Francisco, CA, USA)) for the purposes of language editing and improving the clarity and readability of the text. The authors reviewed and edited all AI-assisted output and take full responsibility for the content of this publication.
Conflicts of Interest
The authors declare no conflicts of interest.
Abbreviations
The following abbreviations are used in this manuscript:
| CBCT | Cone-beam computed tomography |
| HU | Hounsfield units |
| TMJ | Temporomandibular joint |
| BMD | Bone mineral density |
| DEXA | Dual-energy X-ray absorptiometry |
| QCT | Quantitative computed tomography |
| CT | Computed tomography |
References
- Kaurani, P.; Kakodkar, P.; Bhowmick, A.; Samra, R.K.; Bansal, V. Association of tooth loss and nutritional status in adults: An overview of systematic reviews. BMC Oral Health 2024, 24, 838. [Google Scholar] [CrossRef] [Scilit] [PubMed]
- Al-Angari, N.; Algarni, S.; Andijani, A.; Alqahtani, A. Various classes of removable partial dentures: A study of prevalence among patients attending a dental and educational institute in Riyadh, Saudi Arabia. Saudi Dent. J. 2021, 33, 656–660. [Google Scholar] [CrossRef] [Scilit] [PubMed]
- Hassan, N.A.; Abdelmongi, A.; Magdi, S.; Shaltout, M.; Aboelhasan, Y.; Elhariry, Y.; Mohamed, E.H. A novel artificial intelligence approach to Kennedy classification for partially edentulous patients using panoramic radiographs. Eur. J. Prosthodont. Restor. Dent. 2025, 33, 155–163. [Google Scholar] [CrossRef] [Scilit] [PubMed]
- Zheng, H.; Shi, L.; Lu, H.; Liu, Z.; Yu, M.; Wang, Y.; Wang, H. Influence of edentulism on the structure and function of temporomandibular joint. Heliyon 2023, 9, e20307. [Google Scholar] [CrossRef] [Scilit] [PubMed]
- De Stefano, M.; Ruggiero, A. A critical review of human jaw biomechanical modeling. Appl. Sci. 2024, 14, 3813. [Google Scholar] [CrossRef] [Scilit]
- Pascu, L.; Haiduc, R.-S.; Almășan, O.; Leucuța, D.-C. Occlusion and temporomandibular disorders: A scoping review. Medicina 2025, 61, 791. [Google Scholar] [CrossRef] [Scilit] [PubMed]
- Mishra, M.T.; Gupta, S.; Gupta, S.; Mathur, M.; Jindal, A.; Kumawat, M.K. TMDs associated with posterior edentulism. J. Pharm. Bioallied Sci. 2025, 17, S1523–S1525. [Google Scholar] [CrossRef] [Scilit] [PubMed]
- Khanal, P. Study of mandibular condyle morphology using orthopantomogram. JNDA 2020, 20, 3–7. [Google Scholar]
- Singh, B.; Kumar, N.R.; Balan, A.; Nishan, M.; Haris, P.S.; Jinisha, M.; Denny, C.D. Evaluation of normal morphology of mandibular condyle: A radiographic survey. J. Clin. Imaging Sci. 2020, 10, 51. [Google Scholar] [CrossRef] [Scilit] [PubMed]
- Shaikh, A.H.; Ahmed, S.; Ahmed, A.R.; Das, G.; Taqi, M.; Nisar, S.; Khan, O. Assessment of radiographic morphology of mandibular condyles: A radiographic study. Folia Morphol. 2022, 81, 481–486. [Google Scholar] [CrossRef] [Scilit] [PubMed]
- Nithin; Ahmed, J.; Sujir, N.; Shenoy, N.; Binnal, A.; Ongole, R. Morphological assessment of TMJ spaces, mandibular condyle, and glenoid fossa using cone beam computed tomography (CBCT): A retrospective analysis. Indian J. Radiol. Imaging 2021, 31, 78–85. [Google Scholar] [CrossRef] [Scilit] [PubMed]
- Asadipooya, K.; Greene, L.W. Bone mineral density assessment by DXA in disease-associated osteoporosis: The limitations. Front. Endocrinol. 2026, 17, 1768509. [Google Scholar] [CrossRef] [Scilit] [PubMed]
- Amstrup, A.K.; Jakobsen, N.F.B.; Moser, E.; Sikjaer, T.; Mosekilde, L.; Rejnmark, L. Association between bone indices assessed by DXA, HR-pQCT and QCT scans in post-menopausal women. J. Bone Miner. Metab. 2016, 34, 638–645. [Google Scholar] [CrossRef] [Scilit] [PubMed]
- Pinto, E.M.; Neves, J.R.; Teixeira, A.; Frada, R.; Atilano, P.; Oliveira, F.; Veigas, T.; Miranda, A. Efficacy of Hounsfield units measured by lumbar computed tomography on bone density assessment: A systematic review. Spine 2022, 47, 702–710. [Google Scholar] [CrossRef] [Scilit] [PubMed]
- Brooks, R.A. A quantitative theory of the Hounsfield unit and its application to dual energy scanning. J. Comput. Assist. Tomogr. 1977, 1, 487–493. [Google Scholar] [CrossRef] [Scilit] [PubMed]
- Jain, A.; Shil, M.; Sreepradha, C.; Rai, S.; Kaur, I.; Banka, A. A review on cone-beam computed tomography and its application in dentistry. J. Pharm. Bioallied Sci. 2024, 16, S38–S40. [Google Scholar] [CrossRef] [Scilit] [PubMed]
- Kaaber, L.; Matzen, L.H.; Schropp, L.; Spin-Neto, R. Low-dose CBCT protocols in implant dentistry: A systematic review. Oral Surg. Oral Med. Oral Pathol. Oral Radiol. 2024, 138, 427–439. [Google Scholar] [CrossRef] [Scilit] [PubMed]
- Jain, S.; Choudhary, K.; Nagi, R.; Shukla, S.; Kaur, N.; Grover, D. New evolution of cone-beam computed tomography in dentistry: Combining digital technologies. Imaging Sci. Dent. 2019, 49, 179–190. [Google Scholar] [CrossRef] [Scilit] [PubMed]
- Yavuz, Y.; Akleyin, E.; Akkuş, Z.; Doğan, M.E. Can the loss of mineralized tissues of the teeth caused by caries be quantitatively measured by CBCT? HRU Int. J. Dent. Oral Res. 2022, 2, 82–85. [Google Scholar]
- Hu, Y.; Xu, S.; Li, B.; Inscoe, C.R.; Tyndall, D.A.; Lee, Y.Z.; Lu, J.; Zhou, O. Improving the accuracy of bone mineral density using a multisource CBCT. Sci. Rep. 2024, 14, 3887. [Google Scholar] [CrossRef] [Scilit] [PubMed]
- Pauwels, R.; Jacobs, R.; Singer, S.R.; Mupparapu, M. CBCT-based bone quality assessment: Are Hounsfield units applicable? Dentomaxillofac. Radiol. 2015, 44, 20140238. [Google Scholar] [CrossRef] [Scilit] [PubMed]
- Yadegari, A.; Safi, Y.; Shahbazi, S.; Yaghoutiazar, S.; Ghazizadeh Ahsaie, M. Assessment of CBCT gray value in different regions-of-interest and fields-of-view compared to Hounsfield unit. Dentomaxillofac. Radiol. 2023, 52, 20230187. [Google Scholar] [CrossRef] [Scilit] [PubMed]
- Selvaraj, A.; Jain, R.K.; Nagi, R.; Balasubramaniam, A. Correlation between gray values of cone-beam computed tomograms and Hounsfield units of computed tomograms: A systematic review and meta-analysis. Imaging Sci. Dent. 2022, 52, 133–140. [Google Scholar] [CrossRef] [Scilit] [PubMed]
- Cassetta, M.; Stefanelli, L.V.; Pacifici, A.; Pacifici, L.; Barbato, E. How accurate is CBCT in measuring bone density? A comparative CBCT-CT in vitro study. Clin. Implant Dent. Relat. Res. 2014, 16, 471–478. [Google Scholar] [CrossRef] [Scilit] [PubMed]
- Li, J.; Bao, Q.; Chen, S.; Liu, H.; Feng, J.; Qin, H.; Li, A.; Liu, D.; Shen, Y.; Zhao, Y.; et al. Different bone remodeling levels of trabecular and cortical bone in response to changes in Wnt/β-catenin signaling in mice. J. Orthop. Res. 2017, 35, 812–819. [Google Scholar] [CrossRef] [Scilit] [PubMed]
- Barak, M.M. Cortical and trabecular bone modeling and implications for bone functional adaptation in the mammalian tibia. Bioengineering 2024, 11, 514. [Google Scholar] [CrossRef] [Scilit] [PubMed]
- Rawat, P.; Saxena, D.; Srivastava, P.A.; Sharma, A.; Swarnakar, A.; Sharma, A. Prevalence and severity of temporomandibular joint disorder in partially versus completely edentulous patients: A systematic review. J. Indian Prosthodont. Soc. 2023, 23, 218–225. [Google Scholar] [CrossRef] [Scilit] [PubMed]
- Ghasemzadeh, F.; Mortazavi, N.; Mallahi, M.; Gharib, M.H.; Behnampour, N.; Badeleh, M.T.; Asgari, N. Association between psychological stress and mandibular condyle structure: An analytical cross-sectional study. BMC Musculoskelet. Disord. 2024, 25, 563. [Google Scholar] [CrossRef] [Scilit] [PubMed]
- Alkhader, M.; Aldawoodyeh, A.; Abdo, N. Usefulness of measuring bone density of mandibular condyle in patients at risk of osteoporosis: A cone beam computed tomography study. Eur. J. Dent. 2018, 12, 363–368. [Google Scholar] [CrossRef] [Scilit] [PubMed][Green Version]
- Waghmare, M.; Pagare, S.; Manoj, R.; Pinto, J.; Bhutani, H.; Shetty, N.K. Volumetric analysis of mandibular condyle in a subset of the Indian population using CBCT—A retrospective observational study. J. Indian Acad. Oral Med. Radiol. 2023, 35, 363–367. [Google Scholar] [CrossRef] [Scilit] [PubMed]
- Shetty, S.R.; Al-Bayatti, S.; AlKawas, S.; Talaat, W.; Narasimhan, S.; Gaballah, K.; Al-Rawi, N.; Alsaegh, M.; Madiyal, A.; Balan, P.; et al. Analysis of the volumetric asymmetry of the mandibular condyles using CBCT. Int. Dent. J. 2022, 72, 797–804. [Google Scholar] [CrossRef] [Scilit] [PubMed]
- Sugisaki, M.; Agematsu, H.; Matsunaga, S.; Saka, H.; Sakiyama, K.; Ide, Y. Three-dimensional analysis of the internal structure of the mandibular condyle in dentulous and edentulous jaws using micro-CT. Cranio 2009, 27, 78–87. [Google Scholar] [CrossRef] [Scilit] [PubMed]
- Giesen, E.B.W.; Ding, M.; Dalstra, M.; van Eijden, T.M.G.J. Reduced mechanical load decreases the density, stiffness, and strength of cancellous bone of the mandibular condyle. Clin. Biomech. 2003, 18, 358–363. [Google Scholar] [CrossRef] [Scilit] [PubMed]
- Coşgunarslan, A.; Soydan Çabuk, D.; Canger, E.M. Effect of total edentulism on the internal bone structure of mandibular condyle: A preliminary study. Oral Radiol. 2021, 37, 268–275. [Google Scholar] [CrossRef] [Scilit] [PubMed]
- Eisazadeh, M.; Khojastepour, L.; Haghnegahdar, A.; Soltani, P. Comparison of condylar bone density in cone-beam computed tomographic images of patients with and without temporomandibular joint disorders. J. Orofac. Sci. 2021, 13, 3–7. [Google Scholar] [CrossRef] [Scilit] [PubMed]
- Aggarwal, H.; Singh, R.D.; Kumar, M.; Singh, R.; Siddhartha, R.; Jurel, S.K.; Agrawal, K.K.; Kumar, P. Three-dimensional quantitative analysis of the bone density of mandibular condyle in dentulous and edentulous jaws: An in vivo study. J. Clin. Densitom. 2015, 18, 50–53. [Google Scholar] [CrossRef] [Scilit] [PubMed]
- Joo, J.K.; Lim, Y.J.; Kwon, H.B.; Ahn, S.J. Panoramic radiographic evaluation of the mandibular morphological changes in elderly dentate and edentulous subjects. Acta Odontol. Scand. 2013, 71, 357–362. [Google Scholar] [CrossRef] [Scilit] [PubMed]

Disclaimer/Publisher’s Note: The statements, opinions and data contained in all publications are solely those of the individual author(s) and contributor(s) and not of MDPI and/or the editor(s). MDPI and/or the editor(s) disclaim responsibility for any injury to people or property resulting from any ideas, methods, instructions or products referred to in the content. |
© 2026 by the authors. Licensee MDPI, Basel, Switzerland. This article is an open access article distributed under the terms and conditions of the Creative Commons Attribution (CC BY) license.