


Abstract
Personalized itinerary planning for large-scale passengers under resource constraints is a critical challenge in enhancing the operational efficiency and service quality of cruise tourism. Traditional clustering methods, which primarily rely on geometric similarity, often fail to address the intricate coupling between passenger preferences and finite venue capacities, lacking predictive capability for the ultimate planning quality. To overcome these limitations, this study proposes a novel bio-inspired data-driven hybrid optimization framework for the cruise itinerary planning task unit partition. The framework innovatively integrates a Genetic Balanced Clustering Algorithm (GBCA) for multi-objective passenger grouping, Kernel Principal Component Analysis (KPCA) for feature extraction from preference data, an improved Adaptive Spiral Flying Sparrow Search Algorithm (ASFSSA) for hyperparameter optimization, and a Kernel Extreme Learning Machine (KELM) for data-driven prediction of itinerary planning quality. This synergy enables the framework to dynamically allocate venue capacities based on group preferences and optimize partitioning towards maximizing overall benefits, ensuring load balance and fairness. Extensive experiments on simulated cruise scenarios demonstrate that the proposed framework significantly outperforms conventional methods, improving segmentation quality by at least 40% while exhibiting superior convergence speed and stability. This work provides a scalable, intelligent solution for complex resource-constrained scheduling problems, showcasing the effective application of bio-inspired data-driven methodologies in engineering optimization.
1. Introduction
The cruise tourism industry has experienced rapid growth in recent years [1], driven by increasing demand for personalized travel experiences and the rise of smart tourism technologies, with annual passenger volumes exceeding 34.6 million in 2024 [2]. This rapid expansion has intensified competition among cruise operators, requiring innovative approaches to improve service quality and operational efficiency. In this context, cruise operators are under pressure to improve service quality and competitiveness by providing passengers with tailored itinerary planning [3]. However, the unique environmental constraints of cruise ships, including limited venue capacity, fixed hours of operation and service configurations, result in existing multi-passenger itinerary planning methodologies facing significant challenges when accommodating thousands of passengers simultaneously. For instance, when applied to a typical large cruise ship scenario with over 200 passengers and 20+ service venues, traditional itinerary optimization algorithms may require hours of computation time, failing to provide real-time or near-real-time solutions [4]. Moreover, they often produce plans where popular venues like the main dining room or theater are severely overcrowded, while others remain underutilized, leading to widespread passenger dissatisfaction and operational bottlenecks. This renders them impractical for real-world operations [5].
To address this issue, a promising approach involves grouping passengers with similar preferences and then generating optimized itineraries for each group. This strategy reduces the problem scale by partitioning passengers into manageable task units before applying optimization algorithms, thereby mitigating the computational burden of large-scale itinerary planning. The effectiveness of this approach, however, hinges critically on the rationality of passenger grouping, which must account for multiple interrelated factors: heterogeneous passenger preferences, finite venue capacities, and individual time budgets.
Research on itinerary optimization has evolved from single-passenger planning using meta-heuristic techniques such as GRASP (Greedy Randomized Adaptive Search Procedure) [6] and evolutionary algorithms [7] to group-oriented methods incorporating environmental constraints [8] and capacity limitations [4]. Despite these advances, existing group itinerary optimization methods remain computationally prohibitive for large-scale cruise scenarios [4,8,9]. This computational bottleneck underscores the necessity of effective passenger grouping prior to itinerary generation—a task that is itself non-trivial due to its inherently complex nature. The task unit partition problem in cruise itinerary planning is characterized by multiple conflicting objectives (maximizing itinerary benefit, balancing group sizes, and ensuring benefit equity), nonlinear relationships between passenger preferences and venue capacity constraints, and an exponentially growing solution space as passenger numbers increase. A key challenge—and a central innovation of this work—is the need to incorporate a predictive model of itinerary planning quality directly into the partitioning objective. This means that the quality of a given passenger grouping must be evaluated not by a simple geometric metric (such as distance or similarity), but by a data-driven prediction of the itinerary benefits that group would ultimately achieve.
Clustering algorithms serve as fundamental tools for identifying passenger cohorts with homogeneous preferences. Among various paradigms, partition-based clustering [10] and density-based clustering [11] have demonstrated particular efficacy in user segmentation applications. The K-means algorithm, as a prominent representative of partition-based clustering [12], has been widely applied and subsequently improved through better initial centroid selection [13] and weighted distance metrics [14]. However, a critical challenge specific to cruise itinerary planning is the need to evaluate the quality of each task unit’s itinerary after partitioning. Conventional clustering algorithms rely on cluster validity indices—such as CH [15], DB [16], and Dunn [17] metrics—to determine optimal cluster numbers. Recent years have seen the development of improved validity metrics, including those based on morphological similarity distance [18], CSP for structured data [19], STR using inflection point detection [20], FCVI [21], and HCVI for visual tree learning [22]. Despite these advancements, all existing validity metrics share a fundamental limitation: they compute validity based on distance between passenger data vectors, failing to capture the specific requirements of task unit partition for cruise itinerary planning, such as predicted itinerary quality and balanced resource allocation.
Parallel to developments in clustering, significant advancements have been made in applying bio-inspired optimization algorithms to partitional clustering problems. Researchers have proposed hybrid frameworks combining Chicken Swarm Optimization with K-harmonic means [23], bat algorithm variants with neighborhood search mechanisms [24], multi-medoid ant colony optimization for automatic cluster number determination [25], black hole phenomenon-inspired algorithms [26], and firefly algorithm variants [27]. Hybrid approaches have further integrated genetic algorithms with artificial bee colony optimization [28], ABC combined with Extreme Learning Machines [29], magnetic force-based search [30], and gravitational neighborhood strategies [31]. Recent innovations address initialization challenges through cooperative evolution [24], greedy seed selection [32], and neighbor heuristic functions [33], while enhanced gray wolf optimization [34] and chemical reaction optimization [35] have achieved improvements in solution accuracy. However, despite demonstrating satisfactory performance in single-objective cluster formation (e.g., spatial proximity minimization), these heuristic clustering methods exhibit intrinsic limitations when applied to cruise itinerary planning. Their fitness functions do not incorporate itinerary planning quality prediction, and they lack mechanisms to balance the competing requirements of operational efficiency, passenger experience, and capacity constraints. Crucially, the absence of cruise-specific objective functions hinders concurrent optimization of passenger grouping and service resource partitioning, resulting in suboptimal solutions that fail to address the multi-objective nature of the problem.
Bio-inspired algorithms, when properly designed, offer a promising alternative to address these limitations. By emulating natural processes such as evolution, swarm behavior, and biological adaptation, they possess inherent capabilities for global search, population-based exploration, and most importantly, the ability to optimize toward arbitrary, non-differentiable objective functions. This makes them ideally suited to directly use a predictive model of itinerary quality as a fitness function, iteratively refining passenger groupings to maximize expected benefits, a task that traditional distance-based clustering methods cannot accomplish.
Consequently, a critical research gap emerges: existing clustering and itinerary planning methods lack an integrated framework capable of simultaneously addressing the tripartite challenge of (i) dynamically allocating constrained venue capacities based on group preferences, (ii) incorporating predictive assessment of itinerary quality into the partitioning objective, and (iii) achieving balanced multi-objective optimization that maximizes overall benefit, ensures load fairness, and maintains computational efficiency for large-scale, real-world cruise scenarios.
To bridge this gap, this study proposes a novel hybrid optimization framework—KPCA-ASFSSA-KELM-GBCA—for the cruise itinerary planning task unit partition. The framework seamlessly integrates four key components: a Genetic Balanced Clustering Algorithm (GBCA) for multi-objective passenger grouping guided by a composite fitness function; Kernel Principal Component Analysis (KPCA) for nonlinear feature extraction from preference data; an improved Adaptive Spiral Flying Sparrow Search Algorithm (ASFSSA) for hyperparameter optimization; and a Kernel Extreme Learning Machine (KELM) for data-driven prediction of itinerary planning quality. This integration enables the framework to dynamically allocate venue capacities based on group preferences and iteratively refine partitions toward maximizing overall benefits while ensuring load balance and fairness.
The contributions of this work are summarized as follows:
- Multi-Objective Task Unit Partition: Unlike traditional clustering methods that rely solely on geometric similarity, the proposed model incorporates three key objectives: ① maximize the average predicted benefit of passenger groups, ② balance the size of task units to ensure computational feasibility, and ③ minimize the difference in benefits between task units. This explicitly optimizes for operational efficiency and fairness, rather than just data compactness.
- Feature Extraction and Hybrid Optimization Prediction Framework: KPCA is applied to extract principal components from passenger preference data. An ASFSSA-KELM model is introduced to predict the itinerary planning quality. In contrast to standard machine learning models (e.g., SVM, BP) that use default or empirically set parameters, ASFSSA intelligently optimizes the kernel parameters and regularization coefficients of KELM. This combination improves the accuracy and robustness of prediction.
- Dynamic Venue Capacity Partitioning: A novel capacity partitioning mechanism is proposed. This differs from conventional approaches that treat venue capacity as a static, hard constraint for each group. Instead, our mechanism dynamically allocates capacity based on the collective preferences of each passenger group, ensuring that high-demand venues receive the appropriate resources while avoiding the problem of overcapacity.
- Comprehensive Experimental Validation: The proposed model is evaluated on a synthetic dataset simulating a real cruise ship scenario. Comparative experiments demonstrate that the model outperforms traditional clustering and optimization algorithms in terms of convergence speed, stability and overall planning quality.
This research is systematically organized into four sections to present a coherent structure. Section 1 introduces the research background, reviews the relevant literature to establish the research gap, and articulates the motivation and contributions of the proposed framework. The proposed hybrid optimization framework is introduced in Section 2, detailing its conceptual foundation and key components. Section 3 presents the experimental methodology and analyzes the obtained results. Finally, Section 4 concludes the study by summarizing the principal findings and suggesting potential directions for future investigations.
2. Materials and Methods
The fundamental challenge in cruise itinerary planning lies in resolving the inherent conflict between passengers’ heterogeneous demands and constrained service resources. While conventional clustering methods can group passengers by preference similarity, they fail to address three critical operational requirements: (1) dynamic capacity constraints, (2) predictive quality assessment of itinerary plans, and (3) multi-objective balanced optimization under real-world business conditions.
To overcome these limitations, we propose a hybrid optimization framework with three synergistic components:
- Predictive Modeling Phase
A task unit quality prediction model is developed through multi-source data fusion and feature extraction, translating multidimensional parameters (passenger preferences, venue capacities, and time budgets) into quantifiable planning benefit metrics.
- Dynamic Resource Allocation Mechanism
An adaptive global optimization module dynamically regulates task unit sizes and capacity distribution, preventing local resource overload while maintaining efficient service allocation across high-demand periods.
- Multi-Objective Evaluation System
The framework integrates three optimization criteria: maximization of average predicted benefit, balanced task unit scale distribution and minimization of inter-unit benefit disparity. This tripartite evaluation guides the algorithm toward globally optimal solutions that balance passenger satisfaction, computational efficiency, and equitable resource distribution.
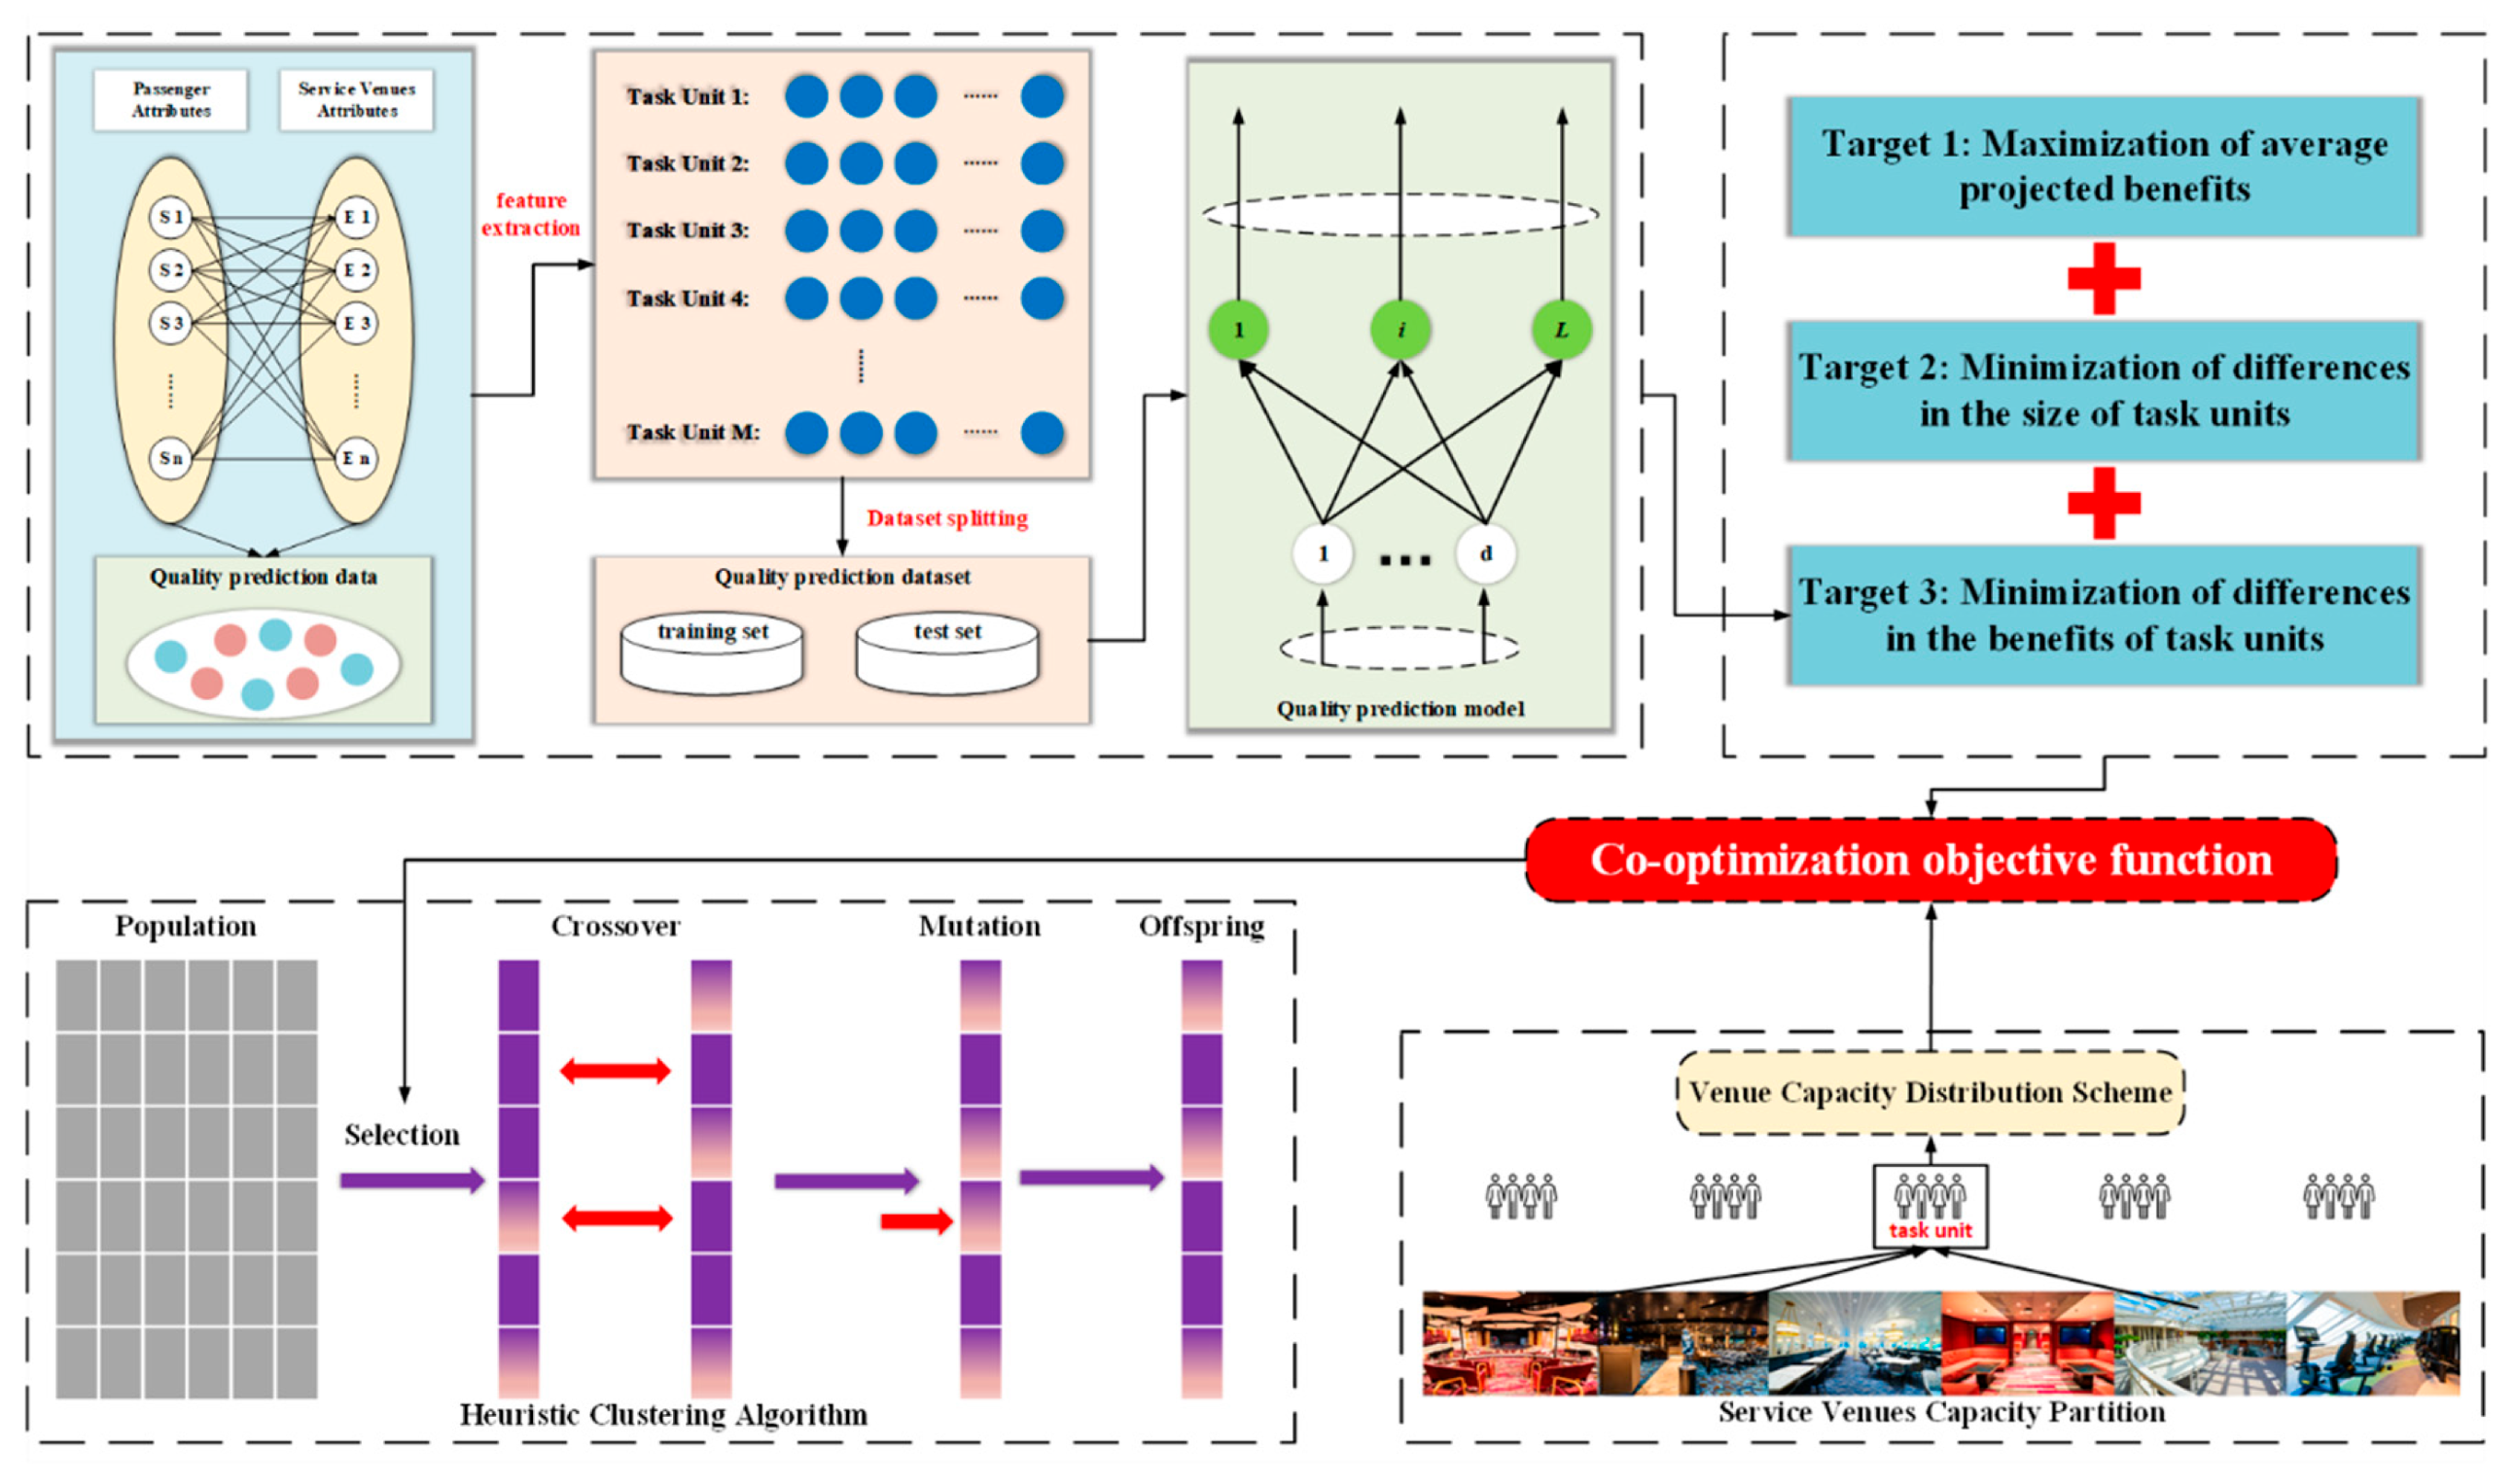
As illustrated in Figure 1, the proposed framework consists of three main modules working in synergy to generate balanced and high-benefit task unit partitions. The first module is a predictive modeling component based on KPCA-ASFSSA-KELM, which extracts key features from passenger preference data and predicts the expected itinerary quality for potential passenger groupings. The second module is a dynamic capacity allocation mechanism that adjusts venue capacity distribution in real-time based on group preferences and predicted demand, preventing local resource overload while maintaining service efficiency. The third module is a multi-objective evaluation system integrated into the Genetic Balanced Clustering Algorithm (GBCA), which simultaneously optimizes for average predicted benefit, balanced task unit scale distribution, and minimized inter-unit benefit disparity. These three components are interconnected in an iterative optimization pipeline: the predictive model informs the capacity allocation, which in turn guides the GBCA’s partitioning decisions, and the resulting partitions are fed back to refine the predictive model. This integrated architecture enables the framework to address the complex, multi-objective nature of cruise itinerary planning.
Figure 1.
Architecture of the proposed hybrid optimization framework, illustrating the three core modules (predictive modeling, dynamic capacity allocation, and multi-objective evaluation) and their interconnections within the iterative optimization pipeline.
2.1. Venue Capacity Partition Based on Preference Data
Unlike the application scenario of conventional clustering methods, when constructing a cruise itinerary planning task unit, in addition to the partition of passengers, the capacity of cruise service venues needs to be split into individual task units to maximize the quality of itineraries ultimately obtained by all task units. Since passengers have different preferences for service venues, assigning higher capacity to service venues with higher preferences tends to yield more itinerary benefits for a task unit. Therefore, the capacity of the service venue for each task unit is determined by the average degree of preference for each service venue among all passengers in the task unit. The formula for calculating the service venue capacity for each task unit is as follows:
Unlike conventional clustering methods that partition only passengers, our framework also splits the capacity of each service venue among task units according to the collective preferences of the passengers within each unit. This ensures that high-demand venues receive proportionally more capacity, maximizing the potential itinerary benefit for each group.
Let denote the preference value of passenger for service venue . For a task unit containing passengers, the average preference for venue is
The initial capacity of venue allocated to unit is then computed as
where is the total capacity of venue , and is the number of task units. Because of the ceiling operation, the total allocated capacity may exceed . A correction step is therefore applied: for each venue, task units are sorted by increasing preference, and one unit of capacity is deducted from the least preferred units until the total matches . The final allocated capacity is denoted as .
2.2. Feature Engineering for Quality Prediction
To predict the itinerary planning quality of a task unit, we construct an 8-dimensional feature vector that captures both passenger characteristics and venue attributes. These features are designed to reflect the unit’s potential for generating high-quality itineraries. Table 1 lists the features and their meanings.
Table 1.
Data items and meaning of quality prediction data.
Features 7 and 8 are computed as follows. The overlap between the time window of service venue and the time budget of passenger is
where are the start and end times of venue , and are the start and end of passenger ’s time budget. The average effective service window length for task unit is then
where is the number of venues. The service venue capacity matching ratio is calculated as
This ratio measures how well the allocated capacity matches the group’s preferences, with higher values indicating better alignment. The target output for prediction is the total itinerary benefit obtained by applying a multi-passenger itinerary planning algorithm [4] to the task unit.
2.3. Predictive Modeling via KPCA-ASFSSA-KELM
To accurately predict the itinerary benefit from the eight features, we employ a Kernel Extreme Learning Machine (KELM) whose hyperparameters are optimized by an improved Adaptive Spiral Flying Sparrow Search Algorithm (ASFSSA). Before prediction, Kernel Principal Component Analysis (KPCA) reduces feature dimensionality and extracts nonlinear components.
KPCA for Feature Extraction: KPCA addresses the nonlinear relationships in passenger preference data by mapping the original feature vectors into a high-dimensional feature space via a nonlinear transformation , then performing linear PCA in that space. Given samples, the kernel matrix with elements is computed using the radial basis function (RBF) kernel:
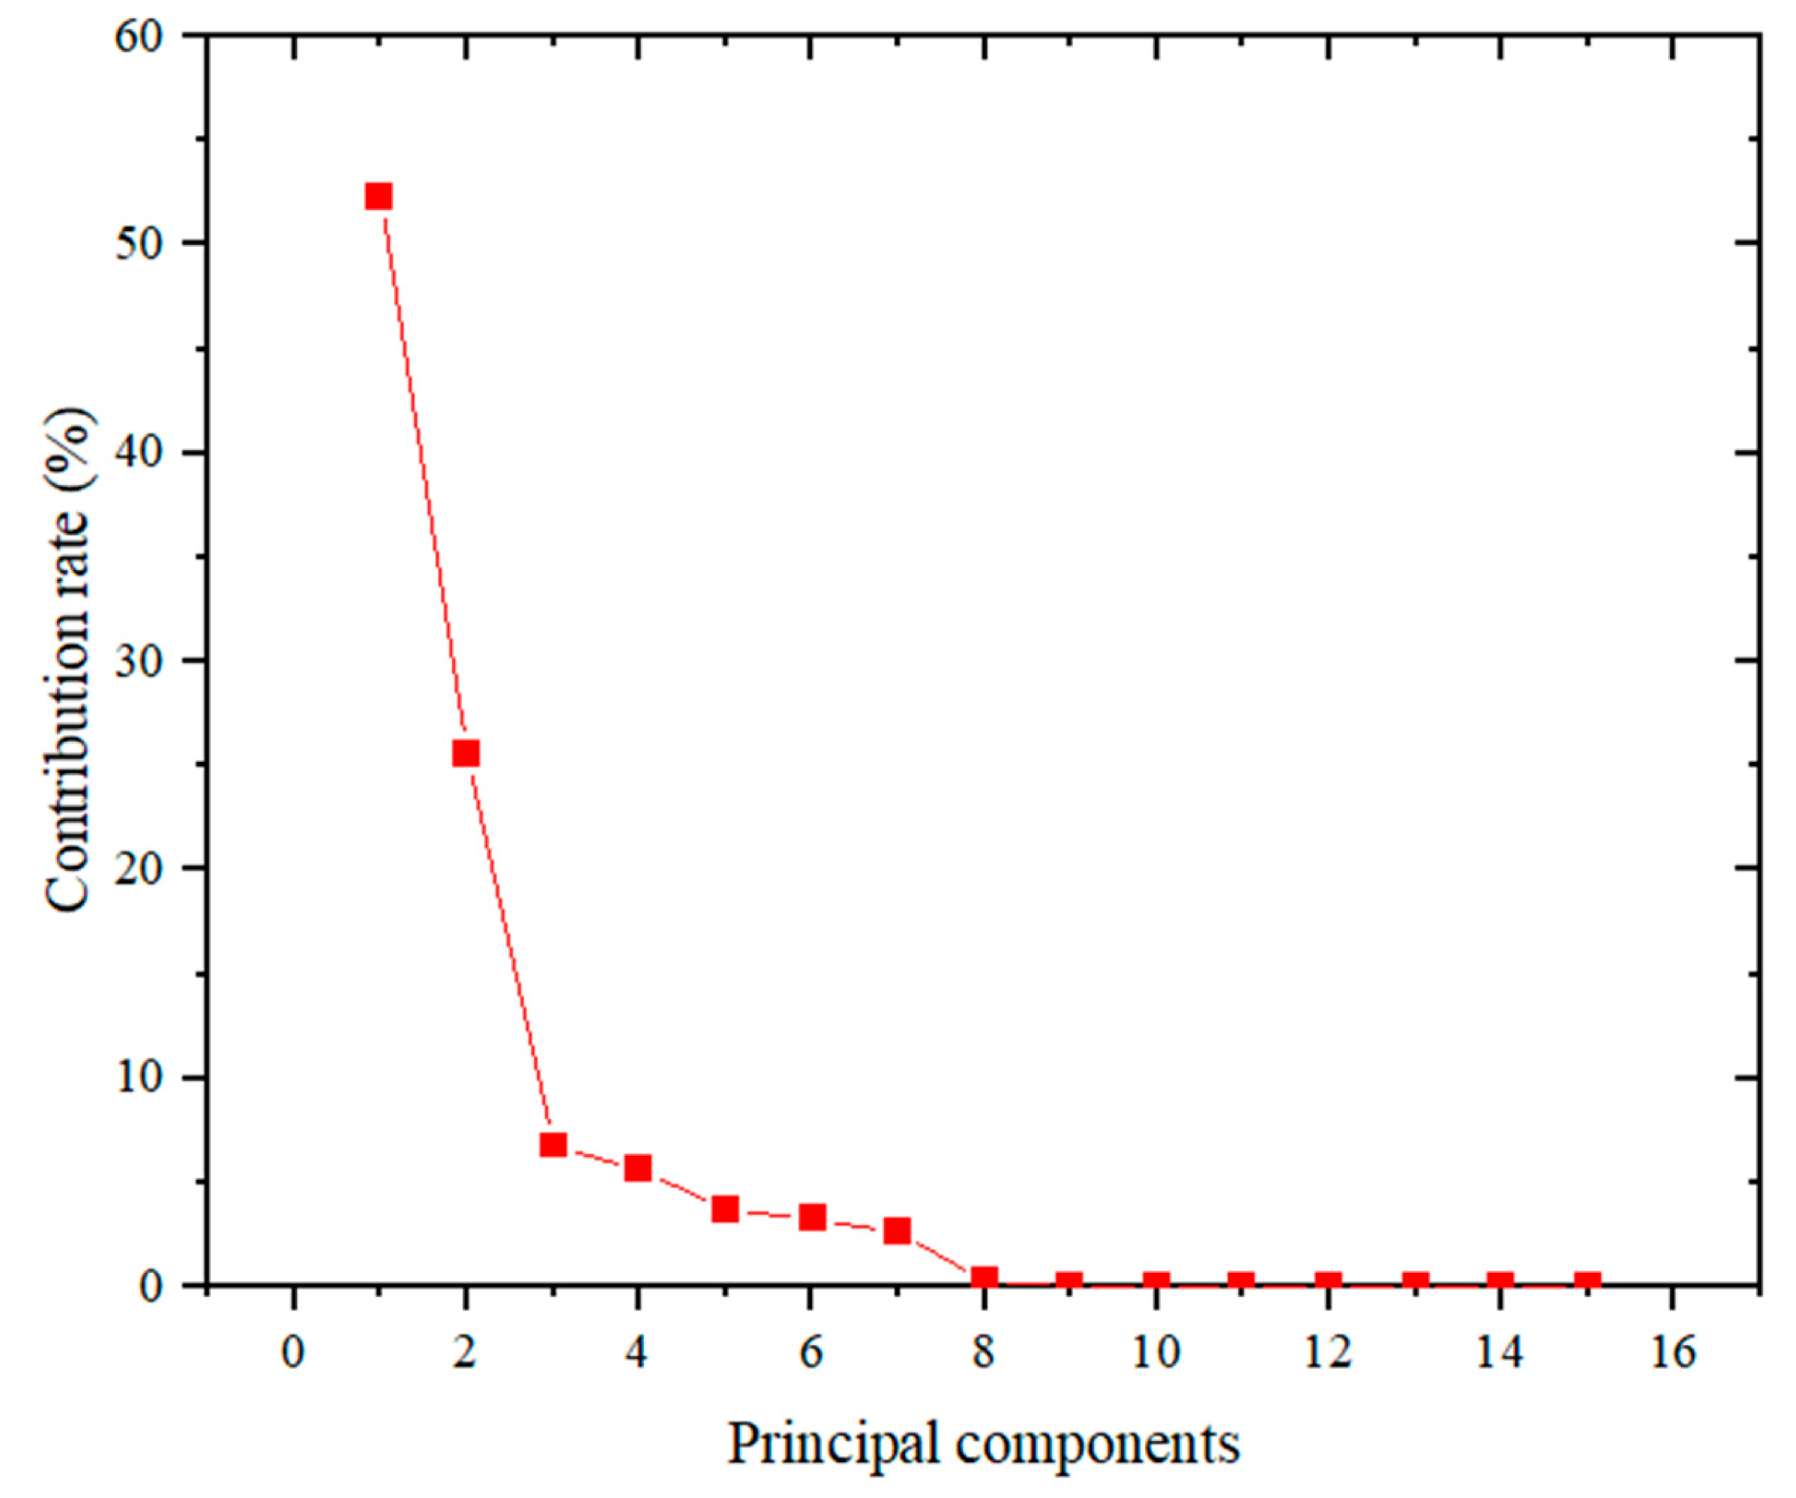
The kernel matrix is centered to obtain , where is an matrix with all entries . Eigenvalue decomposition is performed on , yielding eigenvalues and eigenvectors . The optimal number of retained features is determined based on the cumulative contribution rate, which is commonly set at 85% in dimensionality reduction tasks to balance information preservation and noise reduction [36]:
The original data are then projected onto the first eigenvectors to obtain the reduced-dimensionality feature set , which serves as input to the KELM predictor.
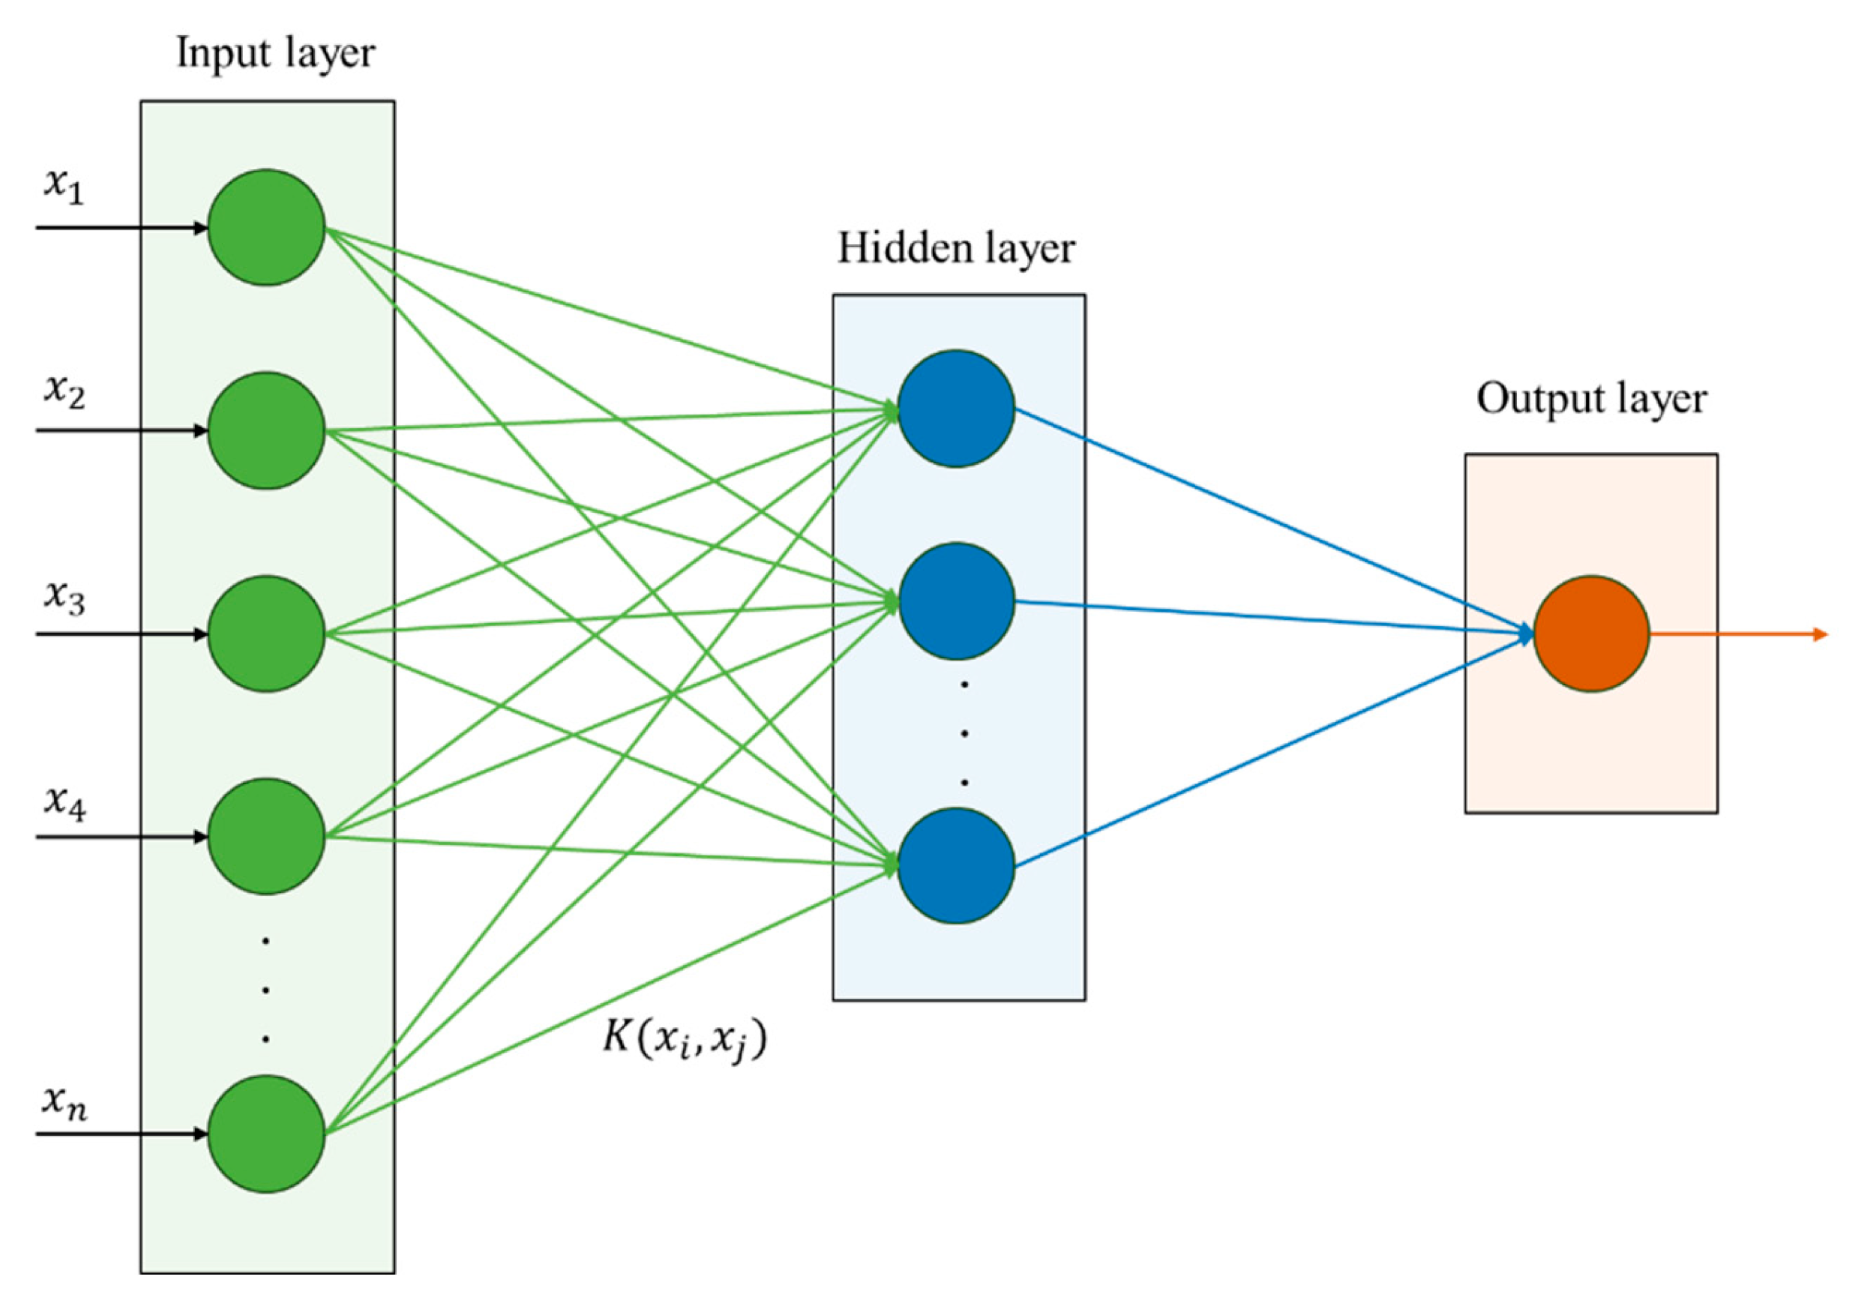
KELM for Regression: KELM improves upon the basic Extreme Learning Machine by replacing random hidden layer mappings with a kernel function, enhancing generalization and stability. The output function of KELM is:
where is the kernel matrix with entries , is the regularization parameter, is the identity matrix, and is the target output vector. The RBF kernel (Equation (6)) is used for its effectiveness in handling nonlinear relationships. The KELM’s performance critically depends on two hyperparameters: the regularization parameter , which controls the trade-off between training error and model complexity, and the kernel width , which determines the influence range of each support vector.
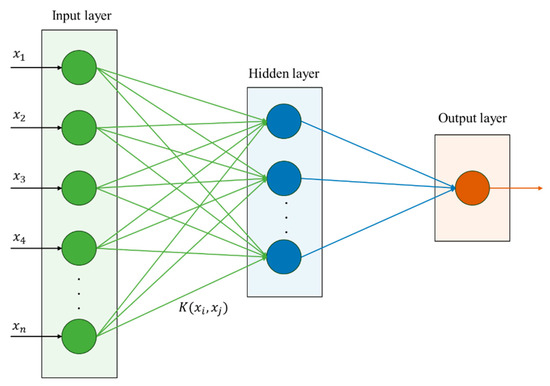
Figure 2 demonstrates that the KELM model employs the kernel trick, which obviates the requirement for prior knowledge regarding the number of hidden layer nodes, thus enhancing computational efficiency and model generalizability.
Figure 2.
Structure diagram of KELM.
ASFSSA for Hyperparameter Optimization: To optimize and , we employ an enhanced Adaptive Spiral Flying Sparrow Search Algorithm [37]. ASFSSA builds upon the basic Sparrow Search Algorithm by integrating four problem-specific enhancements:
- Tent chaotic mapping for population initialization, improving diversity and preventing premature convergence [38]. Its specific formula is as follows:
- Adaptive weighting that dynamically adjusts the search intensity based on iteration progress, balancing exploration and exploitation [31]. The formula for adaptive weights is as follows:
- Lévy flight mechanism enabling occasional long jumps to escape local optima [39]. The location update format for joining the Lévy flight strategy is as follows:
- Variable spiral search strategy, inspired by whale hunting behavior, to refine solutions in promising regions [40].
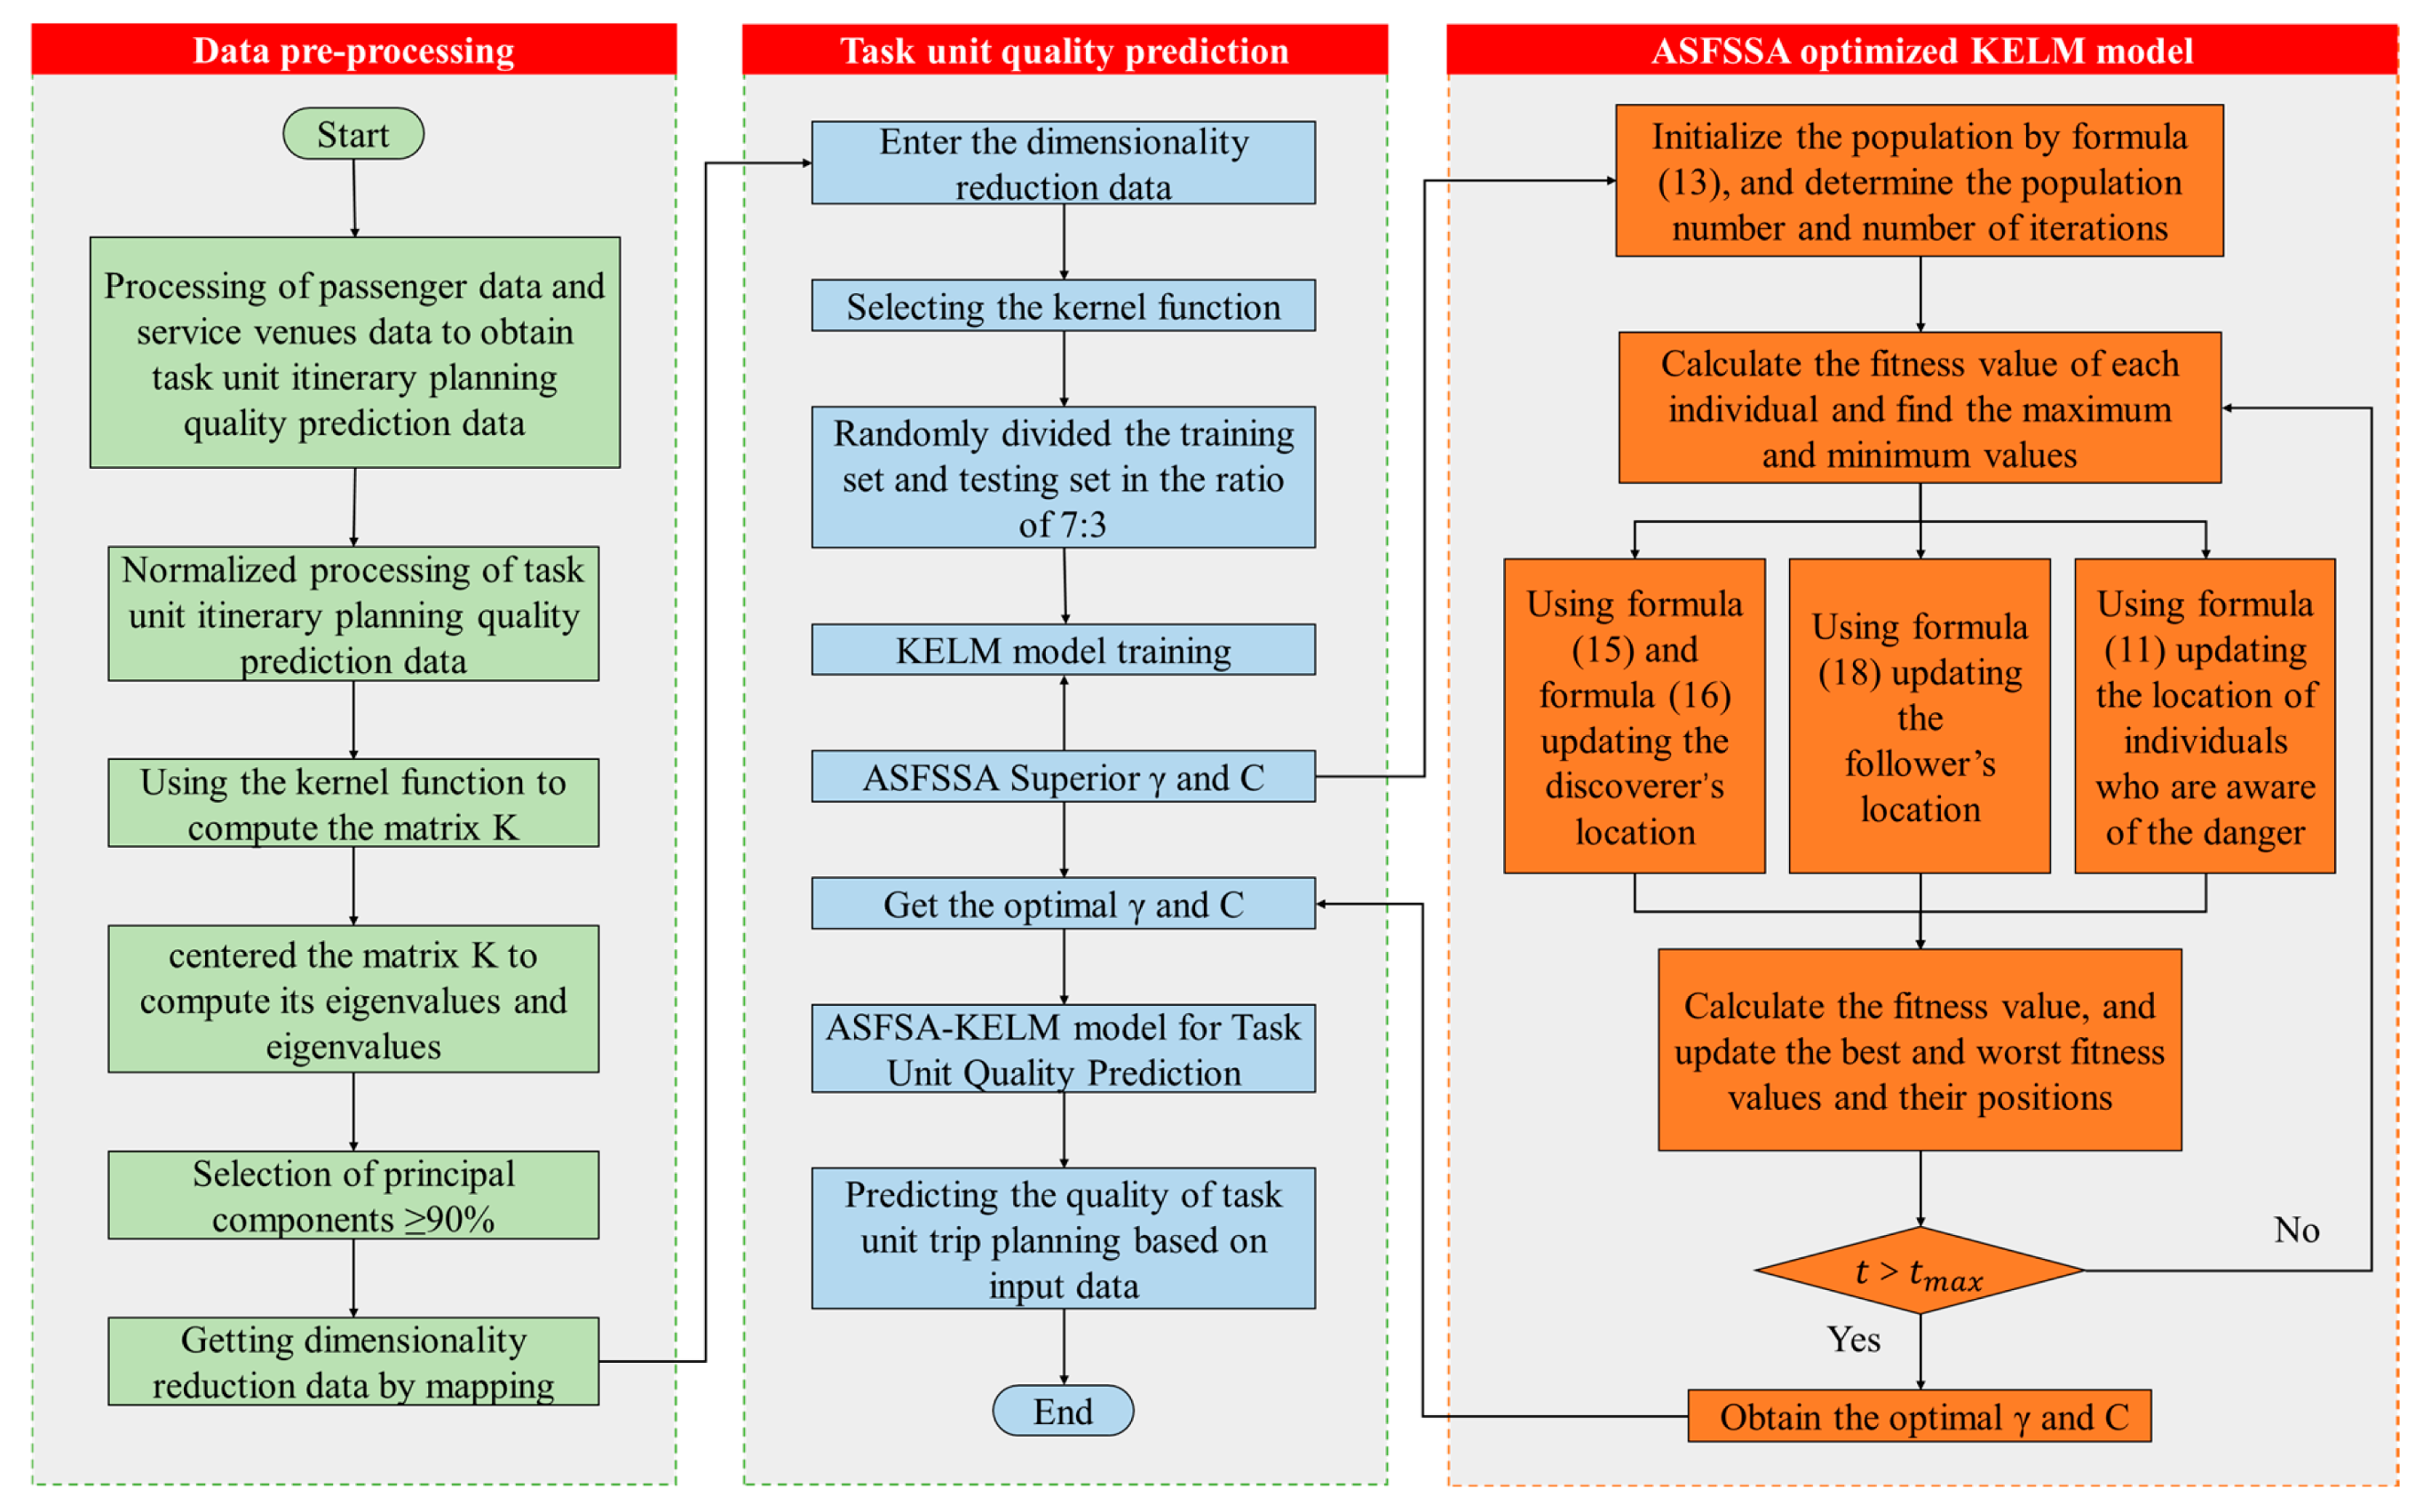
The ASFSSA optimizes by minimizing the Root Mean Square Error (RMSE) on a validation set. The population consists of discoverers (responsible for global exploration), followers (who follow discoverers to promising regions), and warners (who perform local searches when danger is detected). Each agent updates its position according to adaptive rules that incorporate the above mechanisms. After optimization, the best-found are used to train the final KELM on the full training set. The complete predictive modeling pipeline is illustrated in Figure 3.
Figure 3.
KPCA-ASFSA-KELM for task unit quality prediction.
2.4. Genetic Balanced Clustering Algorithm (GBCA)
GBCA is a genetic algorithm specifically designed for multi-objective task unit partition. Unlike conventional clustering methods that rely on distance-based similarity metrics, GBCA directly optimizes partition quality using a composite fitness function that incorporates predictive itinerary benefit.
Chromosome Representation and Initialization: Each chromosome encodes a candidate partition of passengers into task units. A population of chromosomes is randomly initialized, ensuring diversity in the initial partitions.
Fitness Evaluation: The fitness of each chromosome is evaluated based on three normalized objectives:
Average Predicted Benefit (): The mean predicted itinerary benefit across all task units, obtained from the trained KPCA-ASFSSA-KELM predictor:
where is the predicted benefit for task unit .
Size Relative Range (): The disparity in task unit sizes, normalized by the average size:
where is the size of task unit and is the mean unit size.
Benefit Relative Range (): The disparity in predicted benefits among units, normalized similarly:
Specifically, the fitness function is formally defined as a weighted sum:
where w1, w2, and w3 are the non-negative weights of the three sub-objectives. In this study, we adopt equal weights () as a baseline configuration to provide a balanced trade-off among the three objectives. This equal-weight setting serves as a neutral starting point in the absence of specific business preferences.
Importantly, the framework is designed with flexibility in mind: cruise operators can readily adjust these weight coefficients to reflect their strategic priorities. For example, an operator aiming to maximize overall passenger satisfaction might increase , while another prioritizing fairness across groups could assign higher values to and . This adaptability ensures that the proposed approach can be tailored to diverse real-world operational requirements.
Genetic operators: GBCA employs the following:
- Tournament selection to choose parents for reproduction, maintaining selection pressure while preserving diversity.
- Uniform crossover with probability to exchange genetic material between parents.
- Mutation with probability that randomly reassigns a small number of passengers to different task units, introducing novel genetic material.
Termination: The evolution proceeds for a maximum of generations or until the fitness improvement over 20 consecutive generations falls below a threshold of . The chromosome with the best fitness at termination is output as the optimal task unit partition.
2.5. Integrated Framework Workflow
The complete KPCA-ASFSSA-KELM-GBCA framework operates through the following integrated workflow (Figure 4):
- Offline Training Phase: Using historical or synthetic task unit data, the KPCA-ASFSSA-KELM predictor is trained to map the eight engineered features to the corresponding itinerary benefit. This trained predictor serves as the fitness oracle for the subsequent clustering phase.
- Initialization Phase: For a given set of passengers and venues, GBCA generates an initial population of random partitions, each assigning passengers to task units (where is determined via the elbow method described in Section 3.3).
- Capacity Allocation Phase: For each candidate partition, venue capacities are dynamically allocated to task units using the mechanism described in Section 2.1. This produces the final allocated capacities needed for feature computation.
- Fitness Evaluation Phase: For each task unit in the partition, the eight features are computed (Section 2.2) and fed into the trained predictor to estimate the benefit . The three objectives , , and are then calculated, yielding the composite fitness .
- Evolutionary Optimization Phase: Genetic operators (selection, crossover, mutation) are applied to generate a new population of partitions. Steps 3–4 are repeated for each generation, progressively improving the fitness of the population.
- Termination and Output Phase: Upon meeting termination criteria, the partition with the best fitness is output as the optimal task unit grouping. This partition simultaneously maximizes predicted itinerary benefit, balances task unit sizes, and ensures equitable benefit distribution.
Figure 4.
The workflow diagram of the KPCA-ASFSSA-KELM-GBCA.
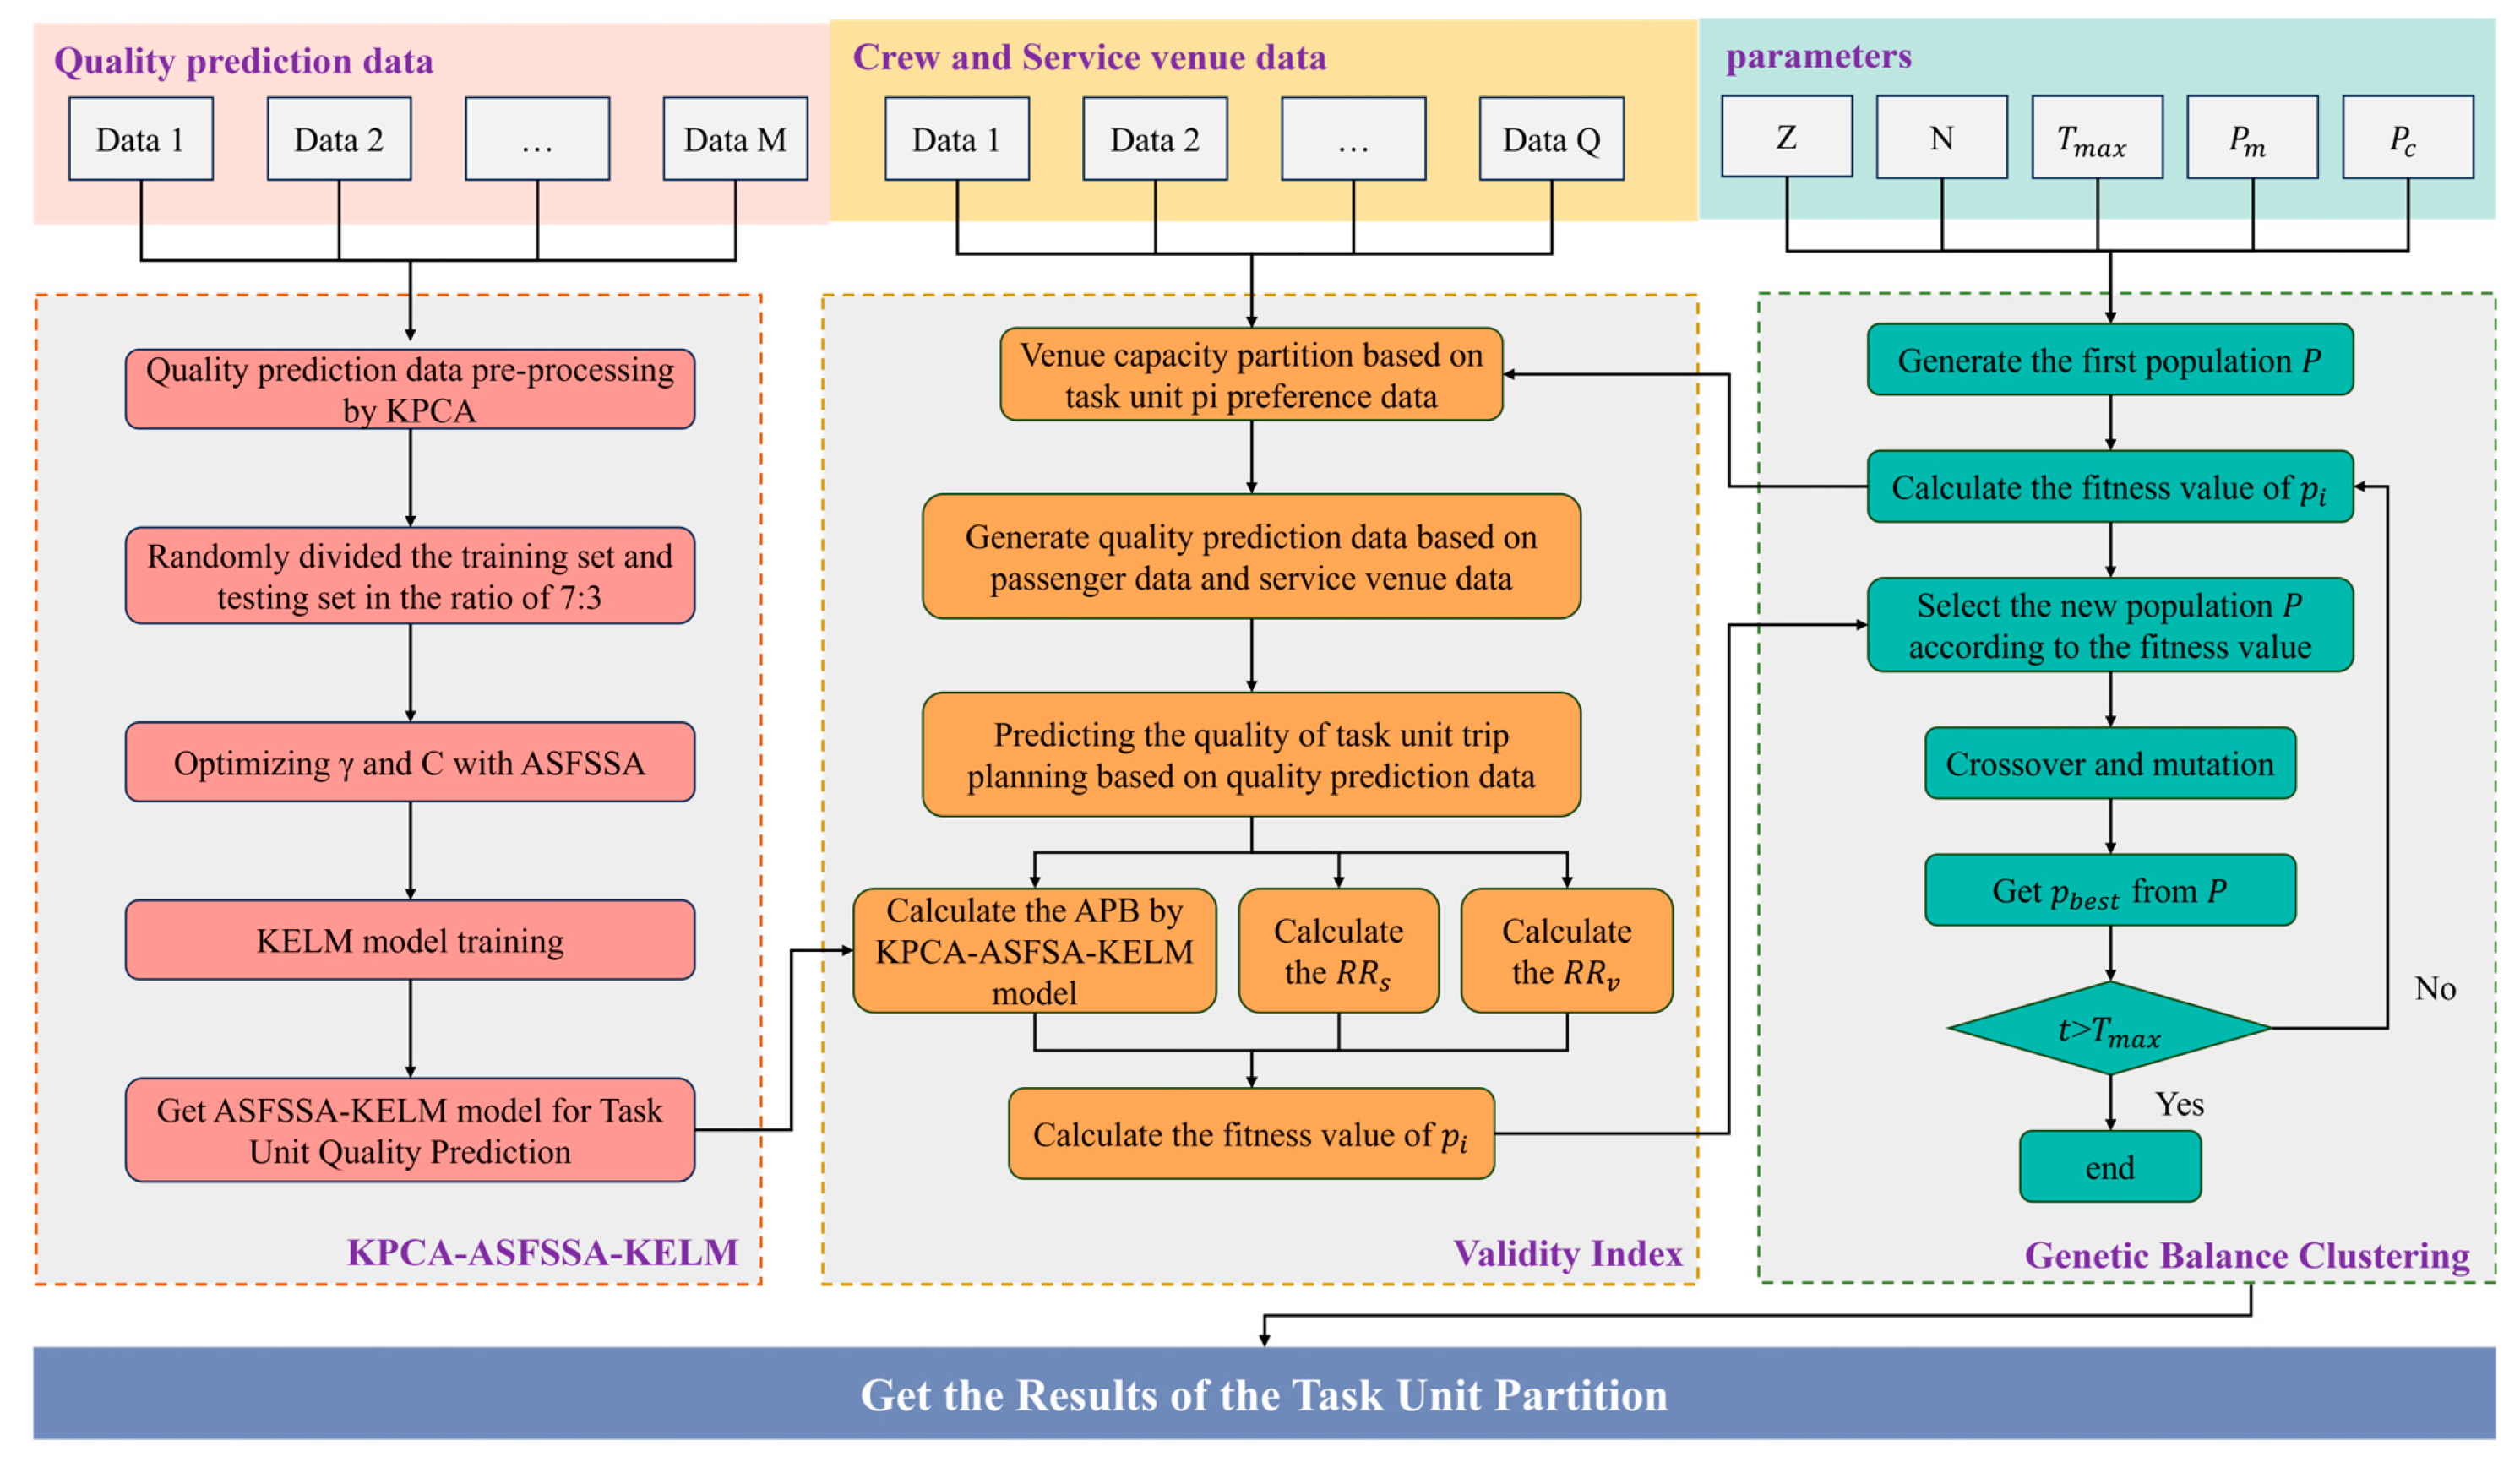
This closed-loop integration of predictive modeling, dynamic resource allocation, and multi-objective evolutionary optimization enables the framework to discover partitions that are superior not only in feature-space metrics but also in terms of downstream itinerary planning performance, a capability that conventional clustering methods fundamentally lack.
3. Results
3.1. Datasets and the Experimental Environment
For the case study, we need to randomly generate the cruise itinerary planning task unit partition data and task unit quality prediction training dataset. Firstly, we randomly generate the passenger data and service venue data involved in the cruise itinerary planning task unit partition. To verify the performance of the algorithm on datasets of different sizes, we conduct experiments using datasets of different passenger sizes and service venue sizes, and the characteristics are detailed in Table 2.
Table 2.
Characterization of datasets.
The dataset sizes were chosen to reflect realistic cruise scenarios: Instance 1 corresponds to a small cruise ship with limited venues, while Instance 4 simulates a large vessel with more complex service offerings. These settings ensure the evaluation covers a wide range of operational scales.
All simulations assumed a fixed passenger origin at coordinates (0, 0, 0). Key parameters were randomly generated within specified ranges:
- Daily time budget constraints: start times [360, 540] minutes (6:00–9:00 a.m.);
- Activity windows: end times [1200, 1440] minutes (8:00 p.m.–12:00 p.m.);
- Service venue utility values: [1, 20] benefit units.
Time windows for each venue were standardized to a minute-based representation (e.g., 7:00 a.m. = 420 min) to ensure computational consistency in scheduling and overlap calculations. Service venue utility values are expressed as dimensionless benefit units within the range [1, 20], where higher values indicate greater passenger preference or perceived satisfaction. The complete parameter specifications for synthetic data generation are presented in Table 3.
Table 3.
Generation of data on cruise ship service venues.
The training dataset for quality prediction is then randomly generated for the partition of task units. The size of the training dataset is set to 3000, and each piece of data for each task unit is randomly generated in the interval. Where the interval of the number of passengers is [10, 80] and the default of passenger location is (0, 0, 0). The number of service venues interval is [10, 60], the location of service venues is randomly generated in the range of 100 × 100 × 100, and the capacity of service venues interval is [1, 30]. The generation intervals for service venue benefit values, recommended service hours, passenger time budgets, and service venue opening hours are the same as the previous generation intervals. Based on the passenger data and service venue data generated for each task unit, the quality prediction input data are fitted to form the quality prediction input data in the manner described in Section 2.2, and the multi-passenger itinerary planning algorithm [4] is applied to calculate the objective function values. These are used as input data and output data for the training dataset of quality prediction for the cruise itinerary planning task unit partition, respectively.
While the data generation process was carefully designed based on real-world cruise parameters (Table 3) to ensure a degree of realism, it is important to acknowledge the limitations of using fully synthetic data. The random generation may not fully capture the nuanced patterns and stochastic nature of actual passenger behavior or operational disturbances. Consequently, the reported performance improvements, while significant in these controlled synthetic settings, should be interpreted as a strong indicator of the framework’s potential. Validation on real-world cruise data is a crucial direction for future work.
All experiments were conducted on a desktop computer with the following specifications: 11th Gen Intel Core i7-11390H processor (3.40 GHz, 4 cores) (Intel Corp., Santa Clara, CA, USA), 16 GB RAM, running Windows 11. The proposed framework and all comparison algorithms were implemented in MATLAB R2022b, utilizing the Statistics and Machine Learning Toolbox for clustering algorithms. To ensure fair comparison, all methods were executed under the same experimental conditions and software environment.
3.2. Performance Evaluation of Predictive Model
The validity of the KPCA-ASFSSA-KELM model needs to be validated to ensure the accuracy of the quality assessment of the cruise ship itinerary planning task unit partition. We assessed the validity of the prediction model by analyzing the performance of KPCA-ASFSSA-KELM on a sample dataset of passenger itinerary planning quality predictions.
3.2.1. Feature Extraction
The feature vector for cruise itinerary planning task unit quality Prediction comprises eight variables (Table 1). Prior to analysis, the dataset is normalized to constrain all variables within the range [0, 1]. To address potential feature interdependence and eliminate noise from irrelevant variables, Kernel Principal Component Analysis (KPCA) is applied for dimensionality reduction on the normalized feature vectors.
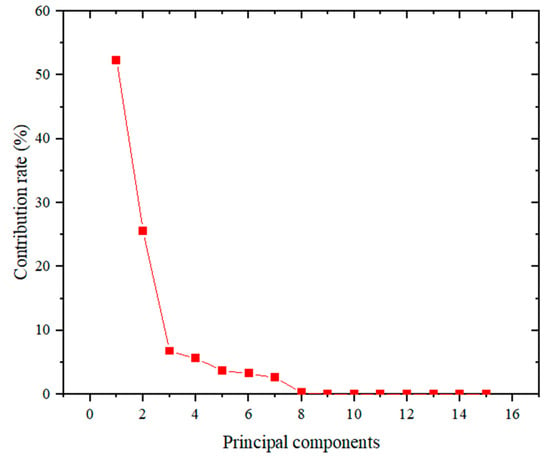
Figure 5 presents the contribution rates of the principal components following dimensionality reduction. To identify the most informative components, a cumulative contribution rate threshold of 90% was applied. Table 4 summarizes the eigenvalues, individual contribution rates, and cumulative contribution rates of the top five principal components derived from KPCA. The results indicate that the first four principal components collectively account for over 90% of the cumulative contribution rates, effectively capturing the essential structure of the original dataset.
Figure 5.
Contribution rate of each principal component.
Table 4.
Principal components and cumulative contribution rates.
3.2.2. Evaluation Criteria
To rigorously evaluate the predictive capability of the proposed model, four established evaluation metrics were employed:
Root Mean Square Error (), quantifying prediction accuracy:
Mean Absolute Percentage Error (), assessing the percentage-based error magnitude:
Mean Absolute Error (), assessing absolute deviation:
Coefficient of Determination (), evaluating goodness-of-fit:
where and refer to the actual measurement and prediction values. denotes the actual average value of the predicted object. denotes the amount of data.
3.2.3. Predictive Performance Evaluation and Comparative Analysis
The performance validation of the predictive model used 3000 sets of samples for simulation experiments. The four principal components after KPCA dimensionality reduction were used as the input set of the ASFSSA-KELM model, and the corresponding itinerary benefits of the cruise itinerary planning task unit were used as the output set. From the reconstructed dataset, 2400 groups are randomly selected as the training set of the model, and the remaining 600 groups are used as the test set. ASFSSA-KELM is compared with the other seven methods, namely, VPPSO-KELM [41], SSA-KELM [42], GWO-KELM [43], KELM [44], ELM [45], BP [46], and LSTM [47]. Each model is repeatedly run 20 times. The comprehensive prediction results, including performance metrics and error analysis, are presented in the following figures and tables. These quantitative outcomes facilitate an in-depth comparative evaluation of the model’s predictive capabilities.
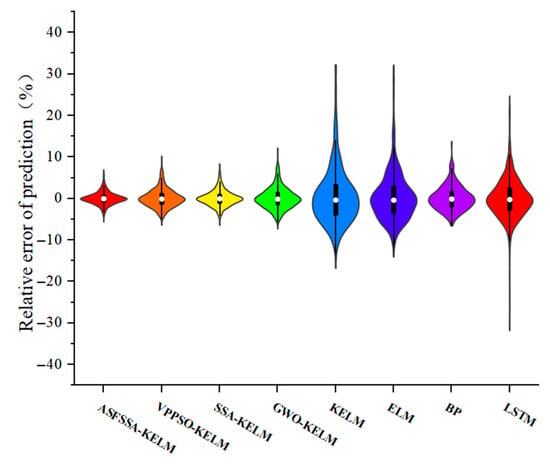
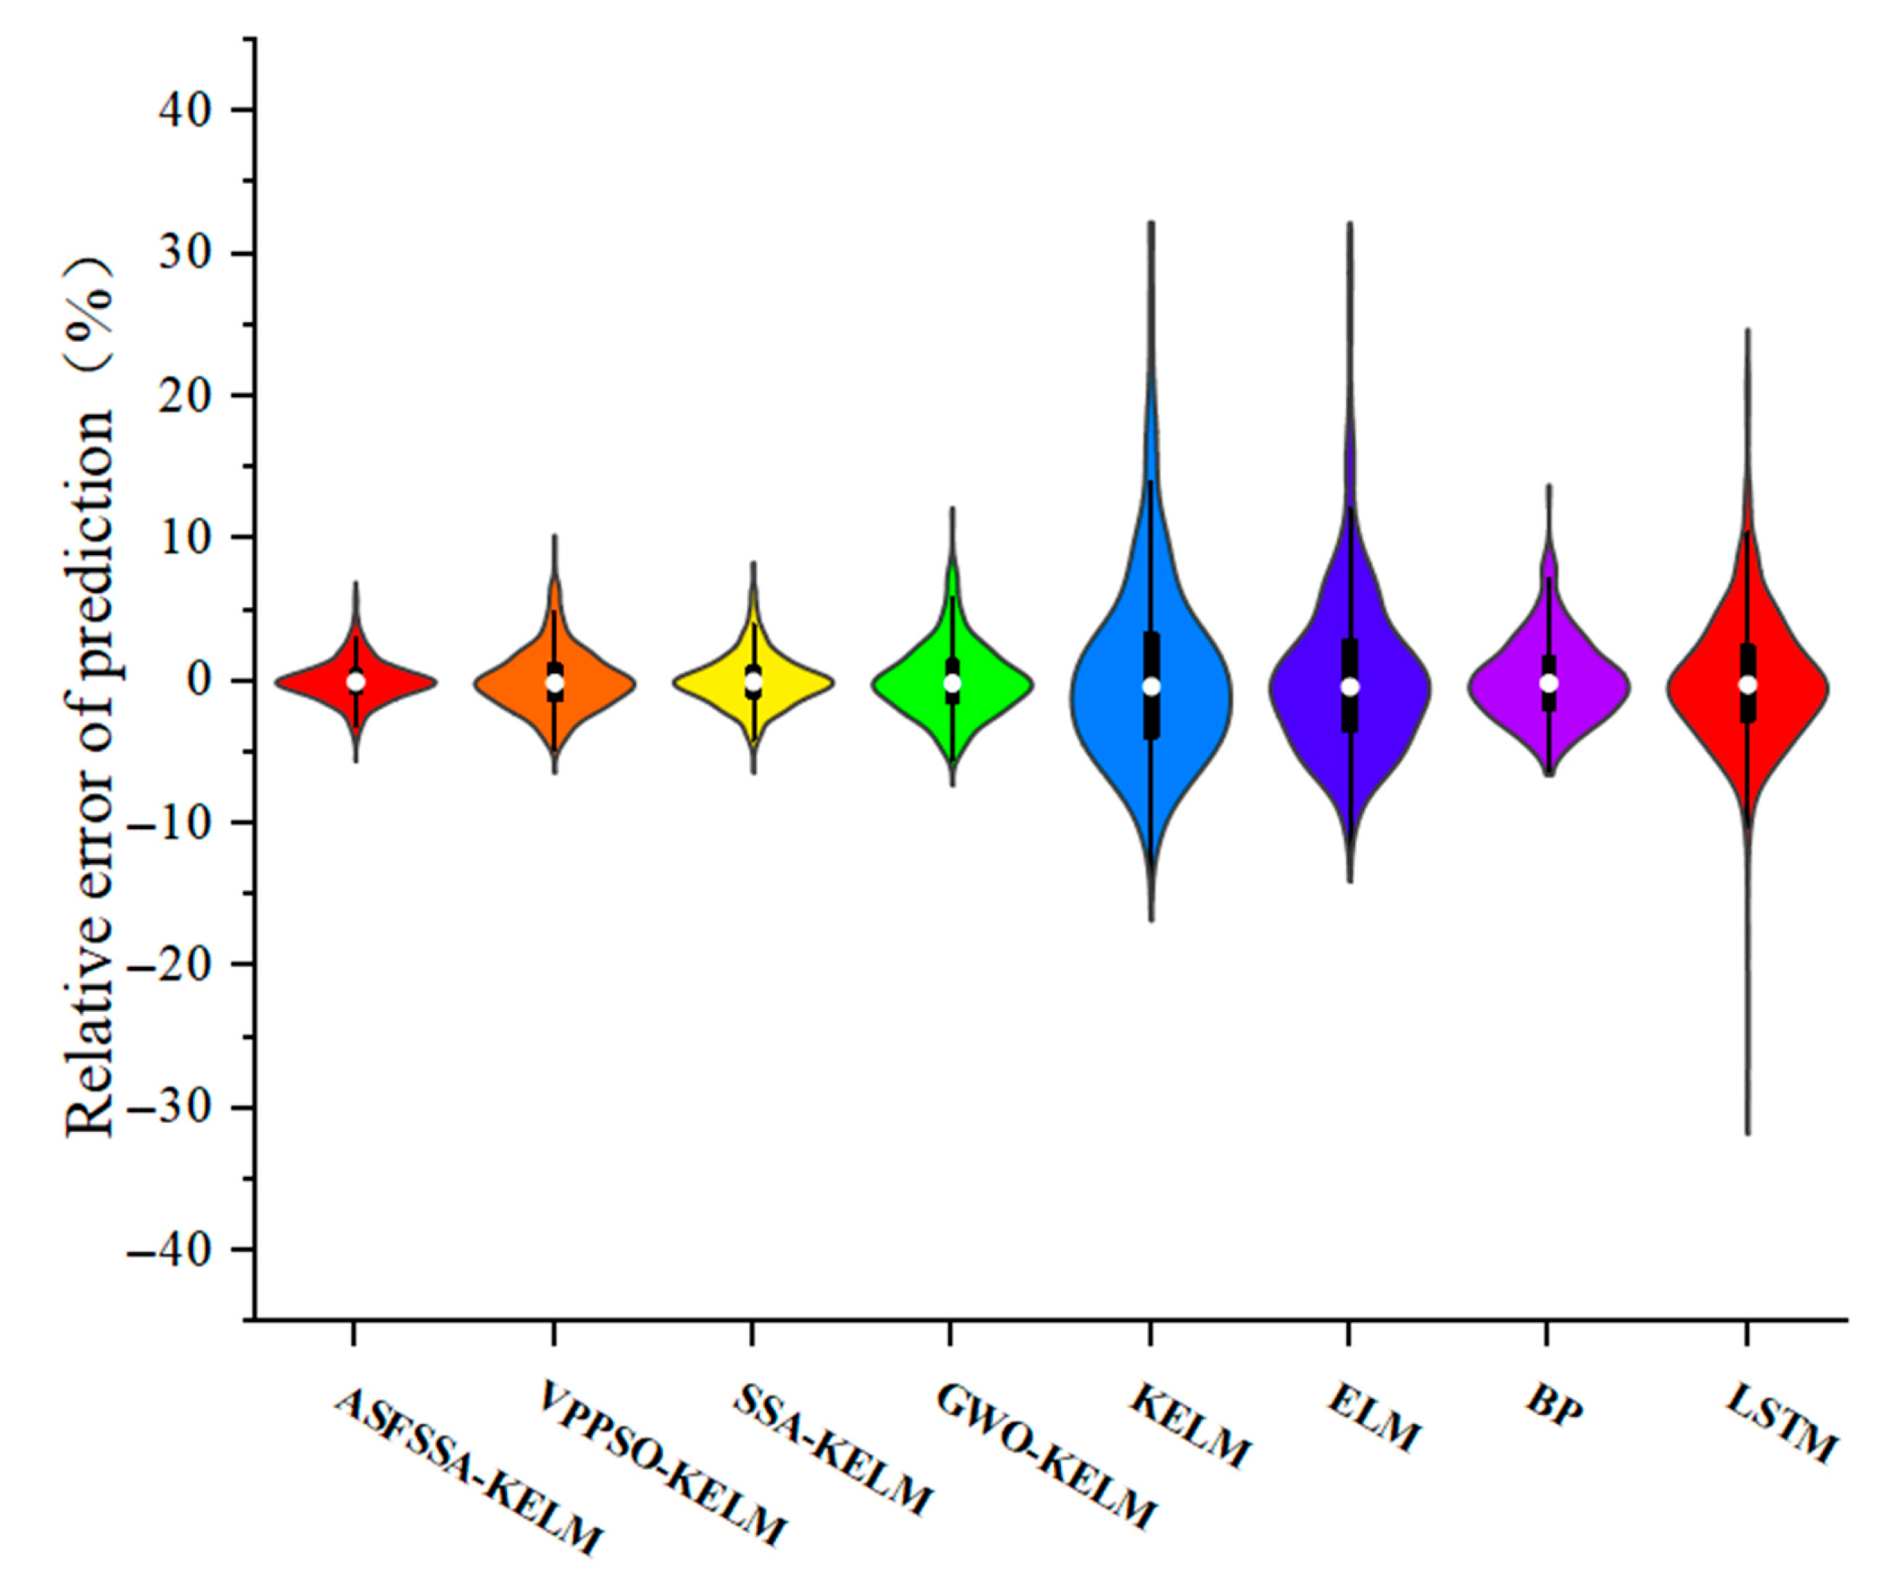
Figure 6 displays the violin plot representation of prediction relative errors across all models. The interquartile range (IQR), visualized by the box length, serves as an indicator of error dispersion—with greater length corresponding to increased variability. Comparative analysis reveals the ASFSSA-KELM model exhibits the most constrained IQR, with error distributions tightly clustered near zero. This characteristic demonstrates superior error concentration compared to alternative approaches, suggesting enhanced prediction stability.
Figure 6.
Relative error violin plots for each model.
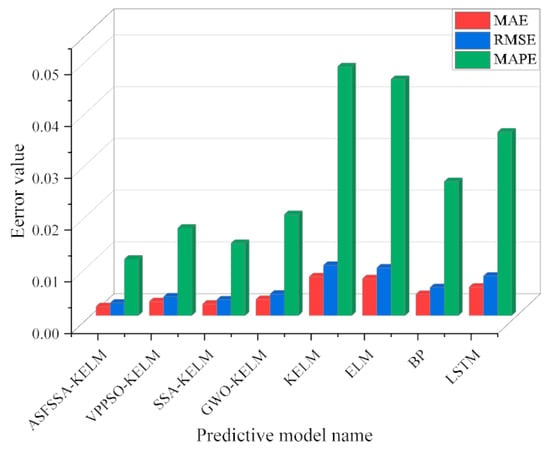
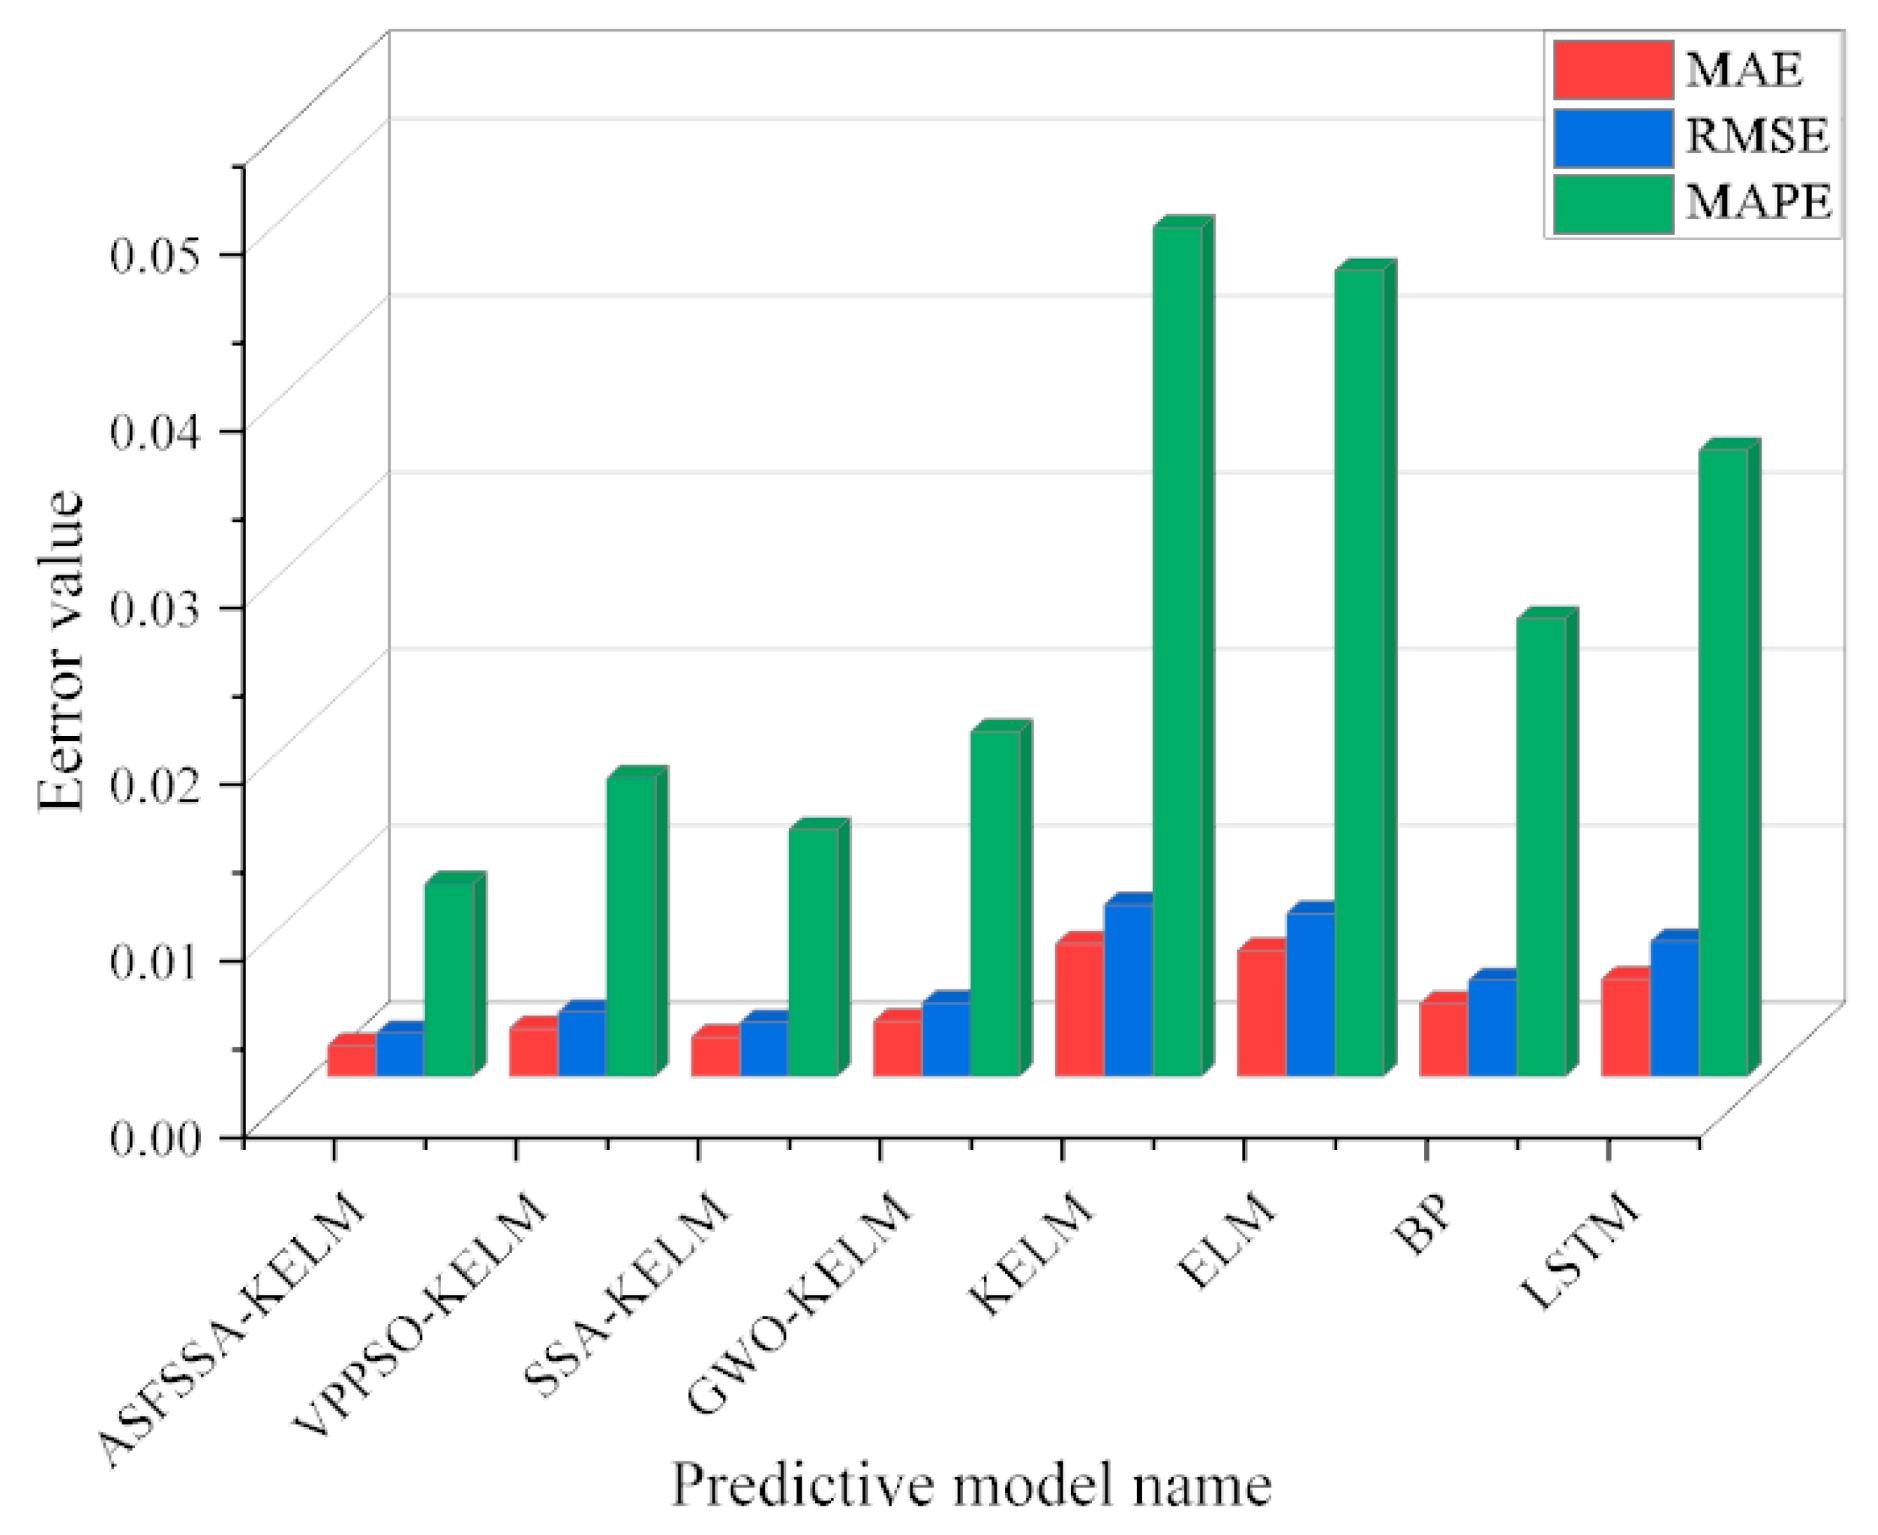
As detailed in Table 5, the proposed ASFSSA-KELM model demonstrates superior predictive performance across all evaluation metrics, achieving optimal values for (0.0024), (0.0017), (1.09%), and (0.9886). The comparative histogram in Figure 7 consolidates , , and results, visually confirming that the ASFSSA-KELM model yields the lowest error metrics among all evaluated methods.
Table 5.
The predictive performance comparisons of different models.
Figure 7.
Comparison of , and results for each model.
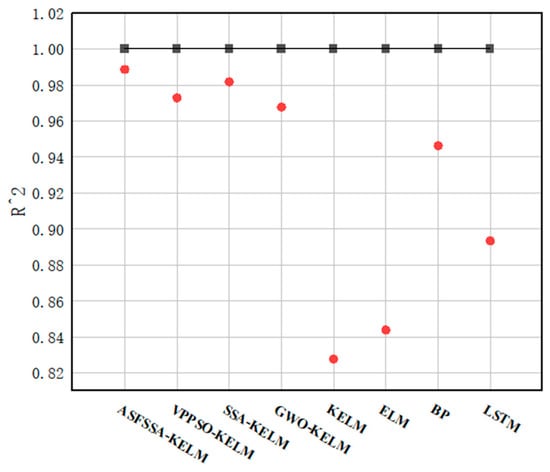
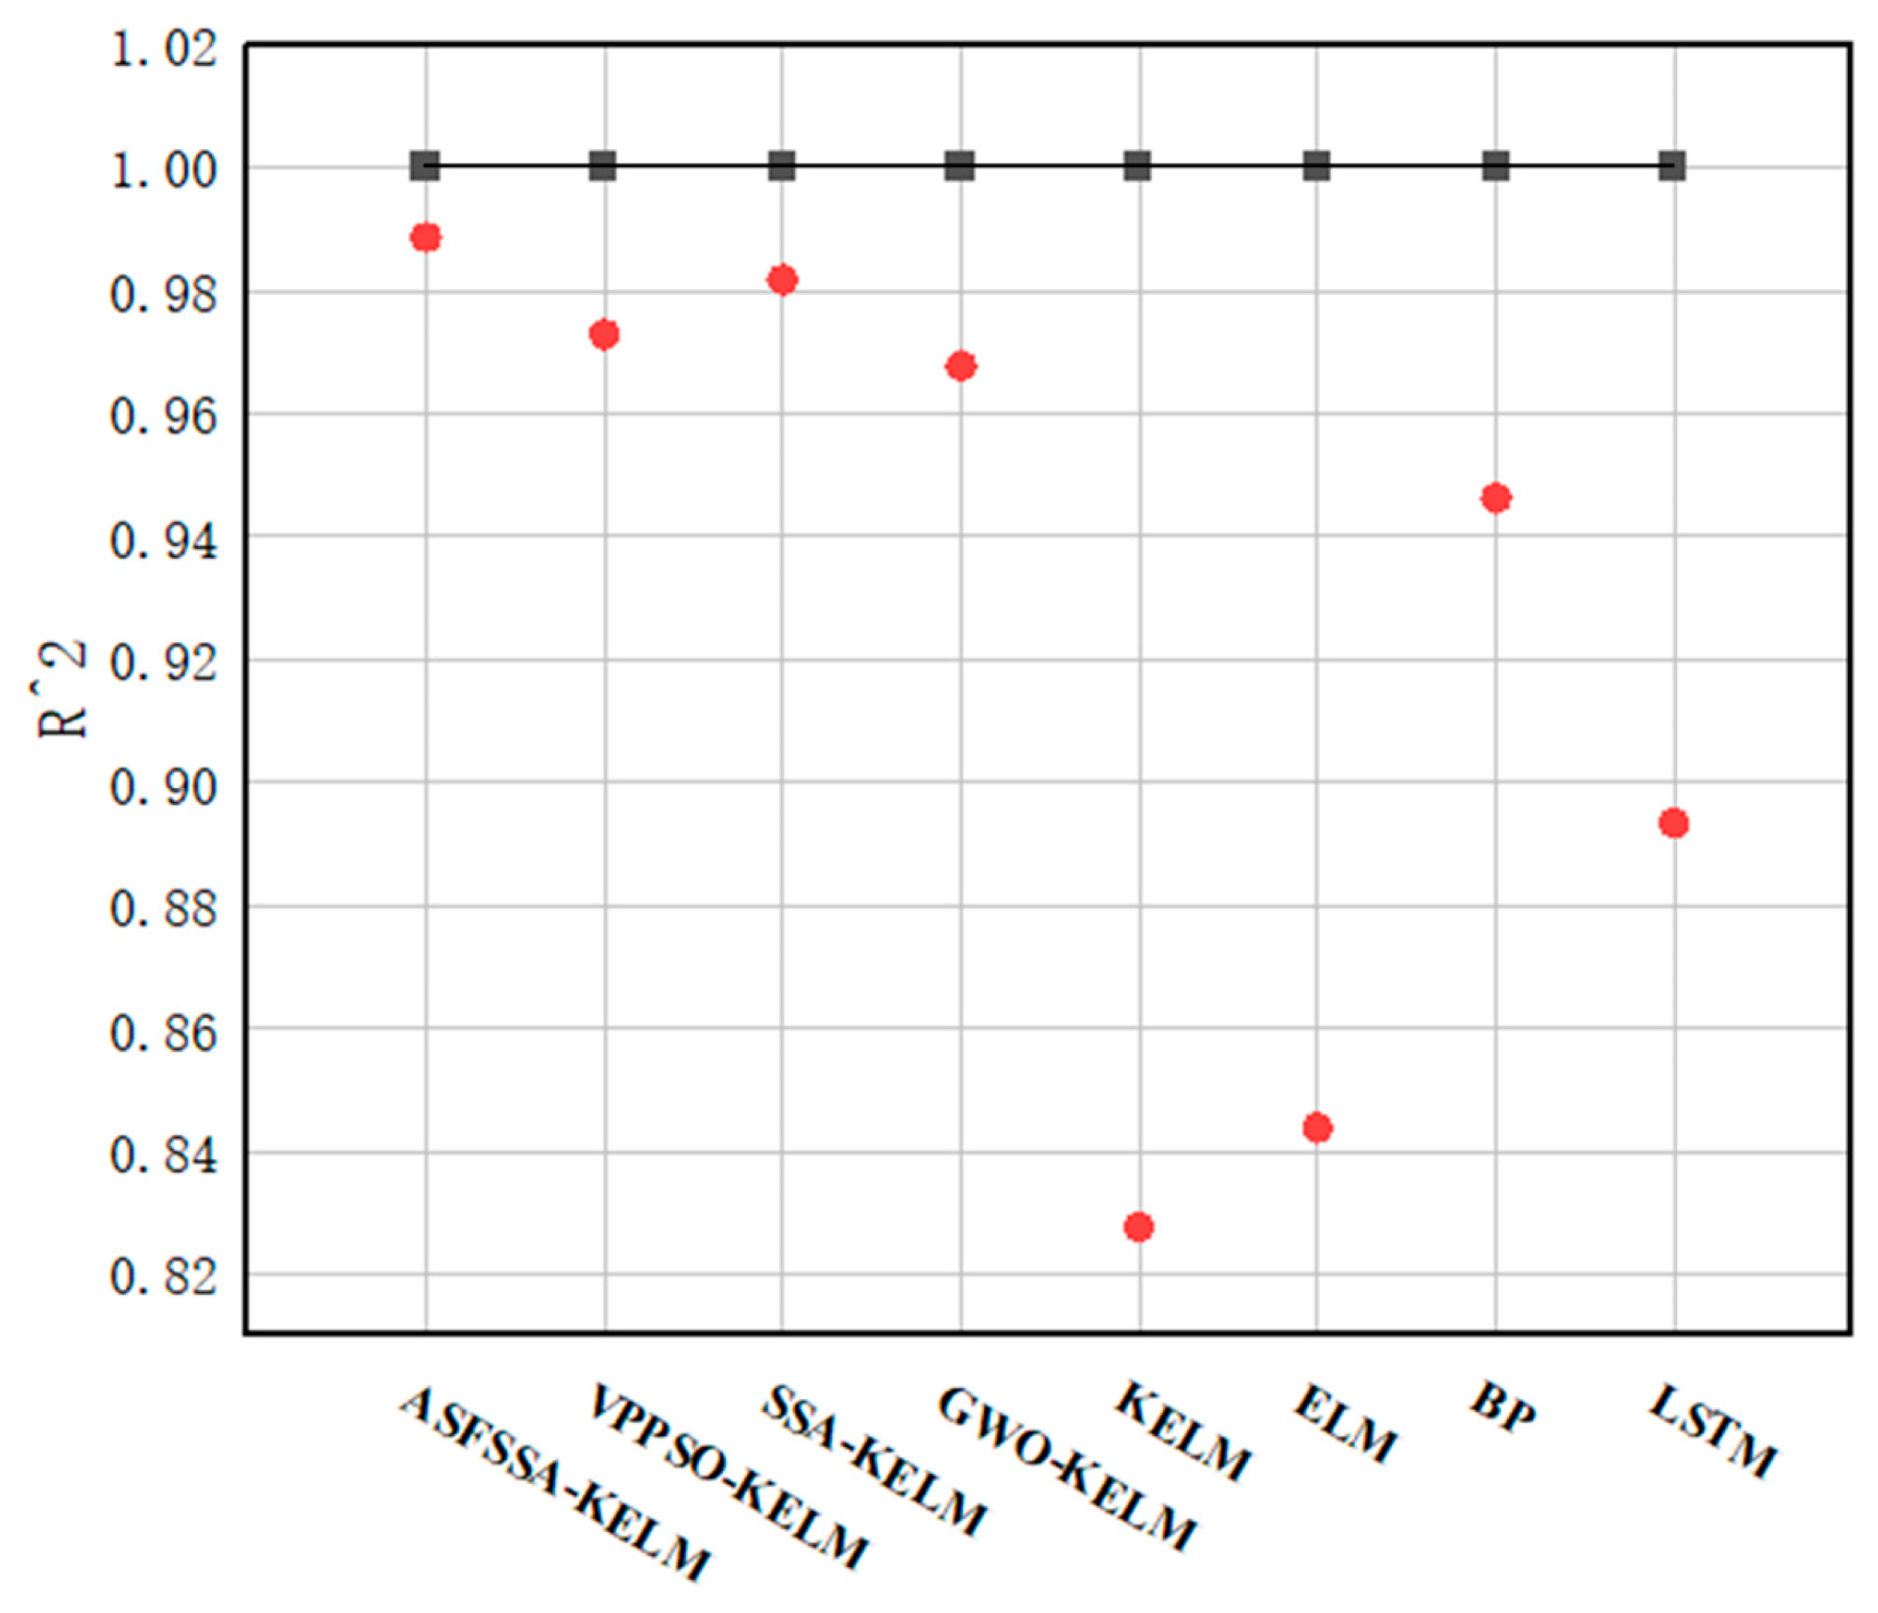
It is worth noting that the values reported in Figure 8 span a wide range, from 0.8277 of KELM to 0.9886 of ASFSSA-KELM. The majority of models, including ASFSSA-KELM, SSA-KELM, VPPSO-KELM, GWO-KELM, and BP, achieve values above 0.94, indicating strong predictive performance. The relatively lower values observed for KELM, ELM, and LSTM are expected, because these models lack systematic parameter optimization or are not well-suited to the tabular structure of our prediction task. We include these weaker baselines intentionally: they provide a reference point that underscores the necessity of the proposed optimization framework, and highlight the substantial improvements achieved by our enhanced models.
Figure 8.
Comparison of results for each model.
The improvements achieved by the different prediction models across the four evaluation metrics are shown in Table 6, Table 7, Table 8 and Table 9. The experimental results demonstrate that the GWO-optimized KELM exhibits relatively inferior accuracy. However, the GWO-KELM hybrid achieves significant improvements over the baseline KELM model, with error reductions of 57.11% (), 59.39% (), and 56.17% (), along with a 16.91% enhancement in . These metrics collectively validate the superior parameter optimization capability of intelligent algorithms for KELM models.
Table 6.
Improvement in between different prediction models (%).
Table 7.
Improvement in between different prediction models (%).
Table 8.
Improvement in between different prediction models (%).
Table 9.
Improvement in between different prediction models (%).
Among conventional prediction approaches, the BP neural network yields the best performance. Notably, the proposed ASFSSA-KELM model outperforms BP by substantial margins: 55.13% lower , 57.92% reduced , 57.71% decreased , and 4.48% higher . This comprehensive superiority confirms that the ASFSSA-KELM architecture delivers markedly enhanced predictive accuracy compared to standard machine learning models.
Therefore, the KPCA-ASFSSA-KELM prediction model proposed in this paper possesses sufficient accuracy to accurately predict the itinerary planning quality of passenger groups. It can be used as a clustering validity indicator for passenger clustering grouping.
3.3. Determination of the Optimal Number of Task Units
To validate the effectiveness of the proposed model in performing the task unit partition for cruise ship itinerary planning, we tested it on the synthesized dataset described in Section 3.1. To obtain the optimal number of partitions, KPCA-ASFSSA-KELM-GBCA is run iteratively on the dataset to obtain the experimental results. k-values are set from 2 to , according to the commonly used rule [48], and is the number of passengers in the dataset. The method used to determine the optimal number of task units is shown in the pseudocode in the Table 10.
Table 10.
Pseudo code for determining the optimal number of task units.
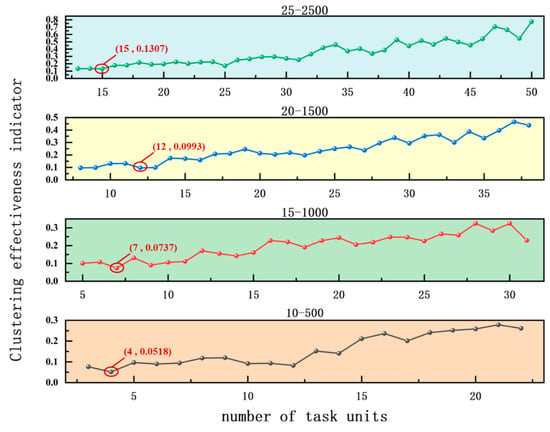
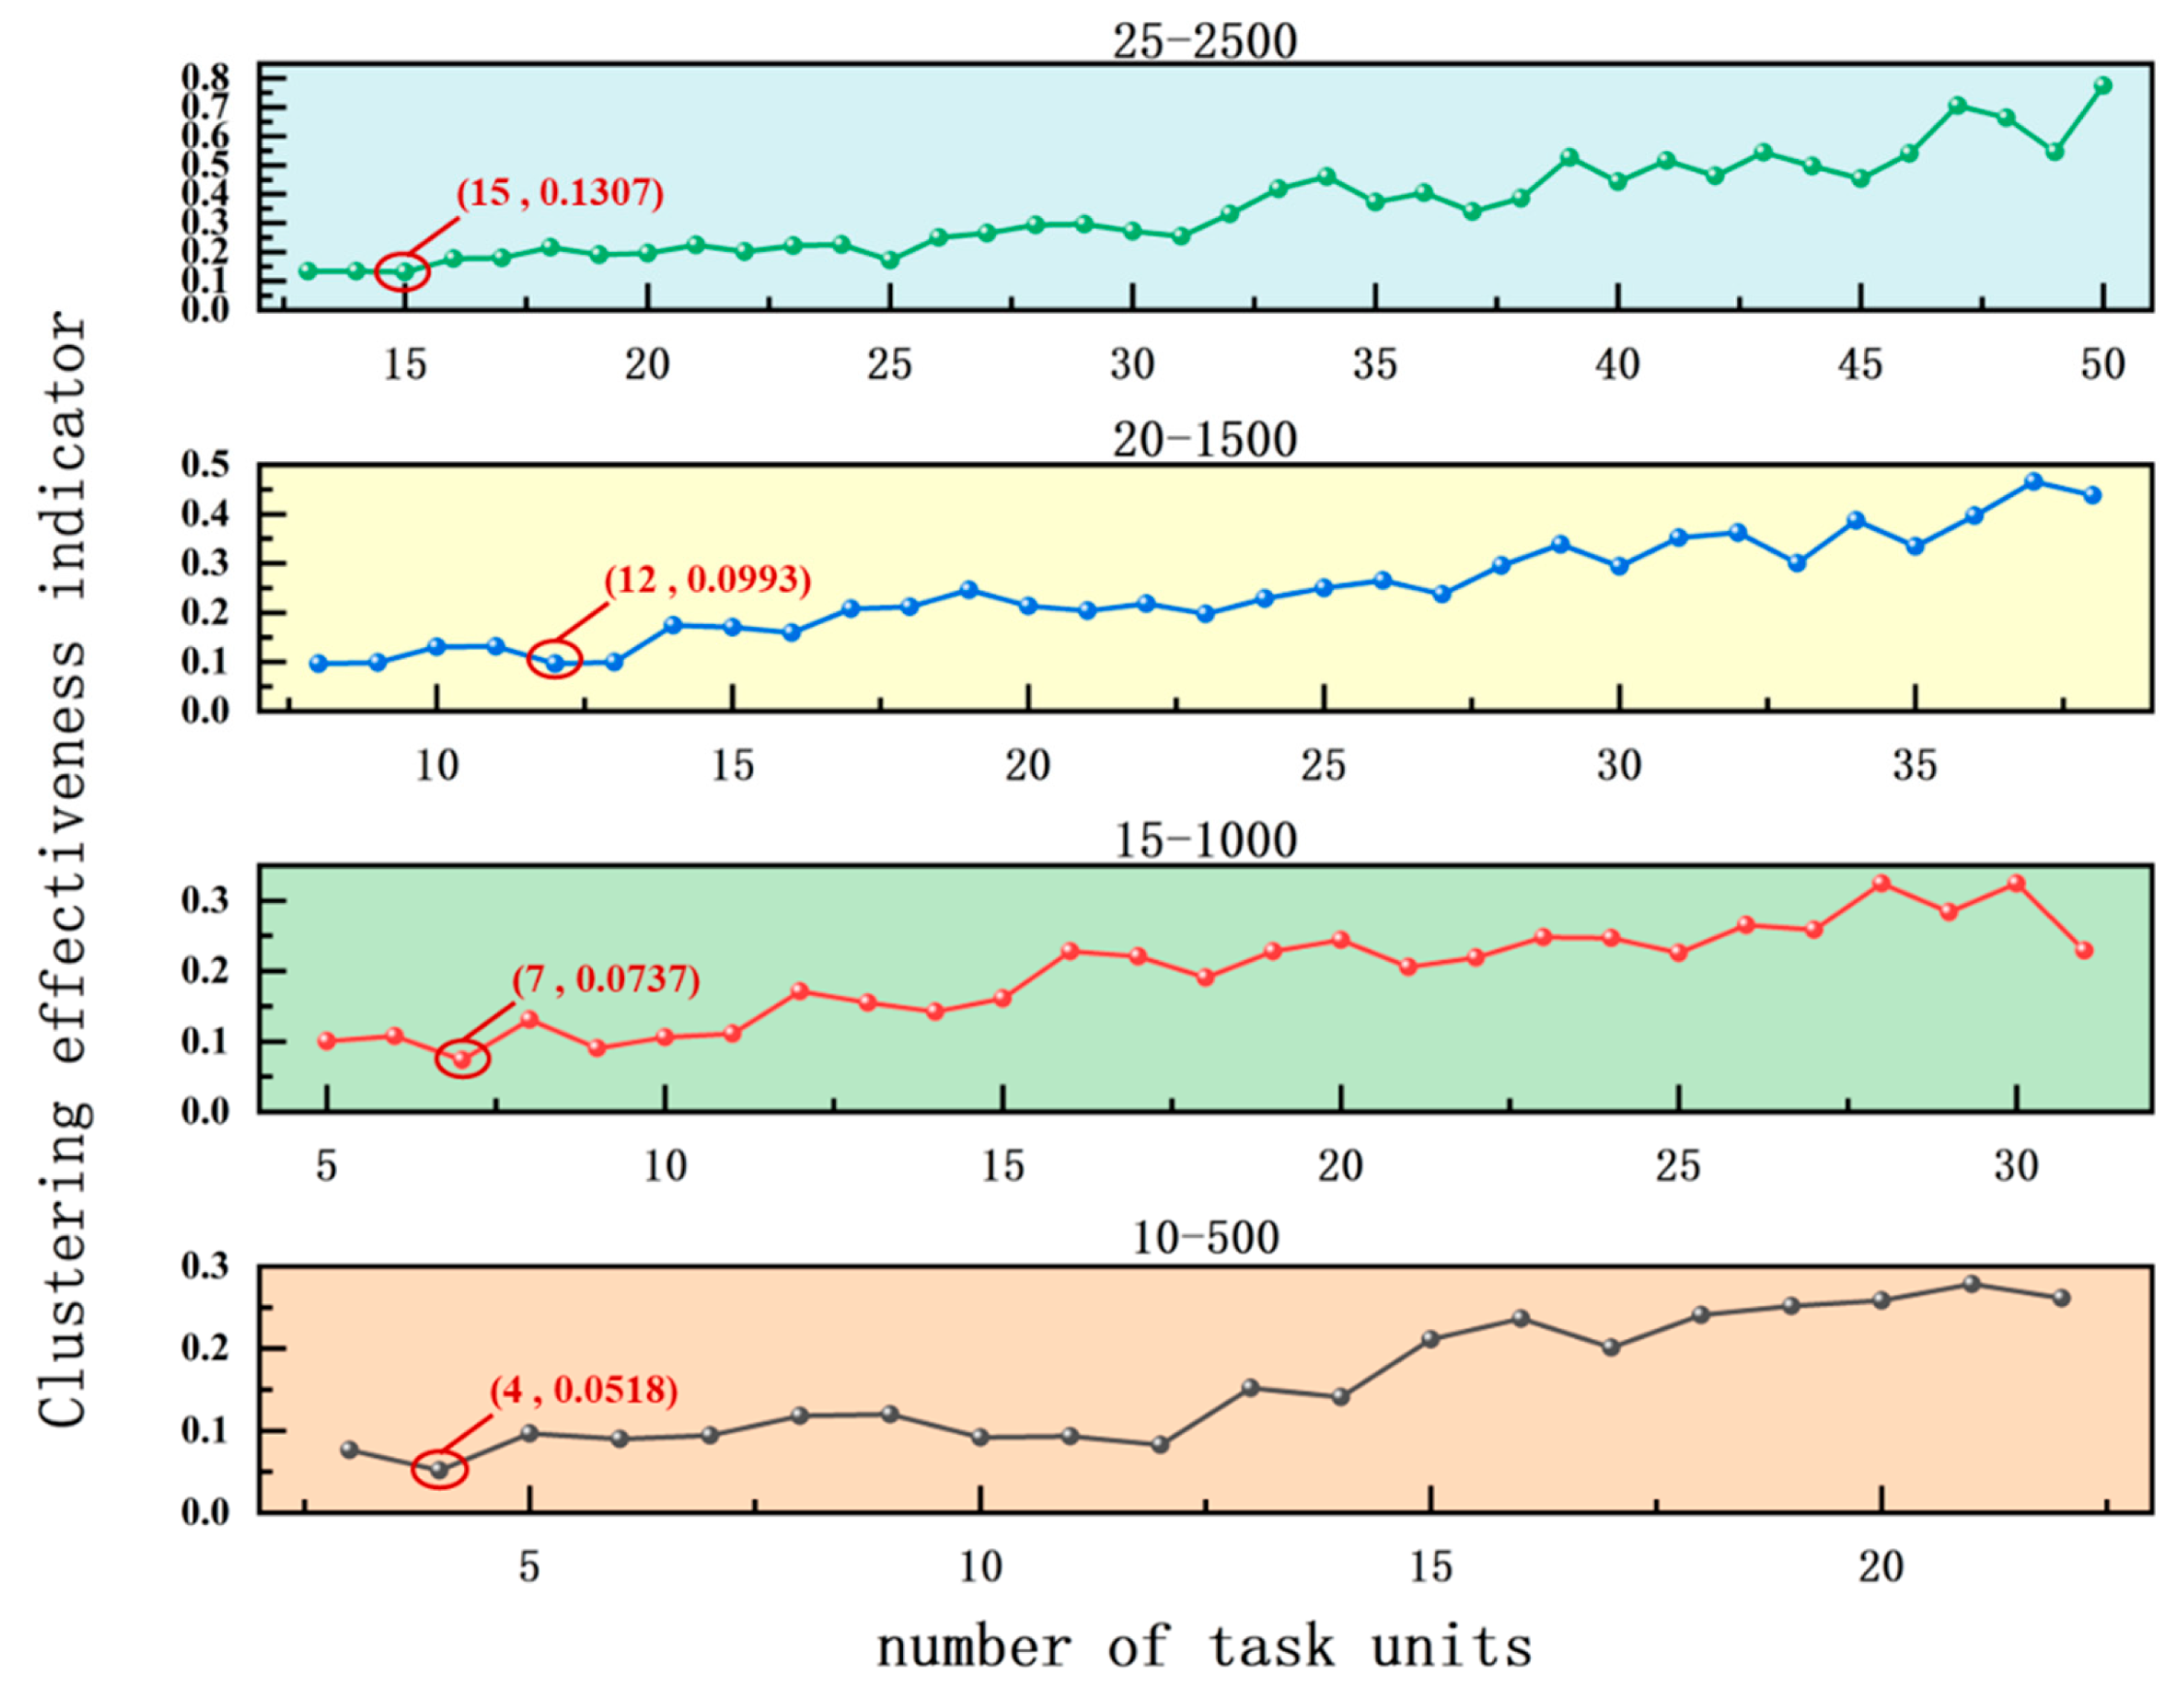
The data described in Section 3.1 are four simulated datasets. The experiment results of the optimal number of task units are shown in Figure 9. When task units are partitioned, exceeding a certain size can result in excessive time spent on itinerary planning. Therefore, when conducting experiments to determine the optimal number of task units, the upper limit of the average size of task units is set to 200. Since the objective function is a minimal value function, when this metric takes the minimum value, it indicates that the algorithm obtains the optimal partition of task units. As can be seen in the figure, the optimal number of task units for the four size datasets is 4, 7, 12, and 15, respectively.
Figure 9.
Experimental results on the optimal number of task units.
3.4. Comparison of Algorithms for Task Unit Partition
Based on the determination of the optimal number of task units for the simulated dataset, and in order to validate the performance of the proposed GBCA, we conducted tests on the four types of datasets described in Section 3.1. The computed results are compared with seven other algorithms applied to the clustering task, including three optimization algorithms, ASFSSA [37], PSO [41], and BWO [49], and four clustering algorithms, K-means [12], K-medoids [50], SC [51], and K-means++ [52]. The user-defined parameters setting of GBCA are defined as the number of task units = (obtained through the optimal number of task units experiment), population size = 100, crossover probability = 0.8, variation probability = 0.2. For comparison, we run each algorithm 30 times independently, taking the average value as the final result.
Table 11 presents the comparative results of eight algorithms on the simulated datasets in terms of average predicted benefit (), Relative Range of Task Unit Size (), Relative Range of Task Unit Benefit (), and the composite objective function (). In addition, the standard deviation of () is reported to evaluate the stability of each algorithm.
Table 11.
Performance comparison of GBCA and other well-known clustering algorithms.
The results clearly demonstrate the efficacy of the proposed GBCA. From Instance 1 to Instance 3, GBCA consistently achieves the best values across all evaluation metrics, indicating its superior ability to balance itinerary benefit, size equilibrium, and benefit fairness. Specifically, GBCA obtains the lowest values (0.0389, 0.1074, and 0.1587) on these datasets, significantly outperforming all compared methods. Moreover, the of GBCA is the smallest among all algorithms on each instance, demonstrating its strong robustness and stability across independent runs.
When the dataset scale is further expanded to Instance 4, PSO achieves a marginally better (−0.1661) than GBCA (−0.1658). However, the difference is negligible, and GBCA still maintains the best overall performance in terms of the composite value (0.1545), along with the lowest (0.0076), indicating that it not only balances size and benefit effectively but also does so with high consistency. In contrast, traditional clustering algorithms such as K-means and K-medoids exhibit much larger values, reflecting their sensitivity to initialization and lack of optimization guidance.
These results confirm that GBCA achieves a superior trade-off among multiple objectives and exhibits significantly better stability than both heuristic and conventional clustering methods, making it particularly suitable for large-scale, real-world cruise itinerary planning tasks.
To assess the statistical significance of the observed performance differences, we performed the Wilcoxon signed-rank test to compare the F-values obtained by the proposed GBCA against those of the seven competing algorithms across 30 independent runs. All tests were conducted at the 0.05 significance level (). The test results confirm that the performance improvements achieved by GBCA over all comparison algorithms are statistically significant: all p-values are consistently below 0.01 across all four dataset instances. In our experiments, the performance differences between GBCA and every compared algorithm are uniformly negative (all sign bits are consistent); thus, all pairwise comparisons yield the identical p-value of . This result robustly verifies that the superior performance of GBCA is not merely due to random chance.
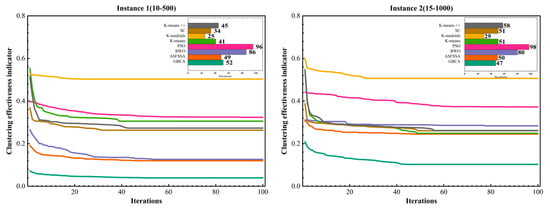
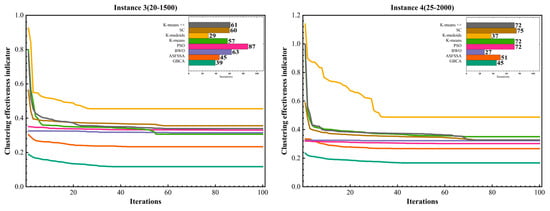
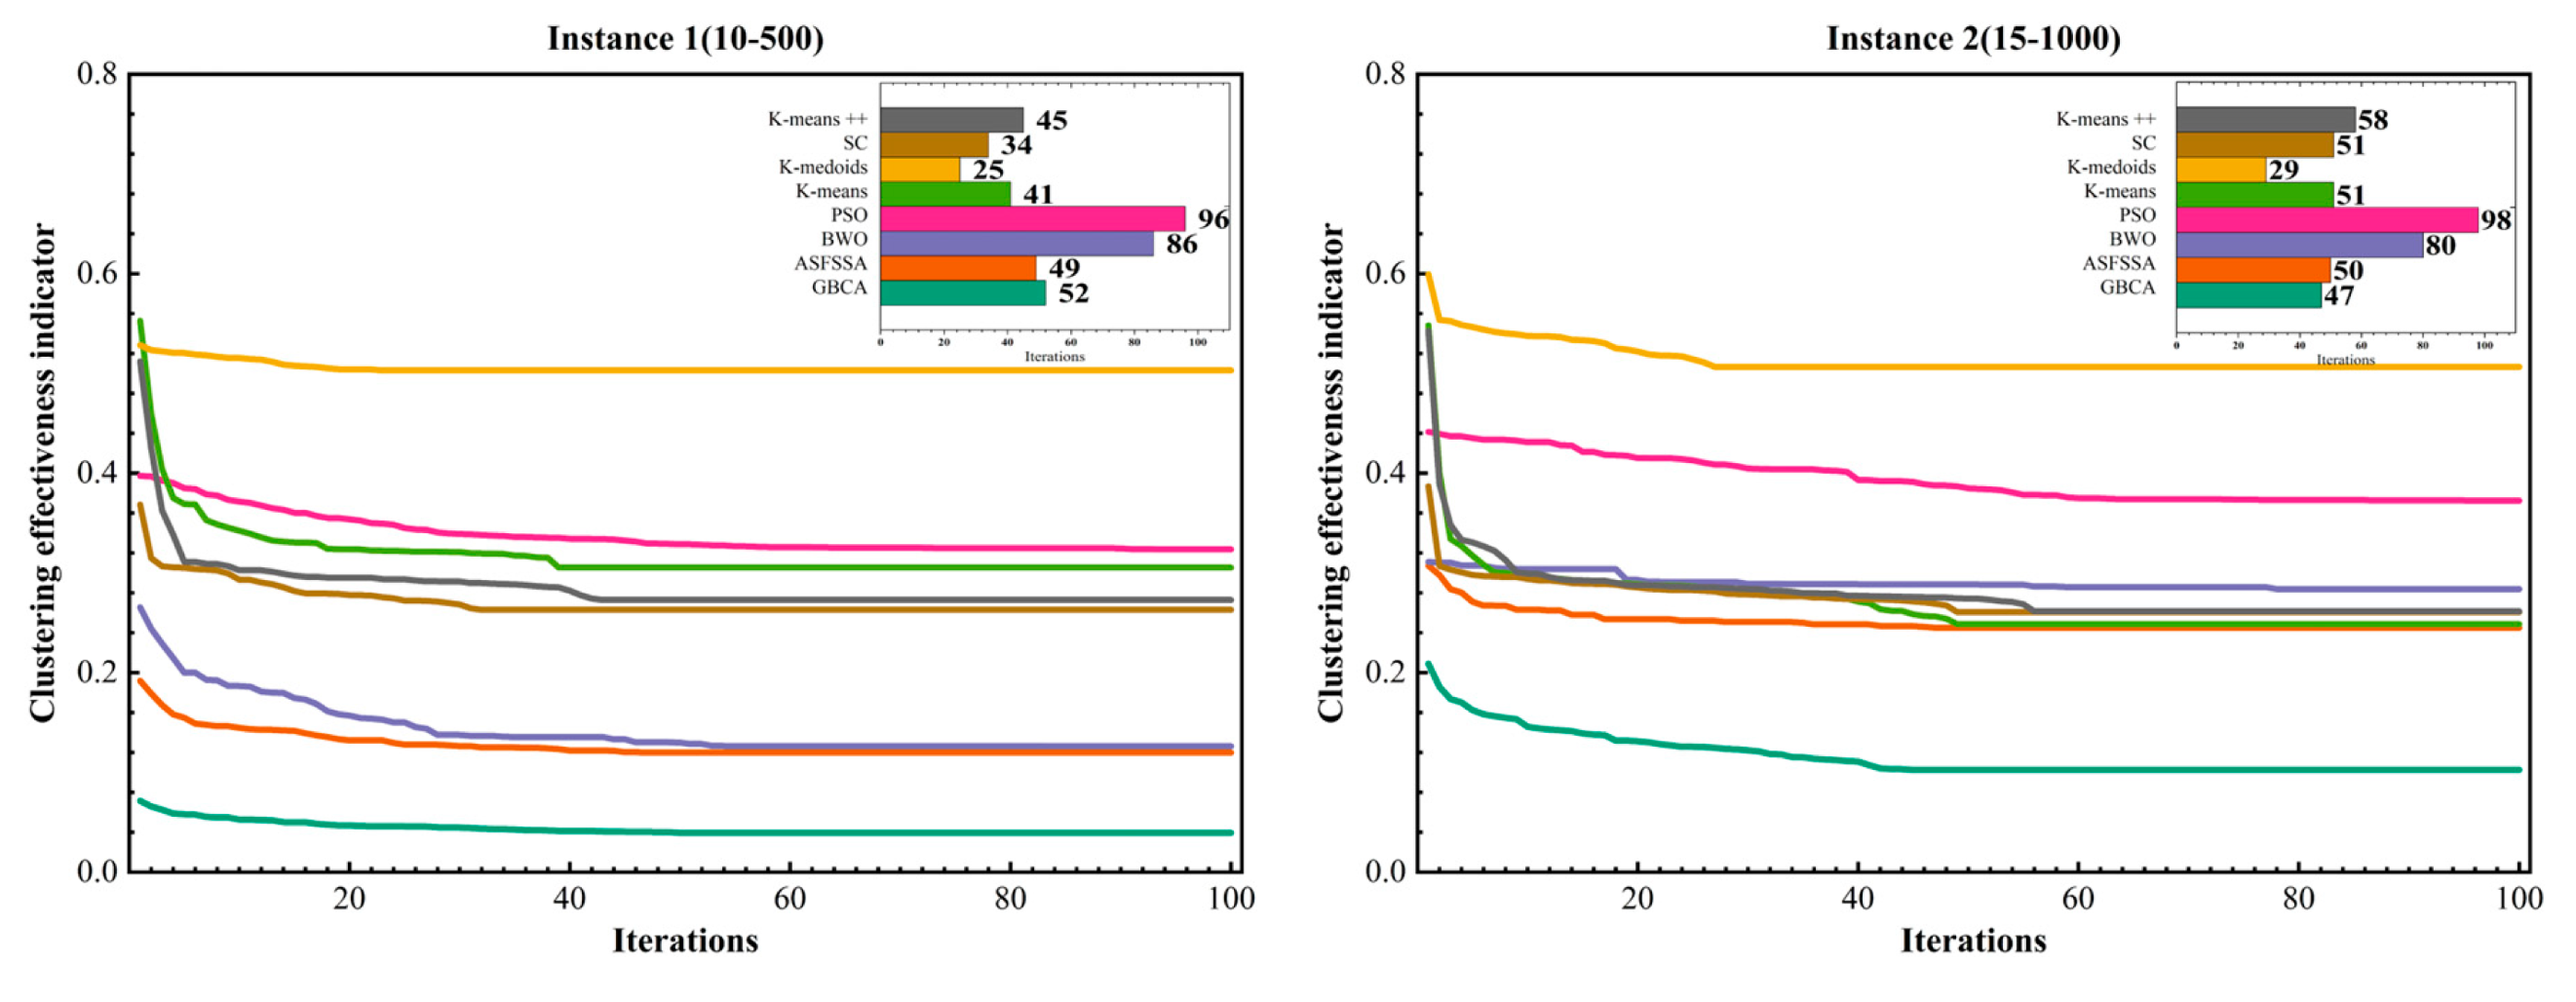
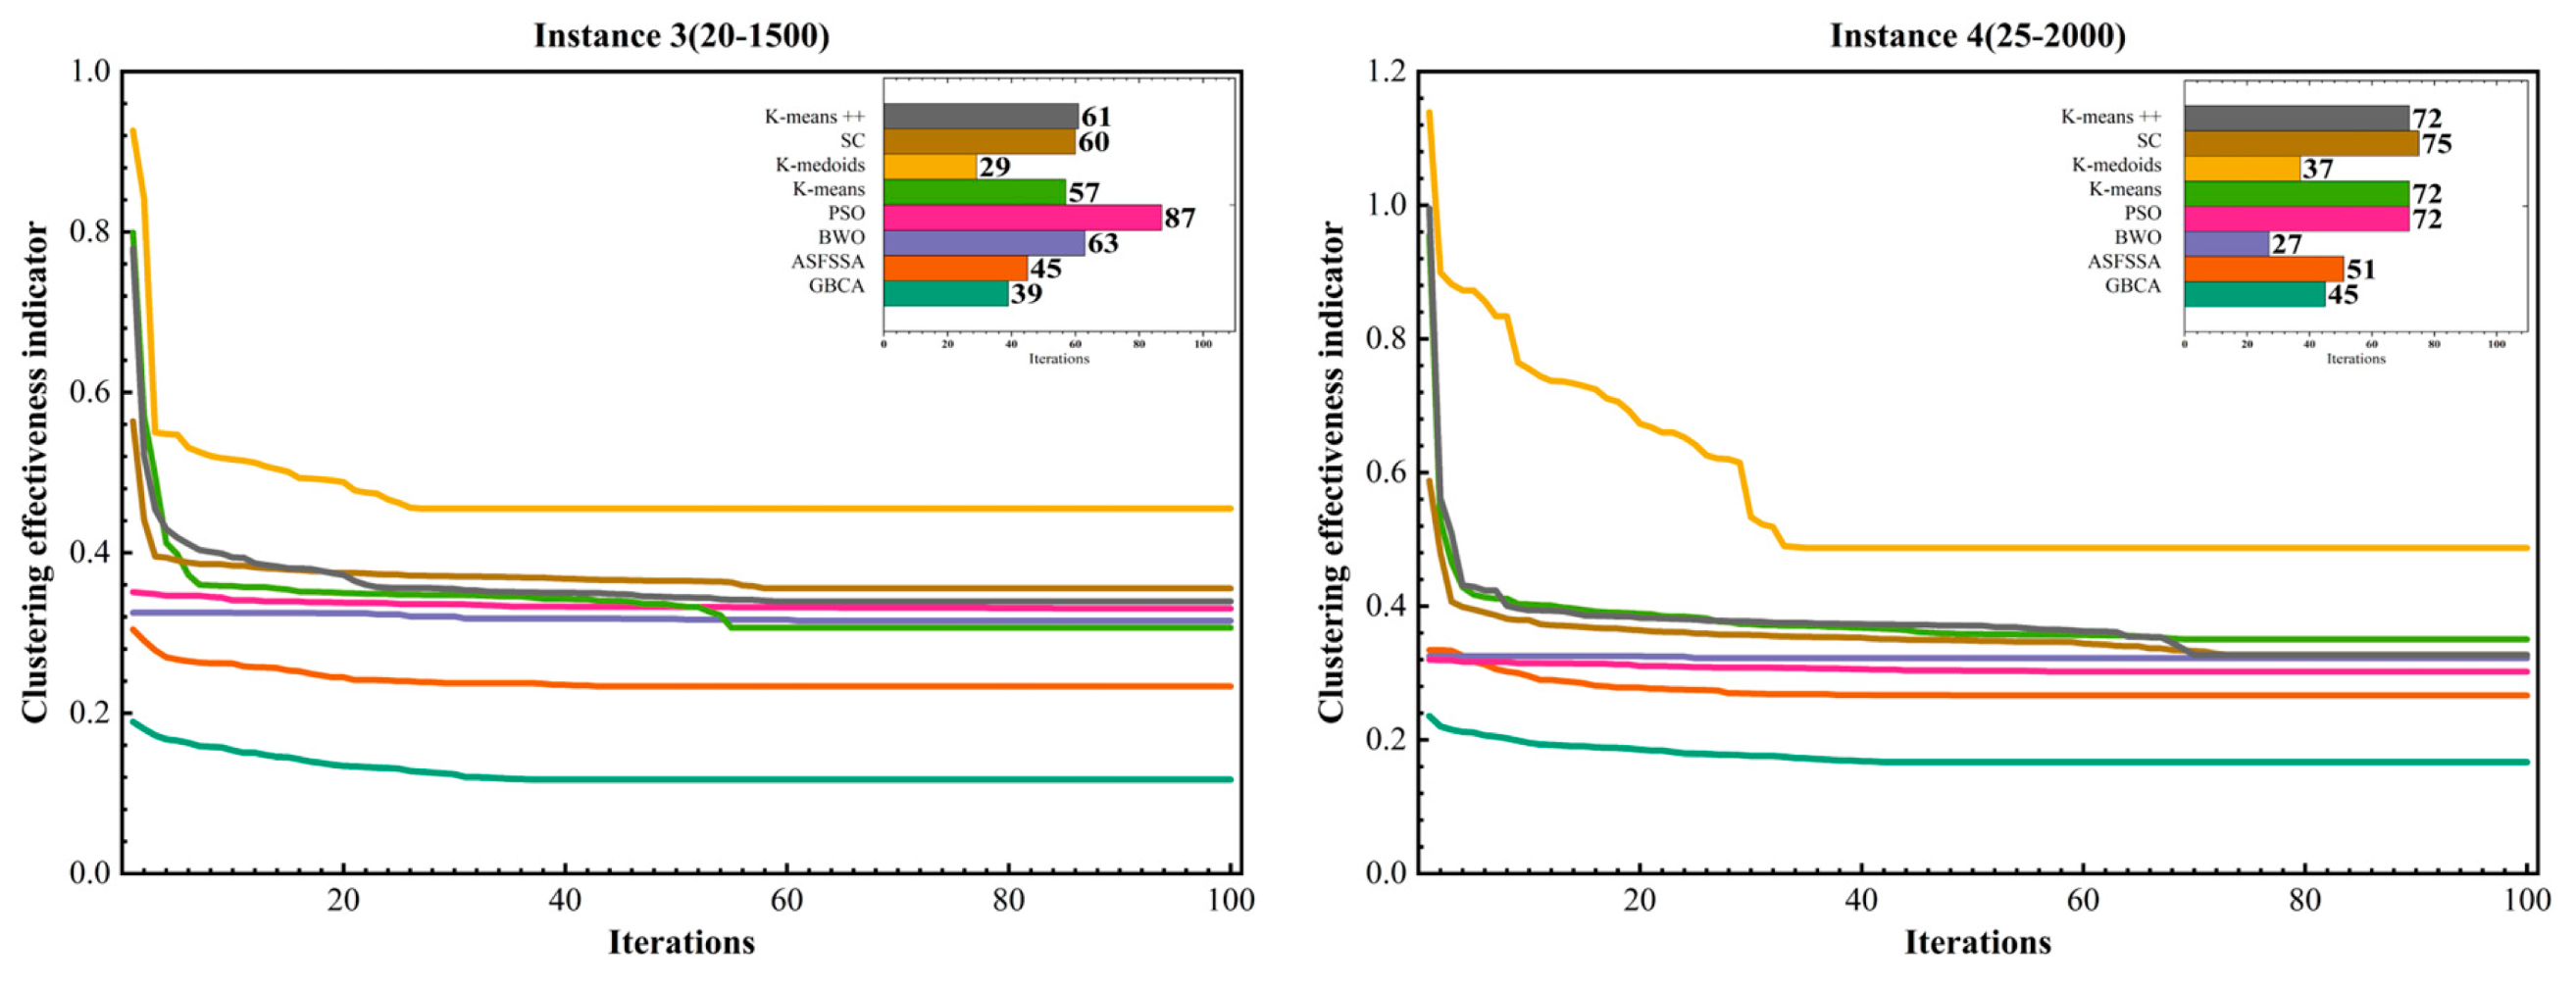
Figure 10 shows the convergence behavior of GBCA, ASFSSA, BWO, PSO, K-means, K-medoids, SC, and K-means++ clustering algorithms. The main plots depict the objective function value versus the number of iterations for datasets of four different sizes, while the top-right bar chart compares the number of iterations each algorithm requires to reach convergence (defined as the point where the objective function value stabilizes). As can be seen from the graphs, the proposed GBCA exhibits good convergence speed on all datasets, reaching a steady state in about 40 iterations. Compared with other heuristic algorithms (e.g., PSO, BWO, ASFSSA), GBCA achieves a competitive convergence rate, often requiring fewer iterations than PSO and BWO, as illustrated by the bar chart, while its convergence curve is smoother and decreases at a uniform rate. This indicates that its optimization mechanism efficiently adapts to increasing data size.
Figure 10.
Convergence behavior and iteration counts of clustering algorithms.
Although some traditional clustering methods converge faster in terms of iteration number, they are extremely sensitive to the initial cluster center, so their convergence curves fluctuate greatly on datasets of different sizes, and they stop updating the partition result early after converging, without further optimization of the objective function, which makes them easily fall into local optima, and the final clustering effectiveness indicator is much worse than GBCA. In contrast, GBCA can continuously improve clustering quality during the iteration process and has obvious advantages in optimizing the objective function, delivering more stable and better clustering results.
Table 12, Table 13, Table 14 and Table 15 show the improvement of the proposed algorithm over the comparison algorithm in terms of the objective function and individual metrics. It can be seen that the GBCA improves by 63.16%, by 0.89%, by 56.67% and by 33.64% compared with the comparison algorithms on average. In terms of individual indicators, the average predicted benefits of task units calculated by the comparison algorithm and GBCA are closer, but the performance difference between the heuristic clustering algorithm and the traditional clustering algorithm is significant in terms of the indicators of scale equalization and benefit value equalization.
Table 12.
Improvements in the clustering effectiveness indicator of the proposed algorithm over other algorithms (%).
Table 13.
Improvements in of the proposed algorithm over other algorithms (%).
Table 14.
Improvements in of the proposed algorithm over other algorithms (%).
Table 15.
Improvements in of the proposed algorithm over other algorithms (%).
As can be seen in these tables, the traditional clustering algorithm takes distance minimization as the core objective and directly constrains the sample partition through iterative optimization, which tends to generate clusters of similar sizes and performs better in the size equilibrium indicator. The heuristic algorithm supports explicit constraints through global random search and thus performs better in the benefit value equalization indicator. The GBCA combines the advantages of global optimization search and the weighted objective function of the heuristic algorithm, and sets explicit constraints for size equalization and benefit value equalization to avoid degradation of the equalization indicator. It can effectively solve the needs of business scenarios of task unit partition and realize scale stability and benefit balance maximization.
4. Discussion
To address the multi-objective optimization challenge in cruise itinerary planning, this study proposes a novel hybrid optimization framework integrating Genetic Balanced Clustering Algorithm (GBCA), Kernel Principal Component Analysis (KPCA), Adaptive Spiral Flying Sparrow Search Algorithm (ASFSSA), and Kernel Extreme Learning Machine (KELM). The framework initiates with KPCA for nonlinear feature extraction from passenger preference data, followed by a dynamic mechanism that allocates venue capacities based on group preferences. The core predictive capability is provided by a KELM model, whose parameters are optimized using the bio-inspired ASFSSA metaheuristic. The predicted itinerary quality is then embedded into a composite fitness function to guide the GBCA in iteratively refining the task unit partition, balancing benefit maximization, load fairness, and unit size equilibrium.
The proposed framework was rigorously evaluated through comprehensive experiments conducted on simulated datasets of varying scales (500 to 2500 passengers, 10 to 25 venues). A systematic performance comparison was performed against seven established clustering algorithms, including ASFSSA, PSO, BWO, K-means, K-medoids, SC, and K-means++. The experimental results demonstrate that the proposed framework achieves superior performance both quantitatively and statistically. Specifically, GBCA improves the composite fitness by an average of 63.16% across all datasets compared to the seven baseline algorithms, with the most significant improvement reaching 92.73% on Instance 1 against K-medoids. In terms of individual objectives, GBCA achieves 0.89% higher average predicted benefit (), 56.67% better task unit size equalization (), and 33.64% improvement in benefit equalization () compared to the baseline average. Furthermore, the Wilcoxon signed-rank test confirms that all performance improvements are statistically significant, indicating that the observed advantages are not attributable to random variation. Convergence analysis further reveals that GBCA reaches a steady state within approximately 40 iterations, demonstrating a competitive convergence rate while maintaining smoother and more stable convergence curves than heuristic alternatives.
In summary, this research presents a cohesive methodology that effectively couples data-driven prediction with bio-inspired optimization. The proposed framework demonstrates a scalable and intelligent approach to resolving the conflict between personalized service and constrained resources in complex scheduling problems, showcasing the practical synergy of bio-inspired data-driven methodologies in engineering optimization.
Finally, it should be noted that the current study is based on synthetic data; while the generation process was grounded in realistic cruise parameters, future validation of the model’s generalizability in real-world cruise operation scenarios is needed to confirm its practical efficacy and robustness under actual operational conditions. Future work could also explore adaptations of deep clustering methods to the task unit partition problem, potentially by integrating the predictive and capacity allocation modules proposed in this study into their frameworks. Additionally, further research should investigate reinforcement learning for real-time task unit adjustment and collaborative multi-ship planning under sustainability constraints. This work provides theoretical support and technical solutions for large-scale resource allocation problems in smart tourism, and its potential applications can be extended to other domains that require multi-objective optimization in constrained environments.
Author Contributions
Conceptualization, Z.Z.; methodology, Z.Z. and J.L.; software, Z.Z.; validation, Z.Z.; formal analysis, Z.Z. and D.S.; investigation, Z.Z. and D.S.; resources, J.L.; data curation, J.L.; writing—original draft preparation, Z.Z.; writing—review and editing, Z.Z., J.L. and D.S.; visualization, Z.Z. All authors have read and agreed to the published version of the manuscript.
Funding
This research was funded by the Ministerial Civil Ship Research Project of China (Grant number [2019]331).
Institutional Review Board Statement
Not applicable.
Informed Consent Statement
Not applicable.
Data Availability Statement
The data presented in this study are available on request from the corresponding author.
Conflicts of Interest
The authors declare no conflicts of interest.
References
- Sun, Y.; Song, H.; Jara, A.J.; Bie, R. Internet of Things and Big Data Analytics for Smart and Connected Communities. IEEE Access 2016, 4, 766–773. [Google Scholar] [CrossRef] [Scilit]
- State of the Cruise Industry Report 2025. Available online: https://cruising.org/sites/default/files/2025-05/State%20of%20the%20Cruise%20Industry%20Report%202025.pdf (accessed on 17 March 2026).
- Zhang, J.; Wu, T.; Fan, Z. Research on Precision Marketing Model of Tourism Industry Based on User’s Mobile Behavior Trajectory. Mob. Inf. Syst. 2019, 2019, 6560848. [Google Scholar] [CrossRef] [Scilit]
- Li, J.; Zhang, Z.; Song, D.; Yang, B.; Zhou, L. Cruise Onboard Itinerary Planning for Multi Passengers with Service Venue Capacity and Time-Window Constraints. Comput. Oper. Res. 2025, 176, 106944. [Google Scholar] [CrossRef] [Scilit]
- Luo, X.; Liu, X.; Ji, P.; Shang, X.; Zhang, Z. Trip Planning for Visitors in a Service System with Capacity Constraints. Comput. Oper. Res. 2022, 148, 105974. [Google Scholar] [CrossRef] [Scilit]
- Herzog, D. Recommending a Sequence of Points of Interest to a Group of Users in a Mobile Context. In RecSys ′17: Proceedings of the Eleventh ACM Conference on Recommender Systems, Como, Italy, 27–31 August 2017; Association for Computing Machinery (ACM): New York, NY, USA, 2017; pp. 402–406. [Google Scholar] [CrossRef] [Scilit]
- Huang, T.; Gong, Y.J.; Zhang, Y.H.; Zhan, Z.H.; Zhang, J. Automatic Planning of Multiple Itineraries: A Niching Genetic Evolution Approach. IEEE Trans. Intell. Transp. Syst. 2019, 21, 4225–4240. [Google Scholar] [CrossRef] [Scilit]
- Ruiz Meza, J.; Montoya Torres, J.R. Tourist Trip Design with Heterogeneous Preferences, Transport Mode Selection and Environmental Considerations. Ann. Oper. Res. 2021, 305, 227–249. [Google Scholar] [CrossRef] [Scilit]
- Ruiz Meza, J.; Brito, J.; Montoya Torres, J.R. A GRASP-VND Algorithm to Solve the Multi-Objective Fuzzy and Sustainable Tourist Trip Design Problem for Groups. Appl. Soft Comput. 2022, 131, 109716. [Google Scholar] [CrossRef] [Scilit]
- Macqueen, J. Some Methods for classification and analysis of multivariate observation. In Proceedings of the Fifth Berkeley Symposium on Mathematical Statistics and Probability; University of California Press: Oakland, CA, USA, 1967. [Google Scholar]
- Duan, L.; Xu, L.; Guo, F.; Lee, J.; Yan, B. A Local-Density Based Spatial Clustering Algorithm with Noise. Inf. Syst. 2007, 32, 978–986. [Google Scholar] [CrossRef] [Scilit]
- Ikotun, A.M.; Ezugwu, A.E.; Abualigah, L.; Abuhaija, B.; Heming, J. K-Means Clustering Algorithms: A Comprehensive Review, Variants Analysis, and Advances in the Era of Big Data. Inf. Sci. 2023, 622, 178–210. [Google Scholar] [CrossRef] [Scilit]
- Nepal, B.; Yamaha, M.; Sahashi, H.; Yokoe, A. Analysis of Building Electricity Use Pattern Using K-Means Clustering Algorithm by Determination of Better Initial Centroids and Number of Clusters. Energies 2019, 12, 2451. [Google Scholar] [CrossRef] [Scilit]
- Zhang, G.; Li, Y.; Deng, X. K-Means Clustering-Based Electrical Equipment Identification for Smart Building Application. Information 2020, 11, 27. [Google Scholar] [CrossRef] [Scilit]
- Calinski, T.; Harabasz, J. A Dendrite Method for Cluster Analysis. Commun. Stat. Theory Methods 1974, 3, 1–27. [Google Scholar] [CrossRef] [Scilit]
- Davies, D.L.; Bouldin, D.W. A Cluster Separation Measure. IEEE Trans. Pattern Anal. Mach. Intell. 1979, PAMI-1, 224–227. [Google Scholar] [CrossRef] [Scilit]
- Dunn, J.C. A Fuzzy Relative of the ISODATA Process and Its Use in Detecting Compact Well-Separated Clusters. J. Cybern. 1973, 3, 32–57. [Google Scholar] [CrossRef] [Scilit]
- Yang, S.; Li, K.; Liang, Z.; Li, W.; Xue, Y. A Novel Cluster Validity Index for Fuzzy C-Means Algorithm. Soft Comput. A Fusion Found. Methodol. Appl. 2018, 22, 1921–1931. [Google Scholar]
- Zhou, S.; Xu, Z.; Liu, F. Method for Determining the Optimal Number of Clusters Based on Agglomerative Hierarchical Clustering. IEEE Trans. Neural Netw. Learn. Syst. 2017, 28, 3007–3017. [Google Scholar] [CrossRef] [Scilit]
- Starczewski, A. A New Validity Index for Crisp Clusters. Pattern Anal. Appl. 2017, 20, 687–700. [Google Scholar] [CrossRef] [Scilit]
- Sett, S.K.; Hazra, S.; Ghosh, A. A Fuzzy Clustering Algorithm Influenced by Validity Indices (FCVI) for Recognizing the Differentially Expressed Cancer Mediating Genes. Meta Gene 2020, 23, 100615. [Google Scholar] [CrossRef] [Scilit]
- Liang, D.Y. Cluster Validity Index for Irregular Clustering Results. Appl. Soft Comput. 2020, 95, 106583. [Google Scholar] [CrossRef] [Scilit]
- Kumar, Y.; Sahoo, G. A Hybrid Data Clustering Approach Based on Improved Cat Swarm Optimization and K-Harmonic Mean Algorithm. AI Commun. 2015, 28, 751–764. [Google Scholar] [CrossRef] [Scilit]
- Kumar, Y.; Kaur, A. Variants of Bat Algorithm for Solving Partitional Clustering Problems. Eng. Comput. 2022, 38, 1973–1999. [Google Scholar] [CrossRef] [Scilit]
- Menéndez, H.D.; Otero, F.E.B.; Camacho, D. Medoid-Based Clustering Using Ant Colony Optimization. Swarm Intell. 2016, 10, 123–145. [Google Scholar] [CrossRef] [Scilit]
- Hatamlou, A. Black Hole: A New Heuristic Optimization Approach for Data Clustering. Inf. Sci. 2013, 222, 175–184. [Google Scholar] [CrossRef] [Scilit]
- Senthilnath, J.; Omkar, S.N.; Mani, V. Clustering Using Firefly Algorithm: Performance Study. Swarm Evol. Comput. 2011, 1, 164–171. [Google Scholar] [CrossRef] [Scilit]
- Yan, X.; Zhu, Y.; Zou, W.; Wang, L. A New Approach for Data Clustering Using Hybrid Artificial Bee Colony Algorithm. Neurocomputing 2012, 97, 241–250. [Google Scholar] [CrossRef] [Scilit]
- Alshamiri, A.K.; Singh, A.; Surampudi, B.R. Artificial Bee Colony Algorithm for Clustering: An Extreme Learning Approach. Soft Comput. 2016, 20, 3163–3176. [Google Scholar] [CrossRef] [Scilit]
- Kushwaha, N.; Pant, M.; Kant, S.; Jain, V.K. Magnetic Optimization Algorithm for Data Clustering. Pattern Recognit. Lett. 2018, 115, 59–65. [Google Scholar] [CrossRef] [Scilit]
- Han, X.; Quan, L.; Xiong, X.; Almeter, M.; Xiang, J.; Lan, Y. A Novel Data Clustering Algorithm Based on Modified Gravitational Search Algorithm. Eng. Appl. Artif. Intell. 2017, 61, 1–7. [Google Scholar] [CrossRef] [Scilit]
- Siddiqi, U.F.; Sait, S.M. A New Heuristic for the Data Clustering Problem. IEEE Access 2017, 5, 6801–6812. [Google Scholar] [CrossRef] [Scilit]
- Ganguly, D. A Fast Partitional Clustering Algorithm Based on Nearest Neighbours Heuristics. Pattern Recognit. Lett. 2018, 112, 198–204. [Google Scholar] [CrossRef] [Scilit]
- Ahmadi, R.; Ekbatanifard, G.; Bayat, P. A Modified Grey Wolf Optimizer Based Data Clustering Algorithm. Appl. Artif. Intell. 2021, 35, 63–79. [Google Scholar] [CrossRef] [Scilit]
- Singh, H.; Kumar, Y.; Kumar, S. A New Meta-Heuristic Algorithm Based on Chemical Reactions for Partitional Clustering Problems. Evol. Intel. 2019, 12, 241–252. [Google Scholar] [CrossRef] [Scilit]
- Lu, X.; Wang, Q.; Xie, B.; Zhu, J. A KPCA-ISSA-SVM Hybrid Model for Identifying Sources of Mine Water Inrush Using Hydrochemical Indicators. Water 2025, 17, 2859. [Google Scholar] [CrossRef] [Scilit]
- Ouyang, C.; Qiu, Y.; Zhu, D. Adaptive Spiral Flying Sparrow Search Algorithm. Sci. Program. 2021, 2021, 1–16. [Google Scholar] [CrossRef] [Scilit]
- Chen, X.; Huang, X.; Zhu, D.; Qiu, Y. Research on Chaotic Flying Sparrow Search Algorithm. J. Phys. Conf. Ser. 2021, 1848, 012044. [Google Scholar] [CrossRef] [Scilit]
- Gao, Y.; Zhang, H.; Duan, Y.; Zhang, H. A Novel Hybrid PSO Based on Levy Flight and Wavelet Mutation for Global Optimization. PLoS ONE 2023, 18, e0279572. [Google Scholar] [CrossRef] [Scilit] [PubMed]
- Mirjalili, S.; Lewis, A. The Whale Optimization Algorithm. Adv. Eng. Softw. 2016, 95, 51–67. [Google Scholar] [CrossRef] [Scilit]
- Shami, T.M.M.; Mirjalili, S.; Al-Eryani, Y.; Daoudi, K.; Izadi, S.; Abualigah, L. Velocity Pausing Particle Swarm Optimization: A Novel Variant for Global Optimization. Neural Comput. Appl. 2023, 35, 9193–9223. [Google Scholar] [CrossRef] [Scilit]
- Wang, K.; Li, K.; Du, F.; Zhang, X.; Wang, Y.; Sun, J. Research on Prediction Model of Coal Spontaneous Combustion Temperature Based on SSA-CNN. Energy 2024, 290, 130158. [Google Scholar] [CrossRef] [Scilit]
- de Campos Souza, P.V.; Sayyadzadeh, I. GWO-FNN: Fuzzy Neural Network Optimized via Grey Wolf Optimization. Mathematics 2025, 13, 1156. [Google Scholar] [CrossRef] [Scilit]
- Liu, Y.; Wang, W.; Zhao, X.; Zhao, S.; Zou, L.; Wang, C. Acoustic Signal-Based Wear Monitoring for Belt Grinding Tools with Pyramid-Structured Abrasives Using BO-KELM. Comput. Ind. 2025, 166, 104235. [Google Scholar] [CrossRef] [Scilit]
- Samantaray, S.; Sahoo, A. Groundwater Level Prediction Using an Improved ELM Model Integrated with Hybrid Particle Swarm Optimisation and Grey Wolf Optimisation. Groundw. Sustain. Dev. 2024, 26, 101178. [Google Scholar] [CrossRef] [Scilit]
- Lai, X.; Tu, Y.; Yan, B.; Wu, L.; Liu, X. A Method for Predicting Ground Pressure in Meihuajing Coal Mine Based on Improved BP Neural Network by Immune Algorithm-Particle Swarm Optimization. Processes 2024, 12, 147. [Google Scholar] [CrossRef] [Scilit]
- Sherstinsky, A. Fundamentals of Recurrent Neural Network (RNN) and Long Short-Term Memory (LSTM) Network. Phys. D 2020, 404, 132306. [Google Scholar] [CrossRef] [Scilit]
- Iam-On, N.; Boongoen, T.; Garrett, S.; Price, C. A Link-Based Approach to the Cluster Ensemble Problem. IEEE Trans. Pattern Anal. Mach. Intell. 2011, 33, 2396–2409. [Google Scholar] [CrossRef] [Scilit]
- Zhao, Z.; Liu, C.; Wang, J.; Luo, J.; Wang, Z.; Wu, Z.; He, C.; Jiao, Z. Intelligent Optimization Control of Plate Plan-View Pattern Based on Intermediate Slab Pattern Vision Inspection and BWO-DNN Algorithm. Materials 2025, 18, 3038. [Google Scholar] [CrossRef] [Scilit]
- Handrizal; Hayatunnufus; Nababan, M.C.D. Improving Road Safety in Indonesia: A Clustering Analysis of Traffic Accidents Using K-Medoids. Int. J. Adv. Comput. Sci. Appl. 2025, 16, 589–594. [Google Scholar] [CrossRef] [Scilit]
- Jia, H.; Ding, S.; Xu, X.; Nie, R. The Latest Research Progress on Spectral Clustering. Neural Comput. Appl. 2014, 24, 1477–1486. [Google Scholar] [CrossRef] [Scilit]
- Vardakas, G.; Likas, A. Global K-Means++: An Effective Relaxation of the Global k-Means Clustering Algorithm. Appl. Intell. 2024, 54, 8876–8888. [Google Scholar] [CrossRef] [Scilit]

Disclaimer/Publisher’s Note: The statements, opinions and data contained in all publications are solely those of the individual author(s) and contributor(s) and not of MDPI and/or the editor(s). MDPI and/or the editor(s) disclaim responsibility for any injury to people or property resulting from any ideas, methods, instructions or products referred to in the content. |
© 2026 by the authors. Licensee MDPI, Basel, Switzerland. This article is an open access article distributed under the terms and conditions of the Creative Commons Attribution (CC BY) license.