


Abstract
Hot-spot analysis identifies high-crash locations, whereas systemic analysis identifies recurring crash and facility characteristics across a network. This study introduces multidimensional fatality profiles as a descriptive bridge between those levels by grouping deaths into recurring combinations that agencies can subsequently map, diagnose, and connect to treatments. Fatality Analysis Reporting System records from 33 U.S. Vision Zero cities and 31 contextual benchmark cities (2010–2023) were classified by road-user group, functional class, junction context, and lighting. The primary equal-city analysis used two-year windows around verified formal-adoption or state-based pseudo-adoption years and included 12,454 fatalities. In Vision Zero cities, the 10 leading profiles accounted for 47.3% of fatalities before adoption and 51.6% after adoption, and nine pre-adoption top-10 profiles remained in the post-adoption top 10. Absolute fatalities increased from 4342 to 5081 in the selected Vision Zero windows and from 1339 to 1692 in benchmark windows; these counts are not exposure-adjusted and do not estimate policy effects. Benchmark cities showed a larger increase in concentration in the primary two-year window, but the relative direction varied across alternative windows. The results identify recurring fatality contexts for local investigation. This descriptive comparison did not establish a distinct post-adoption concentration pattern for Vision Zero cities.
1. Introduction
Vision Zero is a municipal policy commitment that treats traffic deaths and serious injuries as preventable system failures rather than unavoidable consequences of mobility. Its ethical and operational foundations emphasize shared responsibility, safe speeds, forgiving road design, safer vehicles, and protection for people who make mistakes [1,2,3,4]. The Safe System approach is the broader substantive framework through which these principles are translated into coordinated action across road design, speed management, vehicles, post-crash care, and institutional responsibility. In the United States, the National Roadway Safety Strategy adopted this framework nationally, but cities retain different administrative structures, funding processes, and implementation programs [3].
For this study, formal Vision Zero adoption means a documented citywide act—such as a council resolution, mayoral or executive directive, adopted policy, or explicit official commitment—that publicly establishes elimination of traffic deaths and serious injuries as a city goal. The common element is the governmental commitment, not a standardized certification or treatment package. Formal adoption is therefore not equivalent to implementation: it does not establish when countermeasures were funded, installed, or operated at scale. U.S. initiatives vary in organizational structure, stakeholder participation, action-plan content, analytic capacity, expenditures, and delivery of countermeasures [5,6,7]. The adoption year is consequently used here only as a transparent event anchor for descriptive comparison, not as the onset of a uniform intervention.
Most outcome evaluations remain organized around a single dimension at a time: total deaths, mode-specific fatalities, nighttime fatalities, intersections, roadway class, or spatial hot spots. Those lenses are useful but incomplete because fatal events arise from combinations of people, facilities, conflict environments, and visibility conditions. For example, a pedestrian fatality on an arterial away from an intersection in darkness presents a different intervention problem from a motor-vehicle-occupant fatality on a freeway interchange in daylight. National hot-spot research similarly shows that severe pedestrian outcomes cluster in combinations of high-speed, multilane, commercial, and exposure-related contexts rather than in one isolated attribute [8]. Corridor-level evaluations also show that safety effects depend on the location and treatment package [9,10].
Hot-spot and systemic analyses operate at different levels. Hot-spot methods identify specific locations with high observed crash concentrations [8,9], whereas the Federal Highway Administration describes systemic safety analysis as an aggregate, risk-based process that identifies recurring focus crash types, facility types, and roadway characteristics and deploys countermeasures across locations sharing those characteristics [11]. Multidimensional profiles sit between these levels: they do not identify a particular segment or causal mechanism, but they define recurring classes such as pedestrian-arterial-non-junction-dark conditions that can be mapped and investigated locally. This creates a complementary descriptive question for Vision Zero: how much of the observed fatality burden is concentrated in a manageable number of recurring joint contexts?
Concentration and distributional-change measures provide a transparent way to examine concentration-based prioritization potential. Cumulative top-profile coverage measures the share captured by the most prevalent combinations. Shannon entropy and its exponential transformation summarize how many equally common profiles would produce the observed diversity [12,13]. Jensen-Shannon divergence provides a bounded, symmetric measure of how much two observed profile distributions differ, including when some combinations are absent in one period [14]. These tools are descriptive: they quantify the composition and recurrence of observed fatalities, not exposure-adjusted risk, common causal mechanisms, treatment effectiveness, or causal policy effects.
This study applies that framework to person-level fatality records from 33 Vision Zero cities and 31 same-state contextual benchmark cities between 2010 and 2023. Unlike prior analyses of this city sample that examined overall outcomes, age, nighttime conditions, vehicle classes, or separate roadway-context dimensions, the outcome here is the joint distribution and concentration of fatality profiles. The study addresses four questions: (1) How concentrated was the fatality burden across multidimensional profiles before and after Vision Zero adoption? (2) Which profiles were most prevalent and how stable were their rankings? (3) Did changes in concentration and profile composition differ descriptively from same-state benchmark cities? (4) Were the conclusions sensitive to weighting, event-window definition, and exclusion of the 2020–2021 pandemic period?
2. Materials and Methods
2.1. Study Design and Estimand
The study used a descriptive, repeated cross-sectional before-after design. The estimand was the distribution of people killed across recurring joint fatality profiles, not the probability of death among exposed road users. Concentration-based prioritization potential refers narrowly to the degree to which the observed fatality burden is concentrated in a small number of interpretable profiles. It is a screening construct rather than a validated measure of treatability: a concentrated profile may still contain heterogeneous mechanisms and must be linked to locations, contributing factors, exposure, and suitable countermeasures before action. The construct does not imply that a profile is causally high risk, that a particular treatment will be effective, or that Vision Zero adoption caused changes in concentration.
2.2. Data Source and City Samples
Person-level records were obtained from the National Highway Traffic Safety Administration Fatality Analysis Reporting System (FARS), a census of fatal injuries in motor-vehicle traffic crashes on public trafficways in the United States [15]. The analytic files covered calendar years 2010–2023 and had already been harmonized to stable city-proper identifiers. All included records had fatal injury severity. The Vision Zero sample contained 33 cities with a verified formal citywide policy, resolution, executive directive, or explicit official commitment. The 31 non-Vision-Zero cities are described as contextual benchmarks rather than controls. They were selected in the same represented states where possible, with stable city coding, at least 50 fatality records during 2010–2023, and observations on both sides of the assigned pseudo-year. They were not matched on population, density, roadway supply, travel patterns, baseline fatality rates, or pre-adoption trends and are not treated as exchangeable causal counterfactuals. Washington, DC had no same-state benchmark.
The full files contained 32,157 fatalities in Vision Zero cities and 10,985 in benchmark cities. The primary symmetric two-year event window contained 4342 Vision Zero fatalities before and 5081 after adoption, and 1339 benchmark fatalities before and 1692 after the pseudo-year. Records were analyzed at the fatal-person level. A crash with multiple deaths therefore contributed one record per decedent, consistent with the study outcome of fatality burden rather than crash frequency.
2.3. Verified Adoption Years, Pseudo-Years, and Event Windows
Adoption year was defined as the first verified formal citywide commitment rather than task-force formation, a preliminary presentation, later network membership, or publication of a subsequent action plan. The city-specific years used for the numerical analysis are listed in Table A1 and serve as the fixed anchors for the reported event windows. The anchor marks governmental commitment; it does not establish when countermeasures were funded, installed, or operated. For each benchmark city, the pseudo-year was the median verified adoption year among Vision Zero cities in the same state; a midpoint between years was rounded upward, and a state with one Vision Zero city used that city’s adoption year. The pseudo-year is a reproducible calendar anchor, not a policy event or matched causal counterfactual.
The primary window included event years −2 and −1 as Before and +1 and +2 as After; the adoption or pseudo-adoption year was excluded as a transition year. The symmetric window was chosen to keep calendar coverage comparable across cities and reduce imbalance from the different adoption years, while recognizing that two years may be unstable for low-count cities and may be too short for implementation effects. Robustness was therefore examined with symmetric three-year windows (−3 to −1 and +1 to +3), all available pre/post years excluding the anchor year, and the symmetric three-year window after removing calendar years 2020 and 2021 without replacement. These alternatives evaluate descriptive stability; they do not substitute for an interrupted time-series or staggered event study with verified implementation timing.
2.4. Construction of Multidimensional Fatality Profiles
Each fatality was assigned to one mutually exclusive profile formed by the cross-product of four harmonized dimensions: road-user group, roadway functional class, junction context, and lighting context (Table 1). The resulting design allowed up to 320 combinations (4 × 5 × 4 × 4). Across the full 2010–2023 data, 244 combinations were observed; 205 appeared in the primary event window. Year-specific FARS labels were harmonized before constructing the profiles. Unknown or unclassified values were retained within explicitly labeled combined categories rather than deleted, preserving the full fatality denominator but preventing a separate interpretation of unlighted conditions from unknown lighting status. Table 1 documents the analytic categories and harmonization rules; the year-specific crosswalk and analysis code are identified in the Data Availability Statement.
Table 1.
Dimensions used to construct the joint fatality profiles.
2.5. Concentration, Persistence, and Distributional Change
For each city and period, profile counts were divided by that city-period’s total fatalities. The primary equal-city distribution was the arithmetic mean of these city-specific share vectors, giving every city the same influence regardless of fatality volume. This estimand represents the average city pattern rather than the average fatality pattern, but proportions from low-count city-periods can be unstable. We therefore report the city and fatality totals in Table 2, interpret equal-city estimates descriptively, and repeat the principal analysis with pooled fatality weighting so that results can be assessed under the alternative population-level estimand.
Table 2.
Primary two-year event-window sample.
Five complementary concentration measures were calculated. Top-5 and top-10 coverage were the sums of the five or ten largest profile shares. N50 and N80 were the minimum numbers of ranked profiles needed to account for at least 50% and 80% of fatalities. Shannon entropy was calculated as H = −sum(p_k ln p_k), and the effective number of profiles was N_eff = exp(H), which is the number of equally common profiles that would yield the observed entropy [13,14]. The Herfindahl-Hirschman index (HHI) was sum(p_k squared); larger values indicate greater concentration.
Profile persistence was summarized by fixing the pre-adoption top-10 set and counting how many of those profiles remained in the post-adoption top 10, together with the Jaccard overlap of the two sets. Jensen-Shannon divergence was calculated in bits as JSD(P,Q) = 0.5 KL(P||M) + 0.5 KL(Q||M), where M = (P + Q)/2 [15]. A value of zero indicates identical observed distributions and larger values indicate greater observed redistribution. Because JSD is non-negative, upward-biased in sparse samples, and sensitive to unequal sample sizes, it was treated as a descriptive distance. No hypothesis test or causal comparison was made between the Vision Zero and benchmark JSD values. For a fixed-membership sensitivity analysis, the 10 leading pre-adoption profiles were retained when calculating post-adoption coverage. To assess ranking variability, 10,000 paired city-bootstrap draws recalculated the post-adoption top-10 set; the inclusion frequency of each observed leading profile is descriptive.
For each concentration measure, the after-minus-before change was calculated separately for Vision Zero and benchmark cities. The descriptive comparative estimand was the Vision Zero change minus the benchmark change. This difference-in-change notation is used only to summarize relative redistribution; it is not interpreted as a causal difference-in-differences effect because policy adoption was not randomized, the benchmark cities were not exchangeable controls, and no parallel-trends assumption was established.
2.6. Uncertainty and Sensitivity Analysis
Uncertainty for concentration changes was summarized using 10,000 nonparametric city-level bootstrap replications with seed 20260901 [16]. Cities were resampled with replacement within the Vision Zero and benchmark groups, and the same sampled city indices were applied to each city’s before and after distributions to preserve pairing. Percentile 95% intervals were calculated for within-group changes and the difference in change. Profile-level intervals were generated only as descriptive aids; no multiplicity adjustment was applied, and rank positions were not treated as statistically fixed or confirmatory. To examine sensitivity of JSD to unequal fatal-person totals, we additionally drew 2000 simple random samples without replacement of 1339 fatalities from each group-period and recalculated pooled fatality-weighted JSD. We report the median and 2.5th–97.5th percentile range of these resamples as conditional sampling summaries, not as city-level confidence intervals or tests of a Vision Zero effect. Equal-size pooling changes the weighting estimand and does not establish comparable exposure or implementation. Analyses were conducted in Python 3 using pandas and NumPy, and figures were produced with matplotlib and seaborn.
3. Results
3.1. Sample and Overall Profile Concentration
The primary analysis included 12,454 fatal-person records across 64 cities (Table 2). In the selected two-year windows, absolute fatalities increased from 4342 before to 5081 after formal adoption in Vision Zero cities (+739; +17.0%) and from 1339 to 1692 around pseudo-years in contextual benchmark cities (+353; +26.4%). These unadjusted counts describe the fatality burden; they are not exposure-adjusted risk estimates. Vision Zero cities contributed 75.7% of all records, reflecting the presence of several large cities. Equal-city weighting was used for the primary city-level description so that Los Angeles, New York City, Houston, and other high-volume jurisdictions did not dominate; pooled weighting was examined separately. At the city-period level, the Vision Zero median was 74 deaths before (IQR 44–161; range 14–570) and 90 after (IQR 58–196; range 23–623); one city-period before and none after had fewer than 20 deaths. The contextual benchmark median was 36 before (IQR 14–46.5; range 4–274) and 35 after (IQR 18.5–65; range 6–285); 12 city-periods before and nine after had fewer than 20 deaths. These distributions document the low-count problem for equal-city weighting.
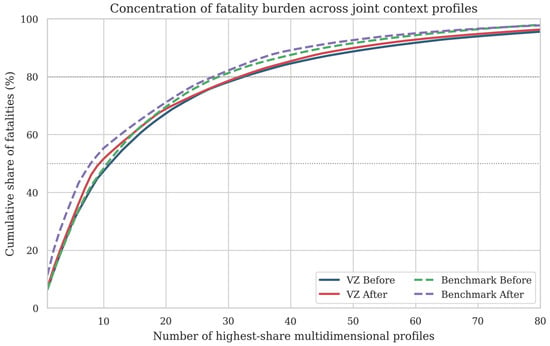
Figure 1 shows the cumulative concentration of the equal-city fatality burden across ranked multidimensional profiles for Vision Zero and benchmark cities before and after the reference year. In Vision Zero cities, the top five profiles accounted for 29.6% of the equal-city burden before adoption and 30.8% after adoption. Top-10 coverage increased from 47.3% to 51.6%, a change of +4.27 percentage points (95% city-bootstrap interval, +0.30 to +7.88) (Figure 1). N50 declined from 12 profiles to 10, while N80 declined from 33 to 32. The effective number of profiles declined from 53.6 to 49.5, and HHI increased from 0.0301 to 0.0334. Together, the measures indicate a modest post-adoption increase in concentration rather than a broad collapse into only a few profile types (Table 3).
Figure 1.
Cumulative equal-city coverage of ranked multidimensional fatality profiles in the primary two-year window. Horizontal guides mark 50% and 80% coverage. Rankings are recalculated for each group and period.
Table 3.
Equal-city changes in profile-concentration measures, estimate [95% city-bootstrap interval].
3.2. Persistence and Identity of the Leading Profiles
The observed rank structure was persistent. Nine of the 10 leading pre-adoption Vision Zero profiles remained in the post-adoption top 10, producing a top-10 Jaccard overlap of 0.818. The only new post-adoption top-10 profile was pedestrian fatalities on arterials in non-junction/other contexts under dark-unlighted/unknown conditions. This profile rose from rank 15 to rank 10 but changed by only +0.34 percentage points. Because many possible profiles had small shares, these ranks are descriptive and should not be interpreted as statistically certain; the persistence statistic is based on the fixed pre-adoption top-10 membership rather than treating each period’s ranking as a stable parameter. Holding the pre-adoption top-10 membership fixed, its equal-city coverage increased from 47.34% before to 50.99% after (+3.65 percentage points), compared with +4.27 points when the top 10 were re-ranked independently in each period. In 10,000 paired city-bootstrap draws, the profile entering at post-adoption rank 10 appeared in the resampled post-adoption top 10 in 49.4% of draws, indicating uncertainty near the cutoff; the set-level pattern is more informative than treating an individual rank as certain.
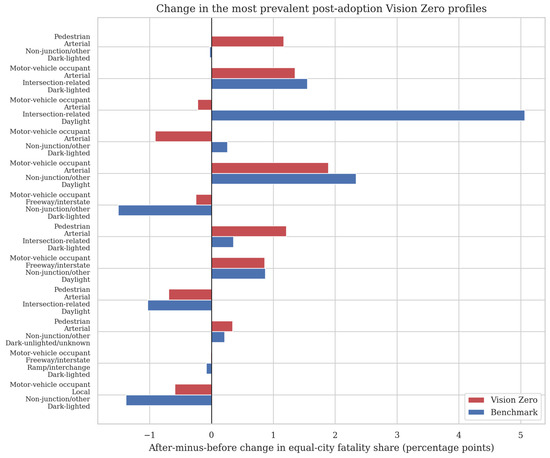
The largest post-adoption profile was pedestrian fatalities on arterials in non-junction/other contexts under dark-lighted conditions (7.11%), followed by motor-vehicle-occupant fatalities on arterials at intersections under dark-lighted conditions (6.78%). Seven of the post-adoption top 10 profiles involved arterials, six involved dark-lighted conditions, and six involved motor-vehicle occupants. Bicyclist and motorcyclist profiles did not enter the top 10 because their overall fatality volumes were lower; this ranking should not be interpreted as evidence that those users are low priority or low risk. The ten most prevalent post-adoption profiles and their corresponding changes are summarized in Table 4. The after-minus-before changes in equal-city fatality shares for the 12 most prevalent post-adoption profiles are shown in Figure 2.
Table 4.
Ten most prevalent post-adoption Vision Zero profiles, equal-city share changes, and raw fatal-person counts.
Figure 2.
After-minus-before equal-city share changes for the 12 most prevalent post-adoption Vision Zero profiles. Bars compare Vision Zero and contextual benchmark changes; they do not estimate causal effects.
3.3. Comparison with Contextual Benchmark Cities
Benchmark cities also became more concentrated. Their top-10 coverage increased from 48.3% to 55.3% (+7.00 percentage points; 95% interval, +0.07 to +11.78), N50 declined from 11 profiles to 8, and the effective number of profiles declined from 47.7 to 41.4. The Vision Zero-minus-benchmark difference in top-10 change was −2.74 percentage points (95% interval, −8.81 to +5.20). The corresponding difference for top-five coverage was −8.01 percentage points (95% interval, −12.81 to −0.17), reflecting particularly strong growth in the leading benchmark combinations.
The observed pre/post Jensen-Shannon divergence was 0.042 bits for Vision Zero cities and 0.094 bits for benchmarks. The lower observed Vision Zero JSD describes a smaller distributional shift, although the unequal totals and sparse profiles affect raw values. In the equal-fatality-size pooled sensitivity analysis (1339 fatalities per group-period), median resampled JSD was 0.060 bits for Vision Zero (2.5th–97.5th percentile 0.050–0.071) and 0.079 bits for benchmarks (0.074–0.085). This sensitivity result uses pooled fatality weighting and conditional resampling; it does not establish a causal or city-level difference in stability. The largest profile-level differential among the Vision Zero post-adoption top profiles involved motor-vehicle occupants on arterials at intersections in daylight. Its Vision Zero share changed by −0.22 percentage points, whereas the benchmark share increased by +5.07 points, for a descriptive difference of −5.29 points. Because the profile table contains many interdependent comparisons and no multiplicity adjustment was applied, this contrast is interpreted only as a contributor to aggregate redistribution, not as a standalone policy effect.
3.4. Sensitivity Analyses
The Vision Zero top-10 share increased under every specification: +3.54 percentage points in the symmetric three-year window, +5.68 with all available years, +3.23 after excluding 2020–2021 from the three-year window, and +2.65 under pooled weighting. The direction of the within-group concentration finding was therefore consistent across longer windows and the alternative weighting estimand. The relative Vision Zero-versus-benchmark difference was not stable across windows: benchmark concentration increased more in the symmetric windows, whereas Vision Zero concentration increased more when all available years were used. Observed Jensen-Shannon divergence was lower for Vision Zero than for benchmarks in each specification, but these descriptive values were not used to infer a policy effect or a statistically different degree of stability. Excluding records with explicitly unknown or not-reported source values in functional class, junction context, or lighting left 4292 Vision Zero deaths before and 5008 after; the re-ranked equal-city top-10 shares were 48.21% and 52.30%, respectively (+4.09 percentage points). In contextual benchmarks, the corresponding totals were 1321 and 1657, and top-10 shares were 49.08% and 56.32% (+7.24 points). This exclusion changed the denominator and did not reverse the within-group direction. The sensitivity results for the main concentration findings are summarized in Table 5.
Table 5.
Sensitivity of the main concentration findings.
4. Discussion
4.1. Principal Findings
This study examined how fatalities were distributed across combinations that agencies can recognize and investigate, while retaining absolute counts as essential context. Four findings stand out. First, absolute fatalities increased in both study groups within the selected two-year windows; without exposure measures, these changes cannot be interpreted as changes in risk. Second, approximately half of the equal-city fatality burden in Vision Zero cities was contained in 10 joint profiles, even though 244 profiles were observed across the complete dataset. Third, concentration increased modestly after formal adoption and the identity of dominant profiles was persistent. Fourth, contextual benchmark cities also became more concentrated, with relative changes depending on the observation window. The most defensible general statement is therefore that a small set of recurring joint contexts remained prominent, but this descriptive comparison did not establish a distinct post-adoption concentration pattern for Vision Zero cities.
The two leading post-adoption combinations unite several conditions that safety programs often monitor separately: arterials, darkness with lighting present, and either pedestrian non-junction contexts or motor-vehicle-occupant intersection contexts. The dark-lighted label should not be interpreted as evidence that lighting caused the fatalities or that illumination was adequate. FARS identifies the reported ambient lighting category but does not measure illumination level, uniformity, glare, pedestrian conspicuity, roadway geometry, or whether a lamp was operating. Instead, the prominence of dark-lighted profiles indicates that lighting presence alone does not eliminate the combined problems of speed, conflict, crossing distance, visibility, and exposure.
The persistence result has potential operational relevance, but it is not itself evidence of treatability. Large shifts in aggregate fatalities can coexist with a stable ordering of the conditions under which people die. Nine of ten dominant Vision Zero combinations persisted, suggesting that agencies could use stable profile classes as an initial screening layer. Before selecting treatments, however, each class must be mapped to actual locations and examined for exposure, geometry, speed, behavior, implementation history, and causal mechanisms. The present study did not perform that profile-to-countermeasure validation.
4.2. Relationship to Vision Zero and Systemic Safety Practice
Prior U.S. research has shown that Vision Zero outcomes and implementation structures vary substantially across cities [5,6,7]. Safe System practice requires a municipal commitment to be translated into speed management, roadway design, vehicle safety, institutional coordination, funding, and measurable delivery [4,17,18,19,20]. Driver-related factors also remain an important component of systemic safety, as prior studies have shown that crash involvement and driving behavior can be associated with individual characteristics, behavioral tendencies, and underlying mental patterns [21,22]. Recent studies further demonstrate the importance of speed management within Vision Zero and Safe System implementation, showing potential safety gains from improved speed-limit compliance and reduced travel speeds following traffic-calming interventions [23,24]. The present analysis does not evaluate program intensity or treatment effectiveness. Its narrower contribution is diagnostic: agencies can test whether dominant joint fatality profiles are represented in high-injury-network criteria, project pipelines, countermeasure selection, and performance reporting.
A profile-based approach complements both hot-spot and systemic analysis. Hot-spot methods identify places with a high observed crash concentration [8,9], while systemic methods identify recurring crash and facility characteristics and apply treatments across sites that share those conditions [11]. Multidimensional profiles form a screening layer between them. They define recurring classes such as pedestrian-arterial-non-junction-dark or occupant-arterial-intersection-daylight, but they do not identify a specific segment, prove a common causal mechanism, or prescribe a countermeasure. A city can map each class, investigate contributing factors, and only then select location-specific or systemic treatments.
The findings caution against equating concentration with safety improvement, treatability, or Vision Zero success. A more concentrated burden can simplify prioritization, but it may also indicate that persistent high-burden combinations have not been adequately addressed. Conversely, a more diffuse distribution can follow successful treatment of dominant profiles or a spread of burden across contexts. Concentration metrics should therefore be reported alongside absolute fatalities, exposure-adjusted rates, serious injuries, implementation measures, and treatment coverage. They are a descriptive monitoring tool, not a stand-alone performance score.
4.3. Practical Monitoring Framework
For future practice, a city could test the profile analysis as an annual dashboard with four linked elements. First, define a stable crosswalk using local crash variables and keep coding rules fixed across years. Second, report top-profile coverage, N50/N80, absolute counts, exposure-adjusted rates where available, and the identities of the highest-burden profiles. Third, map each dominant profile and document contributing factors, responsible agencies, funded projects, and plausible countermeasure families. Fourth, track treatment delivery, network-wide exposure, fatalities, and serious injuries. This proposed chain would allow the descriptive screening construct to be validated against locations, mechanisms, implementation, and outcomes; that validation remains outside the present national FARS analysis. Emerging generative AI approaches may further support such monitoring frameworks through data synthesis, integration of heterogeneous transportation information, and decision support; however, their application in safety-critical transportation settings requires domain-grounded validation, scalability, and trust [25]. The profile system should be locally adapted. A city with reliable speed, lane, land-use, or state-ownership data could extend the four dimensions used here. However, adding dimensions rapidly increases sparsity and can make rankings unstable. The selected dimensions should be widely available, consistently coded, and directly linked to decisions. The present four-dimensional framework is intentionally parsimonious and reproducible across 64 cities.
5. Conclusions
Across 33 Vision Zero and 31 contextual benchmark cities, roughly half of the fatality burden was concentrated in 10 recurring combinations of road-user group, functional class, junction context, and lighting condition. Absolute fatalities increased in both groups within the selected two-year windows, and the descriptive between-group comparison did not establish a distinct Vision Zero pattern across specifications. Nine of the pre-adoption top 10 Vision Zero profiles persisted, with arterial, dark-lighted, pedestrian, and motor-vehicle-occupant combinations prominent among the leading profiles. The general conclusion is limited but useful: this analysis did not establish a distinct pattern following formal adoption, while recurring profile classes offer a reproducible starting point for local investigation. They should be connected to mapped locations, exposure, causal mechanisms, countermeasures, funding, and implementation before being used for treatment decisions. Profile concentration complements—and cannot replace—absolute fatality trends, exposure-adjusted rates, serious-injury outcomes, and causal evaluations.
Several limitations constrain interpretation. The fatal-person data describe the counts and composition of deaths; they do not support exposure-adjusted risk estimates. The descriptive design cannot establish a causal effect of Vision Zero adoption: cities were not randomly selected, adoption marked formal commitment rather than treatment delivery, implementation intensity was not measured, benchmark cities were not matched controls, pre-period parallel trends were not established, and the study period overlapped the COVID-19 pandemic. The short primary window may also yield unstable proportions in low-count city-periods, although longer-window and pooled-weighting sensitivity analyses produced the same direction for the within-Vision-Zero concentration finding.
Category harmonization may conceal differences across roadway, junction, and lighting conditions. In particular, combined other/unknown categories preserve the denominator but prevent separate inference about missing values, and alternative definitions could change profile membership and rank. Equal-city averaging gives low- and high-volume cities the same influence; pooled analyses provide an alternative estimand but do not replace hierarchical shrinkage for city-specific inference. Sparse profiles, data-dependent rankings, unequal group sizes, and the different weighting estimand used for equal-size JSD resampling limit between-group interpretation. Profile-level comparisons were numerous and interdependent and were not multiplicity-adjusted. Changes in FARS coding may also introduce temporal inconsistencies. Future studies should use exposure and serious-injury data, matched or model-based longitudinal designs, explicit implementation dates and intensity measures, more detailed missing-data validation, external rank validation, and local validation linking profiles to intervention locations and outcomes.
Author Contributions
Conceptualization, A.S. and T.L.; methodology, A.S. and T.L.; software, validation, formal analysis, data curation, and visualization, A.S.; writing—original draft preparation, A.S.; writing—review and editing, A.S. and T.L.; supervision, T.L. All authors have read and agreed to the published version of the manuscript.
Funding
This research received no specific grant from any funding agency in the public, commercial, or not-for-profit sectors.
Institutional Review Board Statement
Ethical review and approval were not required because the study used publicly available, de-identified administrative crash records and involved no interaction or intervention with human participants.
Informed Consent Statement
Not applicable.
Data Availability Statement
The source FARS data are publicly available from the National Highway Traffic Safety Administration at https://www.nhtsa.gov/research-data/fatality-analysis-reporting-system-fars (accessed on 21 September 2026). The city list, verified event-year crosswalk, year-specific category-recoding crosswalk, and analysis code used to construct the profiles and reproduce the reported tables and figures will be deposited in a public repository with the accepted manuscript.
Conflicts of Interest
The authors declare no conflicts of interest.
Appendix A. City Event Anchors
Table A1 records the verified Vision Zero adoption years and benchmark pseudo-years used in the primary analysis. Pseudo-years are calendar anchors derived from the median verified Vision Zero adoption year within the same state; they do not represent policy adoption by benchmark cities.
Table A1.
Verified Vision Zero adoption years and contextual benchmark pseudo-years.
References
- Johansson, R. Vision Zero—Implementing a policy for traffic safety. Saf. Sci. 2009, 47, 826–831. [Google Scholar] [CrossRef] [Scilit]
- Belin, M.-A.; Tillgren, P.; Vedung, E. Vision Zero—a road safety policy innovation. Int. J. Inj. Control. Saf. Promot. 2012, 19, 171–179. [Google Scholar] [CrossRef] [Scilit] [PubMed]
- U.S. Department of Transportation. National Roadway Safety Strategy; U.S. Department of Transportation: Washington, DC, USA, 2022. Available online: https://www.transportation.gov/NRSS (accessed on 21 September 2026).
- Shi, G.; Methoxha, V.; Atkinson-Palombo, C.; Garrick, N. Moving beyond the Vision Zero slogan. Transp. Res. Rec. 2023, 2677, 1027–1038. [Google Scholar] [CrossRef] [Scilit]
- Caggiano, A.; Sirohi, N.; Polin, B.; Shoub, K.; Knodler, M. Toward a unified framework for vulnerable road user definitions: A comparative review of laws, crash reporting systems, and professional guidelines. Saf. Sci. 2026, 204, 107405. [Google Scholar] [CrossRef] [Scilit]
- Evenson, K.R.; LaJeunesse, S.; Keefe, E.; Naumann, R.B. Mixed-methods approach to describing Vision Zero initiatives in United States municipalities. Accid. Anal. Prev. 2023, 184, 107012. [Google Scholar] [CrossRef] [Scilit] [PubMed]
- Naumann, R.B.; Heiny, S.; Evenson, K.R.; LaJeunesse, S.; Cooper, J.F.; Doggett, S.; Marshall, S.W. Organizational networks in road safety: Case studies of U.S. Vision Zero cities. Traffic Inj. Prev. 2019, 20, 378–385. [Google Scholar] [CrossRef] [Scilit] [PubMed]
- Schneider, R.J.; Sanders, R.; Proulx, F.; Moayyed, H. United States fatal pedestrian crash hot spot locations and characteristics. J. Transp. Land Use 2021, 14, 1–23. [Google Scholar] [CrossRef] [Scilit]
- Sehtman-Shachar, S.; Billig, P.C.; Stein, A.; Kaplan, S. The immediate effects of Vision Zero corridor upgrades on pedestrian crashes in New York: A before-and-after spatial point process approach. Accid. Anal. Prev. 2024, 200, 107531. [Google Scholar] [CrossRef] [Scilit] [PubMed]
- Ghomi, H.; Hussein, M. Moving Vision Zero programs forward: What pedestrian-focused countermeasure combinations work best and where? A dynamic copula-based time-series approach. Accid. Anal. Prev. 2023, 192, 107229. [Google Scholar] [CrossRef] [Scilit] [PubMed]
- Federal Highway Administration. A Systemic Approach to Safety: Using Risk to Drive Action. Available online: https://highways.dot.gov/safety/data-analysis-tools/systemic/systemic-approach-safety-using-risk-drive-action (accessed on 1 September 2026).
- Shannon, C.E. A mathematical theory of communication. Bell Syst. Tech. J. 1948, 27, 379–423, 623–656. [Google Scholar] [CrossRef] [Scilit]
- Hill, M.O. Diversity and evenness: A unifying notation and its consequences. Ecology 1973, 54, 427–432. [Google Scholar] [CrossRef] [Scilit] [PubMed]
- Lin, J. Divergence measures based on the Shannon entropy. IEEE Trans. Inf. Theory 1991, 37, 145–151. [Google Scholar] [CrossRef] [Scilit]
- National Highway Traffic Safety Administration. Fatality Analysis Reporting System (FARS) Analytical User’s Manual, 1975–2024; National Center for Statistics and Analysis: Washington, DC, USA, 2025. Available online: https://www.nhtsa.gov/file-downloads/download?p=nhtsa%2Fdownloads%2FFARS%2FLinks+for+FARS+Manuals.pdf (accessed on 21 September 2026).
- Efron, B.; Tibshirani, R.J. An Introduction to the Bootstrap; Chapman & Hall/CRC: New York, NY, USA, 1993. [Google Scholar]
- Corben, B.F.; Logan, D.B.; Fanciulli, L.; Farley, R.; Cameron, I. Strengthening road safety strategy development: Towards Zero 2008–2020—Western Australia’s experience. Saf. Sci. 2010, 48, 1085–1097. [Google Scholar] [CrossRef] [Scilit]
- Shi, G.; Methoxha, V.; Atkinson-Palombo, C.; Garrick, N. Sustainable Safety in the Netherlands: Creating a road environment where people on foot and on bikes are as safe as people in cars. Transp. Res. Rec. 2021, 2675, 792–803. [Google Scholar] [CrossRef] [Scilit]
- Klanjcic, M.; Gauvin, L.; Tizzoni, M.; Szell, M. Identifying urban features for vulnerable road user safety in Europe. EPJ Data Sci. 2022, 11, 27. [Google Scholar] [CrossRef] [Scilit]
- Ward, N.J.; Kumfer, W.; Baldwin, S. Editorial: Vision Zero, the Safe System approach, and traffic safety culture. Front. Future Transp. 2023, 4, 1233766. [Google Scholar] [CrossRef] [Scilit]
- Khanpour, A.; King, M.; Sheykhfard, A.; Haghighi, F. Drivers’ reported crash history, sensitivity to reward and punishment, personality, and demographics: A case study in Iran. Transp. Res. Interdiscip. Perspect. 2023, 21, 100902. [Google Scholar] [CrossRef] [Scilit]
- Sheykhfard, A.; Haghighi, F.R.; Soltaninejad, M.; Karji, A. Analyzing drivers’ mental patterns using Q-methodology. J. Transp. Technol. 2020, 10, 169–181. [Google Scholar] [CrossRef]
- Campolettano, E.T.; Kusano, K.D.; Victor, T. Potential safety benefits associated with speed limit compliance in San Francisco and Phoenix. Traffic Inj. Prev. 2025, 26, S21–S30. [Google Scholar] [CrossRef] [Scilit] [PubMed]
- Lopoo, L.M.; Cardon, E.; Souders, S.; Kroner Dale, M.; Ngo, U. An evaluation of a Vision Zero traffic-calming intervention, an urban transportation safety policy. J. Urban Aff. 2025, 47, 3048–3069. [Google Scholar] [CrossRef] [Scilit]
- Babaee, S.; Naghdi, M.; Mansouri, A.; Erfani, A. Generative AI in Transportation Analytics: Foundations, Deep Generative Models, and Practical Use Cases. Infrastructures 2026, 11, 270. [Google Scholar] [CrossRef] [Scilit]

Disclaimer/Publisher’s Note: The statements, opinions and data contained in all publications are solely those of the individual author(s) and contributor(s) and not of MDPI and/or the editor(s). MDPI and/or the editor(s) disclaim responsibility for any injury to people or property resulting from any ideas, methods, instructions or products referred to in the content. |
© 2026 by the authors. Licensee MDPI, Basel, Switzerland. This article is an open access article distributed under the terms and conditions of the Creative Commons Attribution (CC BY) license.