


Abstract
With the increasing prevalence of lithium–ion batteries, the recycling of battery materials is becoming increasingly important. Functional recycling represents a promising approach in this context, one that is often based on aqueous treatment steps. This study examines the aqueous treatment of positive electrodes coated with various cathode active materials and their mixtures. To this end, the electrodes were leached in two different broad-range buffer systems in the pH range of 5 to 11. The investigations focused on the temporal evolution of the pH value, the time-dependent leaching of the active material components, and the dissolution of the aluminum current collector. The results show that process parameters, particularly the initial pH value, the treatment duration, and the composition of the process medium, influence both the leaching of the active materials and the corrosion of the aluminum current collector. Furthermore, the coated electrodes studied show significant differences in the stability of the active materials, which sometimes deviate from the properties of the respective pure active materials described in the literature, suggesting additional interactions within the electrode structure. The results highlight the need for targeted process optimization to create the conditions for the successful functional recycling of active materials from lithium–ion batteries.
1. Introduction
The continued exponential growth in the number of electric vehicles [1], as well as the large number of batteries in cell phones and laptops [2], means that recycling is becoming increasingly important. It is reasonable to assume that prices for key elements—lithium, nickel, cobalt, and manganese—will continue to rise in the long term due to increasing demand, causing the cost share of the cathode active material in the total cost of the battery to increase even further. The costs of exploiting natural deposits will also rise, although the consequences of hazardous mining conditions and environmental impacts are difficult to quantify [3]. As a result, recycling is becoming increasingly important, making the cathode active material in end-of-life batteries of all types a key source of raw materials for the elements urgently needed to manufacture new batteries. As a result, the recycling of lithium–ion batteries can be an effective approach to reducing manufacturing costs in the long term [4], especially since the cathode accounts for about 50% of the total material costs of an automotive battery pack [2].
In recent years, various recycling processes based on pyrometallurgical, thermal, and hydrometallurgical steps have been developed on an industrial scale. The most common method used today starts with deeply discharged end-of-life lithium–ion batteries, which are shredded multiple times, and the resulting fractions are first subjected to mechanical separation. This yields what is known as black mass, which consists of cathode active material, graphite, carbon black, and binder, and may additionally contain impurities of aluminum, copper, iron, and conductive salt residues in varying proportions. This is followed by hydrometallurgical treatment, the aim of which is to dissolve the cathode active material consisting of lithium, nickel, manganese, and cobalt, subject the resulting solution to chemical separation, and recover the high-purity salts of the individual elements through various refining stages [2,5]. There are numerous publications and methods for the hydrometallurgical treatment of black mass, with the focus always on dissolving the cathode active material as completely as possible and efficiently separating the metal ions. Various hydrometallurgical systems for the leaching of cathode active materials based on lithium cobalt oxide (LCO) have been investigated in the literature. Inorganic acids in combination with a reducing agent are used particularly frequently, as the reduction of Co(III) to Co(II) promotes metal dissolution. In particular, the combination of sulfuric acid (H2SO4) and hydrogen peroxide (H2O2) has been extensively studied and described as highly efficient [6,7]. This process results in leaching efficiencies of 95% for cobalt and 96% for lithium. In addition to H2O2, various sugars have also been used as alternative reducing agents [8]. However, under optimal process conditions, the leaching efficiencies for lithium are nearly 100%, whereas for cobalt, leaching efficiencies exceed 95% only when glucose and sucrose are used, and only 54% is achieved when cellulose is used. Furthermore, other inorganic acids such as nitric acid (HNO3) [9,10] or phosphoric acid (H3PO4) [11] have been used in combination with H2O2 and achieved leaching efficiencies of over 90%. Hydrochloric acid (HCl) represents a special case, as it can function both as a leaching agent and as a reducing agent [12,13]. In addition to inorganic acid systems, organic acids—such as oxalic acid [14], DL-maleic acid [15,16], citric acid, and aspartic acid [16]—have also been investigated, sometimes in combination with H2O2. In the case of oxalic acid, the use of H2O2 as a reducing agent had no significant effect on leaching efficiency. Furthermore, ascorbic acid has been successfully used as a reagent, as it can serve as both a leaching agent and a reducing agent [17,18] and can also be used in combination with other organic acids [18,19]. Comparable leaching systems have been investigated for cathode active materials based on lithium–nickel–manganese–cobalt oxides (NMC). Here, too, high leaching efficiencies are achieved using a combination of H2SO4 and H2O2 [20,21]. In addition, alternative reducing agents such as NH4Cl [22] or NaHSO3 [23] have been investigated in comparison to H2O2. Under identical process conditions, the use of NaHSO3 instead of H2O2 results in higher leaching efficiencies for transition metals (Ni, Co, Mn). HCl is also used as a combined leaching and reducing agent [24]. Further work focuses on the combination of inorganic acids with organic reducing agents [25], as well as on the use of organic acids in conjunction with H2O2 [26,27]. In the case of lactic acid, the use of H2O2 increases the leaching efficiency for Li from 60% to 99% and for transition metals (Ni, Co, Mn) from about 30% to 99%.
Pyrometallurgical processes provide another source of cobalt and nickel, in which end-of-life lithium–ion batteries are smelted metallurgically in shaft furnaces under reducing conditions, resulting in a mixed-metal fraction enriched with nickel, cobalt, and copper. Aluminum, manganese, and lithium are lost as slag [28,29,30]. Currently, 87% [31] of the lithium mined worldwide is used for the production of new lithium–ion batteries, while less than 1% of the lithium [32] is currently recovered through recycling; this is in contrast with the recycling rates for the other metals, which exceed 50% [33].
Functional recycling [34] using waterjet delamination, which is carried out in an industrial plant with a capacity of approximately 1,500 tons per year, offers a completely different level of recycling efficiency. In this process, deeply discharged pouch cells are opened, and the removed cathode foils are separated and placed on a screen-like conveyor belt. Above and below the conveyor system are arrays of nozzles from which an aqueous solution is sprayed under pressure, completely removing the cathode coating from the aluminum foil. The key process parameters, such as the pressure of the medium, the nozzle arrangement, the temperature of the medium, and the type of additives to the medium, are adjusted so that nearly 100% decoating can be achieved without destroying or crumpling the aluminum foil. The removed coating enters a collection tank along with the aqueous medium. The resulting fraction is then filtered, pressed, washed, and dried [35]. A comprehensive description of a comparable laboratory-scale process was provided by Ji et al. [36]. Compared with all other industrial recycling processes, waterjet decoating is characterized by the exceptionally high purity and quality of the recovered cathode active material. This material thus has the highest potential to be blended with new cathode active material and used directly for coating new electrodes, making waterjet decoating the recycling process with the best life cycle assessment. The cumulative total energy consumption is 3.3 MJ per 1 kg of traction battery. Indirect recycling methods result in energy consumption that is 5 to 20 times higher [37]. The most important requirement of functional recycling is to recover the cathode active material while largely preserving its morphological, physical, and chemical properties so that it can be reused, either directly or after regeneration, in the manufacture of new battery cells. Although no significant material loss occurs during waterjet decoating, the process control and, in particular, the process medium have a considerable influence on the quality of the recovered cathode active material. The separated electrodes consist of aluminum carrier foils coated with a mixture of an organic binder, conductive carbon, and the cathode active material, to the surface of which residues of conductive salts and non-volatile electrolyte components may adhere. Contact with the process medium triggers chemical reactions that can directly affect the quality and thus the functionality of the cathode active material contained therein. In addition, it must be ensured that contaminants from previous process steps, such as copper resulting from deep discharge [38,39,40,41] or aluminum contamination [42] and active material degradation due to exposure to atmospheric humidity [43,44], are avoided.
It is well known that NMC-type cathode active materials are highly sensitive to water and release lithium to varying degrees depending on their stoichiometry: NMC811 > NMC 622 > NMC 532 > NMC111 [45]. Sieber et al. have demonstrated [46] that NMC111 causes a time-dependent increase in pH in water, resulting from the exchange of lithium ions for protons [47,48] and the associated depletion of protons in the solution. Nowak et al. have also demonstrated, using NMC 811 as an example, that treatment with H2O and D2O results in lithium leaching. Additionally, it has been shown that the active material exhibited a significantly reduced capacity over the course of 500 cycles [49], even though no morphological changes in the NMC were detectable. Furthermore, Sieber et al. have demonstrated that the aluminum foil is also attacked, which can result in the deposition of Al(OH)3 or LiAl(OH)4 on the delaminated material [46]. A decrease in pH and an extension of the contact time, in turn, lead to the dissolution of the transition metals, which is accompanied by a further release of lithium [50] and also results in the destruction of the secondary particles [46].
The aim of this study is to investigate the influence of the process medium on the degradation of the recovered cathode active material. The most important parameters are (a) the initial pH of the process medium; (b) the pH at the end of the industrial decoating line; (c) the presence of transition metal-complexing reagents; (d) the contact time between the CAM coating, the aluminum collector and the process medium, which can be up to 15 min under industrial conditions; and (e) the contact time between the medium and the de-coated active material, which can last for several hours. Each of these parameters contributes in different ways to the degradation of the CAM. The investigations carried out were designed in such a way as to replicate the industrial conditions between the components whilst at the same time allowing the processes taking place to be monitored sufficiently well. Crucial to this is the selection of a suitable buffer system that ensures a largely linear change in pH, i.e., one that avoids a buffer plateau.
This paper focuses on processes in which two broad-range buffers from the Britton–Robinson buffer system [51] were selected to replace the industrial process medium. This makes it possible to set any defined pH value within the technically relevant range of pH 5 to pH 11 without changing the buffer system or its composition. Another characteristic of these buffer systems is that they do not possess a classical buffer capacity, in which the pH value is kept largely constant. The pH curve can be divided into segments in which the pH value varies almost linearly with the proton concentration (Table S1). In addition, two exemplary types of buffer systems were selected for the investigations: buffer 1, which has a very low complexing effect for divalent and trivalent metal ions, and buffer 2, a citric acid-containing buffer with a significant complexing effect for these metal ions in the pH range of 4 to approx. 11, in order to promote higher solubility for metal ions and thus indicate the degradation of the cathode active material at an early stage.
2. Results
2.1. Choice of Reaction System
For the investigations, broad-range buffer systems with a buffering effect in the pH range of 2.5 to 12 were selected [51], so that all tests would take place in the same chemical environment, with the exception of the pH value. The investigations were conducted in the technically relevant pH range of 5 to 11 to rule out, from the outset, the significant dissolution of the cathode active materials at lower pH values and the massive dissolution of the aluminum foils at pH values above 11. These buffer systems do not maintain a constant pH range within their buffer capacity, but rather produce a nearly linear relationship between the change in pH and the varying proton concentration within the defined segments. A broad-range buffer with a weak complexing effect (buffer 1) and a broad-range buffer based on citric acid that exhibits strong complexing in the acidic range (buffer 2) are used. The complexing effect is based on the chelating effect of citric acid, which dissociates in three stages (pKS1 = 3.08–3.16, pKS2 = 4.66–4.85, pKS3 = 6.26–6.43) [52] and which strongly complexes divalent metal ions in the pH range of 4 to 8.5 in the order Mn < Fe < Co < Ni (log K = 2.8, 3.1, 4.4, 4.8; Mn, Fe, Co, Ni) [53]. From this range onward, the buffering effect is taken over by species of phosphoric acid and hydroxylamine, and in the strongly alkaline range, increasingly stable aluminum citrate complexes are formed. The stability constants for the aluminum citrate complexes are (AlH2Cit2+, log K = 1.01–1.17; AlHCit+, log K = 5.28–5.7; AlCit, log K = 9.12–9.52) [54].
The low-complexing buffer system 1 is intended to focus on the extent of Li+/H+ exchange and, at least in the initial stage of the reaction, result in only minimal dissolution of the cathode active material. In contrast, a comparison with the complexing buffer system 2 provides insight into the reaction behavior of the transition metals. If the transition metals are soluble under the given pH conditions, the reducing [55] and complexing effect of citric acid on divalent metal ions promotes the dissolution process. The resulting higher solution concentrations of the transition metals serve as an indicator of the onset of the degradation of the cathode active material, which must be avoided definitely in the recycling process.
This study has a technically relevant aspect. The present investigations are based on the parameters of industrial waterjet stripping with a medium temperature of at least 40 °C and a liquid-to-solid ratio of medium to cathode foil of approximately 1 L: 10 g. In contrast to the industrial process, treatment times of 1500 min are considered here to obtain a complete picture of the aging of the process solution.
2.2. Characterisation of the Leached NMC Materials
Scanning electron microscopy (SEM) was used to investigate the morphological degradation of the treated NMCs. The results for NMC111 are presented as an example (Table 1). All results for the tested CAMs are shown in Figure S1.
Table 1.
SEM studies of NMC 111 cathodes in both buffers at different pHt=0, the image size is 58 µm × 39 µm.
The results show that buffer 2 leads to increased particle degradation at low pH values. NMC523 and NMC111 exhibit this behavior at respective pH values of 5 and 7 in buffer 2, where the secondary structure is partially destroyed. Surprisingly, the effect of morphological degradation is least pronounced in NMC811 in buffer 2. For NMC622+LFP, treatment in buffer 2 at pH 5–7 leads to a complete loss of the secondary structure (see Figure S1).
When treating the various NMCs in buffer 1 at pHt=0 = 5–9, no significant degradation is observable. For all CAMs used, the morphology of the secondary particles remains intact in buffer 1. Only at pHt=0 = 11 do deposits appear on the particles. While deposits of secondary particles can be observed on the individual NMC111 particles, in the case of NMC523 and NMC811, the entire surface is covered, so that the secondary particles of the NMC are in some cases no longer recognizable. In summary, morphological observations show that treatment with buffer 2 leads to massive destruction of the secondary particles, particularly at pHt=0 = 5–7. At pHt=0 = 11, deposits form on the cathodes in both buffer systems. The least morphological changes are observed in buffer 1 at pHt=0 = 7–9.
2.3. Composition of the Used Electrodes
Knowledge of the composition of the cathode active materials (CAMs) is essential for determining leaching efficiencies. Table 2 shows the elemental compositions of the cathode foils used, as determined by analysis. In addition, the stoichiometric factor of the transition metals in the NMC is determined from these elemental compositions. The general formula for NMC is LiNixMnyCOzO2, where x + y + z = 1. The designations for the respective NMC types listed in the table header refer to the stoichiometric factors of the metals Ni, Mn, and Co. In the case of NMC523, this means that the metals are present in stoichiometrically equal proportions, resulting in the formula LiNi0.51Mn0.21Co0.28O2, and this CAM is therefore designated as NMC523. The same procedure was used for the other CAMs. As nickel, cobalt, and manganese are distributed stoichiometrically in equal proportions in the first NMC shown in Table 2, this NMC is designated NMC111.
Table 2.
Composition of the cathodes used, based on a single piece of film coated on both sides; ρa denotes the basis weight; * relative to the active cathode material on the cathode, the lithium–iron–phosphate (LFP) content is 12.5% (w/w).
2.4. Visual Findings Regarding the Interaction Between the Cathode Foil and Water
The following experimental result is significant for interpreting the present findings: When cathode materials come into contact with deionized water with an initial pH of 5.8 to 6.5, there is a continuous increase to a final pH of approximately 11.5 to 12.4 (NMC) or 9 (LFP) [50]. When cathode foils are immersed in deionized water that has previously been mixed with the indicator thymol blue (color-change range pH = 8–9.6), an immediate and massive increase in the pH value occurs directly at the cathode surface, recognizable by a rapid color change to blue. It can therefore be assumed that a strongly basic environment always prevails both immediately at the surface of the cathode coating and within the pore system after water has penetrated it. This can result in reaction behaviors, particularly with respect to the aluminum carrier foil, that are not to be expected based on the pH value of the surrounding solution.
2.5. Change in pH Level
The mechanism underlying the aqueous leaching of cathode materials involves the insertion of protons into the crystal lattice and the release of lithium ions into the surrounding medium [45,46,47,48].
Figure 1 shows the absolute changes in pH values as the difference between the final value (t = 1500 min) and the initial pH value (t = 0) for all experimental series. The relationship between pH and proton concentration for both buffer systems from [51] were divided into different validity ranges. This sectioning is based on the initial pH value and the greatest change in pH over the entire process. Within this range, the curves were linearized, and the slope was determined in order to compare the buffers within the specified validity range. The slopes within the respective validity ranges were used to compare the extent of the pH change in the buffer solutions. The determined parameters are listed in Table S1. If the pH change were attributable solely to a Li+/H+ exchange according to Equation (1), both buffer systems would have to exhibit comparable curves that differ only in that, at pHt=0 = 5–9, the pH change for the same Li+/H+ exchange is about 20–25% lower with buffer 2 than with buffer 1. In the range where pHt=0 = 11, both buffers behave nearly identically. The time-dependent pH values determined for each sample are shown in Figure S2.
Figure 1.
Change in pH as the difference between pHt=1500 min and pHt=0 min; weak complexing buffer 1: solid symbols, complexing buffer 2: half symbols, θ = 40 °C, dashed lines are guides for the eyes.
Regardless of the cathode material used, the same trend is observed in both buffer systems: as the initial pH value increases, the rise in pH becomes progressively smaller. This is consistent with the expectations of Bauer et al. [50], that every cathode active material proceeds toward an equilibrium of Li+/H+ exchange according to Equation (1), which leads to a final pH value, the native pH value. If the initial pH value is between 5 and 9, it rises as the experiment progresses, with the increase in pH value being significantly higher in the complexing buffer system 2 than in the non-complexing buffer system 1. This increase in pH cannot be explained solely by Li+/H+ exchange. Similarly, the electrodes treated with buffer 2 show clearly visible changes in the form of deposits or white stains. This effect becomes more pronounced the lower the pH value is. REM-EDX analyses show that the deposits on the cathodes contain aluminum and oxygen. In accordance with [46], it is suspected that these deposits are Al(OH)3 and LiAl(OH)4, respectively (Figure S3). In this case, the precipitation of the salts leads to unwanted contamination of the CAM. The buffer solutions also exhibit a greenish coloration as the experiment progresses, which becomes significantly more visible the lower the initial pH value is set. As will be shown later, the partial dissolution of the cathode active material and the aluminum collector causes the increased acid consumption, which triggers the unusually high increase in pH. In buffer 1, visually discernible changes on the electrode surface are rare and, if present, only sporadic. Similarly, the buffer solutions used show no change in color (Figure S4).
Buffer solutions with an initial pH of 11 are an exception to this behavior. During treatment with both buffer systems, the pH decreases over the duration of the experiment, which, in the case of leaching from NMC-coated cathodes, suggests side reactions, since the initial value is below the native pH of the active materials.
Compared with the NMC-coated electrodes, the LFP-coated electrodes exhibit the smallest changes in pH in both buffer systems. In contrast, the NMC622+LFP coating, which contains only 12.5% (w/w) LFP, exhibits pH changes comparable to those of NMC622 and thus also significantly higher than the pH increase caused by LFP.
2.6. Leaching of Lithium from NMC Cathode Active Materials
Figure 2 shows the leaching efficiencies for Li at the end of the experiment as a function of pHt=0 in both buffer solutions. In accordance with Equation (1), Figure 2 shows that the lower the pH value, the more intense the Li+/H+ exchange. The general trend of the pH dependence of lithium leaching is thus (pH = 5) >> (pH = 7) > (pH = 9) ≈ (pH = 11). Only in the case of buffer 1 and at a starting pH of 5 is the pH change (Figure 1) equivalent with the amount of lithium leached (Figure 2) and thus correlated with the predicted pH change according to Equation (1). For all other pH values, side reactions lead to deviations from this behavior, which in the case of buffer 2 results in the pH change at pH 5 and pH 7 being significantly higher than the pH change resulting from lithium exchange according to Equation (1). It should be noted that, particularly at high pH values and with low lithium leaching, the proportion of residual lithium and lithium conducting salt residues has an increased influence on the total lithium content.
Figure 2.
Final lithium leaching values at different pH values: solid symbols represent the low-complexing buffer 1 and half symbols represent the complexing buffer 2, θ = 40 °C, dashed lines are guides for the eyes.
In buffer system 2, more lithium dissolves in the pH range of 5 to 9 than in buffer system 1. This is no longer attributable solely to Li+/H+ exchange, as there is no linear relationship between the change in pH and the amount of Li+ released. Here, the release of lithium due to the dissolution of the cathode materials, followed by the complexation of the transition metals by citric acid, dominates. This is also indicated by the fact that the change in pH is significantly higher than the calculated prediction. Figure 3 shows the time-dependent leaching efficiencies of lithium for the respective NMC materials used. The amounts of material leached are shown in Figure S5.
Figure 3.
Time-dependent lithium leaching at different pH values. (a) pHt=0 = 5, (b) pHt=0 = 7, (c) pHt=0 = 9, (d) pHt=0 = 11; solid symbols denote the low-complexing buffer 1 and half symbols denote the complexing buffer 2, θ = 40 °C.
In buffer system 1, the various cathode active materials exhibit different degrees of stability with respect to lithium exchange. NMC523 consistently shows the lowest stability, while NMC111 exhibits the highest. The cathodes containing NMC622, and NMC811 fall in between. In buffer system 2 and the same pH range, NMC523 releases the highest proportion of lithium into solution, while the stability ranking of the other materials depends on the pH. At pH 11, however, the ranking changes significantly, making NMC622 the most stable material in both buffer systems and NMC523 and NMC111 the least stable materials.
In summary, it can be concluded that the preferential leaching of lithium in the low-complexing buffer 1 at pH values between 5 and 7 results in the following stability order for the cathode materials: NMC111 > NMC811 > NMC622 > NMC523.
For complexing buffer 2, however, the following ranking applies between pH 5 and 9:
At pH = 5:
NMC811 > NMC622 > NMC111 > NMC532
At pH = 7:
NMC811 ≈ NMC622 > NMC111 ≈ NMC532
And at pH = 9:
NMC622 > NMC811 > NMC523 > NMC111.
With a few exceptions, the kinetics of lithium leaching from all the cathode foils under consideration are initially very similar. The lithium concentration in the medium rises sharply within the first 120 to 180 min and reaches a value that either does not change significantly for the remainder of the experiment up to 360 min or appears to be approaching a limit value. Only long contact times of 1,500 min lead to a further slight increase in some cases. The cathodes coated with NMC523 and NMC811 exhibit different behavior in buffer 1 at pH 11. Here, the lithium concentration decreases again in the time interval from 360 to 1500 min, which is directly related to the time dependence of the aluminum concentration and will be discussed further below.
2.7. Leaching of Transition Metals
The concentrations of the transition metal ions that entered the buffer solutions were converted to a hypothetical NMC composition in order to draw conclusions about the dissolution behavior in relation to the stoichiometry of the cathode active material used, specifically to determine whether the material dissolves congruently or whether one of the contained transition metals dissolves preferentially. Figure 4 shows the average stoichiometric factors of the individual transition metals using NMC 111 as an example in the various buffer systems at different initial pH values. The stoiciometric factors of the starting material (Figure 4; red dotted lines) corresponds to the stoichiometric factors in Table 2. For all other cathodes investigated, the corresponding figures can be found in the Supplements (Figures S6–S9).
Figure 4.
Average stoichiometric leaching factors for the transition metals Ni, Co, and Mn at various pH values; buffer 1 (left) and buffer 2 (right), θ = 40 °C; the red dotted line indicates the stoichiometry of the starting material; white box plots: values from the individual element analysis are below the LOQ.
It is shown in a pH range of 5–9 that the stoichiometric ratios of the transition metals, particularly in complexing buffer 2, correspond to the stoichiometry of the active material in the cathode coating. In buffer 1 at pH 9–11 and in buffer 2 at pH 11, the solubility of the transition metals is so low that the uncertainty in determining the stoichiometric factors becomes so high that no reliable statement can be made regarding the preferred solubility of individual transition metals.
As no significant or dominant dissolution of an individual transition metal was observed in any of the cathode active materials examined, the subsequent analysis focuses on the total amount of dissolved transition metals. Figure 5a shows the total dissolution of the transition metals Ni, Mn, and Co from the respective active materials in the buffers used as a function of the set pHt=0. The cumulative plot of the leached amounts of substance is shown in Figure S10. The leaching of the individual transition metals is presented as the leached amount of substance and as leaching efficiency in Figures S11–S16.
Figure 5.
Time dependence of the total leaching of the transition metals Ni, Co, and Mn at different pH values. (a) pHt=0 = 5, (b) pHt=0 = 7, (c) pHt=0 = 9, (d) pHt=0 = 11; solid symbols denote the low-complexing buffer 1 and half symbols denote the complexing buffer 2, θ = 40 °C.
In general, it can be observed that (i) as the pH value increases, fewer and fewer transition metals from the cathode active material dissolve into the solution and (ii) the highly complexing buffer 2 consistently dissolves more transition metals than the weakly complexing buffer 1. This is consistent with the assumption that the high lithium concentrations for buffer 2 in the pH range of 5 to 9 (Figure 2) are also caused by a partial dissolution of the cathode active material. A comparison of the curves in Figure 5 with those in Figure 3 already shows that the dissolution of the transition metals proceeds considerably more slowly than the release of lithium. Consequently, within the first 10 min of contact with the medium, there is a particularly high excess of lithium, which only gradually decreases thereafter due to the later onset of transition metal dissolution. This visual observation is consistent with the determined rate constants. The corresponding rate constants are listed in Table S2.
The molar ratio of the lithium–ion concentration to the concentration of the total transition metals in the buffer media at the end of the test period (after 360 and 1500 min) provides insight into the stability of the cathode active materials. Figure 6 illustrates these considerations using buffer 2 as an example.
Figure 6.
Time-dependent evolution of the molar ratio of dissolved lithium to the sum of dissolved transition metals after (a) 360 min and (b) 1500 min for buffer 2 at various pHt=0, θ = 40 °C.
At pH 11, a high molar excess of lithium is present at the end of the experiment, caused by the very low lithium concentration and the even lower concentration of transition metals. However, as the concentration of transition metals at this pH value is below the limit of quantification, no exact quantification is possible. As the pH value decreases, the excess of lithium decreases, resulting in values below 10, which, at the highest solution concentrations of lithium (Figure 3) and transition metals (Figure 5), indicate the massive dissolution of the cathode active materials. In particular, NMC111 exhibits molar ratios between 1.5 and 2 at pH 5–9, and NMC523 and NMC622 exhibit molar ratios between 1.4 and 2.5 in the pH range of 5 to 7, which illustrates the high dissolution rate of the transition metals. Only the leaching of NMC811 leads to high molar ratios, meaning that, despite high lithium leaching, a relatively low dissolution of the cathode material is observed. In the low-complexing buffer 1, there is a general molar excess of lithium, which reaches factors of approximately 20 (NMC111) to 120 (NMC811) at pH = 7. This is caused by the low solubility of the transition metals in the low-complexing buffer 1. Excluded from these calculations are a pH value of 11 for buffer 2 and pH values of 9 and 11 for buffer 1. The determined concentrations of cobalt, nickel, and manganese are close to the limit of quantification and are therefore subject to high measurement uncertainties, such that the uncertainties resulting from error propagation do not allow for a distinction between the numerical values. Consequently, only the results at pH 5 in buffer 1 can be discussed. For all cathode active materials, more lithium is released than the combined total for nickel, manganese, and cobalt. This results in the following ranking: NMC622 (approx. 27 times) > NMC811 (approx. 17 times) > NMC523 (approx. 11 times) > NMC111 (approx. 4 times).
Of interest is the leaching efficency of transition metals depending on the stoichiometric composition of the cathode active materials. In complexing buffer 2, NMC111 releases the highest concentrations of transition metals under all conditions, while NMC811 releases the lowest. This suggests that the chemical stability of the electrodes studied increases with increasing nickel content in the cathode active material: NMC811 > NMC622 > NMC523 >> NMC111.
2.8. Leaching of LFP and NMC/LFP Mixtures
Figure 7 shows the lithium leaching from three cathode foils coated with LFP, NMC622, and a mixture consisting of 87.5% (w/w) NMC622 and 12.5% (w/w) LFP, respectively, in buffers 1 and 2 and as a function of the set pHt=0. This confirms that the behavior known from NMC cathode active materials, with decreasing leaching of lithium as the pH increases, also applies to LFP and the LFP mixture.
Figure 7.
Time-dependent profile of lithium leaching at different pH values. (a) pHt=0 = 5, (b) pHt=0 = 7, (c) pHt=0 = 9, (d) pHt=0 = 11; solid symbols denote the low-complexing buffer 1 and half symbols denote the complexing buffer 2, θ = 40 °C.
However, significant differences are evident upon closer inspection. At pHt=0 = 5, LFP, NMC622, and NMC622+LFP in buffer 2, as well as NMC622+LFP in buffer 1, exhibit comparably high leaching behavior, whereas LFP and NMC622 in buffer 1 shows similarly low leaching efficiency. In buffer 1, the mixed coating NMC622+LFP thus deviates significantly from the behavior of the coatings consisting of only NMC622 and only LFP. pHt=0 = 7 marks the beginning of a reversal in leaching efficiencies, which continues up to pHt=0 = 9. The leaching efficiencies of NMC622 converge in both buffers and reverse at pHt=0 = 9, with buffer 1 now exhibiting the higher leaching efficiency. LFP follows this trend and, starting at pHt=0 = 7, achieves the same and sometimes higher leaching in buffer 1. NMC622+LFP, in turn, deviates from this pattern, as the reversal of the order between buffers 1 and 2 occurs as early as pHt=0 = 5 and is much more pronounced at this pH value, as well as at pHt=0 = 7, than with the other cathode active materials.
The leaching of Li from NMC622+LFP at pHt=0 = 9–11 in buffer 1 also exhibits another characteristic. At pHt=0 = 9, the Li concentration rises during the first 60 min, remains constant until 360 min, and then drops to a value corresponding to the final leaching value in buffer 2 as well as the final leaching value of the LFP-coated electrodes. For NMC622+LFP at pHt=0 = 11, the lithium content in the solution rises rapidly and drops by 120 min to the value reached with buffer 2, remaining constant for the remainder of the test period. However, the lithium content during leaching of the NMC622+LFP cathodes shows comparable time-dependent behavior in the first few minutes, regardless of the pH value. Additionally, these cathodes exhibit the highest lithium concentrations in buffer 1 at pH 5 and 7 throughout the entire experiment, as well as at pH 7 and 9 at the beginning (Figure S5). Therefore, it is suspected that the lithium concentrations, particularly at the beginning, are affected by the dissolution of residual lithium and salt residues.
Figure 8 shows the total amount of leached transition metals (Ni, Co, Mn) from NMC622 and the NMC622+LFP coating mixture relative to the total content of transition metals in NMC622 as a function of the set pHt=0. Both materials behave almost identically in both cases. The metal ion concentrations are always higher in buffer 2 than in buffer 1. At pH values ranging from 5 to 7, the leaching of transition metals in the mixed coating in buffer 1 is higher than in pure NMC622. At higher pH values, all measured leaching rates of the transition metals are below the limit of quantification.
Figure 8.
Time-dependent leaching of the total transition metals Ni, Mn, and Co: a comparison of NMC622 and NMC622+LFP at different pH values. (a) pHt=0 = 5, (b) pHt=0 = 7, (c) pHt=0 = 9, (d) pHt=0 = 11; solid symbols denote the low-complexing buffer 1 and half symbols denote the complexing buffer 2, θ = 40 °C.
Figure 9a shows the leaching of iron from an LFP-coated cathode and from an NMC622+LFP-coated cathode, Figure 9b the leaching of lithium from an LFP-coated cathode, and Figure 9c the molar ratio of Li to Fe in an LFP-coated cathode in complexing buffer 2 as a function of the set pHt=0. Data from buffer 1 are omitted because the measured Fe concentrations are always at or below the limit of quantification, resulting in a leaching efficiency < 0.1%. Additionally, in the low-complexing buffer 1, increasing amounts of Li are released from the LFP only as time increases, with the amount released decreasing significantly as the pH value rises. At the same time, the amount of iron is so small that the molar ratios are in the range of several hundred, which indicates leaching of the lithium but not dissolution of the LFP.
Figure 9.
Time-dependent leaching of LFP cathodes (solid symbols) and NMC622+LFP cathodes (half symbols) at different pH values. (a) The leaching of iron, (b) the leaching of lithium, (c) the molar ratio of Li/Fe in buffer 2, θ = 40 °C.
In complexing buffer 2, citric acid promotes the increased transfer of iron(II) ions into the solution through its reducing and complexing effects. This causes the LFP to dissolve gradually at pH 5: First, the lithium is leached out, followed by an increasing dissolution of the iron, so that after approximately 120 min, a solution with a molar stoichiometry for Li: Fe of 1 results, and the process of congruent dissolution then continues, reaching a final value for Li:Fe = 0.96 ± 0.10. As the pH value increases, a clearly decreasing amount of lithium dissolves, and the dissolution of the LFP also continues to a lesser extent. Over the progress of the 1500 min test period, the Li: Fe ratio continues to decrease to the following final values: pH 7: Li:Fe = 1.26 ± 0.13, pH 9: Li:Fe = 2.23 ± 0.24, pH 9: Li:Fe = 5.75 ± 0.69 (Figure 9c). This indicates that, as the pH increases, lithium leaching becomes increasingly dominant relative to the dissolution of LFP. The NMC622+LFP coating exhibits lower iron leaching than pure LFP in the pH range of 5 to 7, even in buffer 2, which complexes and stabilizes iron(II) ions. Starting at pH 9, this trend reverses at a very low level, and the NMC622+LFP coating releases slightly higher iron concentrations into the solution. The amounts of iron leached are shown in Figure S17.
The pH values change as shown in Figure 1, as follows. In buffer 2, there is a slight increase over the course of the experiment from pH 5 to pH 7.4, from pH 7 to pH 8.6, and, at pH 9, the value remains almost unchanged. In buffer 1, the pH values of the solutions in this pH range remain nearly unchanged. Starting at a value of pH 11, the pH decreases in both buffers to pH 9.9 for buffer 1 and 9.8 for buffer 2.
The analysis shown in Figure 10 of the molar ratios of the metal ions to one another during the leaching of NMC622+LFP provides insight into the dissolution behavior. Here, the ratio of (a) lithium to the sum of the transition metals (Ni, Co, Mn), (b) the ratio of lithium to iron, and (c) the ratio of the sum of the transition metals to iron are examined as a function of time and at various pH values.
Figure 10.
Molar ratios of NMC622+LFP leaching at different pH values in buffer 2; (a) the molar ratio of Li/∑TM, (b) the molar ratio of Li/Fe, (c) the molar ratio of ∑TM/Fe; the red dashed line in (c) indicates the stoichiometric ratio in the cathode material.
As the pH increases, fewer transition metals dissolve relative to lithium, resulting in the following molar ratios of Li: transition metal (Figure 10a) at the end of the experiment: 1.74 ± 0.36 for pH 5, 2.50 ± 0.35 for pH 7, 4.69 ± 0.57 for pH 9, and 11.6 ± 1.3 for pH 11. This means that during leaching at pH 5 and 7, analogous to pure NMC622, the NMC622 in the NMC622+LFP coating enters solution in comparable Li: transition metal ratios, which illustrates a comparably high dissolution rate of the transition metals. The molar excess of lithium relative to iron is very high at every pH value, ranging between a factor of 30 (pH = 5) and 100 (pH = 11) (Figure 10b). The molar ratio of the sum of transition metals: iron (Figure 10c) ranges between a factor of 4.2 ± 0.6 at pH = 11 and 57 ± 10 at pH = 5. The stoichiometric ratio in the cathode is approximately 10. This means that a preferential dissolution of iron in the alkaline environment occurs relative to the transition metals of the NMC.
The following hypothesis is proposed to explain the interaction between NMC622 and LFP. The experiment described at the beginning, using the indicator thymol blue, shows that a significantly higher pH develops very quickly immediately at the surface of NMC coatings than in the bulk phase of the medium. It is plausible to assume that at pH 5 within the NMC622+LFP coating, the preferential release of lithium from the NMC622 in the pore system results in a pH value that is higher than in the pore system of the LFP coating. This locally higher pH value in the NMC622+LFP coating suppresses the leaching of iron from the LFP, which is thus lower than in a pure LFP coating, which also shows hardly any change in pH value when lithium ions are released. Thus, at pH 5, the NMC622+LFP coating behaves almost identically to the NMC622 coating with regard to the leaching of lithium and the transition metals Ni, Mn, and Co, but suppresses the dissolution of iron from the LFP compared with the pure LFP coating. In an alkaline medium, the differences disappear significantly; the NMC622+LFP coating releases relatively more iron than the pure LFP coating.
2.9. Dissolution of the Aluminum Collector
Aluminum passivates in the pH range between 4 and 9 and is therefore practically insoluble [56]. Blind tests (Figure S18), in which uncoated aluminum collectors were treated in complexing buffer 2 at pHt=0 = 5…9, result in no change in the initial pH value and only very low area-normalized aluminum concentrations (maximum 0.21 µmol·cm−2) in the buffer solution over a period of 300 min. Only at pH 11 does significant dissolution occur, as expected according to Equation (2), leading to a final area-normalized aluminum concentration of approx. 25 µmol·cm−2.
Concurrently, the dissolution of the aluminum leads to a decrease in the pH value from 11.09 at the start of the process to 9.85 at the end of the process. If the pH value falls below a certain threshold, aluminum dissolution is inhibited due to passivation.
However, when cathode foils consisting of an aluminum substrate foil and a coating of cathode active material are used, significant dissolution of the aluminum is observed. Figure 11 shows the area-normalized aluminum concentration for buffers 1 and 2 as a function of time and initial pH. In particular, between pH 5 and 9, aluminum dissolves significantly, although this corresponds to the stability range of the passivation. The cause of this is believed to be the local increase in pH within the pores of the coating due to Li+/H+ exchange, which results in the passivation stability range being exceeded at the coating/aluminum foil interface, allowing the aluminum to dissolve. The highest aluminum concentrations are achieved between pH 5 and 9 in buffer 2 in the following order:
pH 5: NMC811 > LFP > NMC622 >> NMC622+LFP > NMC523 > NMC111
pH 7: NMC811 > LFP >> NMC622+LFP > NMC622 > NMC523 >> NMC111
pH 9: NMC811 > NMC622+LFP > LFP >> NMC622 >> NMC523 > NMC111
Figure 11.
Time-dependent dissolution of the aluminum collector at different pH values. (a) pHt=0 = 5, (b) pHt=0 = 7, (c) pHt=0 = 9, (d) pHt=0 = 11; solid symbols denote the low-complexing buffer 1 and half symbols denote the complexing buffer 2, θ = 40 °C. The dotted line in (d) is intended to illustrate the trend of the data points for NMC622+LFP, NMC523, and NMC 811 in buffer 1.
Thus, aluminum proves to be most stable in NMC111, while NMC811 promotes dissolution most significantly. At pH 11, the order is reversed; the highest aluminum concentrations are now found in buffer 1 in the order NMC 523 > NMC811 > NMC111 > NMC622+LFP > LFP > NMC622. At significantly lower aluminum concentrations, the result in buffer 2 is NMC811 > NMC622+LFP > NMC523 > NMC111 > LFP >> NMC622.
The reason for this is thought to be the relatively low dissolution of transition metals from NMC811 in buffer 2 between pH 5 and 9, which results in significantly lower consumption of citric acid, leaving it available to complex with the aluminum. Thus, the dissolution of the aluminum collector behaves inversely to the dissolution of the transition metals. At pH = 11, however, the dissolution of aluminum by hydroxide ions begins according to Equation (2). Nevertheless, at pH = 11, a lower aluminum concentration is obtained at the end of the experiment than in the blank measurements, which ultimately resulted in approximately 25 µmol·cm−2. One reason lies in the limited mass transport within the coating’s pore system, which acts as a kinetic barrier to the reaction. This is illustrated by the fact that the temporal evolution of the aluminum concentrations for the NMC622+LFP and NMC523 coatings in Figure 11d shows a sigmoidal curve, which is clearly recognizable by the dotted auxiliary line and is also present for NMC 811, albeit in a less pronounced form. The cathodes with the NMC811 and NMC523 coatings show the highest absolute aluminum concentrations overall in buffer 1, with a maximum at approximately 300 min (Figure 11d). At their maximum, these concentrations nearly reach the value of the dissolution achieved in the blank measurement. Toward the end of the experiment, the aluminum concentration drops again, which can likely be explained by the precipitation of aluminum compounds, such as LiAl(OH)4 (Figures S1 and S3), especially as the lithium concentration also decreases during the same period. Furthermore, the pH value during the leaching of the corresponding electrodes shows a minimum at 300 min and subsequently rises again until the end of the experiment. This presumed precipitation of aluminum compounds also leads to lower aluminum concentrations than in the blank measurement with the uncoated aluminum foil. During the experiment, there is thus an overlap between aluminum dissolution and the parallel precipitation of lithium and aluminum, in which presumably more aluminum was dissolved from the carrier foil than could be detected in the analyses of the solutions.
A phenomenon is observed reproducibly only for the NMC622+LFP coating at pH 11 in buffer 2, as shown in Figure 7d. Within the first few minutes, the lithium concentration rises, reaches a maximum, and then drops significantly over the progress of 210 min. During the same period, the aluminum concentration reaches its maximum value (Figure 11d), which does not change further as the experiment proceeds. At the same time, the pH value reaches its minimum, which also remains constant and corresponds to the minimum value of the blank measurement. These are likely the same mechanisms already observed with NMC523 and NMC811. However, this precipitation occurs significantly earlier in the progress of the experiment, leading to the trends in lithium and aluminum concentration described above. The cause of this earlier onset of the effect is attributed to adhering salt residues that dissolve immediately at the start of the experiment, and the expected increase in pH due to precipitation does not occur because these residues hydrolyze to form acids in the aqueous medium.
3. Discussion
In functional recycling using a waterjet process, the coating of cathode active material is removed by a jet of aqueous medium at high pressure and elevated temperature. As a result, the black mass contains very low levels of metallic impurities. On the other hand, the electrodes—consisting of the aluminum carrier foil and the applied coating of cathode active material—come into contact with the aqueous medium for an extended period of time. This can not only trigger degradation processes in the cathode active material but also cause further reactions on the aluminum carrier foil.
The lower the pH of the process solution used, the more lithium dissolves through Li+/H+ exchange, causing the solution’s pH to rise. The lower the pH value, the more the cathode active material is attacked and transition metal ions dissolve into the solution. The dissolution of the cathode active materials occurs only to a very limited extent in a non-complexing medium, so that there is an enormous molar excess of lithium relative to the dissolved transition metal ions in the solution. Here, the Li+/H+ exchange reaction is the determining process, as the pH change resulting from the exchanged amount of lithium corresponds to the experimentally determined pH change. However, if the process medium acts as a complexing agent and, in some cases, also as a reducing agent on transition metals, a congruent dissolution of the cathode active material occurs in addition to the leaching of lithium. This dissolution leads to a significant increase in the concentrations of transition metal ions and, consequently, to a further increase in the concentration of lithium. The observed pH increase is so pronounced that it can no longer be explained by Li+/H+ exchange alone. In the alkaline medium at pH 11, the solution concentrations of lithium and transition metal ions reach their lowest values, although these are slightly higher in the complexing medium compared with the non-complexing medium.
The presence of the aluminum carrier foil has a specific effect on the reaction behavior with the process media. At lower pH values (5, 7, 9) and in a non-complexing medium, small amounts of aluminum dissolve into the solution, even though the passivation of the aluminum should prevent dissolution in this pH range. If a complexing medium is present that also acts as a complexing agent for aluminum ions—such as citric acid—this promotes dissolution and can multiply the solution concentration at low levels. In this process, solubility decreases from pH 5 to 9 and increases significantly again at pH 11. It should be noted that uncoated carrier films are hardly affected by either medium in the pH range of 5–9, provided there is no coating with cathode active material. The fact that aluminum nevertheless dissolves is due to the massive increase in pH at the surface and particularly within the pore system of the coating, which causes localized destruction of the passivation layer and allows the aluminum to dissolve. However, the dissolution of the aluminum is limited by the mass transfer within the pore system of the coating. Furthermore, in the complexing medium within the pH range of 5–9, a competitive reaction occurs between the complexation of the transition metals and the aluminum, whereby minor leaching of the transition metals promotes increased dissolution of the aluminum collector.
At pHt=0 = 11, aluminum dissolves through the consumption of OH− ions, causing the pH of the solution to decrease slightly. For some types of cathode active materials, an initial sharp increase in lithium–ion concentration followed by a subsequent decrease is observed at pH 11. At the same time, the increase in aluminum concentration is delayed, following a sigmoidal time curve. These observations can be interpreted as colloidal precipitation of LiAl(OH)4, a compound that has already been detected or hypothesized in connection with leaching processes [46].
Electrode coatings containing LFP and an LFP+NMC622 mixture exhibit further special characteristics. In both media, the LFP coating releases lithium ions preferentially, similar to the NMC types. However, in the non-complexing medium, nearly no iron dissolves. Only in the complexing medium is the dissolution of iron time-shifted relative to that of lithium. In the complexing medium at pH 5, nearly stoichiometric dissolution occurs during long treatment durations; in contrast, the solution concentrations of lithium and iron decrease dramatically as the pH increases, so that although there is a significant molar excess of lithium over iron, it occurs at a low concentration level. The NMC622+LFP-coated electrode, on the other hand, exhibits different behavior. Lithium dissolves in every medium, with its concentration decreasing as the pH increases. In contrast, the dissolution of iron in the complexing medium is very low, resulting in a multiple-fold molar excess of lithium relative to the dissolved iron. The dissolution of the transition metals from the NMC622 follows the known pattern of decreasing solution concentrations as the pH increases. However, here too there is a multiple-fold molar excess of transition metal ions relative to the iron ions. Thus, there is an interaction between the medium and the mixed coating of LFP and NMC622, which results in the LFP in the mixture being significantly stabilized relative to the complexing medium—i.e., its dissolution behavior is suppressed—and instead, the attack occurs preferentially on the NMC622. Here, too, the conditions within the coating’s pore system provide an explanation. Due to the Li+/H+ exchange, a medium prevails in the pores that generates a higher pH value in the NMC622+LFP coating than in a coating consisting solely of LFP (analogous to Figure 1). Similar to the results described, a rising pH value suppresses the dissolution of the transition metals, with no significant difference observed between an NMC622- and an NMC622+LFP-coated electrode. In contrast, the dissolution of iron is suppressed much more strongly by the increase in pH than in pure LFP and thus remains practically unaffected.
The studies conducted demonstrate the complex interactions that can occur when electrodes come into contact with coatings containing different cathode active materials and the process medium used in waterjet recycling. The goal of functional recycling is to recover as much of the active material as possible while minimizing—or ideally completely preventing—material degradation. Partial dissolution of the active material would hinder or prevent the direct reuse of the recovered material and additionally contaminate the process solution with dissolved heavy metal ions. Therefore, the selection of suitable parameters for the process media to be used and the process control (process duration, temperature, etc.) is of central importance. In this study, two basic types of process media—a non-complexing and a complexing one—were investigated using a suitable buffer system that provides additional insight into the ongoing processes via a linear change in pH. The experimental parameters were selected to correspond to the technical parameters of waterjet recycling. The results show that non-complexing process media with an initial pH of approximately 9 and the shortest possible contact times with the electrode foils provide the best conditions for recovering cathode active material with minimal degradation. Under these process conditions, the lowest dissolution rates of the metals in the CAM and the aluminum collector are observed and no detectable morphological changes in the CAM were found. In addition, no significant contamination due to deposits was detected. It was demonstrated that, particularly in acidic-to-neutral environments, the use of a complexing buffer causes significant morphological degradation of the CAM. Furthermore, the use of the complexing buffer in the pH range of 5–9 consistently leads to increased dissolution of the aluminum collector resulting in aluminum-containing deposits on the cathode surface as significant contamination of the CAM. Although the CAM shows no morphological degradation in the non-complexing buffer at pH = 11, the dissolution of the aluminum collector still leads, in some cases, to deposits on the cathode surface and thus also to undesirable contamination of the CAM.
4. Materials and Methods
The material used in the experiments is taken from one cell of each material after the disassembly of used traction batteries consisting of pouch cells (NMC111, NMC622, NMC622+LFP) and prismatic cells (NMC523, NMC811, LFP) with liquid electrolytes based on ethylene carbonate and propylene carbonate, with LiPF6 as the dominant conductive salt. The state of aging of the cells is unknown. In the first step, the batteries were deeply discharged at a constant load resistance to transfer the lithium as completely as possible into the positive electrode (hereinafter referred to as the cathode) and to ensure safe opening of the battery. Subsequently, the batteries were opened, the electrodes separated, and the cathode foils washed with ethanol to remove electrolyte and conductive salt residues from the surface. The cathodes were then dried and stored under vacuum.
For the leaching tests, the cathode foils were cut to a size of 70 × 50 mm, and two foil pieces were secured in a reaction vessel for each experiment. Briton–Robinson universal buffers were used as buffer solutions. The first buffer (buffer 1) consists of a mixture of 0.04 M boric acid (VWR, Leuven, Belgium), 0.04 M phosphoric acid (VWR, Fontenay-sous-Bois, France), and 0.04 M acetic acid (Merck, Darmstadt, Germany). The second buffer (buffer 2) consists of 0.0286 M citric acid (Sigma Aldrich, Taufkirchen, Germany), 0.0286 M monopotassium phosphate (Carl Roth, Karlsruhe, Germany), 0.0286 M boric acid (VWR, Leuven, Belgium), 0.0286 M hydroxylamine (Sigma Aldrich, Steinheim, Germany), and 0.0286 M hydrochloric acid (Carl Roth, Karlsruhe, Germany). The veronal used in the literature was replaced here with hydroxylamine, which has a similar pKs value, without changing the buffer properties. An amount of 110 mL of buffer was prepared for each experiment; the initial pH (5, 7, 9, and 11) was adjusted using 0.2 M sodium hydroxide (Merck, Darmstadt, Germany) solution, and the total volume was filled to 220 mL with deionized water with a conductivity of 0,055 µS·cm−1. All chemicals used in this study were of analytical grade. This 220 mL buffer solution was preheated to 40 °C and then added to the reaction vessel containing the fixed electrode foils. The temperature of 40 °C was maintained throughout the entire duration of the experiment; the solution was stirred using a magnetic stirrer at a speed of 600 rpm. An aliquot of 1 mL was taken from the reaction vessel at regular intervals and immediately diluted 10-fold with nitric acid (Merck, Darmstadt, Germany) (1% v/v). In a parallel experiment using the same volume of buffer solution, and the same stirring speed and temperature control, the mass loss of the solution caused by sampling and evaporation was determined. A “WTW inoLab Multi 9310 IDS” with a “Sentix® 940” pH electrode was used to determine the pH value.
The composition of the used cathode foils [57] as well as the dissolved elements in the buffer solutions were determined using an inductively coupled plasma optical emission spectrometer (ICP-OES) with a dual-view option (iCap 6500 DUO, Thermo Scientific, Dreieich, Germany). The sample introduction system consisted of a polyetheretherketone (PEEK) parallel-path nebulizer (MiraMist, Burgener Inc., Mississauga, ON, Canada) connected to a cyclone spray chamber (Glass Expansion, Port Melbourne, Victoria, Australia) and a ceramic injection tube (Glass Expansion, Port Melbourne, Victoria, Australia). An 8-point calibration was established for quantification. The matrix-matched multi-element standards were prepared from single-element standards of 1000 mg·L−1 (Merck, Germany). All stated uncertainties are given as 2σ and are the result of a Gaussian error propagation across the entire process for 3 replicated measurements. They include uncertainties arising from both the analytical measurement and the procedure itself, such as weighing uncertainties. The calibrations were adjusted to the final solution concentration values obtained in the respective experiments. The resulting limits of quantification were normalized to the absolute amounts of substance nx,total of the cathodes used and are summarized in the Supplements (Tables S3–S8). The limits of quantification were determined in accordance with DIN 32645 [58].
Based on the analytically determined composition of the cathodes (wk,x; mass fraction of component x in the cathode) used (Table 2), their areal density ρa, and the total surface area of the cathode (AK) used in the experiment, Equation 3 is used to calculate the absolute amount of substance nx,total for each element x to be determined, where x = Li, Ni, Co, Mn, Fe, Al. Here, Mx is the molar mass of component x.
The amounts of substance x leached from the cathode foil at a specific time t during the experiment are calculated according to Equation (4), where i = 0, and Equation (5). Here, i (where i = 1, …, N) denotes the sample collection, and each i can be assigned a specific time t.
wx,i is the mass fraction of element x at time t, as determined by ICP-OES, and mi is the total mass of the solution immediately before each sample withdrawal i. The decrease in the total mass of the solution that occurs during the experiment is due to the collection of aliquots for analytical determination and slight evaporation. mA corresponds to the mass of an aliquot. The total amount of substance nx leached at any given time t is converted into a leaching efficiency using Equation (6).
Notwithstanding the above, the amount of aluminum that dissolves is normalized to its accessible surface area.
The characterization of the CAM was performed with a scanning electron microscope (Zeiss Evo MA15) and the energy dispersive X-ray analysis (EDX) was used for spatially resolved elemental distribution. The elemental analysis and the secondary electron image have been recorded with a detector system from AMETEKR operating at 20 kV.
Supplementary Materials
The following supporting information can be downloaded at https://www.mdpi.com/article/10.3390/recycling11070133/s1, Figure S1: SEM studies of various NMC cathodes in both buffers at different pHt=0, the image size is 58 µm × 39 µm; Table S1: Slopes (ΔpH/ΔOH− = mbx in mmol−1) of the relationship between pH and proton concentration for both buffer systems from [51] for the respective validity ranges; b1 refers to buffer 1 and b2 refers to buffer 2; pH1 is the lower limit and pH2 is the upper limit of the validity range; Figure S2: Time-dependent pH values at different initial pH values: (a) pHt=0 = 5, (b) pHt=0 = 7, (c) pHt=0 = 9, (d) pHt=0 = 11; solid symbols denote the low-complexing buffer 1 and half symbols denote the complexing buffer 2, θ = 40 °C; Figure S3: REM-EDX analyses of cathode surface with deposits, (a) image, (b) EDX aluminum, EDX oxygen, EDX nickel, EDX manganese, EDX cobalt; NMC 622 @ pH = 7, buffer 2, t = 1500 min; Figure S4: visual inspection of the buffer solutions and the treated positive electrodes containing NMC 622, t = 25 h, θ = 40 °C; Figure S5: Time-dependent trend of the absolute amounts of lithium leached at different pH values (a) pHt=0 = 5, (b) pHt=0 = 7, (c) pHt=0 = 9, (d) pHt=0 = 11; solid symbols denote the low-complexing buffer 1 and half symbols denote the complexing buffer 2, θ = 40 °C; Figure S6: Average stoichiometric leaching factors for the transition metals Ni, Co, and Mn from an NMC 523-coated cathode at various pH values; buffer 1 on the left and buffer 2 on the right, θ = 40 °C; the red dotted line indicates the stoichiometry of the starting material; white box plots: Values from single-element analysis are below the LOQ; Figure S7: Average stoichiometric leaching factors for the transition metals Ni, Co, and Mn from an NMC 622-coated cathode at various pH values; buffer 1 on the left and buffer 2 on the right, θ = 40 °C; the red dotted line indicates the stoichiometry of the starting material; white box plots: Values from single-element analysis are below the LOQ; Figure S8: Average stoichiometric leaching factors for the transition metals Ni, Co, and Mn from an NMC622+LFP-coated cathode at various pH values; buffer 1 on the left and buffer 2 on the right, θ = 40 °C; the red dotted line indicates the stoichiometry of the starting material; white box plots: Values from single-element analysis are below the LOQ; Figure S9: Average stoichiometric leaching factors for the transition metals Ni, Co, and Mn from an NMC 811-coated cathode at various pH values; buffer 1 on the left and buffer 2 on the right, θ = 40 °C; the red dotted line indicates the stoichiometry of the starting material; white box plots: Values from single-element analysis are below the LOQ; Figure S10: Time-dependent trend of the absolute amounts of lithium leached at different pH values (a) pHt=0 = 5, (b) pHt=0 = 7, (c) pHt=0 = 9, (d) pHt=0 = 11; solid symbols denote the low-complexing buffer 1 and half symbols denote the complexing buffer 2, θ = 40 °C; Figure S11: Time-dependent trend of the absolute amounts of nickel leached at different pH values (a) pHt=0 = 5, (b) pHt=0 = 7, (c) pHt=0 = 9, (d) pHt=0 = 11; solid symbols denote the low-complexing buffer 1 and half symbols denote the complexing buffer 2, θ = 40 °C; Figure S12: Time-dependent leaching of nickel at different pH values (a) pHt=0 = 5, (b) pHt=0 = 7, (c) pHt=0 = 9, (d) pHt=0 = 11; solid symbols denote the low-complexing buffer 1 and half symbols denote the complexing buffer 2, θ = 40 °C; Figure S13: Time series of the absolute amounts of manganese leached at different pH values (a) pHt=0 = 5, (b) pHt=0 = 7, (c) pHt=0 = 9, (d) pHt=0 = 11; solid symbols denote the low-complexing buffer 1 and half symbols denote the complexing buffer 2, θ = 40 °C; Figure S14: Time-dependent leaching of manganese at different pH levels (a) pHt=0 = 5, (b) pHt=0 = 7, (c) pHt=0 = 9, (d) pHt=0 = 11; solid symbols denote the low-complexing buffer 1 and half symbols denote the complexing buffer 2, θ = 40 °C; Figure S15: Time-dependent trend of the leached absolute amounts of cobalt at different pH values (a) pHt=0 = 5, (b) pHt=0 = 7, (c) pHt=0 = 9, (d) pHt=0 = 11; solid symbols denote the low-complexing buffer 1 and half symbols denote the complexing buffer 2, θ = 40 °C; Figure S16: Time-dependent leaching of cobalt at different pH values (a) pHt=0 = 5, (b) pHt=0 = 7, (c) pHt=0 = 9, (d) pHt=0 = 11; solid symbols denote the low-complexing buffer 1 and half symbols denote the complexing buffer 2, θ = 40 °C; Table S2: Determined rate constants for the initial reaction rate (0–2 min), first-order reaction, all values in min−1; Figure S17: Time-dependent leaching of iron at different pH levels (a) pHt=0 = 5, (b) pHt=0 = 7, (c) pHt=0 = 9, (d) pHt=0 = 11; solid symbols denote the low-complexing buffer 1 and half symbols denote the complexing buffer 2, θ = 40 °C; Figure S18: Time-dependent dissolution of uncoated aluminum foil at various pH values (a) pHt=0 = 5, (b) pHt=0 = 7, (c) pHt=0 = 9, (d) pHt=0 = 11 in the complexing buffer 2, θ = 40 °C; Table S3: LOQ of Lithium in %; Table S4: LOQ of Nickel in %; Table S5: LOQ of Cobalt in %; Table S6: LOQ of Manganese in %; Table S7: LOQ of Iron in %; Table S8: LOQ of Aluminum in µmol·cm−2.
Author Contributions
Conceptualization, T.L.; methodology, T.L. and A.R.; writing—original draft preparation, T.L.; writing—review and editing, J.A.; visualization, T.L. and A.R.; supervision, J.A. All authors have read and agreed to the published version of the manuscript.
Funding
This research was funded by Federal Ministry of Research, Technology and Space: (BMFTR) under grant number 03XP0548C.
Data Availability Statement
The original contributions presented in this study are included in the Article/Supplementary Materials. Further inquiries can be directed to the corresponding author.
Conflicts of Interest
The authors declare no conflicts of interest.
References
- ZSW Data on Stock as Well as on New Registrations of Battery-Electric Vehicles. Available online: https://www.zsw-bw.de/en/media-center/data-service.html#c6700 (accessed on 28 May 2026).
- Costa, C.M.; Barbosa, J.C.; Gonçalves, R.; Castro, H.; Campo, F.J.D.; Lanceros-Méndez, S. Recycling and Environmental Issues of Lithium-Ion Batteries: Advances, Challenges and Opportunities. Energy Storage Mater. 2021, 37, 433–465. [Google Scholar] [CrossRef] [Scilit]
- Hsieh, I.-Y.L.; Pan, M.S.; Chiang, Y.-M.; Green, W.H. Learning Only Buys You so Much: Practical Limits on Battery Price Reduction. Appl. Energy 2019, 239, 218–224. [Google Scholar] [CrossRef] [Scilit]
- Zou, H.; Gratz, E.; Apelian, D.; Wang, Y. A Novel Method to Recycle Mixed Cathode Materials for Lithium Ion Batteries. Green Chem. 2013, 15, 1183. [Google Scholar] [CrossRef] [Scilit]
- Larouche, F.; Tedjar, F.; Amouzegar, K.; Houlachi, G.; Bouchard, P.; Demopoulos, G.P.; Zaghib, K. Progress and Status of Hydrometallurgical and Direct Recycling of Li-Ion Batteries and Beyond. Materials 2020, 13, 801. [Google Scholar] [CrossRef] [Scilit] [PubMed]
- Chen, L.; Tang, X.; Zhang, Y.; Li, L.; Zeng, Z.; Zhang, Y. Process for the Recovery of Cobalt Oxalate from Spent Lithium-Ion Batteries. Hydrometallurgy 2011, 108, 80–86. [Google Scholar] [CrossRef] [Scilit]
- Jha, M.K.; Kumari, A.; Jha, A.K.; Kumar, V.; Hait, J.; Pandey, B.D. Recovery of Lithium and Cobalt from Waste Lithium Ion Batteries of Mobile Phone. Waste Manag. 2013, 33, 1890–1897. [Google Scholar] [CrossRef] [Scilit] [PubMed]
- Chen, X.; Guo, C.; Ma, H.; Li, J.; Zhou, T.; Cao, L.; Kang, D. Organic Reductants Based Leaching: A Sustainable Process for the Recovery of Valuable Metals from Spent Lithium Ion Batteries. Waste Manag. 2018, 75, 459–468. [Google Scholar] [CrossRef] [Scilit] [PubMed]
- Lee, C.K.; Rhee, K.-I. Reductive Leaching of Cathodic Active Materials from Lithium Ion Battery Wastes. Hydrometallurgy 2003, 68, 5–10. [Google Scholar] [CrossRef] [Scilit]
- Li, L.; Chen, R.; Sun, F.; Wu, F.; Liu, J. Preparation of LiCoO2 Films from Spent Lithium-Ion Batteries by a Combined Recycling Process. Hydrometallurgy 2011, 108, 220–225. [Google Scholar] [CrossRef] [Scilit]
- Pinna, E.G.; Ruiz, M.C.; Ojeda, M.W.; Rodriguez, M.H. Cathodes of Spent Li-Ion Batteries: Dissolution with Phosphoric Acid and Recovery of Lithium and Cobalt from Leach Liquors. Hydrometallurgy 2017, 167, 66–71. [Google Scholar] [CrossRef] [Scilit]
- Li, J.; Shi, P.; Wang, Z.; Chen, Y.; Chang, C.-C. A Combined Recovery Process of Metals in Spent Lithium-Ion Batteries. Chemosphere 2009, 77, 1132–1136. [Google Scholar] [CrossRef] [Scilit] [PubMed]
- Shuva, M.A.H.; Kurny, A.S.W. Dissolution Kinetics of Cathode of Spent Lithium Ion Battery in Hydrochloric Acid Solutions. J. Inst. Eng. India Ser. D. 2013, 94, 13–16. [Google Scholar] [CrossRef] [Scilit]
- Sun, L.; Qiu, K. Organic Oxalate as Leachant and Precipitant for the Recovery of Valuable Metals from Spent Lithium-Ion Batteries. Waste Manag. 2012, 32, 1575–1582. [Google Scholar] [CrossRef] [Scilit] [PubMed]
- Li, L.; Ge, J.; Chen, R.; Wu, F.; Chen, S.; Zhang, X. Environmental Friendly Leaching Reagent for Cobalt and Lithium Recovery from Spent Lithium-Ion Batteries. Waste Manag. 2010, 30, 2615–2621. [Google Scholar] [CrossRef] [Scilit] [PubMed]
- Li, L.; Dunn, J.B.; Zhang, X.X.; Gaines, L.; Chen, R.J.; Wu, F.; Amine, K. Recovery of Metals from Spent Lithium-Ion Batteries with Organic Acids as Leaching Reagents and Environmental Assessment. J. Power Sources 2013, 233, 180–189. [Google Scholar] [CrossRef] [Scilit]
- Li, L.; Lu, J.; Ren, Y.; Zhang, X.X.; Chen, R.J.; Wu, F.; Amine, K. Ascorbic-Acid-Assisted Recovery of Cobalt and Lithium from Spent Li-Ion Batteries. J. Power Sources 2012, 218, 21–27. [Google Scholar] [CrossRef] [Scilit]
- Nayaka, G.P.; Pai, K.V.; Santhosh, G.; Manjanna, J. Recovery of Cobalt as Cobalt Oxalate from Spent Lithium Ion Batteries by Using Glycine as Leaching Agent. J. Environ. Chem. Eng. 2016, 4, 2378–2383. [Google Scholar] [CrossRef] [Scilit]
- Nayaka, G.P.; Pai, K.V.; Manjanna, J.; Keny, S.J. Use of Mild Organic Acid Reagents to Recover the Co and Li from Spent Li-Ion Batteries. Waste Manag. 2016, 51, 234–238. [Google Scholar] [CrossRef] [Scilit] [PubMed]
- Cheng, Q.; Chirdon, W.M.; Lin, M.; Mishra, K.; Zhou, X. Characterization, Modeling, and Optimization of a Single-Step Process for Leaching Metallic Ions from LiNi1/3Co1/3Mn1/3O2 Cathodes for the Recycling of Spent Lithium-Ion Batteries. Hydrometallurgy 2019, 185, 1–11. [Google Scholar] [CrossRef] [Scilit]
- Liu, T.; Chen, J.; Li, H.; Li, K. An Integrated Process for the Separation and Recovery of Valuable Metals from the Spent LiNi0.5Co0.2Mn0.3O2 Cathode Materials. Sep. Purif. Technol. 2020, 245, 116869. [Google Scholar] [CrossRef] [Scilit]
- Lv, W.; Wang, Z.; Cao, H.; Zheng, X.; Jin, W.; Zhang, Y.; Sun, Z. A Sustainable Process for Metal Recycling from Spent Lithium-Ion Batteries Using Ammonium Chloride. Waste Manag. 2018, 79, 545–553. [Google Scholar] [CrossRef] [Scilit] [PubMed]
- Meshram, P.; Abhilash; Pandey, B.D.; Mankhand, T.R.; Deveci, H. Comparision of Different Reductants in Leaching of Spent Lithium Ion Batteries. JOM 2016, 68, 2613–2623. [Google Scholar] [CrossRef] [Scilit]
- Wang, R.-C.; Lin, Y.-C.; Wu, S.-H. A Novel Recovery Process of Metal Values from the Cathode Active Materials of the Lithium-Ion Secondary Batteries. Hydrometallurgy 2009, 99, 194–201. [Google Scholar] [CrossRef] [Scilit]
- Zhuang, L.; Sun, C.; Zhou, T.; Li, H.; Dai, A. Recovery of Valuable Metals from LiNi0.5Co0.2Mn0.3O2 Cathode Materials of Spent Li-Ion Batteries Using Mild Mixed Acid as Leachant. Waste Manag. 2019, 85, 175–185. [Google Scholar] [CrossRef] [Scilit] [PubMed]
- He, L.-P.; Sun, S.-Y.; Mu, Y.-Y.; Song, X.-F.; Yu, J.-G. Recovery of Lithium, Nickel, Cobalt, and Manganese from Spent Lithium-Ion Batteries Using l -Tartaric Acid as a Leachant. ACS Sustain. Chem. Eng. 2017, 5, 714–721. [Google Scholar] [CrossRef] [Scilit]
- Li, L.; Fan, E.; Guan, Y.; Zhang, X.; Xue, Q.; Wei, L.; Wu, F.; Chen, R. Sustainable Recovery of Cathode Materials from Spent Lithium-Ion Batteries Using Lactic Acid Leaching System. ACS Sustain. Chem. Eng. 2017, 5, 5224–5233. [Google Scholar] [CrossRef] [Scilit]
- Zheng, X.; Zhu, Z.; Lin, X.; Zhang, Y.; He, Y.; Cao, H.; Sun, Z. A Mini-Review on Metal Recycling from Spent Lithium Ion Batteries. Engineering 2018, 4, 361–370. [Google Scholar] [CrossRef] [Scilit]
- Gaines, L.; Richa, K.; Spangenberger, J. Key Issues for Li-Ion Battery Recycling. MRS Energy Sustain. 2018, 5, 12. [Google Scholar] [CrossRef] [Scilit]
- Huang, B.; Pan, Z.; Su, X.; An, L. Recycling of Lithium-Ion Batteries: Recent Advances and Perspectives. J. Power Sources 2018, 399, 274–286. [Google Scholar] [CrossRef] [Scilit]
- U.S. Geological Survey. Mineral Commodity Summaries 2024; U.S. Geological Survey: Reston, VA, USA, 2024. [CrossRef]
- Bae, H.; Kim, Y. Technologies of Lithium Recycling from Waste Lithium Ion Batteries: A Review. Mater. Adv. 2021, 2, 3234–3250. [Google Scholar] [CrossRef] [Scilit]
- Zeng, X.; Li, J.; Singh, N. Recycling of Spent Lithium-Ion Battery: A Critical Review. Crit. Rev. Environ. Sci. Technol. 2014, 44, 1129–1165. [Google Scholar] [CrossRef] [Scilit]
- Schmidt, M.; Göckeritz, M.; Peasold-Runge, D.; Göbel, F.; Wienold, H. Verfahren zum Recycling von Lithium-Ionenakkumulatoren. EP3563446B1, 3 June 2020. [Google Scholar]
- Sojka, R.; Pan, Q.; Billmann, L. Comparative Study of Li-Ion Battery Recycling Processes; ACCUREC Recycling GmbH: Krefeld, Germany, 2020. [Google Scholar]
- Ji, Y.; Jafvert, C.T.; Kpodzro, E.E.; Zhao, F. Chemical-Free Pressure Washing System as Pretreatment to Harvest Cathode Materials. Waste Manag. 2022, 153, 121–128. [Google Scholar] [CrossRef] [Scilit] [PubMed]
- Kurz, L.; Faryadras, M.; Klugius, I.; Reichert, F.; Scheibe, A.; Schmidt, M.; Wörner, R. Global Warming Potential of a New Waterjet-Based Recycling Process for Cathode Materials of Lithium-Ion Batteries. Batteries 2021, 7, 29. [Google Scholar] [CrossRef] [Scilit]
- Li, H.; Gao, J.; Zhang, S. Effect of Overdischarge on Swelling and Recharge Performance of Lithium Ion Cells. Chin. J. Chem. 2008, 26, 1585–1588. [Google Scholar] [CrossRef] [Scilit]
- Guo, R.; Lu, L.; Ouyang, M.; Feng, X. Mechanism of the Entire Overdischarge Process and Overdischarge-Induced Internal Short Circuit in Lithium-Ion Batteries. Sci. Rep. 2016, 6, 30248. [Google Scholar] [CrossRef] [Scilit] [PubMed]
- Langner, T.; Sieber, T.; Acker, J. Studies on the Deposition of Copper in Lithium-Ion Batteries during the Deep Discharge Process. Sci. Rep. 2021, 11, 6316. [Google Scholar] [CrossRef] [Scilit] [PubMed]
- Flügel, M.; Waldmann, T.; Kasper, M.; Wohlfahrt-Mehrens, M. Detection of Copper Deposition on Anodes of Over-Discharged Lithium Ion Cells by GD-OES Depth Profiling. ChemPhysChem 2020, 21, 2047–2050. [Google Scholar] [CrossRef] [Scilit] [PubMed]
- Langner, T.; Sieber, T.; Rietig, A.; Merk, V.; Pfeifer, L.; Acker, J. A Phenomenological and Quantitative View on the Degradation of Positive Electrodes from Spent Lithium-Ion Batteries in Humid Atmosphere. Sci. Rep. 2023, 13, 5671. [Google Scholar] [CrossRef] [Scilit] [PubMed]
- Huttner, F.; Diener, A.; Heckmann, T.; Eser, J.C.; Abali, T.; Mayer, J.K.; Scharfer, P.; Schabel, W.; Kwade, A. Increased Moisture Uptake of NCM622 Cathodes after Calendering Due to Particle Breakage. J. Electrochem. Soc. 2021, 168, 090539. [Google Scholar] [CrossRef] [Scilit]
- Busà, C.; Belekoukia, M.; Loveridge, M.J. The Effects of Ambient Storage Conditions on the Structural and Electrochemical Properties of NMC-811 Cathodes for Li-Ion Batteries. Electrochim. Acta 2021, 366, 137358. [Google Scholar] [CrossRef] [Scilit]
- Wood, M.; Li, J.; Ruther, R.E.; Du, Z.; Self, E.C.; Meyer, H.M.; Daniel, C.; Belharouak, I.; Wood, D.L. Chemical Stability and Long-Term Cell Performance of Low-Cobalt, Ni-Rich Cathodes Prepared by Aqueous Processing for High-Energy Li-Ion Batteries. Energy Storage Mater. 2020, 24, 188–197. [Google Scholar] [CrossRef] [Scilit]
- Sieber, T.; Ducke, J.; Rietig, A.; Langner, T.; Acker, J. Recovery of Li(Ni0.33Mn0.33Co0.33)O2 from Lithium-Ion Battery Cathodes: Aspects of Degradation. Nanomaterials 2019, 9, 246. [Google Scholar] [CrossRef] [Scilit] [PubMed]
- Shkrob, I.A.; Gilbert, J.A.; Phillips, P.J.; Klie, R.; Haasch, R.T.; Bareño, J.; Abraham, D.P. Chemical Weathering of Layered Ni-Rich Oxide Electrode Materials: Evidence for Cation Exchange. J. Electrochem. Soc. 2017, 164, A1489–A1498. [Google Scholar] [CrossRef] [Scilit]
- Billy, E.; Joulié, M.; Laucournet, R.; Boulineau, A.; De Vito, E.; Meyer, D. Dissolution Mechanisms of LiNi1/3Mn1/3Co1/3O2 Positive Electrode Material from Lithium-Ion Batteries in Acid Solution. ACS Appl. Mater. Interfaces 2018, 10, 16424–16435. [Google Scholar] [CrossRef] [Scilit]
- Engler, J.; Tsoufios, A.; Winter, M.; Börner, M.; Wiemers-Meyer, S.; Nowak, S. Understanding Aqueous Processing of Positive Electrodes for Lithium Ion Batteries: Investigation of the Interaction Mechanism of LiNi0.8Mn0.1Co0.1O2 with Water via a D2O Treatment Approach. Adv. Energy Sustain. Res. 2026, 7, e202500416. [Google Scholar] [CrossRef] [Scilit]
- Bauer, W.; Çetinel, F.A.; Müller, M.; Kaufmann, U. Effects of pH Control by Acid Addition at the Aqueous Processing of Cathodes for Lithium Ion Batteries. Electrochim. Acta 2019, 317, 112–119. [Google Scholar] [CrossRef] [Scilit]
- Britton, H.T.S.; Robinson, A.R. Universal Buffer Solutions and the Dissociation Constant of Veronal. J. Chem. Soc. 1931, 134, 1456–1462. [Google Scholar] [CrossRef] [Scilit]
- Apelblat, A.; Barthel, J. Conductance Studies on Aqueous Citric Acid. Z. Naturforsch. 1991, 46, 131–140. [Google Scholar] [CrossRef] [Scilit]
- Eby, G. Stability Constants (log K1) of Various Metal Chelates. In CRC Handbook of Food Additives; Furia, T.E., Ed.; Chapter 6: Sequestrants in Foods; CRC Press: Boca Raton, FL, USA, 2006; pp. 271–294. [Google Scholar]
- Lopez-Quintela, M.A.; Knoche, W.; Veith, J. Kinetics and thermodynamics of complex formation between aluminium(III) and citric acid in aqueous solution. J. Chem. Soc. Faraday Trans. 1984, 80, 2313–2321. [Google Scholar] [CrossRef] [Scilit]
- Van Hoonacker, A.; Englebienne, P. Revisiting Silver Nanoparticle Chemical Synthesis and Stability by Optical Spectroscopy. Curr. Nanosci. 2006, 2, 359–371. [Google Scholar] [CrossRef] [Scilit]
- Zhu, J.; Hihara, L.H. Corrosion of Continuous Alumina-Fibre Reinforced Al–2 wt.% Cu–T6 Metal–Matrix Composite in 3.15 wt.% NaCl Solution. Corros. Sci. 2010, 52, 406–415. [Google Scholar] [CrossRef] [Scilit]
- Dommaschk, M.; Sieber, T.; Acker, J. Lithium-Ion Batteries: Direct Solid Sampling for Characterisation of Black Mass Recyclates Using Graphite Furnace Atomic Absorption Spectrometry. J. Anal. At. Spectrom. 2024, 39, 2522–2531. [Google Scholar] [CrossRef] [Scilit]
- DIN32 645; Chemical Analysis—Decision Limit, Detection Limit and Determination Limit, Estimation in Case of Repeatability—Terms, Methods, Evaluation. Beuth Verlag: Berlin, Germany, 1994.
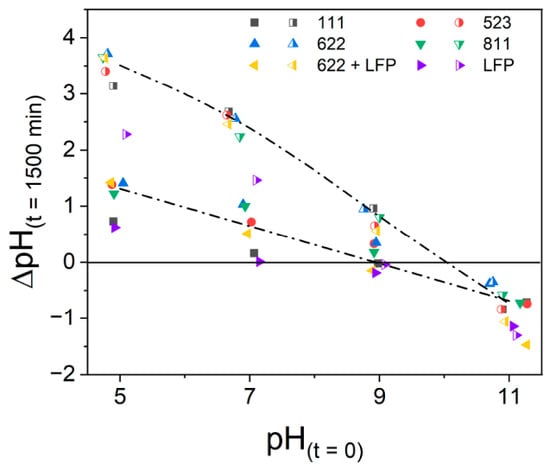
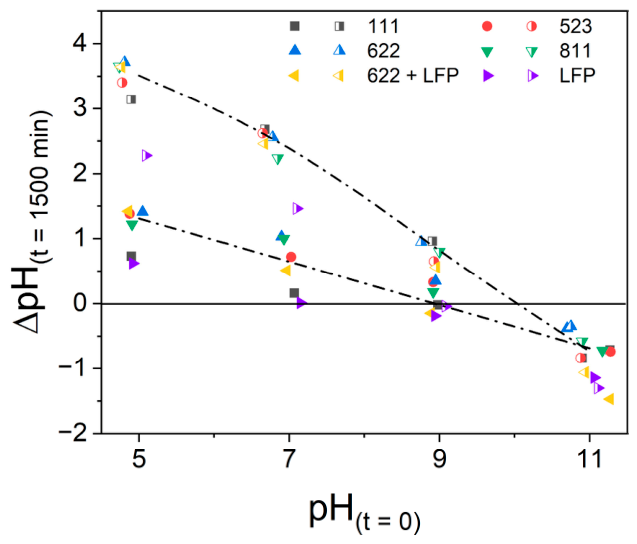
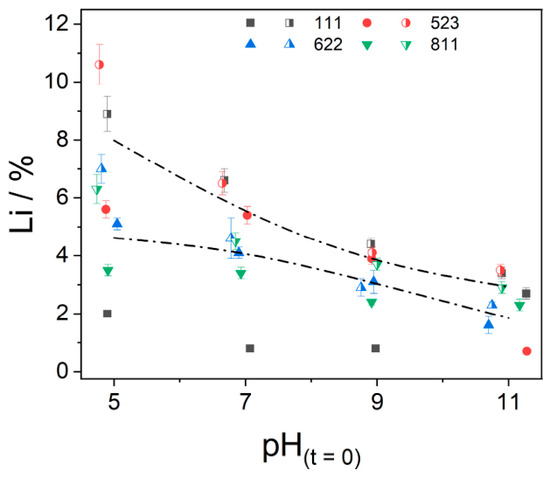
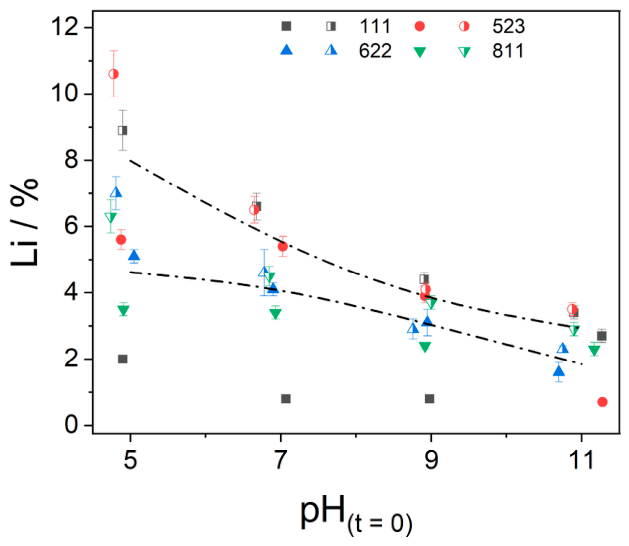
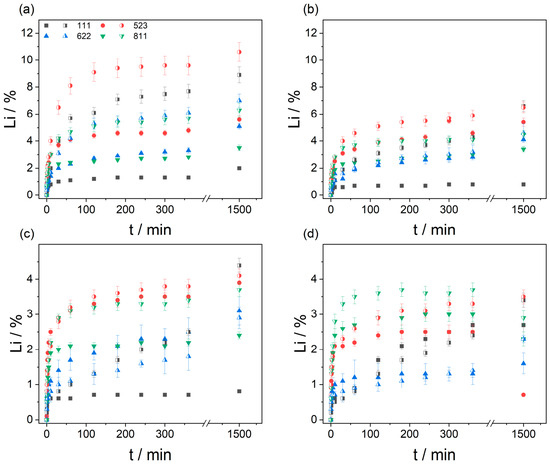
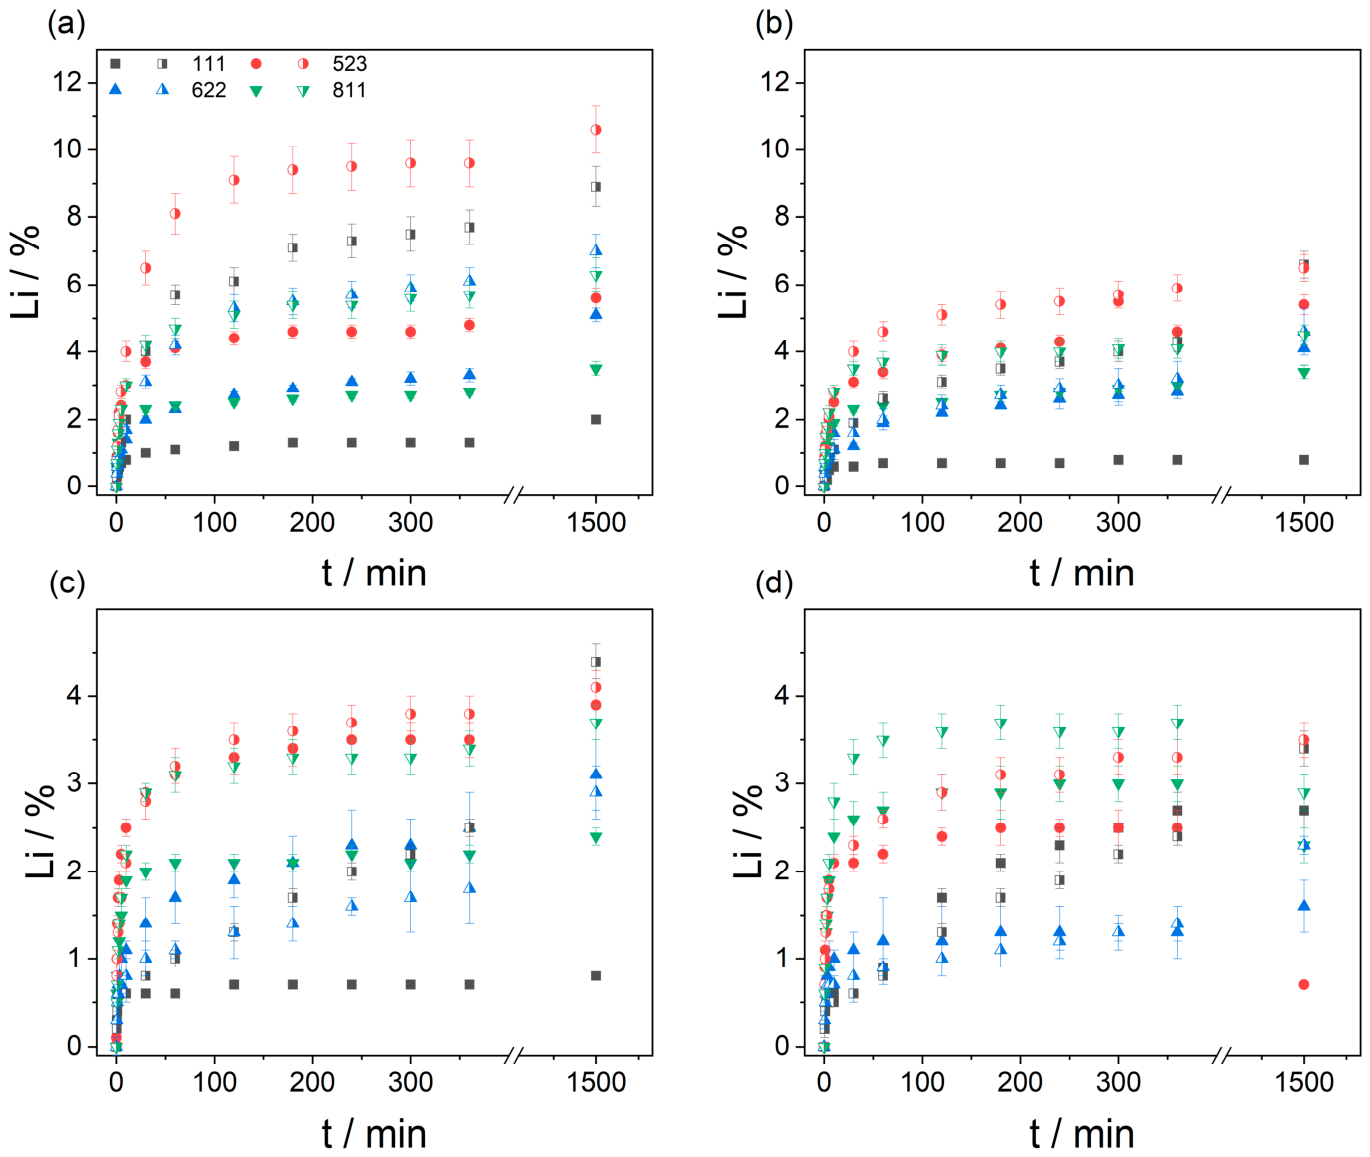
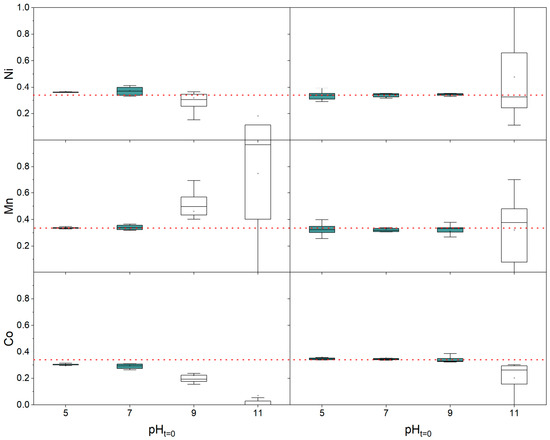
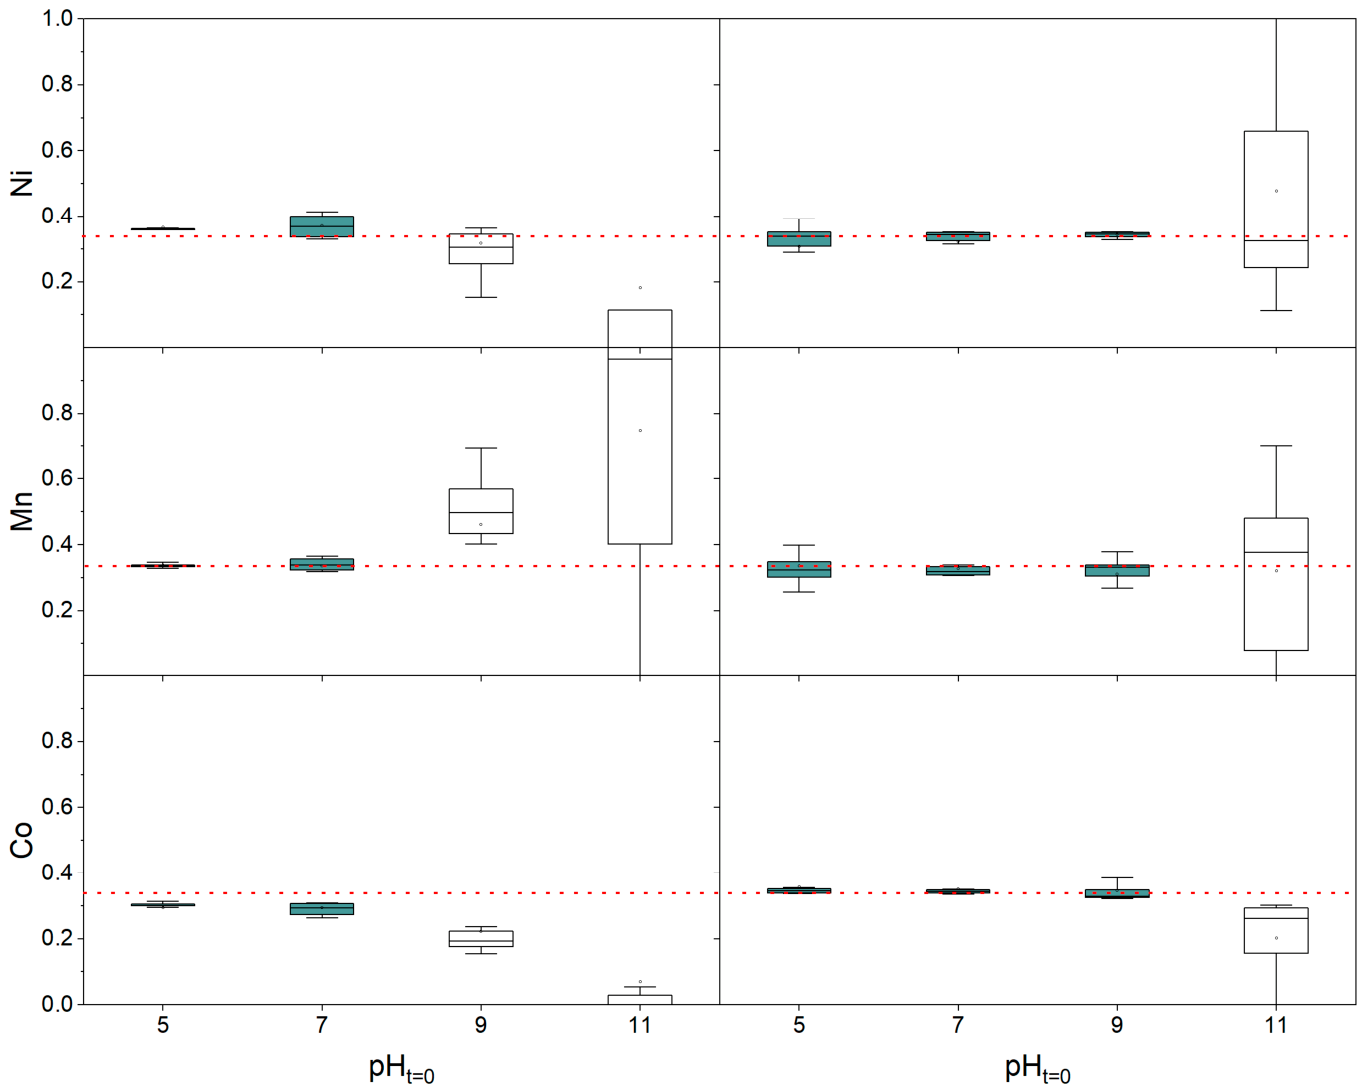
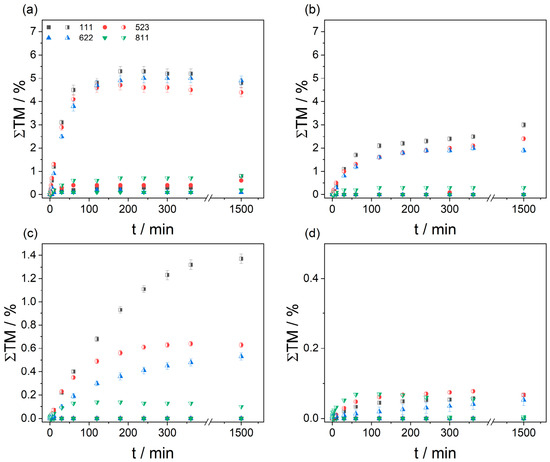
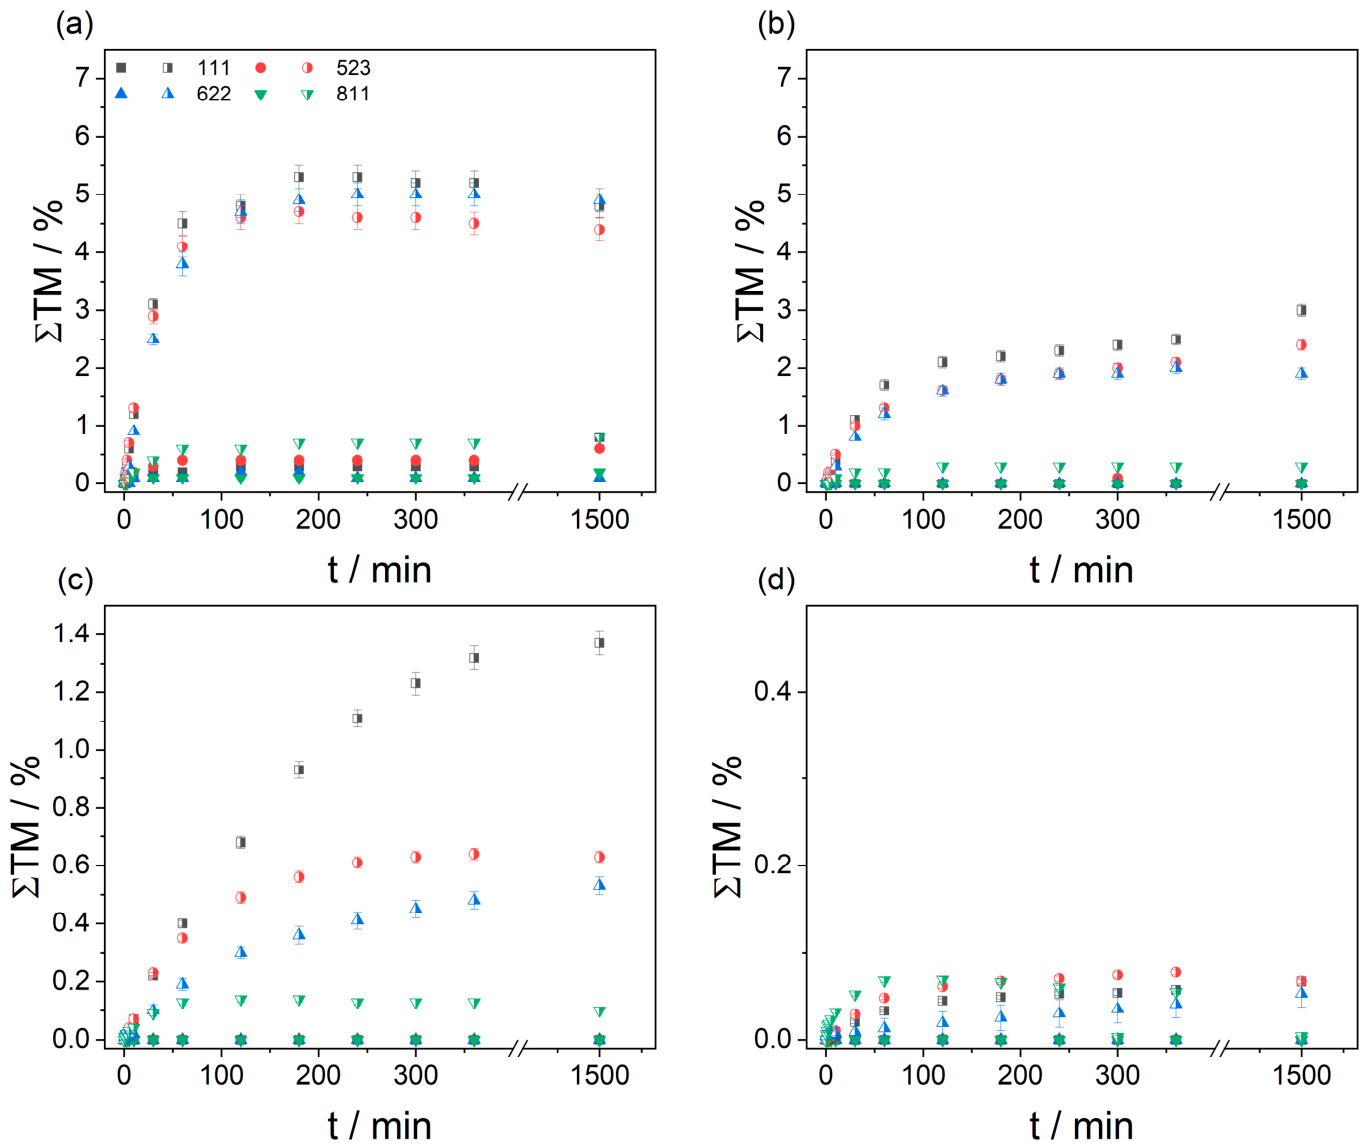
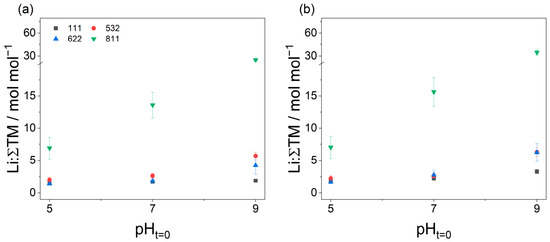
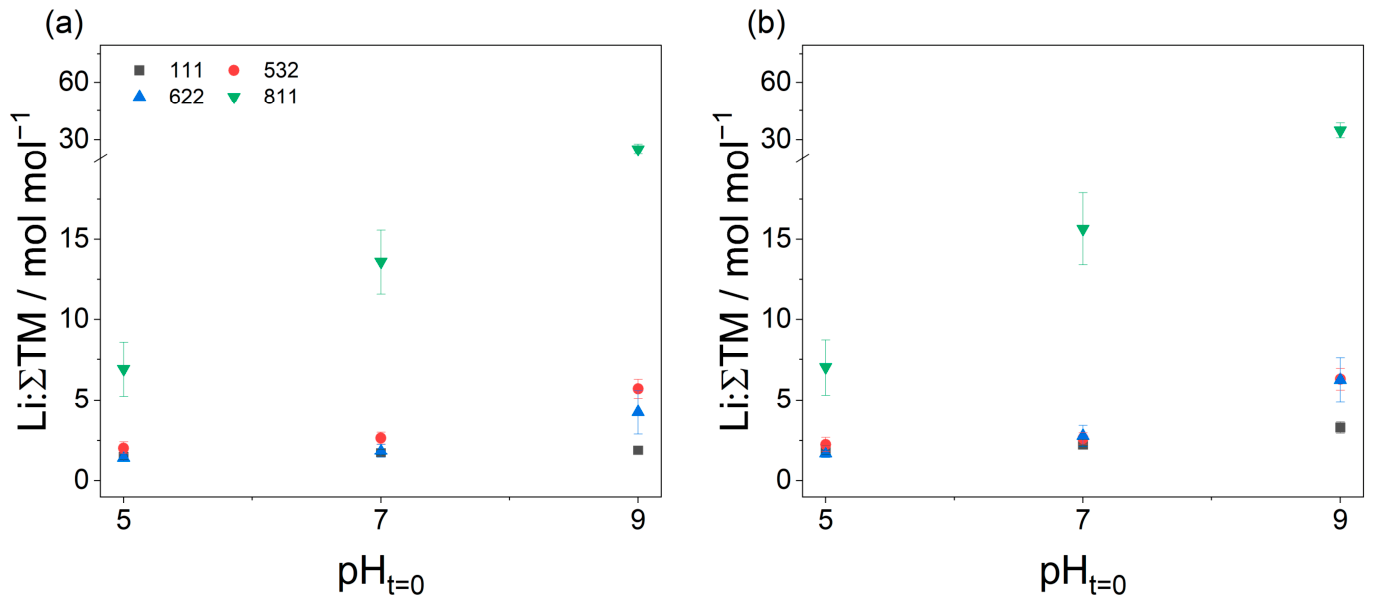
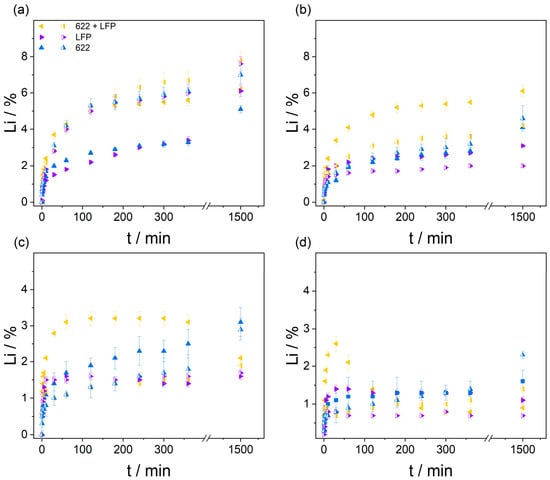
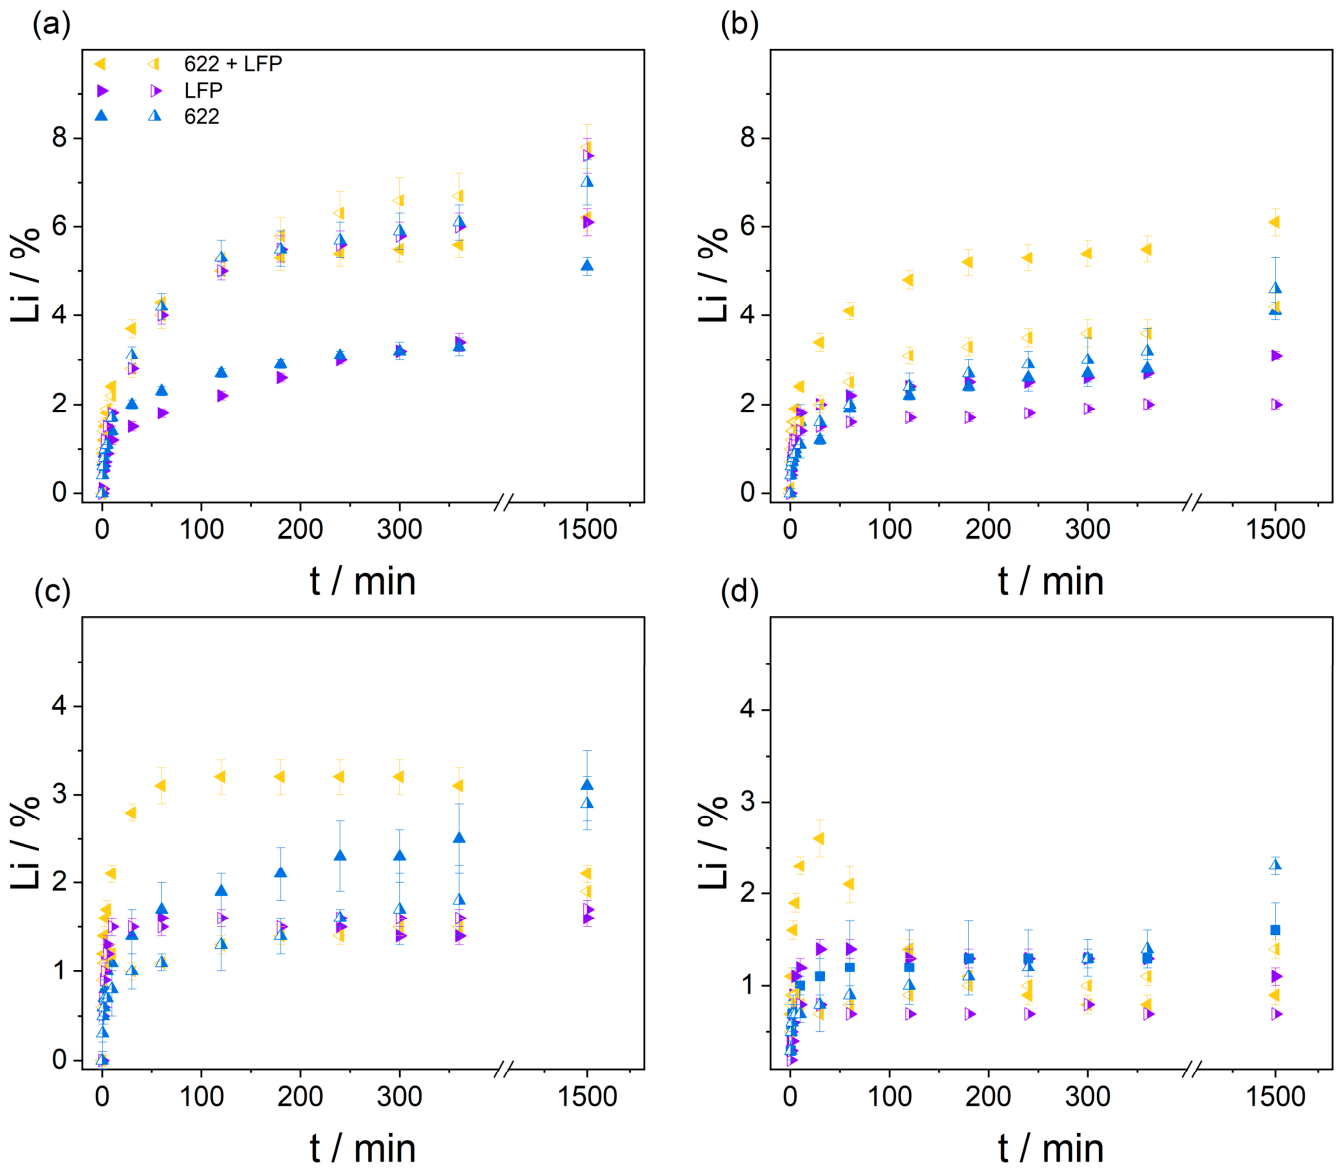
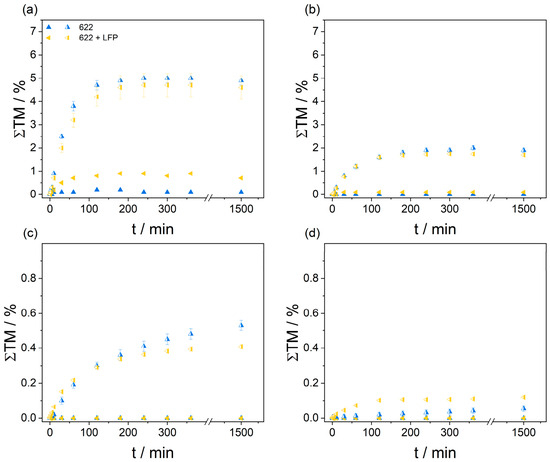
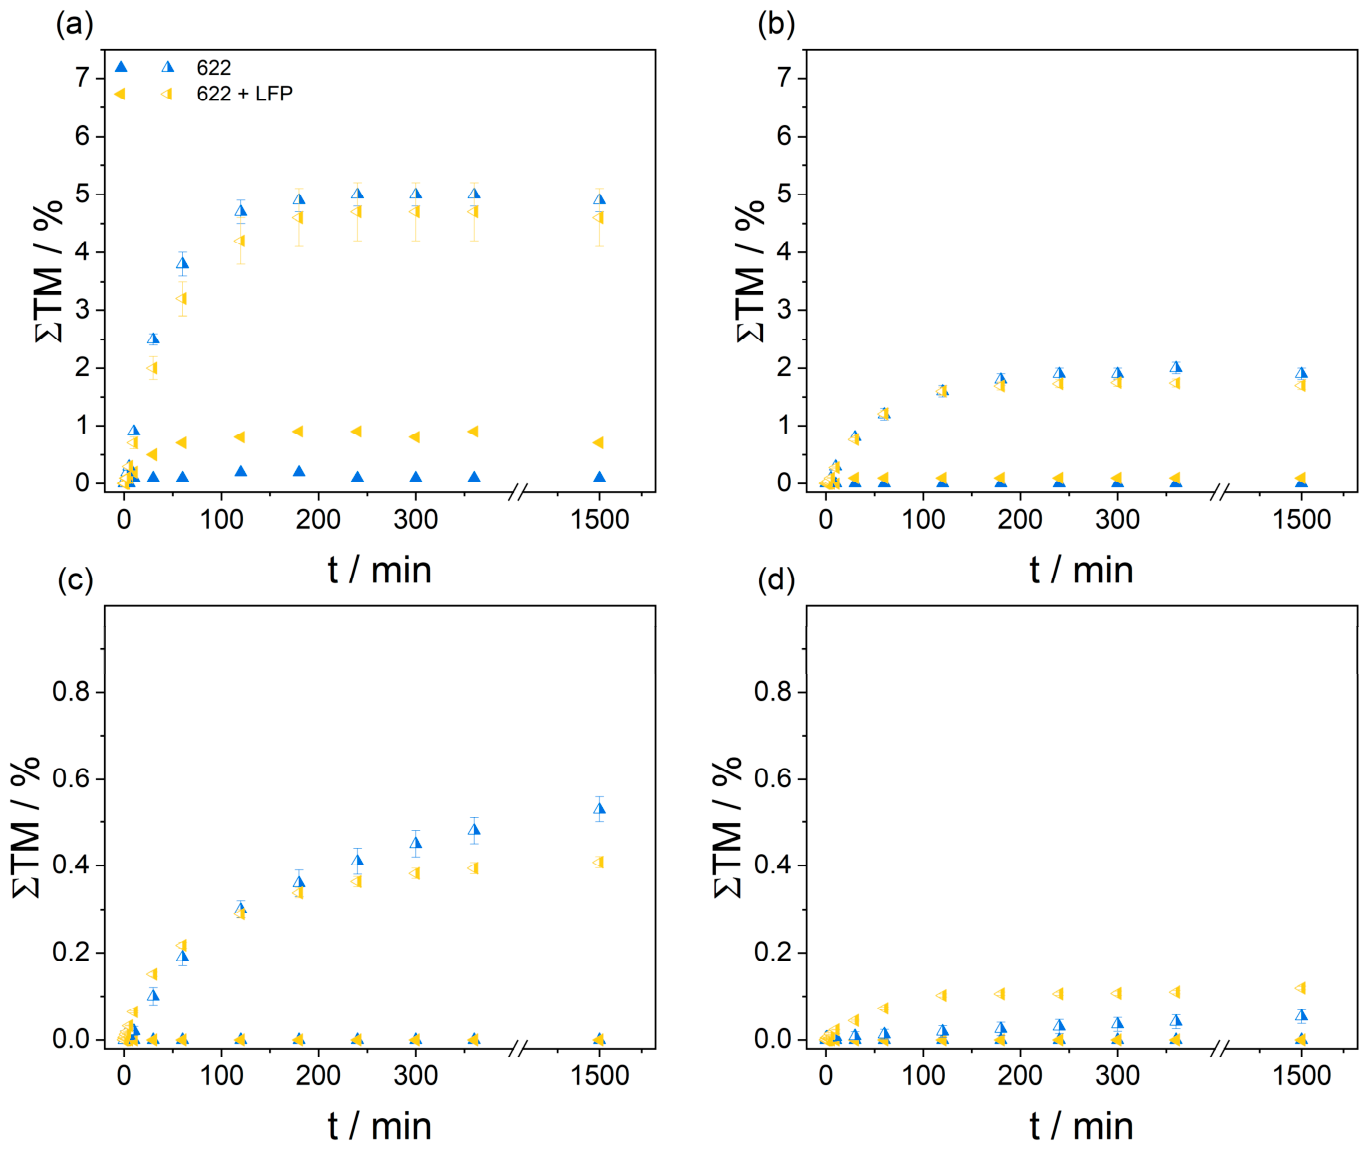
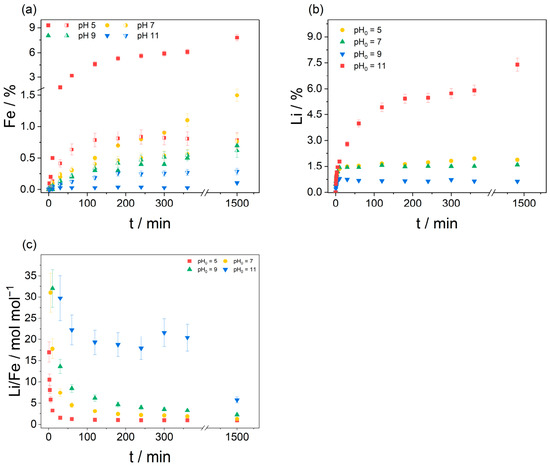
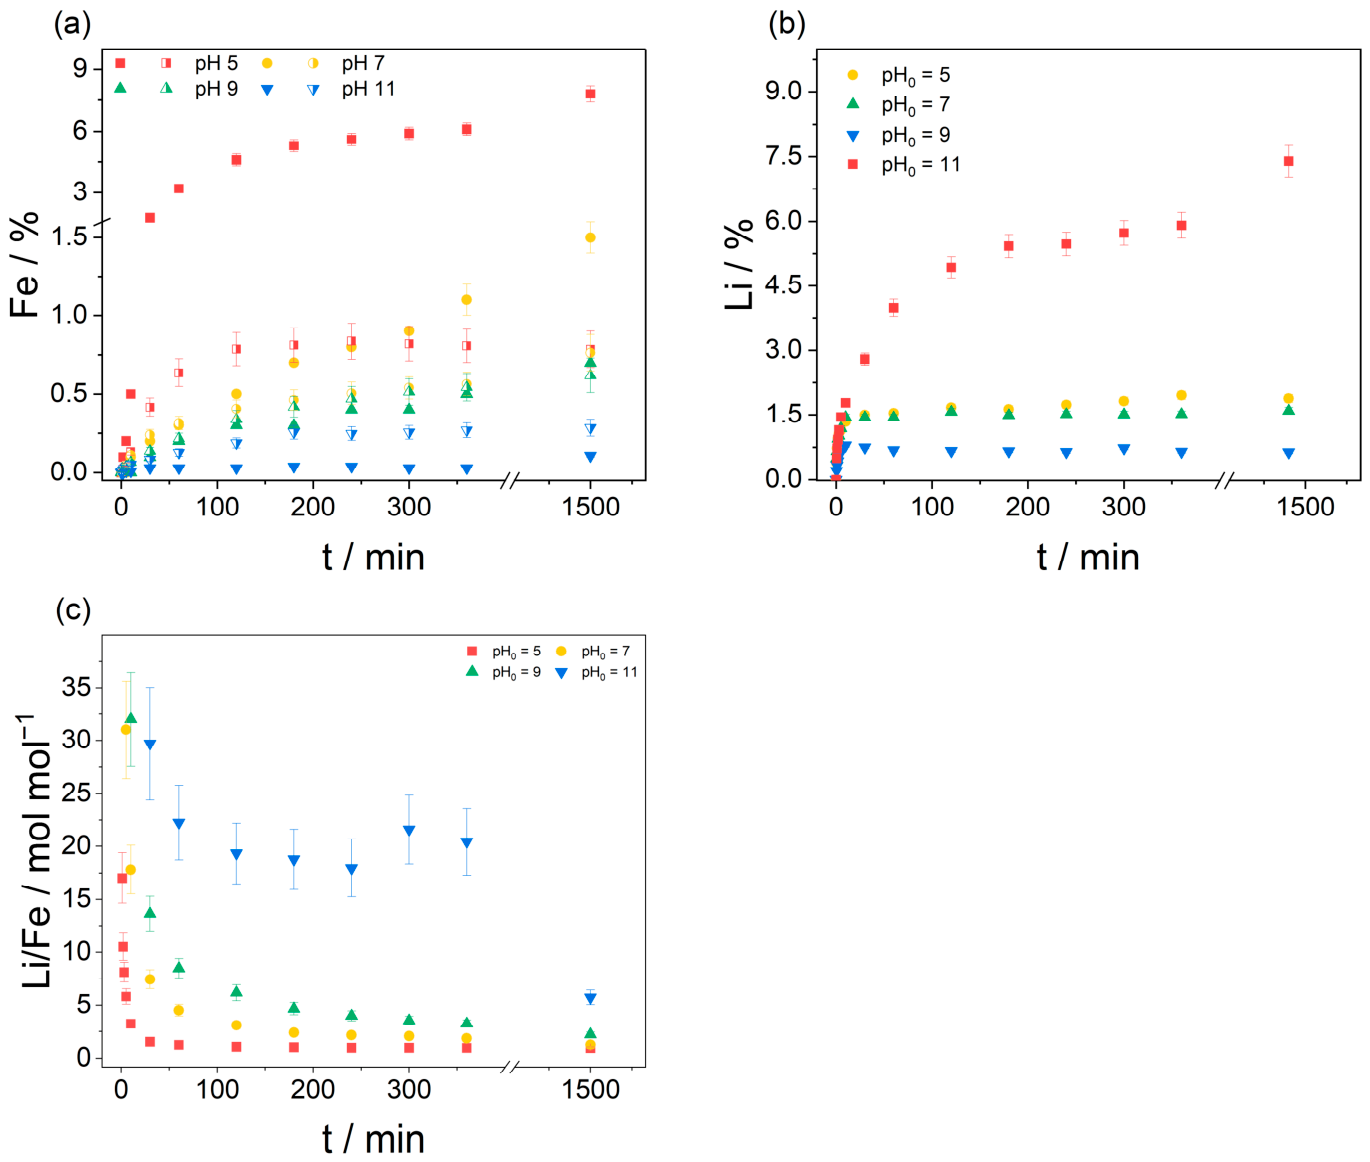
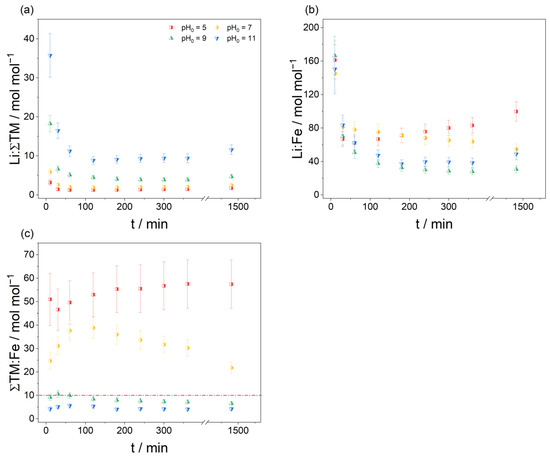
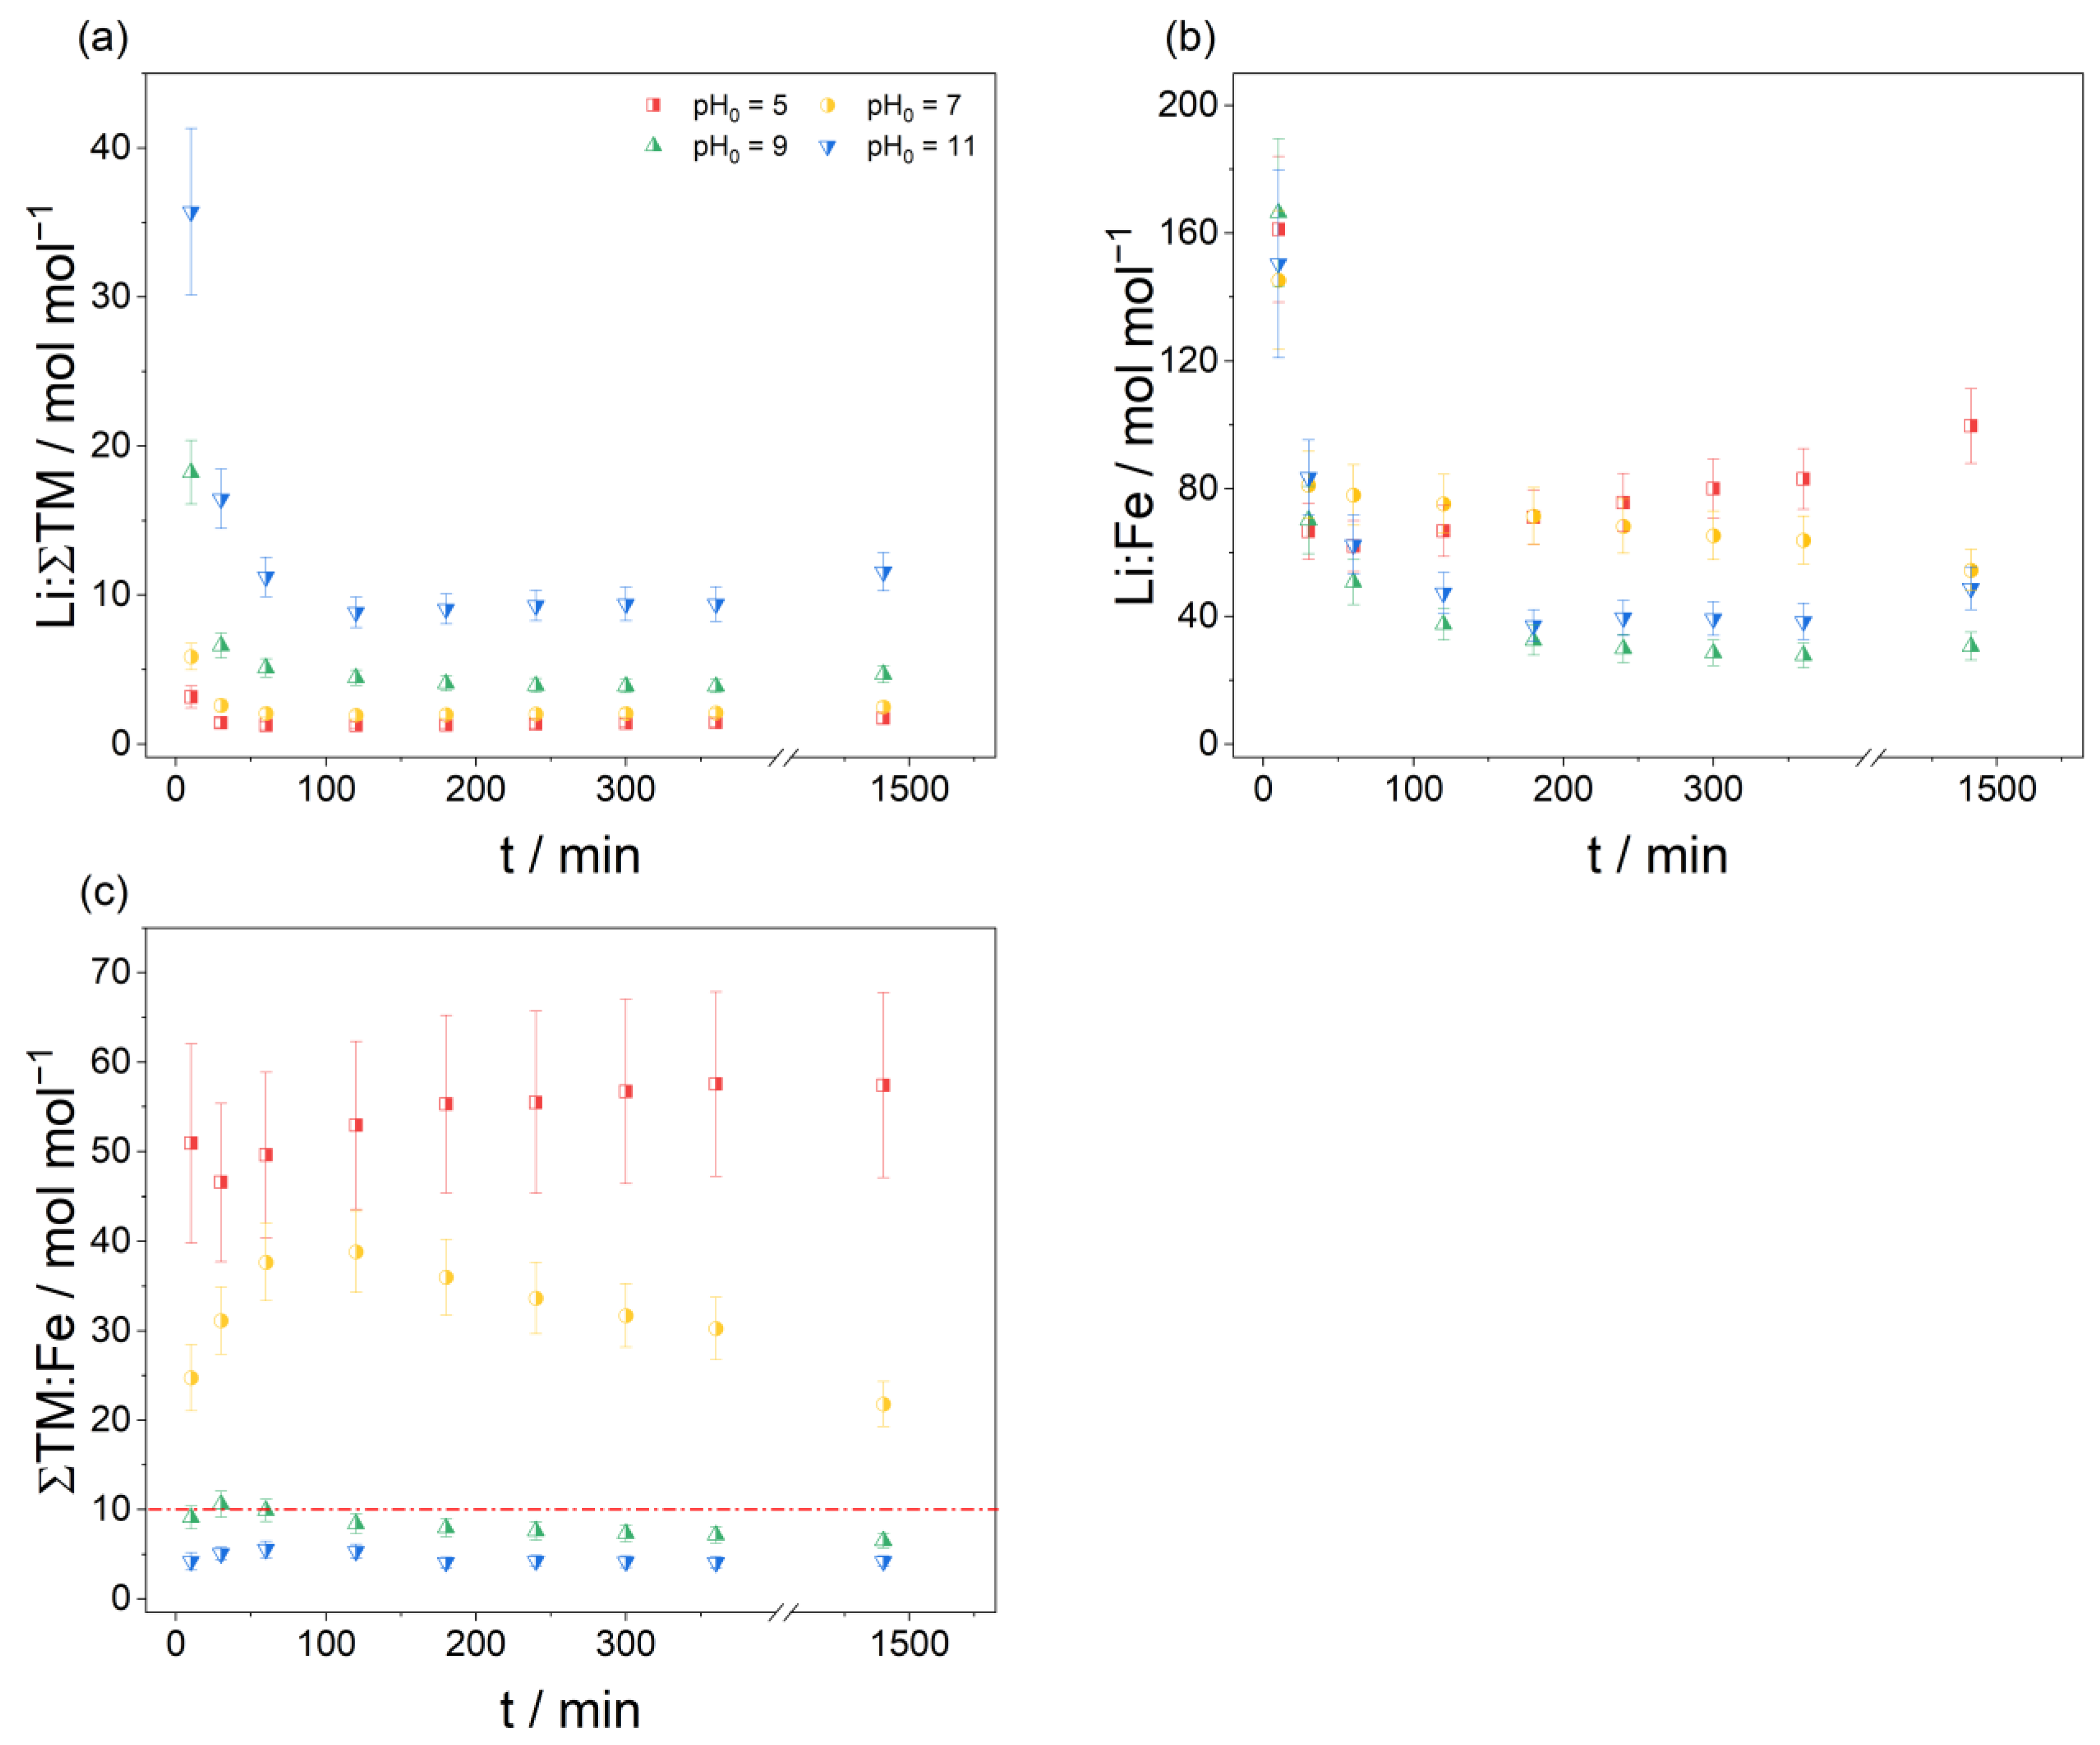
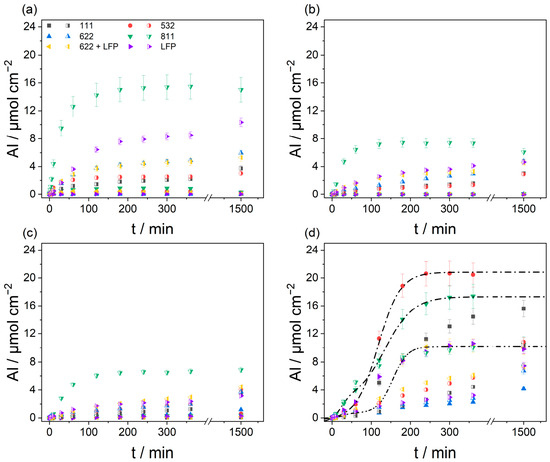
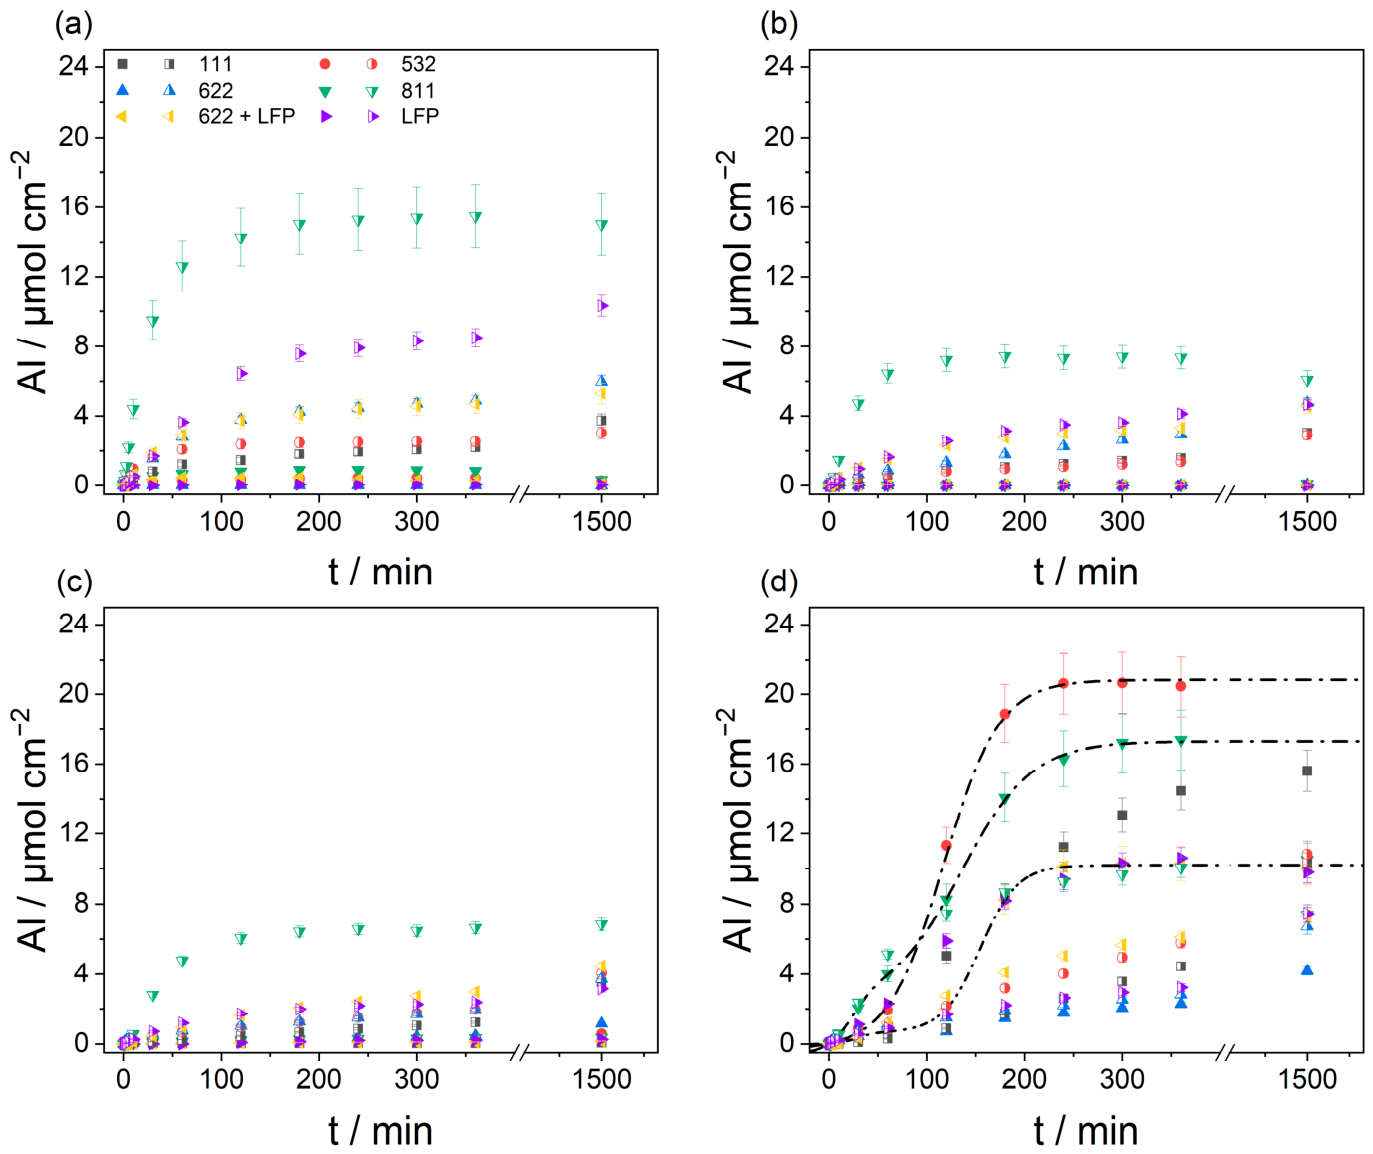

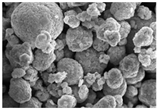
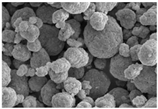
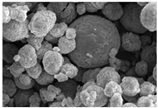
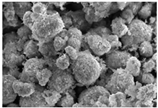
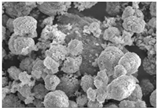
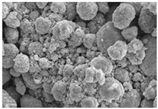
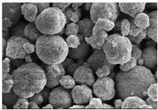
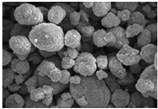
Disclaimer/Publisher’s Note: The statements, opinions and data contained in all publications are solely those of the individual author(s) and contributor(s) and not of MDPI and/or the editor(s). MDPI and/or the editor(s) disclaim responsibility for any injury to people or property resulting from any ideas, methods, instructions or products referred to in the content. |
© 2026 by the authors. Licensee MDPI, Basel, Switzerland. This article is an open access article distributed under the terms and conditions of the Creative Commons Attribution (CC BY) license.