


Abstract
Manufacturer datasheets state battery cycle life under conditions that rarely match how cells are used, while public cycling datasets measure degradation under conditions datasheets do not cover. We present a knowledge-graph (KG) system that represents claims, measurements, and independent tests of commercial lithium-ion cells with full provenance, detects claim-versus-measured and claim-versus-claim discrepancies conditioned on the comparability of test conditions, and supports cycle-life prediction with coverage-gated abstention. On the 124-cell Severson dataset under leave-one-policy-group-out cross-validation, graph-derived neighbor features do not significantly improve point prediction over a strong early-cycle baseline (RMSE 135 vs. 141 cycles), but graph coverage provides a statistically significant abstention signal (Spearman with prediction error, ) that reduces retained RMSE by roughly 40% at 60% retention, where random abstention does not. Deployed zero-shot on a second cycling study of the same commercial cell, the gate abstained on all 77 cells; the counterfactual confirms every refusal (approximately 83% error had it answered), an error an ungated baseline commits silently. On a third study with commensurable features, the gate’s first partial acceptance (17 of 45 cells) is itself diagnostic: coverage acts partly as a lifetime proxy out of distribution, and five labeled cells halve retained error while leaving that proxy in place—adaptation repairs the predictor, not the selection criterion. A 70B open-weight LLM extracts datasheet claims at with non-deterministic output even at temperature 0; a deterministic validator with three-run consensus raises this to with zero unsourced values; on a held-out datasheet, precision and the zero-unsourced-value property transfer while recall falls to 0.34, localizing the extractor’s boundary at table-structured content; row-level table grounding, implemented in response, raises held-out recall to 0.63 with zero hallucinations at a measured precision cost. Reconciling claims across document variants shows that roughly one in three cross-document specification comparisons (14 of 43, three commercial cells) yields a conflict or condition mismatch, twelve involving third-party documents and two internal to a single manufacturer’s own documents. A hand-labeled, condition-annotated gold standard of 103 claims (62 development, 41 held-out; inter-annotator on property naming) and a staged, human-gated literature-monitoring pipeline are released with the code.
1. Introduction
Commercial lithium-ion cells are sold with datasheet specifications (nominal capacity, rate capability, cycle life) that inform pack design, warranty terms, and second-life purchasing decisions. Yet these specifications are single numbers describing what is, in reality, a broad distribution. The A123 APR18650M1A cell studied here is rated “>1000 cycles” on its datasheet, with no stated charge regime, temperature, or end-of-life threshold. In a public cycling campaign, the same cell model spans 147 to 2236 cycles depending on operating conditions, more than an order of magnitude. Meanwhile, the measured degradation data that could ground such claims is fragmented across laboratory studies, published in heterogeneous formats, and increasingly access-gated [1]. No systematic infrastructure, however, exists to reconcile what manufacturers state with what independent cycling campaigns measure.
This gap has practical consequences. Cell selection based on datasheet values alone systematically misestimates lifetime under application conditions, and recent fleet-scale work has documented manufacturer-reported battery health diverging sharply from independently measured capacity [2]. The resulting information asymmetry runs against everyone who is not the manufacturer: buyers, second-life purchasers, and third-party warranty and insurance providers, who must price risk on the statistical variation of real-world degradation without access to either fleet telemetry or reconciled independent measurements. Standardized measurement is not the missing piece: IEC 61960 defines reference test procedures for secondary lithium cells, IEC 62660-1 does so for automotive cells [3,4], and ISO/IEC 17025-accredited laboratories apply them. Regulatory pressure is mounting on top of this infrastructure: the EU Batteries Regulation [5] now mandates verifiable performance and durability declarations, defining rated capacity as the measured quantity under reference conditions rather than the declared one. What remains difficult is reconciliation. Claims and measurements are made under different, often partially unstated, conditions; specification documents conflict, as we show, even between two documents from the same manufacturer; and manual curation does not scale with the pace of new datasets and literature.
We present BatteryKG, a knowledge-graph system for commercial lithium-ion cells. The system consolidates manufacturer datasheets, laboratory cycling data, and independent test reports into a unified, provenance-tracked graph. It detects discrepancies between claims and measurements, and among specification documents themselves, while modeling whether the underlying test conditions license each comparison. For unseen cells it predicts cycle life with a coverage-gated abstention mechanism that declines to predict when the graph offers insufficient support. Large-language-model extraction agents populate the graph from documents, wrapped in a deterministic validation pipeline; no value enters the graph that cannot be traced to a source. We evaluate the system on 276 cells from four public cycling studies, four manufacturer documents, and three independent test reports, with all code and the annotated claims released.
These three mechanisms share one design principle: the system represents the limits of its own knowledge and prefers a justified refusal to a confident guess. A discrepancy verdict states whether the underlying conditions license the comparison at all; the predictor abstains rather than silently regressing an unfamiliar cell toward the population mean; and the extraction pipeline routes unverifiable values to human review. For infrastructure whose outputs may inform purchasing, warranty, and regulatory decisions, the ability to say “these are not comparable” or “this cell is unknown” is a precondition for usefulness.
Our contributions are: (1) a multi-source knowledge-graph schema for commercial cells separating claims, measurements, and provenance, with a staged, human-gated pipeline for discovering new sources (Section 3.1); (2) a validated LLM extraction pipeline with per-stage error reduction quantified against a hand-labeled gold standard, reaching zero unsourced values (Section 4.3); (3) coverage-gated selective prediction evaluated under leakage-controlled, replicate-aware cross-validation: graph-derived features do not significantly improve point-prediction accuracy over a strong early-cycle baseline, but graph coverage provides a statistically significant, model-external, and interpretable abstention signal that reduces retained error by roughly 40% at 60% retention and matches tuned model-internal uncertainty (Section 4.2); and (4) an empirical anatomy of manufacturer claims across three widely used commercial cells: underspecification to the point of unfalsifiability (a cycle-life claim with no charge regime, temperature, or end-of-life threshold), marketing-versus-specification coverage gaps (a marketing sheet with no cycle-life claim at all), and conflicts in one in three cross-document comparisons, including contradictions internal to a single manufacturer (charge-temperature ranges of +10–45 vs. 0–40 °C in two documents for the same cell) (Section 4).
2. Related Work
Battery lifetime prognostics and uncertainty. Data-driven cycle-life prediction is well established: early-cycle features predict lifetime with high accuracy [6], enabling closed-loop protocol optimization [7], with multi-chemistry degradation of commercial cells characterized at scale [8] and the broader field surveyed in [9] and, recently, in [10]. A growing strand attaches uncertainty to these predictions, including quantile mixture-of-experts models spanning multiple public datasets [11], confidence-aware quantile Transformers that predict degradation as intervals rather than point estimates [12], and confidence-weighted semi-supervised learning that propagates lifetime labels to unlabeled cells and weights them by estimated reliability [13]. Our work differs in what is done with uncertainty: these systems quantify it and answer anyway, whereas BatteryKG treats refusal as a first-class, evaluated output. This means that abstention is a designed system response with its own quality metrics: refusals are counted, traced to a stated reason (insufficient graph coverage), and evaluated against random and model-internal baselines on risk–coverage curves, rather than being treated as a failure to produce an answer. Closer to our motivation, Park et al. [2] document fleet-scale divergence between manufacturer-reported battery health and independent measurement, evidence that the claim-versus-measurement gap we address at the specification level manifests throughout the battery lifecycle.
Knowledge graphs and language models for battery and materials data. LLMs are entering battery informatics as extraction, estimation, and reasoning tools [14,15], and knowledge graphs have been coupled to them for fault diagnosis [16] and, in adjacent industrial-asset domains, as the data layer grounding agent workflows [17,18]. These systems use graphs to answer questions; none, to our knowledge, target the reconciliation of conflicting specification documents with claim-level provenance, nor derive predictive trust signals from graph structure. Our vanilla-model comparison illustrates why grounding matters in this domain: an ungrounded model answered specification queries poorly, never attributed a source, and in one case fabricated both test conditions and a datasheet citation (Section 4.6).
Selective prediction and abstention. Selective classification has a mature methodology: risk–coverage analysis and its summary metrics [19,20], and distribution-free uncertainty via conformal prediction [21]. We import this evaluation framework into battery prognostics but change the source of the abstention signal: rather than model-internal confidence, our gate reads coverage from the knowledge graph, a signal that exists before any predictor is trained, transfers across predictors, and yields an interpretable refusal (“no well-covered neighborhood”). Empirically it matches a tuned model-internal baseline on risk–coverage while being the only gate with a significant rank correlation to error (Section 4.2).
Multi-agent LLM systems with validation. Agentic LLM pipelines increasingly automate scientific data workflows; our own prior work grounds multi-agent design exploration in a curated knowledge graph for superalloys [22]. BatteryKG narrows the agent roles to extraction, validation, and monitoring, and subordinates them to deterministic gates and human review: extracted values must be traceable to source text, and newly discovered sources are staged rather than auto-ingested. Our per-stage evaluation quantifies what this buys, in which agents generate candidates while deterministic checks and human review decide what enters the graph (Section 4.3).
3. Materials and Methods
3.1. System Overview and Knowledge Graph
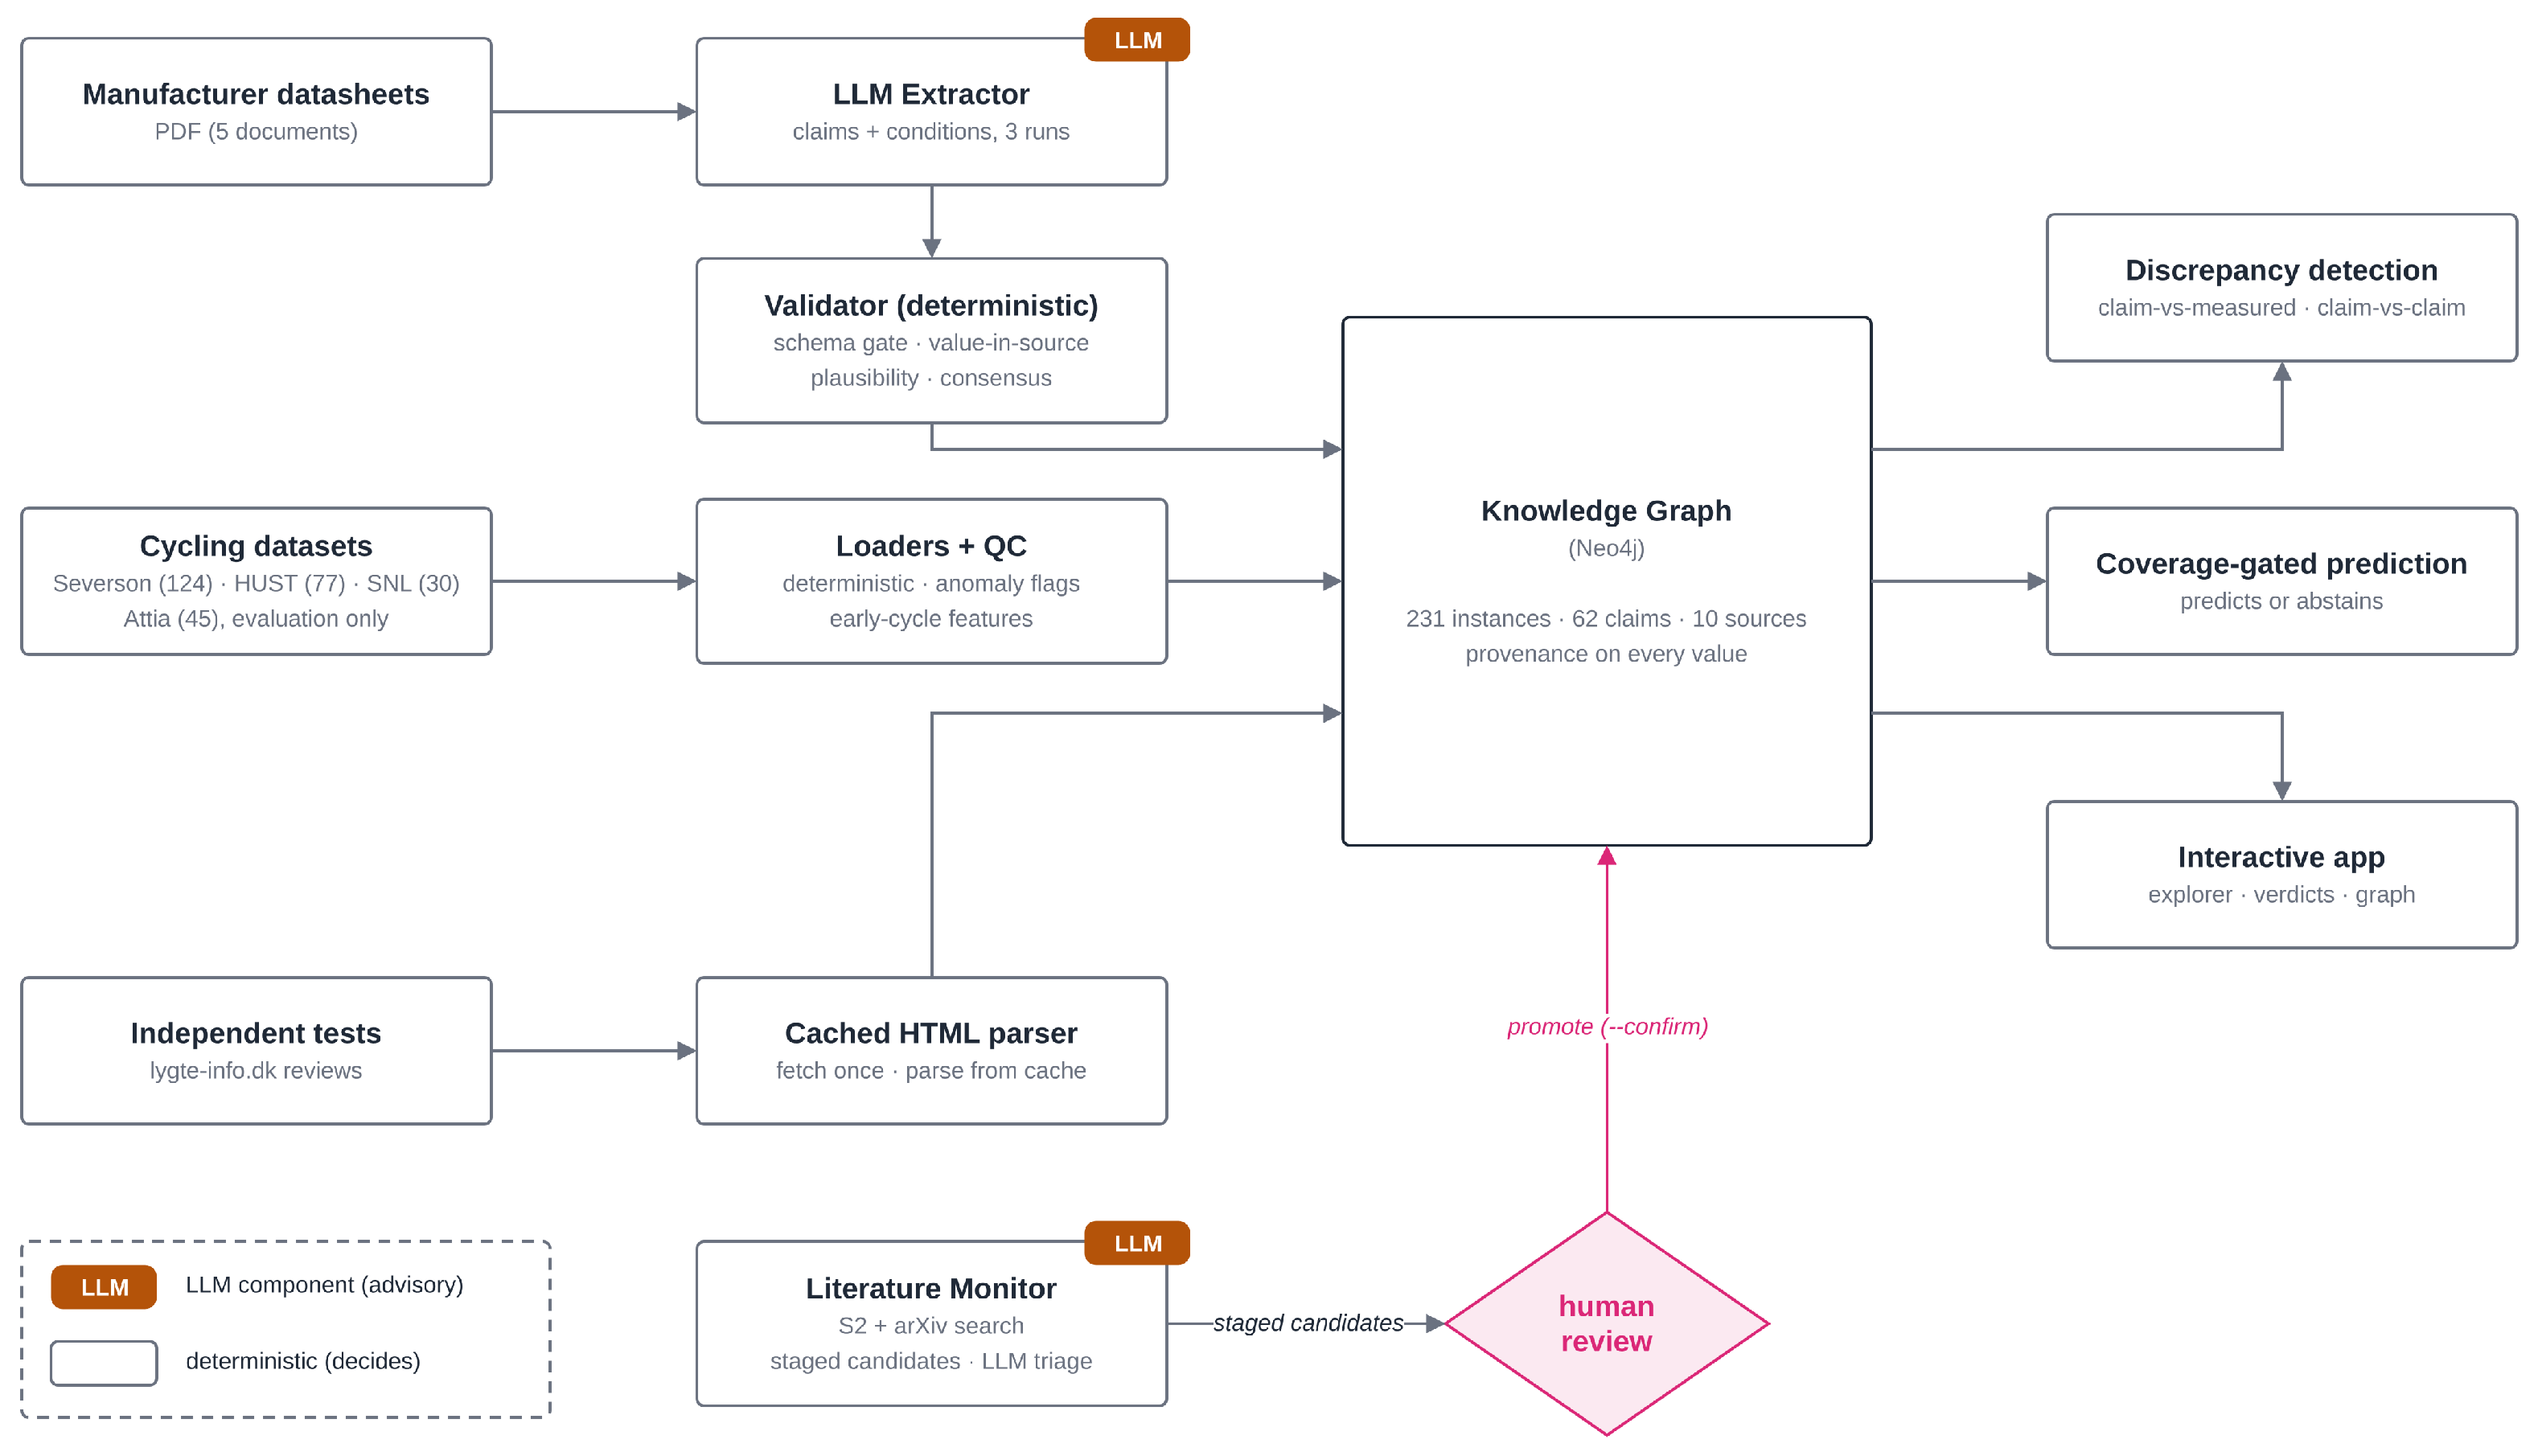
Figure 1 shows the system. Three source classes are ingested through separate pipelines: manufacturer datasheets pass through an LLM extractor and a deterministic validator; cycling datasets pass through deterministic loaders with automated quality control; independent test pages are parsed from cached copies. All three feed a Neo4j knowledge graph [23] in which every value carries its provenance. The graph serves three functions: discrepancy detection, cycle-life prediction with coverage-gated abstention, and an interactive application. A Literature Monitor searches Semantic Scholar and arXiv for candidate sources and stages them with an advisory LLM triage verdict; promotion into the graph requires an explicit human command. Throughout the system, LLM components only propose; deterministic checks and human review decide.
Figure 1.
System architecture. Three source classes are ingested through source-appropriate pipelines into the knowledge graph; LLM components (badged) are advisory, while deterministic validators and a human review gate decide what enters the graph. The red diamond and dashed arrow denote the human-review gate and the staged promotion path. Counts shown reflect the graph state after the Section 4.7 ingestion (231 instances, 10 sources). The graph serves discrepancy detection, coverage-gated prediction, and an interactive application.
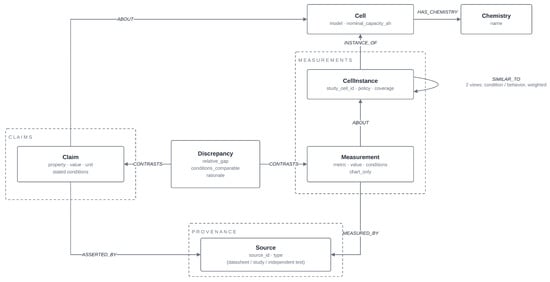
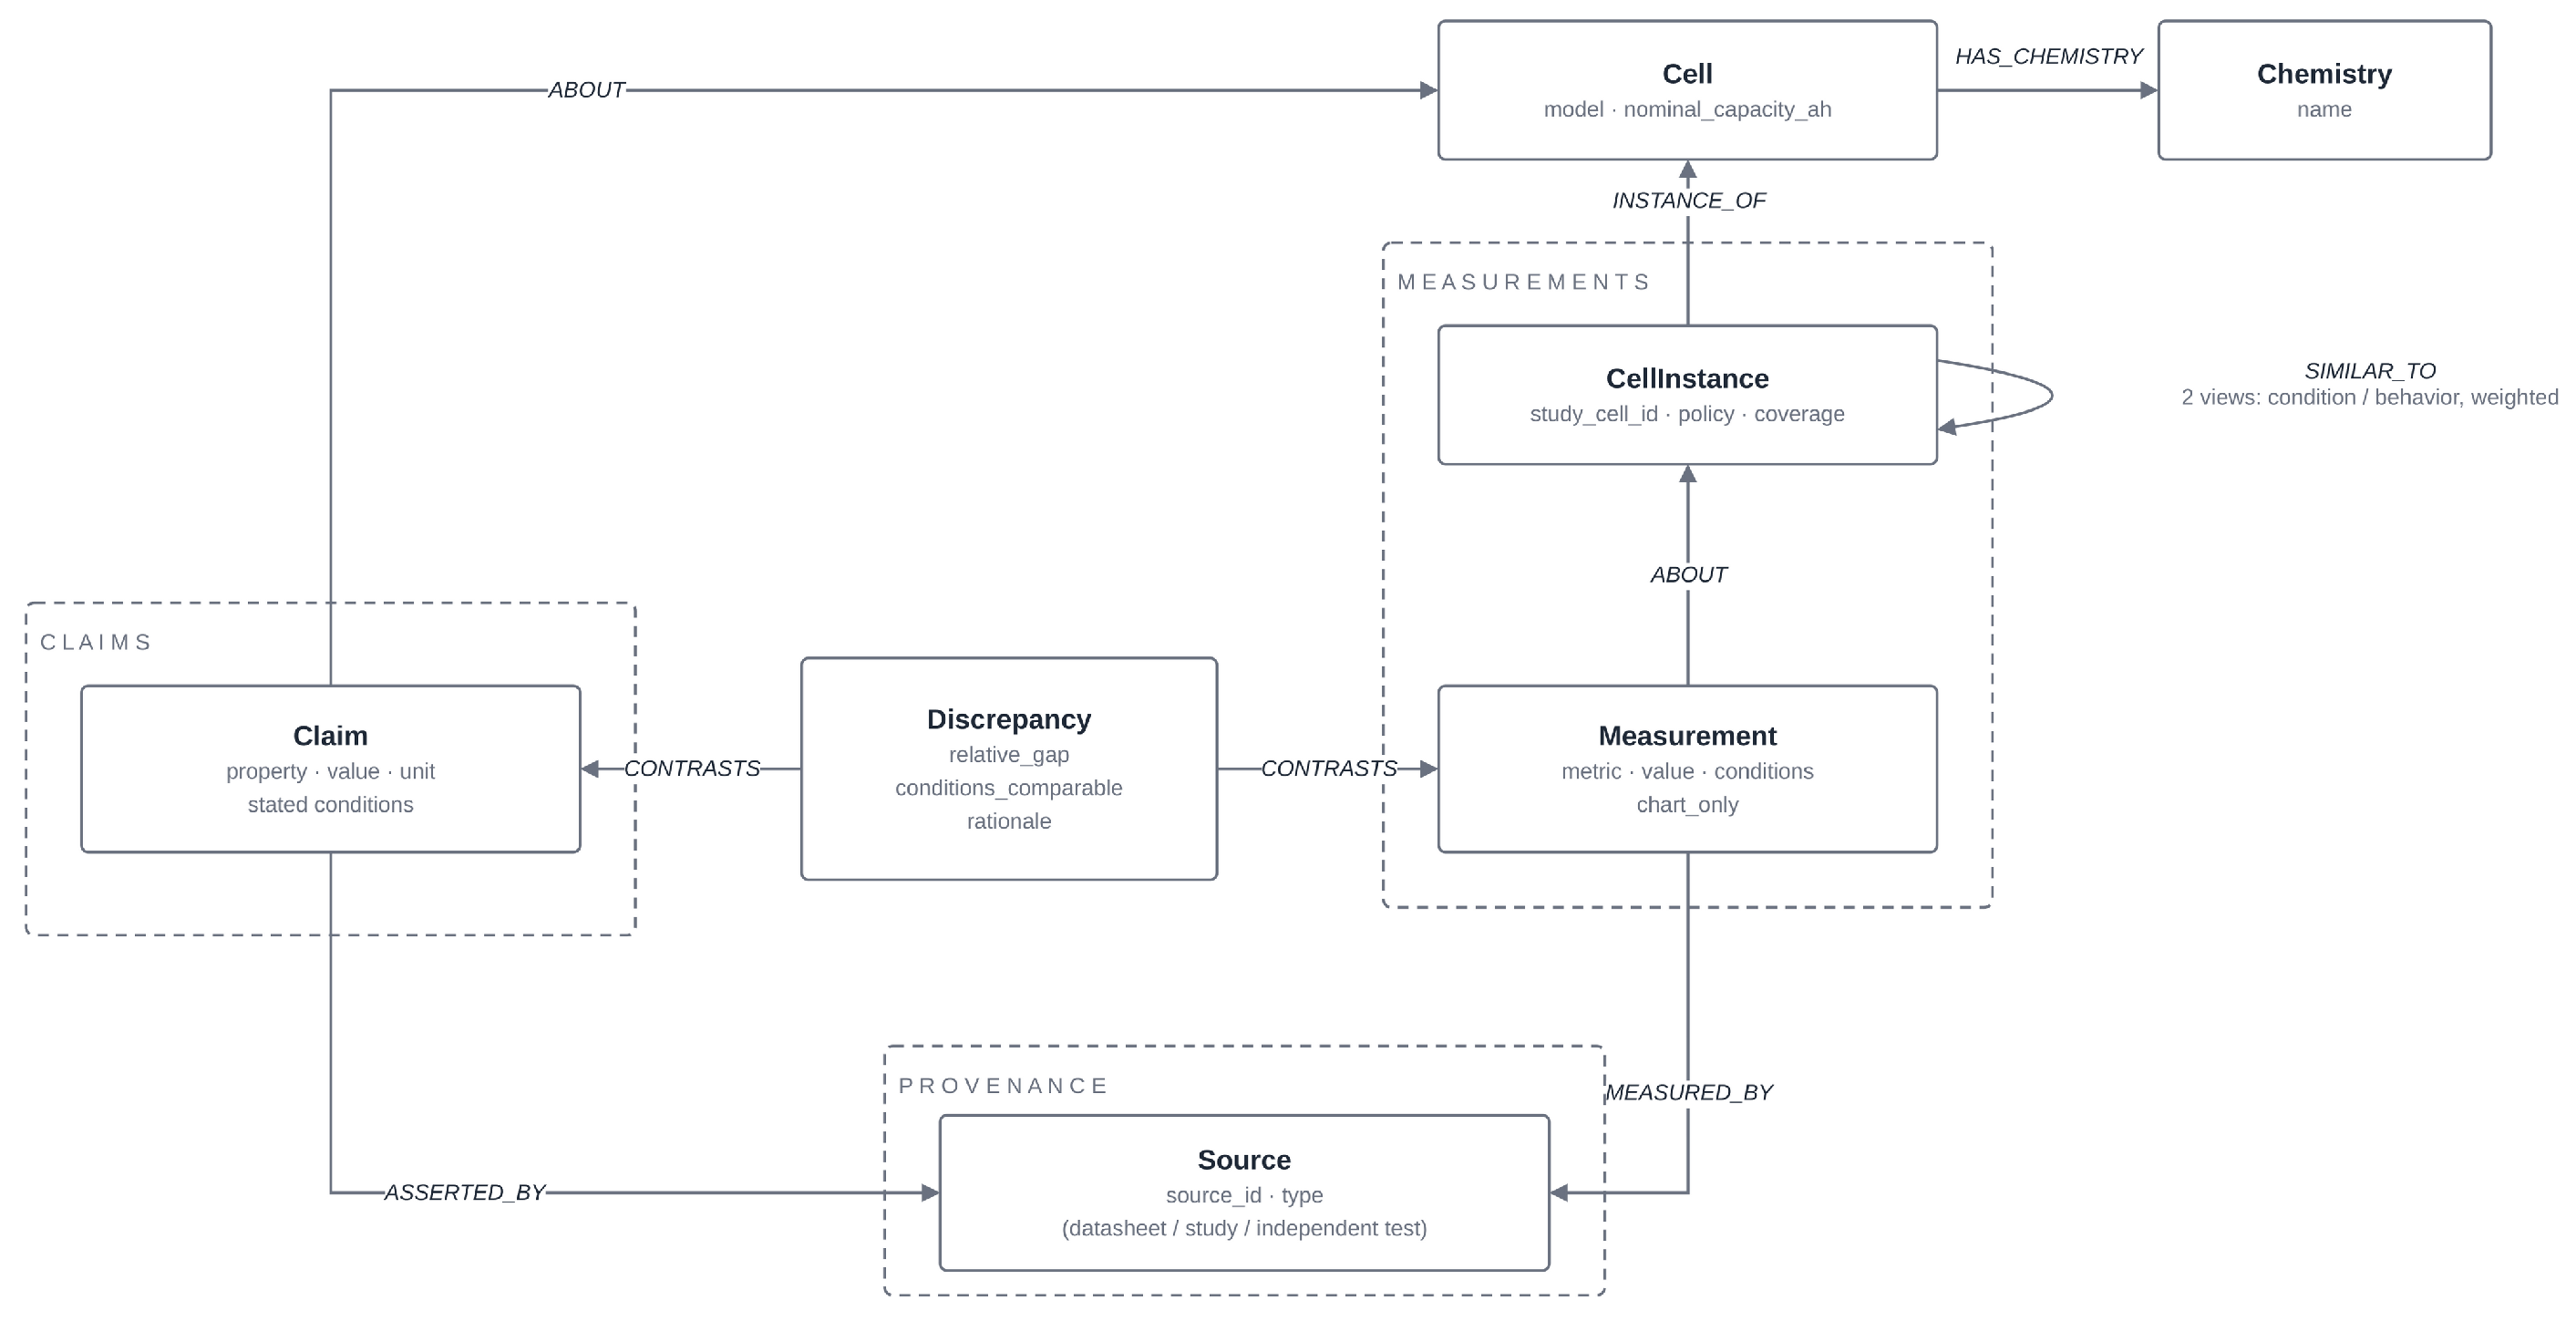
The schema (Figure 2) separates what is asserted from what is observed. Claim nodes hold manufacturer-stated values (property, value, unit, and stated conditions) and attach to the commercial product (Cell), while Measurement nodes hold observed values and attach to the individual physical cell (CellInstance), since a claim describes a product while a measurement describes one specimen under one protocol. Both link to a Source node, so every quantity is traceable to a document page or dataset file. Discrepancy nodes record reconciliation verdicts (Section 3.6). Loading is idempotent, so the graph can be rebuilt from the raw artifacts at any time.
Figure 2.
Knowledge-graph schema. Claims (left) and measurements (right) are held separately and linked to their sources (bottom). Dashed boxes group the claim, measurement, and provenance regions of the schema. Discrepancy nodes arbitrate between the two sides, and SIMILAR_TO edges connect cell instances in two weighted views.
Cell instances are connected by weighted SIMILAR_TO edges in two views: the condition view embeds each instance by its charge protocol (both C-rates and the transition state of charge), and the behavior view by its early-cycle degradation features (Section 3.3). In both views, features are z-scored, similarity is with d as the Euclidean distance, and each instance keeps its top-10 neighbors. Edges within the same charge-policy group are flagged so that downstream computations can exclude them. The predictor and the abstention gate both operate on these edges. Self-exclusion in all neighbor computations is by cell identifier rather than by distance, verified by regression tests.
3.2. Data Sources
Cycling measurements. We use the 124-cell dataset of Severson et al. [6]: A123 APR18650M1A LFP cells (1.1 Ah nominal), cycled at 30 °C, 100% depth of discharge, 4 C discharge, and per-cell two-step fast-charge policies (3.6 C–8 C). The canonical cell set is reproduced from the raw files, cross-checked against BatteryML [24]: batch continuations are merged and the authors’ exclusions are applied, yielding 124 cells in three batches (41/43/40). Batch is a strong nuisance covariate (median cycle life 841/481/964) and is handled by the cross-validation design. One malformed policy string (cell b2c12, “4 C(31%)-5”) is corrected to 4 C(31%)–5 C, identified unambiguously from the protocol design space. Four cells with gross capacity artifacts are excluded by automated quality control. The 77-cell HUST dataset [25], used only for the zero-shot cross-study evaluation, is described with that experiment (Section 4.5).
Manufacturer claims. For three commercial cells (A123 APR18650M1A, Panasonic NCR18650B, and LG Chem INR18650HG2) we hand-extracted all 62 quantitative claims from four manufacturer documents into a structured format with page numbers and stated test conditions (Table 1). The full annotated claim set is released in machine-readable form with the code. This gold standard is both the reference for evaluating LLM extraction and a dataset about claim quality in its own right. Where a document states no conditions, this is recorded as unspecified rather than filled with typical values; the A123 cycle-life claim, for example, states discharge rate and depth of discharge but neither charge regime, temperature, nor end-of-life threshold. Annotation was performed manually by the first author directly from the source documents, and every numeric value in the released gold standard passes the automated value-in-source check against the frozen document text. The annotation protocol is codified in a written guideline released with the code. A fifth, held-out document annotated under the same protocol is described in Section 4.3.
Table 1.
Hand-extracted manufacturer-claim gold standard (62 claims across four datasheet documents, three commercial 18650 cells). Cycle-life claims are shown with their stated conditions; the completeness of those conditions varies substantially between manufacturers, and one widely mirrored datasheet contains no cycle-life claim at all.
Inter-annotator agreement. A second annotator (the second author) independently annotated all five documents against the released annotation guideline, without access to the reference annotations, and produced 164 claims. Table 2 summarizes the comparison with the 103-claim reference. Of the 103 reference claims, 101 (98.1%) have a counterpart in the second set, and across the entire corpus only 1 claim pair disagrees on a value. Cohen’s on property naming is 0.744 over the matched pairs, rising to 0.895 when the characteristic-grid stratum (21 pairs) is excluded: the grids admit two defensible naming schemes and account for 17 of the 25 naming disagreements. Krippendorff’s on the same task equals to three decimals (), as expected for two annotators with similar marginals. The second set is larger because the second annotator also recorded cell dimensions, cut-off currents, and per-duration storage rows, so the exact set-level of 0.569 reflects annotation granularity, not conflicting values. Both annotation sets, the agreement report, and the computation scripts are released with the code.
Table 2.
Inter-annotator agreement between the reference gold standard (103 claims, first author) and the independent second annotation of all five documents (164 claims, second author). Property-level statistics are computed over the 101 matched claim pairs. Value-level matching aligns claims that agree on value and unit class regardless of property name; the exact metric additionally requires identical property names. The one value-disagreeing pair is unmatched under both metrics.
Independent tests. The lygte-info.dk test reviews [26] of all three cells form a third source class. Their measured capacity data exists only as chart images and is recorded as chart_only rather than estimated; text-explicit measurements are extracted with verbatim source fragments. The reviews’ specification echoes, i.e., the reviewer’s restatement of the manufacturer’s specification table, are retained as claims because they disagree with the manufacturer datasheets in several places (Section 4.4).
3.3. Cycle-Life Target and Early-Cycle Features
Cycle life is computed under two definitions: cycles to 80% of nominal capacity (0.88 Ah, the definition the cells were physically cycled to) and cycles to 80% of initial measured capacity (≈0.856 Ah, common in the machine-learning literature). The crossing is linearly interpolated on a rolling-median-smoothed capacity series; a cell ending within 1% of the threshold counts as having reached end of life at its final cycle. Under the nominal definition all 124 cells have a defined cycle life (147–2236 cycles, median 736); under the initial-capacity definition only 46 of 124 reach the threshold, and the rest are recorded as right-censored rather than imputed. The nominal definition is the prediction target and is stated on every figure and table.
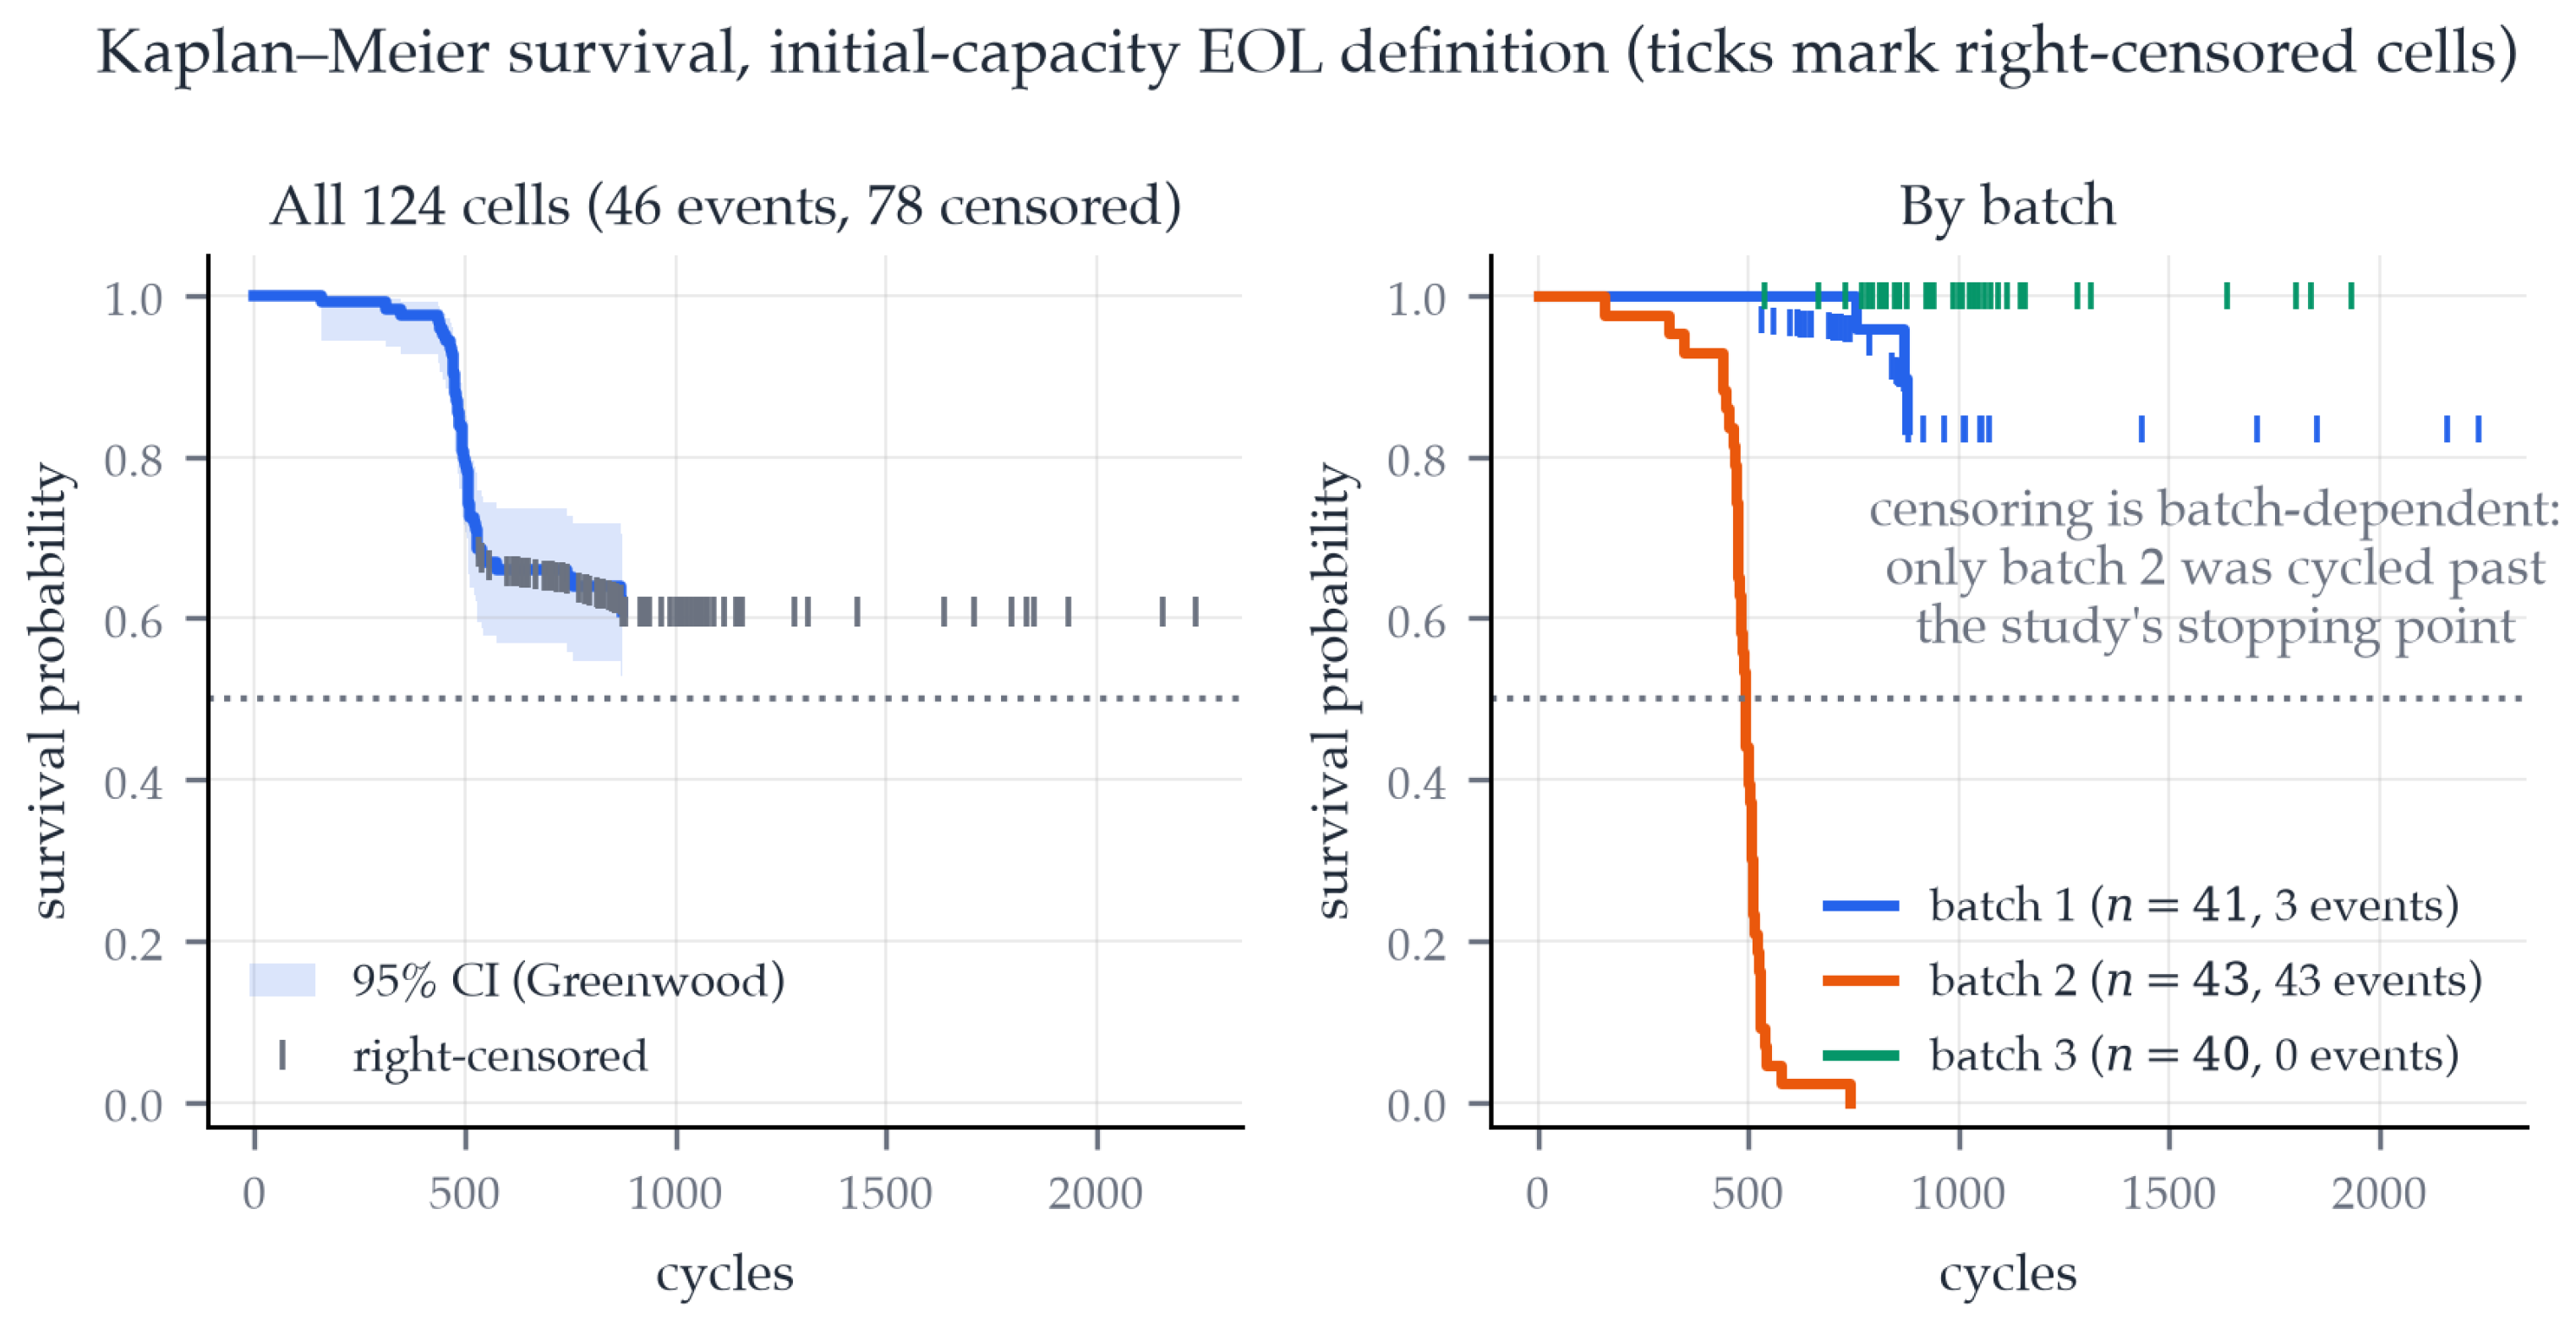
The target is insensitive to its construction choices: varying the smoothing window (1–9 cycles), the threshold-proximity tolerance (0.5–2%, or removing it), and the interpolation scheme changes headline results by at most 1.2 cycles of RMSE and 0.009 of Spearman (Appendix A); 81 of 124 labels arise from the proximity rule rather than a strict crossing, which the appendix quantifies. Under the initial-capacity definition, a Kaplan–Meier analysis of the right-censored population shows survival plateauing at ≈0.61, so the median is undefined; discarding censored cells would report a median of 493 cycles, biased short by construction since the omitted cells are the long-lived ones. Between-batch survival comparisons are confounded by the study’s stopping schedule and are reported only with that caveat.
Predictive features use cycles ≤100 only, a boundary enforced by runtime assertions and verified by a unit test that corrupts all later cycles and checks that no feature changes. The features are the variance and of (the canonical Severson features), the capacity slope over cycles 2–100, capacities at cycles 2 and 100 and their ratio, and mean charge time. The variance feature reproduces its published strength ( with cycle life), which serves as an end-to-end correctness check.
3.4. Prediction and Coverage-Gated Abstention
Evaluation protocol. Cells sharing a charge policy are experimental replicates: 81 of 124 cells share their policy with at least one other cell. Random splits would leak, evaluating a model on a cell whose twin it trained on. All evaluation therefore uses leave-one-policy-group-out cross-validation; after excluding the four flagged cells, this yields 120 cells in 66 folds.
Models. Both models are XGBoost regressors on (cycle life), with one fixed configuration and seed, so the comparison is about features rather than tuning. The baseline uses early-cycle features, policy features, and batch. The graph-augmented model adds four neighbor statistics per similarity view, computed from each cell’s SIMILAR_TO neighbors restricted to the training fold: weighted mean and standard deviation of neighbor cycle life, mean edge weight, and coverage, the sum of retained edge weights. Neighbor labels come exclusively from training cells; a runtime assertion fails if a test cell appears in any neighbor set, and a unit test deliberately poisons a neighbor set to verify this tripwire.
Abstention. At prediction time the system either answers or refuses. The signal is coverage_train in the behavior view: the sum of the test cell’s top-5 edge weights into the training set. Below a threshold, the system abstains and reports the sparse neighborhood as the reason. Sweeping the threshold traces a risk–coverage curve (error on retained cells vs. fraction retained), compared against two baselines: random abstention at equal retention, which any informative gate must beat, and the model’s own uncertainty (per-fold quantile regressors, gating on the spread). Gates are summarized by the area under the risk–coverage curve (AURC) over 20–100% retention, with 95% confidence intervals from 1000 fold-level bootstrap resamples. A hybrid gate combining both signals is evaluated with an out-of-fold threshold selection and is reported as a negative result (Section 4.2).
The operational threshold is defined as a percentile of the bank’s own leave-one-out coverage distribution rather than an absolute value: the deployed setting, the 41st percentile selected in-study without test-fold information, reproduces the paper’s operating point (median per-fold threshold 4.081, range 4.075–4.095 across the 66 folds). For banks containing cells from multiple studies, the reference population is stratified by study, with reference cells scored under the same neighbor availability the query faces; on a single-study bank this rule is identical to the plain percentile. The percentile formulation is scale-free and transfers across studies with different internal feature spread (Section 4.5). Algorithm 1 states the decision rule.
| Algorithm 1 Coverage-gated cycle-life prediction. |
|
A cost-sensitive reading makes the deployed setting interpretable: writing total cost as r times the abstention fraction plus the retained share of total absolute error, the setting is within 5% of cost-optimal for , i.e., it implicitly prices one abstention at approximately the cost of one average-error prediction; at the gate abstains on 40% of cells while removing 56% of total absolute error.
3.5. Claim Extraction and Validation
Datasheet text is extracted with layout preservation and page markers, and frozen as a reproducible snapshot. The extractor LLM (Llama-3.3-70B [27], served via the Groq inference API, temperature 0, fixed seed) receives the document text and a schema-locked prompt: claims as JSON with property, value, unit, page, and stated conditions, instructed to extract only what the document states and to mark unstated conditions as unspecified. Extraction runs three times; only claims appearing in at least two runs survive.
Surviving claims must pass a deterministic validator: (1) a schema gate whose only permitted repair is mechanical unnesting; (2) a value-in-source check requiring every numeric value to appear in the document text under normalized number matching, which rejects silent unit conversions by construction; (3) per-property physical plausibility bounds; and (4) a tolerance normalizer that maps “” range forms to a single convention. Only claims passing all four checks are eligible for the graph; each rejection carries a reason code. Algorithm 2 summarizes the full pipeline.
| Algorithm 2 Validated claim extraction. |
|
Test conditions receive a second, focused pass: one query per accepted claim, with the claim’s source page as the only context. Numeric condition values must pass the same value-in-source check. Consensus is not applied at this stage: it prunes correct minority fields, while the dominant residual error, conditions of a neighboring table row attached to the wrong claim, is systematic across runs and survives voting (Section 4.3).
Extraction is scored against the gold standard: predictions match gold claims on property and value within 2% tolerance, each gold claim matched at most once. Conditions are scored separately; predicting unspecified where the document states nothing counts as correct. A false positive whose value appears nowhere in the source text counts as a hallucination, a stronger failure than the over-extraction of real numbers.
The full set of experiments required approximately 230 LLM calls in total: nine extraction runs, 156 conditions queries, and 62 vanilla-comparison queries, served via the Groq API. All responses are cached, so this is a one-time cost per document corpus. We estimate the associated energy at well under 1 kWh (tens of grams of CO2e). Operating the knowledge graph afterwards requires no LLM calls at all, since queries are answered by deterministic graph lookup.
3.6. Discrepancy Computation
A Discrepancy node contrasts a claim with the corresponding measurements, or with another document’s claim about the same property, storing the relative gap, a conditions_comparable flag, and a textual rationale.
The verdicts are computed by explicit per-field rules (Table 3). The 2% tolerance is calibrated rather than generous: the closest consistent pair sits at 1.5% and the closest conflict at 2.1%, so the threshold is discriminative on this corpus but should be revisited for new document classes. An independent re-derivation of all verdicts from the tabulated rules reproduces the stored 43/43; the validation is exercised rather than vacuous since agreement drops under every rule mutation (41/43 at 0–0.5% tolerance, 38/43 at 5%, 31/43 at 50%, 36/43 when unspecified conditions count as stated). Only two comparisons are decided by bound satisfaction, so that rule rests on a thinner slice of evidence.
Table 3.
Comparability rules for cross-document (claim-versus-claim) reconciliation, as implemented. Values match under a 2% relative tolerance, ; a point value satisfying the other document’s stated bound (“Max.”/“Min.”) counts as consistent, but two rival bounds must match as values. Condition fields are compared only when stated on both sides: an absent condition is skipped for claim-versus-claim verdicts, whereas for claim-versus-measured comparisons any unstated condition renders the pair conditions_comparable = false (Section 3.6). Applying these rules to the 43 cross-document comparisons of Section 4.4 reproduces all 43 stored verdicts (29 consistent, 3 condition mismatches, 11 value conflicts), with the conditions re-derived independently from the source fragments; the validation script is released with the code.
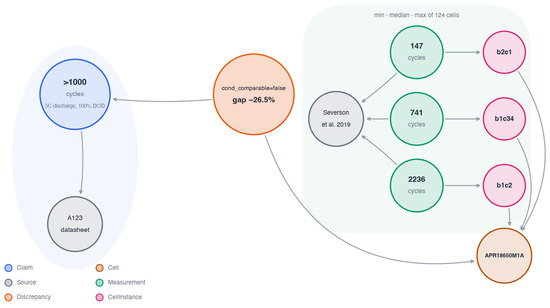
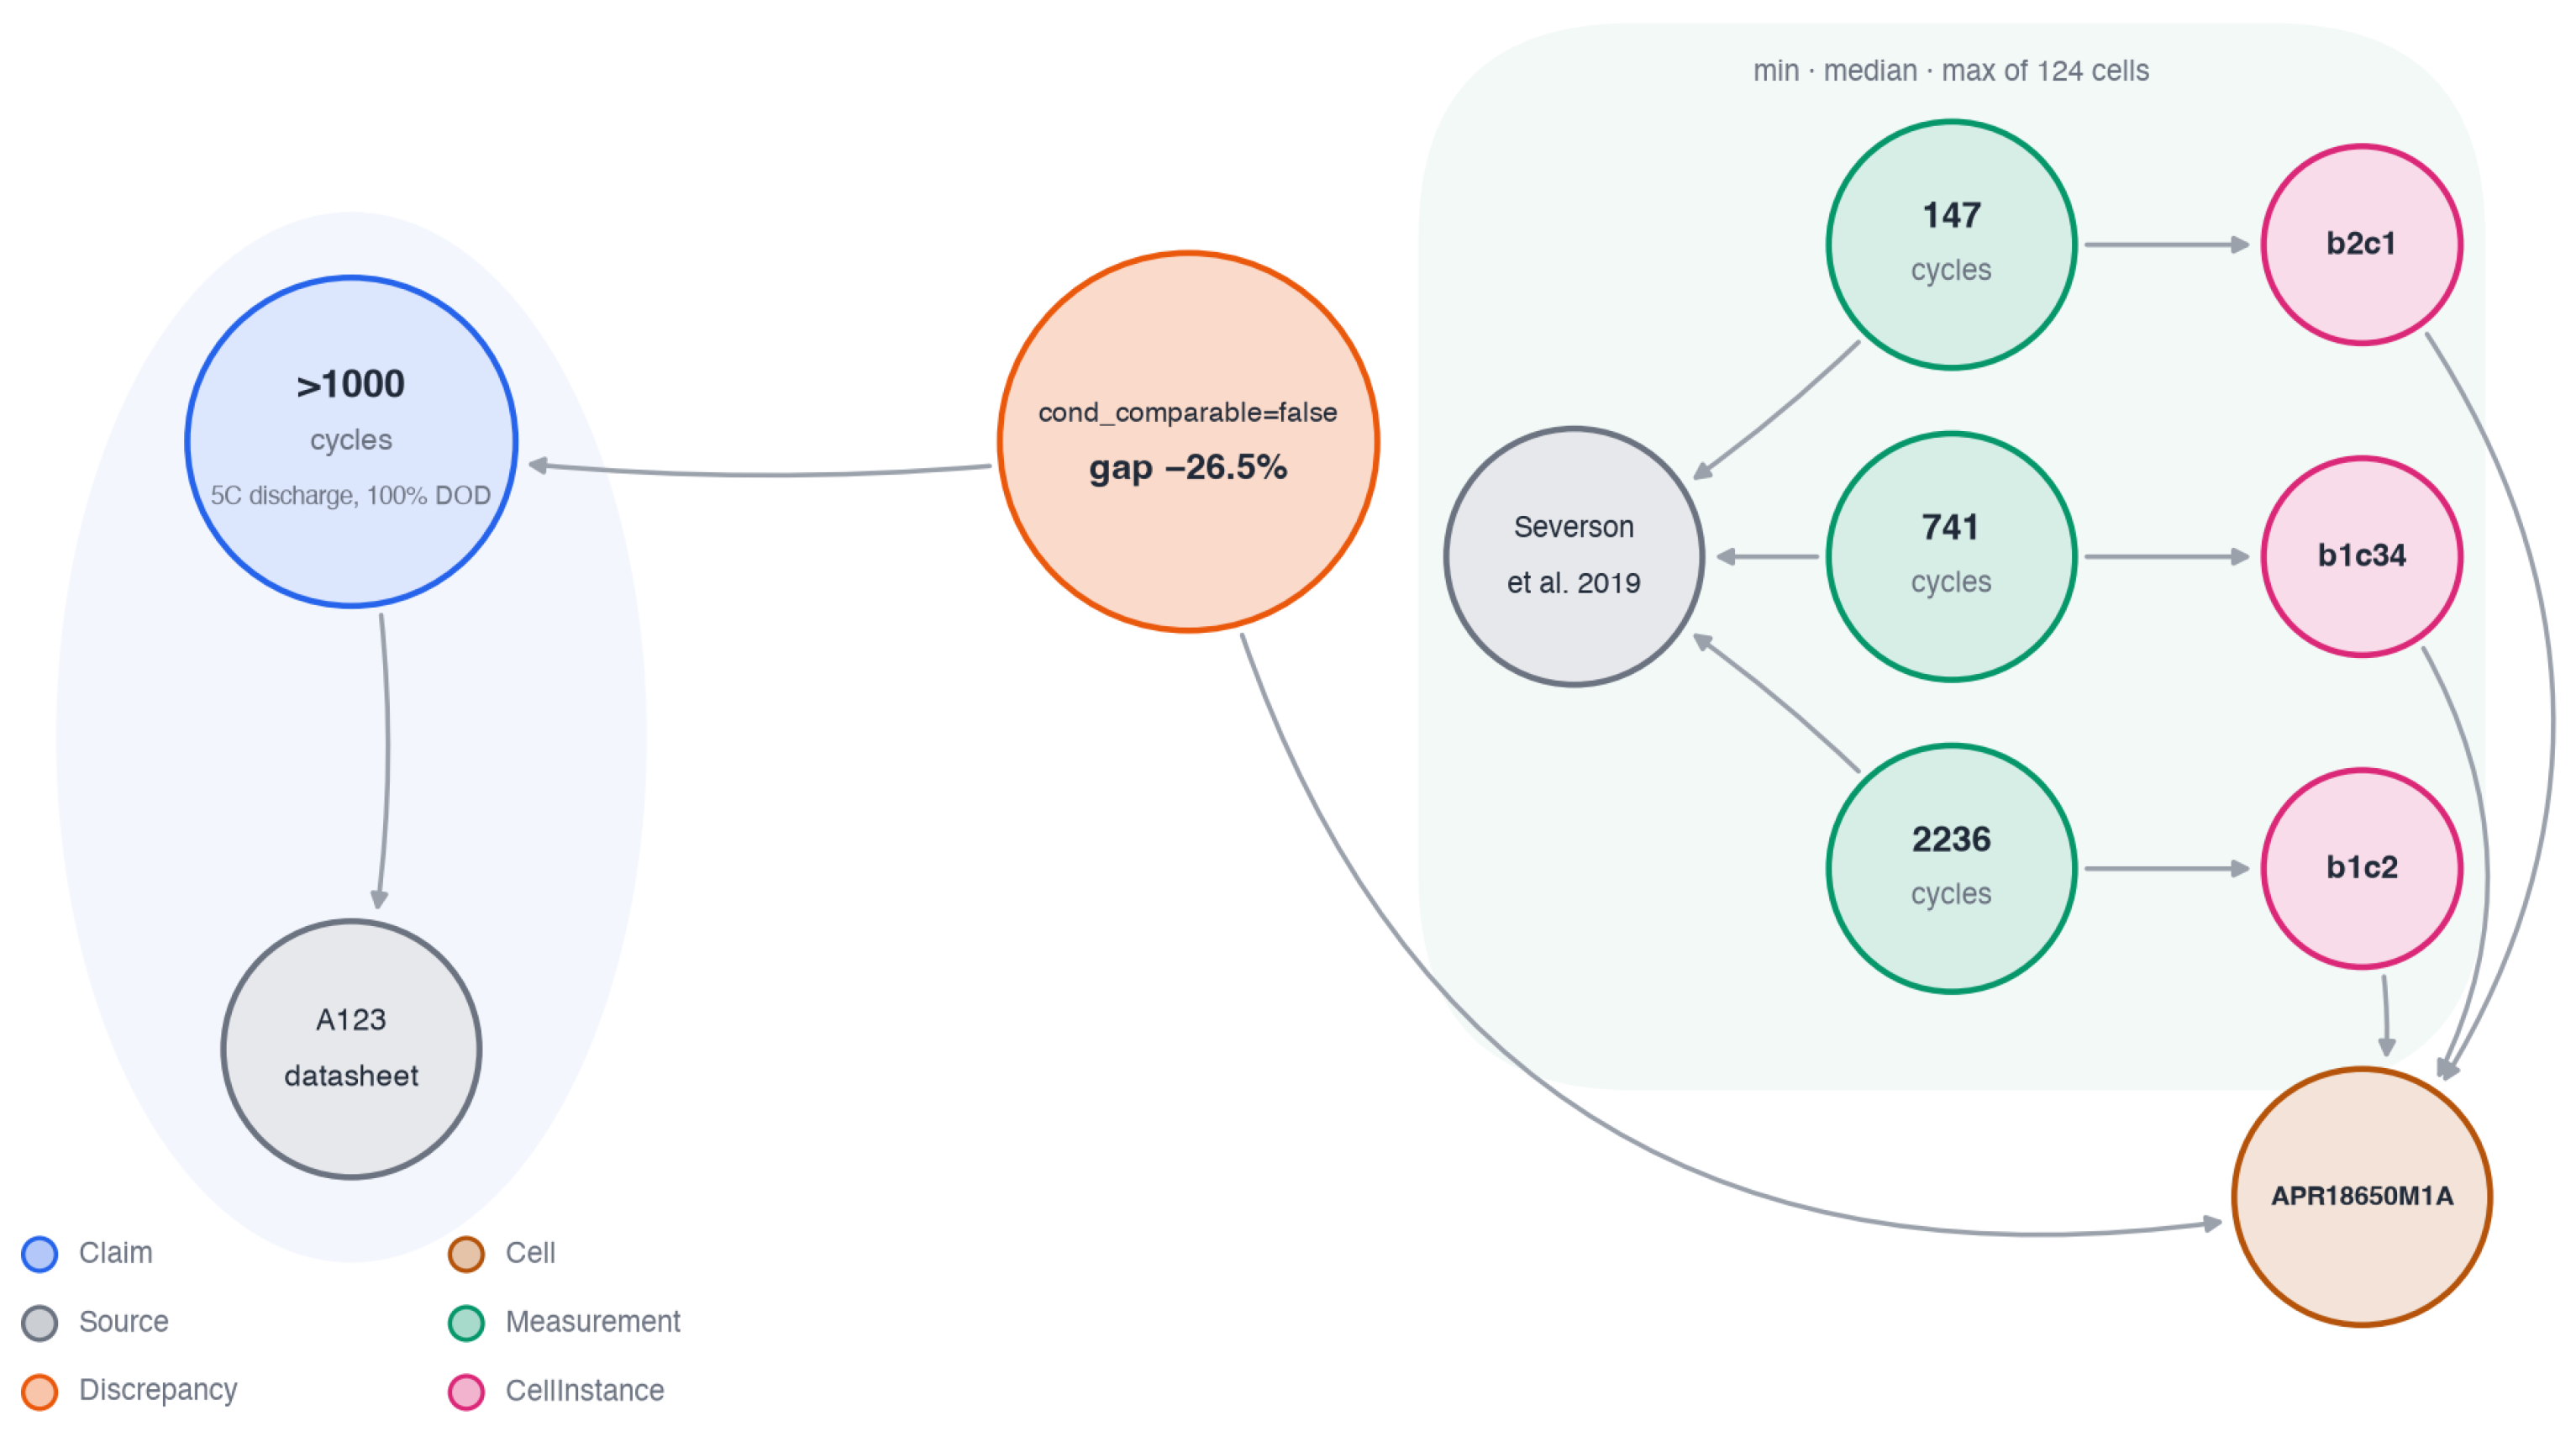
The flag is deliberately conservative: the first computed discrepancy (Table 4) is not marked comparable because the measured cells were fast-charged while the claim’s charge regime is unstated, and the claim specifies no end-of-life threshold. The system reports the honest comparison, not a verdict of false advertising. Figure 3 shows this first discrepancy as it is stored in the graph.
Table 4.
First claim-vs.-measured comparison: A123 APR18650M1A cycle life. The relative gap is context, not a verdict—the conditions are not comparable: the measured cells are deliberately fast-charged (3.6–8 C) to induce accelerated degradation, while the claim’s charge regime, temperature, and end-of-life threshold are unstated. The comparison is stored in the knowledge graph as a Discrepancy node with conditions_comparable = false and a full rationale.
Figure 3.
The A123 cycle-life discrepancy as stored in the knowledge graph. The manufacturer claim (left, with its stated conditions) and three representative Severson measurements [6] (the minimum, median, and maximum of 124 cells) are each linked to their sources; the Discrepancy node records the relative gap and the conditions_comparable=false verdict, and all cell instances resolve to the same commercial cell. Node types are given by the legend; edge types follow the schema in Figure 2.
4. Results
Except for the update-cycle demonstration (Section 4.7), which by design changes the graph, all results are produced against a single knowledge-graph state, built by the released pipeline: 62 hand-labeled claims from four manufacturer documents (three commercial cells), 124 Severson cell instances with their measurements and similarity edges, the 77 HUST instances (loaded for the cross-study evaluation but excluded from the neighbor bank) and the lygte-info.dk test reviews. Prediction and abstention (Section 4.2) are evaluated on the 120 non-flagged Severson cells under leave-one-policy-group-out cross-validation, with graph features recomputed per fold from training cells only. Extraction (Section 4.3) is evaluated against the 62-claim gold standard; the graph itself holds only gold claims, never unvalidated LLM output. The cross-study evaluation (Section 4.5) adds the 77-cell HUST and 45-cell Attia datasets as held-out data that the model, neighbor bank, and threshold have never seen. All numbers are reproducible from the repository with fixed seeds.
4.1. Cycle-Life Prediction
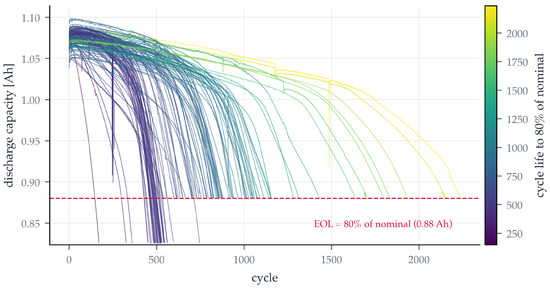
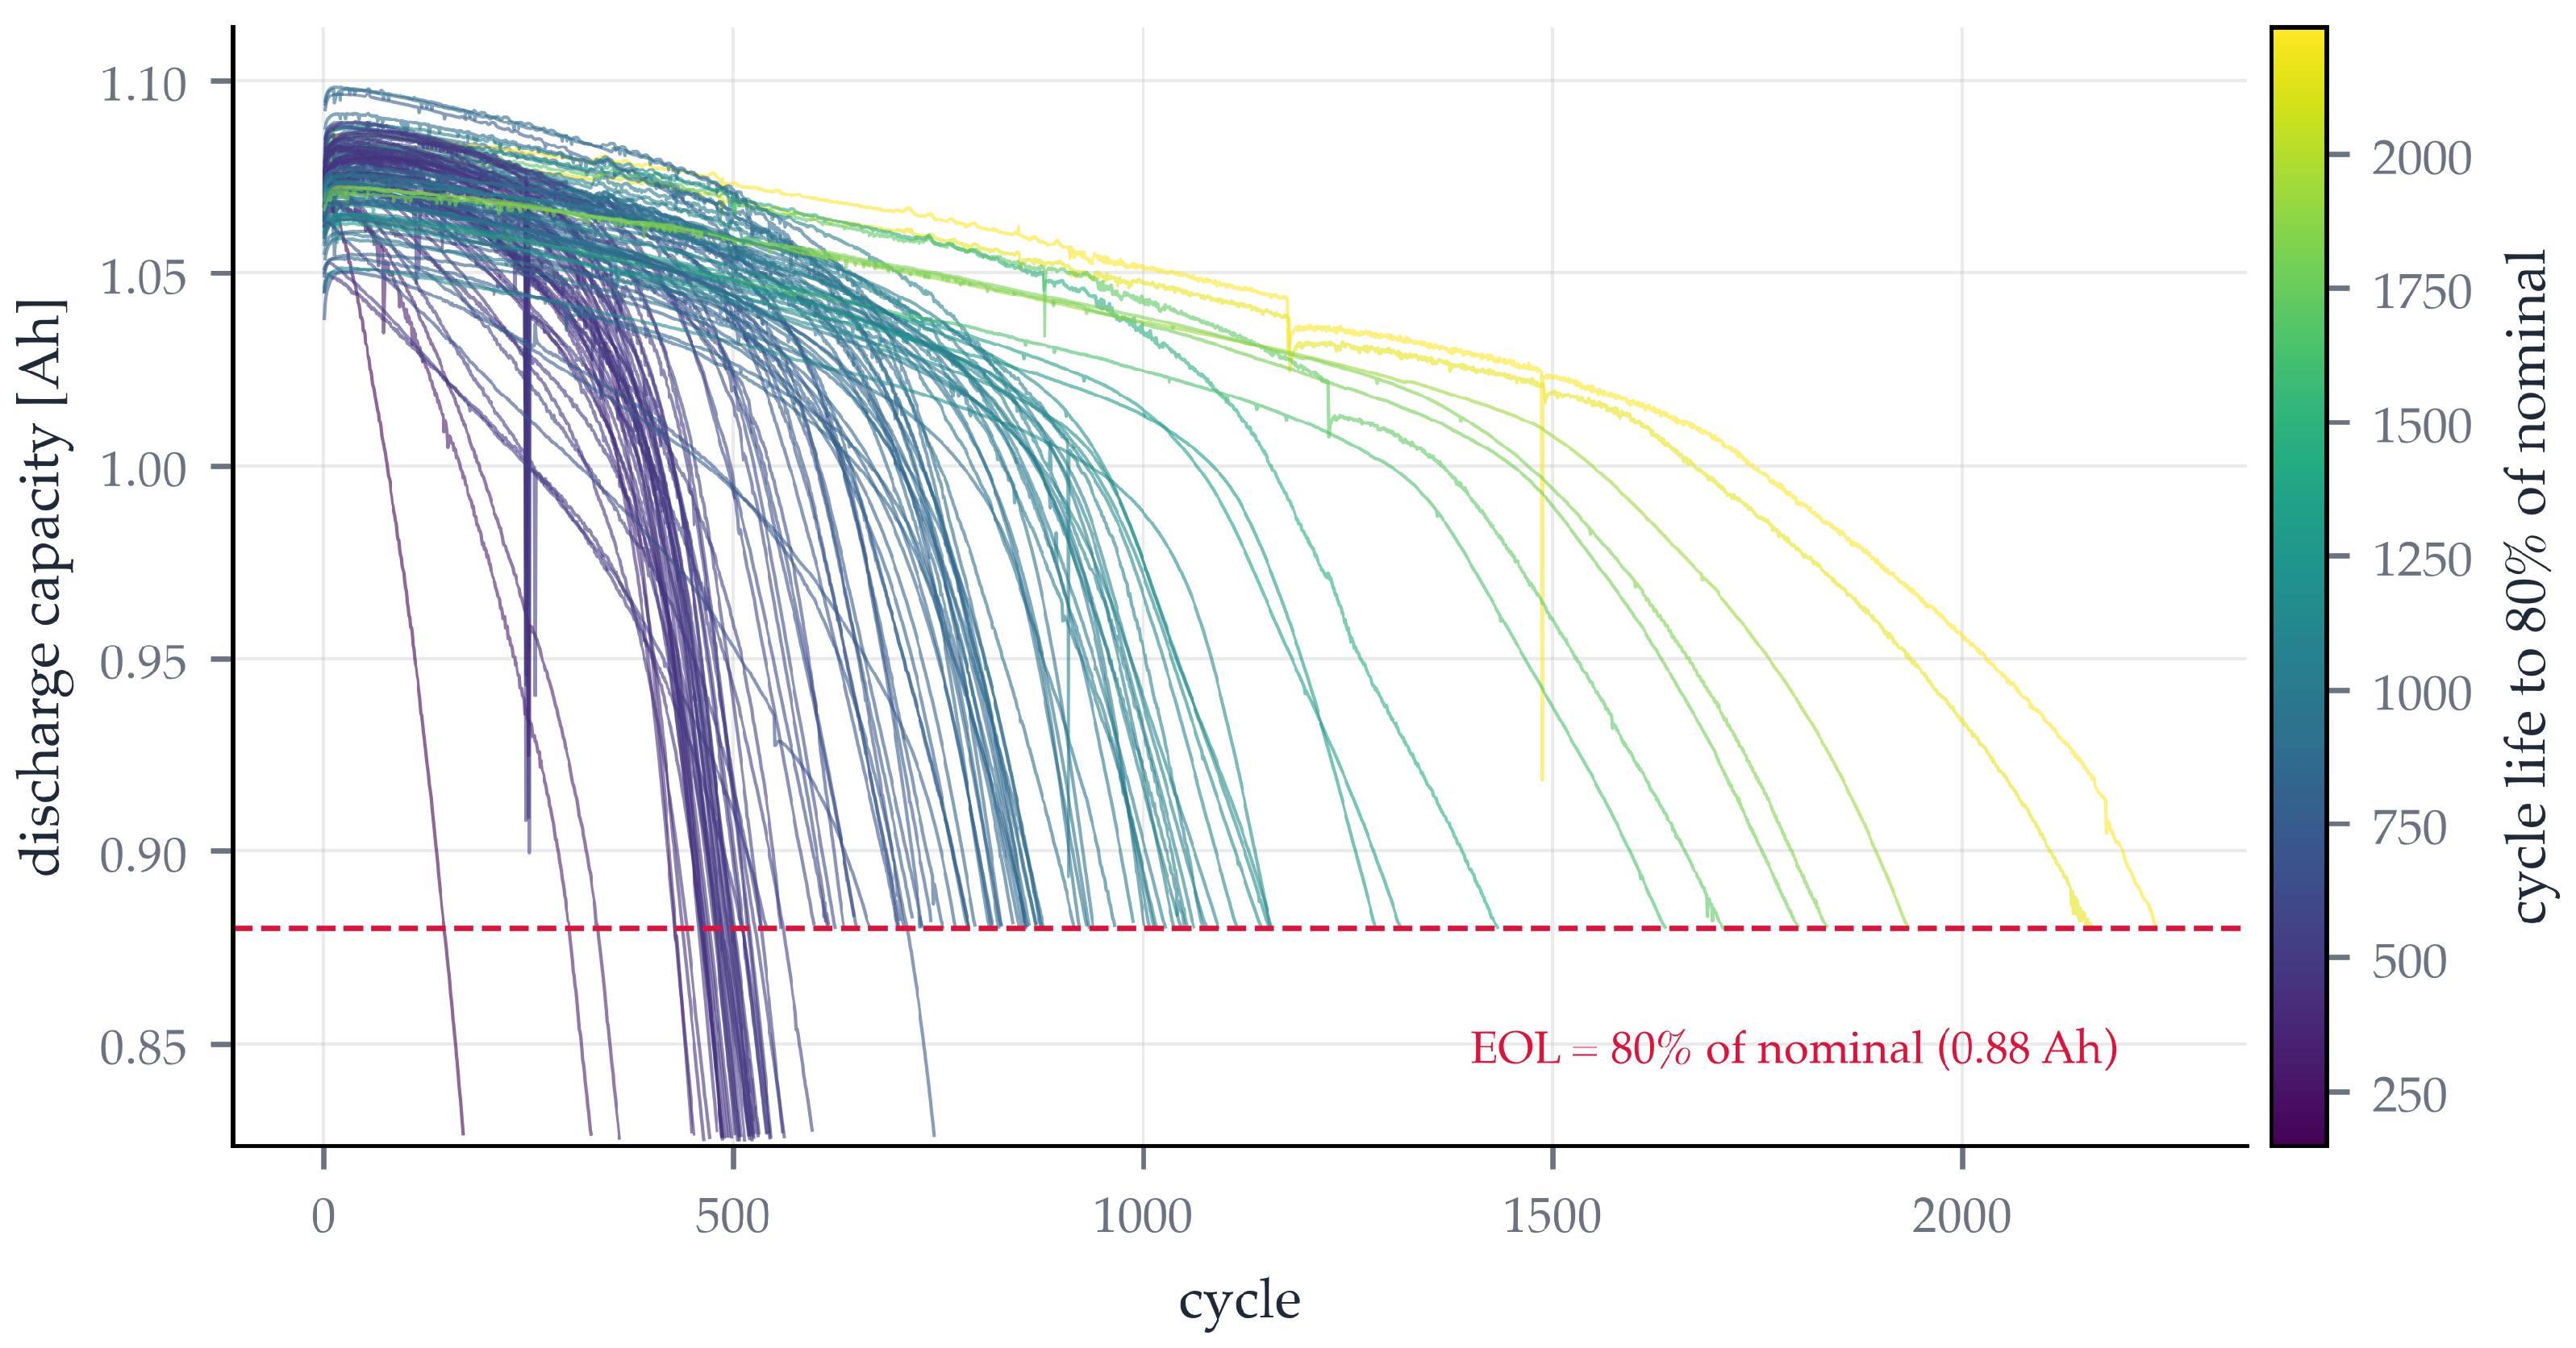
Figure 4 shows the capacity-fade curves. Table 5 summarizes prediction: the two models are essentially tied (log-space RMSE 0.0615 vs. 0.0611; the graph model’s lower cycle-space RMSE, 135.2 vs. 141.3, reflects the nonlinear back-transform rather than a real gap), the graph model wins 38 of 66 folds, and the paired difference is not significant (). With the variance-of- feature already in the baseline, graph neighbors add little to point prediction; we report this as a negative result.
Figure 4.
Capacity fade of 120 Severson cells (four QC-flagged cells omitted for clarity), colored by cycle life to 80% of nominal capacity.
Table 5.
Cycle-life prediction under leave-one-policy-group-out cross-validation (120 cells, 66 folds; identical XGBoost configuration for both models, seed 42). The graph-augmented model adds per-fold, train-neighbor-only knowledge-graph features to the baseline feature set. Paired per-fold comparison: the graph model wins 38 of 66 folds (baseline 28, no ties); Wilcoxon signed-rank on paired fold RMSEs .
4.2. Coverage-Gated Abstention
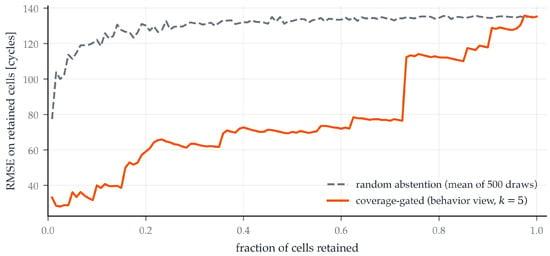
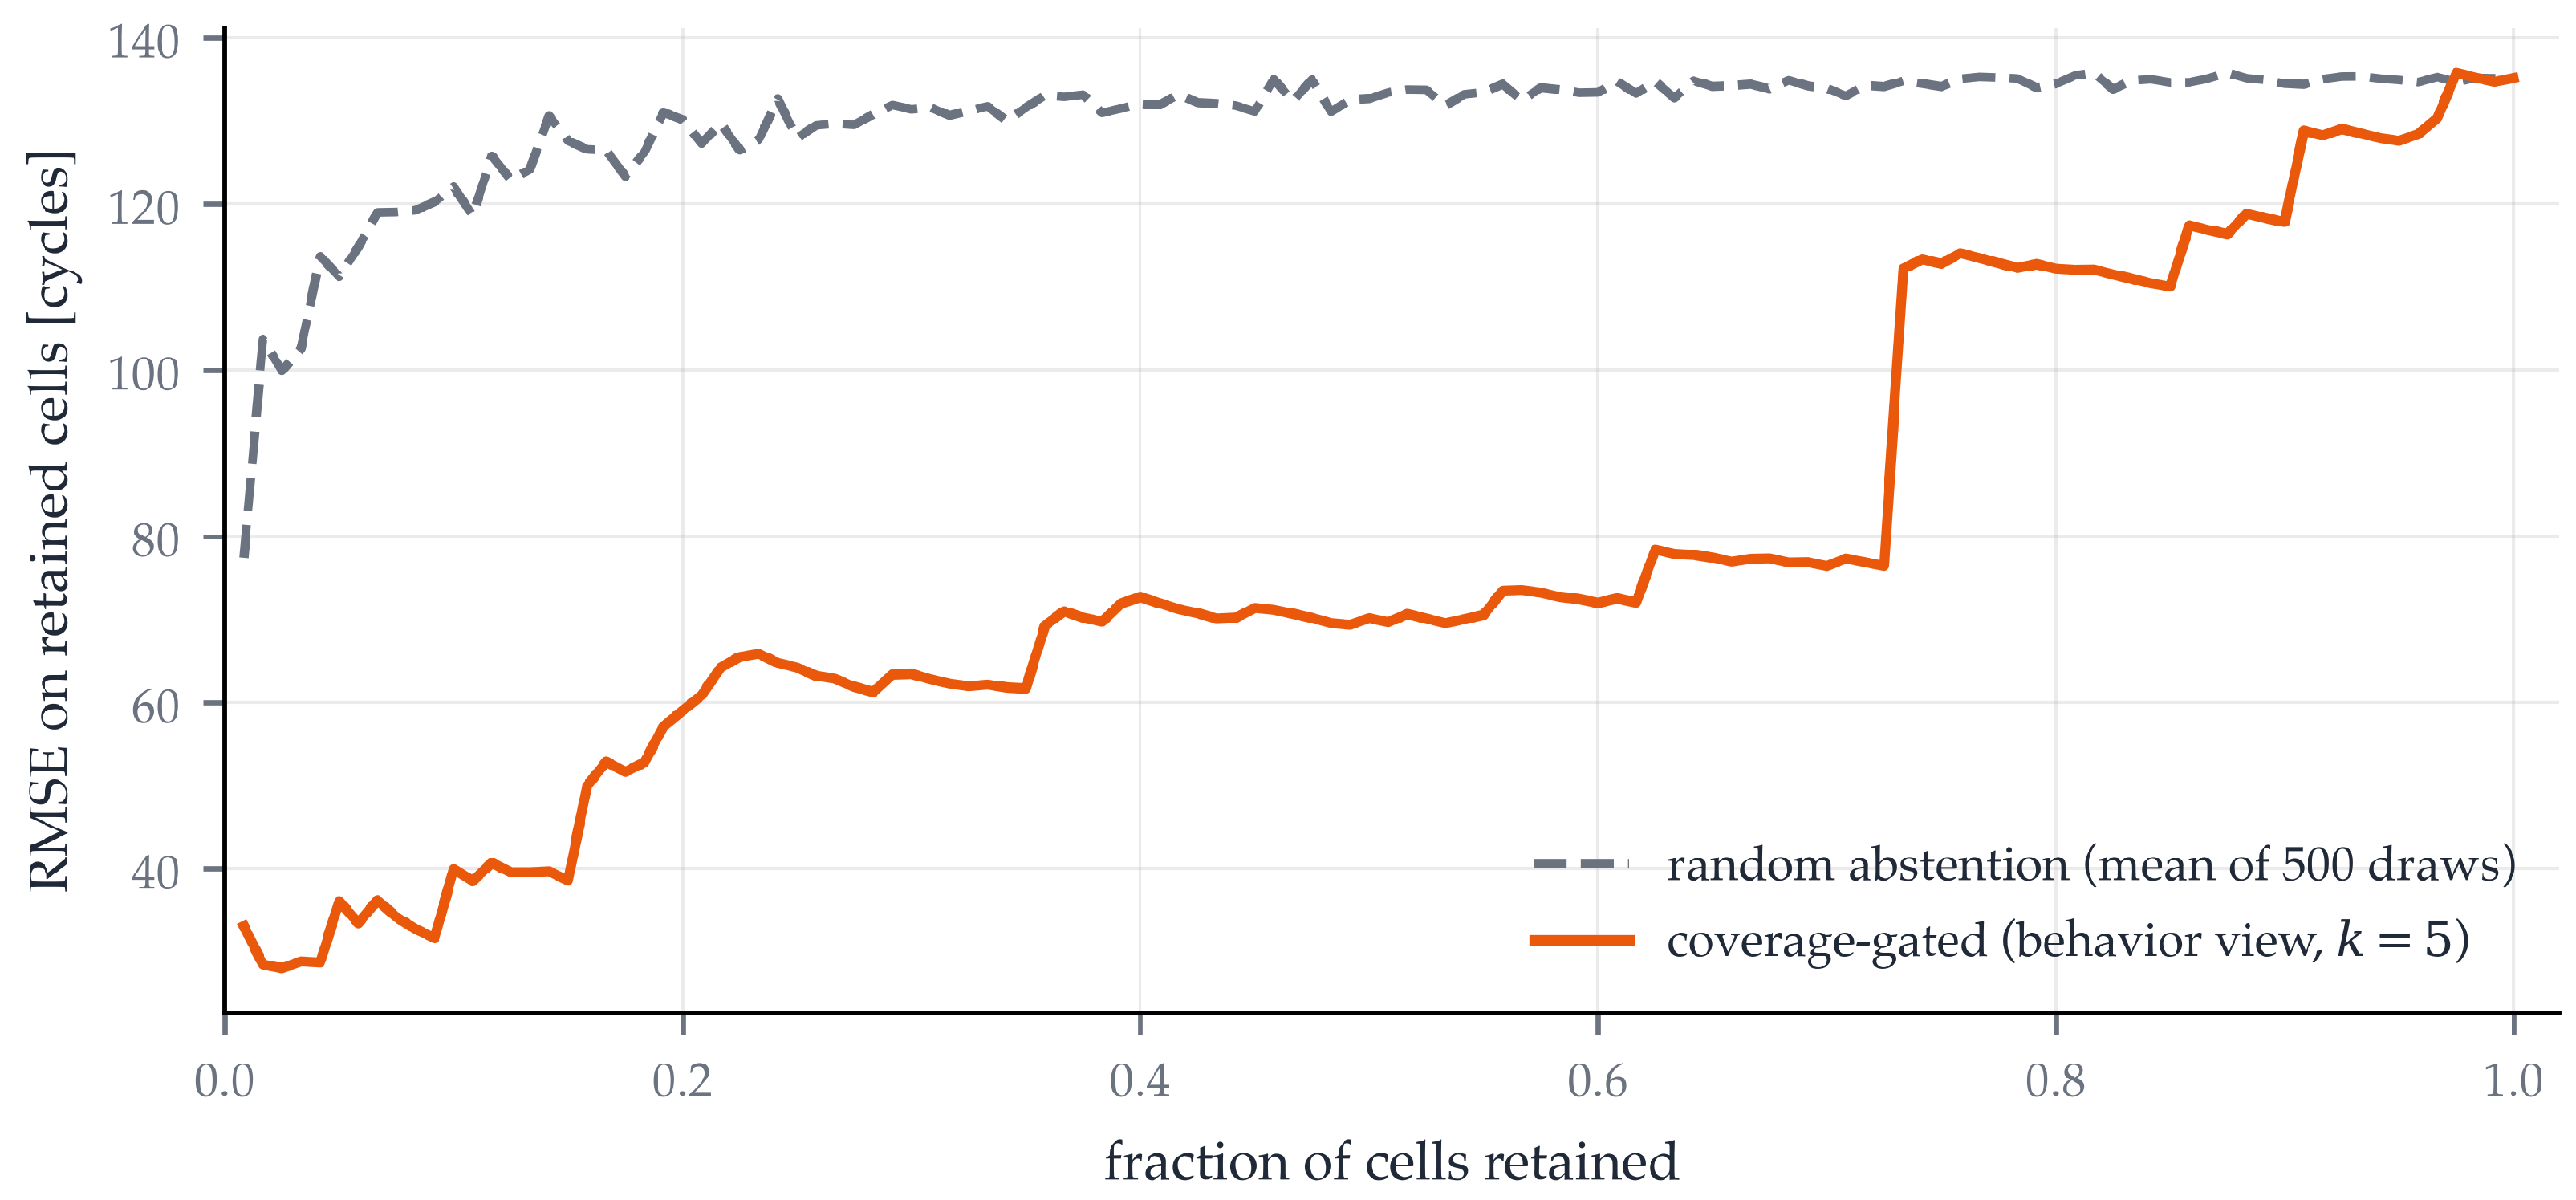
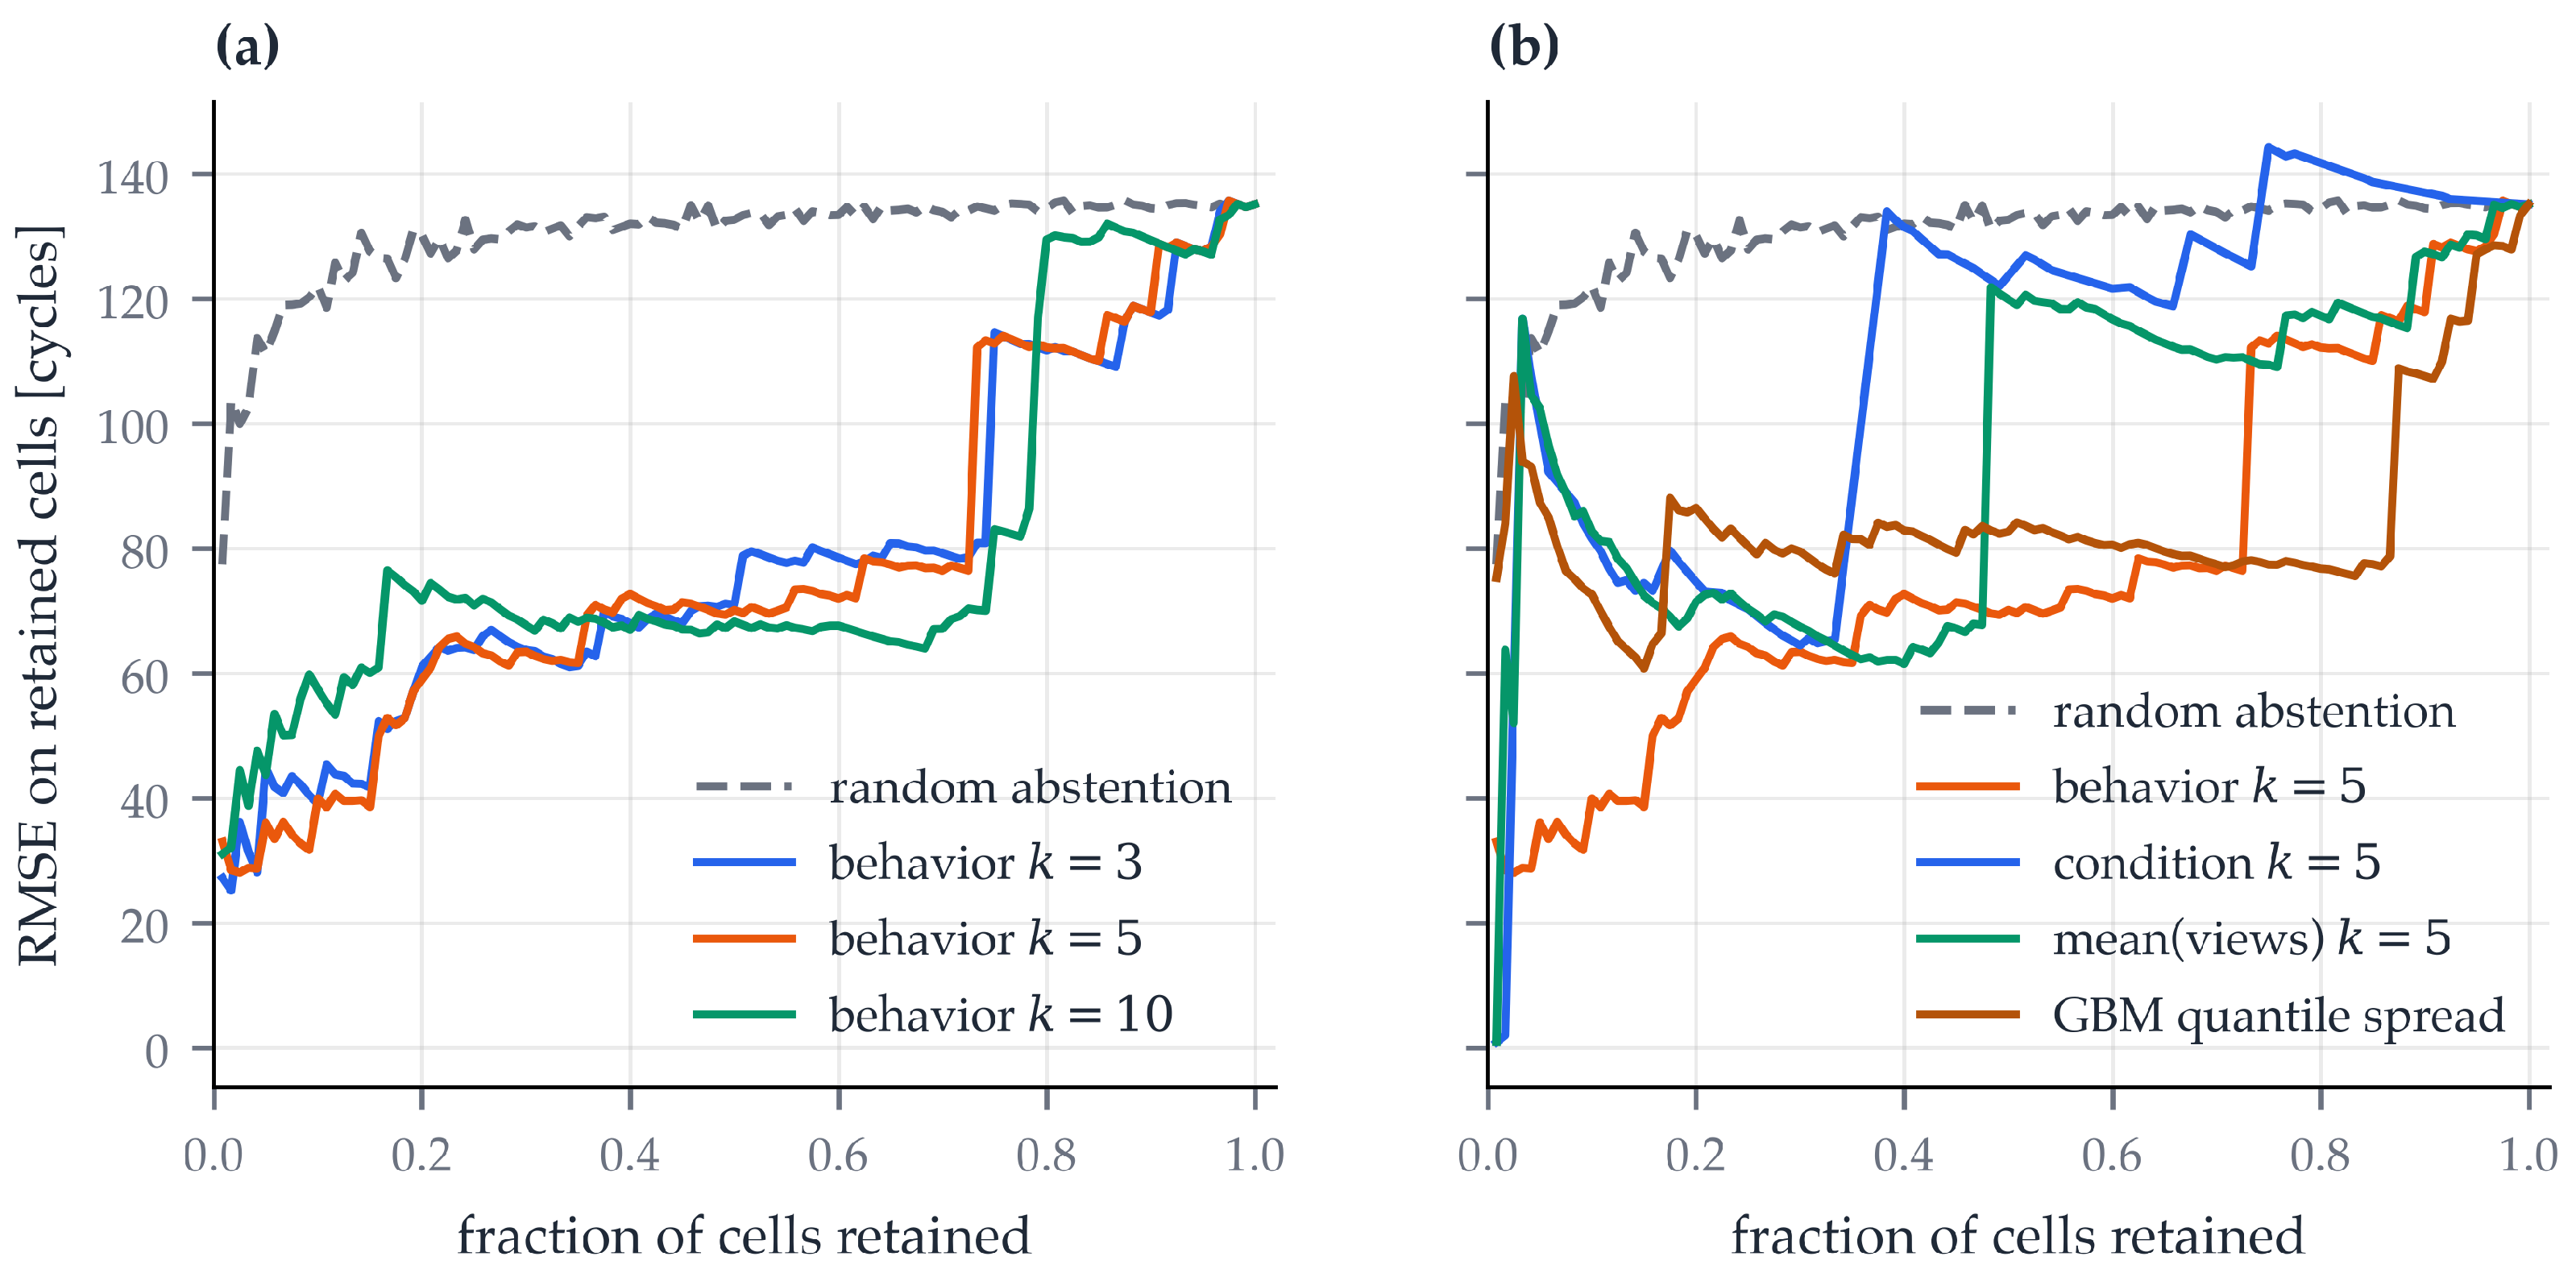
The graph earns its keep in abstention (Figure 5). Behavior-view coverage correlates with prediction error (Spearman , ) but not with cycle-life magnitude (, ): the gate selects reliable predictions, not short-lived cells. Retaining the best-covered 60% of cells reduces RMSE from 135 to 79 cycles, while random abstention at the same retention stays near 133.
Figure 5.
Risk–coverage curve for behavior-view coverage gating versus random abstention at equal retention.
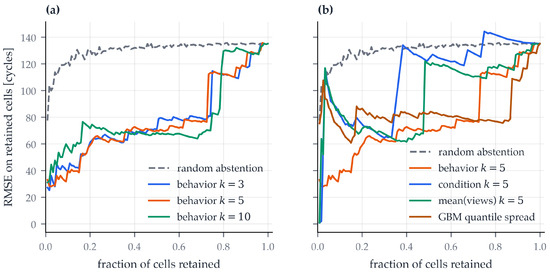
Table 6 and Figure 6 give the robustness analysis. The result is insensitive to the neighborhood size (: AURC 85–87). It is attributable to the behavior view: condition-view coverage collapses to random beyond ∼40% retention and shows no significant error correlation. On AURC, the coverage gate is statistically indistinguishable from the model’s own quantile-spread uncertainty, but it is the only gate with a significant rank correlation to error. Under the percentile formulation of the operational threshold (Section 3.4), AURC is 87.4 [67.5, 109.5] against the absolute rule’s 86.8, within the bootstrap interval, with the coverage–error correlation unchanged. A hybrid gate combining both signals underperforms both components (AURC 109.7): jointly tuning two thresholds out-of-fold overfits at . We keep this negative result as evidence that the evaluation does not reward gate complexity.
Table 6.
Area under the risk–coverage curve (AURC; mean RMSE in cycles across retention levels 20–100%, lower is better) for each abstention gate, with 95% confidence intervals from 1000 fold-bootstrap resamples. Hybrid-gate thresholds are selected on held-out folds only.
Figure 6.
Robustness of the abstention result: (a) sensitivity to the neighborhood size k; (b) gating signals compared (behavior, condition, and mean similarity views, and the model’s quantile-spread uncertainty).
4.3. Claim Extraction
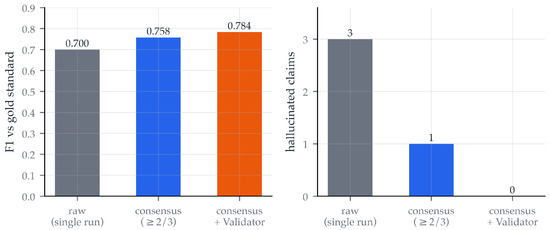
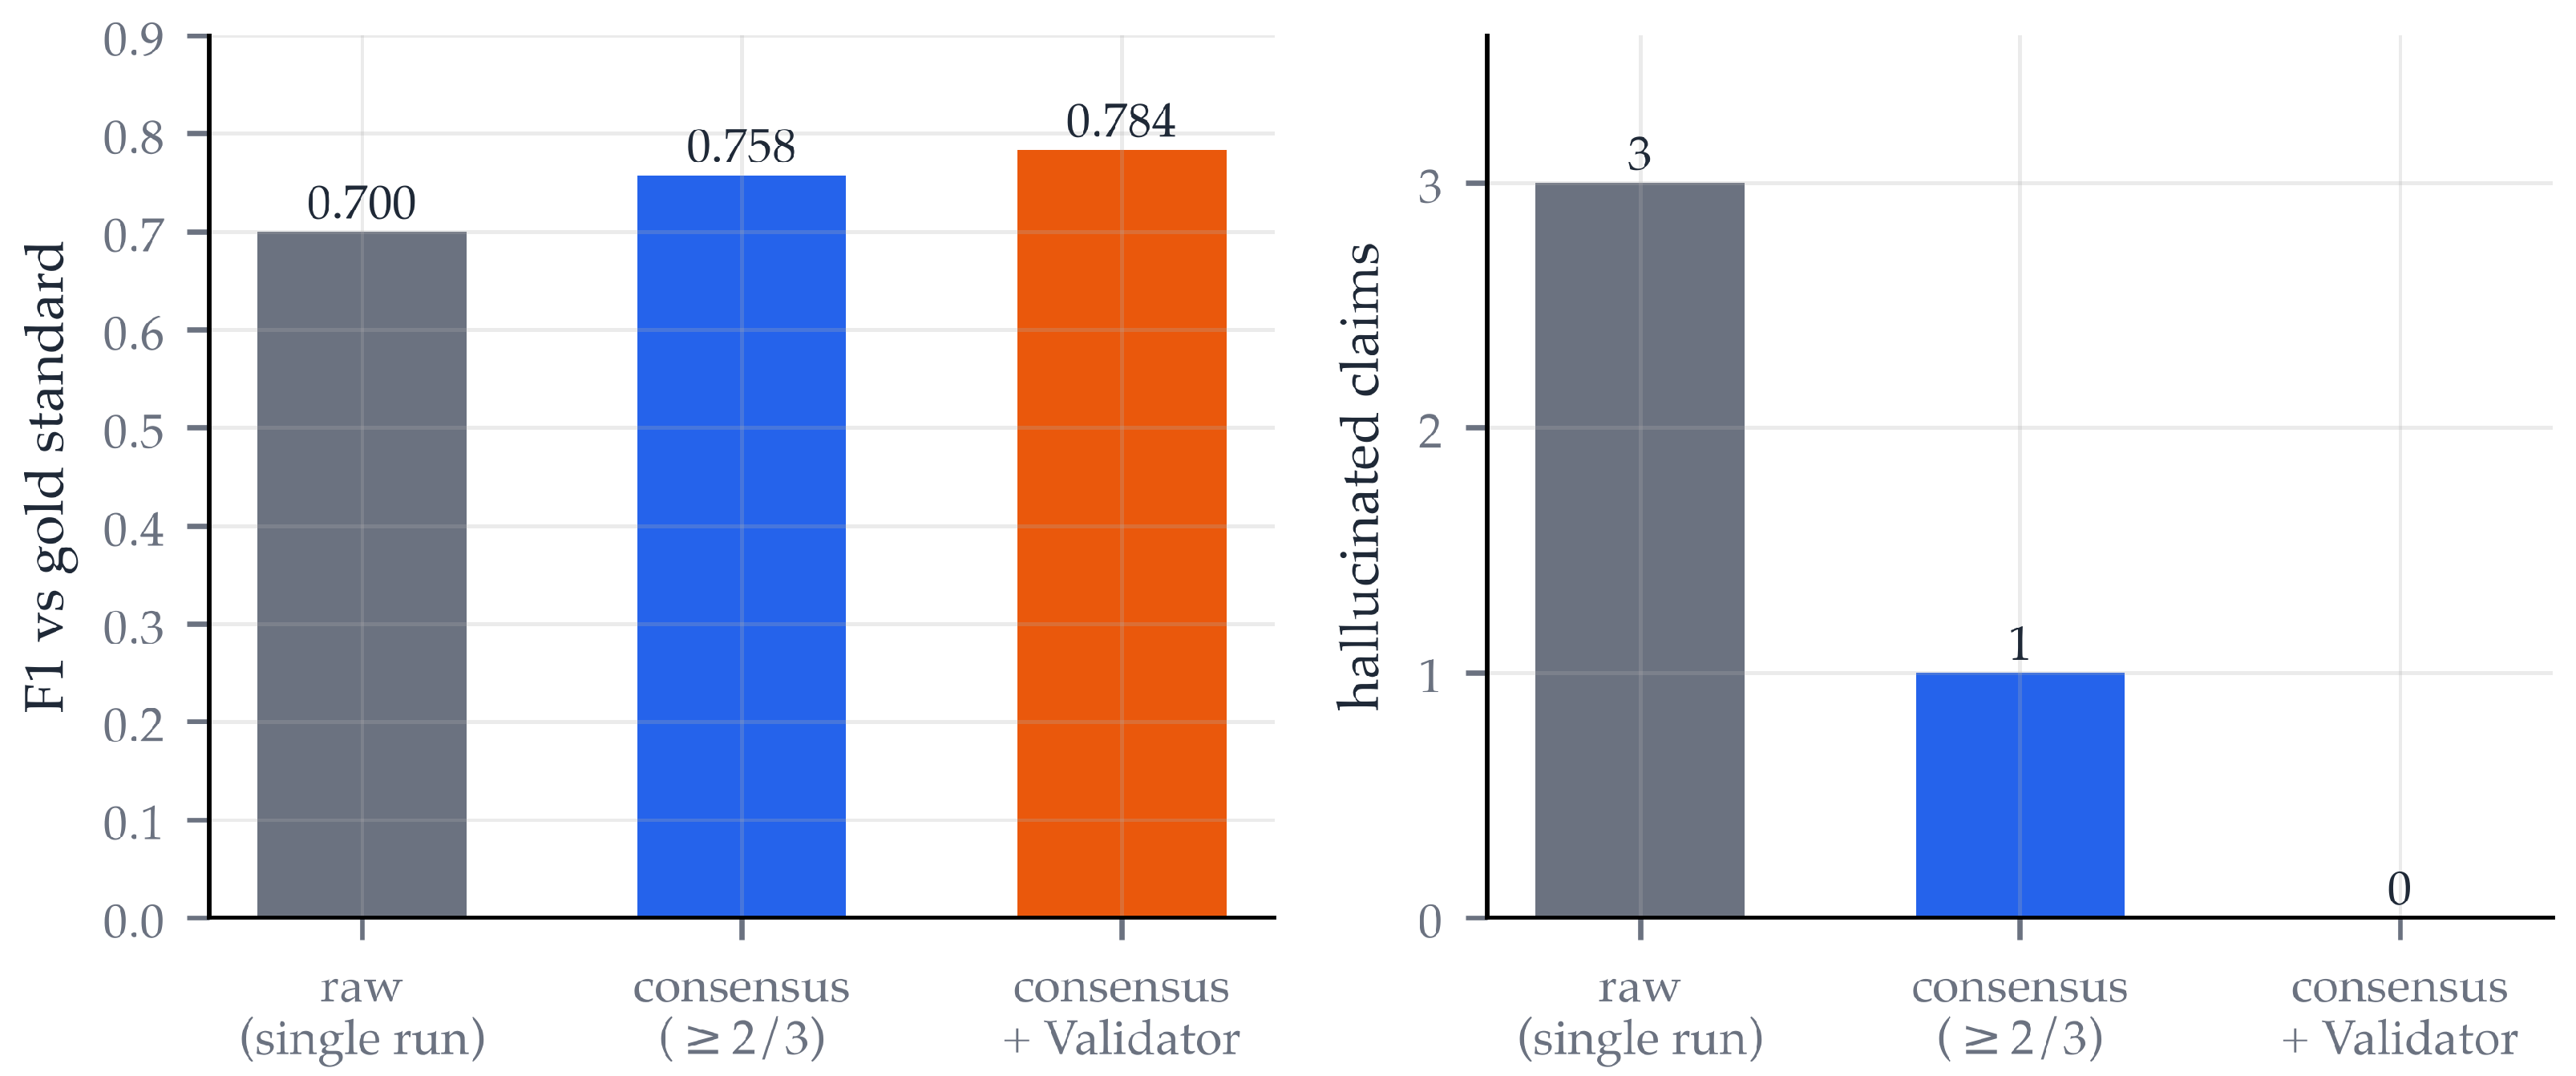
Table 7, Table 8 and Table 9 and Figure 7 summarize the extraction experiments. Raw single-run extraction reaches with three hallucination-class errors, and its output is non-deterministic even at temperature 0 with a fixed seed ( spread 0.033 over three runs; pairwise claim-set Jaccard 0.77–0.84), a known property of batched inference serving rather than of the model weights. Single-pass LLM extraction is therefore not reproducible enough to load a knowledge graph directly. Three-run consensus plus the deterministic validator reaches with zero unsourced values and zero false rejections: every rejected claim was genuinely erroneous. The conditions-focused second pass raises conditions accuracy from 0.763 to 0.816 and repairs the dominant single-pass failure (charge-protocol conditions, 0/4 → 4/4 correct), at a ∼17× call-count cost and a 21% over-extraction rate. The residual errors are neighbor-row misattributions, which row-level table grounding addresses; this fix is implemented and measured below. Two points bound the impact of these residual errors. First, over-extraction here means surplus conditions whose values do appear in the source text, not fabricated values: the hallucination count remains zero after validation. Second, no unvalidated LLM output reaches the graph in any case—the deployed graph holds only the manually annotated gold claims, so extraction errors affect the reported evaluation metrics, not the stored data (Section 4).
Table 7.
LLM claim extraction (Llama-3.3-70B, temperature 0) against the manual gold standard, per document (run 1 of 3). The image-only Panasonic marketing sheet (14 gold claims, no text layer) is excluded from extraction; it would require OCR or a vision model. Cond. acc. = fraction of matched claims whose stated test conditions are correct; halluc. = predicted claims whose value appears nowhere in the source text. P = precision; R = recall; F1 = F1 score.
Table 8.
Effect of the deterministic Validator and multi-run consensus on extraction quality (same three cached extraction runs throughout; 48 evaluable gold claims). The Validator applies a schema gate with mechanical unnesting, a value-in-source check, per-property plausibility bounds, and an “” tolerance normalizer. Validator false-rejection rate: 0/5—all rejections were genuine errors.
Table 9.
Conditions-focused second extraction pass, evaluated on the 38 gold claims matched by the frozen value pipeline. Claim-level accuracy uses the same metric as Table 7; over-extraction = conditions asserted where the gold standard records none (manual review attributes the flagged cases to cross-reference resolution (defensible) and neighbor-row misattribution (genuine error)). The focused pass costs one LLM call per claim per run (9 → 156 calls for the three-document pipeline).
Figure 7.
Extraction quality across pipeline stages: (left) and hallucinated claims (right) for raw extraction, three-run consensus, and consensus plus the deterministic validator.
Held-out document. To measure generalization beyond the development corpus, a previously unseen datasheet (Samsung INR18650-25R, a 17-page full product specification) was annotated manually by the first author before any pipeline contact, yielding 41 gold claims; the frozen pipeline was then run blind, with no changes to the prompt, schema, or validator. Held-out performance drops substantially: against 0.78 in-corpus (precision 0.88, recall 0.34). The decomposition is diagnostic. Precision holds—what the extractor emits is almost always correct, with zero hallucinated values and zero incorrect validator decisions, so the safety properties of the harness transfer. Recall does not: 17 of the 27 missed claims are cells of tabular characteristic grids (relative capacity versus temperature and rate) that the extractor never emitted in any run, and the remainder are individual specification rows it skipped. The conditions-focused second pass, beneficial in-corpus, is negative held-out (conditions accuracy 0.79 → 0.71, with a 29% over-extraction rate), and one conditions error required resolving a cross-reference between sections, which a page-local pass cannot do. The held-out result sharpens the in-corpus conclusion rather than contradicting it: the deterministic harness generalizes, the extractor’s coverage of table-structured content does not, and table grounding is the indicated fix. The next experiment measures it.
Row-level table grounding. The setup matches the held-out evaluation: the same document, the same 41-claim gold standard, and the same matching rules. The extractor prompt, validator, consensus mechanism, and evaluation are imported unchanged; the only modification is the extraction context. Tables are segmented into deterministically isolated row-level units (15 for this document), extraction runs once per unit, and the predictions are merged with the document-level pass (Table 10). Recall rises from 0.342 to 0.634 and from 0.49 to 0.61, with hallucinations remaining at zero. All 17 characteristic-grid cells that the document-level pass never emitted are recovered at value level. The row-level view also explains the largest document-level error bucket: one grid’s axis row ends on page 4 and its value row begins on page 5, so the row-by-column association is simply absent from flat document text. The gain has a cost: precision falls from 0.875 to 0.591. Seven of the eighteen false positives come from a single naming choice on two grids, where every cell is read correctly but named under a different, equally defensible scheme than the gold standard’s. Five more are new over-extraction of discharge cut-off currents. Row isolation buys structural access and costs restraint. One methodological caveat applies: the grid-naming rule was written with knowledge of the gold standard’s naming scheme, so we report the value-level recovery (17/17) alongside the exact-name metric (10/17); specification-row recoveries involve no naming rule and are unaffected. The run also exposes a validator limitation: a silently converted charge time (180 min emitted as 3 h) passes the value-in-source check because the digit 3 occurs elsewhere in the document. We state this limitation rather than patch it post hoc.
Table 10.
Row-level table grounding on the held-out Samsung document (41-claim gold standard, matching rules identical to the document-level evaluation; extractor, validator, and consensus unchanged). The merged configuration combines the document-level pass with the 15 row-level table units. Halluc. = predicted claims whose value appears nowhere in the source text. Pred. = predicted claims; TP/FP/FN = true/false positives and false negatives.
Image-only document. The image-only Panasonic marketing sheet, previously excluded from extraction, was OCR-processed (Tesseract) and the frozen document-level pipeline was run unchanged over the OCR text: precision 1.000, recall 0.643, , zero hallucinations. All 14 gold values are legible in the OCR output, and no miss is attributable to OCR. The five misses are the extractor’s own. Three are silent unit conversions (two mAh-to-Ah, one mA-to-A) that the Validator correctly rejected, two at the value-in-source check and one at the plausibility bounds, which is why precision is perfect. The two experiments together mark the limits of the value-in-source check: it catches a converted value when the converted number is absent from the document, as here, and passes one when the number happens to occur elsewhere, as in the charge-time case above. This is an exploratory result on one document; the deployed pipeline is unchanged.
4.4. Claims Findings and Discrepancies
Table 1 summarizes the gold standard. The claims corpus itself yields findings. Cycle-life claims differ not only in value but in definition: A123 states no retention threshold, while Panasonic and LG use pass criteria at ≈70% and 60% retention, under different discharge rates. One widely mirrored datasheet omits cycle life entirely. Table 4 shows the first computed claim-versus-measured discrepancy: A123’s “>1000 cycles” against the Severson distribution (median 736), flagged conditions_comparable = false because the measured cells are deliberately fast-charged while the claim’s charge regime is unstated. The under-specification, not the % gap, is the substantive finding.
Claim-versus-claim reconciliation across document variants (Table 11) makes the disagreement systematic: of 43 cross-document property comparisons, 14 (roughly one in three) yield a value conflict or a condition mismatch. Twelve involve third-party documents (specification echoes and a retail wrapper label), with discrepancies such as a 4 vs. 5 A fast-charge current for the A123 cell and a 60 vs. 70% retention threshold on identical claimed cycle-life values for the LG cell; the schema flags such condition mismatches separately from value conflicts. The remaining two are manufacturer-internal: Panasonic’s marketing sheet and full product specification contradict each other on the charge-temperature range (+10–45 vs. 0–40 °C) and the maximum cell mass (47.5 vs. 48.5 g). These internal conflicts are the core of the finding; no third-party transcription error can explain them.
Table 11.
Specification consistency across document variants of the same cell: gold datasheet claims vs. the lygte-info.dk specification echoes, and (Panasonic) the marketing sheet vs. the full product specification. Values compared after unit normalization (2% tolerance; a point value satisfying the other document’s stated bound counts as consistent). Condition mismatches (same value, different stated test conditions) are flagged separately from value conflicts, and both are split by provenance: manufacturer-internal (both documents issued by the manufacturer) vs. ecosystem (at least one third-party document). Comp. = properties compared; Cons. = consistent; Cond. = condition mismatches; Confl. = value conflicts; Mfr. = manufacturer-internal; Eco. = ecosystem; Gap = property present in only one document.
4.5. Cross-Study External Validation
Three external populations, none seen by the model, the neighbor bank, or the threshold, probe the gate under increasing feature overlap: HUST (same cell, mirrored protocol design—zero-shot refusal), SNL (same cell, slow charging, ingested via the update cycle of Section 4.7—refused outright), and Attia (same cell and laboratory, commensurable features—the first partial acceptance). SNL is additionally unsuited to a zero-shot acceptance test by construction: its capacity measurements are RPT-based at 0.5 C against the bank’s 4 C feature basis, and 24 of its 30 cycle-life labels are right-censored, so it enters the evaluation through the ingestion path (Section 4.7) rather than the prediction path.
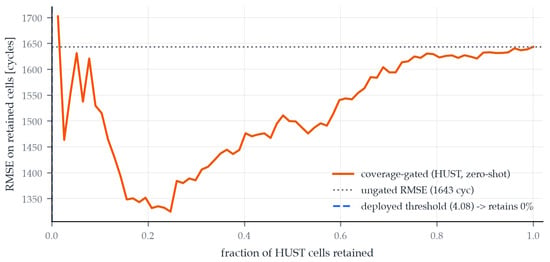
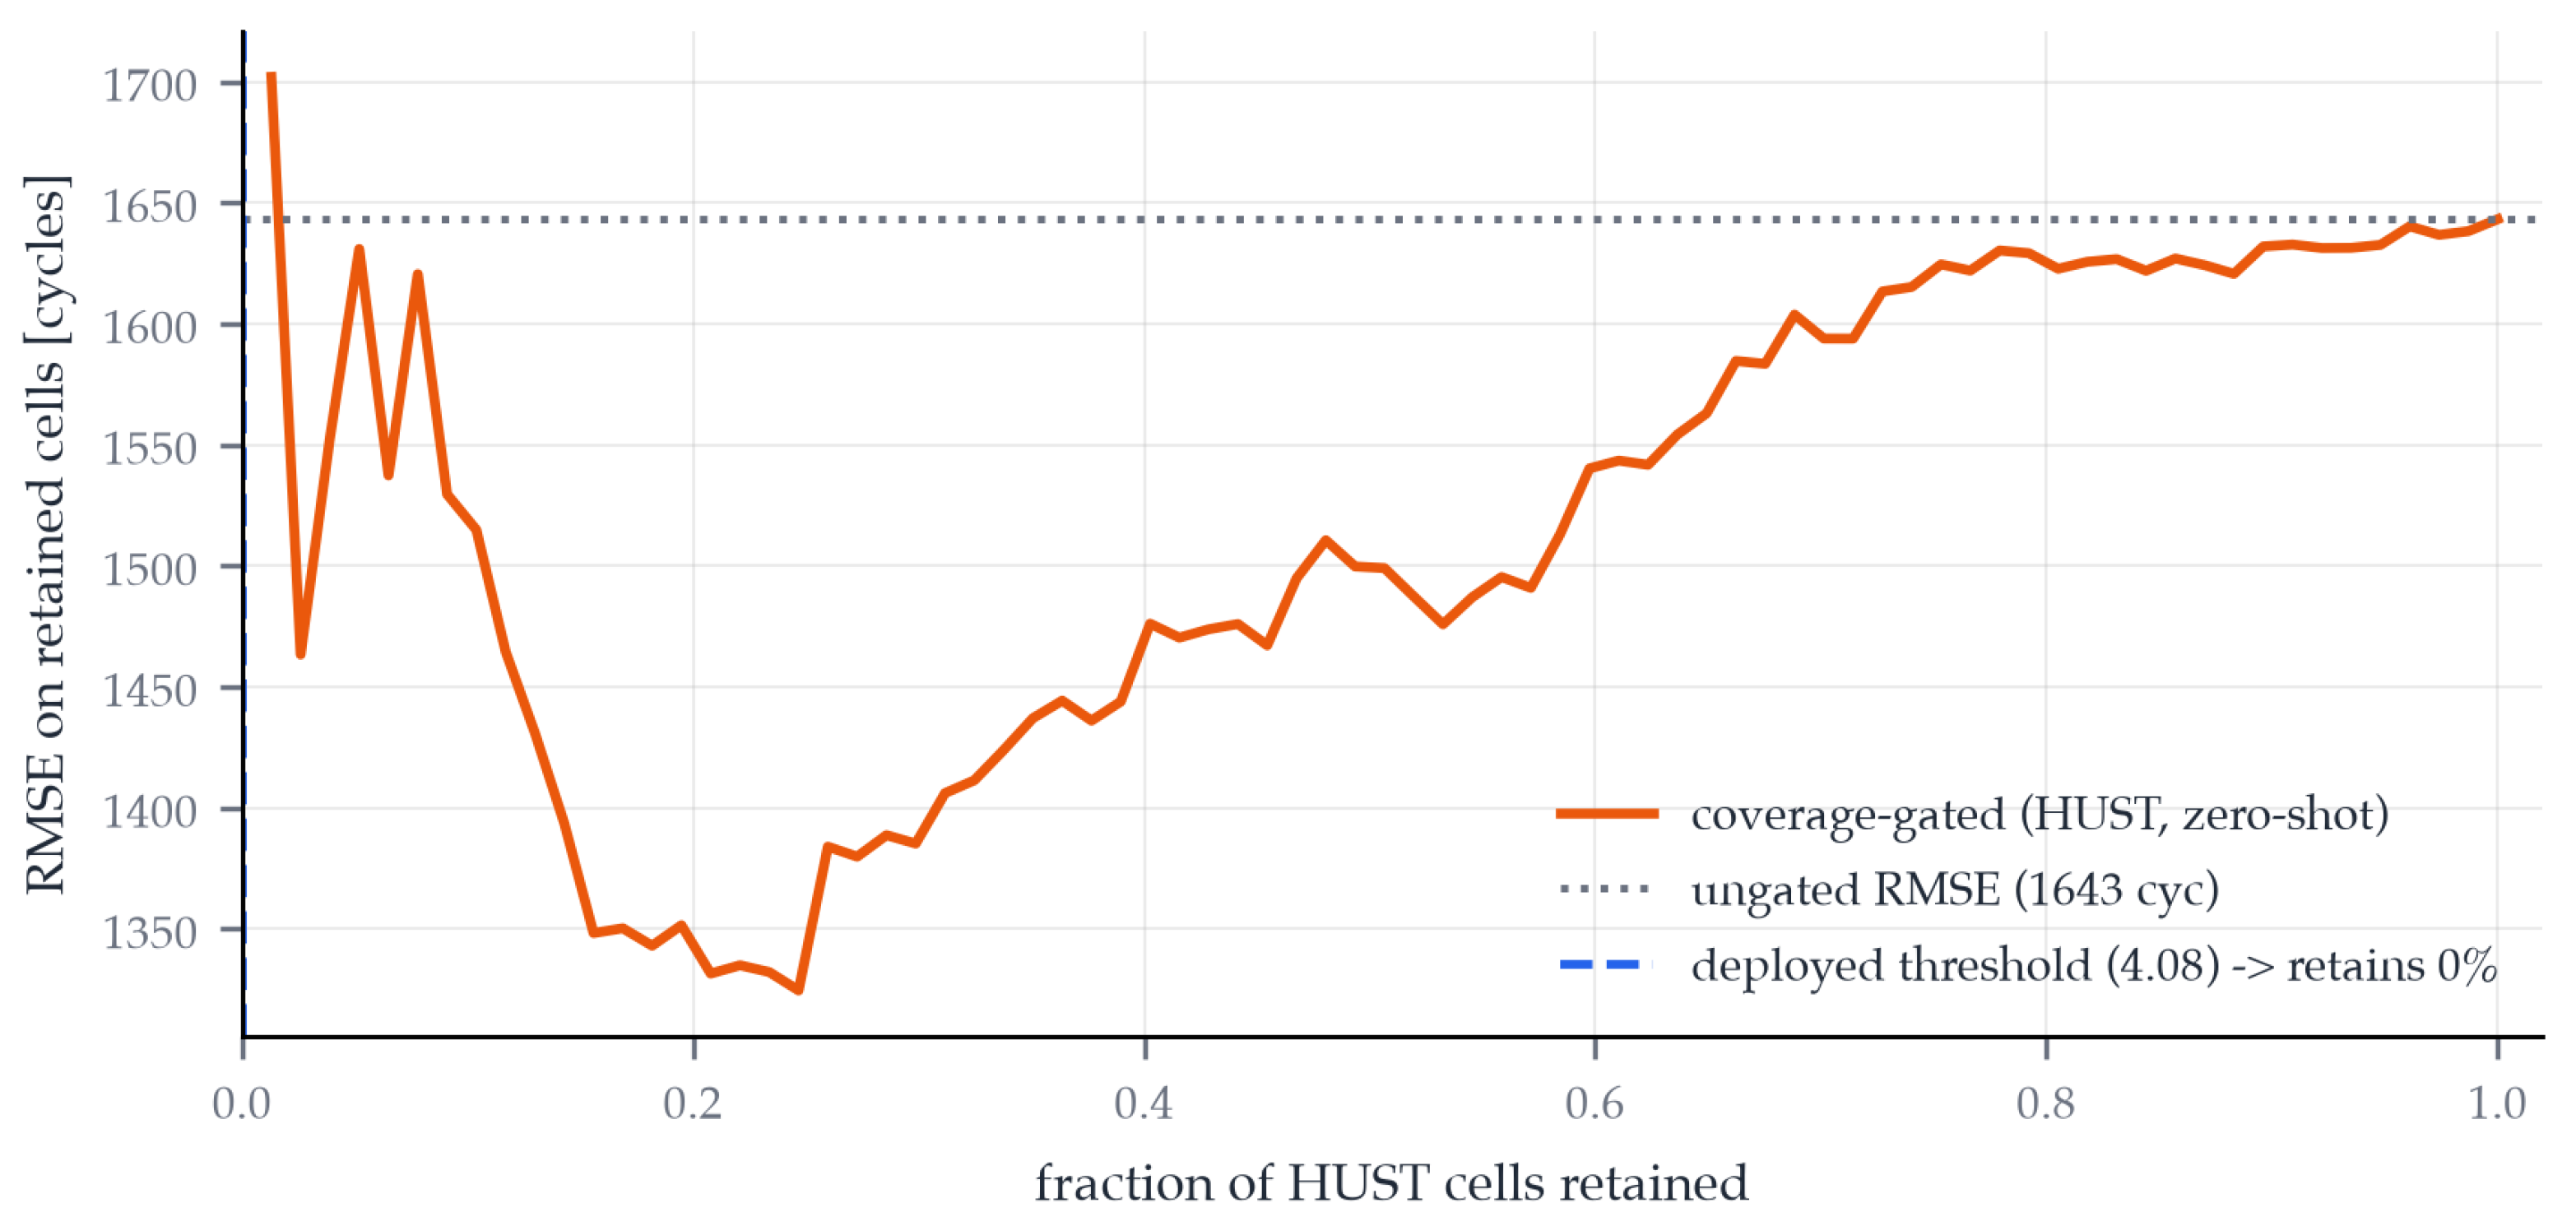
The deployed configuration (Severson-trained model, Severson-only neighbor bank, transferred abstention threshold, and no re-tuning) is evaluated zero-shot on the 77-cell HUST dataset [25]: the same commercial cell under a mirrored protocol design (per-cell multi-stage discharge at fixed fast charge, where Severson varies charge at fixed discharge), with substantially longer lifetimes (median 1875 vs. 736 cycles). The result (Table 12, Figure 8) is an abstention success built on a prediction failure. Had the system answered, both models would have mispredicted every cell by ∼83% MAPE, predicting a few hundred cycles for cells lasting 1100–2700: the training prior, that high early variance implies short life, inverts under the multi-stage discharge protocol. The gate detects the shift before any label is seen: cross-study coverage (0.64–1.86) falls far below the deployed threshold (4.08), and the system abstains on all 77 HUST cells, versus 40% abstention in-study. The graph-free baseline, the standard deployment, answers every cell with ∼84% error and no warning. The cost of total abstention is zero utility on the new study until its data enters the graph; that is the designed behavior, and what the staged ingestion path exists to remedy.
Table 12.
Cross-study external validation: the deployed configuration (Severson-trained model, Severson-only neighbor bank, and transferred abstention threshold) applies zero-shot to the 77 HUST cells—the same commercial cell under a mirrored protocol design (varied discharge, fixed fast charge) with substantially longer lifetimes. No re-tuning of any component.
Figure 8.
Risk–coverage on the HUST cells under the transferred abstention threshold. The deployed threshold retains no cross-study cells; correctly so, given the error the model would otherwise produce. The blue dashed legend entry marks the deployed threshold, which retains 0% of cells and therefore coincides with the left edge of the plot; no visible line is drawn for it.
4.5.1. Small-Sample Adaptation
The question that follows total abstention is how quickly the system becomes useful as evidence arrives. We progressively add labeled HUST cells to the neighbor bank (random draws, five repeats), retrain the predictor on the combined data with the fixed configuration, and evaluate the remaining cells under the stratified percentile gate with the in-study setting () transferred unchanged (Table 13). At the rule falls back to the whole-bank percentile and reproduces the all-abstain result exactly. At , retention reaches % with % MAPE on retained cells; false acceptances (retained with APE > 30%) fall from 9.8 at to 2.0 at . The gate opens because the graph acquires same-study evidence, not because it is loosened.
Table 13.
Small-sample adaptation on the external HUST study under the study-stratified quantile gate: a cell is served when its neighborhood coverage reaches the st percentile of the coverage that bank cells from its own study actually attain. The percentile was fixed on the Severson in-study cross-validation and is never re-tuned; only the neighbor bank and the predictor change. n labeled HUST cells are added to the bank at random and the predictor is retrained on Severson ; evaluation is on the remaining cells. Mean ± standard deviation over 5 seeded repeats. False acceptances are served predictions with absolute percentage error above 30%; unnecessary rejections are abstentions on cells the predictor would have called within that bound. At the bank holds no HUST cells, the rule falls back to the whole-bank percentile, and the gate abstains on the entire population.
Three qualifications are part of the result. First, the gate must ship with retraining: with the bank augmented but the predictor unchanged, served predictions remain at ∼71% MAPE, so coverage recovery alone is not competence recovery. Second, retention is non-monotone in n, because the threshold and the coverage distribution rise together under a self-referencing criterion, so n is not a progress bar. Third, among accepted cells the coverage–error correlation is near zero: after adaptation the gate’s value is the accept/reject decision, not a confidence ordering over accepted predictions.
4.5.2. Partial Acceptance on a Third Study
The Attia et al. [7] dataset—45 cells of the same commercial model, cycled in the same laboratory as the training data under closed-loop-optimized multi-step charge protocols—provides the remaining external scenario: features fully commensurable with the bank (all behavior features fall inside the bank’s range), complete labels (45/45 cells reach end of life), and, uniquely, non-zero acceptance under the deployed gate transferred unchanged: 17 of 45 cells retained (37.8%). Inspecting this first partial acceptance is more informative than celebrating it (Table 14). The retained cells show lower absolute but higher relative error than the abstained ones (RMSE 141.7 vs. 197.8 cycles; MAPE 21.5% vs. 19.1%), because the gate selects systematically shorter-lived cells: Spearman correlation between coverage and cycle life is on Attia, against in-study, where this confound check was explicitly run and passed. Out of distribution, coverage acts partly as a lifetime proxy rather than a predictability signal—the coverage–error correlation on the retained set is weak (, )—and the model’s quantile band is severely miscalibrated in one direction (empirical coverage 22% against a nominal 68% over all 45 cells, with every miss below the band: the model over-predicts lifetime). A structural caveat bounds these numbers: eight of nineteen model inputs, the charge-policy features and their derivatives, are undefined for Attia’s four-step protocols, which the bank’s policy grammar cannot express, so part of the degradation is attributable to absent inputs rather than to distribution shift. The eight features undefined for Attia cells are supplied as missing values and routed by XGBoost’s learned default branches; no imputation is performed, so the reported errors reflect prediction from 11 of 19 inputs rather than from imputed substitutes.
Table 14.
Partial acceptance on a third external study: Attia et al. 2020 [7] (closed-loop optimization; 45 cells of the same A123 APR18650M1A, same laboratory and equipment as the training study, 30 °C, 4C discharge, four-step constant-current fast-charge protocols). The deployed configuration is applied unchanged—Severson-trained model, Severson-only neighbor bank, stratified percentile gate at falling back to the whole-bank percentile because no Attia cell is in the bank. Nothing is retrained and nothing is added to the bank. Unlike the HUST and SNL populations, the 4 C discharge is shared with the bank, so the behavior-view features are commensurable and the gate retains a non-empty subset. False acceptances are served predictions with APE above 30%; unnecessary rejections are abstentions on cells the model would have called within that bound.
Five labeled Attia cells repeat the adaptation result (Table 15): with the stratified gate drawing its reference from same-study cells, retained MAPE halves (), false acceptances fall to , and band calibration improves from 6% to 47% (retained cells, before vs. after adaptation)—while the lifetime-proxy correlation is essentially unmoved (). Adaptation repairs the predictor; it does not repair the selection criterion on this population. The practical reading spans all three external studies: the gate’s accept/reject decision is trustworthy (it refused HUST and SNL outright and its acceptances here carry few gross errors after adaptation), but zero-shot partial acceptance on a new population is not a certificate of competence, and the coverage–lifetime correlation check that detected the proxy behavior here should accompany any deployment on a new population as a standing diagnostic. Retention at is additionally high-variance (35–78% across repeats) since a percentile estimated from five reference cells is unstable; demonstrates the mechanism, not an operating point.
Table 15.
Minimal adaptation on Attia et al. 2020 [7]: five labeled cells added to the neighbor bank at random and the predictor (point and quantile models) refitted on Severson , evaluated on the remaining 40. The stratified percentile gate is unchanged at ; with five same-study cells in the bank the rule now takes its reference from Attia’s own coverage distribution rather than falling back to the whole bank. Mean ± standard deviation over five seeded repeats; the zero-shot row is the unadapted deployed configuration on all 45 cells, shown for contrast. FA counts served predictions with APE above 30%, UR abstentions on cells the model would have called within that bound. is Spearman (coverage, cycle life) over the evaluated population—the confound check that reads in-study.
4.6. Vanilla LLM Versus Knowledge-Graph Answers
To measure what the graph adds over simply asking a language model, one natural-language question per gold claim is posed to the same 70B model used by the extractor, with no documents and no retrieval, and compared against BatteryKG’s deterministic claim lookup (Table 16). The vanilla model answers fluently but without provenance. It cannot name the document it is quoting, and some of its errors correspond to a different specification variant than the one asked about; this failure mode is only detectable because the graph holds the variants. The knowledge graph answers with value, stated conditions, source document, and page, and lists all variants when its sources disagree. Asked for the fast-charge current of the A123 APR18650M1A, for example, the vanilla model returns a single unattributed number. BatteryKG returns both recorded variants with their provenance, 4 A (A123 datasheet, p. 1, “4 A to 3.6 V CCCV, 15 min”) and 5 A (lygte-info.dk specification echo, same stated conditions), and flags the pair as a value conflict. The full question set is released with the code; conditions accuracy is scored on the 27 questions whose gold claim states numeric test conditions.
Table 16.
Vanilla LLM (Llama-3.3-70B, temperature 0, no retrieval) vs. BatteryKG (deterministic claim lookup) on one specification question per gold claim (). Conditions accuracy is over the 27 questions whose gold claim states conditions. Source attribution requires a specific, checkable document (name/page), not “the datasheet”.
4.7. The Update Cycle End-to-End
To demonstrate the staged ingestion path as a whole rather than by its parts, we ran one complete update cycle, promoting the SNL cycling study of Preger et al. [8] (30 A123 APR18650M1A cells from BatteryArchive, cycled at 0.5C charge with varied temperature, depth of discharge, and discharge rate) from discovery to changed graph outputs. The cycle exercised every stage. Staging: the study was registered as a candidate through the Literature Monitor’s staging path with a resolved DOI; because the monitor’s automated sweep filters to recent publications, this 2020 study entered through manual registration, which exists for exactly that gap. Entity matching: all 30 cells were matched to the existing A123 cell node, with the identity recorded as asserted from the publication (which names the part number) and corroborated, but not established, by the data itself (form factor, LFP voltage plateau, initial capacities); the files contain no model string, and the provenance annotation says so. Human validation: promotion required an explicit human command issued against a printed summary of everything that would enter the graph, including three flagged judgment calls (end-of-life definition consistency, a spuriously firing quality-control rule, one anomalous cell). Ingestion: 30 cell instances and 90 measurements were loaded with full provenance (+122 nodes, +210 relationships); a second run produced byte-identical counts, so idempotence is verified rather than assumed. No similarity edge was created and the neighbor bank is untouched: ingestion and adaptation are deliberately separate steps. Consistently with this, the transferred gate abstains on all 30 SNL cells, as it did on HUST: ingestion alone does not open the gate.
The changed outputs are the point of the exercise. The graph now holds two claim-versus-measured cycle-life discrepancies for the same cell against the same datasheet claim, with opposite signs: % under Severson’s by-design fast charging (median 736 cycles, ) and % under SNL’s 0.5C charging (median 3446 cycles among the six cells reaching end of life, ). Both carry conditions_comparable = false. Neither study alone could make this argument; together they show that a bare percentage gap against “>1000 cycles” is nearly meaningless without the comparability verdict attached, which is the reconciliation policy this system implements. The ingestion also added an independent capacity finding: all 30 SNL cells measure below the 1.1 Ah nameplate (2.2–6.5% short, median %). Here the comparability verdict is false for a reason worth stating: the datasheet’s capacity entry reads, in full, “Nominal capacity and voltage: 1.1Ah, 3.3 V”, with no measurement current, temperature, or cut-off stated. A capacity number published without conditions cannot be falsified, only contextualized; thirty cells from an independent laboratory all falling short is that context.
5. Discussion
The abstention result deserves a mechanistic reading, not just a statistical one. Behavior-view coverage works as a reliability signal because cells that degrade alike tend to fail alike: a test cell whose early-cycle fingerprint sits inside a dense cluster of training cells is being judged by a committee of relevant precedents, while a sparse neighborhood means the model is extrapolating whether it admits it or not. The condition view fails as a gate for the complementary reason: two cells can share a charge protocol yet land in different batches with very different lifetimes, so protocol proximity does not imply outcome proximity in this dataset. This also explains why the gate transfers across studies while the predictor does not. The HUST cells produce early signatures unlike anything in the Severson bank, so their coverage collapses and the gate refuses, before any label reveals that the learned prior no longer holds. Under the multi-stage discharge protocol, early-cycle variance in no longer indicates rapid degradation the way it does under aggressive fast charging, so the feature-to-lifetime mapping inverts; the gate does not know this physics, but it does not need to because unfamiliarity in feature space is detectable without labels.
The adaptation experiment adds the constructive half of this account: an absolute coverage threshold does not transfer across studies with different internal feature spread, but a percentile-referenced, study-stratified criterion does, and five labeled cells from the new study suffice to restore both gate retention and predictor competence. The Attia evaluation adds the corresponding caution: where features are commensurable and zero-shot acceptance does occur, it is not self-certifying—the coverage–lifetime check that passed in-study and failed there is the cheap diagnostic any new population should face once labels arrive.
The update-cycle demonstration (Section 4.7) closes the loop the architecture promises: a second measurement source, entering through the staged path, changed what the graph can assert—producing the opposite-sign discrepancy pair for the same claim that no single study could support. That the system’s most striking reconciliation finding arrived through its own ingestion mechanism is evidence that the mechanism is load-bearing rather than decorative.
For extraction, the practical lesson generalizes beyond batteries: an LLM extractor should be treated as a proposal generator inside a deterministic harness, not as a data source. Every failure mode we observed, non-reproducibility at temperature 0, silent unit conversion, neighbor-row misattribution, was caught or localized by checks that cost no LLM calls, and the expensive component runs once per document corpus while the cheap deterministic layer runs on every query. The residual error mode is instructive: value-in-source validation verifies that a number exists in the document but not that it belongs to the claim it was attached to, which is why table-row grounding, not a larger model, is the indicated fix. The row-level experiment on the held-out document confirms this diagnosis: it recovers every missed grid cell at value level, while the naming and restraint errors, which are not grounding problems, remain (Section 4.3).
The claims findings carry consequences beyond this system. If one in three cross-document comparisons conflicts for three of the most widely used commercial cells, then any downstream consumer of specification data, second-life traders, third-party warranty and insurance providers, pack designers, is currently pricing risk against documents that disagree with each other, sometimes within a single manufacturer. The EU Batteries Regulation presupposes exactly the machinery this paper prototypes: its “reference conditions” require that declared and measured quantities be compared under stated, matching conditions, and the condition fields of our schema (charge regime, temperature, depth of discharge, end-of-life threshold, with unspecified as an explicit value) can be read as a lightweight ontology of such reference conditions, one the IEC test standards presuppose but do not formalize machine-readably. Aligning the two is a natural extension.
Finally, the study clarifies what a reconciliation infrastructure at scale would require. The components demonstrated here, a provenance-first schema, validated extraction, comparability-aware discrepancy verdicts, and coverage-gated prediction, are necessary but not sufficient: scaling adds entity resolution across cell naming variants, document version tracking (our manufacturer-internal conflicts show that even “the datasheet” is not a single object), multi-chemistry measurement coverage, and a sustainable human-review budget for the ingestion gate. None of these is a research obstacle; all are engineering and governance commitments, which suggests the barrier to such infrastructure is institutional rather than technical.
6. Limitations and Future Work
The present evaluation is bounded in ways we state explicitly. (1) Claim-versus-measured reconciliation now draws on two measured studies for one cell model (Section 4.7) but remains confined to that model, and the independent-test capacity comparison is blocked by chart-only source data; both comparisons activate without code changes as soon as valued measurements enter the graph. (2) The abstention result, while significant, is derived from a single chemistry and a single commercial cell model, with the abstention headline established on one dataset and stress-tested on three further studies of the same cell; AURC confidence intervals are correspondingly wide. The schema, the two-view similarity construction, and the coverage metric are chemistry-agnostic by design; cross-chemistry evaluation awaits multi-chemistry degradation data. (3) The claims gold standard covers four cells and 103 claims (62 development, 41 held-out). A second annotator independently annotates all five documents, and agreement is reported in Section 3.2 ( on property naming, 98.1% claim-level coverage, one value disagreement), though the corpus remains small and the two annotation sets differ in granularity. The image-only marketing sheet is evaluated through an exploratory OCR run (Section 4.3) but remains outside the deployed text-based pipeline, and held-out extraction recall bounds what the document-level extractor recovers from unseen table-heavy documents. (4) Conditions extraction retains a systematic neighbor-row misattribution error that value-in-source validation cannot catch. Row-level table grounding, implemented and measured on the held-out document (Section 4.3), recovers the table-grid recall the document-level pass misses (0.342 to 0.634, zero hallucinations) at a measured precision cost (0.875 to 0.591); integrating it into the deployed pipeline, with a property-naming policy that does not depend on the gold standard, remains future work. (5) The Literature Monitor is implemented as a staged, human-gated discovery pipeline; auto-promotion is deliberately excluded, so the pace at which the graph incorporates new sources is bounded by human review throughput. In its first monitoring run it stages one triaged candidate and, by design, promotes none. Entity resolution, automated reconciliation, and recommendation remain future work.
7. Conclusions
We presented a provenance-preserving knowledge graph that holds manufacturer claims, cycling measurements, and independent tests for commercial lithium-ion cells, together with four results that stand on their own: (1) a coverage-gated abstention mechanism whose signal is statistically significant, robust to its hyperparameters, attributable to the behavior-space similarity view, and matched, but not beaten, by the model’s own uncertainty estimate, while graph features add no significant point-prediction accuracy over a strong early-cycle baseline (an honest negative result); (2) a validated LLM extraction pipeline that turns a non-deterministic extractor into a source-grounded one using only deterministic checks and consensus; (3) released condition-annotated gold standards (62 development and 41 held-out claims) whose cross-document reconciliation shows that roughly one in three cross-document specification comparisons conflicts or mismatches in conditions, including two contradictions internal to a single manufacturer’s own documents; and (4) a staged, human-gated literature-monitoring pipeline that discovers and triages candidate sources without ever promoting them autonomously. The system’s design principle—namely to verify LLM output deterministically, quantify comparability before comparing, and abstain when graph support is thin—is, we argue, what trustworthiness requires of data-driven battery assessment. These conclusions are established for the cell models, documents, and cycling studies evaluated here; the schema and the evaluation protocol are designed to travel, but their generality is a matter for evidence, not assertion, and the staged ingestion path is how that evidence accumulates.
Author Contributions
Conceptualization, A.L.; methodology, A.L.; software, A.L.; validation, A.L.; formal analysis, A.L.; investigation, A.L.; data curation, A.L.; visualization, A.L.; writing—original draft preparation, A.L.; writing—review and editing, L.H. and A.G.; supervision, L.H. and A.G. All authors have read and agreed to the published version of the manuscript.
Funding
The dissemination of this article is supported by the Technical University of Cluj-Napoca. A. Groza is supported by the “Romanian Hub for Artificial Intelligence-HRIA”, Smart Growth, Digitization and Financial Instruments Program, MySMIS no. 334906.
Institutional Review Board Statement
Not applicable.
Informed Consent Statement
Not applicable.
Data Availability Statement
The code, the annotated claim gold standards (62 development and 41 held-out claims), and all experiment artifacts are available at https://github.com/AlexLecu/BatteryKG (accessed on 20 July 2026). The Severson dataset [6], the HUST dataset [25], the Attia dataset [7], and the SNL dataset [8] (downloaded from BatteryArchive, https://www.batteryarchive.org (accessed on 15 July 2026) [1]) are publicly available from their original publications.
Acknowledgments
During the preparation of this study, the authors used Claude (Anthropic; Claude and Claude Code) to assist with software implementation and for copy-editing of the manuscript, including punctuation, sentence rephrasing, and grammatical revision. The authors have reviewed and edited all output and take full responsibility for the content of this publication.
Conflicts of Interest
Authors Alexandru Lecu and Lezan Hawizy are employed by the company Digital Science & Research Solutions Ltd. The remaining authors declare that the research was conducted in the absence of any commercial or financial relationships that could be construed as a potential conflict of interest.
Appendix A. Sensitivity of the Cycle-Life Target and Survival Analysis
Table A1 reports the full sensitivity analysis of the cycle-life target to its construction choices: the rolling-median smoothing window, the threshold-proximity tolerance, and the interpolation scheme. Under the paper configuration, 81 of 124 labels arise from the proximity rule rather than a strict threshold crossing, which explains why smoothing and interpolation choices have negligible effect: they act only on the 43 strictly crossing cells. Removing the proximity rule leaves 43 labeled cells and a lower RMSE (59.1 cycles), which reflects a different, shorter-lived subpopulation rather than a better model.
Table A1.
Sensitivity of the cycle-life target to the three definitional choices behind it (Section 3.3), over the 124 Severson cells. Each row re-labels the cells and re-runs the unchanged evaluation harness (leave-one-policy-group-out CV, identical features, seed, and similarity graph); only the labels differ. Lab. is the number of cells receiving an EOL label, Chg. the number whose label moves relative to the paper configuration, and the shift in cycles among those. The proximity rule is what makes the target well defined for most of this dataset: the Severson cells are cycled until they reach and then stopped, so the smoothed capacity curve of 81 of the 124 cells never dips strictly below the threshold. Removing the rule censors them, and the resulting metrics refer to a different, shorter-lived subpopulation rather than to a worse model. The graph model tracks the baseline throughout and is omitted for width.
Figure A1 shows the Kaplan–Meier survival estimate under the initial-capacity end-of-life definition (46 events, 78 right-censored cells). Survival plateaus at ≈0.61, so the population median is undefined within the study horizon; estimating it from event cells alone would yield 493 cycles, biased short by construction. Between-batch comparisons are confounded by the study’s stopping schedule: registering an event under this definition requires cycling past the batch’s own stopping point, so the log-rank statistic reflects the experimental design rather than differential degradation, and we do not interpret it as such.
Figure A1.
Kaplan–Meier survival under the initial-capacity end-of-life definition, with 95% Greenwood confidence band. Censoring marks indicate cells whose studies ended before the threshold was reached. The dotted horizontal line marks 0.5 survival probability, the level at which the population median would be defined.
References
- Dos Reis, G.; Strange, C.; Yadav, M.; Li, S. Lithium-ion battery data and where to find it. Energy AI 2021, 5, 100081. [Google Scholar] [CrossRef] [Scilit]
- Park, J.; Kim, K.; Geum, S.; Lee, J.; Son, H.; Han, S. Battery health reporting fails independent validation across manufacturers. arXiv 2026, arXiv:2603.21592. [Google Scholar] [CrossRef] [Scilit]
- IEC 61960-3:2017; Secondary Cells and Batteries Containing Alkaline or Other Non-Acid Electrolytes–Secondary Lithium Cells and Batteries for Portable Applications. International Electrotechnical Commission: Geneva, Switzerland, 2017.
- IEC 62660-1:2018; Secondary Lithium-Ion Cells for the Propulsion of Electric Road Vehicles–Part 1: Performance Testing. International Electrotechnical Commission: Geneva, Switzerland, 2018.
- EU 2023/1542; Regulation Concerning Batteries and Waste Batteries, Article 10 and Annex IV. European Parliament and Council of the European Union: Brussels, Belgium, 2023; p. 191.
- Severson, K.A.; Attia, P.M.; Jin, N.; Perkins, N.; Jiang, B.; Yang, Z.; Chen, M.H.; Aykol, M.; Herring, P.K.; Fraggedakis, D.; et al. Data-driven prediction of battery cycle life before capacity degradation. Nat. Energy 2019, 4, 383–391. [Google Scholar] [CrossRef] [Scilit]
- Attia, P.M.; Grover, A.; Jin, N.; Severson, K.A.; Markov, T.M.; Liao, Y.H.; Chen, M.H.; Cheong, B.; Perkins, N.; Yang, Z.; et al. Closed-loop optimization of fast-charging protocols for batteries with machine learning. Nature 2020, 578, 397–402. [Google Scholar] [CrossRef] [Scilit] [PubMed]
- Preger, Y.; Barkholtz, H.M.; Fresquez, A.; Campbell, D.L.; Juba, B.W.; Román-Kustas, J.; Ferreira, S.R.; Chalamala, B. Degradation of commercial lithium-ion cells as a function of chemistry and cycling conditions. J. Electrochem. Soc. 2020, 167, 120532. [Google Scholar] [CrossRef] [Scilit]
- Hu, X.; Xu, L.; Lin, X.; Pecht, M. Battery lifetime prognostics. Joule 2020, 4, 310–346. [Google Scholar] [CrossRef] [Scilit]
- Yang, K.; Wang, S.; Zhou, L.; Fernandez, C.; Blaabjerg, F. A critical review of AI-based battery remaining useful life prediction for energy storage systems. Batteries 2025, 11, 376. [Google Scholar] [CrossRef] [Scilit]
- Ly, S.; Yang, R.; Dixit, N.; Nguyen, H.D. RUL-QMoE: Multiple non-crossing quantile mixture-of-experts for probabilistic remaining useful life predictions of varying battery materials. arXiv 2025, arXiv:2512.23725. [Google Scholar] [CrossRef] [Scilit]
- Wu, R.; Tian, J.; Yao, J.; Han, T.; Hu, C. Confidence-aware quantile Transformer for reliable degradation prediction of battery energy storage systems. Reliab. Eng. Syst. Saf. 2025, 260, 111019. [Google Scholar] [CrossRef] [Scilit]
- Zhang, S.; Li, Y.; Tian, J.; Man, Z.; Chung, C.Y.; Shen, W. Improving Battery Life Prediction With Unlabeled Data: Confidence-Weighted Semi-Supervised Learning With Label Propagation. IEEE Trans. Transp. Electrif. 2025, 11, 5938–5949. [Google Scholar] [CrossRef] [Scilit]
- Zuo, W.; Zheng, H.; He, T.; Vishwanath, V.; Chan, M.K.Y.; Stevens, R.L.; Amine, K.; Xu, G.L. Large language models for batteries. Joule 2025, 9, 102037. [Google Scholar] [CrossRef] [Scilit]
- Feng, Y.; Hu, G.; Zhang, Z. GPT4Battery: An LLM-driven framework for adaptive state of health estimation of raw Li-ion batteries. arXiv 2024, arXiv:2402.00068. [Google Scholar] [CrossRef] [Scilit]
- Zhang, Z.; Sun, Y.; Zhang, L.; Cheng, H.; Cao, R.; Liu, X.; Yang, S. Enabling online search and fault inference for batteries based on knowledge graph. Batteries 2023, 9, 124. [Google Scholar] [CrossRef] [Scilit]
- Patel, D.; Lin, S.; Rayfield, J.; Zhou, N.; Shyalika, C.; Yarrabothula, S.R.; Vaculin, R.; Martinez, N.; O’Donncha, F.; Kalagnanam, J. AssetOpsBench: Benchmarking AI agents for task automation in industrial asset operations and maintenance. arXiv 2025, arXiv:2506.03828. [Google Scholar] [CrossRef] [Scilit]
- Edge, D.; Trinh, H.; Cheng, N.; Bradley, J.; Chao, A.; Mody, A.; Truitt, S.; Larson, J. From local to global: A graph RAG approach to query-focused summarization. arXiv 2024, arXiv:2404.16130. [Google Scholar] [CrossRef] [Scilit]
- El-Yaniv, R.; Wiener, Y. On the foundations of noise-free selective classification. J. Mach. Learn. Res. 2010, 11, 1605–1641. [Google Scholar]
- Geifman, Y.; El-Yaniv, R. Selective classification for deep neural networks. In Proceedings of the Advances in Neural Information Processing Systems 30, Long Beach, CA, USA, 4–9 December 2017. [Google Scholar]
- Angelopoulos, A.N.; Bates, S. Conformal prediction: A gentle introduction. Found. Trends Mach. Learn. 2023, 16, 494–591. [Google Scholar] [CrossRef] [Scilit]
- Lecu, A.; Hawizy, L.; Birosca, S.; Groza, A. AlloyGraph: A knowledge-graph-grounded multi-agent system for nickel-based superalloy design. Soc. Sci. Res. Netw. 2026. [Google Scholar] [CrossRef] [Scilit]
- Neo4j, Inc. Neo4j Graph Database, Community Edition 5. 2025. Available online: https://neo4j.com (accessed on 20 July 2026).
- Zhang, H.; Gui, X.; Zheng, S.; Lu, Z.; Li, Y.; Bian, J. BatteryML: An open-source platform for machine learning on battery degradation. In Proceedings of the International Conference on Learning Representations (ICLR), Vienna, Austria, 4–8 May 2024. [Google Scholar]
- Ma, G.; Xu, S.; Jiang, B.; Cheng, C.; Yang, X.; Shen, Y.; Yang, T.; Huang, Y.; Ding, H.; Yuan, Y. Real-time personalized health status prediction of lithium-ion batteries using deep transfer learning. Energy Environ. Sci. 2022, 15, 4083–4094. [Google Scholar] [CrossRef] [Scilit]
- Jensen, H.K. lygte-info.dk: Battery and Charger Test Reviews. 2026. Available online: https://lygte-info.dk (accessed on 10 July 2026).
- Meta, A.I. Llama 3.3 Model Card. 2024. Available online: https://github.com/meta-llama/llama-models (accessed on 20 July 2026).

Disclaimer/Publisher’s Note: The statements, opinions and data contained in all publications are solely those of the individual author(s) and contributor(s) and not of MDPI and/or the editor(s). MDPI and/or the editor(s) disclaim responsibility for any injury to people or property resulting from any ideas, methods, instructions or products referred to in the content. |
© 2026 by the authors. Licensee MDPI, Basel, Switzerland. This article is an open access article distributed under the terms and conditions of the Creative Commons Attribution (CC BY) license.