


Abstract
The inferior electronic conductivity, sluggish bulk Li+ transport, and Jahn–Teller distortion intrinsic to Mn3+ collectively impede the practical application of LiMn0.6Fe0.4PO4 (LMFP) as a high-performance cathode for lithium-ion batteries. Herein, a series of W-doped Li(Mn0.6Fe0.4)1−xWxPO4/C (x = 0, 0.005, 0.010, 0.015) cathode materials were synthesized via spray-drying combined with carbothermal reduction. Rietveld refinement indicated decreases in the fitted lattice parameters and unit-cell volume with increasing nominal W content, and no crystalline secondary phases were detected within the laboratory XRD detection limit. Although the structural evolution is consistent with W incorporation, direct determination of the occupation site requires further local structural characterization. X-ray photoelectron spectroscopy indicated that the detectable near-surface W species are predominantly present as W6+, and the semi-quantitative Mn 2p peak-area fitting showed that the fitted relative Mn3+ contribution decreased from 70.4% in LMFP-0 to 58.3% in LMFP-2. The optimal composition (LMFP-2, x = 0.010) delivers an initial discharge capacity of 160.2 mAh g−1 at 0.1 C, retains 98.1% capacity after 100 cycles at 1 C, and achieves 126.3 mAh g−1 at 5 C. Electrochemical impedance spectroscopy reveals that LMFP-2 possesses the lowest charge-transfer resistance (195.4 Ω) and the highest Li+ diffusion coefficient (5.3 × 10⁻¹⁵ cm2 s−1). These improvements may be attributed to the synergistic effects of enhanced bulk electronic conductivity, accelerated Li+ diffusion kinetics, and improved structural stability induced by moderate W incorporation. This work establishes W doping as a viable compositional engineering strategy for olivine-based cathode materials.
1. Introduction
The rapid expansion of electric vehicles and grid-scale energy storage systems has intensified global demand for lithium-ion batteries that simultaneously deliver high energy density, long cycle life, and competitive cost. Lithium-ion batteries (LIBs) remain the dominant technology for portable electronics, electric vehicles, and grid-scale storage owing to their high energy density and reliable cycle life [1,2,3]. The cathode material is the primary determinant of both energy density and cost in a LIB system [4,5,6].
Olivine-structured LiFePO4 (LFP) has achieved broad commercialization by virtue of its excellent thermal stability and long service life; however, its intrinsically low redox potential (~3.4 V vs. Li/Li+) limits the theoretical gravimetric energy density to 578 Wh kg−1, which is increasingly inadequate for next-generation applications [7,8]. LiMnxFe1−xPO4 (LMFP) has emerged as a compelling upgrade to LFP: by incorporating Mn2+ into the olivine framework, the working voltage is elevated to ~4.1 V vs. Li/Li+, raising the theoretical energy density to approximately 650 Wh kg−1, an improvement of ~12% relative to LFP, while retaining the intrinsic thermal robustness and low raw-material cost of the parent structure [9,10,11]. Despite these merits, practical deployment of LMFP is impeded by three concurrent limitations: (i) Jahn–Teller (JT) distortion of MnO6 octahedra induced by Mn3+, coupled with Mn dissolution into the electrolyte accelerates capacity fade; (ii) the intrinsically low electronic conductivity (<10−10 S cm−1) restricts charge transport; and (iii) sluggish Li+ diffusion kinetics leads to pronounced polarization at elevated current densities [12,13].
Cation doping has been widely adopted to address these issues simultaneously. At the transition-metal site, Ti4+ substitution in Li(Fe0.6Mn0.4)1−xTixPO4/C improved electronic transport and suppressed Mn3+-associated JT distortion through strong Ti–O bonding, delivering 163.53 mAh g−1 at 0.1 C with 93.58% retention after 500 cycles at 1 C [14]. Nb5+ doping at the Fe/Mn site of LiMn0.6Fe0.4PO4 similarly enhanced electronic conductivity through electronic structure modulation, achieving 156.7 mAh g−1 at 0.2 C and 95.6% retention over 100 cycles at 1 C [15]. At the Li site, Na+ substitution in Li1−xNaxMn0.6Fe0.4PO4/C elongated Li–O bonds and lowered the Li+ migration barrier from 0.348 to 0.266 eV, and the pillar effect of immobile Na+ stabilized the framework against JT-related degradation, yielding 125.0 mAh g−1 at 5 C and 96.7% retention after 100 cycles at 1 C [16]. Mg2+ doping at the Fe site broadened Li+ transport channels and reduced charge-transfer resistance, resulting in 159.6 mAh g−1 at 0.2 C and 124.5 mAh g−1 at 10 C [17]. Ni2+ doping at the transition-metal site of LiMn0.6Fe0.4PO4/C similarly improved structural stability and rate capability, with the optimal composition retaining 98.3% of its capacity after 100 cycles at 1 C and delivering 125.1 and 115.4 mAh g−1 at 10 C and 15 C, respectively [18]. In a related Mn-rich composition, Ni2+ doping of LiMn0.8Fe0.2PO4@C markedly improved electronic conductivity and Li+ diffusion kinetics relative to the pristine material [19]. Combined Mg/Ni dual-doping has also been employed to simultaneously alleviate Jahn–Teller distortion and enhance electronic conductivity, increasing the reversible capacity at 5 C by approximately 2.4-fold relative to the pristine sample and maintaining 92% of the initial capacity after 2000 cycles at 1 C in a pouch-type full cell [20].
Although Ti4+, Nb5+, Na+, Ni2+ and Mg/Ni dual-doping strategies have demonstrated effectiveness in improving specific aspects of LMFP performance, most reported approaches primarily target either structural stabilization, electronic conductivity enhancement, or Li+ transport regulation [21,22]. Achieving simultaneous optimization of electronic transport, Li+ diffusion kinetics, Mn valence-state regulation, and structural stability remains challenging.
Notwithstanding these advances, tungsten (W) doping modification for LMFP has rarely been systematically investigated. Owing to its high valence state (predominantly W6+) and strong metal–oxygen bonding characteristics, W incorporation is expected to modulate the electronic conductivity, surface Mn valence-state distribution, and structural stability of LMFP materials. Therefore, a systematic investigation of W-doped LMFP is of considerable interest for understanding the structure–property relationship and optimizing electrochemical performance.
Motivated by these considerations, the present work systematically prepares W-doped Li(Mn0.6Fe0.4)1−xWxPO4/C cathodes via spray-drying combined with carbothermal reduction. The effects of W content on crystal structure, particle morphology, and electrochemical performance are evaluated through XRD, FE-SEM, EDS, XPS, galvanostatic cycling, dQ/dV and EIS, with the aim of elucidating the possible mechanistic contributions of W doping and providing experimental guidance for the compositional optimization of LMFP-based cathode materials.
2. Materials and Methods
2.1. Synthesis of Li(Mn0.6Fe0.4)1−xWxPO4/C
A series of Li(Mn0.6Fe0.4)1−xWxPO4/C (x = 0, 0.005, 0.010, 0.015) cathode materials were prepared via a spray-drying combined with carbothermal reduction approach. Stoichiometric quantities of Mn3O4 (99.5%, Huicheng, Guiyang, China), FePO4 (99.5%, Yunxiang Juneng, Wuxue, China), Li2CO3 (99.5%, Tianqi, Chengdu, China), phosphoric acid (H3PO4, AR grade, Tianjin Fuyu Fine Chemical Co., Ltd., Tianjin, China) as a supplementary phosphorus source, glucose (99%, Sinopharm Chemical Reagent Co., Ltd., Shanghai, China, AR grade), poly(ethylene glycol) (PEG, 99%, Sinopharm, AR grade), and WO3 (99.5%, Runguangheng, Tianjin, China, AR grade) were dispersed in deionized water and stirred at 600 rpm for 30 min until no visible agglomerated particles were observed, yielding a homogeneous suspension. Since FePO4 supplies both the Fe and a stoichiometric portion of the P required for the target composition, phosphoric acid was additionally introduced to provide the remaining P needed to balance the Mn0.6Fe0.4 transition-metal content against the overall 1:1 P:(Mn + Fe) stoichiometry of the olivine structure. The resulting suspension was subsequently transferred to a sand mill (XL-B1L, Xili, Changsha, China) and processed at 2500 rpm for 60 min to ensure thorough mixing and uniform particle size reduction. The stable slurry obtained was then pumped into a spray dryer (OM-1500A, Oumon, Shanghai, China) and atomized under an air pressure of 0.2 MPa, with the inlet and outlet air temperatures set at 210 °C and 100 °C, respectively. The collected precursor powders were subsequently subjected to carbothermal reduction-assisted sintering at 700 °C for 10 h in a tube furnace (OTF-1200X-S-R-II, Kejing, Shenzhen, China) under a flowing nitrogen atmosphere, where glucose simultaneously served as the carbon source and reducing agent. The resulting Li(Mn0.6Fe0.4)1−xWxPO4/C products with x = 0, 0.005, 0.010, and 0.015 were designated as LMFP-0, LMFP-1, LMFP-2, and LMFP-3, respectively.
2.2. Materials Characterization
Elemental quantification of Li, Mn, Fe, P, and W was performed by inductively coupled plasma optical emission spectrometry (ICP-OES, PROFILE SPEC, Leeman, Hudson, NH, USA). The crystalline structure and phase composition of all samples were characterized by X-ray powder diffraction (XRD, Smartlab, Rigaku, Tokyo, Japan) over a 2θ scanning range of 10–80°. Rietveld refinement was performed over the full 2θ range of 10–80° using GSAS-II. The microstructural morphology and elemental distribution of the samples were examined using a field-emission scanning electron microscope (FE-SEM, Gemini 360, Zeiss, Oberkochen, Germany) equipped with an energy-dispersive X-ray spectroscopy (EDS) system. The surface-detectable elements and near-surface chemical states of the samples were examined by X-ray photoelectron spectroscopy (XPS, K-Alpha, Thermo Fisher Scientific, East Grinstead, UK). The bulk resistivity of the samples was measured at room temperature using a four-probe resistivity tester (PRCD3100, Shenzhen YuanNeng Technology Co., Ltd., Shenzhen, China). The corresponding electronic conductivity (σ) was calculated using σ = 1/ρ, where ρ is the measured bulk resistivity.
2.3. Electrochemical Measurements
The electrochemical performance of all samples was evaluated using CR2032 coin-type half-cells (Canrd Technology Co., Ltd., Dongguan, China). Cathode electrodes were fabricated by blending the active material, conductive carbon black (Super P), and poly(vinylidene fluoride) (PVDF) binder in a mass ratio of 90:5:5, followed by the addition of an appropriate volume of N-methyl-2-pyrrolidone (NMP) as solvent. The mixture was stirred at high speed for 20 min to form a homogeneous slurry, which was then evenly coated on aluminum foil current collectors. After drying, the coated foils were calendered at 20 MPa to adjust electrode thickness to 35–45 μm. Identical slurry preparation, coating and calendering procedures were adopted for all four samples (LMFP-0 to LMFP-3), with the only difference being the W-doping content of active materials. The calendered foils were punched into circular electrode discs (diameter = 14 mm, effective area A = 1.54 cm2) with an active material areal loading of ~2.5 mg cm−2. Electrode porosity was not measured in this study. Although identical slurry preparation, coating, and calendering procedures were applied to all electrodes, possible differences in porosity arising from variations in particle morphology cannot be completely excluded. This limitation should be considered when interpreting the comparative electrochemical results.
CR2032-type coin cells were assembled in an argon-filled glovebox using the as-prepared cathode disc, a lithium metal foil counter electrode, a Celgard polypropylene separator, and a commercial LiPF6-based electrolyte. All electrochemical measurements were conducted at 25 °C within a voltage window of 2.0–4.5 V vs. Li/Li+. Based on the areal mass loading, the corresponding areal capacity of the LMFP-2 electrode at 1 C was ~0.37 mAh cm−2.
Galvanostatic charge–discharge cycling tests were conducted on a battery testing system (MIHW-200-160CH, Neware, Shenzhen, China). Cyclic voltammetry (CV) and electrochemical impedance spectroscopy (EIS) measurements were performed on an electrochemical workstation (PMC-2000, Princeton Applied Research, Oak Ridge, TN, USA). CV curves were recorded at a scan rate of 0.1 mV s−1 within the same voltage range, and EIS spectra were acquired over a frequency range of 0.01 Hz to 100 kHz with an alternating-current perturbation amplitude of 5 mV.
3. Results and Discussion
3.1. Structural Characterization
The elemental mass fractions of all synthesized samples were precisely quantified by ICP-OES, and the results are summarized in Table 1. For the undoped LMFP-0 sample, the measured molar ratio of Li:Mn:Fe:P was determined to be 1.001:0.600:0.400:1.000. For LMFP-1, the molar ratio of Li:Mn:Fe:P:W was 1.001:0.597:0.398:1.000:0.005. The corresponding values for LMFP-2 and LMFP-3 were 1.000:0.594:0.396:1.000:0.0104 and 1.000:0.591:0.394:1.000:0.0156, respectively. The experimentally determined molar ratios are in close agreement with the nominal stoichiometric compositions, confirming the successful synthesis of Li(Mn0.6Fe0.4)1−xWxPO4/C materials across the entire doping range investigated. Furthermore, the W contents determined by ICP-OES increase monotonically from 0.58 wt% (LMFP-1) to 1.16 wt% (LMFP-2) and 1.73 wt% (LMFP-3), which is consistent with the nominal compositions. These ICP-OES results quantitatively confirm the intended increase in the bulk W content across the series. XPS provides complementary information on the chemical state of the detectable near-surface W species, whereas EDS mapping reveals the spatial distribution of W. However, neither XPS nor EDS independently determines the crystallographic occupation site of W.
Table 1.
ICP-OES elemental compositions of pristine and W-doped Li(Mn0.6Fe0.4)1−xWxPO4/C samples.
The carbon contents of LMFP-0, LMFP-1, LMFP-2, and LMFP-3 were measured by a high-frequency infrared carbon-sulfur analyzer (HCS-140, Dekai, Shanghai, China) as 1.38, 1.31, 1.29, and 1.30 wt%, respectively. The similar carbon contents across all compositions reduce carbon-content variation as a potential confounding factor when comparing the electrochemical performance of the samples.
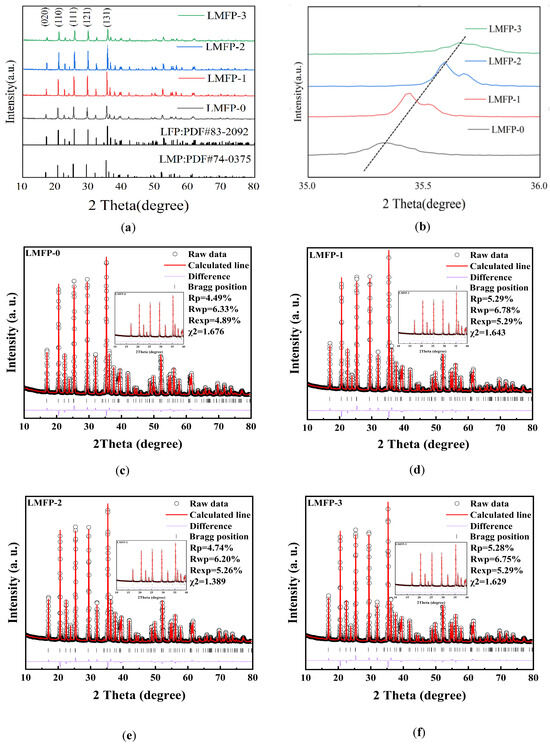
The XRD patterns of Li(Mn0.6Fe0.4)1−xWxPO4/C samples are presented in Figure 1a. All diffraction peaks can be indexed to an olivine phase without detectable impurity reflections within the XRD detection limit. The peak positions fall between the standard reference patterns of LiMnPO4 (JCPDS #74-0375) and LiFePO4 (JCPDS #83-2092), confirming the formation of a LiMn0.6Fe0.4PO4-based solid solution. Relative to the undoped LMFP-0, the W-doped LMFP-2 sample exhibits enhanced diffraction peak intensity and improved peak sharpness (Figure 1a), indicative of higher crystallinity and greater structural order. To more rigorously examine whether any secondary-phase reflections emerge upon W incorporation, views of the refined patterns over the 10–80° range are provided in Figure 1c–f (magnified views of the refined patterns over the 10–40° range are provided as insets in Figure 1c–f); no additional diffraction peaks attributable to WO3, Li3PO4, or other crystalline impurity phases can be discerned for any of the W-doped compositions (LMFP-1 to LMFP-3) within this range. To further corroborate this observation, independent Rietveld whole-pattern refinements were performed for each composition using a single-phase olivine structural model (Figure 1c–f); the close agreement between the raw data and the calculated pattern is reflected in the low Rwp/Rexp/χ2 values (Rwp = 6.20–6.78%, χ2 = 1.389–1.676).
Figure 1.
(a) XRD patterns of LMFP-0, LMFP-1, LMFP-2, and LMFP-3 over the full 2θ range of 10–80°, together with the reference patterns of the LiFePO4 and LiMnPO4 end members; (b) corresponding magnified XRD patterns over the 35–36° range, where the dashed line indicates the shift trend of the diffraction peak position with increasing W content; and (c–f) Rietveld refinement profiles of LMFP-0, LMFP-1, LMFP-2, and LMFP-3, respectively, over the full 10–80° range. The insets in panels (c–f) show the corresponding refinement profiles over the magnified 10–40° range. Open circles, red lines, purple lines, and vertical tick marks represent the observed data, calculated profiles, difference curves, and Bragg positions, respectively.
A monotonic decrease in the lattice parameters (a, b, c) and unit cell volume (V) is observed across the series (Table 2), with all W-doped compositions exhibiting smaller unit-cell dimensions than the pristine LMFP-0. Given that the ionic radius of W6+ (0.60 Å) is appreciably smaller than those of Fe2+ (0.78 Å) and Mn2+ (0.83 Å) [23], the observed lattice contraction is consistent with W incorporation into the crystal lattice; however, the precise occupation site cannot be unambiguously determined from XRD analysis alone. Conversely, when the W6+ content exceeds the optimal level, the pronounced ionic size mismatch disrupts the structural equilibrium, inducing lattice distortion that compromises crystalline integrity [24], which accounts for the reduced crystallinity observed in LMFP-3 relative to LMFP-2. The absence of detectable impurity peaks indicates that no crystalline secondary phases were observed within the detection limit of XRD, suggesting that W is incorporated into the olivine framework without forming detectable crystalline secondary phases.
Table 2.
Lattice parameters obtained from whole-pattern refinement of pristine and W-doped samples.
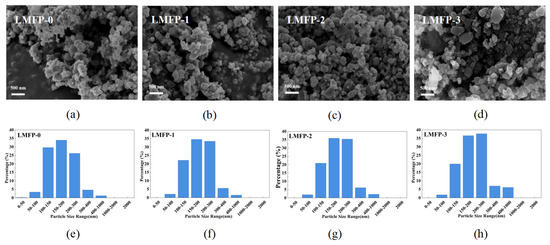
The influence of W doping on the particle morphology and size characteristics of Li(Mn0.6Fe0.4)1−xWxPO4/C was investigated by field-emission scanning electron microscopy (FE-SEM), and the representative images are displayed in Figure 2a–d. All samples consist of primary particles with diameters predominantly in the range of 100–300 nm. The undoped LMFP-0 (Figure 2a) exhibits a broad primary particle size distribution with poor sphericity and pronounced interparticle agglomeration, which is expected to impede electrolyte infiltration and hinder ionic transport pathways, thereby adversely affecting the electrochemical utilization of the active material. With increasing W substitution, the primary particle size increases moderately, the size distribution becomes progressively more uniform, and the degree of agglomeration is moderately reduced. Among all compositions, LMFP-2 demonstrates the most homogeneous particle size distribution, the lowest extent of agglomeration, and the most well-defined particle morphology. However, further increasing the dopant concentration to x = 0.015 (LMFP-3, Figure 2d) results in an increase in particle size heterogeneity and morphological irregularity, consistent with the reduced crystallinity evidenced by XRD analysis, which may be associated with the higher nominal W content and increased local structural disorder, consistent with the reduced diffraction-peak sharpness observed for LMFP-3.
Figure 2.
FE-SEM images and corresponding particle size distribution histograms of pristine and W-doped Li(Mn0.6Fe0.4)1−xWxPO4/C samples: (a–d) FE-SEM images of LMFP-0, LMFP-1, LMFP-2, and LMFP-3, respectively; (e–h) particle size distribution histograms of LMFP-0, LMFP-1, LMFP-2, and LMFP-3, respectively.
Quantitative particle size analysis was performed based on statistical measurement of approximately 500 individual particles randomly selected from multiple FE-SEM images for each composition, using ImageJ2 software to determine the equivalent circular diameter of each particle. The results reveal that the mean particle diameters of LMFP-0, LMFP-1, LMFP-2, and LMFP-3 are 188.3, 198.0, 198.2, and 201.0 nm, respectively, exhibiting a marginal but monotonic increase with W content. Notably, the fraction of particles falling within the optimal size range of 200–300 nm reaches 35.38% for LMFP-2, markedly exceeding the corresponding value of 26.20% for the undoped LMFP-0. This finding demonstrates that an appropriate W6+ doping level effectively regulates particle growth kinetics, yielding a more rounded and regular particle morphology with a narrower size distribution, both of which are conducive to enhanced electrode–electrolyte contact and improved Li+ transport efficiency.
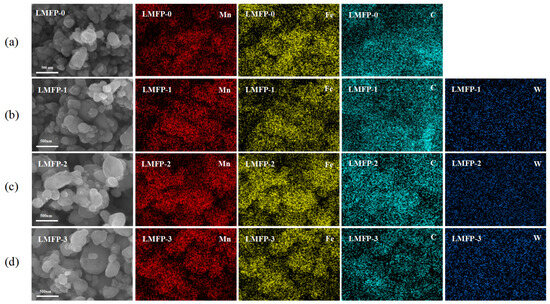
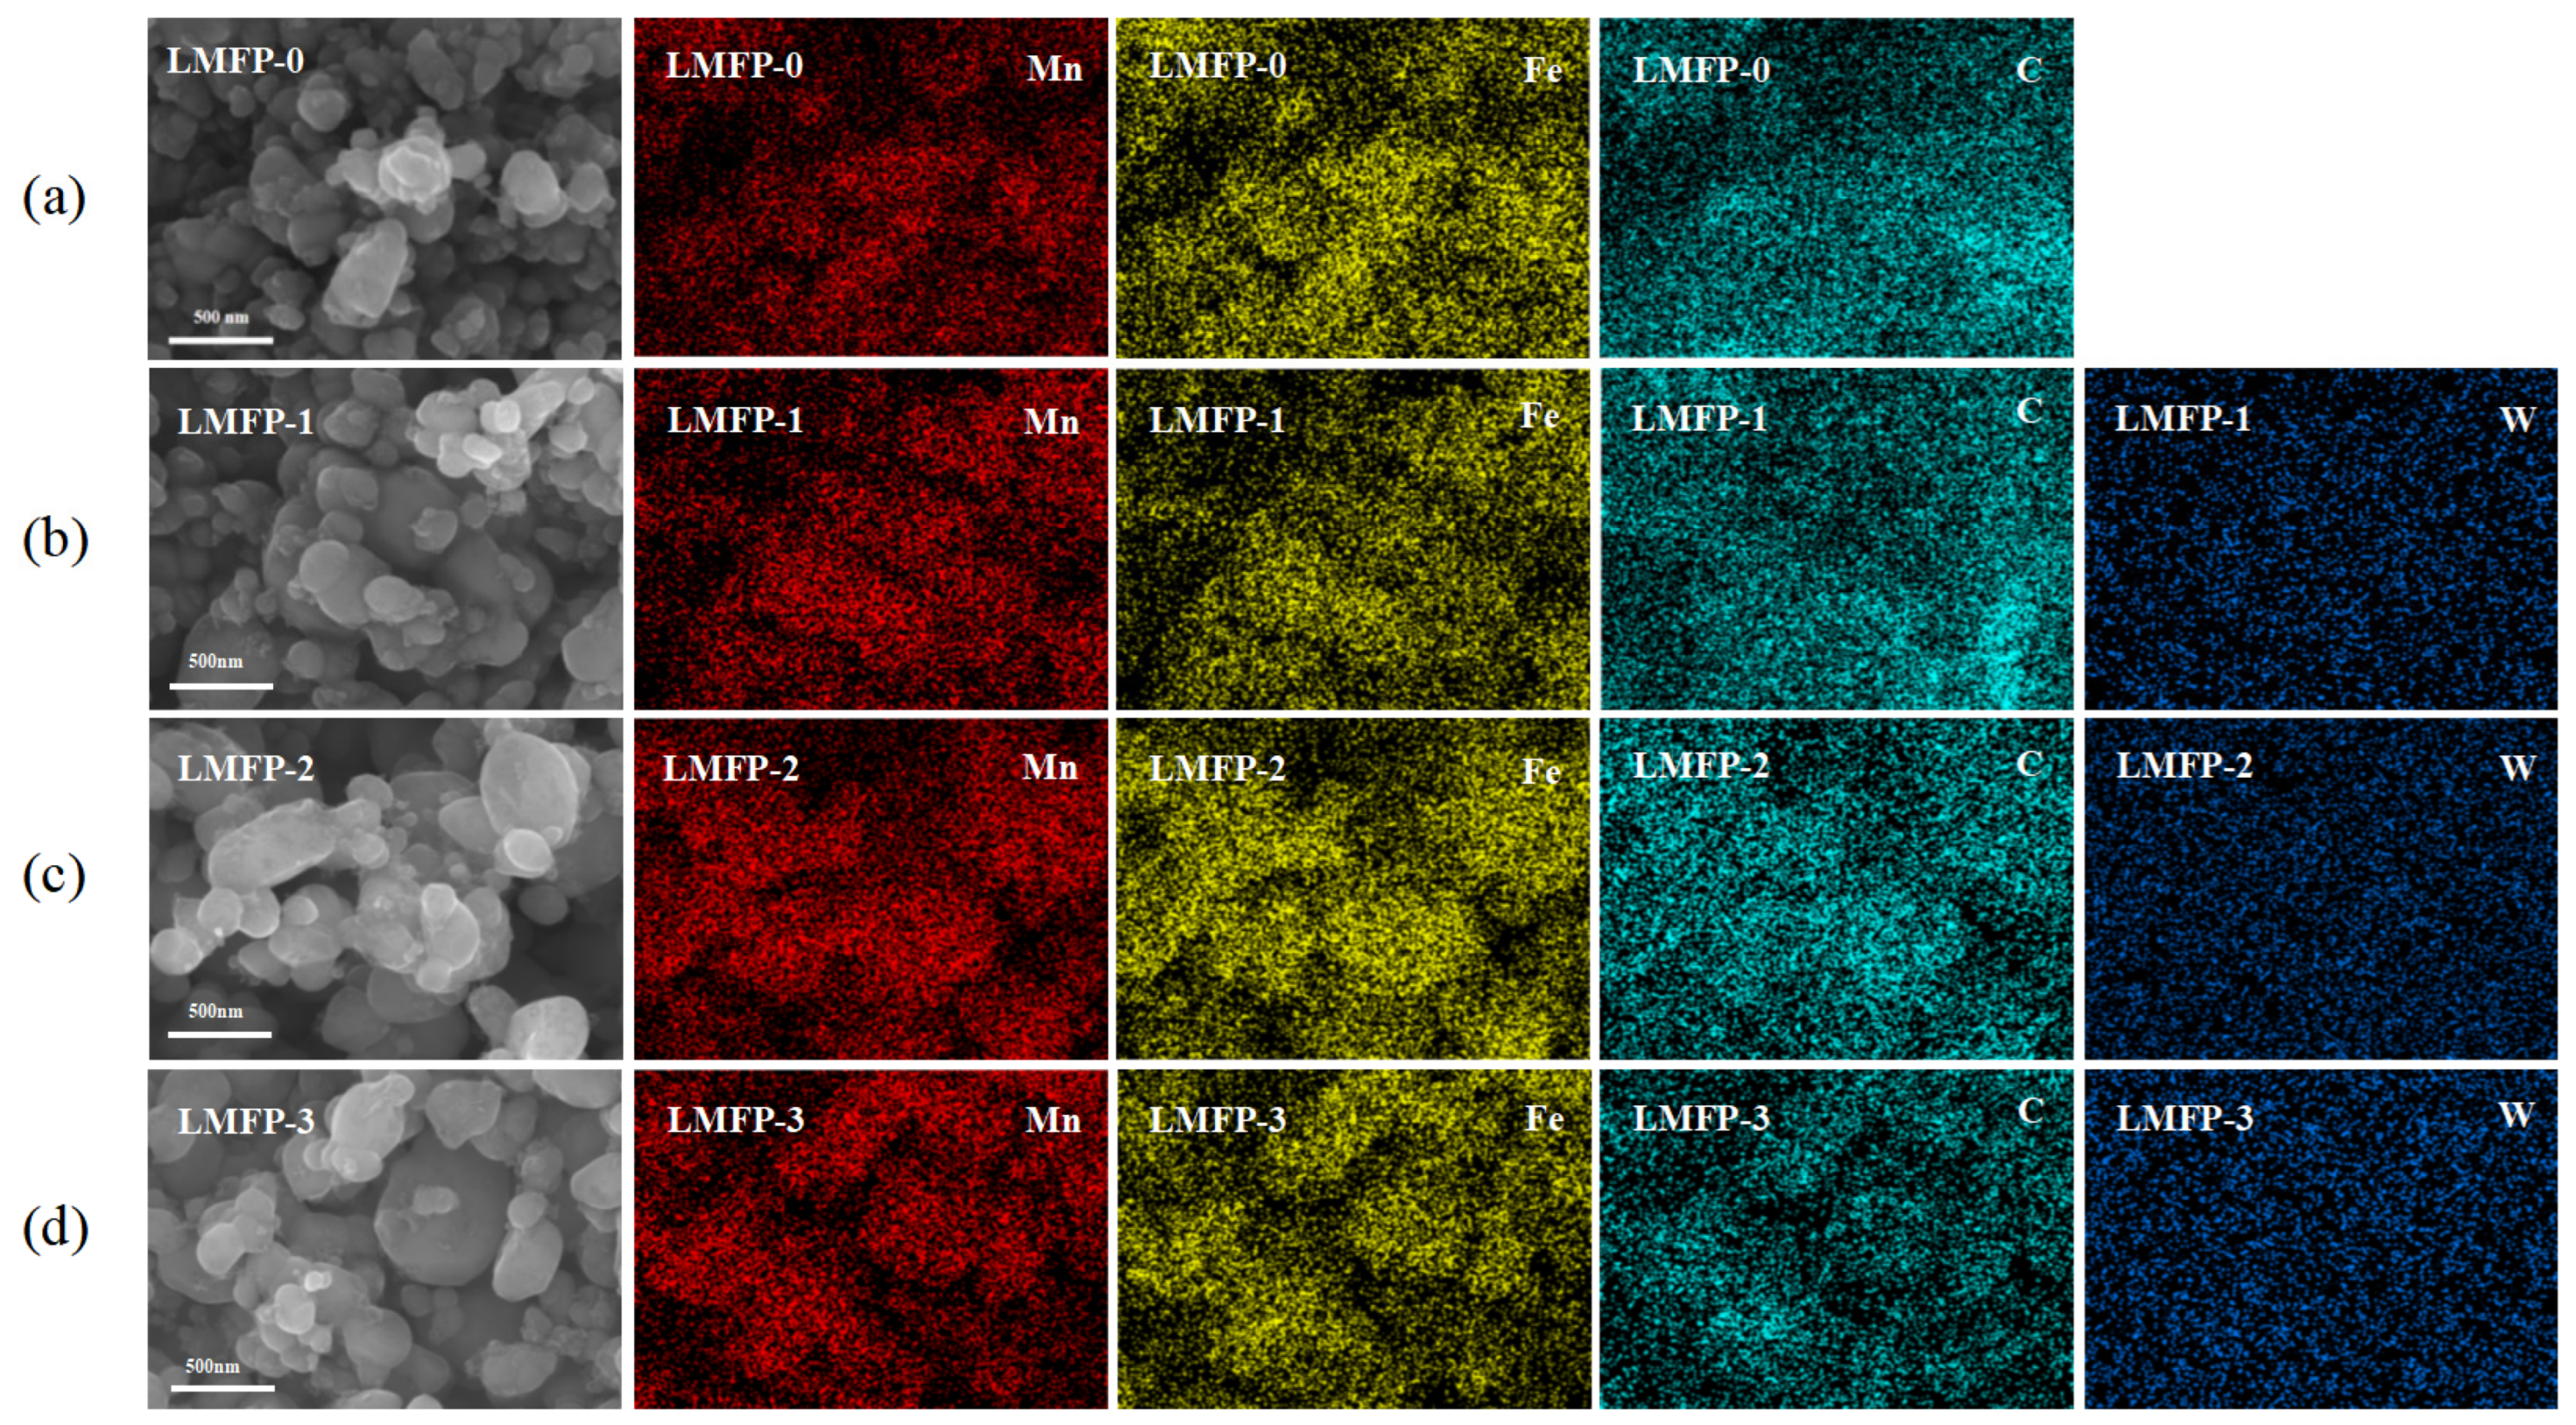
Energy-dispersive X-ray spectroscopy (EDS) elemental mapping images of Li(Mn0.6Fe0.4)1−xWxPO4/C (x = 0, 0.005, 0.010, and 0.015) are also presented in Figure 3. For the undoped LMFP-0 sample (Figure 3a), the first panel shows the SEM image corresponding to the EDS-mapping region in place of a W elemental map because this sample contains no tungsten. The Mn, Fe, and C signals are broadly distributed across the mapped regions for all four samples. In the W-containing samples (LMFP-1, LMFP-2, and LMFP-3), weak but spatially dispersed W signals are observed without obvious micron-scale W-rich agglomerates. These results support the dispersion of W at the SEM-EDS length scale but do not establish its crystallographic site occupancy or exclude the possible presence of nanoscale or amorphous W-rich species.
Figure 3.
SEM images and corresponding EDS elemental maps of LMFP-0, LMFP-1, LMFP-2, and LMFP-3. (a) LMFP-0: SEM image and corresponding elemental maps of Mn, Fe, and C; (b) LMFP-1: SEM image and corresponding elemental maps of Mn, Fe, C, and W; (c) LMFP-2: SEM image and corresponding elemental maps of Mn, Fe, C, and W; (d) LMFP-3: SEM image and corresponding elemental maps of Mn, Fe, C, and W. The SEM image in each panel was acquired from the region used for the corresponding elemental mapping, enabling direct correlation between particle morphology and elemental distribution. The SEM images shown in Figure 3 were acquired from regions different from those shown in Figure 2.
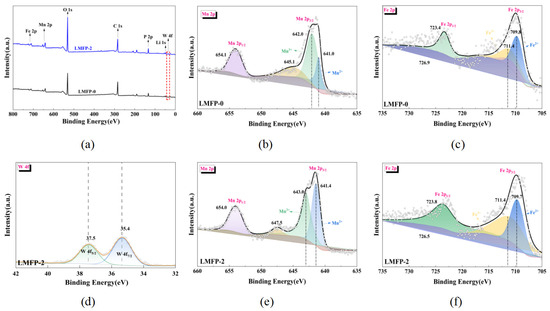
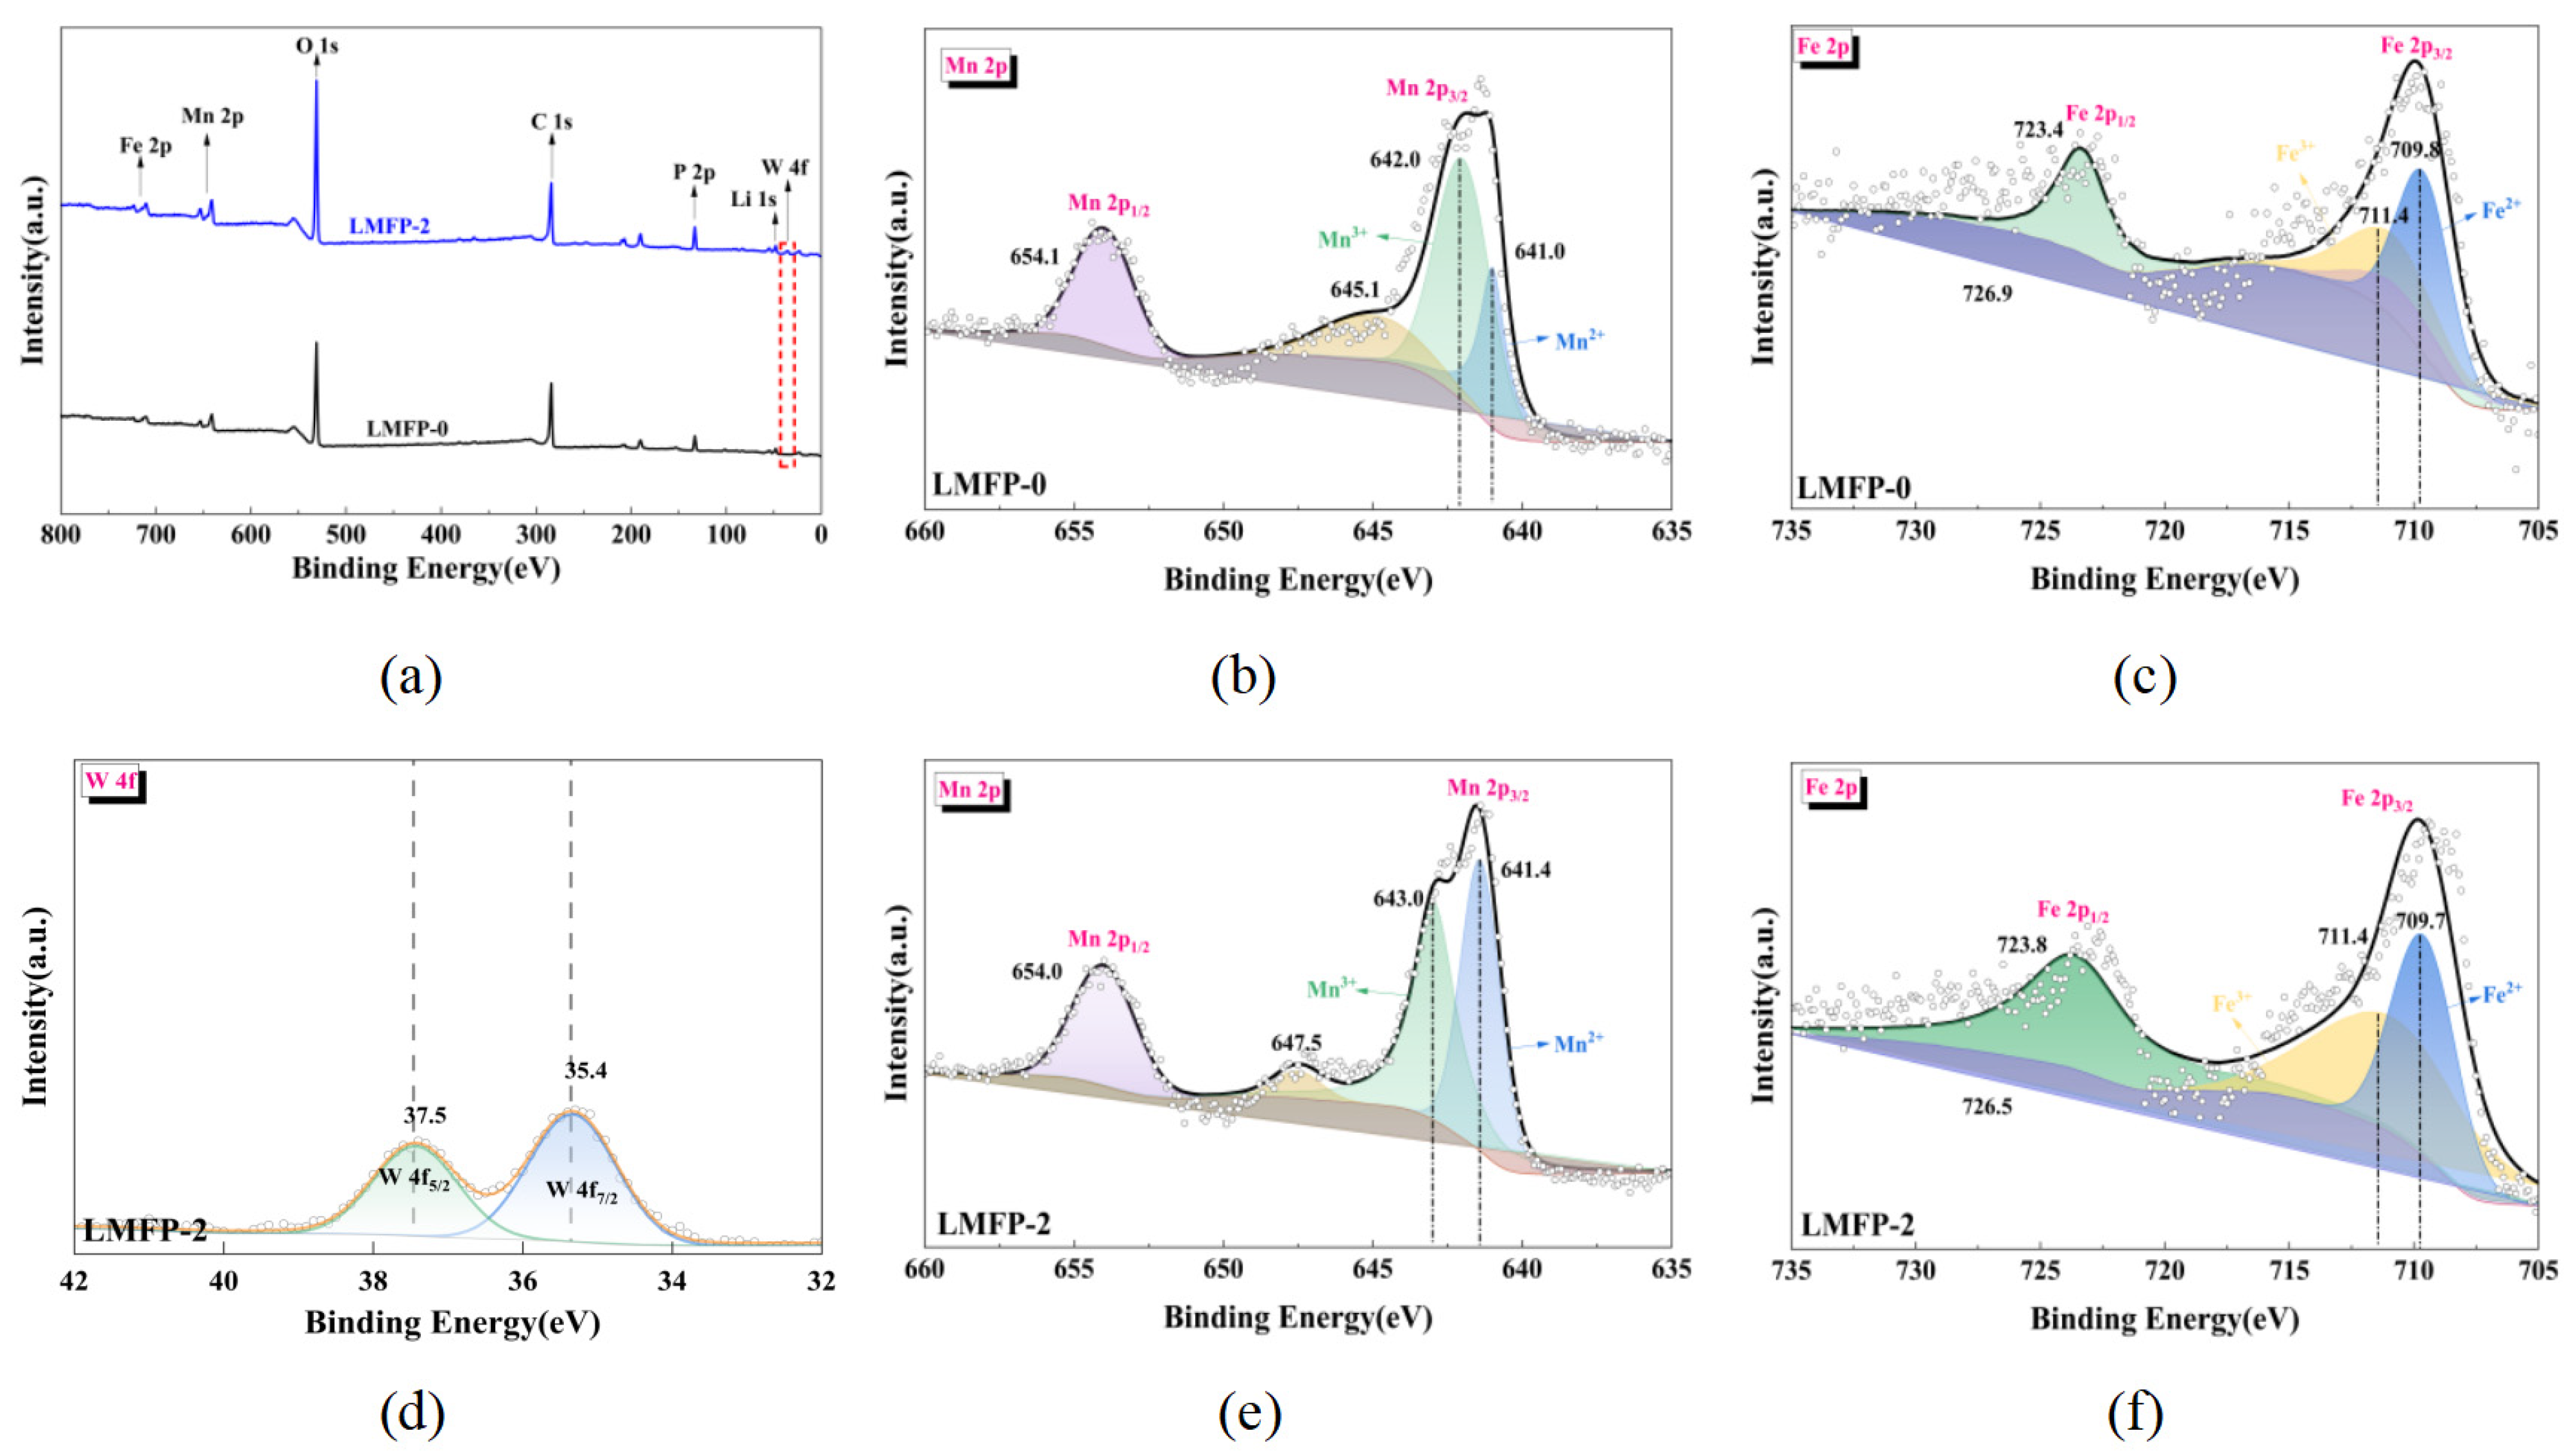
X-ray photoelectron spectroscopy (XPS) measurements were conducted at room temperature to qualitatively identify the surface-detectable elements and examine their near-surface chemical states. Therefore, no complete quantitative surface elemental composition is reported. Because dedicated high-resolution Li 1s and P 2p spectra were not acquired, the corresponding survey-level signals are used only for qualitative elemental identification and are not further deconvoluted or interpreted in terms of detailed chemical states. As shown in Figure 4a, the survey spectra of both LMFP-0 and LMFP-2 display characteristic signals assigned to Li 1s, Fe 2p, Mn 2p, P 2p, O 1s, and C 1s, providing qualitative evidence for the presence of these elements in the near-surface region probed by XPS. The present XPS analysis was used primarily for elemental identification and chemical-state characterization. In addition, the LMFP-2 sample (x = 0.010) exhibits distinct binding-energy features in the 30–40 eV region attributable to W 4f (Figure 4d). Peak fitting of the high-resolution W 4f spectrum resolves a spin–orbit doublet at approximately 35.4 and 37.5 eV, assigned to W 4f7/2 and W 4f5/2, respectively, with a peak separation of approximately 2.1 eV. These binding-energy positions are consistent with the characteristic W 4f doublet of W6+, indicating that the detectable near-surface W species in LMFP-2 are predominantly present in the +6 oxidation state [25]. Because XPS is surface-sensitive, this assignment applies to the detectable near-surface W species; within the detection and fitting limits of the present measurements, no additional W 4f components attributable to lower-valence W species were resolved. However, the present XPS results do not independently establish the crystallographic occupation site of W.
Figure 4.
XPS spectra of pristine and W-doped Li(Mn0.6Fe0.4)1−xWxPO4/C samples: (a) survey spectra of LMFP-0 and LMFP-2, where the red dashed box highlights the binding energy region of W 4f, indicating the presence of W in LMFP-2 but its absence in LMFP-0; (b,e) high-resolution Mn 2p spectra of LMFP-0 and LMFP-2, respectively; (c,f) high-resolution Fe 2p spectra of LMFP-0 and LMFP-2, respectively; (d) fitted high-resolution W 4f spectrum of LMFP-2, showing the W 4f7/2 and W 4f5/2 components at approximately 35.4 and 37.5 eV, respectively. The Mn 2p and Fe 2p spectra were quantitatively deconvoluted using a Lorentzian–Gaussian mixed line shape (GL(30)) under identical fitting constraints. The reported Mn2+/Mn3+ values represent fitted relative component-area ratios rather than absolute surface concentrations.
The high-resolution Mn 2p spectra of LMFP-0 and LMFP-2 are presented in Figure 4b and Figure 4e, respectively. For LMFP-0, deconvolution of the Mn 2p3/2 signal yields two component peaks centered at 641.0 eV and 642.0 eV, assigned to Mn2+ and Mn3+, respectively; the Mn 2p1/2 peak is located at 654.1 eV, accompanied by a satellite feature at 645.1 eV. For LMFP-2, the Mn 2p3/2 envelope is resolved into peaks at 641.4 eV (Mn2+) and 643.0 eV (Mn3+), with the Mn 2p1/2 component appearing at 654.0 eV and a satellite peak at 647.5 eV. The semi-quantitative peak-area fitting results summarized in Table 3 indicate that the Mn 2p3/2 spectra can be deconvoluted using a Lorentzian–Gaussian mixed line shape (GL(30)) under identical fitting constraints. The fitted relative Mn2+ and Mn3+ fractions of LMFP-0 were determined to be 29.6% and 70.4%, respectively, corresponding to a Mn2+/Mn3+ peak-area ratio of 0.42. For LMFP-2, the fitted relative Mn2+ contribution increased to 41.7%, whereas the fitted relative Mn3+ fraction decreased to 58.3%, yielding a Mn2+/Mn3+ ratio of 0.72. This trend indicates that the introduction of W is associated with a modified near-surface Mn electronic environment. One plausible explanation is local charge compensation, through which a fraction of the pre-existing near-surface Mn3+ species is reduced to Mn2+. The resulting decrease in the fitted relative Mn3+ contribution may be associated with partial alleviation of Mn3+-related Jahn–Teller distortion and may contribute to improved structural stability during electrochemical cycling. Nevertheless, this interpretation should be regarded as a possible mechanism rather than a definitively established process. If W6+ substitutes for a divalent transition-metal ion, the resulting excess positive charge may, in principle, be compensated through several negatively charged defect processes, including cation-vacancy formation and/or electron localization accompanied by the reduction in pre-existing near-surface Mn3+ species to Mn2+. The possible lithium-vacancy-assisted mechanism discussed in Section 3.3 may represent another contribution, while subtle differences in the local surface or reducing environment during carbothermal sintering may also affect the near-surface Mn valence distribution. However, the present XPS results do not establish that W occupies the Mn site or identify a unique charge-compensation mechanism. It should be noted that the reported Mn2+/Mn3+ ratios represent single-fit results obtained under fixed Lorentzian–Gaussian constraints, and the associated fitting uncertainty has not been formally quantified in this study. Accordingly, these values represent relative component-area fractions within the fitted Mn 2p3/2 envelope and should not be interpreted as absolute surface Mn concentrations. Furthermore, as a surface-sensitive technique, XPS reflects the near-surface Mn valence distribution rather than the bulk; bulk-sensitive techniques such as Mn K-edge XANES would provide further validation of the average Mn oxidation state.
Table 3.
Semi-quantitative Mn 2p3/2 peak-fitting results obtained using a Lorentzian–Gaussian mixed line shape (GL(30)). The reported percentages represent fitted relative component-area fractions rather than absolute surface concentrations. Satellite peaks were excluded from the normalization of the Mn2+ and Mn3+ component areas.
The high-resolution Fe 2p spectra of LMFP-0 and LMFP-2 are shown in Figure 4c and Figure 4f, respectively. For LMFP-0, deconvolution of the Fe 2p3/2 signal resolves two components at 709.8 eV (Fe2+) and 711.4 eV (Fe3+), with the Fe 2p1/2 peak at 723.4 eV and a satellite feature at 726.9 eV. The corresponding Fe 2p3/2 components of LMFP-2 appear at 709.7 eV (Fe2+) and 711.4 eV (Fe3+), with Fe 2p1/2 at 723.8 eV and a satellite at 726.5 eV. In contrast to the Mn 2p spectra, no appreciable shift in the overall Fe 2p binding energies is detected between LMFP-0 and LMFP-2, suggesting that the presence of near-surface W6+ species is not accompanied by a pronounced change in the near-surface Fe chemical environment. Although this observation is compatible with a limited perturbation of the Fe sites, it cannot independently identify the crystallographic occupation site of W. Within the sensitivity of the present XPS measurements, no major change in the Fe chemical state was observed after the introduction of W. This observation is consistent with the possibility of W incorporation, in agreement with the XRD and Rietveld refinement results. However, the present XPS results mainly reflect the surface chemical environment and cannot independently determine the crystallographic occupation site. The Fe-O coordination environment does not appear to be substantially disrupted by the dopant.
3.2. Electrochemical Performance
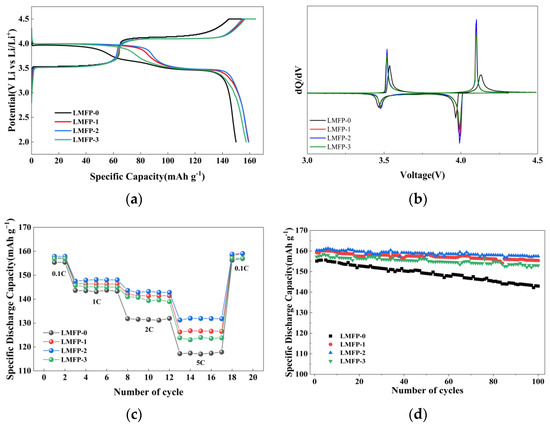
Figure 5a presents the initial charge–discharge profiles of all samples recorded at 0.1 C. All electrodes were charged under a constant-current/constant-voltage (CC/CV) protocol and discharged under constant-current (CC) conditions. Two well-defined voltage plateaus are observed at approximately 3.5 V and 4.1 V (vs. Li/Li+) for all compositions, corresponding to the Fe2+/Fe3+ and Mn2+/Mn3+ redox couples, respectively [26,27]. At 0.1 C, the initial discharge-specific capacities of LMFP-0, LMFP-1, LMFP-2 and LMFP-3 are 155.0, 159.0, 160.2 and 157.3 mAh g−1, respectively. Evidently, W6+ doping elevates the initial discharge capacity, even though partial substitution of transition metal sites by W6+ would theoretically reduce the content of electrochemically active transition metal ions and lower the theoretical specific capacity. As shown in Figure 5a, LMFP-2 exhibits a longer voltage plateau at approximately 4.1 V than pristine LMFP-0, which is consistent with improved utilization of the Mn2+/Mn3+ redox capacity and contributes to its higher reversible capacity. Meanwhile, the smoother charge–discharge plateaus after tungsten doping are also beneficial to the improvement of discharge capacity. The superior initial discharge capacity of LMFP-2 originates from its higher crystallinity and uniformly distributed primary particle size. Nevertheless, further increasing the W doping content to 1.5 mol% triggers a sharp decline in capacity retention. Excessive W doping induces increased local structural disorder, which may trigger structural degradation and block Li+ diffusion pathways, deteriorating the cycling stability of the material. In addition, tungsten does not directly participate in redox reactions during charge and discharge and cannot contribute extra capacity; excessive incorporation of W dilutes the proportion of electrochemically active components, thereby impairing the overall electrochemical performance of the cathode material.
Figure 5.
Electrochemical performance of pristine and W-doped Li(Mn0.6Fe0.4)1−xWxPO4/C samples: (a) initial charge–discharge profiles at 0.1 C; (b) differential capacity (dQ/dV) curves; (c) rate performance curves at 0.1, 1, 2, and 5 C; (d) cycling performance curves at 1 C and 25 °C.
The differential capacity (dQ/dV) curves presented in Figure 5b reveal that W6+ incorporation exerts a pronounced influence on the electrochemical characteristics of the Mn2+/Mn3+ redox couple near 4.0 V, and this regulation effect is especially prominent for high-voltage Mn-related redox sites. Notably, the manganese oxidation peak of LMFP-2 shifts negatively to the largest extent, accompanied by the minimum peak potential separation (ΔE) across all samples. Such narrowed ΔE confirms a weakened kinetic barrier for Li+ deintercalation and Mn2+ oxidation, demonstrating enhanced electrochemical reversibility and suppressed polarization behavior. This favorable behavior may be associated with the relatively high crystallinity of LMFP-2 and the absence of detectable crystalline secondary phases within the XRD detection limit. Together with the conductive carbon coating and relatively uniform primary-particle distribution, these structural features may facilitate electron and Li+ transport.
Figure 5c presents the rate performance of the pristine and W6+-doped samples evaluated at current densities of 0.1, 1, 2, and 5 C. Upon returning to 0.1 C following high-rate cycling, the specific discharge capacities of all samples recovered essentially to their initial values, confirming that the olivine framework remained structurally intact throughout the high-rate charge–discharge processes. As expected, the discharge capacities of all compositions decline monotonically with increasing current density owing to the progressively exacerbated electrochemical polarization. Nevertheless, W6+ doping improves the rate capability to varying extents across the series. The LMFP-2 sample exhibits the most favorable rate performance, delivering discharge capacities of 146.6, 142.1, and 126.3 mAh g−1 at 1, 2, and 5 C, respectively, which are markedly superior to those of the undoped LMFP-0 sample (143.6, 131.8, and 117.2 mAh g−1 at the corresponding rates). This improvement is primarily attributed to the higher degree of crystallinity and a smaller, more homogeneous primary particle size distribution achieved in LMFP-2. These findings collectively corroborate the beneficial role of W6+ doping in accelerating Li+ diffusion kinetics and enhancing the overall electrochemical reaction kinetics.
To evaluate the effect of W6+ substitution on long-term electrochemical stability, coin-type half-cells were subjected to galvanostatic cycling at 1 C and 25 °C. The resulting cycling performance curves are shown in Figure 5d. Based on the first-cycle discharge capacity, the capacity retentions of LMFP-0, LMFP-1, LMFP-2, and LMFP-3 after 100 cycles are 91.6%, 97.4%, 98.1%, and 97.1%, respectively, demonstrating that W6+ doping systematically enhances cycling stability, with LMFP-2 achieving the highest retention.
This improvement can be rationalized on two grounds. First, the introduced W species may contribute to the stabilization of the olivine framework during repeated charge–discharge cycling [16]. Nevertheless, because the crystallographic occupation site of W has not been established and no in situ structural evidence was obtained during cycling, this possible framework-stabilizing effect should be regarded as a tentative interpretation. Second, the lower fitted relative surface Mn3+ fraction may be associated with partial alleviation of Mn3+-induced Jahn–Teller distortion, which could help suppress structural degradation during cycling. The slight decrease in capacity retention observed for LMFP-3 relative to LMFP-2 is ascribed to two competing effects: increased local structural disorder induced by excessive W6+ incorporation and an elevated fraction of electrochemically inactive tungsten species, both of which ultimately compromise the structural integrity and diminish the available capacity.
3.3. Electrochemical Kinetics
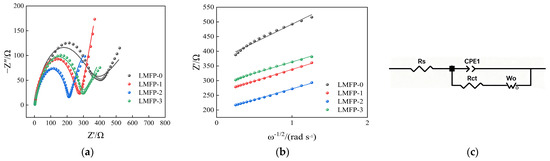
The electrochemical kinetics of all four electrode materials were further investigated by electrochemical impedance spectroscopy (EIS). The resulting Nyquist plots are presented in Figure 6. Each spectrum comprises a depressed semicircle in the high- to medium-frequency region, associated with the charge-transfer process at the electrode–electrolyte interface, and an inclined line in the low-frequency region corresponding to semi-infinite Warburg diffusion [28]. Equivalent circuit fitting of the Nyquist plots in Figure 6a yields charge-transfer resistance (Rct) values of 279.5, 243.9, 195.4, and 230.4 Ω for LMFP-0, LMFP-1, LMFP-2, and LMFP-3, respectively. The lowest Rct observed for LMFP-2 indicates significantly improved interfacial charge-transfer kinetics. Combined with the direct resistivity measurements and Li+ diffusion analysis, these results suggest that moderate W incorporation facilitates both electron transport and Li+ migration, thereby contributing to the superior electrochemical performance of LMFP-2. Conversely, excessive W6+ content constricts the Li+ transport channels, leading to a deterioration of ionic conductivity and a consequent increase in Rct, as evidenced by the larger semicircle diameter of LMFP-3 relative to LMFP-2. The lowest Rct of LMFP-2 is therefore consistent with its superior reversible capacity and rate capability demonstrated above.
Figure 6.
Electrochemical impedance spectroscopy (EIS) of pristine and W-doped samples: (a) Nyquist plots; (b) linear fitting of Z′ versus ω−1/2 in the low-frequency region; (c) the equivalent circuit employed for fitting the EIS Nyquist plots, comprising the electrolyte resistance (Rs) in series with a parallel combination of a constant phase element (CPE1) and a branch consisting of the charge-transfer resistance (Rct) in series with the Warburg element (Wo).
The inclined low-frequency tail is associated with the Warburg impedance arising from solid-state Li+ diffusion within the active material particles [29]. The apparent Li+ diffusion coefficient (DLi+) was calculated according to the following equation:
where R is the universal gas constant (8.314 J mol−1 K−1), T is the absolute temperature (298.15 K), A is the geometric electrode area (1.54 cm2, consistent with the electrode area described in Section 2.3), n is the number of electrons transferred per formula unit during the redox process (n = 1, corresponding to one-electron transfer per Fe2+/Fe3+ or Mn2+/Mn3+ redox event), F is the Faraday constant (96485 C mol−1), C is the molar concentration of Li+ in the active material (0.0228 mol cm−3, the theoretical Li+ concentration in the olivine lattice), and σ is the Warburg coefficient, which is related to the real part of the impedance (Z′) by the following:
DLi+ = R2T2/2A2n4F4C2σ2
Z′ = Rs + Rct + σω−1/2
The EIS spectra were fitted using ZView software (Version 2.70) with the equivalent circuit shown in Figure 6c. The circuit consists of the electrolyte resistance (Rs) connected in series with a parallel combination of a constant-phase element (CPE1) and a branch comprising the charge-transfer resistance (Rct) in series with the Warburg element (Wo). The chi-squared (χ2) values of all fits were below 0.0039, and the relative fitting errors of the equivalent-circuit elements were below 3%, indicating satisfactory fitting quality. The value of σ was obtained from the slope of the linear fit of Z′ versus ω−1/2, as shown in Figure 6b. The last 15 data points in the low-frequency region were used for the linear fitting. For all four compositions, the Z′ versus ω−1/2 data exhibited excellent linearity, with R2 > 0.997. This linear behavior indicates that, within the timescale probed by the applied AC perturbation (0.01 Hz–100 kHz), the diffusion layer remains confined well within the bulk of the active material particles and does not reach a reflecting boundary (e.g., the particle center or the current-collector interface), justifying the semi-infinite diffusion assumption underlying Equation (1). Deviation from this linear regime—for example, a transition to a vertical capacitive tail at very low frequency—was not observed within the tested frequency window, further supporting the applicability of the semi-infinite diffusion model to the present system. Based on Equations (1) and (2) [29,30], the relative standard errors of σ obtained from the low-frequency linear fits were below 3%. Because DLi+ is proportional to σ−2, propagation of the fitting uncertainty in σ resulted in an estimated relative uncertainty of approximately 6% in DLi+. Accordingly, the DLi+ values of LMFP-0, LMFP-1, LMFP-2 and LMFP-3 are determined to be (1.8 ± 0.1) × 10−15, (4.6 ± 0.3) × 10−15, (5.3 ± 0.3) × 10−15 and (4.8 ± 0.3) × 10−15 cm2 s−1, respectively, with LMFP-2 exhibiting the highest Li+ diffusion coefficient among all compositions.
The superior DLi+ of LMFP-2 may be associated with a possible lithium-vacancy-assisted diffusion mechanism arising from W6+ incorporation. If W6+ preferentially occupies transition-metal sites, charge neutrality considerations suggest the possible generation of lithium vacancies. If present, such lithium vacancies could facilitate Li+ migration by increasing the number of accessible diffusion pathways. However, neither the crystallographic occupation site of W nor lithium-vacancy formation was directly determined in this study. Therefore, the lithium-vacancy-assisted diffusion pathway should be regarded as a plausible hypothesis rather than a confirmed mechanism. Moreover, because the fitted lattice-parameter changes are small and their statistical significance has not been established, their contribution to Li+ transport cannot be determined from the present data. In contrast, the inferior electrochemical kinetics of LMFP-3 may be associated with increased local structural disorder and less favorable Li+ transport at the higher nominal W content. Collectively, these results demonstrate that an optimal W6+ doping level simultaneously reduces the charge-transfer resistance and enhances the Li+ migration rate, thereby synergistically improving the overall electrochemical kinetics of the LMFP cathode material.
As summarized in Table 4, the measured resistivities of LMFP-0, LMFP-1, LMFP-2, and LMFP-3 were 654.19, 230.19, 102.17, and 444.64 Ω cm, respectively. The corresponding electronic conductivities were calculated to be 1.53 × 10⁻³, 4.34 × 10⁻³, 9.79 × 10⁻³, and 2.25 × 10⁻³ S cm−1.
Table 4.
Resistivity and electronic conductivity of LMFP/C samples.
Among the four samples, LMFP-2 exhibited the highest electronic conductivity, approximately 6.4 times higher than that of pristine LMFP-0. This result provides direct evidence that moderate W incorporation improves the bulk electronic conductivity of LMFP/C materials. However, excessive W incorporation leads to a decrease in conductivity, indicating that an optimal W concentration is required to achieve superior electrochemical performance.
It should be noted that the present structural characterization provides indirect evidence regarding the incorporation of W into the LMFP lattice. Direct determination of the W occupation site and the associated charge-compensation mechanism requires advanced local structural characterization techniques, such as neutron diffraction, synchrotron X-ray absorption spectroscopy (XANES/EXAFS), or Rietveld refinement with site-occupancy analysis, which will be pursued in future work.
4. Conclusions
In summary, a series of W-doped Li(Mn0.6Fe0.4)1−xWxPO4/C (x = 0, 0.005, 0.010, 0.015) cathode materials were successfully synthesized via spray-drying combined with a carbothermal reduction route. Whole-pattern refinement indicated small changes in the lattice parameters following W incorporation. These changes are consistent with possible incorporation of W into the olivine lattice; however, the magnitude and statistical significance of the lattice variation, as well as the precise W occupation site, require confirmation by higher-resolution diffraction and local-structure characterization. FE-SEM analysis revealed that an appropriate W6+ substitution level refines the primary particle size distribution, reduces interparticle agglomeration, and improves particle morphology regularity, with EDS elemental mapping showing spatially dispersed W signals across the examined regions. XPS characterization indicated that the detectable near-surface tungsten species are predominantly present in the +6 oxidation state. Semi-quantitative Mn 2p XPS peak fitting showed that the fitted relative surface Mn3+ fraction decreased from 70.4% in LMFP-0 to 58.3% in LMFP-2, while the fitted Mn2+/Mn3+ area ratio increased from 0.42 to 0.72. This trend suggests that the presence of W modifies the near-surface Mn electronic environment and may be associated with local charge compensation. However, the present XPS results do not independently establish the crystallographic occupation site of W or the unique charge-compensation mechanism. The negligible shift in Fe 2p binding energy is consistent with limited perturbation of the Fe local environment between LMFP-0 and LMFP-2, although it does not by itself provide direct evidence for the atomic occupation site of W. Electrochemical evaluation identified LMFP-2 (x = 0.010) as the optimal composition, delivering an initial discharge capacity of 160.2 mAh g−1 at 0.1 C, a capacity retention of 98.1% after 100 cycles at 1 C, and a high-rate discharge capacity of 126.3 mAh g−1 at 5 C, all substantially exceeding the corresponding values of the undoped LMFP-0. EIS analysis further revealed that LMFP-2 possesses the lowest charge-transfer resistance (Rct = 195.4 Ω) and the highest Li+ diffusion coefficient (DLi+ = 5.3 × 10⁻¹⁵ cm2 s−1) among all compositions. These electrochemical enhancements are attributed to the synergistic effects of enhanced bulk electronic conductivity, accelerated Li+ diffusion kinetics, the reduced relative surface Mn3+ fraction and the partial alleviation of Mn3+-associated Jahn–Teller distortion, together with the improved structural stability induced by moderate W incorporation. However, the higher nominal W content in LMFP-3 may increase local structural disorder and adversely affect Li+ transport, resulting in inferior capacity, rate capability, and cycling performance relative to LMFP-2. These findings identify W doping as a potentially useful compositional modification strategy for olivine-based cathode materials and provide further insight into the structure–performance relationships of W-modified LMFP systems.
Although the present study demonstrates the beneficial effects of moderate W incorporation on the electrochemical performance of LMFP, additional investigations under extended cycling and practical operating conditions would provide further insights into the long-term structure–property relationship of W-doped LMFP materials.
Author Contributions
Conceptualization, S.L. (Sha Li) and Y.C.; methodology, S.L. (Sha Li), Y.C. and J.Z.; software, X.W.; validation, S.L. (Sha Li), Y.C., J.Z. and X.W.; formal analysis, S.L. (Sha Li), J.Z. and X.W.; investigation, Y.C., J.Z., H.L., W.L. and H.L.; resources, S.L. (Sha Li), F.L. and S.L. (Suqin Liu); data curation, S.L. (Sha Li) and Y.C.; writing—original draft preparation, S.L. (Sha Li) and Y.C.; writing—review and editing, S.L. (Sha Li), F.L. and S.L. (Suqin Liu); visualization, Y.C.; supervision, F.L. and S.L. (Suqin Liu); project administration, S.L. (Sha Li). All authors have read and agreed to the published version of the manuscript.
Funding
This research received no external funding.
Data Availability Statement
The data presented in this study are available on request from the corresponding author due to privacy.
Acknowledgments
We acknowledge Zijin Mining Group Co., Ltd. and Zijin Mining New Energy and New Materials Technology (Changsha) Co., Ltd. for supporting this study.
Conflicts of Interest
Authors Sha Li, Yizhou Cao, Xinyi Wang, Junhao Zhao, Wenbin Li, and Hongxu Li are employed by the company Zijin Mining New Energy and New Materials Technology (Changsha) Co., Ltd. The remaining authors declare that the research was conducted in the absence of any commercial or financial relationships that could be construed as potential conflicts of interest.
References
- Xu, J.; Cai, X.; Cai, S.; Shao, Y.; Hu, C.; Lu, S.; Ding, S. High-Energy Lithium-Ion Batteries: Recent Progress and a Promising Future in Applications. Energy Environ. Mater. 2023, 6, e12450. [Google Scholar] [CrossRef] [Scilit]
- Ahangari, M.; Szalai, B.; Lujan, J.; Zhou, M.; Luo, H. Advancements and Challenges in High-Capacity Ni-Rich Cathode Materials for Lithium-Ion Batteries. Materials 2024, 17, 801. [Google Scholar] [CrossRef] [Scilit]
- Bao, Y.; Guo, X.; Li, W.; Zhao, S.; Huang, C. Research Progress on Cathode Materials for Lithium-Ion Batteries. J. Solid State Electrochem. 2025, 29, 3595–3619. [Google Scholar] [CrossRef] [Scilit]
- Gonçalves, J.M.; Mubarac, S.; Silva, G.T.M.; Freitas, B.; Aguiar Neto, B.G.; Zanin, H. Emerging Multimetal LMFP-Based Cathodes for Lithium-Ion Batteries: A Review. J. Mater. Chem. A 2025, 13, 40399–40429. [Google Scholar] [CrossRef] [Scilit]
- Li, Y.; Yu, C.; Wang, X.; Zhong, Y.; Wu, Z.; Wang, X.; Zhong, B. Advancements in Lithium Manganese Iron Phosphate as a High-Performance Cathode Material for Lithium-Ion Batteries. Ind. Eng. Chem. Res. 2025, 64, 13920–13949. [Google Scholar] [CrossRef] [Scilit]
- Agustiana, D.; Daraz, U.; Siburian, D.M.; Lyu, P.; Liu, H. Cathode Materials for Advanced Lithium-Ion Batteries: Developments, Challenges, and Emerging Trends. Mater. Res. Bull. 2026, 195, 113842. [Google Scholar] [CrossRef] [Scilit]
- Wang, J.; Sun, X. Olivine LiFePO4: The Remaining Challenges for Future Energy Storage. Energy Environ. Sci. 2015, 8, 1110–1138. [Google Scholar] [CrossRef] [Scilit]
- Li, W.; Song, B.; Manthiram, A. High-Voltage Positive Electrode Materials for Lithium-Ion Batteries. Chem. Soc. Rev. 2017, 46, 3006–3059. [Google Scholar] [CrossRef] [Scilit] [PubMed]
- Manthiram, A.; Goodenough, J.B. Lithium-Based Polyanion Oxide Cathodes. Nat. Energy 2021, 6, 844–845. [Google Scholar] [CrossRef] [Scilit]
- Baji, D.S.; Athira, K.M.; Aravindan, V. LiMn0.5Fe0.5PO4: A Cathode Material for Lithium-Ion Batteries: A Comprehensive Review. Adv. Energy Mater. 2026, 16, e71014. [Google Scholar] [CrossRef] [Scilit]
- Jung, H.; Oh, C.; Park, S.; An, S.; Bang, J.; Youn, J.; Lee, J.; Park, J.-H.; Han, D. Lithium Manganese Iron Phosphate (LiMn1−yFeyPO4) Rechargeable Batteries: Bridging Material Innovation with Practical Cell Design. Energy Mater. 2025, 5, 500118. [Google Scholar] [CrossRef] [Scilit]
- Youn, G.; Baek, S.; Chae, M.S.; Lee, K.T. Re-Evaluating Jahn–Teller Distortion for Structural Flexibility and Fast Ion Transport in LMFP Cathodes. Adv. Funct. Mater. 2026, 36, e74566. [Google Scholar] [CrossRef] [Scilit]
- Xu, E.; Sun, X.; Lyv, W.; Li, F.; Li, R.; Cai, W.; Wu, H.; Wu, K.; Zhang, Y. Optimizing the Electrochemical Performance of Olivine LiMnxFe1−xPO4 Cathode Materials: Ongoing Progresses and Challenges. Ind. Eng. Chem. Res. 2024, 63, 9631–9660. [Google Scholar] [CrossRef] [Scilit]
- Peng, J.; Li, Z.; You, Y.; Liu, J.; Wang, L.; Xu, J.; Ou, S.; Yuan, M. Contribution of Ti-Doping to the Cyclic Stability of LiFe0.6Mn0.4PO4/C. Ind. Eng. Chem. Res. 2024, 63, 8228–8238. [Google Scholar] [CrossRef] [Scilit]
- Guo, H.; Liu, R.; Li, W.; Gu, H.; Cao, J.; Gong, D.; Liang, G. Site Selection of Niobium-Doped LiMn0.6Fe0.4PO4 and Effect on Electrochemical Properties. J. Electrochem. Soc. 2023, 170, 030542. [Google Scholar] [CrossRef] [Scilit]
- Xu, J.; Hou, K.; Li, X.; Bian, Y.; Wang, Y.; Wang, L.; Liang, G. Enhancing the High-Rate Capability and Cycling Stability of LiMn0.6Fe0.4PO4/C Cathode Materials for Lithium-Ion Batteries by Na+ Doping. ACS Appl. Energy Mater. 2024, 7, 8694–8704. [Google Scholar] [CrossRef] [Scilit]
- Zhang, K.; Cao, J.; Tian, S.; Guo, H.; Liu, R.; Ren, X.; Wen, L.; Liang, G. The Prepared and Electrochemical Property of Mg-Doped LiMn0.6Fe0.4PO4/C as cathode Materials for Lithium-Ion Batteries. Ionics 2021, 27, 4629–4637. [Google Scholar] [CrossRef] [Scilit]
- Tian, S.; Zhang, K.; Cao, J.; Guo, H.; Liu, R.; Liang, G. Spherical Ni-Doped LiMn0.6Fe0.4PO4/C Composites with High-Rate Performance. Ionics 2021, 27, 2877–2887. [Google Scholar] [CrossRef] [Scilit]
- Zeng, T.; Gao, P.; Zhou, Z.; Fan, C.; Liu, Z.; Zhang, F.; Liu, J.; Liu, J. Superior Electronic/Ionic Kinetics of LiMn0.8Fe0.2PO4@C Nanoparticles Cathode by Doping Strategy toward Enhanced Li-Ion Storage. Energy Storage Mater. 2024, 65, 103125. [Google Scholar] [CrossRef] [Scilit]
- Yu, H.; Zhang, E.; Yu, J.; Yu, S.; Fang, Y.; Chen, L.; Jiang, H.; Li, C. Relaxing the Jahn–Teller Distortion of LiMn0.6Fe0.4PO4 Cathodes via Mg/Ni Dual-Doping for High-Rate and Long-Life Li-Ion Batteries. J. Mater. Chem. A 2024, 12, 26076–26082. [Google Scholar] [CrossRef] [Scilit]
- Cao, X.; Pan, A.; Zhang, Y.; Li, J.; Luo, Z.; Yang, X.; Liang, S.; Cao, G. Nanorod-Nanoflake Interconnected LiMnPO4·Li3V2(PO4)3/C Composite for High-Rate and Long-Life Lithium-Ion Batteries. ACS Appl. Mater. Interfaces 2016, 8, 27632–27641. [Google Scholar] [CrossRef] [Scilit] [PubMed]
- Jin, H.; Zhang, J.; Qin, L.; Hu, Y.; Jiang, H.; Li, C. Dual Modification of Olivine LiFe0.5Mn0.5PO4 Cathodes with Accelerated Kinetics for High-Rate Lithium-Ion Batteries. Ind. Eng. Chem. Res. 2023, 62, 1029–1034. [Google Scholar] [CrossRef] [Scilit]
- Shannon, R.D. Revised Effective Ionic Radii and Systematic Studies of Interatomic Distances in Halides and Chalcogenides. Acta Crystallogr. Sect. A 1976, 32, 751–767. [Google Scholar] [CrossRef] [Scilit]
- Qiu, Z.; Man, Q.; Mu, Y.; Gu, H.; Zou, Z.; Han, M.; Zeng, L. Modification Strategies for Enhancing the Performance of Lithium Manganese Iron Phosphate Cathodes in Lithium-Ion Batteries. Chem. Methods 2025, 5, e202400065. [Google Scholar] [CrossRef] [Scilit]
- Nakagawa, Y.; Shiratsuchi, Y.; Shibayama, T.; Takeguchi, M. Ultraviolet Light-Induced Surface Changes of Tungsten Oxide in Air: Combined Scanning Transmission Electron Microscopy and X-ray Photoelectron Spectroscopy Analysis. Nanomaterials 2024, 14, 1486. [Google Scholar] [CrossRef] [Scilit] [PubMed]
- Hou, Y.K.; Pan, G.L.; Sun, Y.Y.; Gao, X.P. LiMn0.8Fe0.2PO4/Carbon Nanospheres@Graphene Nanoribbons Prepared by the Biomineralization Process as the Cathode for Lithium-Ion Batteries. ACS Appl. Mater. Interfaces 2018, 10, 16500–16510. [Google Scholar] [CrossRef] [Scilit] [PubMed]
- Liu, H.; Ren, L.; Li, J.; Tuo, H. Iron-Assisted Carbon Coating Strategy for Improved Electrochemical LiMn0.8Fe0.2PO4 Cathodes. Electrochim. Acta 2016, 212, 800–807. [Google Scholar] [CrossRef] [Scilit]
- Trinh, D.V.; Nguyen, M.T.T.; Dang, H.T.M.; Dang, D.T.; Le, H.T.T.; Le, H.T.N.; Tran, H.V.; Huynh, C.D. Hydrothermally Synthesized Nanostructured LiMnxFe1−xPO4 (x = 0–0.3) Cathode Materials with Enhanced Properties for Lithium-Ion Batteries. Sci. Rep. 2021, 11, 12280. [Google Scholar] [CrossRef] [Scilit] [PubMed]
- Li, G.; Li, Z.; Hou, Z.; Liu, Y.; Jiao, S. Unraveling superior lithium storage performance of MnO by a three-dimensional structure-memory anode. Electrochim. Acta 2020, 363, 137184. [Google Scholar] [CrossRef] [Scilit]
- Yan, X.; Sun, D.; Wang, Y.; Zhang, Z.; Yan, W.; Jiang, J.; Ma, F.; Liu, J.; Jin, Y.; Kanamura, K. Enhanced electrochemical performance of LiMn0.75Fe0.25PO4 nanoplates from multiple interface modification by using fluorine-doped carbon coating. ACS Sustain. Chem. Eng. 2017, 5, 4637–4644. [Google Scholar] [CrossRef] [Scilit]

Disclaimer/Publisher’s Note: The statements, opinions and data contained in all publications are solely those of the individual author(s) and contributor(s) and not of MDPI and/or the editor(s). MDPI and/or the editor(s) disclaim responsibility for any injury to people or property resulting from any ideas, methods, instructions or products referred to in the content. |
© 2026 by the authors. Licensee MDPI, Basel, Switzerland. This article is an open access article distributed under the terms and conditions of the Creative Commons Attribution (CC BY) license.