


Abstract
This study investigates the influence of CuO doping on the structural, electrochemical, and catalytic properties of tungsten phosphate matrices. The synthesized materials were characterized using various physicochemical techniques to evaluate the effects of copper oxide incorporation and their structural and functional properties. Their electrochemical behavior was investigated in an alkaline solution (1 M KOH) and in acidic electrolytes (0.5, 2.5, and 5 M H2SO4) to assess the influence of electrolyte concentration and composition on their electrochemical performance. The results reveal a significant dependence of the electrochemical response on the nature and concentration of the electrolyte solution. In acidic media with 0.5 M H2SO4, the material exhibits the lowest Tafel slope and relatively low charge-transfer resistance, suggesting more favorable interfacial electron-transfer processes under these conditions. Conversely, a higher Tafel slope was observed by using 2.5 and 5 M H2SO4 electrolyte solutions, indicating less favorable apparent reaction kinetics. Furthermore, the electrochemical response varies with electrolyte concentration, reflecting differences in charge-transfer behavior and resistance contributions.
1. Introduction
The growing global demand for sustainable and clean energy technologies has intensified research efforts toward the development of efficient electrocatalysts for energy conversion and storage applications. Electrochemical processes such as hydrogen evolution, oxygen evolution, and fuel cell reactions play a crucial role in renewable energy systems. However, the efficiency of these technologies is often limited by sluggish reaction kinetics and high activation overpotentials, necessitating the use of highly active catalysts [1,2].
Among the various transition metal oxides, copper oxide, CuO has emerged as a promising candidate due to its favourable electronic structure, good chemical stability, abundance, and low cost. CuO-based materials exhibit attractive electrochemical performance that facilitate charge transfer and enhance catalytic activity in various electrochemical reactions [3,4]. Furthermore, the surface chemistry of CuO allows the optimization of active sites and reaction pathways, making it a versatile material for catalytic applications.
On the other hand, nowadays, vitreous systems play an important role in different domains such as industry, medical, photonics, optical fibres, display devices, and others. Phosphorus pentoxide is a widely used network former due to its favourable physical characteristics for glass production, which include a low melting point, a high refractive index, and a low glass transition temperature. Phosphate glasses are characterized by a well-defined structure, good ionic conductivity, and hygroscopic properties. Due to these characteristics, the different modifiers were introduced in the phosphate network to increase mechanical strength, resistance to water, and chemical stability [5].
Tungsten phosphate glasses constitute an important class of inorganic materials characterized by a phosphate glass network modified by tungsten oxide, WO3 [6,7]. The structure of tungsten phosphate glasses consists primarily of interconnected [PO4] tetrahedral units and [WO6] octahedral structural units [8]. The presence of tungsten ions introduces multiple oxidation states, particularly W6+ and W5+, which facilitate electron hopping mechanisms and contribute to improved electronic conductivity [9,10]. This mixed ionic electronic conduction behaviour makes tungsten phosphate glasses attractive materials for electrochemical devices. One of the most important characteristics of tungsten phosphate glasses is their proton conducting capability. The phosphate groups provide pathways for proton migration, while the tungsten oxide component enhances charge transport through redox reactions. As a result, these materials have been investigated as solid electrolytes, catalyst supports, and electrode materials in fuel cell systems.
At proton exchange membrane fuel cells (PEMFCs), the tungsten phosphate materials can serve as catalyst supports or co-catalysts, providing stable anchoring sites for active metal nanoparticles. Their proton-conducting phosphate network enhances local proton transport, improving reaction kinetics at the cathode or anode.
Doping with transition metal oxides, such as CuO and NiO, can improve the electronic conductivity and reduce the activation polarization, making these glasses promising low-cost alternative electrode materials.
Tungsten phosphate glasses offer several advantages, including good chemical resistance, thermal stability, and tolerance to corrosive environments. Their amorphous structure can participate in electrochemical reactions. Furthermore, the incorporation of transition metal oxides such as CuO, NiO, CoO, or Fe2O3 can improve conductivity, catalytic activity, and charge-transfer kinetics, making these materials suitable candidates for electrocatalytic applications [11,12].
The electrocatalytic performance of tungsten phosphate glasses is strongly influenced by their composition and microstructure. Doping with copper oxide can increase the concentration of redox active sites, enhance electron mobility and reduce activation polarization. Such modifications may produce a lower Tafel slope, improved reaction kinetics, and higher catalytic efficiency in acidic media.
Because of their low cost, ease of synthesis, compositional flexibility, and favourable electrochemical properties, tungsten phosphate glasses are considered promising materials for energy conversion technologies. Ongoing research focuses on optimizing their structure and composition to achieve higher conductivity, enhanced durability, and improved electrocatalytic performance.
This study highlights the potential of tungsten phosphate and CuO–tungsten phosphate vitreous systems as promising functional materials for advanced technological applications. The electrochemical properties of studied materials as working electrodes operating with a potassium hydroxide or sulphuric acid solution are determined from measurements of cyclic voltammetry (CV), linear sweep voltammetry (LSV), electrochemical impedance spectroscopy (EIS), and Tafel analysis. Particular attention was paid to the kinetic parameters governing the electrochemical reaction.
2. Experimental Procedure
2.1. Materials
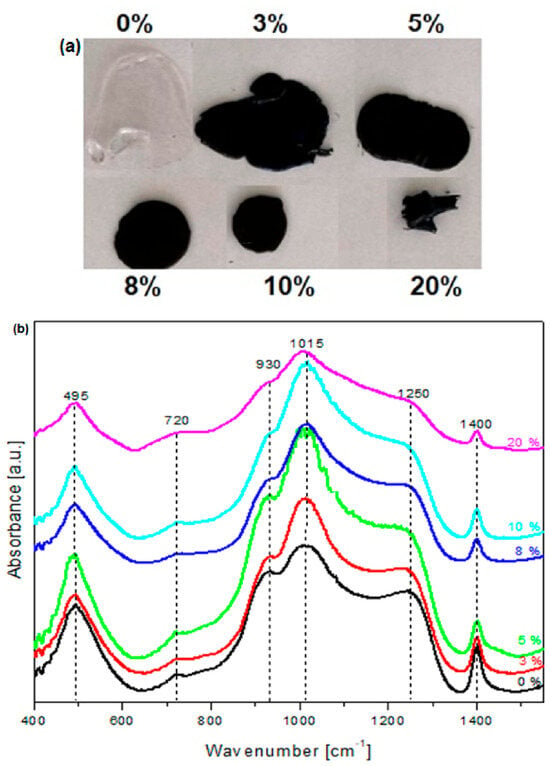
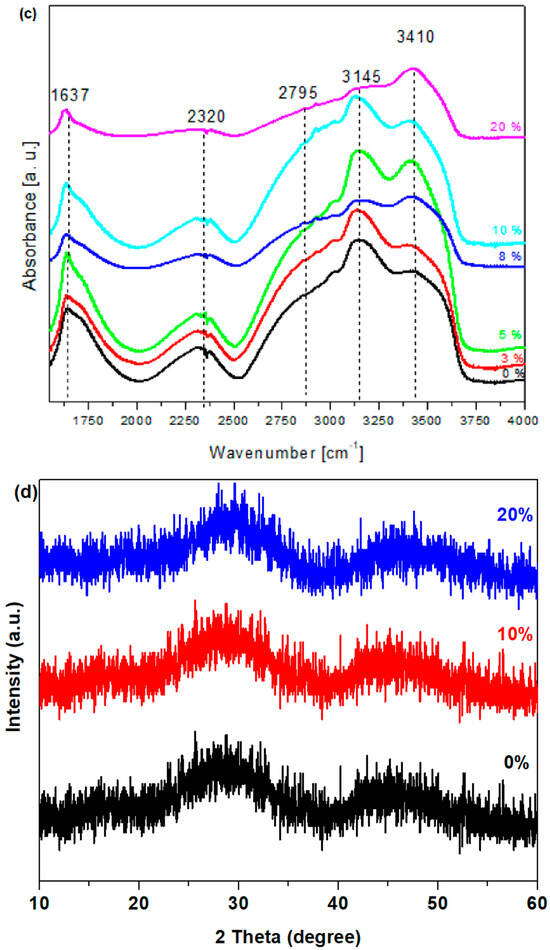
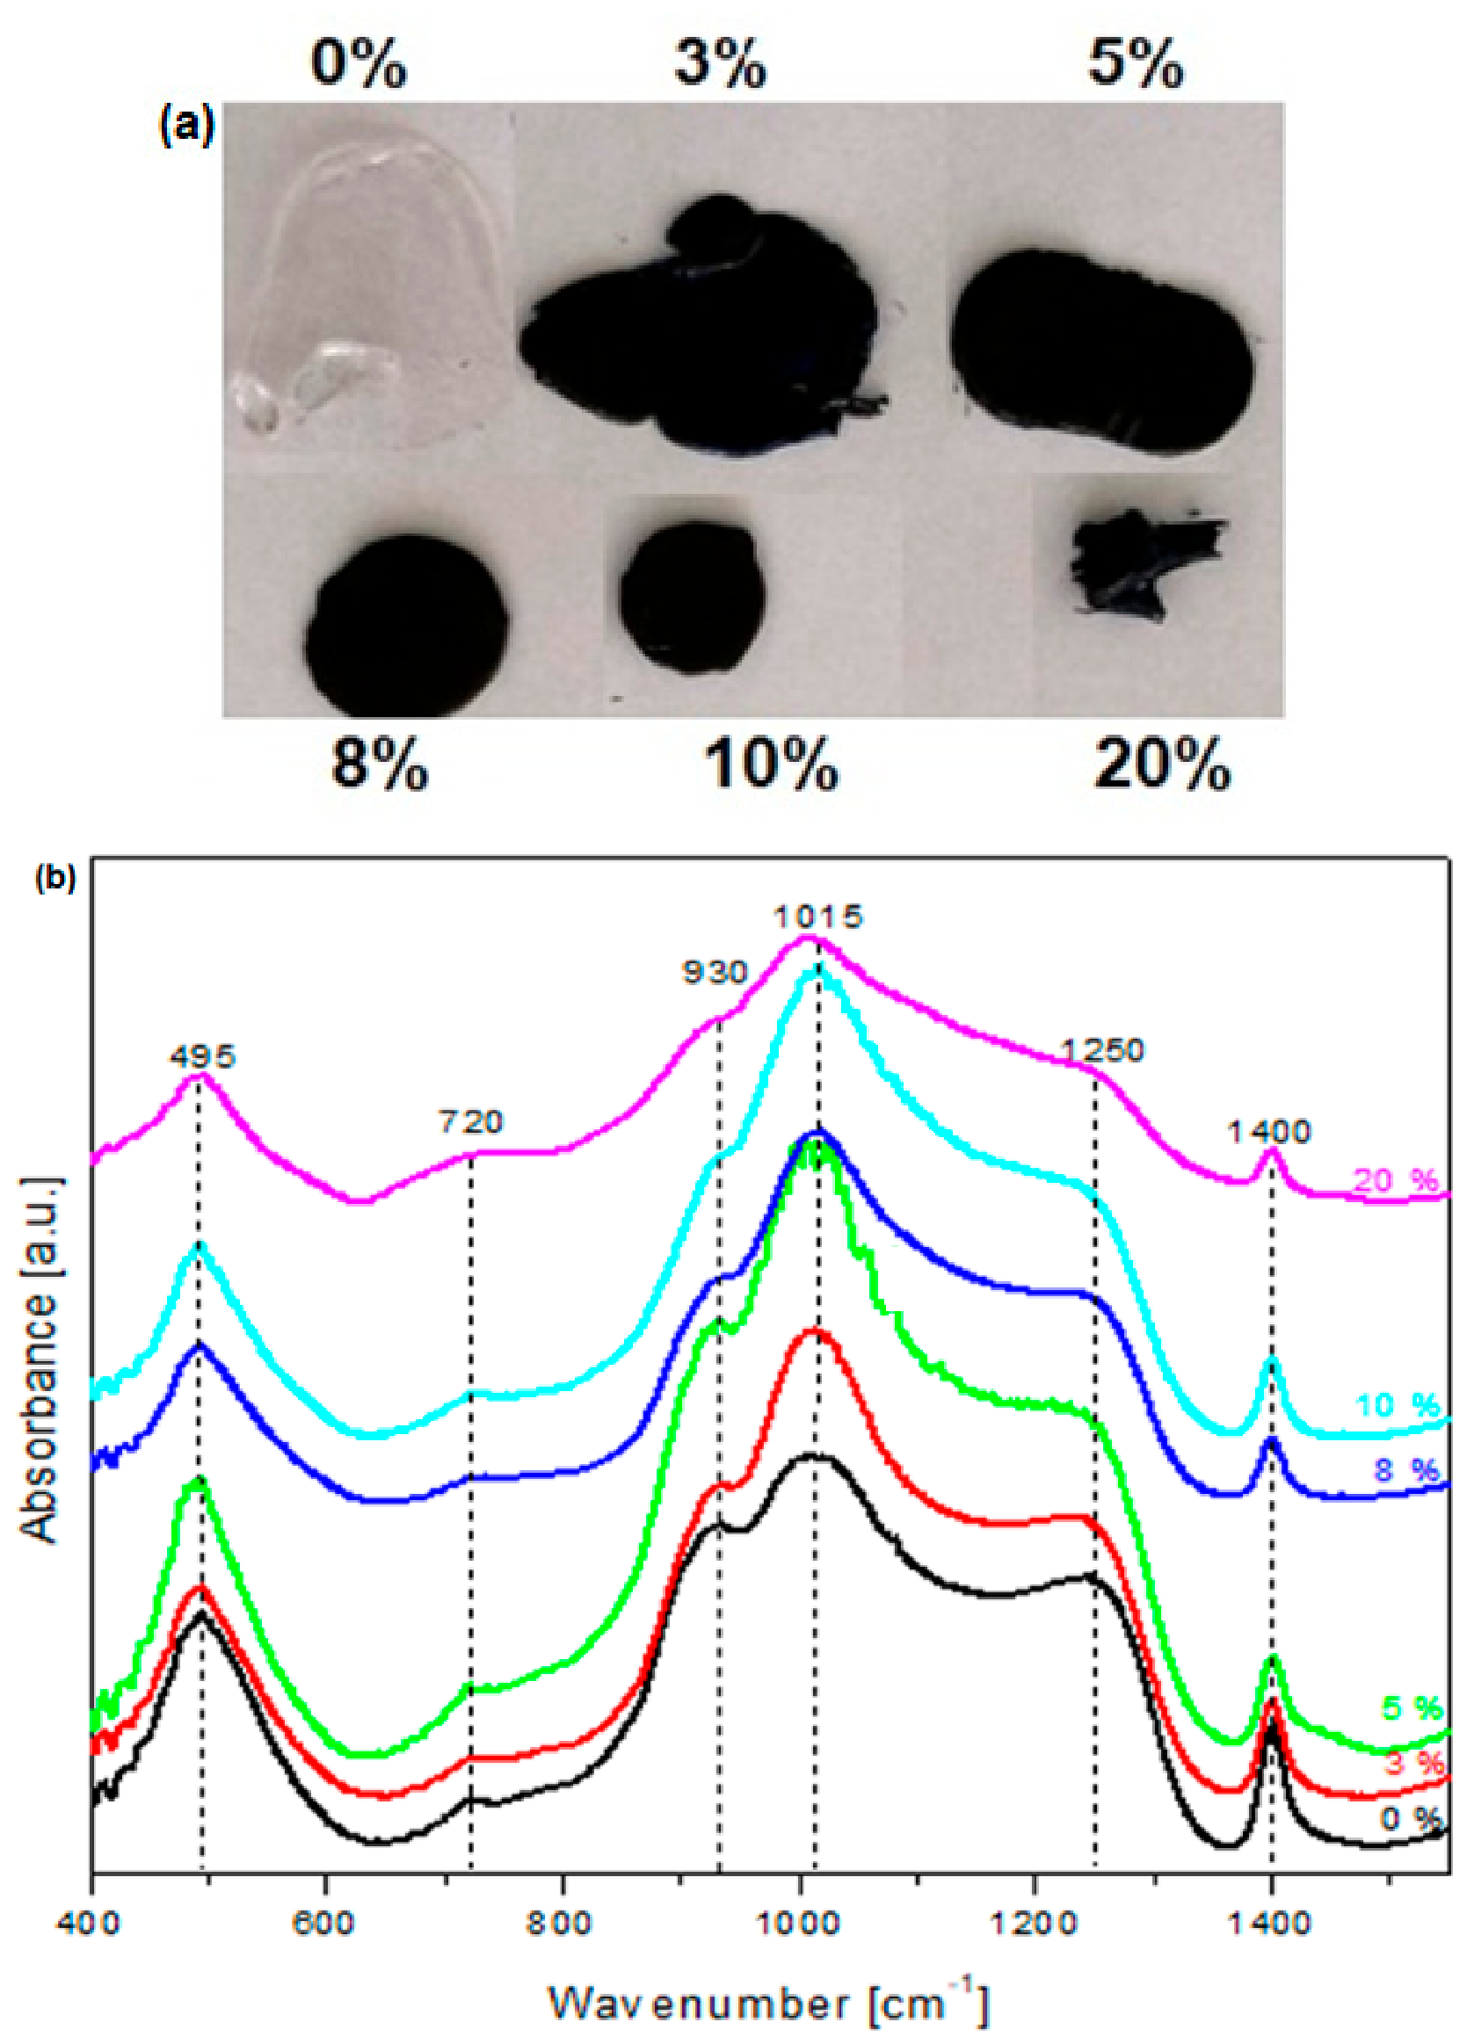
The vitreous system in the xWO3·(100 − x)(NH4)2HPO4 composition, where x = 0, 3, 5, 8, 10, and 20% moles of WO3, was prepared using as starting materials WO3 and (NH4)2HPO4 powders. The substances in stoichiometric proportions were weighed on an analytical balance with four decimal places. The weighed powders of tungsten trioxide and ammonium hydrogen phosphate were mixed in an agate mortar and finely ground. The finely ground mixture was placed in a ceramic crucible, and then, it was introduced into an electric furnace set at a temperature of 700 °C. After about 10 min, the melt was quickly poured onto a stainless-steel plate at room temperature and then pressed with another steel plate. The obtained samples were photographed and can be seen in Figure 1a.
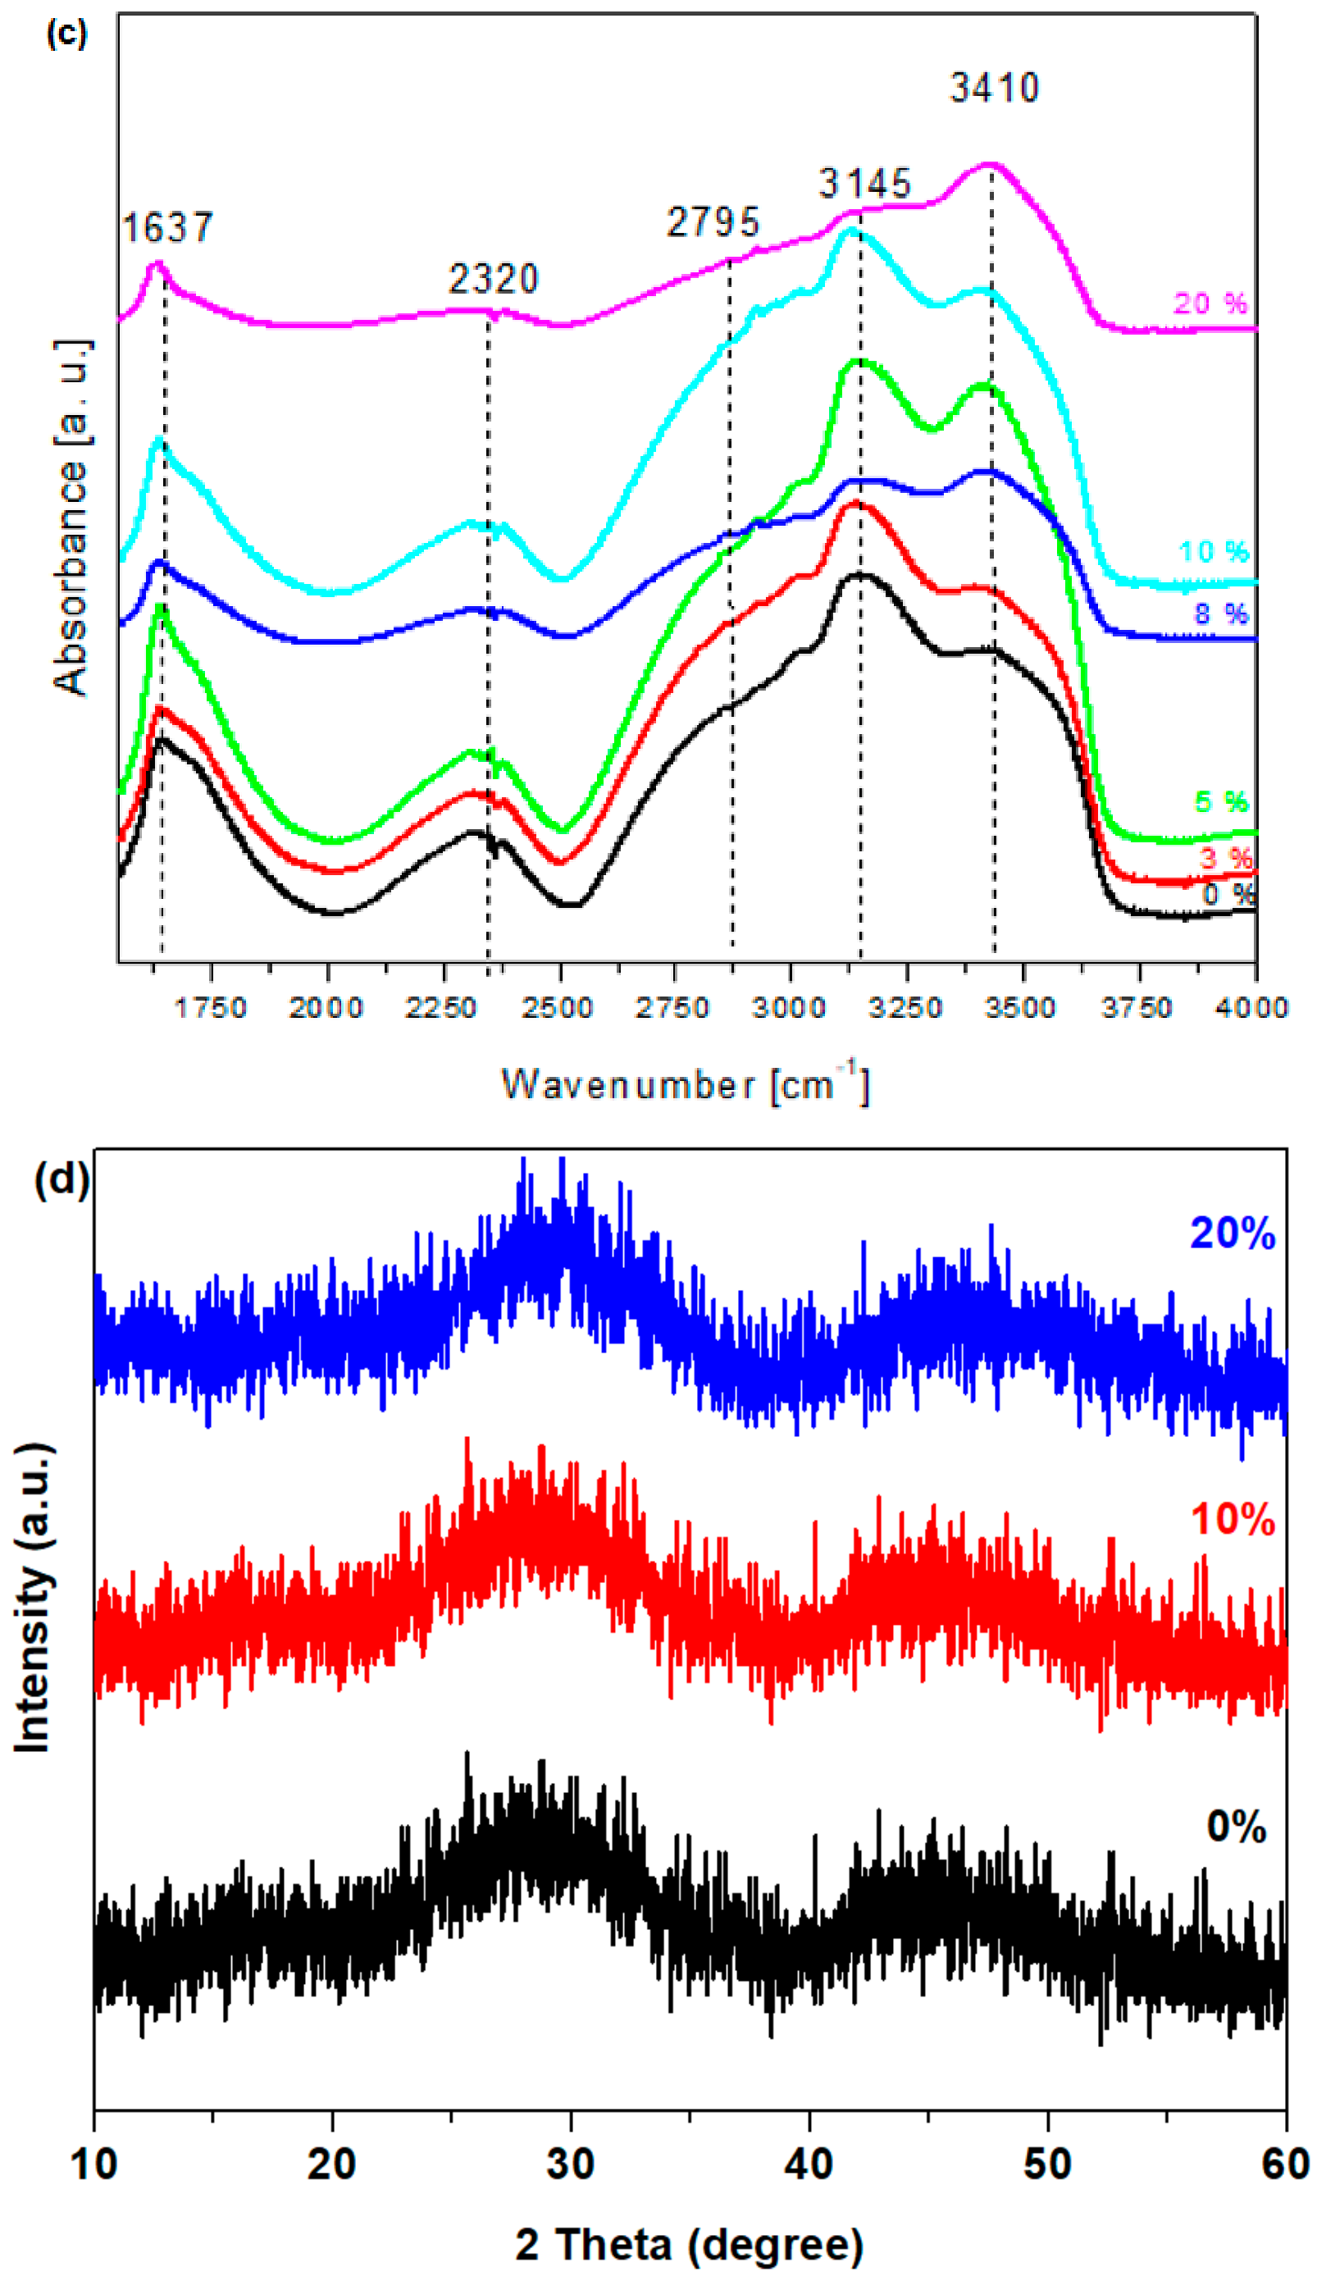
Figure 1.
(a) The images, (b,c) FTIR spectra in the region situated between the ranges of (b) 400 – 1550 cm−1 and (c) 1550 – 4000 cm−1, and (d) XRD data of the prepared samples in the xWO3·(100 − x)(NH4)2HPO4 composition.
The expression xWO3·(100 − x)(NH4)2HPO4 represents the initial composition of the starting materials rather than the actual composition of the final melt after thermal treatment. We acknowledge that the decomposition of ammonium hydrogen phosphate, accompanied by the release of NH3 and H2O, may alter the composition of the material during heating. The formula is therefore used to describe the precursor composition and should not be interpreted as evidence of the final melt composition.
The CuO-containing vitreous sample in the 3CuO·5WO3·92(NH4)2HPO4 composition was prepared using the same general melt-quenching procedure as the other investigated compositions, with CuO incorporated into the starting batch according to the nominal composition. Although CuO was used as the starting precursor, the oxidation state of copper in the final vitreous matrix was not directly determined. Therefore, the possible presence of different copper oxidation states cannot be excluded.
2.2. Methods
X-ray diffraction (XRD) measurements were performed on powdered samples using a XRD-6000 diffractometer (Shimadzu Corporation, Kyoto, Japan) with Cu Kα radiation (λ = 1.5406 Å) to investigate the structure of the prepared materials. The patterns were recorded over a 2θ range of 10–60°, with a step size of 0.02° and a counting time of 1 s per step.
For the study of samples by Fourier Transform Infrared Spectroscopy (FTIR), the fine powders of the samples were mixed with KBr in an agate mortar in a mass ratio of 1:150 and vacuum pressed. The resulting pellets were used for recording of infrared spectra FTIR spectra, performed at room temperature in the spectral range of 400–4000 cm−1 using a FT/IR-6200 spectrometer (JASCO Corporation, Tokyo, Japan).
The ultraviolet–visible (UV-Vis) spectra were recorded at room temperature in the 200–1000 nm range using a Lambda 45 UV-Vis spectrometer (PerkinElmer, Waltham, MA, USA), in absorption, and then we determined several important parameters, including the optical gap energy and the Urbach energy for the tungsten phosphate system.
The electrochemical properties of the tungsten phosphate materials were investigated by cyclic voltammetry (CV), linear sweep voltammetry (LSV), and electrochemical impedance spectroscopy (EIS) measurements using a PGSTAT 302 N potentiostat/galvanostat controlled by the NOVA 1.11 software. All measurements were performed in a three-electrode electrochemical cell. The prepared tungsten phosphate materials served as the working electrode, a platinum electrode was used as the counter electrode, and an Ag/AgCl electrode (KCl) served as the reference electrode. A KOH solution of 1 M concentration was used as the electrolyte under alkaline conditions, while acidic measurements were conducted in H2SO4 solutions with concentrations of 0.5 M, 2.5 M, or 5 M H2SO4. For voltammetric measurements, a scan rate of 10 mV/s was used. The impedance spectra were recorded over a frequency range from 0.1 Hz to 104 Hz.
The electrode dimensions used for cyclic voltammetry (CV) and electrochemical impedance spectroscopy (EIS) measurements were ~12 × 12 × 1.2 mm, with an exposed geometric area of ~1.73 cm2 and an active material mass of ~600 mg.
The electrochemical response of the tungsten phosphate material was investigated in H2SO4 electrolytes with concentrations of 0.5, 2.5, and 5 M. The differences observed in the voltammetric profiles and Tafel slope reflects the combined effects of electrolyte concentration and electrode–electrolyte interactions under the experimental conditions.
The experimental impedance spectra were fitted using an equivalent electrical circuit. The goodness of fit was evaluated using the chi-square (χ2) parameter, which provides an indication of the agreement between the experimental data and the simulated impedance response.
The impedance spectra provide information about the overall resistive and capacitive response of the investigated electrochemical systems. The high-frequency intercept on the real axis is associated with the uncompensated ohmic resistance of the system, which includes contributions from the electrolyte and measurement setup.
3. Results and Discussion
3.1. The Analysis of FTIR Data
The FTIR spectra and XRD data of the prepared glass system with the composition xWO3·(100 − x)(NH4)2HPO4, where x = 0, 3, 5, 8, 10 and 20 mol % WO3, are shown in Figure 1b–d. The XRD patterns indicate that all investigated samples exhibit predominantly amorphous structures, as evidenced by the absence of well-defined diffraction peaks and the presence of broad diffuse halos.
The IR spectra of the studied system show six distinct bands in the range between 400 and 1600 cm−1. The hygroscopic character of the obtained samples is best observed in the range of 1600–4000 cm−1, where the presence of broad and intense FTIR bands is evidenced. These IR bands are due to the symmetrical stretching vibrations of the O-H groups and the deformation vibrations of the H-O-H angles, but also the vibrations of the P-O-H bonds.
The conventional method for the characterization of the phosphate units in the vitreous network is to use the Qn structural units, where n = 0, 1, 2, 3, and represents the number of bonded or bridged oxygen atoms. The identification of these FTIR bands is achieved by the comparing of the recorded spectra with the available literature [13,14,15].
The first region of FTIR bands situated between 400 and 600 cm−1 is characteristic of the bending vibrations of O=P-O and/or O-P-O bonds in the Q1 units. The second region between 600 and 1350 cm−1 is due to the presence of deforming vibrations of the P-O-P bonds. The last region between 1350 and 1500 cm−1 is assigned to vibrations of non-bridging PO2 units [16,17,18,19].
Looking at the intermediate frequency region (600–1350 cm−1), the envelope of this region is resolved into four component bands located around the values of 720, 930, 1015, and 1250 cm−1. The IR band around the value of 720 cm−1 is due to the symmetric stretching vibrations of the P-O-P bonds within the Q2 structural units, and the FTIR band at 1250 cm−1 is due to the stretching vibrations of the P=O bonds or the asymmetric stretching vibrations of the non-bridging O-P-O bonds within the Q2 units. At the same time, the most intense FTIR band in the mentioned range, i.e., the one at 1015 cm−1, corresponds to the asymmetric stretching vibrations of the P-O-P bonds in the Q0 units linked to the metaphosphate rings [20,21,22]. The asymmetric stretching vibrations of the P-O-P bonds in PO2 having the Q2 structural units are highlighted by the presence of the FTIR band at 930 cm−1 [23]. The obvious FTIR band at 1400 cm−1 is attributed to the characteristic stretching mode of the P=O double bond and to vibrations of non-bridging PO2 units [24].
By adding of high levels of dopant, the intensity of the FTIR band centred at 495 cm−1 decreases, and the FTIR band located at 720 cm−1 becomes well-formed for the sample with 20% WO3. This structural evolution highlights the appearance of short-chain pyrophosphate structural units at high dopant levels.
The FTIR bands in the phosphate vibration region are attributed to the vibrational modes of phosphate structural units. The FTIR band observed at approximately 1015 cm−1 is attributed mainly to P-O stretching vibrations associated with the metaphosphate structural units, characterized by Q2 phosphate tetrahedral forming chains and rings. The FTIR band around 930 cm−1 may be assigned with P-O stretching vibrations in orthophosphate and pyrophosphate units, corresponding to Q0 and Q1 phosphate tetrahedral, respectively. These assignments suggest the coexistence of different phosphate structural environments within the vitreous network.
In the FTIR spectra, we find maxima specific to orthophosphate (FTIR band centred at 930 cm−1) and metaphosphate (band located at 1015 cm−1) units. The position of both FTIR bands shifts to lower wavenumbers by the addition of higher tungsten trioxide contents in the host matrix. This can be explained considering the conversion of ortho- and metaphosphate units into pyrophosphate units by doping. The number of metaphosphate structural units reaches a maximum value for the sample with 5% WO3 and has a minimum value for the sample with 8% WO3.
The most intense FTIR band in the recorded spectra is the one located at 1015 cm−1. This FTIR band increases in intensity up to x = 5% mol WO3, after which it decreases again in intensity, even though it remains the strongest band in the recorded spectra.
A trend towards higher wavenumbers is observed for the FTIR band centred at 1250 cm−1 by adding higher dopant levels in the host matrix. An increase in the intensity of this FTIR band is also evident for samples with x = 3 and 5% WO3. For the sample with 5 mol% WO3, the intensity of the FTIR bands located in the range between 950 and 1350 cm−1 reaches maximum values. This region corresponds to the metaphosphate structural units and the vibrations of the P=O bonds. On the opposite side are the samples with 8 and 20%.
A narrow absorption band is observed at approximately 1400 cm−1 in all spectra. This band is attributed to the N–H bending vibrations of residual NH4+ groups originating from the (NH4)2HPO4 precursor, which were not completely removed during melting [25]. Its intensity is the highest for the undoped glass and generally decreases with the increase in WO3 content, suggesting a lower amount of residual ammonium in the WO3-containing glasses. Therefore, the presence of small amounts of residual NH4+ in the glass network cannot be excluded, and its possible contribution to the structural properties of the samples should be taken into account.
The FTIR band centred at 1640 cm−1 is due to the presence of O-H bonds in P-O-H, and the bands at around 3145 and 3420 cm−1 are attributed to the physic bound water and hydroxyl groups. The intensities of these bands reach maximum values for the 5 and 20% samples. The intensity of the FTIR band centred at 1640 cm−1 increases for the 5 and 20% sample, indicating an increase in the number of vibrations of the P-O-H bonds. The intensity of the FTIR bands centred at 3145 and 3410 cm−1 increase with doping reaching the maximum value for the 5 and 20% samples and have a minimum value for 8% WO3.
Therefore, a mechanism responsible for these structural developments can be explained as follows: (i) at low dopant concentrations of up to 5% WO3, a gradual conversion of orthophosphate units into metaphosphate occurs and the number of P=O bonds increases and reaches a maximum value for the sample with 5%; (ii) for the sample with x = 8% WO3, the number of metaphosphate units, the number of vibrations due to P=O bonds and the O-P-O angles decreases; (iii) for dopant contents with x ≥ 10% WO3, the degree of polymerization of the phosphate matrix increases due to the appearance of shorter pyrophosphate structural units.
3.2. Ultraviolet–Visible (UV-Vis) Spectroscopy
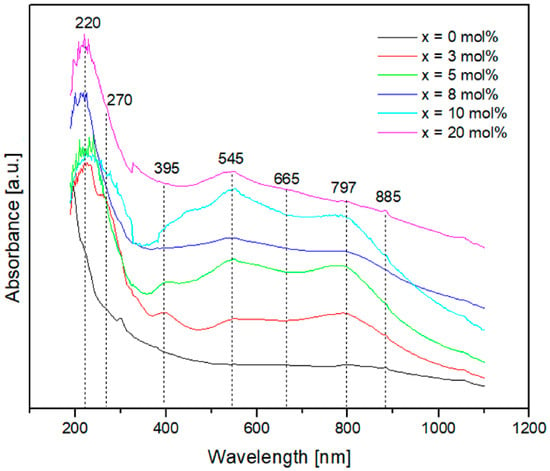
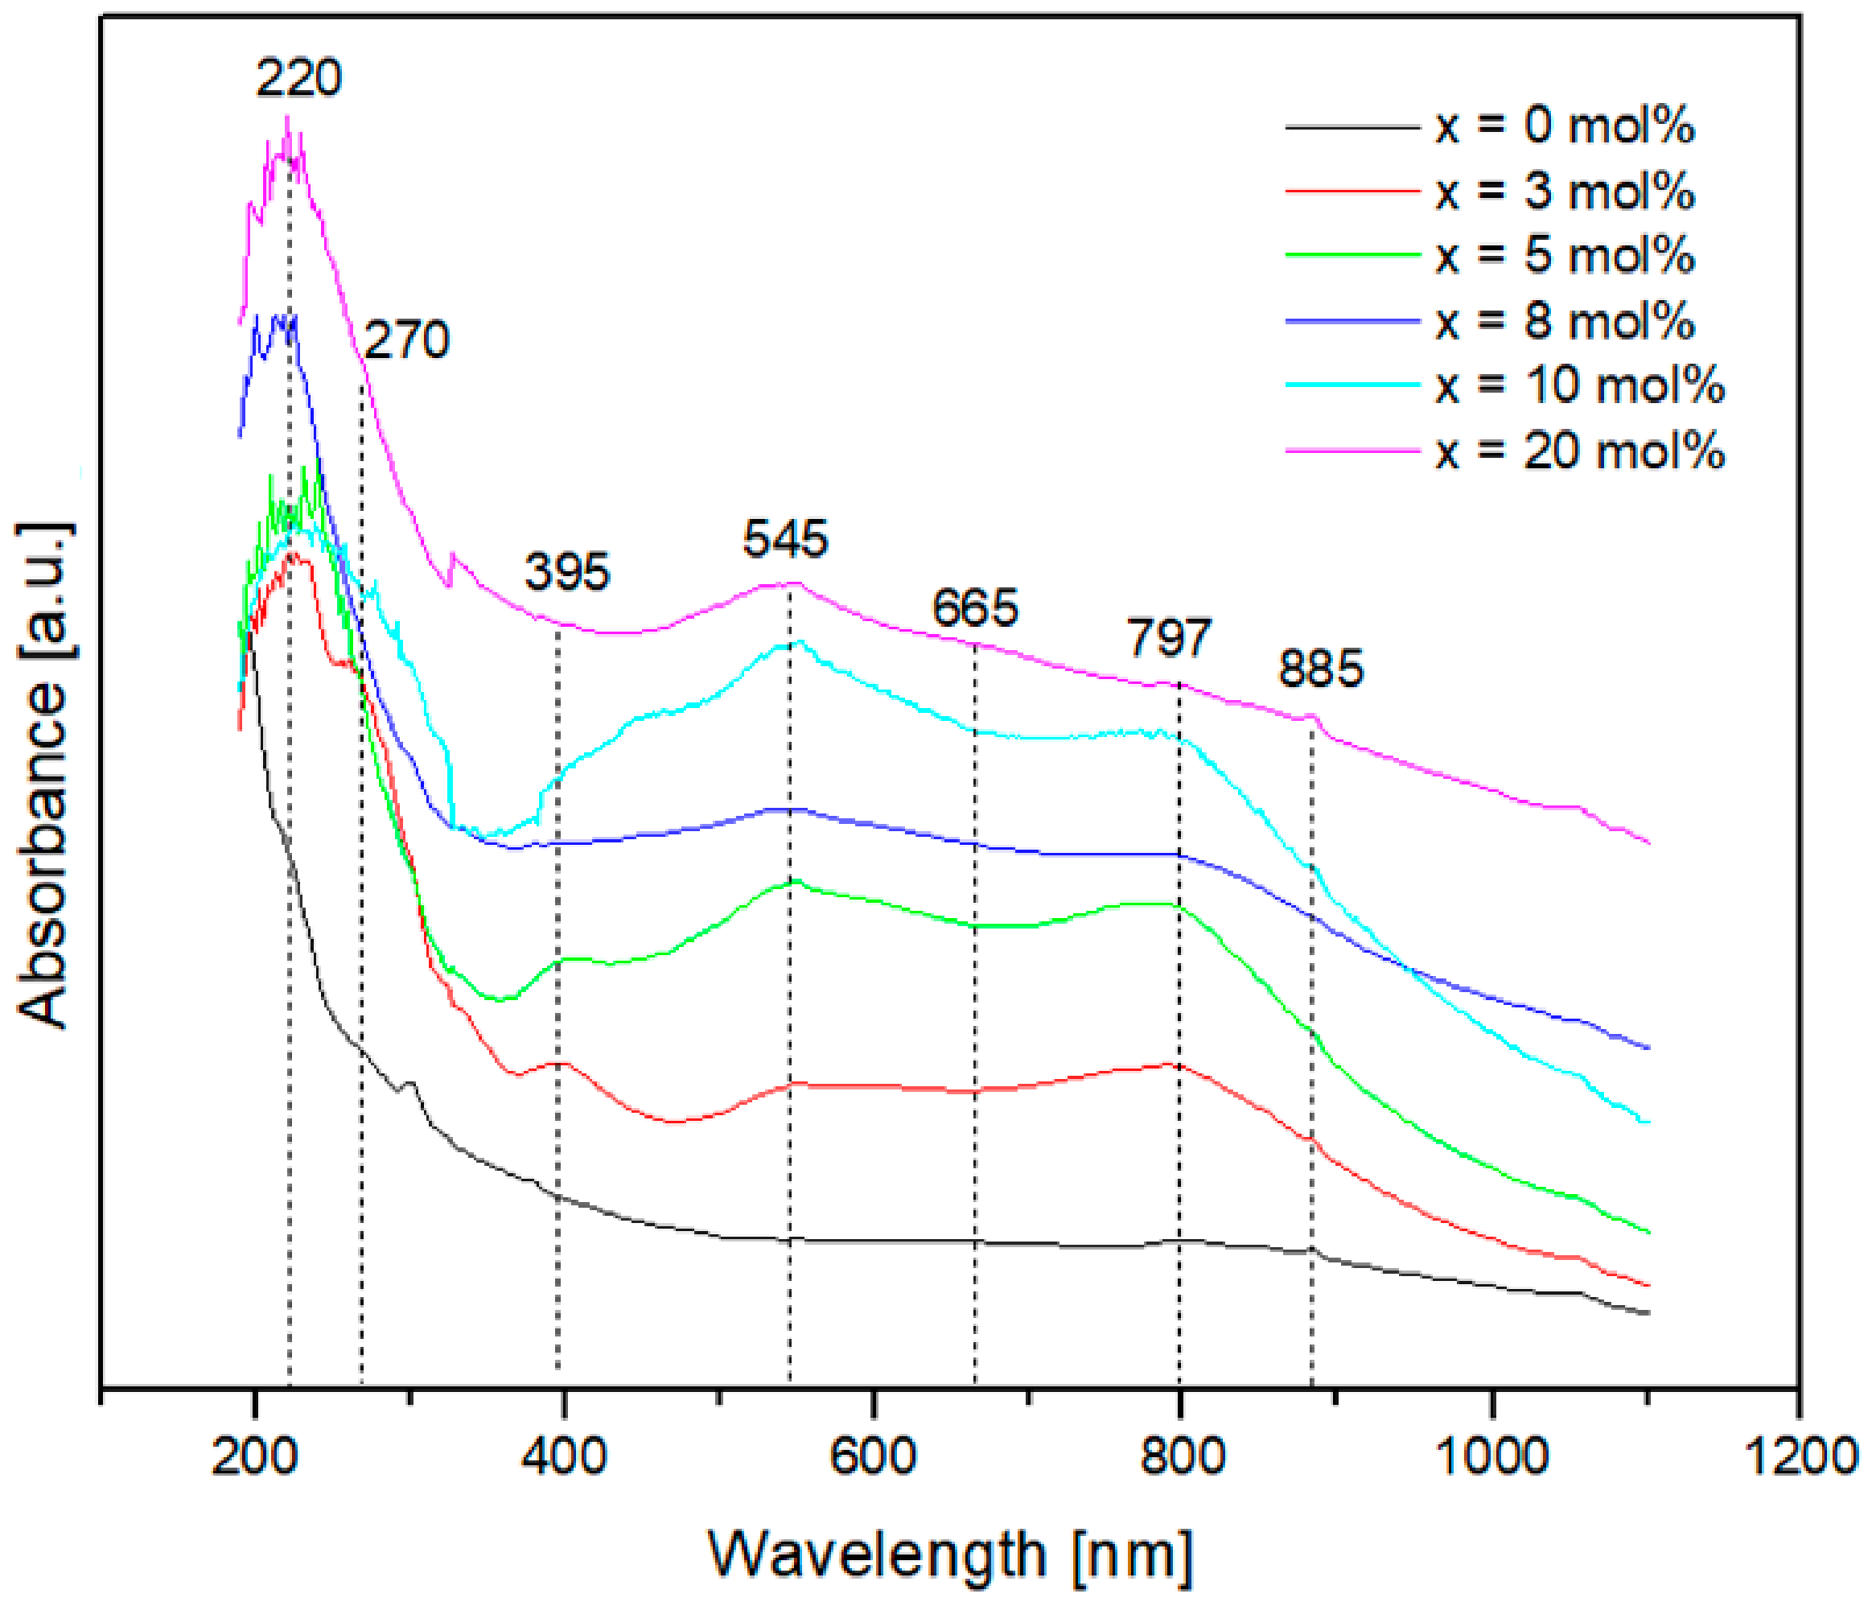
The UV-Vis spectra recorded for the vitreous system with the xWO3(100 − x)·(NH4)2HPO4 composition, where x = 0, 3, 5, 8, 10 and 20 mole% WO3, show obvious variations with the increase in WO3 content, as can be seen in Figure 2.
Figure 2.
UV-Vis spectra of the prepared samples.
All samples exhibit strong absorption in the UV region, with bands at approximately 220 and 270 nm, which are commonly attributed to O2− - W6+ ligand-to-metal charge-transfer transitions within the WO6 units, overlapping with the fundamental absorption edge of the phosphate glass network. The undoped glass (x = 0 mol%) shows no significant absorption in the visible and near-infrared regions. In contrast, the WO3-containing glasses exhibit broad absorption bands centred at approximately 545 and 797 nm, accompanied by weaker features at about 395, 665, and 885 nm, whose overall intensity generally increases with the WO3 content. Since these bands are absent in the undoped glass, they can be associated with the tungsten species. Such absorption bands in the visible and near-infrared regions are commonly attributed in the literature to the presence of W5+ ions, arising from d–d transitions and from W5+ - W6+ intervalence charge transfer (small polaron hopping) [20,21,22,23]. However, since the oxidation states of tungsten were not directly determined in this work (e.g., by XPS or EPR), the presence of W5+ is discussed in this paper only as a possibility.
In the case of the studied system, the presence of the UV-Vis bands at 220 and 270 nm highlights the presence of tungsten in the W6+ form, while the presence of the other states is associated as follows: the band at 395 nm is due to the trivalent state of tungsten (W3+, d3), the bands at 545 and 665 nm emphasize the presence of W4+ and the bands at 797 and 885 nm, respectively, correspond to the presence of tungsten in the W5+ state [20,21,22,23].
By the gradual addition of tungsten trioxide up to 5 mol% in the studied phosphate system, increasing trends of the UV-Vis bands centred at 270, 395, 545, and 797 nm corresponding to the W6+, W3+, W4+, and W5+ ions are observed. Furthermore, by introducing 8% WO3 into the host matrix, the intensity of these UV-Vis bands decreases, then increases for x = 10% and then decreases again. For the samples with x = 8 and 20% WO3, the UV-Vis band centred at 395 nm is not observed, and for the sample with 20%, the band characteristic of the W4+ ions predominates.
The analysis of UV-Vis spectra indicate the presence of characteristic UV-Vis bands of tungsten ions. The results suggest that the addition of high concentrations of WO3 to the samples leads to an increase in the intensity of the characteristic bands of tungsten ions, reaching a maximum for the sample with x = 5% moles of WO3.
3.3. Optical Gap Energy and Urbach Energy
The Tauc method [24] assumes that the absorption coefficient, α, is dependent on the photon energy, , by the following relationship:
where h is Planck’s constant, is the photon frequency, B is a constant, n is a factor that depends on the nature of the electronic transition, and n = 1/2 or 2 for indirect and direct transitions.
For materials with defects, doping, or surface modification that has a significant absorption in this energy range below Eg, the results may be modified and the results are erroneous [24]. These modifications can introduce bandgap states that are reflected in the absorption spectrum as an Urbach tail or Urbach energy, EU, i.e., an additional, broad absorption band. The presence of the Urbach energy influences the Tauc plot and must be considered to determine the bandgap energy.
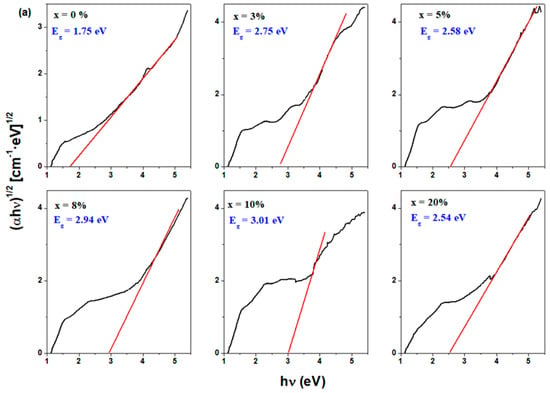
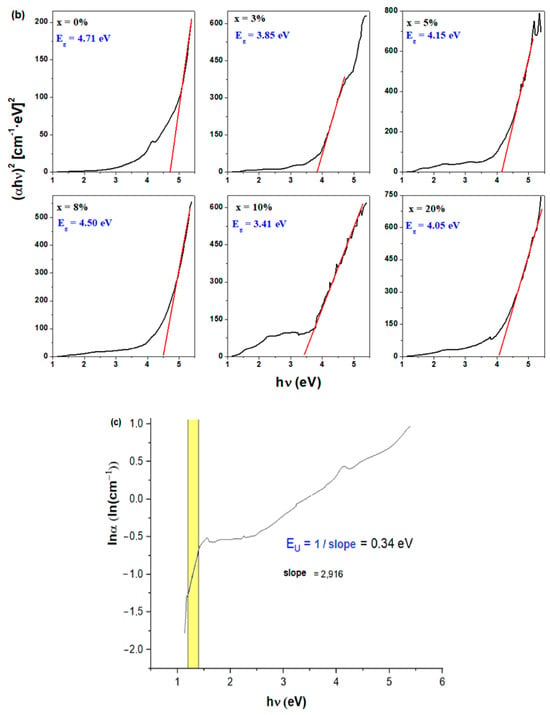
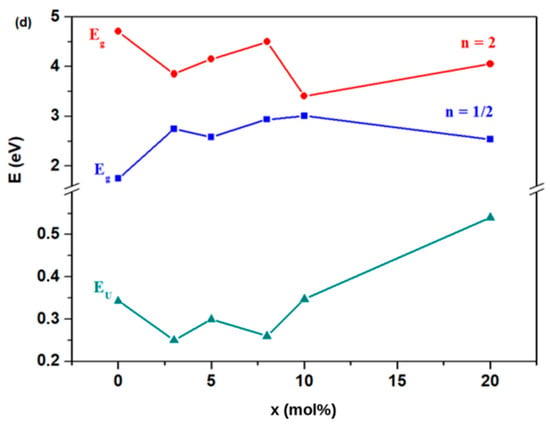
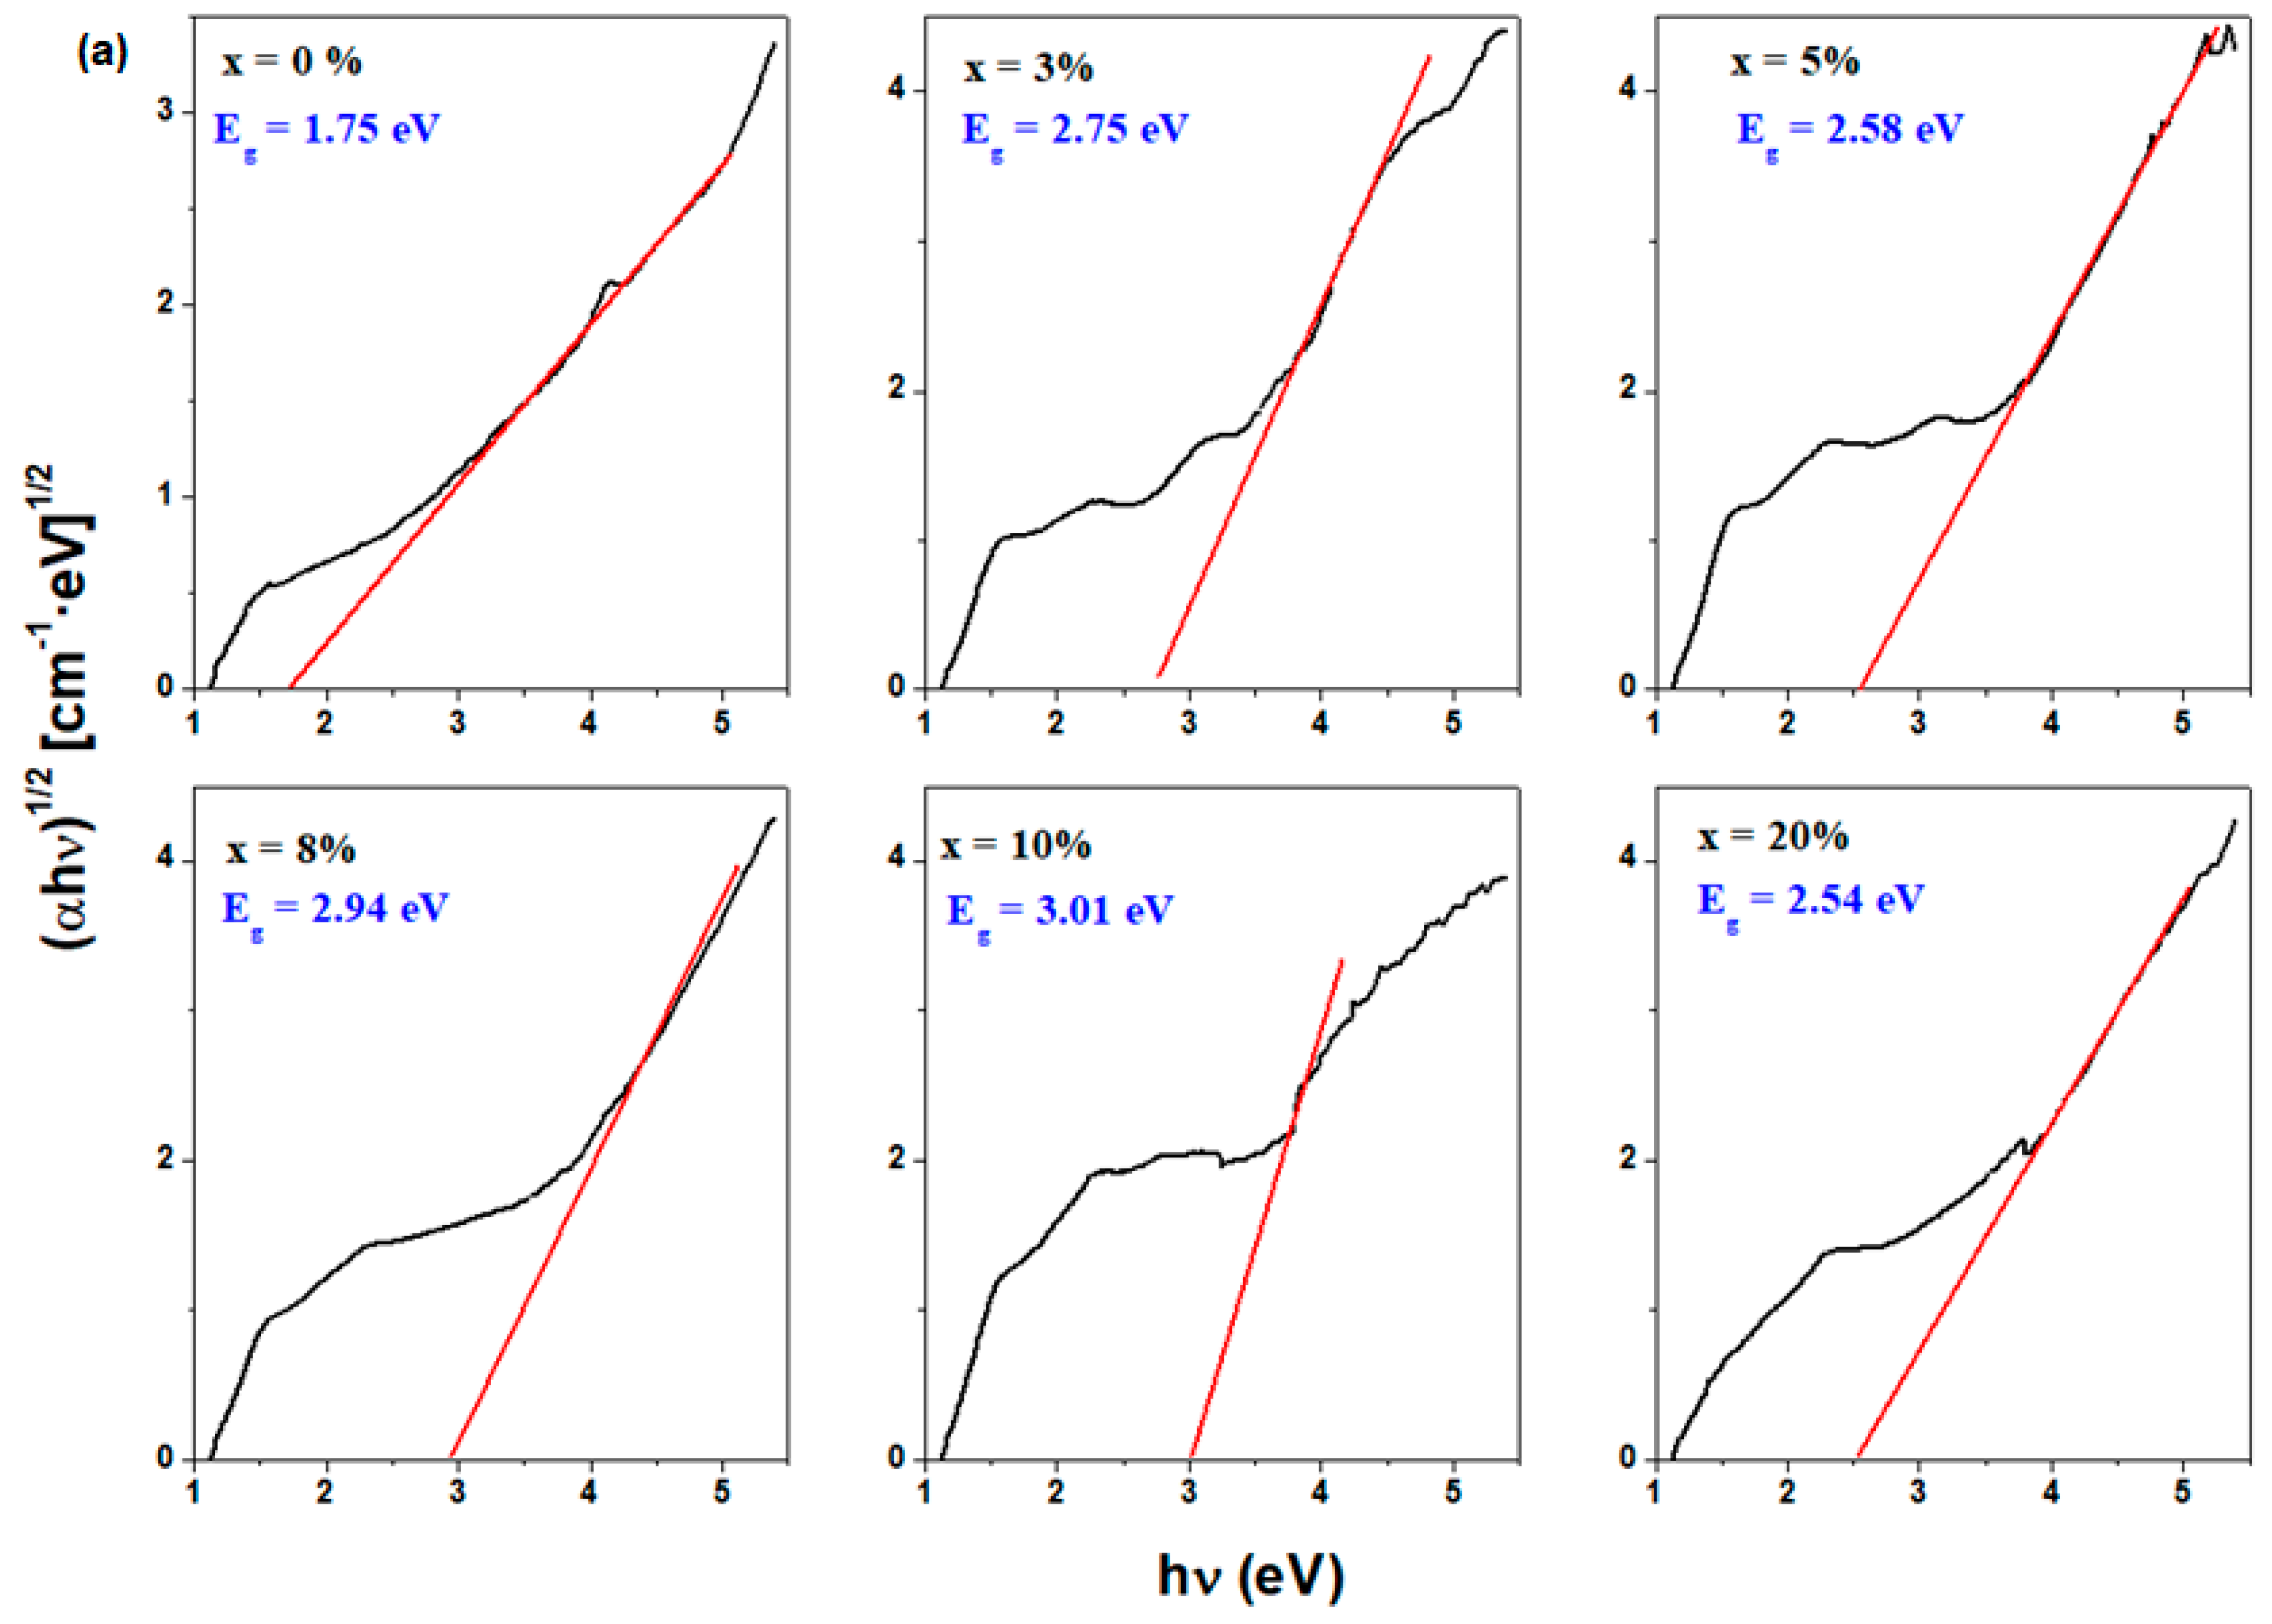
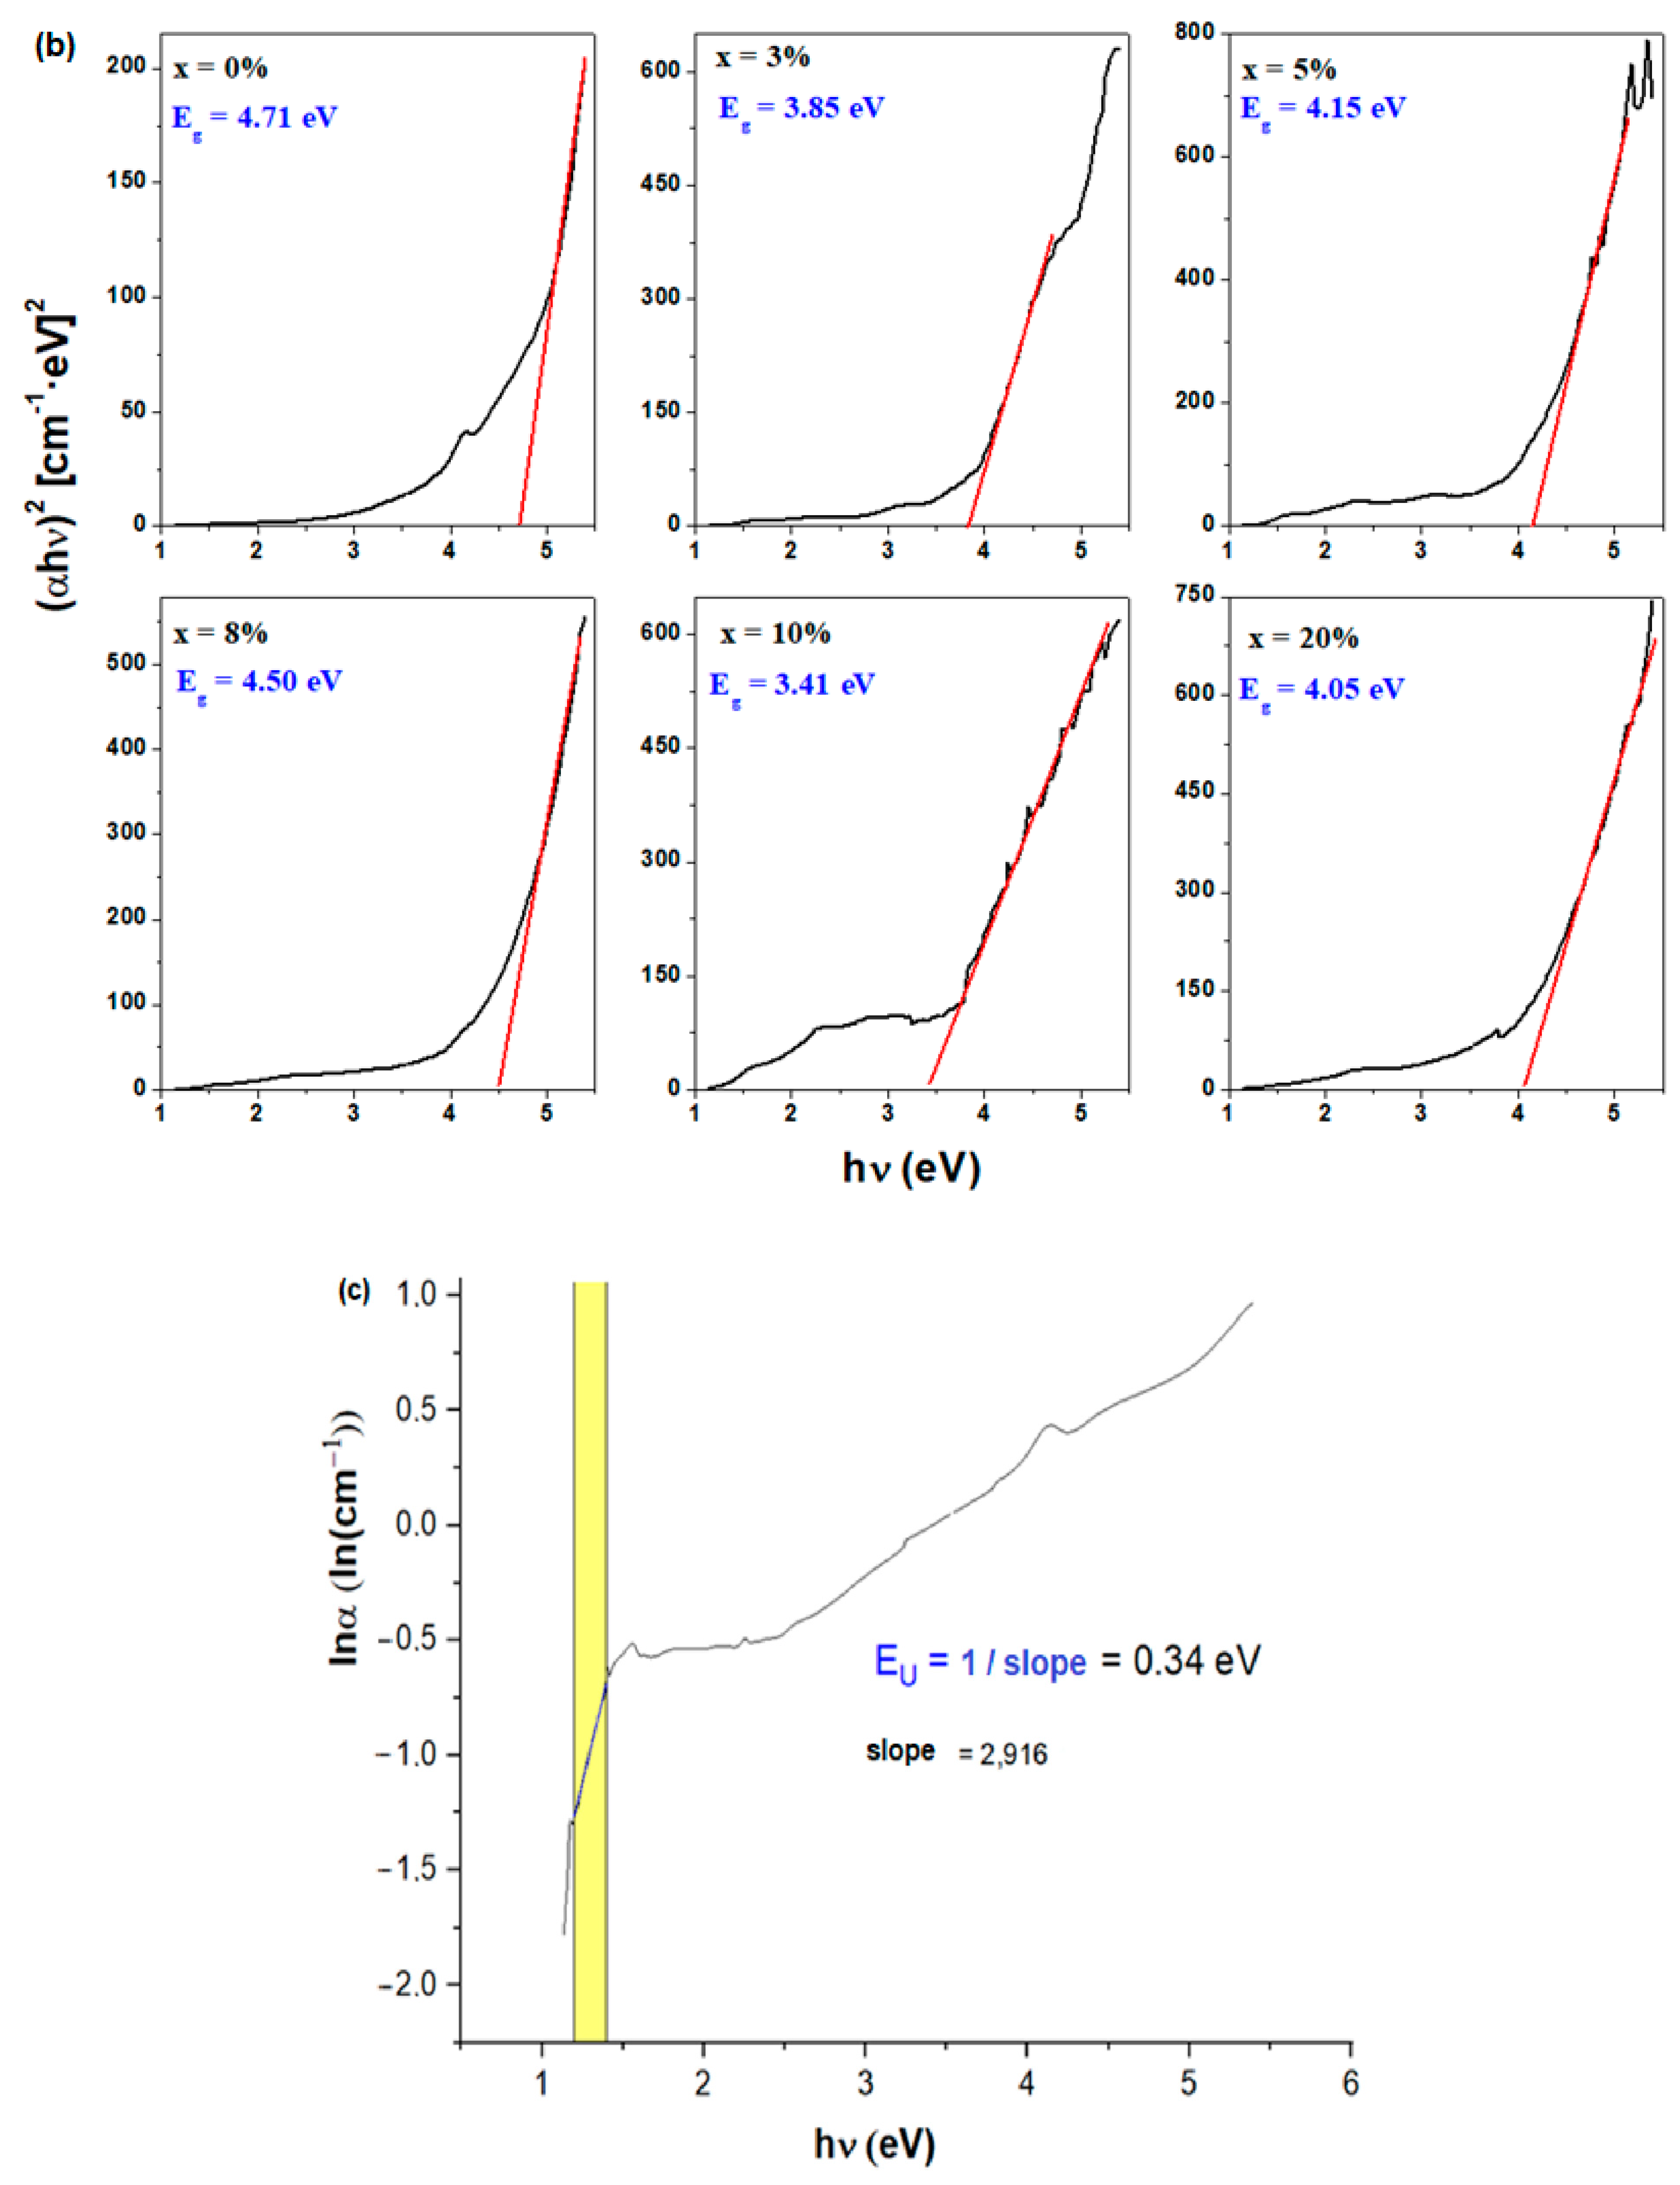
From Figure 3a,b, using UV-Vis spectra, versus and versus were plotted and the optical gap energy, denoted by Eg, was determined. By extrapolating the linear region of the graphs to , the optical gap energy values for the direct and indirect transitions were determined.
Figure 3.
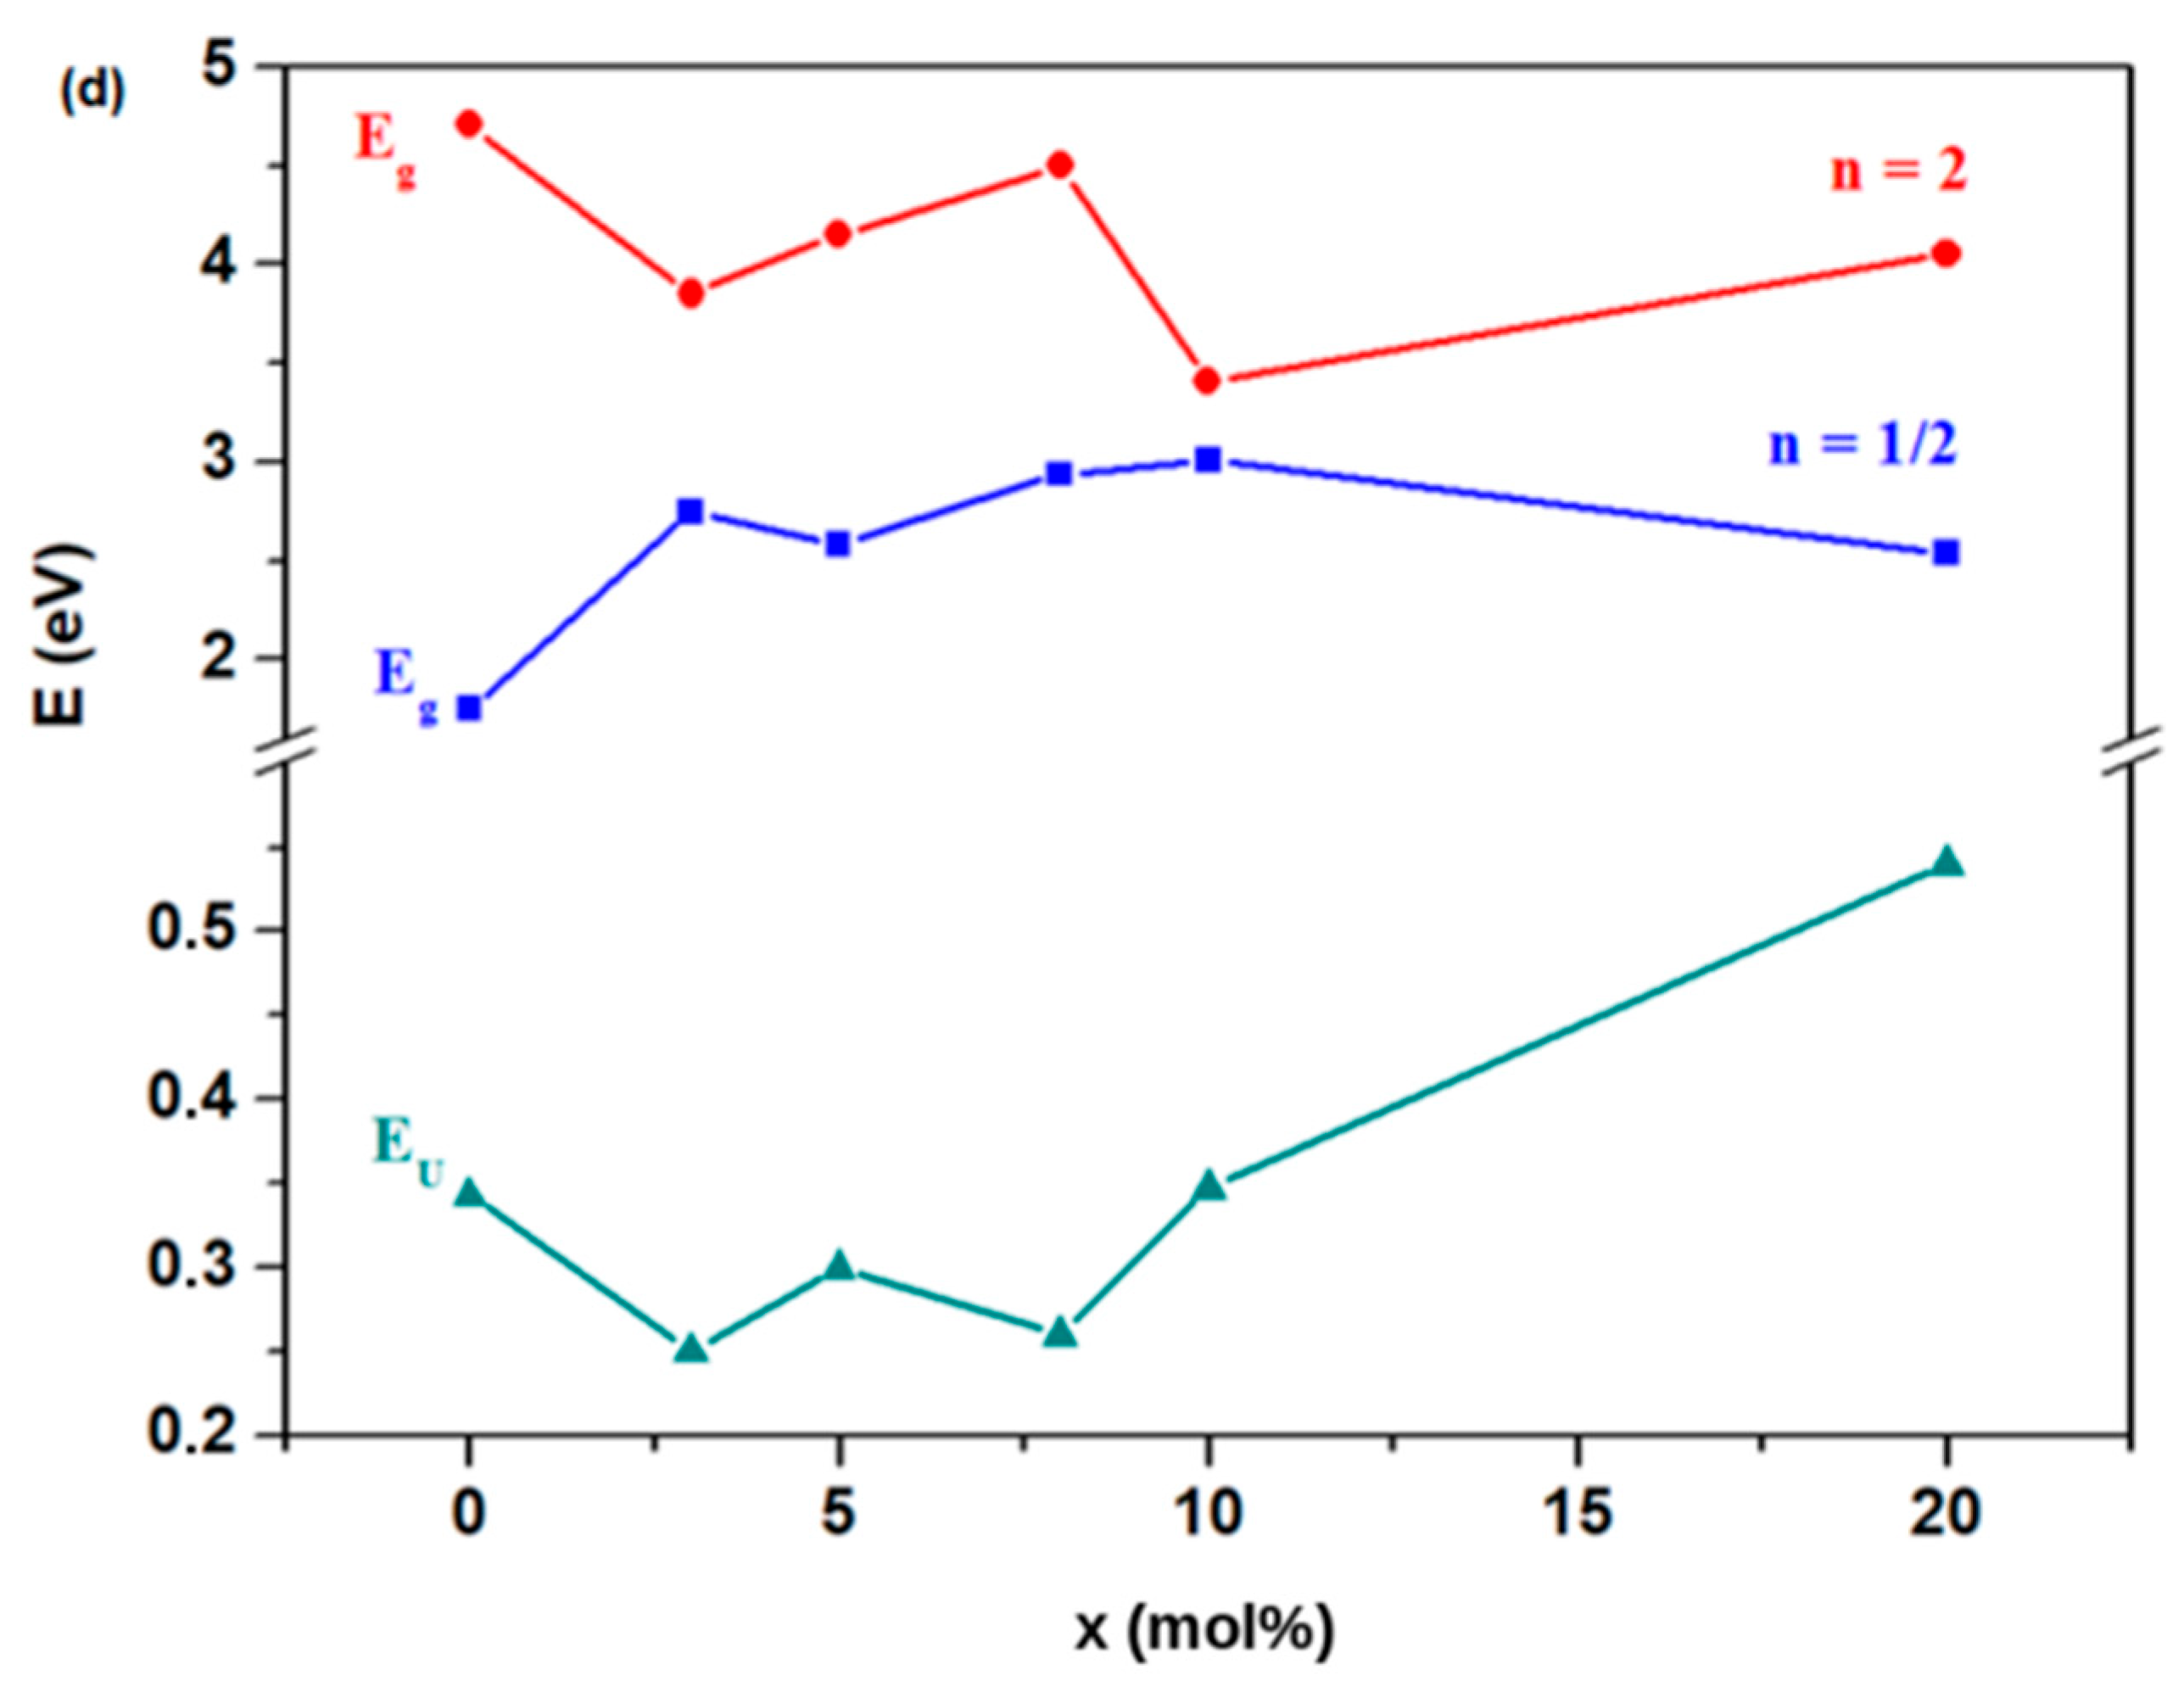
Dependence of (a) (αhν)1/2 and (b) (αhν)2 as a function of hν. (c) Urbach energy plot of the prepared sample. (d) Compositional evolution of the gap energy, Eg, and Urbach energy, EU.
The optical gap energy values for indirect transitions are between 1.75 and 3.01 eV. For direct transitions, the optical gap energy values are in the range between 3.41 eV and 4.71 eV, with lower values for the samples with x = 5 mol% WO3 (having Eg = 2.58 eV) and for 20 mol% WO3 (with Eg = 2.54 eV).
The optical band gap energies for indirect transitions range from 1.75 to 3.01 eV, whereas those for direct transitions range from 3.41 to 4.71 eV (Figure 3). The lowest indirect band gap values were obtained for the samples with x = 5 and 20 mol% WO3 (2.58 and 2.54 eV, respectively), while the lowest direct band gap (3.41 eV) was found for the sample with x = 10 mol% WO3.
The variation in the gap energy values can be understood in terms of lattice defects. Lattice defects originating for example from non-bridging oxygen atoms usually introduce extrinsic energy levels between the bands and consequently reduce the gap energy.
FTIR spectroscopy provides information about phosphate network connectivity, whereas Urbach energy reflects the degree of electronic disorder and the presence of localized states within the optical band gap.
Along the absorption coefficient curve and near the optical band edge, there is an exponential part called the Urbach tail. This exponential tail appears in poorly crystalline, disordered, and amorphous materials because these materials have localized states that extend into the band gap. The spectral dependence of the absorption coefficient, , and the photon energy, is expressed by the empirical Urbach rule through the following equation:
where is a constant and EU represents the band tail energy or Urbach energy.
The Urbach energy depends weakly on the temperature and is interpreted as the width of the band tail due to the localized states in the normal band gap and associated with disordered or poorly crystalline materials.
For the calculation of the Urbach energy, EU, the natural logarithm of the absorption coefficient is plotted against the incident photon energy and then the reciprocal of the linear portion of the resulting curve is calculated. The logarithm of the last equation expressed by the Urbach empirical rule can be written as:
where the slope of the line is 1 / EU.
Therefore, the band tail energy or Urbach energy can be obtained from the slope of the line in the graphical representation of the as a function of the incident photon energy . For the undoped sample, the linear portion (coloured yellow) for which the slope of the line and the Urbach energy value were calculated is shown in Figure 3c. The Urbach energy value was found to be approximately 0.34 eV.
The Urbach energy values of the prepared tungsten phosphate glasses range from 0.25 to 0.54 eV and exhibit a non-monotonic dependence on the WO3 content. The undoped glass shows a relatively high Urbach energy (EU ≈ 0.34 eV), whereas the glasses containing 3–8 mol% WO3 exhibit lower values (0.25–0.30 eV), with only small variations within this compositional range. This decrease suggests that, at low concentrations, WO3 is incorporated into the phosphate network through P-O-W linkages, which increase the network connectivity and reduce the structural disorder.
At higher WO3 contents (x ≥ 10 mol%), the Urbach energy increases almost linearly with the WO3 content. This behaviour is consistent with the depolymerization of the phosphate network evidenced by FTIR spectroscopy (Section 3.1), which increases the number of defects and the degree of structural disorder. These defects introduce localized states near the band edges, which broaden the band tails and thus increase the Urbach energy.
From the compositional evolution of the Urbach energy for the prepared tungsten phosphate system, it is observed that the values obtained for the band tail width are between 0.25 and 0.54 eV. For samples with a lower dopant content, a small variation in the slope is observed, and further for higher concentrations, there is an almost linear behaviour with the addition of larger amounts of tungsten trioxide.
The behaviour of the Urbach energy can be attributed to the increase in the tungsten trioxide content in the tungsten phosphate matrix, which leads to an increase in the number of disordered atoms and defects in the structural units. The disorder and defects introduce delocalized states near the conduction band, which leads to an increase in the width of the Urbach energy tail.
The mechanism responsible for this dependence of the Urbach energy on the composition of the system can be explained as follows: (i) for x ≤ 8 mol% WO3, the Urbach energy values are between 0.25 and 0.3 eV and the samples have a disordered microstructure; (ii) for samples with x ≥ 10 mol% WO3, the Urbach energy values are between 0.347 and 0.54 eV, and they increase with the degree of polymerization, and the slope of this region will increase. For samples with 5, 10, and 20% WO3, the Urbach energy reaches higher values than those found in their analogues. This compositional evolution can be explained based on the fact that there is a higher tendency to convert weak bonds into defects, and as a result, the gap energy decreases.
FTIR data indicate that the 20% sample has the lowest number of stretching vibrations due to the P=O double bonds. This suggests that the addition of excess oxygen introduces the most defects into the host matrix, and as a result, the Urbach energy increases and the gap energy decreases, in agreement with the opto-electronic properties.
The introduction of tungsten trioxide into the phosphate matrix creates structural disorder in the system. The random distribution of dopant in the lattice and the difference between the atomic or ionic radii of the dopant and the lattice-forming atom can lead to fluctuations [26] in the glassy system, which introduce energy levels near the valence band or conduction band in the form of electronic disorder or Urbach energy that could increase when the dopant content increases.
3.4. Cyclic Voltammetry Measurements
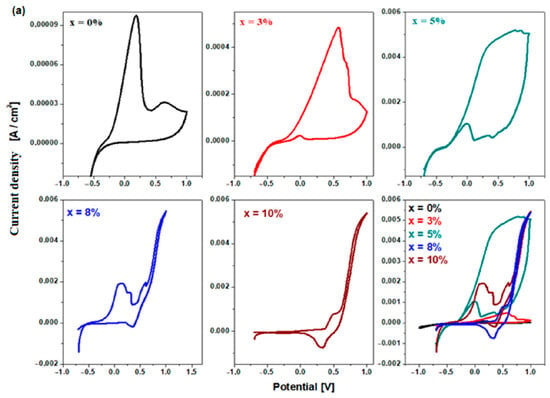
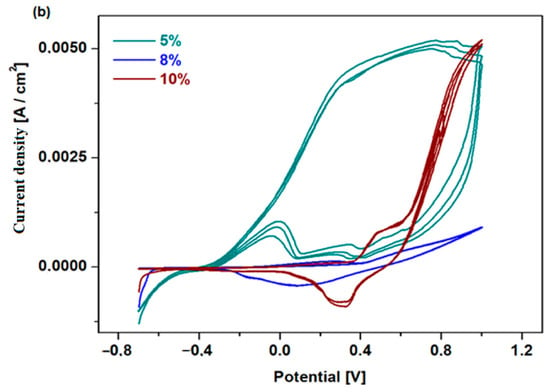
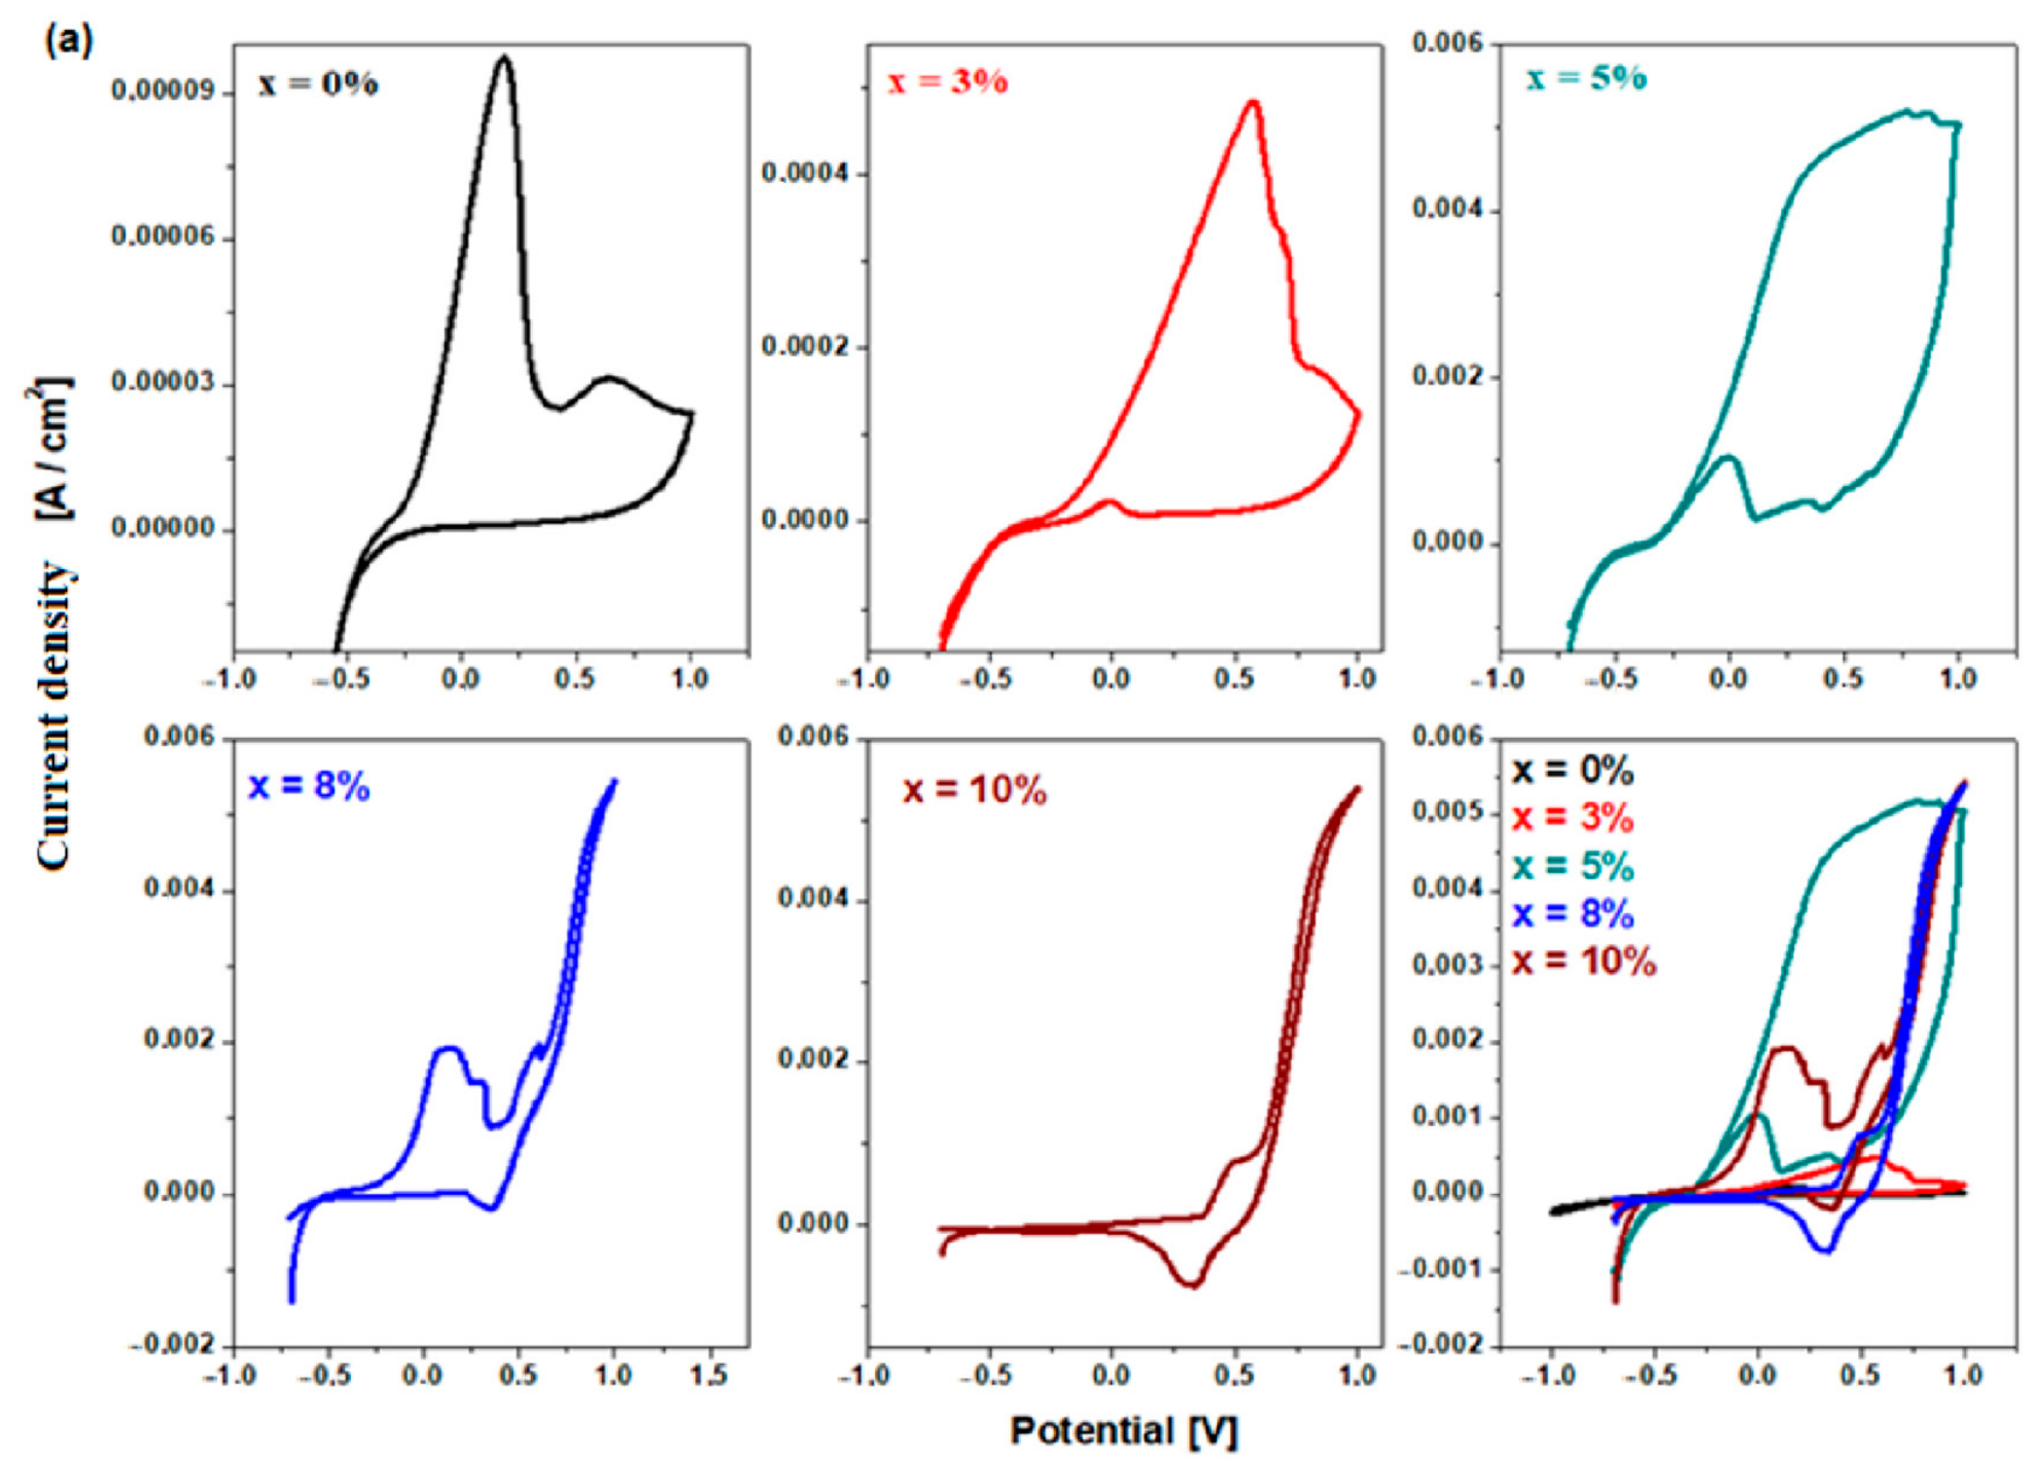
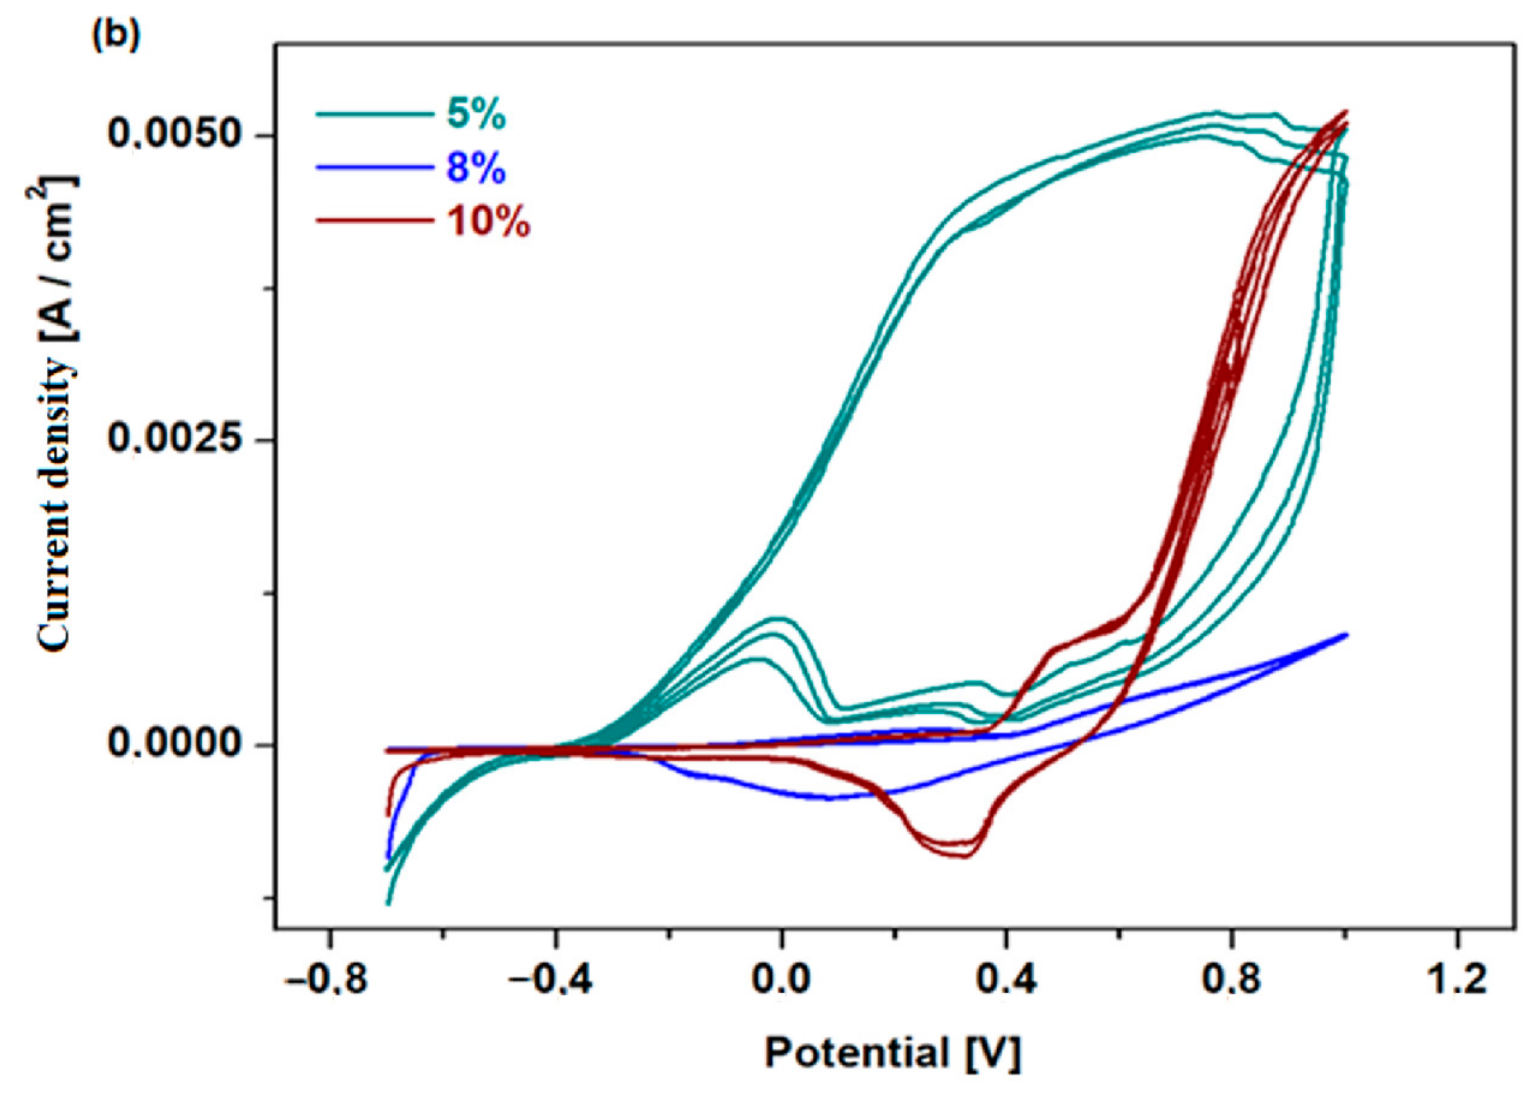
The cyclic voltammograms scanned for one cycle and three cycles of the tungsten phosphate system with the composition xWO3·(100 − x)(NH4)2HPO4, where x = 0, 3, 5, 8, and 10% moles of WO3, recorded in an alkaline medium are shown in Figure 4a,b.
Figure 4.
Cyclic voltammograms of the studied materials as working electrode scanning for (a) one cycle and (b) three cycles.
The shape of the cyclic voltammograms is dependent on the concentration of tungsten trioxide. For the sample with x = 0 and 3% moles of WO3, the cyclic voltammograms have the typical appearance for irreversible systems, and the cyclic voltammogram could not be recorded after scanning three cycles due to advanced corrosion processes in the basic medium. The sample with 5% has a higher degree of irreversibility of the cyclic voltammogram.
The voltammograms recorded for the samples with 8 and 10% WO3 indicate several specific oxidation and reduction peaks. The current response is significantly improved for the 5% WO3 sample both for scanning the first cycle and after scanning of three cycles compared to its analogues.
3.5. Linear Sweep Voltammetry Measurements
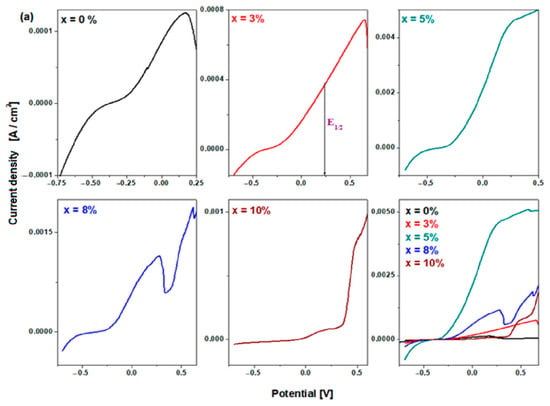
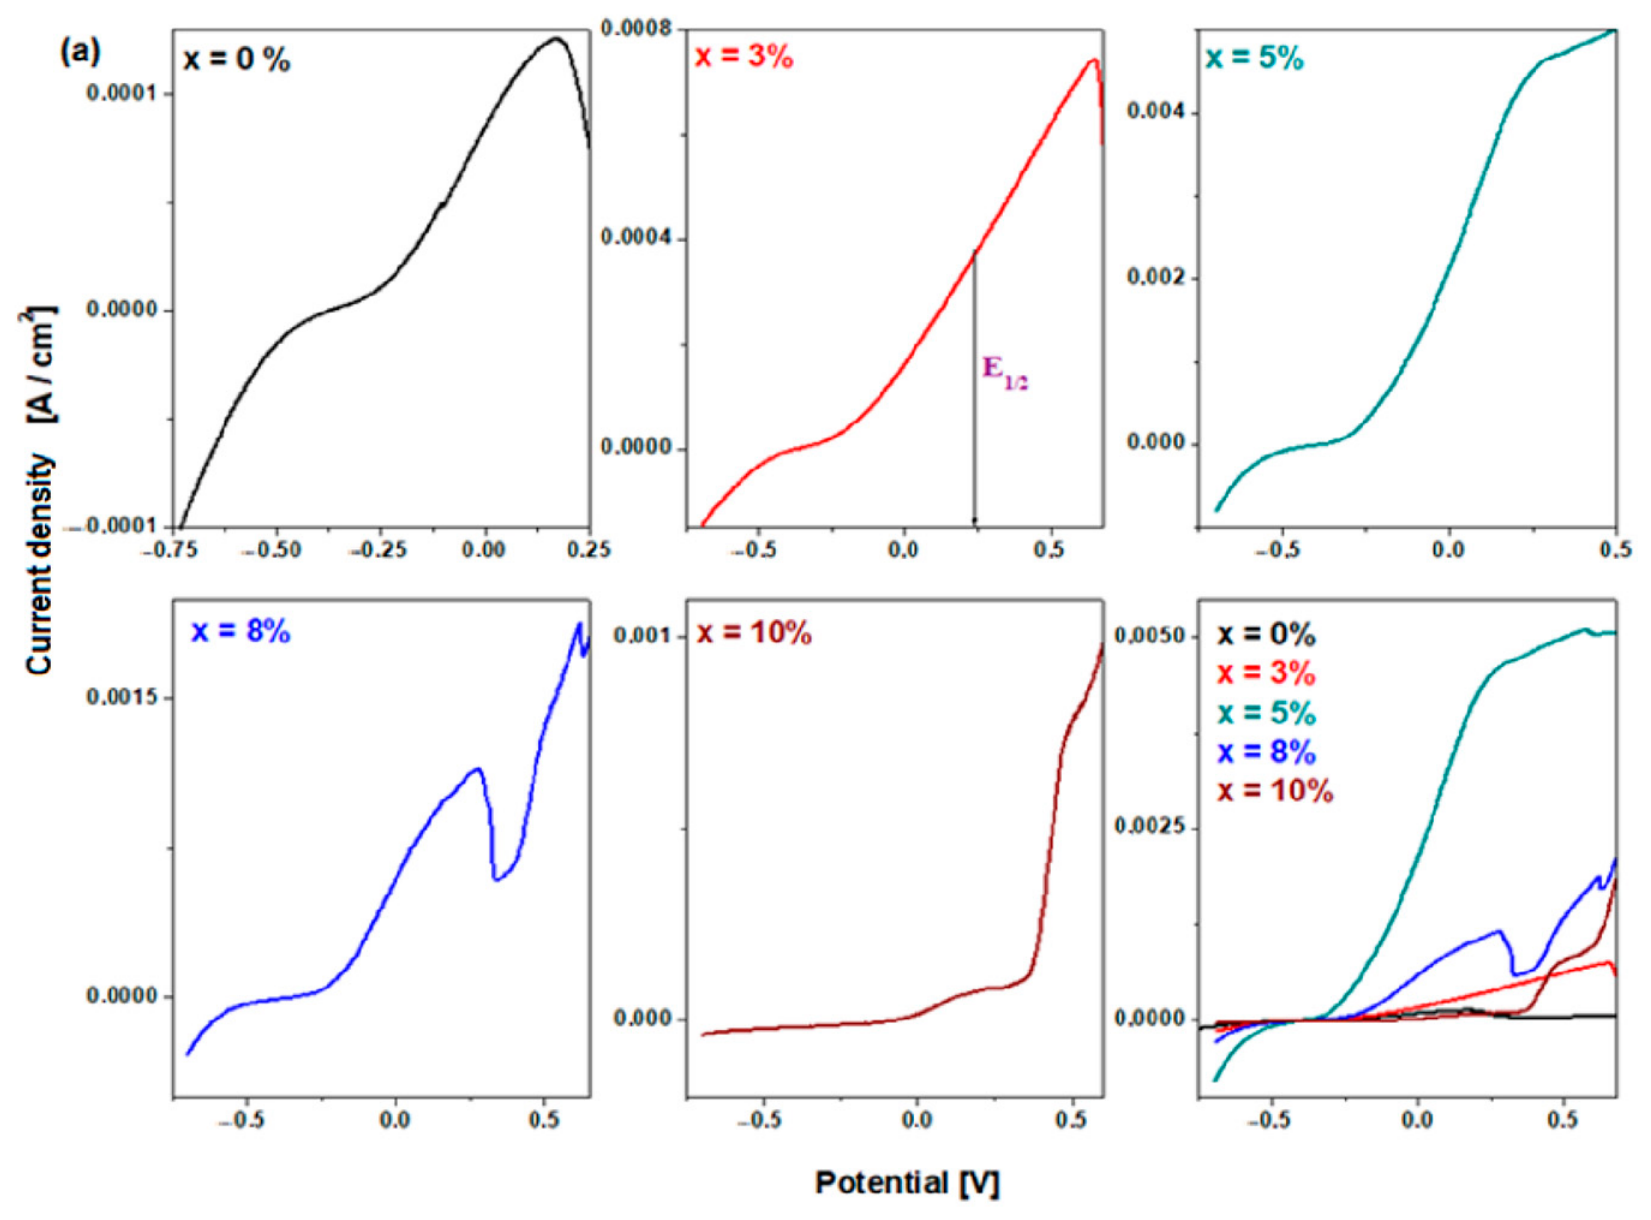
The linear sweep voltammetry (LSV) data recorded for the studied system are illustrated in Figure 5a. It can be observed that the 5% sample has the highest current intensity for the first anodic peak. As expected, the 0 and 3% samples have the lowest current intensities.
Figure 5.
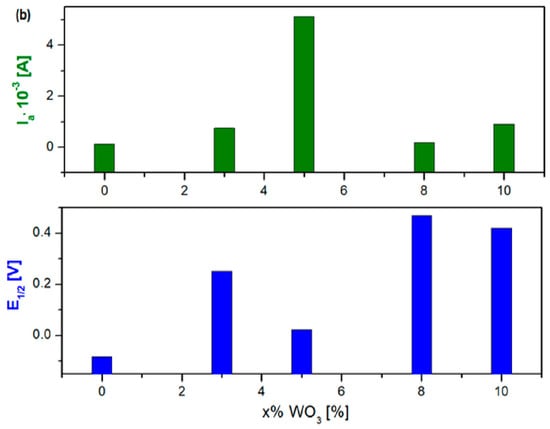
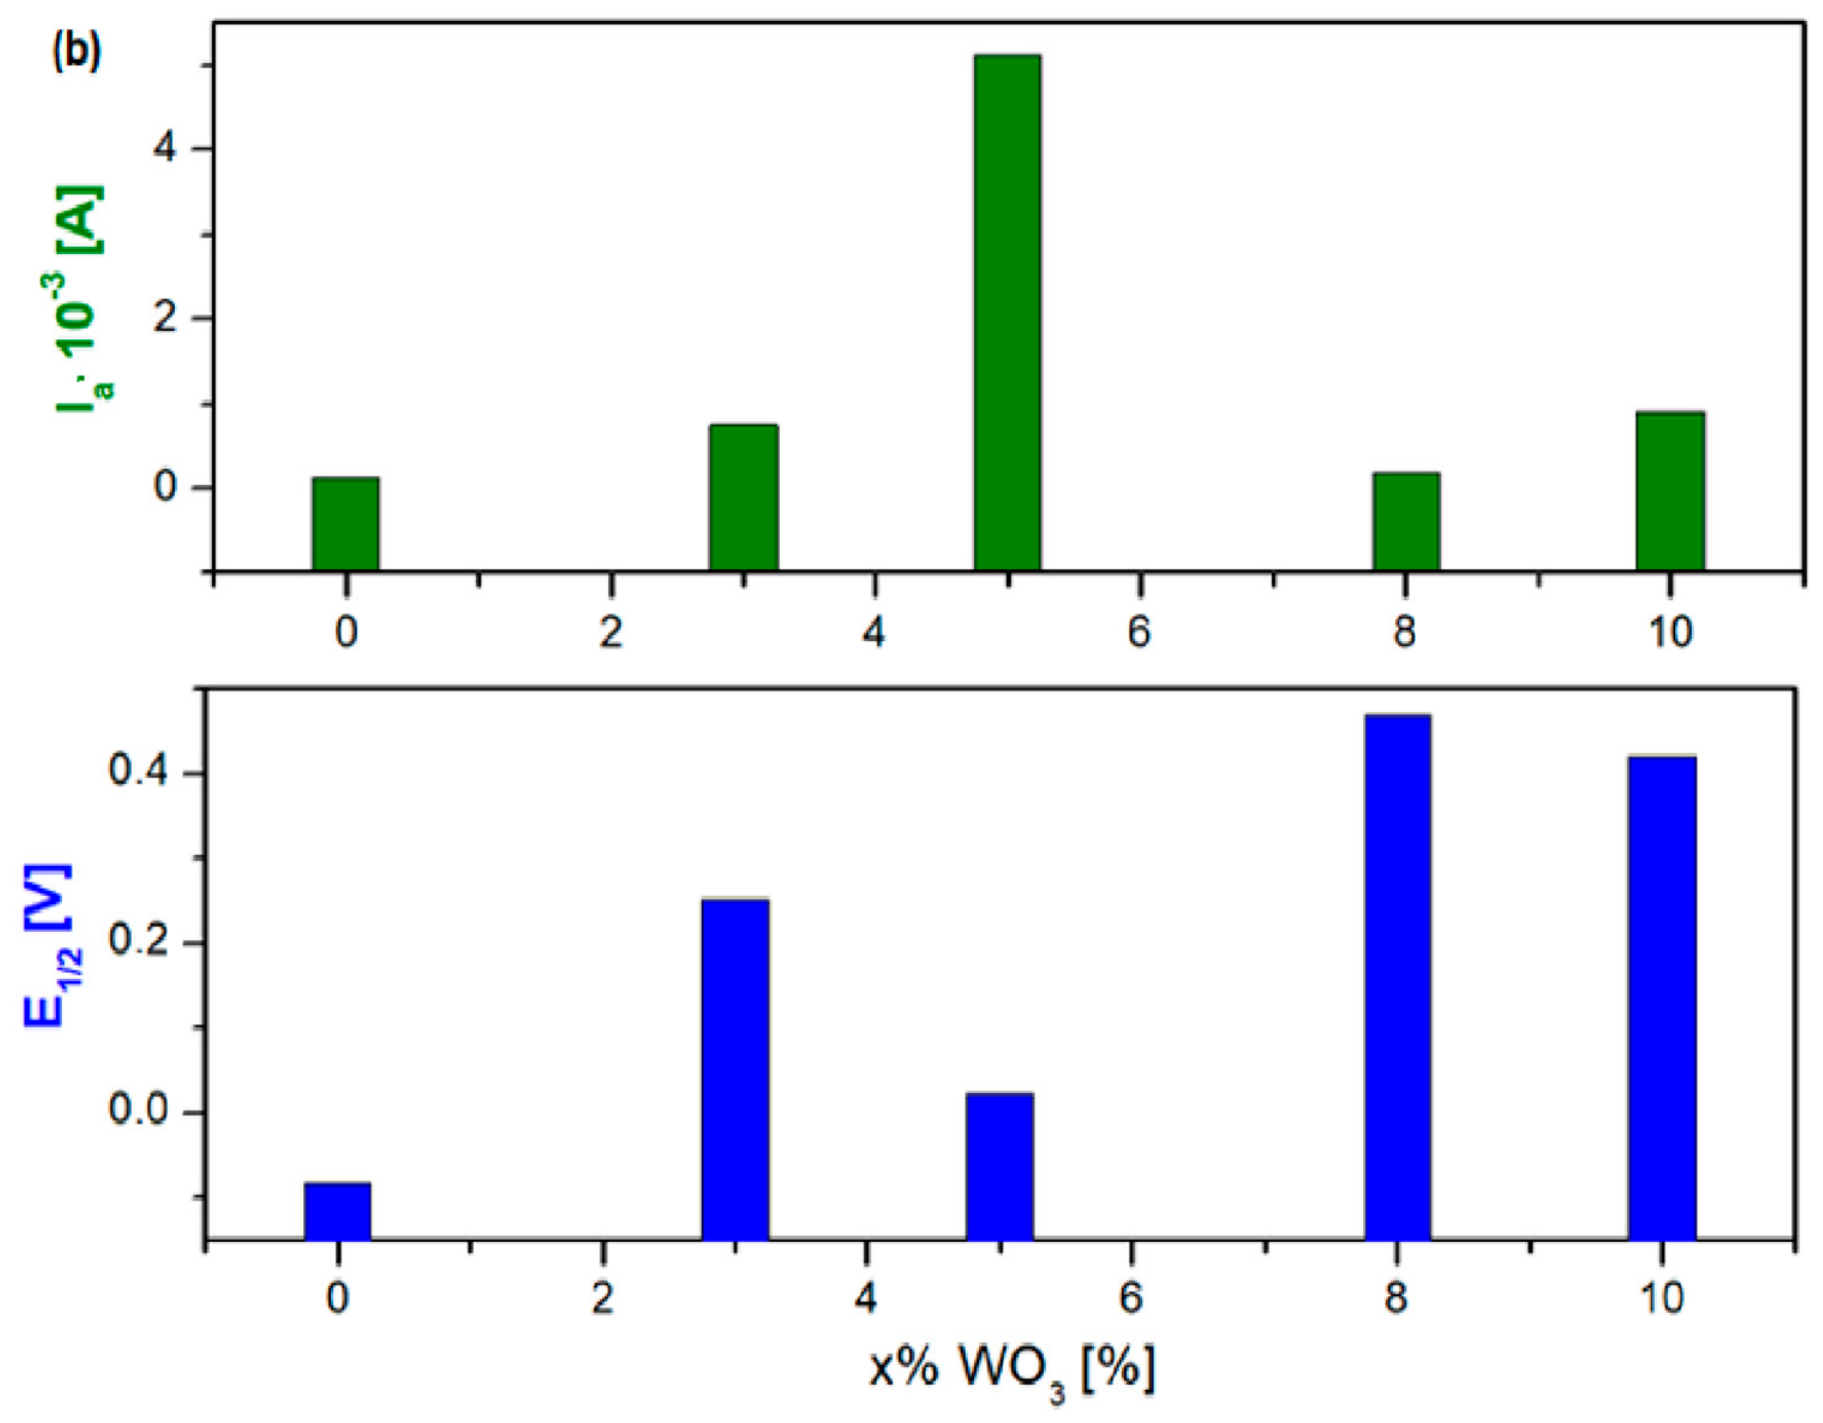
(a) Linear sweep voltammograms of studied samples. (b) Compositional evolution of the electrochemical parameters.
The half-wave potentials, E1/2, and the anodic peak current intensities denoted by Ia were determined. The graphical representation of these electrochemical parameters depending on the concentration of tungsten trioxide is highlighted in Figure 5b. The half-wave potential values reach low values for the sample with 5% WO3. Also, the current intensity has the highest value for the sample with 5% WO3. The analysis of the results highlights, for the sample with 5% WO3, the lowest E1/2 value and the highest Ia intensity value.
The observed degradation of the tungsten phosphate material in alkaline electrolyte suggests that its chemical stability may be limited under the investigated conditions. Partial dissolution or structural changes during electrochemical testing cannot be excluded and may influence the measured current response.
3.6. Electrochemical Impedance Spectroscopy Measurements
Furthermore, the results of cyclic voltammetry and linear sweep voltammetry will be correlated with electrochemical impedance spectroscopy (EIS) data to further characterize the tungsten phosphate electrode. The processes taking place in the electrochemical cell can be extracted from the representation of the imaginary part of the complex impedance, ZIm, as a function of the real part of the complex impedance, ZRe, for different values of the frequency.
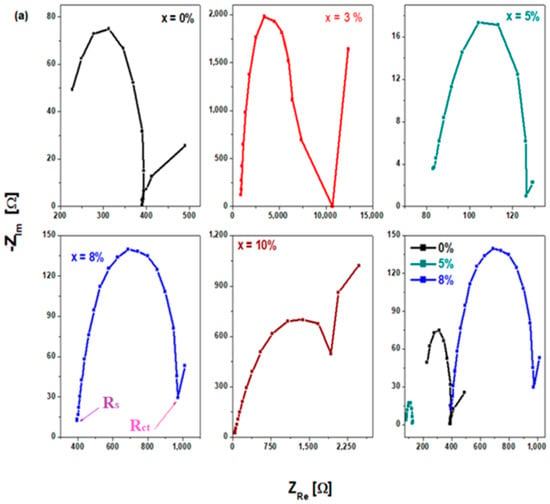
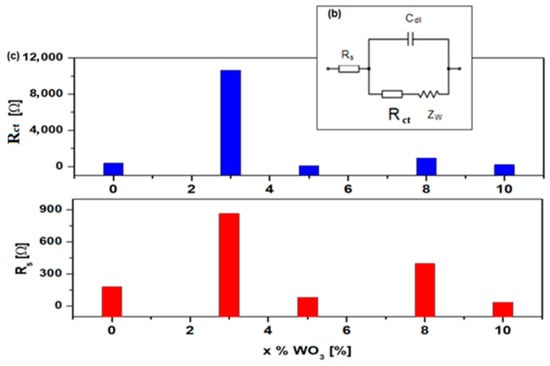
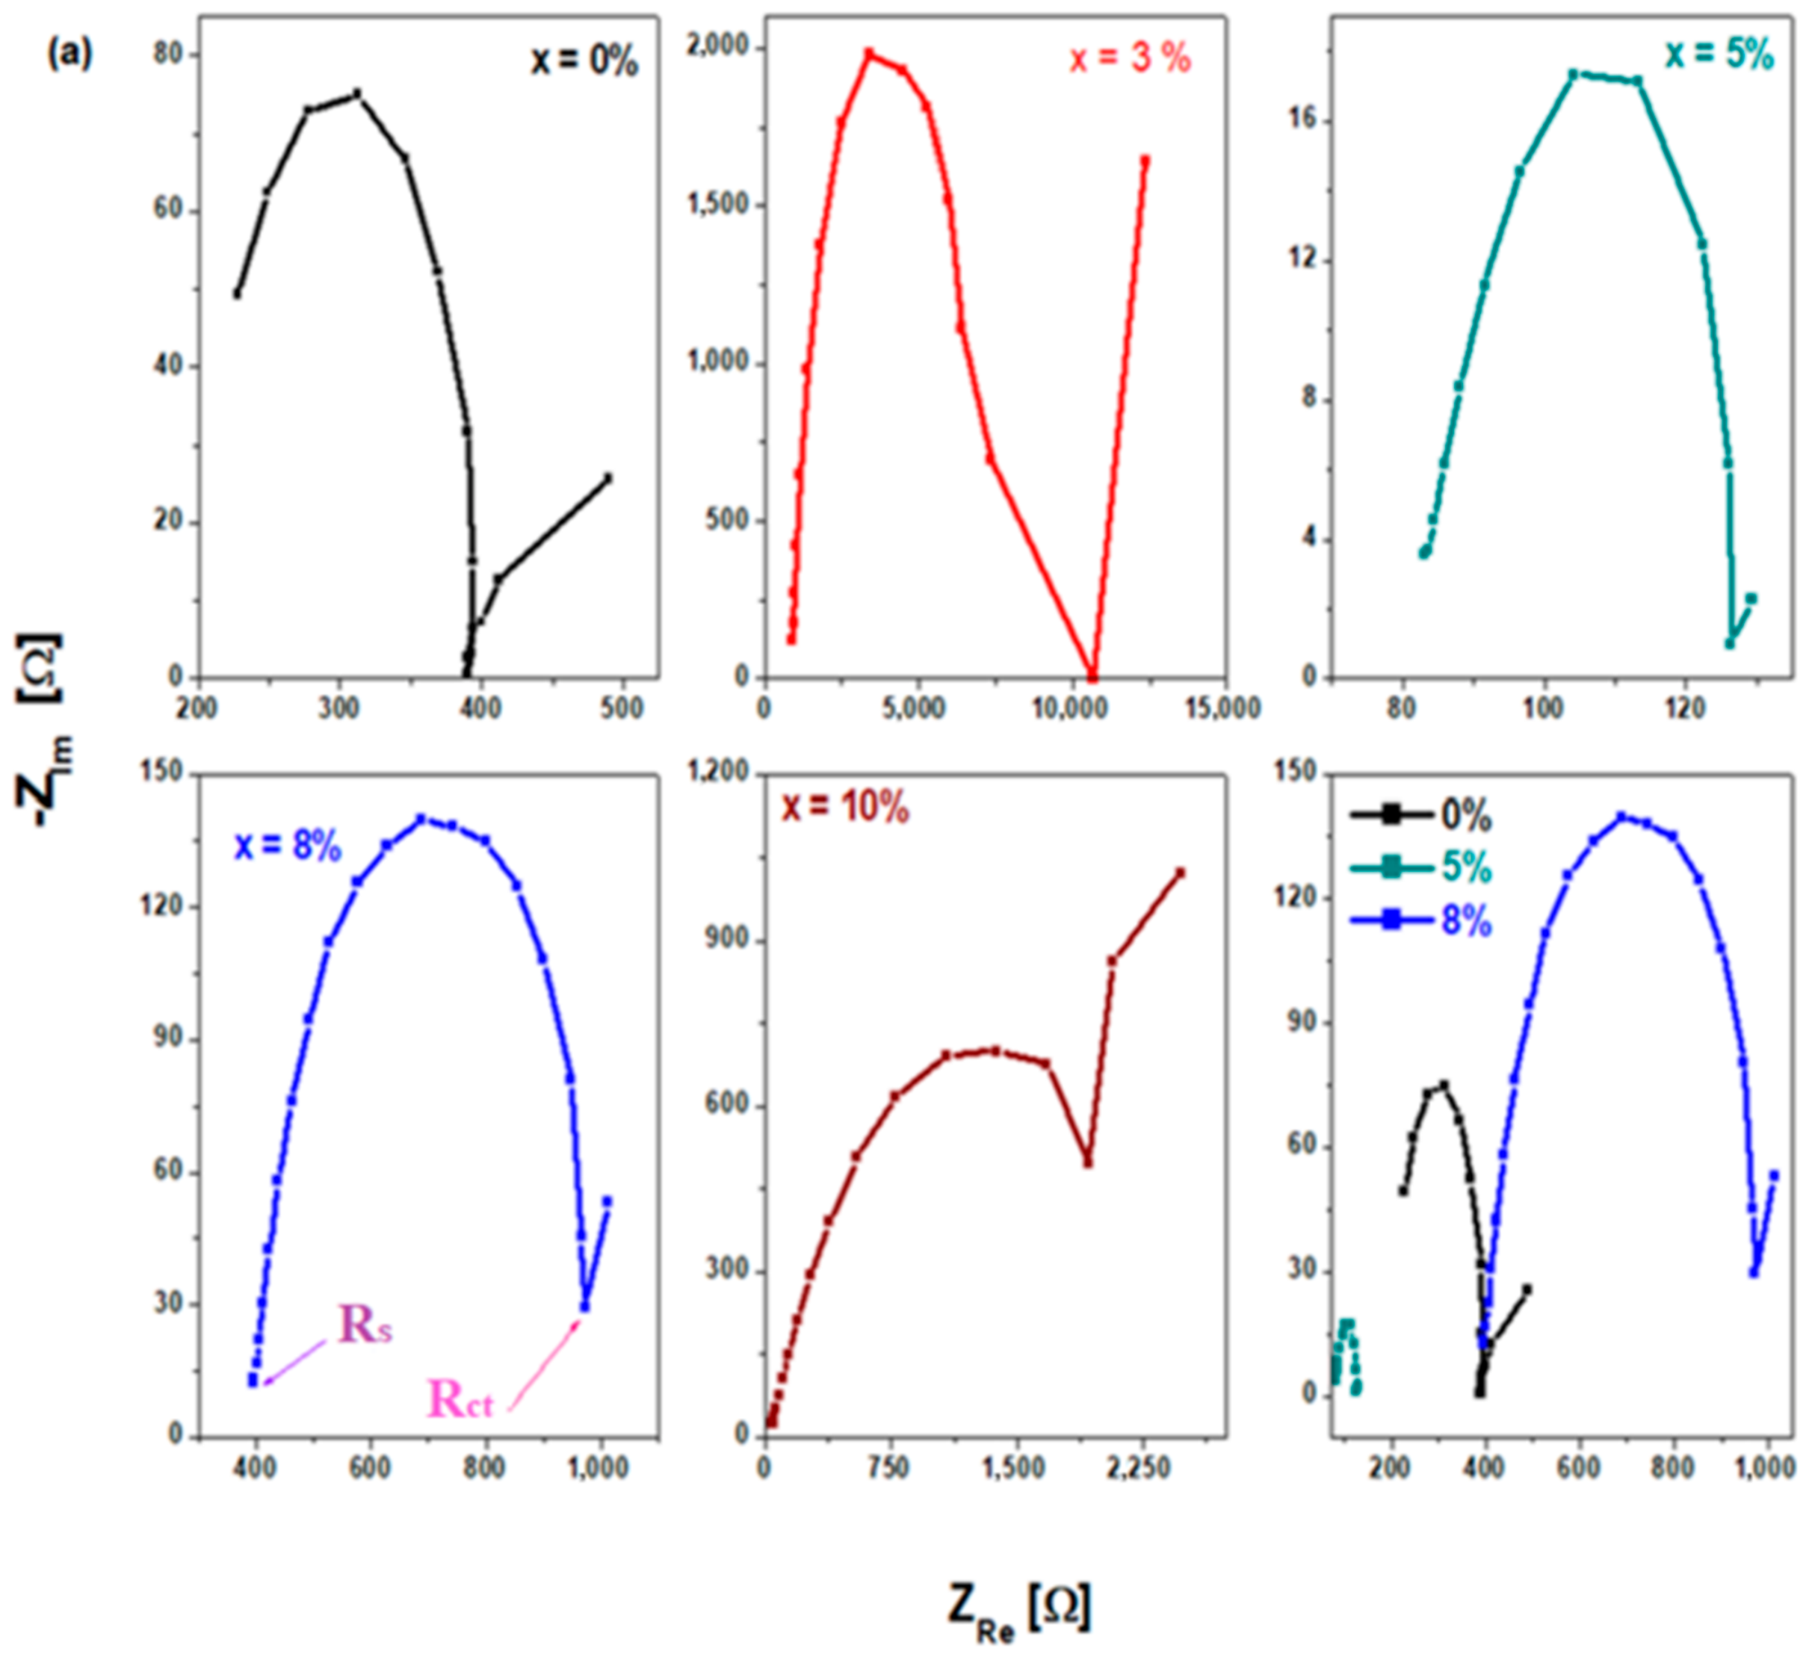
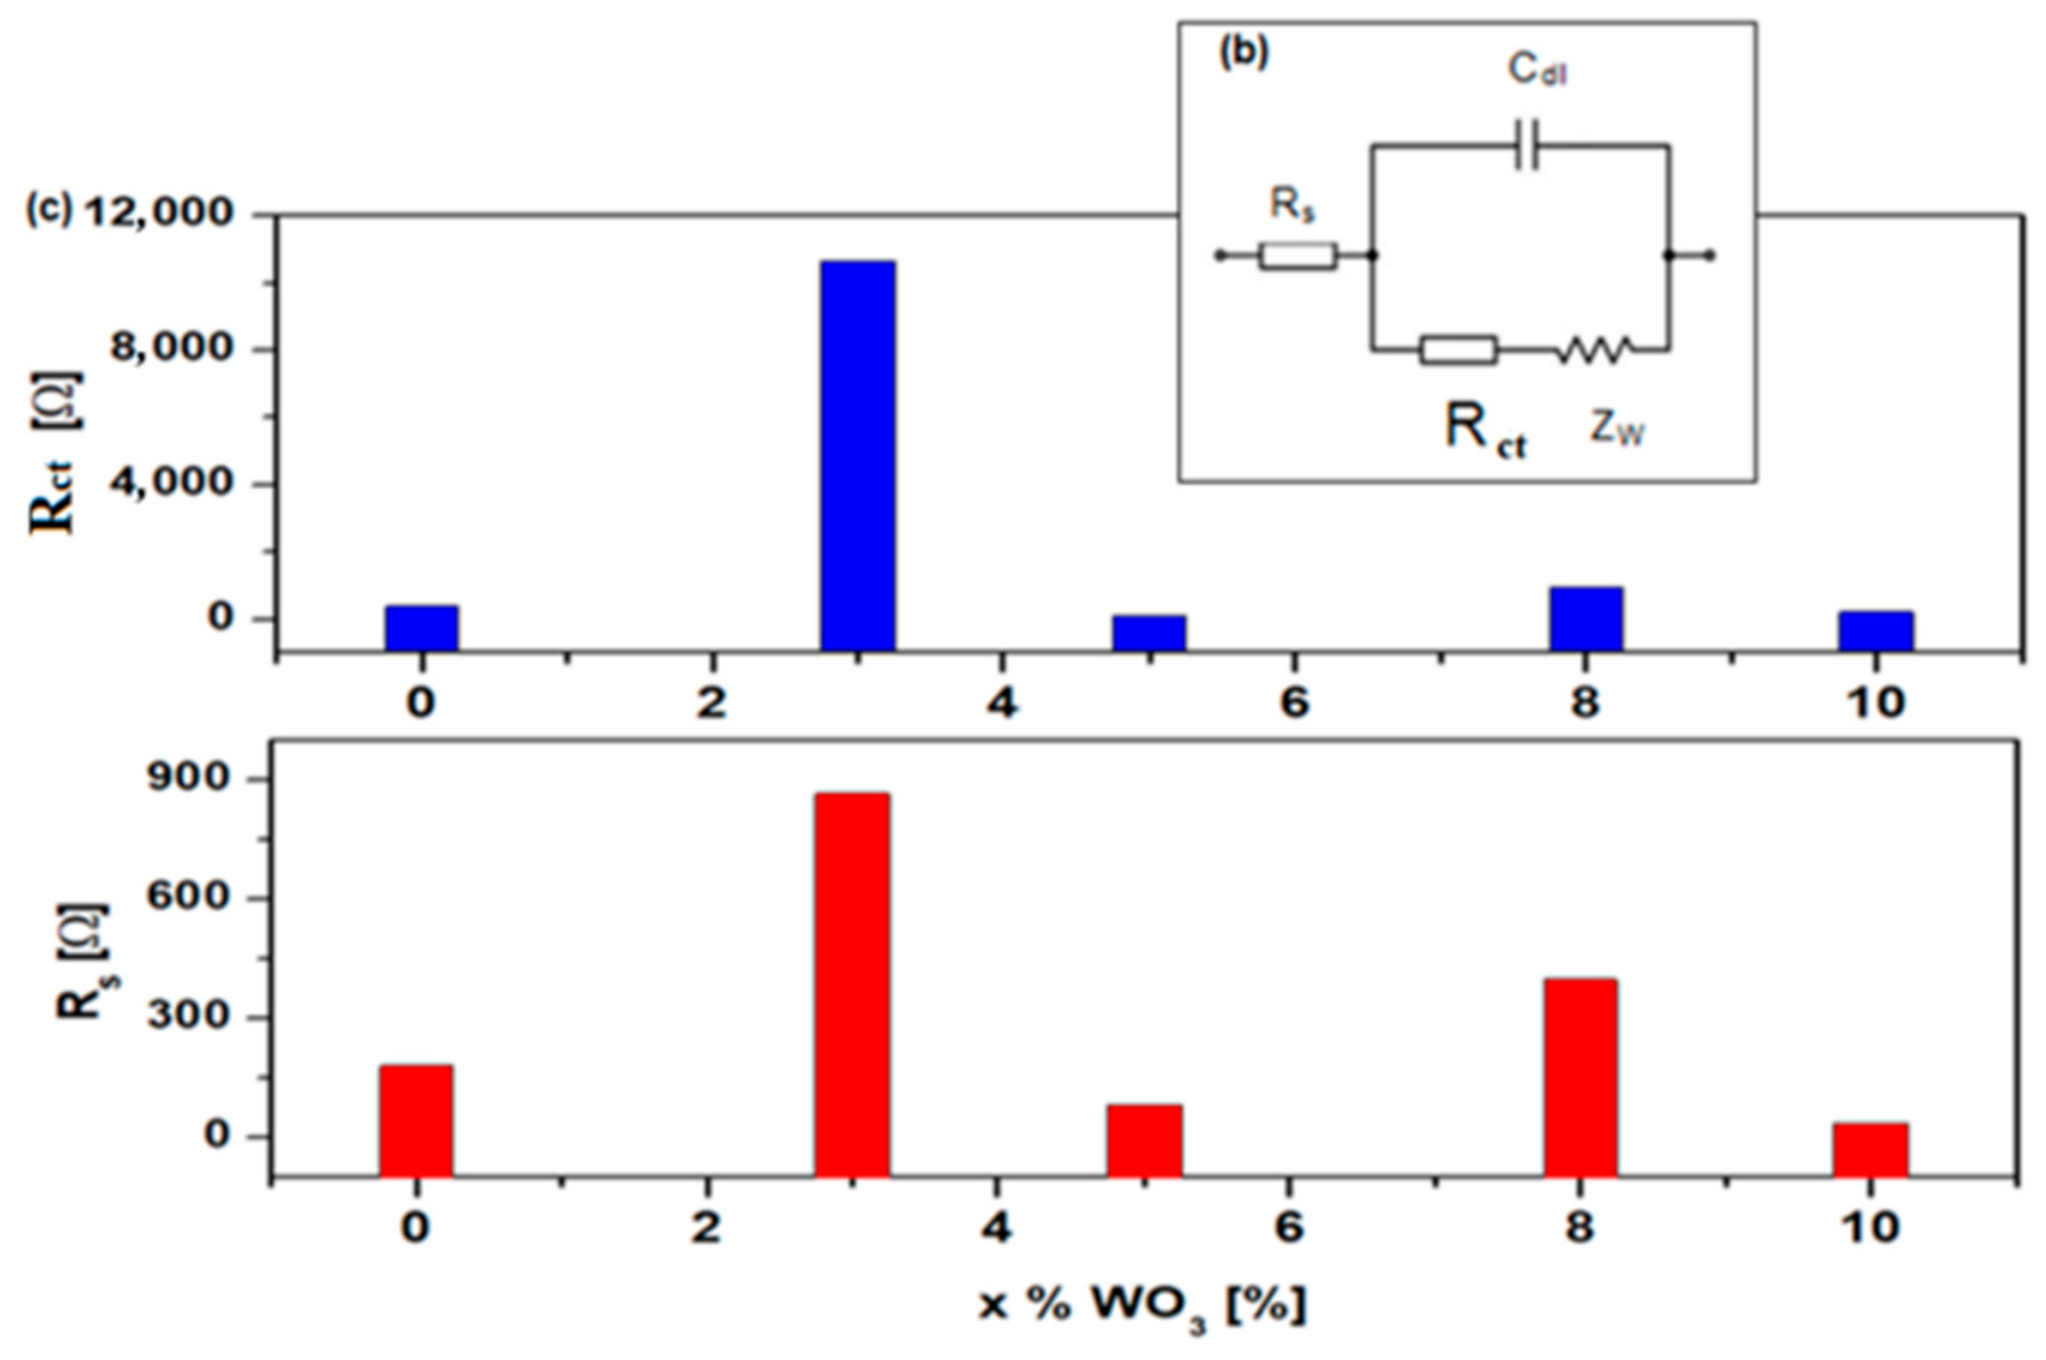
The Nyquist plots of the complex impedance for materials with the composition xWO3·(100 − x)(NH4)2HPO4, where x = 0, 3, 5, 8, and 10 mol% WO3, and the values of the resistances Rs and Rct, depending on the composition, are presented in Figure 6.
Figure 6.
(a) Nyquist plots of complex impedance of the studied samples. (b) Equivalent circuit using in the simulation. (c) Compositional evolution of resistances for the prepared samples.
In all cases, the impedance spectra are characterized by two components: a semicircle in the high frequency range and a straight line at an angle of 45º in the low frequency range. The semicircle corresponds to the electrical properties of the material [27,28,29,30]. The straight line corresponds to the polarization effect and the Warburg diffusion zone.
The equivalent electrical circuit indicated in Figure 6b was chosen in accordance with the experimental data and contains the solution resistance Rs, the charge-transfer resistance denoted with Rct, the Warburg impedance Zw, and the electric double layer capacitance Cdl.
The charge-transfer resistance Rct is influenced by the surface condition of the tungsten phosphate electrode. The resistance value Rct is inversely proportional to the conductivity of the material. A nonlinear variation with concentration is observed for both Rs and Rct values. The highest resistance values are observed for the samples with x = 3 and 8% WO3. The lowest charge-transfer resistance value Rct of 126 Ω is observed for the sample with x = 5% WO3. This low value from high resistance values indicates a saturation trend that can be attributed to the accumulation and adaptation of potassium hydroxide molecules between the layers of the tungsten phosphate system.
The diameter of the semicircle in the Nyquist plot increases for the sample with x = 8 and 10% WO3 and has the smallest diameter for the sample with 5% WO3. The increase in the diameter of the semicircle can be associated with a denser structure that inhibits ion transport and as a result the semicircle in the Nyquist plot has increased.
3.7. Doping of the Tungsten Phosphate System with CuO
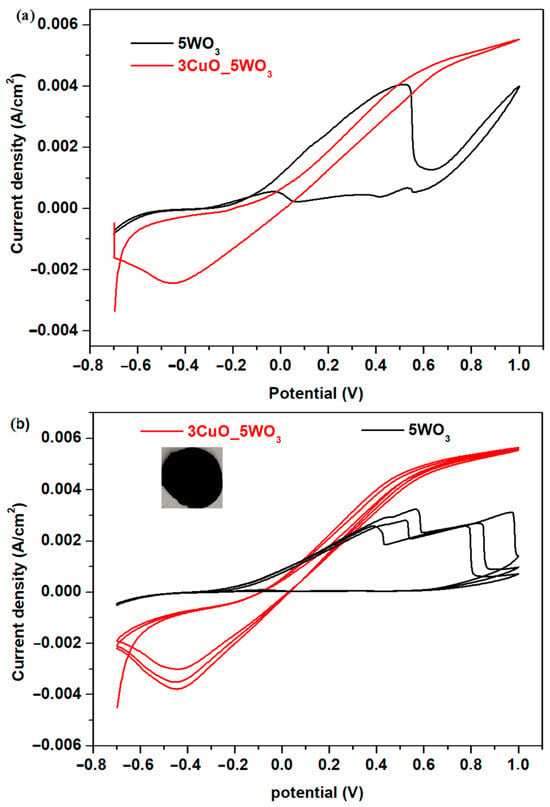
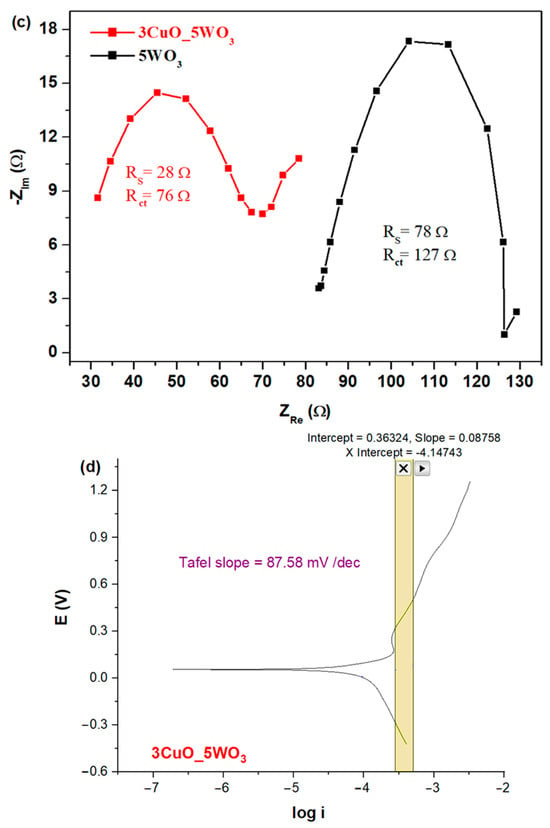
Cyclic voltammograms of the copper–tungsten phosphate material in the composition 3CuO·5WO3·92(NH4)2HPO4 recorded in potassium hydroxide of 1 M solution are shown in Figure 7. Inspection of the doped cyclic voltammogram indicates significantly superior performance compared to the undoped host matrix.
Figure 7.
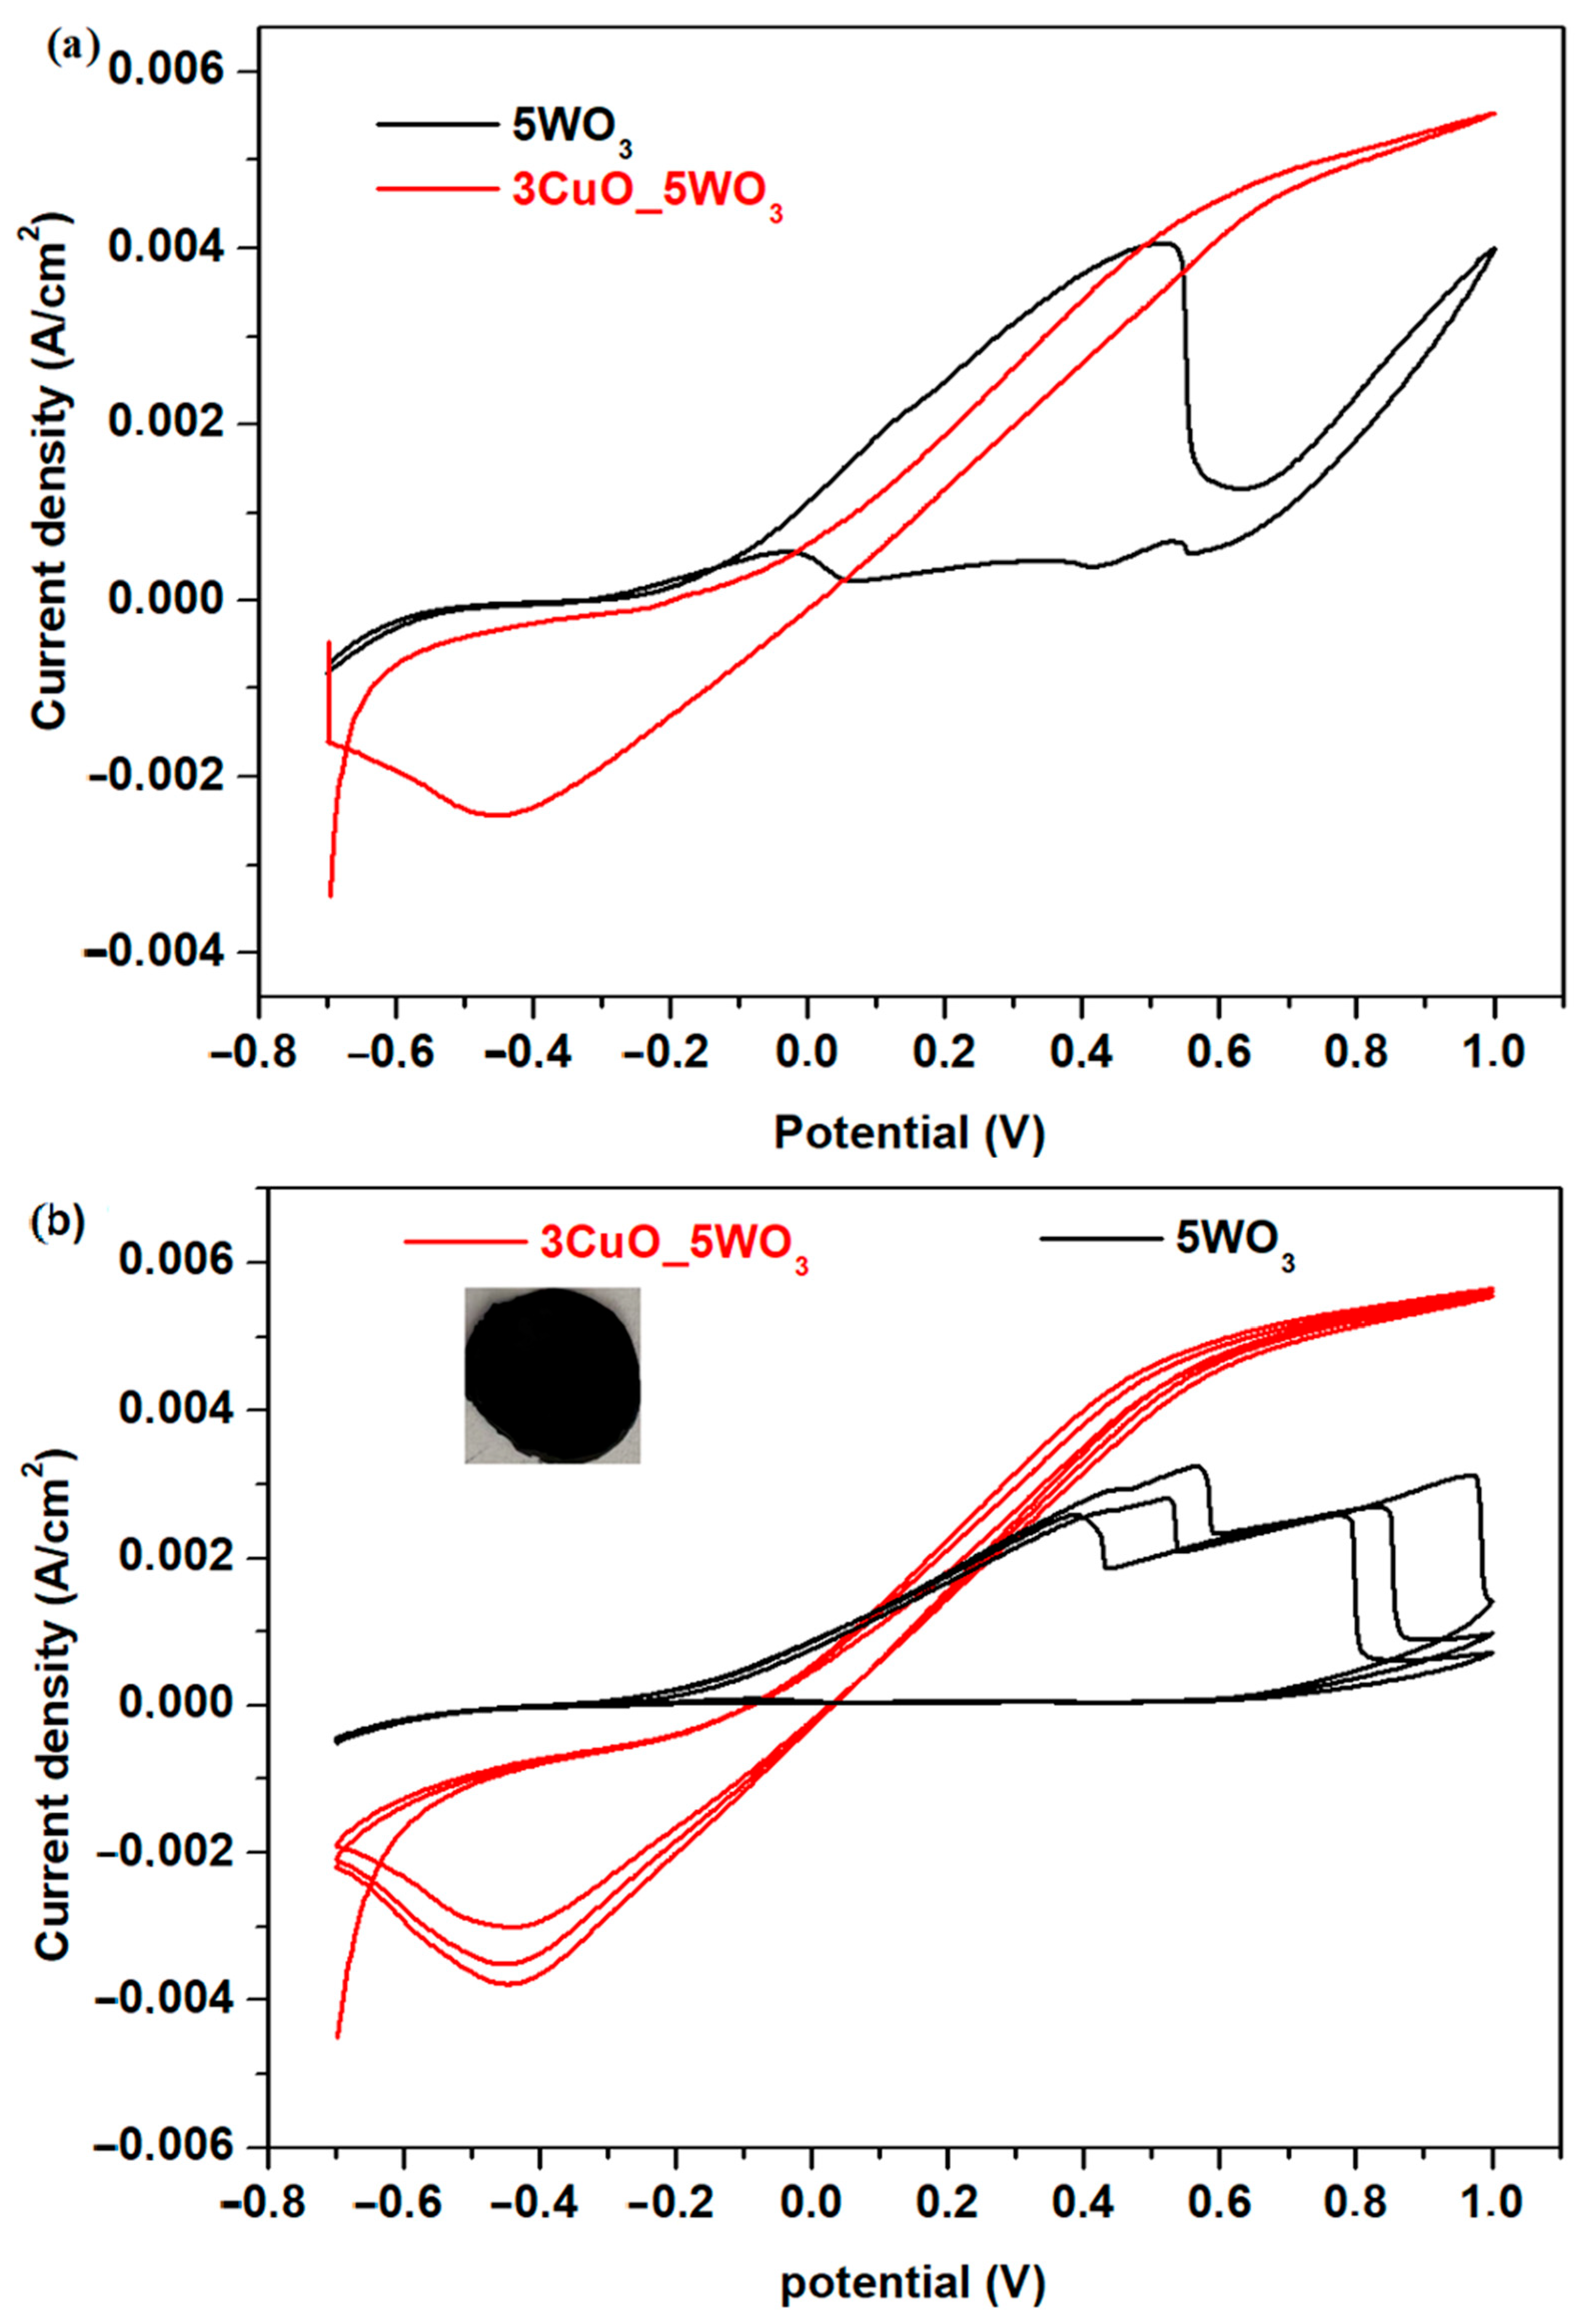
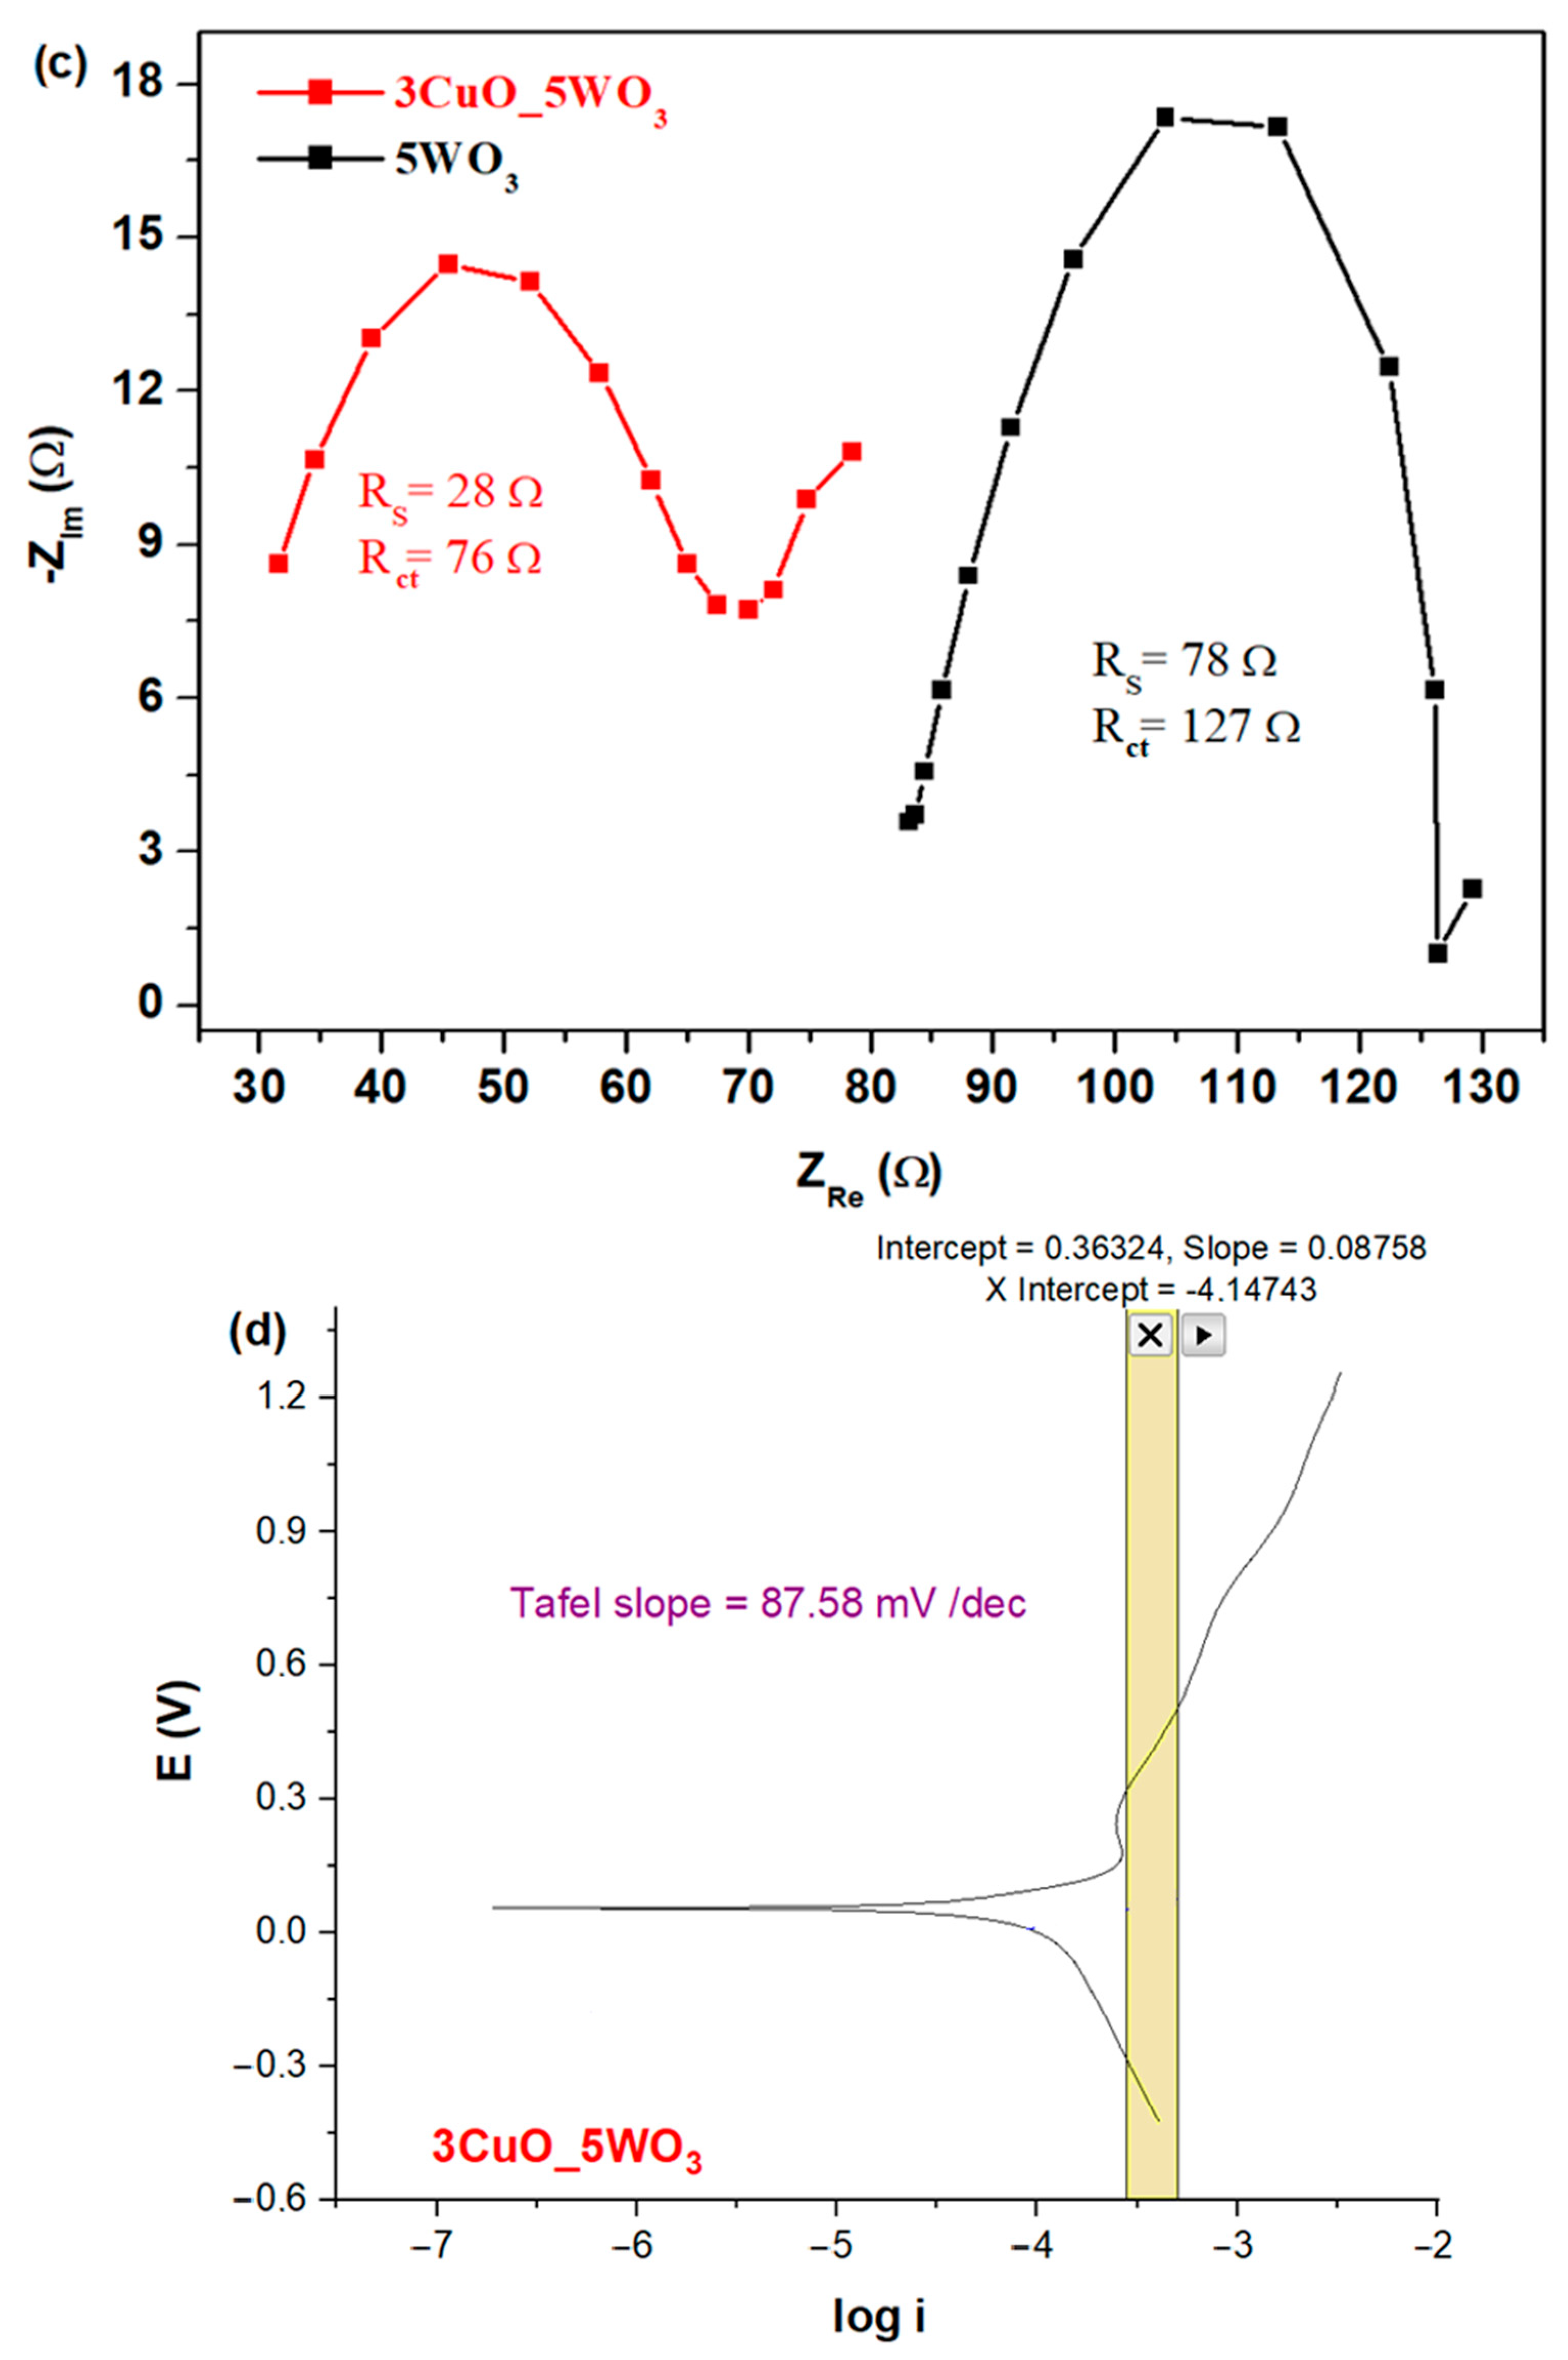
(a) Cyclic voltammograms scanned for first cycle and (b) for three cycles; (c) Nyquist plots and (d) Tafel plots of the 3CuO·5WO3·92(NH4)2HPO4 material recorded in potassium hydroxide of 1 M solution.
The cyclic voltammogram for the host matrix indicates a high level of irreversibility. The voltammogram shows irregular jumps or peaks, indicating instability or bubble formation. The features suggest poor electrical contact or a surface that blocks gas evolution. It is not reliable for catalytic comparison due to the mass transport issues or surface instability.
The CuO-doped sample shows clearly a small reduction at ~−0.45 V, suggesting surface redox processes. The voltammogram has a higher current than the undoped sample and shows a more moderate increase at positive potentials. Some electroactive behaviour is observed at the surface, but it does not have excellent performance for oxygen evolution reactions.
Cyclic voltammograms scanning three cycles illustrated in Figure 7b show a minimal instability for the sample with CuO. From cyclic voltammetry data, we can conclude that the presence of the redox peaks is a sign of catalytic activation and not a defect.
The Nyquist plots of the complex impedance for the studied system are represented in Figure 7c. For both samples, the impedance spectra are characterized by a semicircle in the high frequency range corresponding to the conductivity of the material. The linear region situated at low frequency is due to the polarization effect and Warburg diffusion. Smaller values of the Rs and Rct resistance are observed for the CuO-doped sample, indicating the best conductivity.
The correlation between charge-transfer resistance and Tafel slope highlights the importance of electrolyte composition in governing electrode–electrolyte interfacial processes.
The Tafel slope (mV dec−1) indicates how strongly the overpotential must increase to produce a tenfold increase in current density. It provides information about the apparent reaction kinetics and the possible rate-determining steps. A lower Tafel slope generally indicates more favourable apparent electrochemical kinetics, meaning that a smaller increase in overpotential is required to increase the reaction rate. A higher Tafel slope indicates less favourable apparent kinetics, as a larger overpotential is required to achieve the same increase in current density.
The behaviour of Tafel slope is responsible of the catalytic activity. The smaller Tafel slope suggests faster kinetics and the better catalyst. For the CuO–tungsten phosphate sample, the value of the Tafel slope was 87.58 mV/dec. In general, the values of the Tafel slope up to 60 mV/dec indicate a rapid kinetics and good catalyst. For values close to 120 mV/dec, the kinetics are slow and with a rate-determining step. Therefore, the doping of the tungsten phosphate matrix with CuO corresponds to moderate kinetics and a weak catalyst in basic environmental conditions.
3.8. Electrochemical Performance of the Copper–Tungsten Phosphate in Acidic Electrolytes
Considering the previous results, it was found that the CuO-doped material has good conductivity and a moderate Tafel slope in basic media. The tests of the electrochemical performances in the acidic electrolytes of this material are useful to follow the catalytic behaviour. Three types of concentrations of sulphuric acid solution were considered.
3.8.1. Cyclic Voltammograms
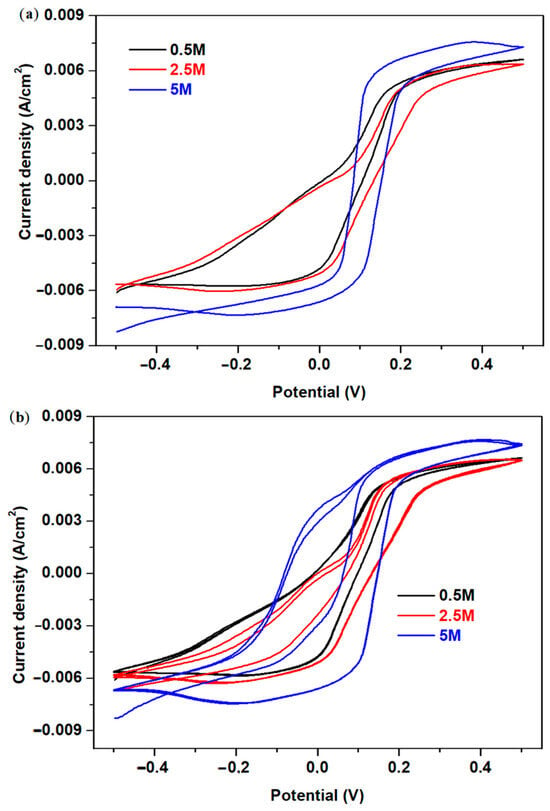
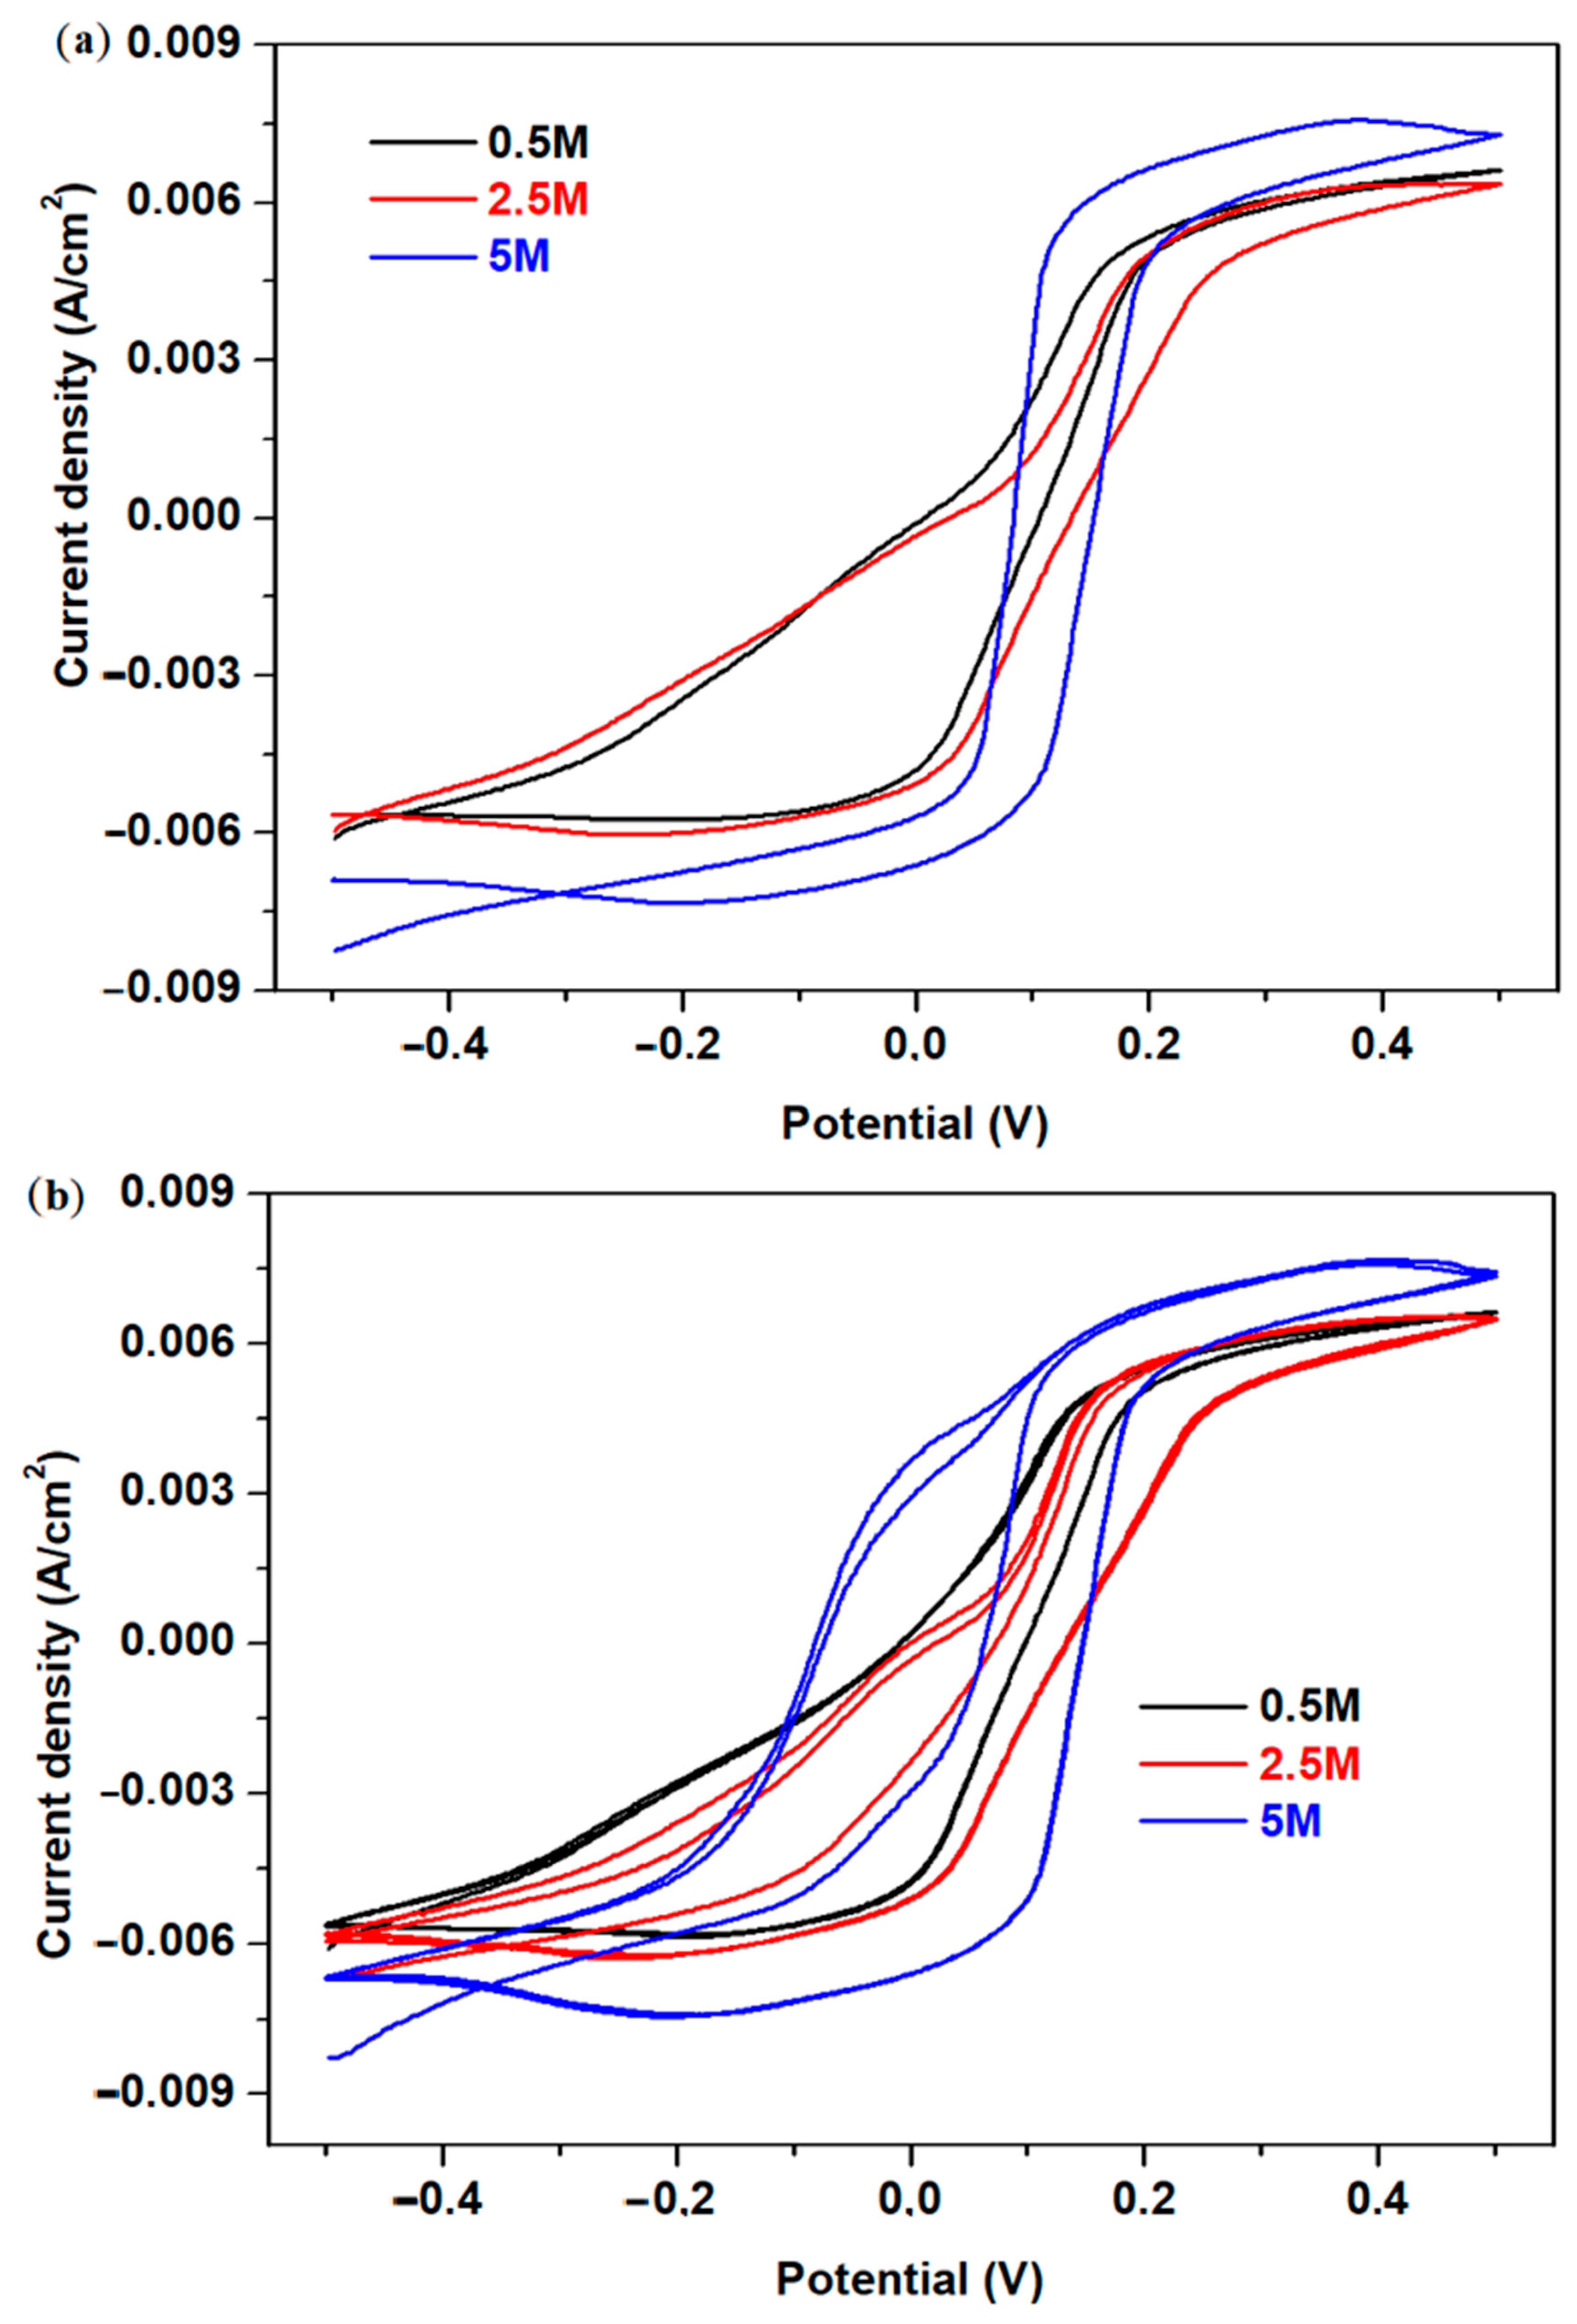
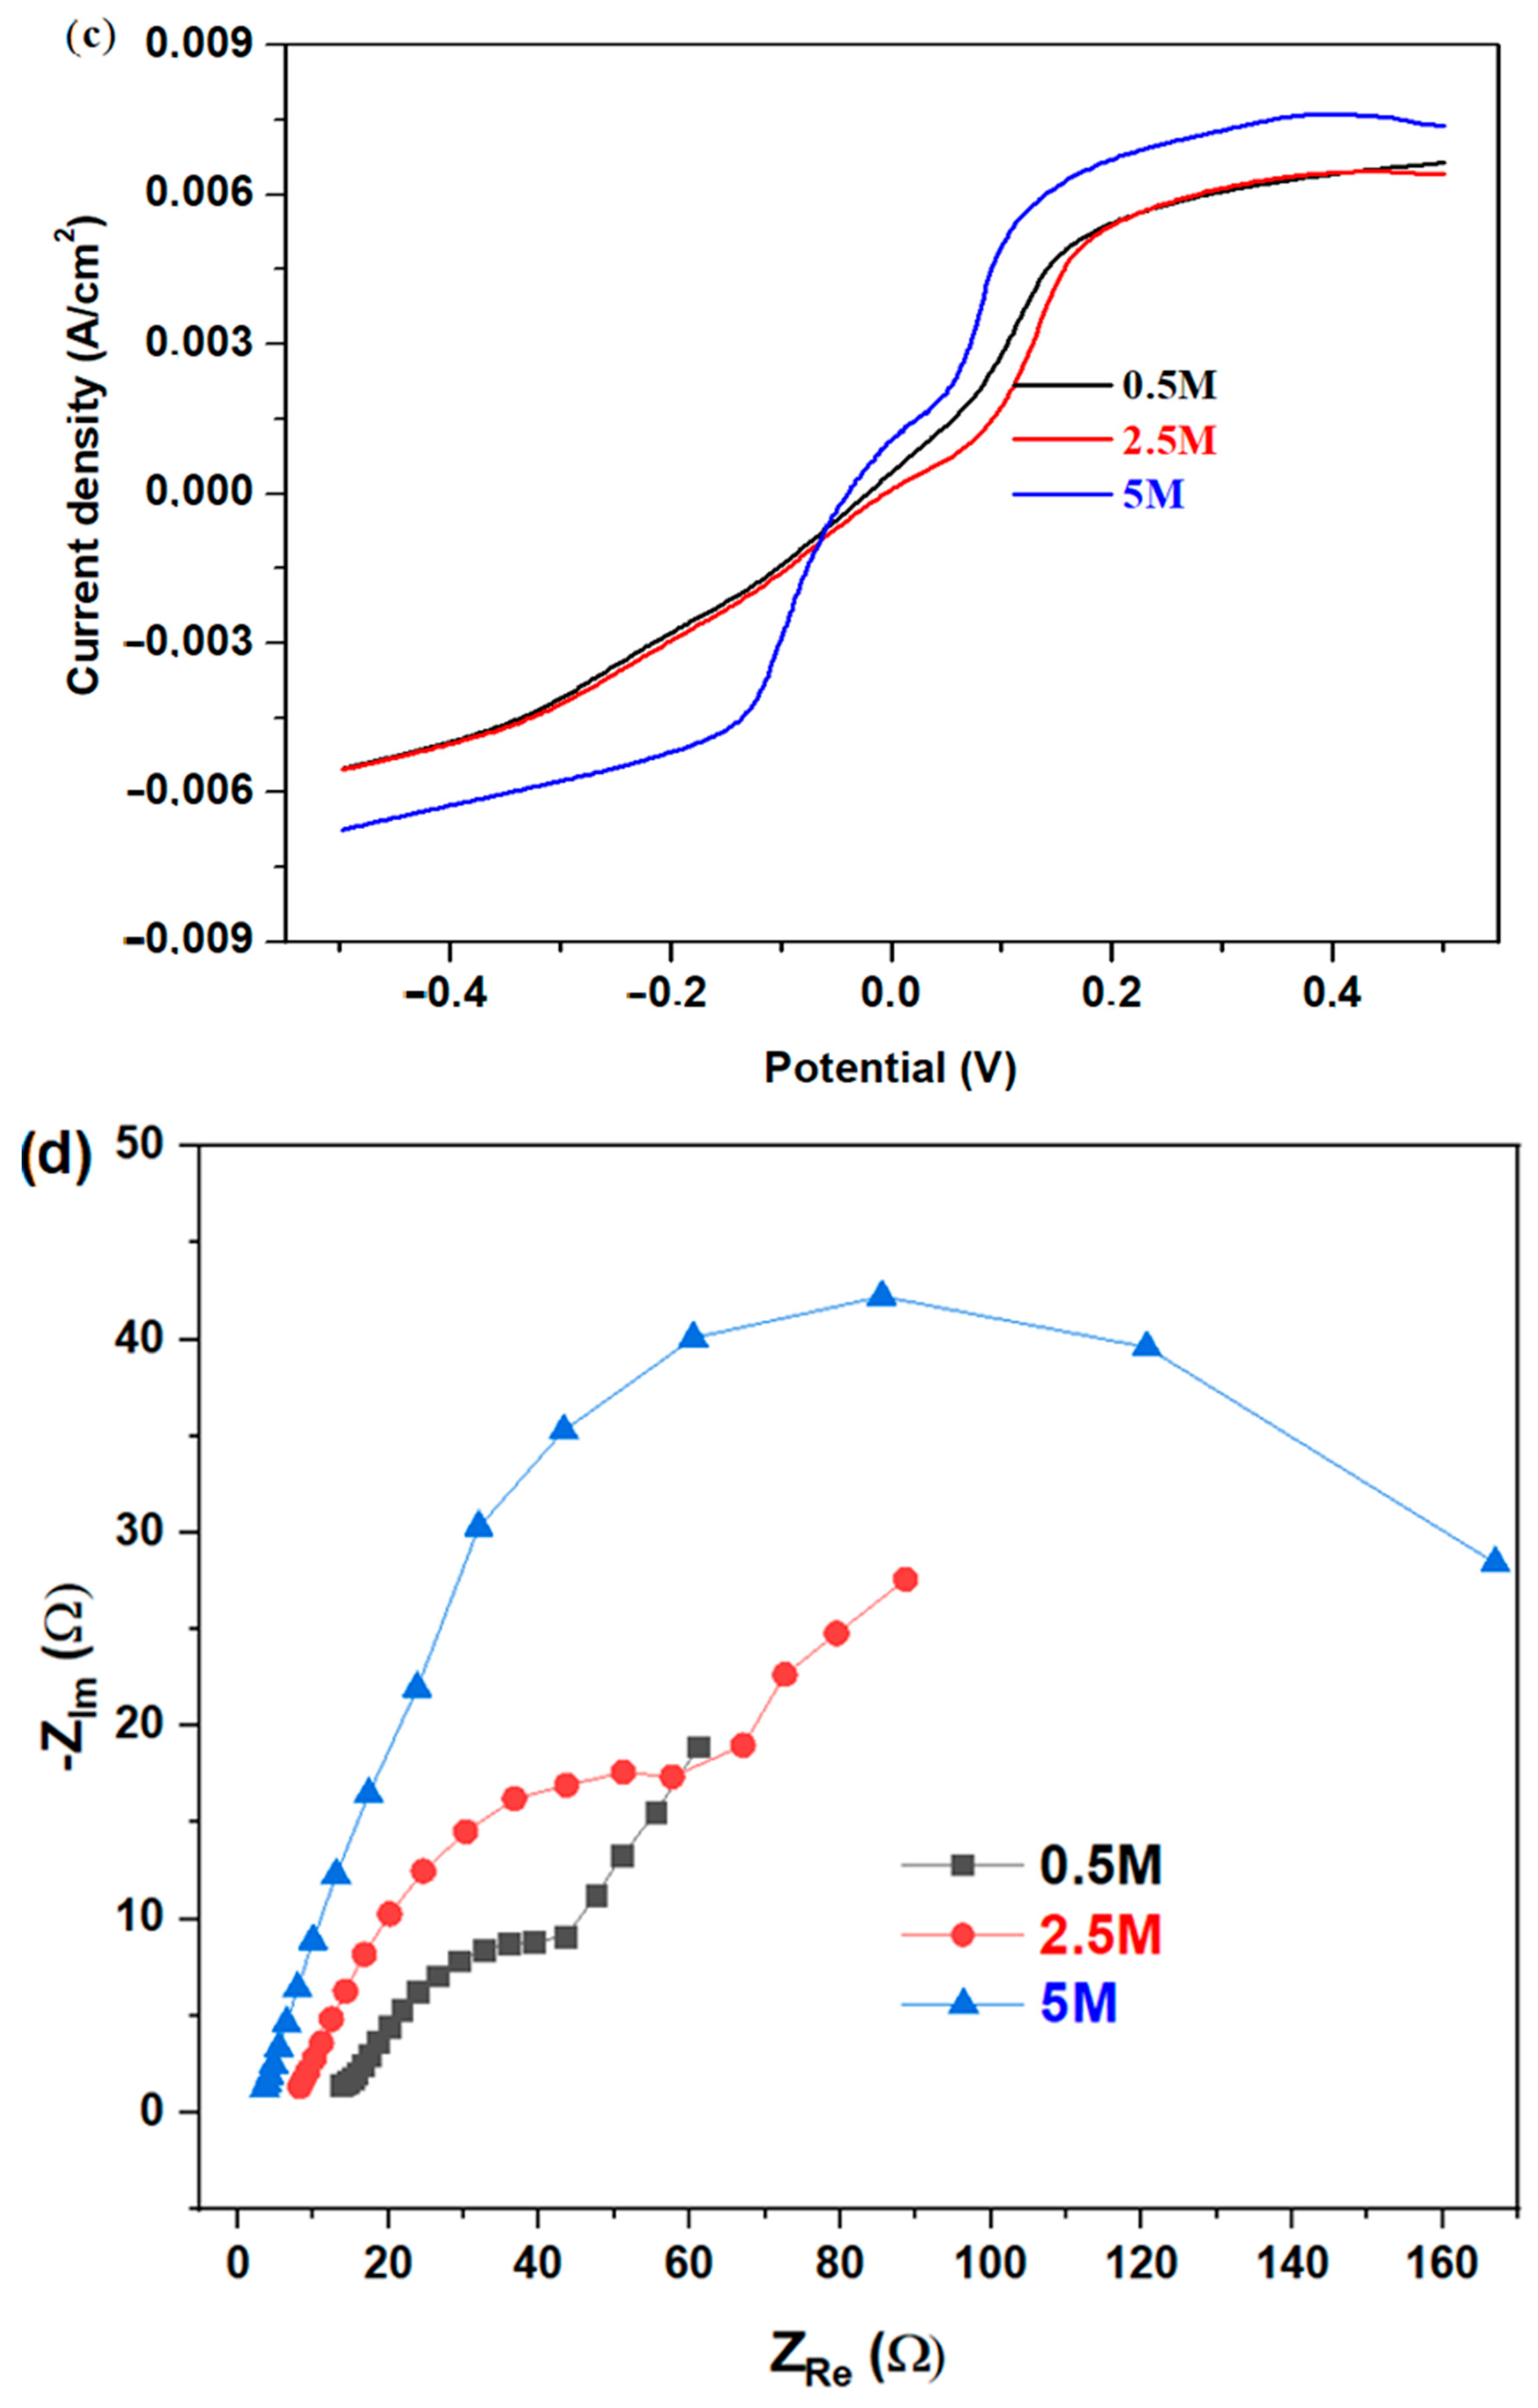
The cyclic voltammograms of the 3CuO·5WO3·92(NH4)2HPO4 material recorded in the H2SO4 solution of 0.5, 2.5, or 5 M concentration are shown in Figure 8a. These curves are much more compact, smoother, and sigmoidal with an S shape. This is typical of acidic environmental conditions for the oxygen evolution reaction or related anodic processes. In a KOH solution, there are clear activation peaks, while in the acidic environment, there are no obvious redox features. This confirms that the acidic environment suppresses transition-metal activation chemistry and the surface is not restructuring. All curves rise around a similar potential situated in the range of 0–0.2 V.
Figure 8.
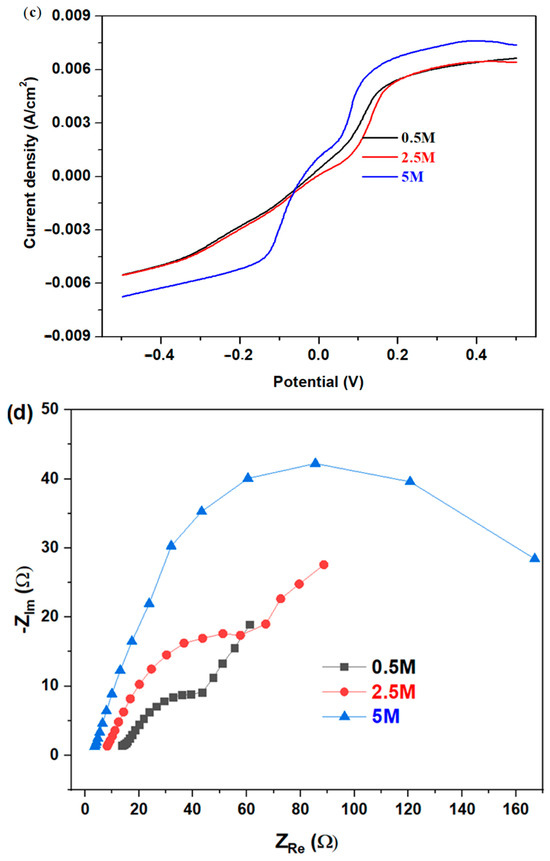
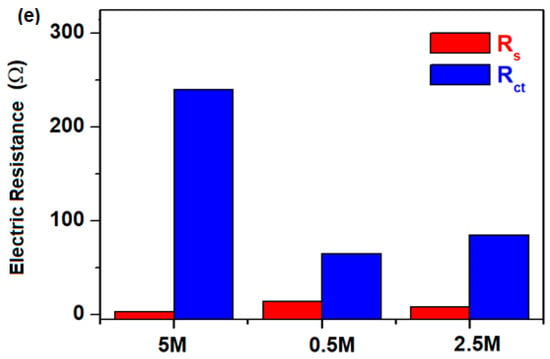
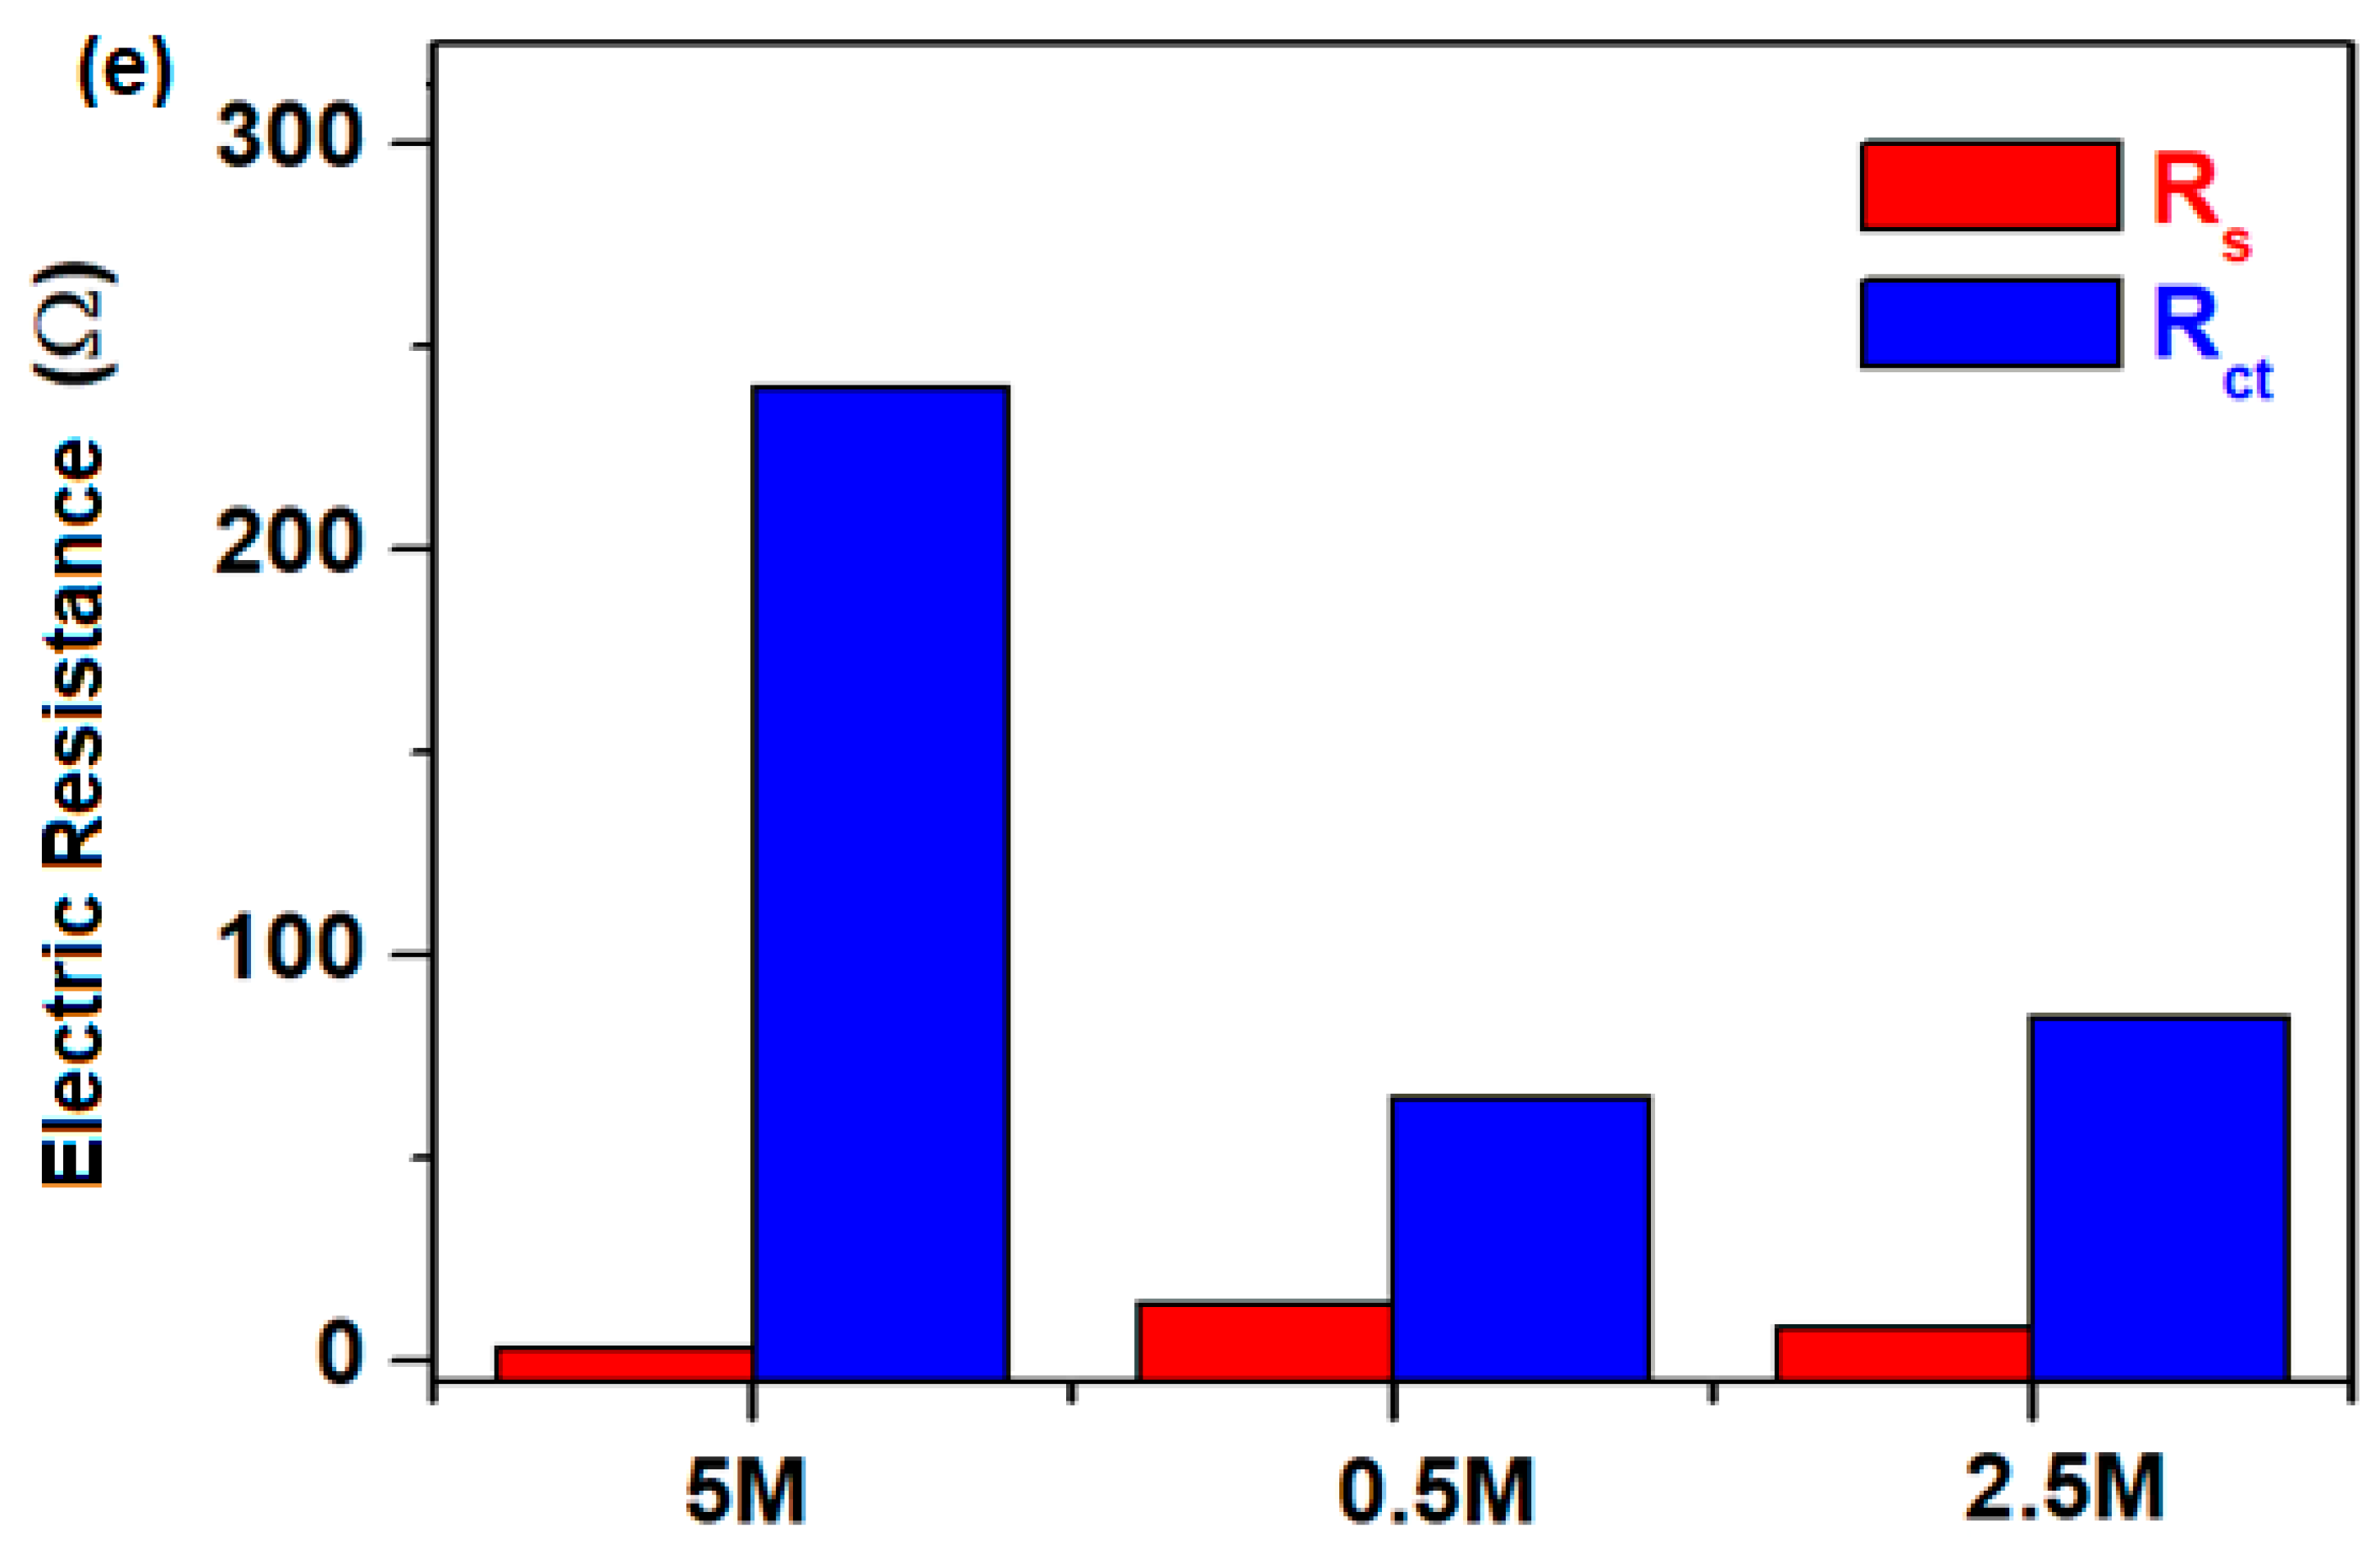
(a,b) Cyclic voltammograms. (c) Linear sweep voltammograms. (d) Nyquist plots of the copper–tungsten phosphate material recorded in sulphuric acid solution. (e) Variation in electrochemical parameters under different electrolyte conditions.
The ranking, from the best to the worst, of the performance in an acidic electrolyte based on the onset potential and current rise is: 5 M > 0.5 M > 2.5 M.
The cyclic voltammograms scanned for three cycles (Figure 8b) at various concentrations of the electrolyte solution indicate the highest current density of 0.0077 A/cm2 for a solution of 5 M H2SO4. The magnitudes of the current densities decrease at 0.5 M (to 0.00666 A/cm2) and at 2.5 M H2SO4 (with a value of 0.00642 A/cm2).
A higher current density generally reflects a more pronounced electrochemical activity, which may arise from better electronic conductivity and/or a larger number of accessible active sites. The area enclosed by the cyclic voltammogram is proportional to the capacitive charge, and the CV loop areas follow the same order as the current densities. Higher current densities were obtained in 5 M H2SO4, followed by 0.5 M H2SO4 electrolyte solution. The electrode with the highest current density has a pronounced electrochemical activity, better conductivity, or catalytic sites. As a result, the samples doped with CuO in 5 M and 0.5 M H2SO4 electrolytes had the highest surface area and the highest capacity, suggesting a better accessibility of ions in the acidic media.
The electrochemical measurements show that the sample introduced in 5 M electrolytes exhibits a comparatively lower onset potential as evidenced by the leftward shift of the voltametric curve, together with a higher current density at a given potential and a steeper increase in the current response.
The sample introduced in 0.5 M electrolyte shows a moderate behaviour and a slower rise. The sample in 2.5 M solution evidences the most delayed onset potential and the lowest current in key region of the oxygen evolution reaction, suggesting poor catalytic kinetics in an acid environment. The findings indicate that catalytic performance is determined by the intrinsic catalytic activity and electrochemical stability of the material.
Hysteresis is the difference between forward and reverse scans and shows an observable separation of the loop in all samples. The larger loop in the sample with 5 M electrolyte indicates a higher energy storage capacity but possibly also a higher contribution to diffusion. The sample tested in the 0.5 M electrolyte solution after three CV cycles exhibits the highest degree of electrochemical reversibility. This behaviour suggests reduced polarization and potentially fewer irreversible side reactions compared with those observed at the other investigated electrolyte concentrations.
The samples tested in the 2.5 and 5 M electrolyte solutions exhibit greater distortion between the forward and reverse scans, indicating slower electrochemical kinetics and more pronounced resistance effects compared with the other investigated electrolyte concentrations. In technological applications, a faster charge transfer indicates lower internal losses.
3.8.2. Linear Sweep Voltammograms
The linear sweep voltammograms shown in Figure 8c confirm some conclusions previously related to cyclic voltammograms. The samples introduced in 5 M and 0.5 M electrolyte solutions had the highest current density and the strongest response in both the anodic and cathodic regions.
The electrochemical measurements reveal differences in the current response among the investigated electrolyte concentrations, with the sample in 0.5 M electrolyte exhibiting a pronounced electrochemical response, and the sample introduced in 2.5 M electrolyte displaying a comparatively lower response toward hydrogen-related electrochemical processes under the experimental conditions employed.
For the 0.5 M electrolyte, the slope is smoother in the region between −0.3 and 0.1 V compared to its analogues. The other samples indicate transition zones with the onset of redox reactions.
3.8.3. EIS Data
The Nyquist diagram (Figure 8d) represents imaginary impedance as a function of the real impedance for the studied samples. The Nyquist diagrams evidence a semicircle corresponding to the charge-transfer resistance Rct at a higher frequency, and the solution resistance Rs can be extracted in the linear region of low frequency. The solution resistance Rs primarily represents the ohmic contribution of the electrochemical system, including the electrolyte and other resistive components in the measurement setup.
The resistance values were obtained from the electrochemical impedance spectroscopy (EIS) measurements by analysing the Nyquist plots and fitting the experimental data to the selected equivalent-circuit model, Rs-(Rct║CPE), to extract the corresponding parameters.
The dependence of both resistances on the concentration of electrolytes is represented in Figure 8e. The electrochemical parameters are shown in Table 1. The sample introduced in the 0.5 M solution has the smallest semicircle (Rct is 65 Ω), indicating fast kinetics, fastest interfacial electron transfer, and minimal kinetics barrier at electrode surface. The low values for Rct are due to the efficient proton reactions and easier charge transfer. As result, the sample in the 0.5 M electrolyte shows excellent charge transfer in an acidic medium, good electronic contact, and conductivity. The sample in 2.5 M electrolyte has a slightly higher resistance (Rct = 85 Ω), still efficient charge transfer, and minor kinetic limitations compared to the sample in 0.5 M electrolyte, showing good a balance of conductivity and surface interaction. The sample in 5 M electrolyte indicates a significant increase in resistance, having Rct = 240 Ω, slower electron transfer, and likely partial surface blocking or poor acid stability. These characteristics show that the surface begins to degrade or becomes less conductive in acid.
Table 1.
Electrochemical parameters and Tafel slope for 3CuO·5WO3·92(NH4)2HPO4 material in a H2SO4 solution of 0.5, 2.5, and 5 M concentrations.
In conclusion, the lowest values of the Rct were observed for the sample immersed in 0.5 M electrolyte, with Rct = 65 Ω, followed by the sample in the 2.5 M electrolyte, indicating good conductivity. Resistance increases strongly with the variation in the acid solution from 0.5 M → 2.5 M → 5 M, suggesting that increasing structural complexity or loading may hurt conductivity in acid, possible corrosion, or loss of active conductive pathways.
In acidic oxygen evolution reactions or anodic reactions, charge transfer happens directly through lattice conduction and surface electron transfer. Furthermore, charge-transfer resistance Rct becomes a stronger indicator of performance than in alkaline systems. The final conclusion is that the samples introduced in 0.5 M and 2.5 M electrolytes are the best performing electrodes in acidic environments based on charge-transfer resistance. The sample in 5 M electrolyte is the worst because the increasing Rct is correlated with reduced interfacial charge-transfer efficiency. Unlike alkaline systems, acidic performance is strongly controlled by intrinsic conductivity and stability rather than surface reconstruction.
Solution resistance Rs represents electrolyte and bulk sample resistance. The lower solution resistance means better proton conductivity. Overall, the ranking based on solution resistance performance is: 5 M (with Rs = 3.11 Ω) > 2.5 M (8.26 Ω) > 0.5 M (having Rs = 14.10 Ω).
Specifically, the CV results indicate a good electrochemical response for the sample prepared in 0.5 M electrolyte solution. EIS measurements suggest that the 0.5 M sample exhibits the most favourable interfacial charge-transfer characteristics, having a smaller Rct value. The CV response reflects the overall electrochemical activity, whereas EIS provides information about the interfacial charge-transfer processes and Rs represents the ohmic contribution of the electrolyte and experimental system. Therefore, a lower Rs does not necessarily imply faster charge transfer or superior overall electrochemical performance.
The designation of the 0.5 M solution as having the best conductivity performance is consistent with the reported total resistance Rt values. Specifically, Rt decreases from 243.11 Ω in 5 M electrolyte to 79.10 Ω in 0.5 M electrolyte, indicating a lower overall resistance and better electrical transport properties under the investigated conditions. It should be noted that total resistance Rt and solution resistance Rs represent different contributions to the overall electrochemical resistance and should therefore be interpreted separately.
3.9. Tafel Plots of the CuO-Doped Tungsten Phosphate in Acidic Media
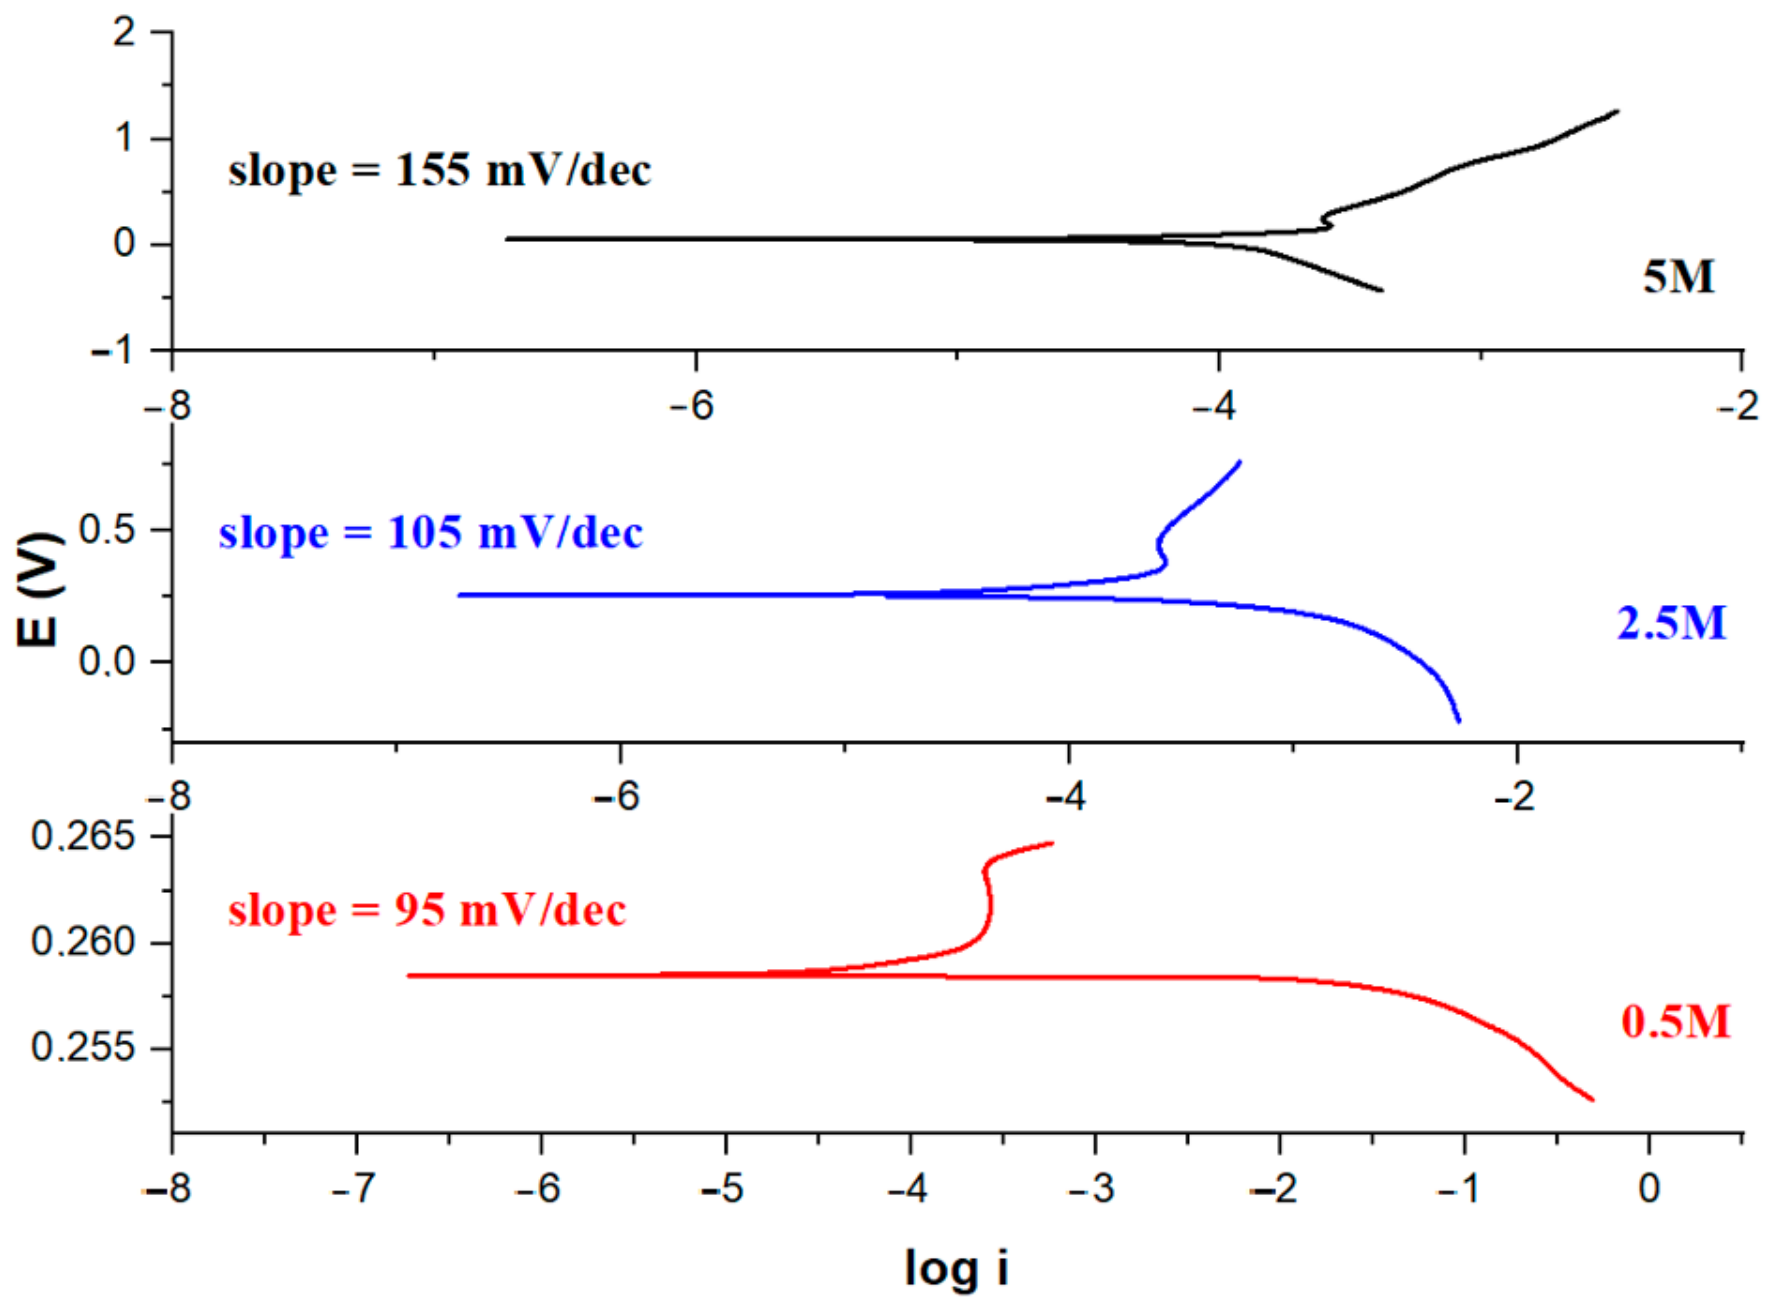
Tafel analysis was used to study reaction kinetics. A lower Tafel slope means faster kinetics, lower activation loss, and better catalyst efficiency. The Tafel analysis and characteristic parameters, namely the estimated Tafel slope for the studied material in a H2SO4 solution with 0.5, 2.5, and 5 M concentrations, are shown in Figure 9.
Figure 9.
Corrosion rate analysis of 3CuO·5WO3·92(NH4)2HPO4 material in 0.5, 2.5, and 5 M H2SO4 electrolyte.
The typical values of the Tafel slopes in aqueous electrocatalysis for energy conversion are ~30–40 mV/dec (low overpotential region) for the high-performance Pt catalyst and ~60–70 mV/dec for Pt/C catalyst [31]. Nafion membranes are widely recognized for their excellent proton conductivity, low charge-transfer resistance, and stable electrochemical behaviour under acidic operating conditions. Commercial Nafion-based PEM fuel cells combined with Pt catalyst typically exhibit Tafel slopes in the range of 60–70 mV/dec, with very low interfacial resistance, enabling efficient proton transport and rapid electrode kinetics [32].
The Tafel slopes obtained for the 3CuO·5WO3·92(NH4)2HPO4 material in 0.5 M, 2.5 M, and 5 M H2SO4 electrolytes were 95, 105, and 155 mV dec−1, respectively. The lower Tafel slopes observed for the sample introduced in 0.5 M H2SO4 indicate a stronger potential dependence of the measured current response than that observed in 2.5 and 5 M H2SO4. The higher Tafel slope of the sample immersed in 5 M H2SO4 suggests less favourable apparent electrochemical kinetics under the investigated conditions.
These differences indicate that the electrolyte concentration influences the electrochemical response of the tungsten phosphate materials. In our case, the lowest Tafel slope obtained in 0.5 M H2SO4 electrolyte suggests more favourable electrochemical kinetics compared with the other acidic conditions investigated.
The faster intrinsic reaction kinetics and reduced activation polarization represent the primary goal in optimizing fuel cells and batteries. These improvements imply fast kinetics, lower energy loss, and maximum power output.
3.10. Comparative Assessment of the Investigated Materials Based on Their Electrochemical Properties
The electrochemical performance of the investigated acidic electrolytes was evaluated using cyclic voltammetry, linear sweep voltammetry, Tafel analysis, and electrochemical impedance spectroscopy for technological applications.
Cyclic voltammetry measurements in an acidic medium were used to evaluate the electrocatalytic behaviour of three samples in 0.5, 2.5, and 5 M acidic solutions in terms of oxygen evolution reaction. The CV profiles show a smooth, sigmoidal current with no distinct redox peaks, indicating that the electrochemical response is dominated by direct water oxidation rather than surface redox transformations. Unlike alkaline conditions, no evidence of metal oxyhydroxide formation is observed, confirming the absence of surface reconstruction processes in an acidic medium. This suggests that the catalytic activity is governed primarily by intrinsic material properties and charge-transfer kinetics that activation of surface phases.
The Tafel analysis reveals that the sample in the 0.5 M electrolyte has a lower Tafel slope of 95 mV/dec compared with 155 mV/dec for the use of 5 M electrolyte, suggesting faster intrinsic electrocatalytic kinetics and lower activation polarization. For the use of the 2.5 M electrolyte, the Tafel slope was approximately 105 mV/dec, indicating moderate electrocatalytic activity and charge-transfer kinetics. The relatively high Tafel slope suggests that the reaction rate is strongly dependent on the applied overpotential and that the electron transfer process may be kinetically limited.
Charge-transfer resistance represents the resistance associated with electron transfer across the electrode–electrolyte interface. Lower Rct values indicate more facile interfacial charge transfer. Higher Rct values suggest slower electron-transfer processes and greater resistance to electrochemical reactions.
Furthermore, impedance analysis shows that the charge-transfer resistance Rct increases with the electrolyte concentration, with values of 65 Ω, 85 Ω, and 240 Ω for 0.5, 2.5, and 5 M electrolytes, respectively. The lower values of the resistances for the sample prepared in 0.5 M and 2.5 M indicate more efficient interfacial charge transfer and superior reaction kinetics compared to the 5 M system. The relatively low Rct observed in 0.5 M H2SO4 electrolyte therefore supports the interpretation of a more favourable interfacial electrochemical response in this electrolyte.
Overall, although the sample introduced in 5 M electrolyte shows a higher current response due to enhanced ionic conductivity, those in the 0.5 M and 2.5 M electrolytes demonstrate better intrinsic catalytic efficiency, lower activation losses, and reduced charge-transfer resistance. Among the investigated samples, the use of the 0.5 M electrolyte presents a balanced electrochemical performance with favourable conductivity, low Tafel slope, and slower charge-transfer kinetics, making it a promising candidate for technological applications.
4. Conclusions
Six samples with the composition xWO3·(100 − x)(NH4)2HPO4, where x = 0–20% WO3, were prepared by the melt quenching method. The prepared samples were characterized by FT-IR and UV-Vis spectra and electrochemical measurements. The studied system is a hygroscopic system due to the presence of a phosphate network with different structural units present.
The incorporation of tungsten trioxide modifies the electrochemical response of the investigated vitreous systems. The results of voltammetric measurements and electrochemical impedance spectroscopy suggest that the sample with 5% WO3 is an electrode material in alkaline electrochemical systems operating with a 1 M potassium hydroxide solution.
The incorporation of CuO into the tungsten phosphate matrix containing 5% WO3 produces moderate kinetic behaviour and only limited catalytic efficiency in an alkaline medium. Samples with 3CuO·5WO3·92(NH4)2HPO4 composition were tested for electrochemical applications using three electrolytes with 0.5, 2.5, and 5 M H2SO4 concentrations.
The substantially lower charge-transfer resistances observed for the sample tested in 0.5 M electrolyte indicates more efficient interfacial electron transfer processes and improved electrochemical reaction kinetics compared with those in the 5 M electrolyte. Among the studied systems, the sample tested in the 0.5 M H2SO4 solution appears to provide the most balanced electrochemical performance, combining a low Tafel slope, favourable charge-transfer and solution resistance characteristics, and a satisfactory current response. These results suggest that the use of 0.5 M H2SO4 electrolyte provides favourable electrochemical conditions and demonstrates promising potential for applications in electrochemical energy-conversion systems.
Author Contributions
Conceptualization, S.R. and L.P.; methodology, S.R. and L.P.; formal analysis, S.R., L.P. and D.F.; investigation, S.R., L.P. and D.F.; writing—original draft preparation, S.R. and L.P.; writing—review and editing, S.R. and L.P.; supervision, S.R.; project administration, S.R. and D.F.; funding acquisition, D.F. All authors have read and agreed to the published version of the manuscript.
Funding
This research was funded by the European Regional Development Fund through the Smart Growth, Digitalization and Financial Instruments Program 2021–2027, as part of the project “Romanian Hydrogen and New Energy Technologies Hub—Ro-HydroHub”, contract no. G 2025-113330 of 30 September 2025 (SMIS code 351358), contract no. G 2024-81692/390006 of 13 November 2024 (SMIS code 304724).
Data Availability Statement
The original contributions presented in this study are included in the article.
Acknowledgments
AI tools were used for checking and improving the academic quality of sentences.
Conflicts of Interest
The authors declare no conflict of interest.
References
- Kweon, D.H.; Jeon, I.Y.; Baek, J.B. Electrochemical catalysts for green hydrogen energy. Adv. Energy Sustain. Res. 2021, 2, 2100019. [Google Scholar] [CrossRef] [Scilit]
- Lai, F.; Shang, H.; Jiao, Y.; Chen, X.; Zhang, T.; Liu, X. Recent progress and perspective on electrocatalysis in neutral media: Mechanisms, materials and advanced characterizations. Interdiscip. Mater. 2024, 3, 492–529. [Google Scholar] [CrossRef] [Scilit]
- Chaudhary, M.; Singh, M.; Kumar, A.; Prachi; Gautam, Y.K.; Malik, A.K.; Kumar, Y.; Singh, B.P. Experimental investigation of Co and Fe-doped CuO nanostructured electrode material for remarkable electrochemical performance. Ceram. Int. 2021, 47, 2094–2106. [Google Scholar] [CrossRef] [Scilit]
- Jawad, M.S.; Tanveer, F.; Ahsan, R.R.; Rahman, M.A.; Billah, M.M. Hydrothermal synthesis of CuO nanostructures: Morphology controlled approaches for multifunctional performance—A review. J. Phys. Chem. Solids 2026, 208, 113018. [Google Scholar] [CrossRef] [Scilit]
- Brow, R.K. Review: The structure of simple phosphate glasses. J. Non-Cryst. Solids 2000, 263–264, 1–28. [Google Scholar] [CrossRef] [Scilit]
- Koudelka, L.; Hostinsky, T.; Mosner, P.; Montagne, L.; Revel, B.; Buryi, M.; Pavic, L. Structure and properties of silver phosphate glasses with tungsten trioxide. J. Non-Cryst. Solids 2026, 682, 124080. [Google Scholar] [CrossRef] [Scilit]
- Ouachouto, L.; Jerroudi, M.; Bih, L. Structure, chemical durability and mechanical properties of alkaline tungsten phosphate glasses. Mater. Today Proc. 2026, 121, 181–188. [Google Scholar] [CrossRef] [Scilit]
- Soufi, H.E.; Bih, L.; Benzineb, M. Study of tungsten phosphate glasses containing Fe2O3. New J. Glass Ceram. 2019, 9, 33–49. [Google Scholar]
- Renka, S.; Klaser, T.; Burazer, S.; Mosner, P.; Kalenda, P.; Santic, A.; Milankovic, A.M. High electronically conductive tungsten phosphate glass ceramics. Nanomaterials 2020, 10, 2515. [Google Scholar] [CrossRef] [Scilit] [PubMed]
- Mansingh, A.; Tandon, R.P.; Vaid, J.K. AC conductivity of tungsten phosphate glasses. Phys. Rev. B 1980, 21, 4829. [Google Scholar] [CrossRef] [Scilit]
- Yang, Y.; Peltier, C.R.; Zeng, R.; Schimmenti, R.; Li, Q.; Huang, X.; Yan, Z.; Potsi, G.; Selhorst, R.; Lu, X.; et al. Electrocatalysis in alkaline media and alkaline membrane-based energy technologies. Chem. Rev. 2022, 122, 6117–6321. [Google Scholar] [CrossRef] [Scilit] [PubMed]
- Osgood, H.; Devaguptapu, S.V.; Xu, H.; Cho, J.; Wu, G. Transition metal (Fe, Co, Ni and Mn) oxides for oxygen reduction and evolution bifunctional catalysts in alkaline media. Nano Today 2016, 11, 601–625. [Google Scholar] [CrossRef] [Scilit]
- Kuwik, M.; Dej, K.; Goryczka, T.; Pisarska, J.; Pisarski, W.A. Studies on structural and spectroscopic properties of germanate-phosphate glasses doped with Eu3+ ions. Spectrochim. Acta A 2026, 344, 126658. [Google Scholar] [CrossRef] [Scilit] [PubMed]
- Elsaghier, H.M.; Azooz, M.A.; Zidan, N.A.; Abbas, W.; Okasha, A.; Marzouk, S.Y. Spectroscopic and optical investigations on Er3+ ions doped alkali cadmium phosphate glasses for laser applications. J. Non-Cryst. Solids 2022, 588, 121616. [Google Scholar] [CrossRef] [Scilit]
- Abo-Naf, S.M.; El-Amiry, M.S.; Abdel-Khalek, A.A. FT-IR and UV–Vis optical absorption spectra of c-irradiated calcium phosphate glasses doped with Cr2O3, V2O5 and Fe2O3. Opt. Mater. 2008, 30, 900–909. [Google Scholar] [CrossRef] [Scilit]
- Vedeanu, N.; Cozar, O.; Stanescu, R.; Cozar, I.B.; Ardelean, I. Structural investigation of new vanadium–bismuth–phosphate glasses by IR and ESR spectroscopy. J. Mol. Struct. 2013, 1044, 323–327. [Google Scholar] [CrossRef] [Scilit]
- Carta, D.; Qiu, D.; Guerry, P.; Ahmed, I.; Abou Neel, E.A.; Knowles, J.C.; Smith, M.E.; Newport, R.J. The effect of composition on the structure of sodium borophosphate glasses. J. Non-Cryst. Solids 2008, 354, 3671–3677. [Google Scholar] [CrossRef] [Scilit]
- Ghoneim, N.A.; Abdelghany, A.M.; Abo-Naf, S.M.; Moustafa, F.A.; ElBadry, K.M. Spectroscopic studies of lithium phosphate, lead phosphate and zinc phosphate glasses containing TiO2: Effect of gamma irradiation. J. Mol. Struct. 2013, 1035, 209–217. [Google Scholar] [CrossRef] [Scilit]
- Abdelghany, A.M. Photochromic behavior of tungsten ions in sodium metaphosphate glass and effect of oxidizing condition assessed by spectroscopic analysis. J. Non-Cryst. Solids 2021, 552, 120460. [Google Scholar] [CrossRef] [Scilit]
- Möncke, D.; Ehrt, D. Photoinduced redox-reactions and transmission changes in glasses doped with 4d-and 5d-ions. J. Non-Cryst. Solids 2006, 352, 2631–2636. [Google Scholar] [CrossRef] [Scilit]
- Möncke, D.; Ehrt, D. Photoinduced redox reactions in Zr, Nb, Ta, Mo, and W doped glasses. Phys. Chem. Glasses-Eur. J. Glass Sci. Technol. B 2007, 48, 317–323. [Google Scholar]
- Sadeq, M.S.; El-Bashir, B.O.; Almuqrin, A.H.; Sayyed, M.I. The tungsten oxide within phosphate glasses to investigate the structural, optical and shielding properties variations. J. Mater. Sci. Mater. Electron. 2021, 32, 12402–12413. [Google Scholar] [CrossRef] [Scilit]
- Allaham, M.; Dalaev, R.; Burda, D.; Sobola, D.; Nebojsa, A.; Knapek, A.; Mousa, M.S.; Kolarik, V. Energy gap measurements based on enhanced absorption coefficient calculation from transmittance and reflectance raw data. Phys. Scr. 2024, 99, 025952. Available online: https://iopscience.iop.org/article/10.1088/1402-4896/ad1cb8/pdf (accessed on 1 October 2026). [CrossRef] [Scilit]
- Makula, P.; Pacia, M.; Macyk, W. How to correctly determine the band gap energy of modified semiconductor photocatalysts based on UV-Vis spectra. J. Phys. Chem. Lett. 2018, 9, 6814–6817. [Google Scholar] [CrossRef] [Scilit] [PubMed]
- Sun, C.; Xue, D. In Situ IR Spectral Observation of NH4H2PO4 Crystallization: Structural Identification of Nucleation and Crystal Growth. J. Phys. Chem. C 2013, 117, 19146–19153. [Google Scholar] [CrossRef] [Scilit]
- Rambadery, O.V.; Kumar, A.; Sati, A.; Sagdeo, P.R. Exploring the interrelation between Urbach energy and dielectric constant in HF-Substituted BaTiO3. ACS Omega 2021, 6, 32231–32238. [Google Scholar] [CrossRef] [Scilit] [PubMed]
- Piscoiu, D.; Rada, S.; Vermesan, H. Enhancing electrochemical properties of vitreous materials based on CaO-Fe2O3-Fe-Pb and recycled from anodic plate of a spent car battery. Materials 2025, 18, 2017. [Google Scholar] [CrossRef] [Scilit] [PubMed]
- Dong, B.; Qiu, Q.; Gu, Z.; Xiang, J.; Huang, C.; Fang, Y.; Xing, F.; Liu, W. Characterization of carbonation behavior of fly ash blended cement materials by the electrochemical impedance spectroscopy method. Cem. Concr. Compos. 2016, 65, 118–127. [Google Scholar] [CrossRef] [Scilit]
- Barbosa, R.A.; Hansen, S.G.; Hansen, K.K.; Hoang, L.C.; Grelk, B. Influence of alkaline—Silica reaction and crack orientation on the uniaxial compressive strength of concrete cores from slab bridges. Constr. Build. Mater. 2018, 176, 440–451. [Google Scholar] [CrossRef] [Scilit]
- Rada, R.; Manea, D.L.; Rada, S.; Fechete, R. Circular economy of construction and demolition waste for nanocomposite cement: XRD, NMR, Vickers, Voltammetric and EIS characterization. Nanomaterials 2024, 14, 1239. [Google Scholar] [CrossRef] [Scilit] [PubMed]
- Shinagawa, T.; Esparza, A.T.G.; Takanabe, K. Insight on Tafel slopes from a microkinetic analysis of aqueous electrocatalysis for energy conversion. Sci. Rep. 2015, 5, 13801, Correction in Sci. Rep. 2022, 10, 6899. https://doi.org/10.1038/s41598-020-62993-x. [Google Scholar] [CrossRef] [Scilit] [PubMed]
- Zhao, N.; Shi, Z.; Girard, F. Superior proton exchange membrane fuel cell (PEMFC) performance using short side chain perfluorosulfonic acid (PFSA) membrane and ionomer. Materials 2022, 15, 78. [Google Scholar] [CrossRef] [Scilit] [PubMed]

Disclaimer/Publisher’s Note: The statements, opinions and data contained in all publications are solely those of the individual author(s) and contributor(s) and not of MDPI and/or the editor(s). MDPI and/or the editor(s) disclaim responsibility for any injury to people or property resulting from any ideas, methods, instructions or products referred to in the content. |
© 2026 by the authors. Licensee MDPI, Basel, Switzerland. This article is an open access article distributed under the terms and conditions of the Creative Commons Attribution (CC BY) license.