


Abstract
Screening of retired lithium ion cells limits second-life deployment, because full characterization resolves retention well yet occupies a test channel for hundreds of hours per cell. This study measures how much screening information each chronologically available block carries once the physical grouping of retired cells is respected, using a primary source with 1034 retired notebook cell records from 152 retired notebook packs, of which 100 cells carry delayed capacity trajectories, and a stored pack yield summary excluded as outcome derived. Holding out whole packs, battery history reaches 0.686 balanced accuracy for source-defined second-life eligibility, physical observations 0.761, and early electrical diagnostics 0.862; the paired bootstrap interval for that last step excludes zero, the balanced error rate falls by 56 percent, and false rejections fall from 17 to 6 of 36 eligible cells. The ordering holds at any matched threshold, where the early block never produces more false rejections than history alone, and in an independent 86 cell NCM(523)/graphite cohort, five explicit diagnostics raise holdout accuracy from 0.660 to 0.743 whereas 108 implicit features reach 0.627. Screening therefore benefits from a staged design: history provides a first pass, early diagnostics refine the decision, and full characterization qualifies.
1. Introduction
Second life deployment of retired lithium ion batteries is limited first by screening. Cells that leave a battery pack differ in age, duty cycle, temperature exposure and cell-to-cell spread, so a batch presented for a second life application contains units whose remaining performance ranges from adequate to unusable [1,2]. Retaining an unsuitable cell creates a warranty and safety exposure, while rejecting a suitable cell destroys value that the second life step was intended to capture. Sorting and qualification therefore sit between collection and every second life product, and their cost is set by measurement rather than by material handling. Three routes are distinguished throughout: a reuse route returns a cell to a duty comparable to its original one, a repurposing route reassembles cells into a different application, and a recycling route recovers material. The first two are the second-life routes examined here, and a cell is second-life eligible when the source records assign it to either of them.
The measurement problem is a problem of time and channel capacity. Residual capacity and retention can be resolved accurately by cycling or by a full electrical characterization sequence, and state estimation and trajectory prediction methods now reach high accuracy on such references [2,3,4,5]. A complete sequence, however, occupies a test channel for hundreds of hours per cell and is difficult to scale to incoming volumes, which is why industrial screening practice relies on short diagnostics and on whatever information arrives with the unit [6,7,8]. The operating question is therefore not the accuracy of a health estimate in isolation, but whether information that is already recorded, or that can be obtained cheaply and early, changes which cells are sent on to qualification and which are redirected.
Historical battery information is the resource that regulation now makes available. Regulation (EU) 2023/1542 establishes a digital battery passport for batteries placed on the European market, and the accompanying data point specifications define the fields that economic operators must be able to access [9,10,11]. Governance and requirement studies have mapped stakeholder needs, data availability and the remaining implementation barriers [12,13,14], and application studies have examined how passport content maps onto second life use cases [15,16]. An experimental assessment of passport sufficiency has shown that a nominal state of health field does not certify the thermal, electrical or durability requirements of a finished second life product [16]. These results establish what a passport should contain.
The literature that actually uses passport or history information for a performance assessment made after use is thinner, and it defines the gap addressed here. Experimental passport assessment evaluates whether the recorded fields satisfy the requirements of a target second life application [16]. Traceability studies examine which data points a passport can realistically expose along the second life chain, and material flow studies use passport data to project stocks and flows rather than to evaluate individual units [17]. Value assessments estimate what passport information could be worth to a recycling market when acquisition costs and payoffs are assumed in advance [11]. Across these strands, the passport is assessed as a document, as a traceability layer or as a market input, and the quantity that a receiving operator needs at intake, namely how much a set of passport-compatible fields adds to a screening decision once the physical grouping of retired cells is respected, is not measured.
That quantity is a specific and testable one, and it has an operational form: whether passport-compatible history, once available, measurably improves a cell-level screening decision taken before a full characterization is paid for. A methodological obstacle sits between this question and the reported accuracy in the field. Reported accuracy for retired cell classification is often obtained under random cell-level splits, under which cells that shared one original pack appear in both training and evaluation data [18,19]. Cells from a single pack share manufacturing lot, thermal history and pack electronics, so such a split measures interpolation within a physical unit rather than transfer to a new unit. A related obstacle is information access time. Capacity, energy and relaxation measurements are recorded during the paid characterization, and a model that uses them can report high discrimination while being unusable as a stopping criterion for that same characterization. A third obstacle is a stored summary that is derived from the measurement it appears to predict, which turns a target into an input. None of the three obstacles is visible in a reported accuracy value, and each of them raises the apparent value of battery history or of a nominally early feature.
This study quantifies how much screening information each chronologically available block carries, using evaluation that respects the physical grouping of retired cells. Three questions are addressed:
- (1)
- How much second life screening information is contained in battery history and passport-compatible fields before any electrical test, and how much do physical observations after recovery add?
- (2)
- How much additional discrimination do early electrical diagnostics provide, and how do the resulting decision errors change?
- (3)
- What trade-off between screening errors and recorded testing burden results when only information that is genuinely available before the completion of characterization is used?
An independent cell cohort with a different cathode chemistry and a different first life protocol distribution is evaluated under protocol holdout prediction to test whether the diagnostic mechanism transfers to a separate physical system. The contribution is the measurement of one screening proposition: the incremental value that each information block carries at the decision point where a receiving operator can actually use it, with the group and the information access time controlled, and with the resulting decision errors translated into recorded testing burden. The evidence separates what the records identify from what they leave open, and Section 4.5 sets out the boundary of the claims in one place.
2. Materials and Methods
2.1. Datasets and Battery Populations
2.1.1. Linked Retired Notebook Cell Records
The primary source is the fourth version of the public Mendeley collection of retired notebook battery cells [20], released with a study of notebook packs and the cells recovered from them [21,22]. The cell workbook contains 1034 rows that link to 152 original battery packs through the pack code and the cell number, with no duplicate pack key, no duplicate cell key within a pack and no unmatched cell to pack code. It reports battery management system fields, cell-level measurements, visual inspection flags, electrical characterization results, measured capacity, discharge energy and a recorded test duration per cell. The pack workbook adds pack-level battery management system summaries. A linked outcome subset comes from the thesis data release [22,23]: 100 characterized cells with a recorded capacity trajectory over 100 s life cycles. Every one of these cells matches the 2019 workbook exactly on the pack code and cell number, and all 100 carry a recorded test duration. The 100 cells originate from 16 original packs, so the outcome subset is an outcome-linked subsample of one collection rather than an independent campaign. The composition of those 16 packs matters for how the grouped evaluation must be read, and it is reported in full in Section 3.1: 15 of the 16 packs contain cells of a single source class, and the sixteenth contains 5 eligible and 3 ineligible cells. The pack is therefore close to the level at which the source assigned the class, so a pack-level holdout removes a class-homogeneous group and leaves no within-pack class information available to the model.
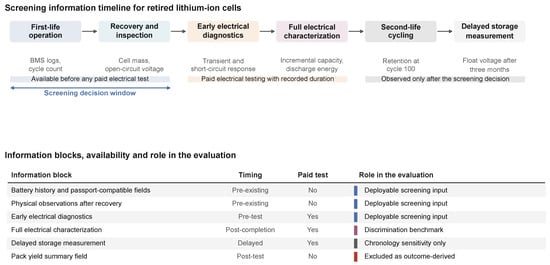
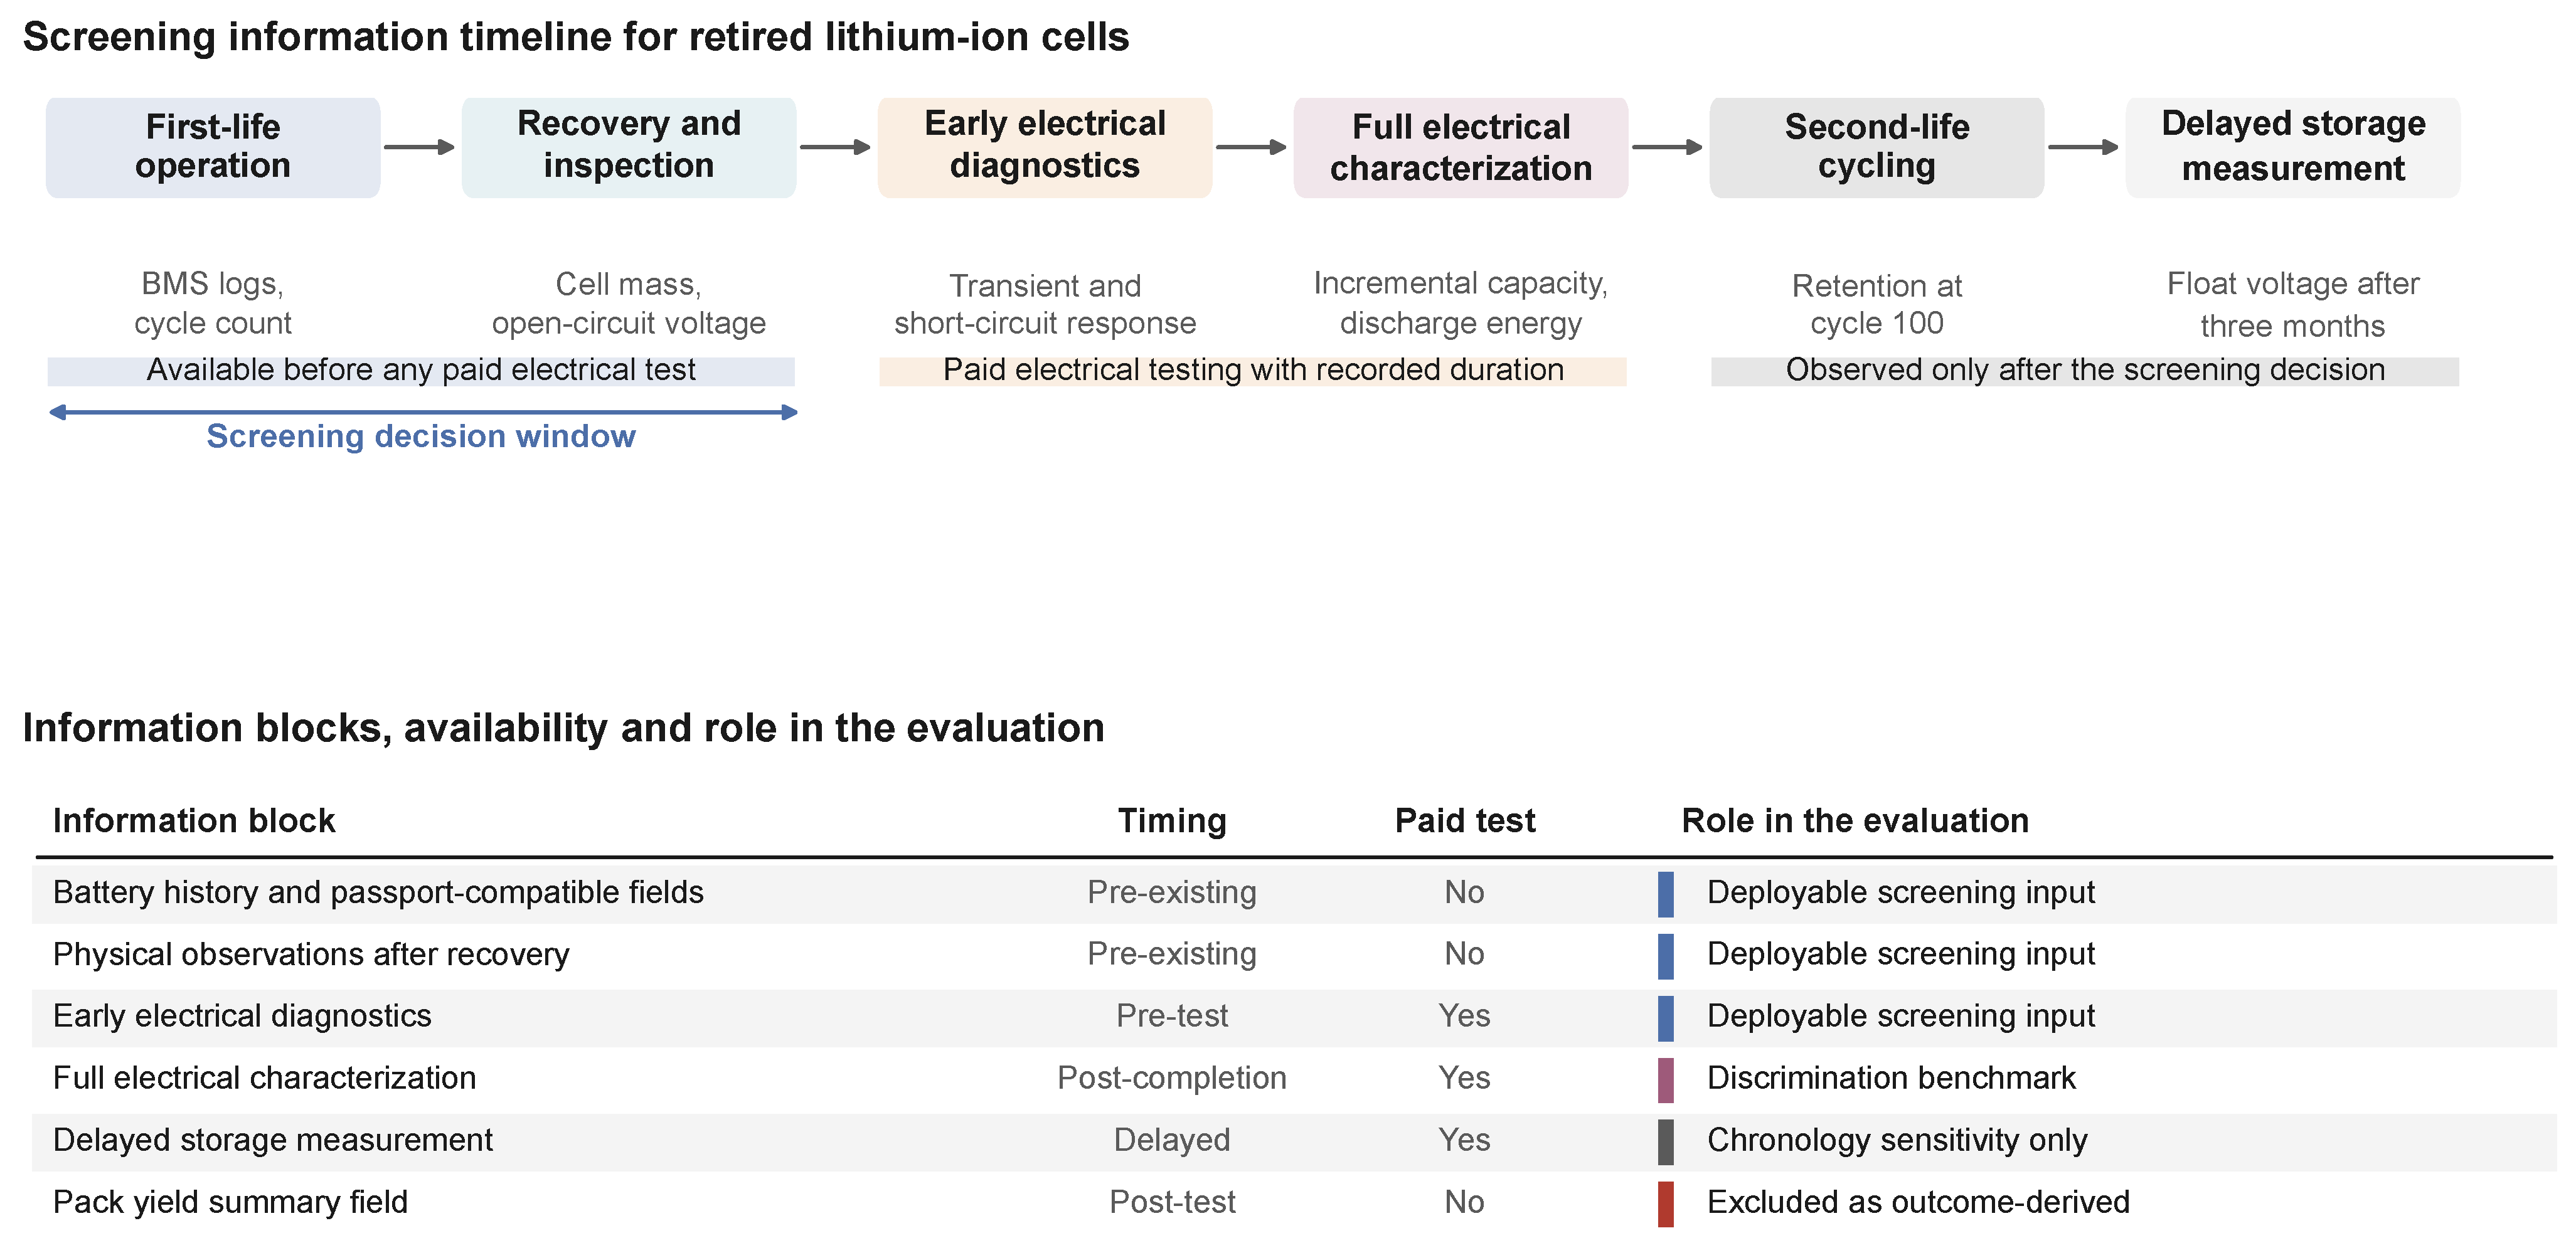
Forty-five cells were rejected at visual inspection and have no electrical record. Of the remaining 989 cells with an electrical characterization record, 487 reach at least 70 percent of nominal capacity. Visually rejected cells are retained as missing information and are not assigned a zero capacity, because an unperformed measurement is not a measured failure. Table 1 summarizes the populations, and Figure 1 shows the sequence in which the corresponding information becomes available.
Table 1.
Audited battery populations and outcomes. Counts are taken from the linked public records.
Figure 1.
Screening information timeline for retired lithium ion cells. The upper panel places the six stages of a retired cell on the physical timeline and marks the window in which a screening decision can be taken. The lower panel lists the information blocks used in the evaluation with their availability and their role. The pack yield summary is outcome-derived and is excluded from all models, and the delayed storage measurement is restricted to a chronology sensitivity.
In this study, the term passport-compatible information denotes historical battery information of the type that a battery passport could make available, namely pack and cell age, battery management system cycle count and battery management system capacity relative to rated capacity. The source collection predates the implementation of the European battery passport and is not itself an operational passport dataset. The term is used for the information class, not as evidence about a deployed passport system.
2.1.2. Independent Cell Cohort
For an independent physical test of the diagnostic mechanism, the processed records released with Wang, Gao and Tian are used [24,25]. The collection contains 86 commercial NCM(523)/graphite Lishen LR1865SZ cells of 2.4 Ah nominal capacity, assigned to 16 distinct first-life protocols and then cycled under one standardized second-life protocol. For each cell, the released feature file reports five explicit snapshot measurements, namely capacity, voltage, internal resistance, coulombic efficiency and energy efficiency, together with 108 implicit features extracted from the first second life diagnostic cycle at which capacity reached the source retirement criterion. The trajectory file provides a spline-interpolated capacity series from every fifth cycle measurement. The cycle 151 value of that series is used only as a future physical endpoint. Battery identifiers and the 16 protocol groups were reconciled against the released first rows and the identity map before grouping. This cohort carries no passport history, no route allocation, no processing cost and no product output, so it tests transfer of a chronology-based diagnostic signal to a separate retention screen.
2.2. Second-Life Screening Targets
The primary target is a source-defined eligibility indicator,
where , 1 and 2 denote the recycle, repurpose and reuse classes assigned by the source from delayed cycling performance under a defined second-life protocol. The indicator is interpreted as source-defined second-life eligibility rather than as an observed operator route, and it does not certify safety or a commercial product. The secondary target is a physical retention endpoint,
with the number of observed cycles and relative capacity at cycle 100. The continuous value is also modeled for the 93 complete trajectories. For the independent cohort, the endpoint is , which yields 44 positive and 42 negative cells. Seven truncated trajectories end below the 70 percent threshold before the final recorded cycle and are retained as failures for the explicitly defined 100-cycle endpoint.
2.3. Chronology of Information Blocks
Each variable is assigned to the earliest point at which a receiving operator could obtain it, and the assignment is conservative: a field is not treated as free because it appears in a downloadable file. Five blocks are defined, and Table 2 lists them in the order used throughout.
Table 2.
Information blocks, availability and role in the evaluation. Variable identifiers follow the source workbook column order; the complete mapping with measurement families is given in Supplementary Table S1.
The pack yield summary field is excluded because it reproduces, to numerical precision, the fraction of cells in the original pack whose measured capacity reaches 70 percent. It behaves like a passport field in the file, since it is stored beside the battery management system fields, but it is computed after characterization and is therefore an outcome-derived summary. Treating it as an input would convert the target into a shortcut. The three pack-level battery management system fields are also incomplete. Of the 152 packs, the remaining capacity ratio field is absent in 47 packs, the cycle count field is absent in 45 packs, and the diagnostic status field is absent in 39 packs, so each field is available for between 105 and 113 packs. Median imputation inside each training fold provides the computational fallback for those entries.
The linkage between the two Salinas releases provides an internal consistency check. Initial voltage equals the earlier recorded open-circuit voltage, discharge capacity equals the earlier measured capacity, and discharge energy equals the earlier measured energy for all 100 cells, and the pack cycle count equals the 2019 pack field. The battery management system capacity ratio agrees with the rounded pack field to within 0.1 percentage points, with a maximum absolute fraction difference of 0.00096. These agreements verify the linkage and do not constitute independent validation.
2.4. Leakage Control and Grouped Validation
Predictions hold out whole original packs. In each fold, one pack is left out, the model is fitted on the remaining packs and predicts the held-out pack, so duplicate pack histories and shared pack-level conditions cannot appear on both sides of the evaluation boundary. This follows the requirement that grouped validation respect hierarchical dependence [18], and it avoids the optimistic error estimates that arise when model selection and threshold selection reuse the same held-out predictions [19]. No feature selection and no decision threshold is tuned on held-out outcomes. In the independent cohort, the comparable grouping unit is the first life protocol, and each of the 16 protocols is held out in turn.
Three leakage channels are controlled explicitly. Group leakage is removed by holding out the physical pack or the protocol. Feature leakage is removed by assigning every variable to a block at or after its availability time and by excluding the delayed measurements, and those recorded after completion, from the stopping analysis. Label construction leakage is removed by excluding the pack yield summary field from all models.
2.5. Classification and Regression Models
For each information block, a fixed L2-regularized logistic regression predicts the binary target, with numeric features median imputed and standardized on the training packs only, and the regularization constant fixed at . A ridge regression with predicts the continuous cycle 100 capacity. The models are deliberately transparent so that the information block, the grouping, the imputation boundary and the decision threshold remain inspectable, and they are not presented as state of the art diagnostic algorithms. For the independent cohort, the same fixed pipeline is fitted to four blocks: capacity alone, the five explicit snapshot measurements, the 108 implicit single-cycle features, and the union of the explicit and implicit blocks.
2.6. Performance Metrics and Uncertainty
The primary discrimination measure is balanced accuracy, because the second life target contains 36 positive cells against 64 negative cells, while the retention target contains 25 positive cells against 68 negative cells. Eligible cell recall, specificity for the ineligible class, the area under the receiver operating characteristic curve (AUROC), macro F1 and Brier score are reported alongside it. Precision and recall behavior are inspected because class imbalance can make ROC summaries appear more favorable than the underlying trade-off [26]. For the continuous endpoint, mean absolute error, root mean squared error, and Spearman correlation are reported. Uncertainty intervals are percentile intervals from 1000 bootstrap resamples of the 16 physical packs, with cells retained inside their sampled pack; in the independent cohort, intervals come from 1000 protocol cluster resamples. The intervals describe variation over the observed groups conditional on the fixed predictions and do not repair the absence of external batches. Reporting follows the transparency principles for multivariable prediction models adapted to a screening and decision context [27].
Two intervals are reported for every comparison between information blocks. The first is the marginal interval of each block, which answers how well the block performs on its own. The second is a paired interval for the difference, which answers the question a screening decision actually poses, namely whether the richer block outperforms the poorer one. The paired interval is obtained from the same predictions, made with one pack left out, by resampling the 16 packs with replacement 10,000 times. In each resample, both blocks are scored on the same drawn cells, and the difference in balanced accuracy is recorded, so the shared variation between the two blocks cancels. The reported interval is the percentile interval of that difference, and the share of resamples in which the difference is positive is reported alongside it. Marginal intervals can overlap substantially while the paired interval for the difference excludes zero, and in that situation, the paired interval is the relevant evidence for the comparison.
As a wider same-source check, the pack holdout procedure is also applied to the 989 cells with a measured capacity, spanning 150 packs. The endpoint is the indicator of measured capacity after characterization at or above 70 percent, and the only inputs are the battery management system capacity field available before the decision, either alone or together with the cycle count field.
2.7. Screening Resource and Risk Analysis
Let be the probability, computed with one pack left out, that cell i is eligible under information block s. For the deployable blocks, namely battery history, history with physical observations, and early diagnostics, and for a threshold , the stopping replay withholds cell i from the reference sequence when . The replay records
where is the recorded electrical channel duration of cell i and is the number of eligible cells that the replay would discard. The recorded duration attached to stopped cells is a replay quantity that precedes any deduction of the acquisition and verification time of the information used to stop them, and Section 4.5 sets out how it relates to facility-level savings. The duration is not converted to a currency value, and measured discharge energy is not equated with test station electricity consumption or with recovered material output. Full characterization and the delayed measurement are excluded from the replay, because using a quantity observed during or after the paid sequence to claim that the same sequence could have been stopped is a timing error rather than a screening result.
The linked records also contain voltage and capacity screening scenarios. Total workload is reconstructed as the sum of selected test durations including cells that later fail. The scenarios work in two steps. A voltage gate decides which cells are sent to a capacity test, and a capacity criterion then decides which of the tested cells qualify. In the 1.5 V and 70 percent scenario, 768 of the 989 cells with a characterization record pass the voltage gate and are therefore tested. Of those 768 tested cells, 418 also meet the capacity criterion, which means 350 cells are tested and then rejected. The recorded duration is 3890.53 h for all 768 tested cells against 2255.42 h for the 418 qualified cells, so 1635.11 h, or 42 percent of the workload, are spent on tests whose outcome is a rejection. Reporting recorded duration only for accepted cells would therefore understate the screening workload.
2.8. Sensitivity Analyses
Four controls are applied. First, simple deterministic rules based on battery management system state of health and on measured initial capacity provide model-free comparators, with the measured capacity rules treated as paid test benchmarks. Second, the full characterization block is refitted after removing all direct ampere hour and watt hour variables, to test whether the block carries information beyond a capacity shortcut. Third, the delayed measurement is added to the full block as a chronology sensitivity only. Fourth, the complete threshold sweep from 0 to 1 in steps of 0.01 is reported for every deployable block in Supplementary Table S2, so that the two operating points discussed in Section 3.3 are read as illustrative points on a reported curve rather than as tuned optima.
3. Results
3.1. Characteristics of the Retired Cell Populations
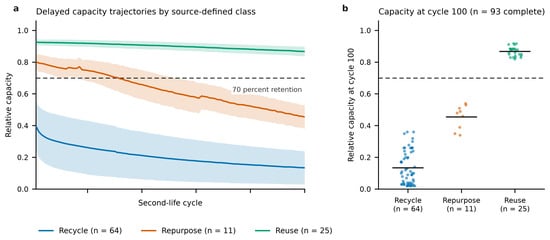
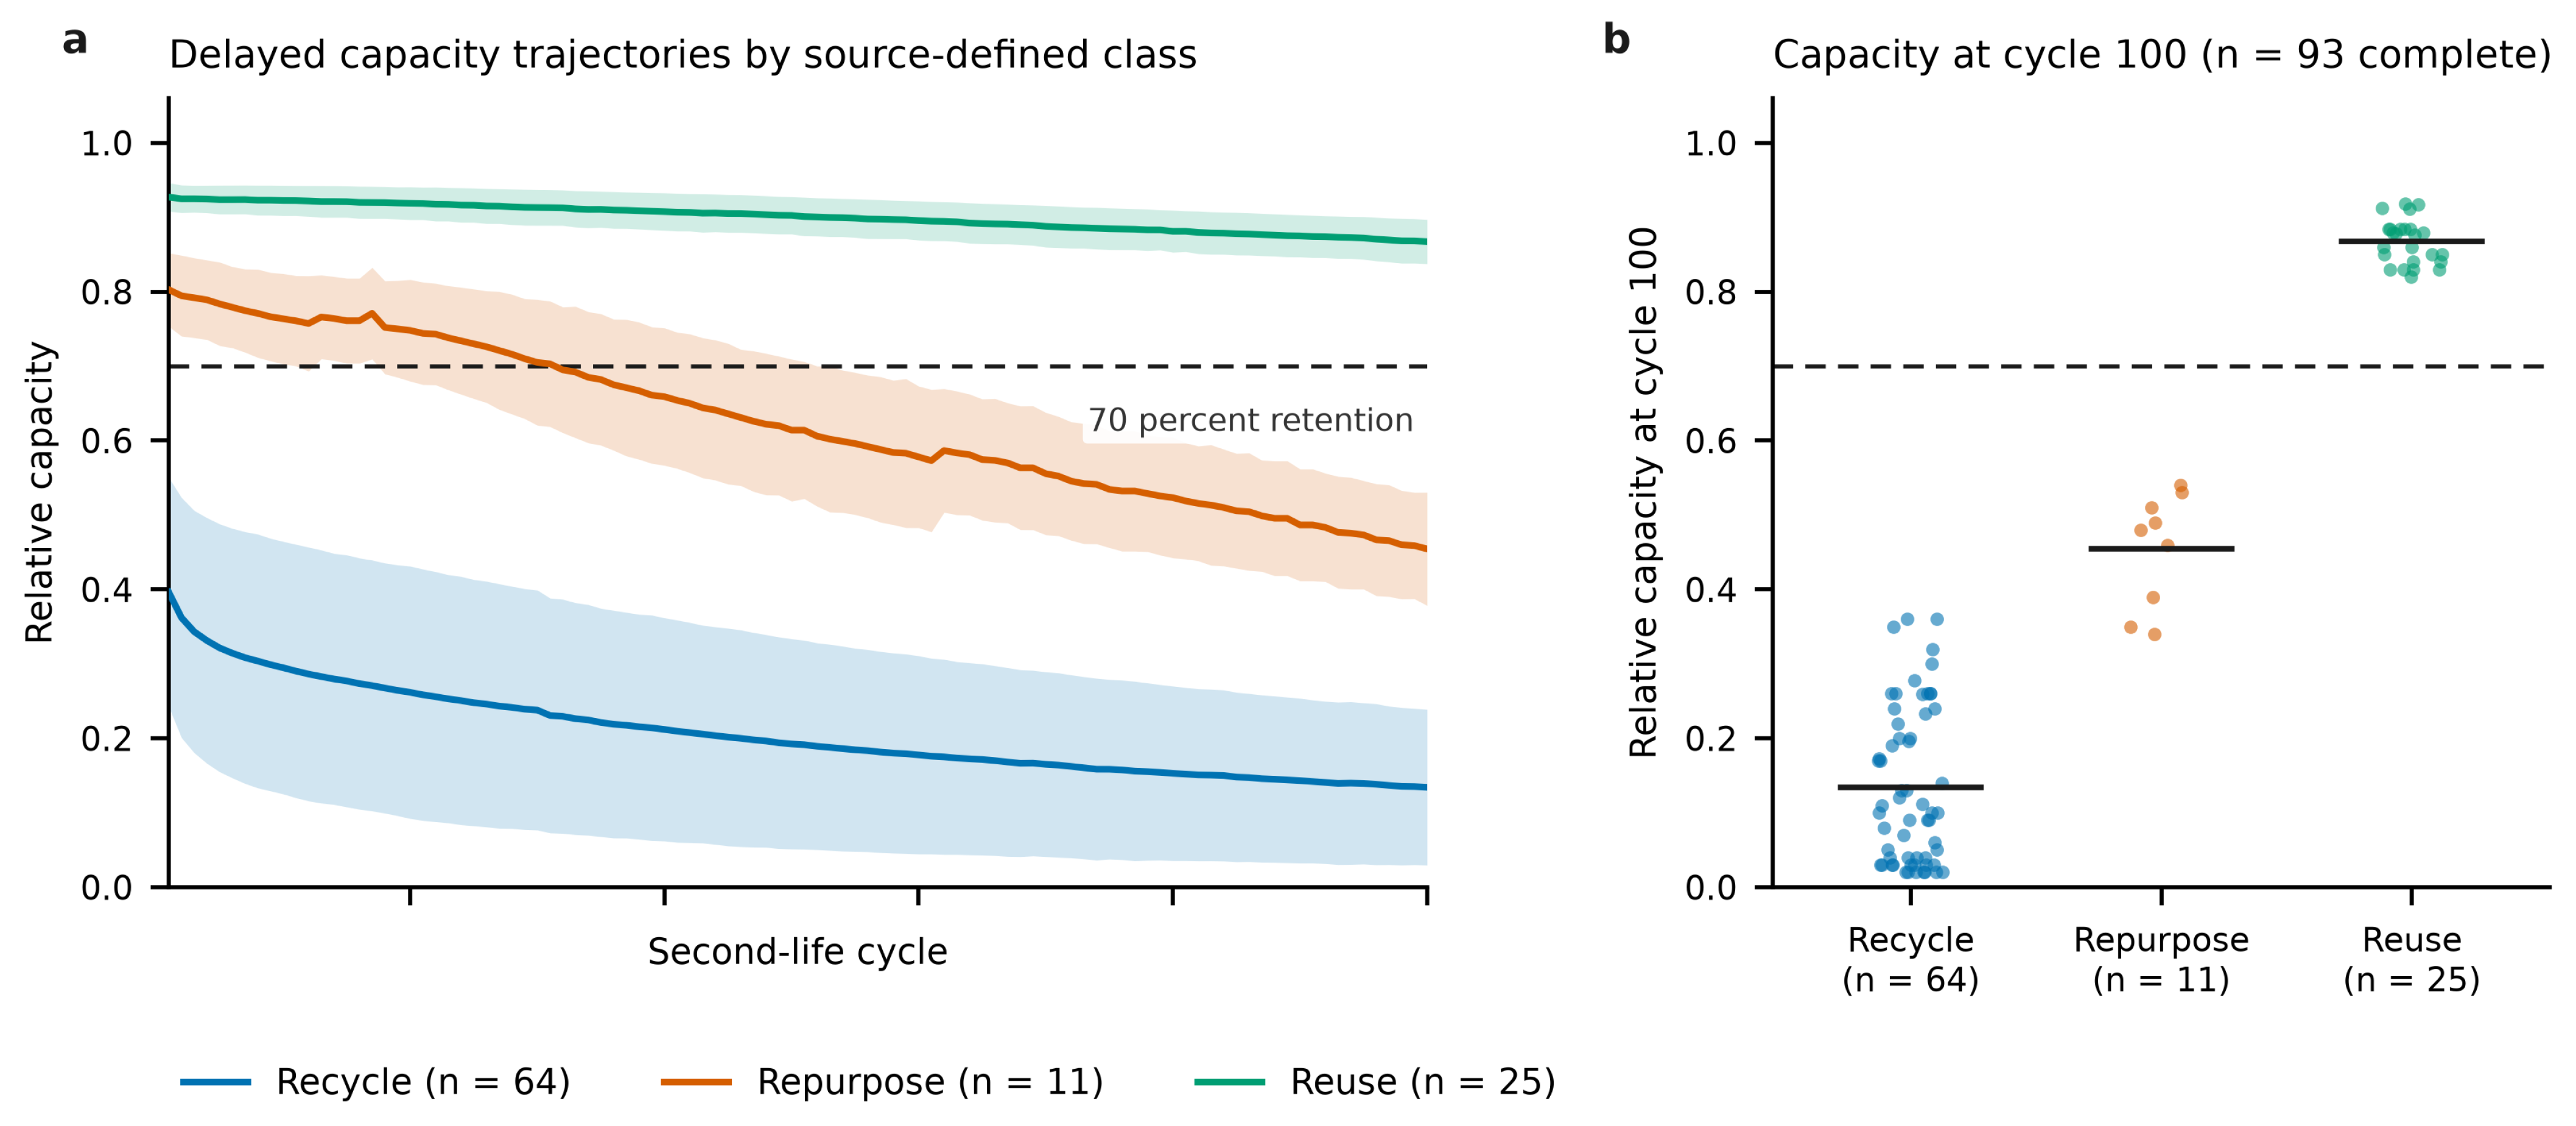
The delayed trajectories separate the source-defined classes over 100 s life cycles (Figure 2). Cells labeled for reuse remain close to nominal capacity throughout; the repurpose group declines faster, and the recycle group falls below the 70 percent threshold well before the end of the sequence. The separation is visible in the mean trajectory and also in the distribution of relative capacity at cycle 100, where the three groups occupy largely distinct ranges.
Figure 2.
Delayed capacity of retired notebook cells over 100 s life cycles. Panel (a) shows the mean relative capacity per source-defined class with one standard deviation bands over cells. Panel (b) shows relative capacity at cycle 100 for the 93 complete trajectories, with the group means marked. The dashed line marks 70 percent retention. Bands and points describe the source protocol and are not observations of a commercial route choice.
The composition of the 16 packs behind these 100 outcomes fixes how the grouped estimates must be read, and it is stated here in full. Ten packs contain no second-life eligible cell, five packs contain only eligible cells, and one pack contains five eligible and three ineligible cells. Fifteen of the sixteen packs are therefore single class, and the eligible share per pack is either 0 or 1 for all but one pack. Two consequences follow. First, a fold that leaves one pack out removes a class-homogeneous group, so no within-pack class information is available to the model, and the reported performance is a transfer estimate across physically distinct packs rather than an interpolation within them. Second, the effective number of independent class-homogeneous units is small, which is the direct reason the pack bootstrap intervals in Table 3 are wide. A cell-level random split would answer a different and considerably more optimistic question than the pack-level evaluation used here, because it would place cells of the same class and the same pack on both sides of the boundary.
Table 3.
Pack level screening performance by information block. Recall is recall of the positive class and specificity is specificity for the ineligible class. Intervals are 2.5th to 97.5th percentiles from 1000 pack bootstrap resamples. AUROC, Brier score and macro F1 are reported in Supplementary Table S3.
The wider capacity check places the historical signal at a measurable and consistent level. With the battery management system capacity field alone, pack holdout balanced accuracy against the measured capacity endpoint is 0.656 (95 percent interval 0.583 to 0.719; AUROC 0.676), and adding the cycle count field gives 0.650 (0.578 to 0.719; AUROC 0.662). Across 989 cells and 150 packs, which is the largest population available in this study, the historical field carries real screening information, and the additional cycle count field leaves this capacity endpoint unchanged.
3.2. Screening Performance from Battery History, Physical Observations and Early Diagnostics
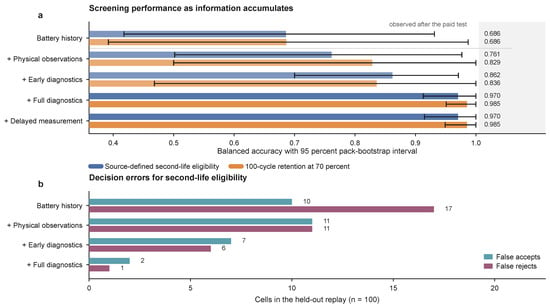
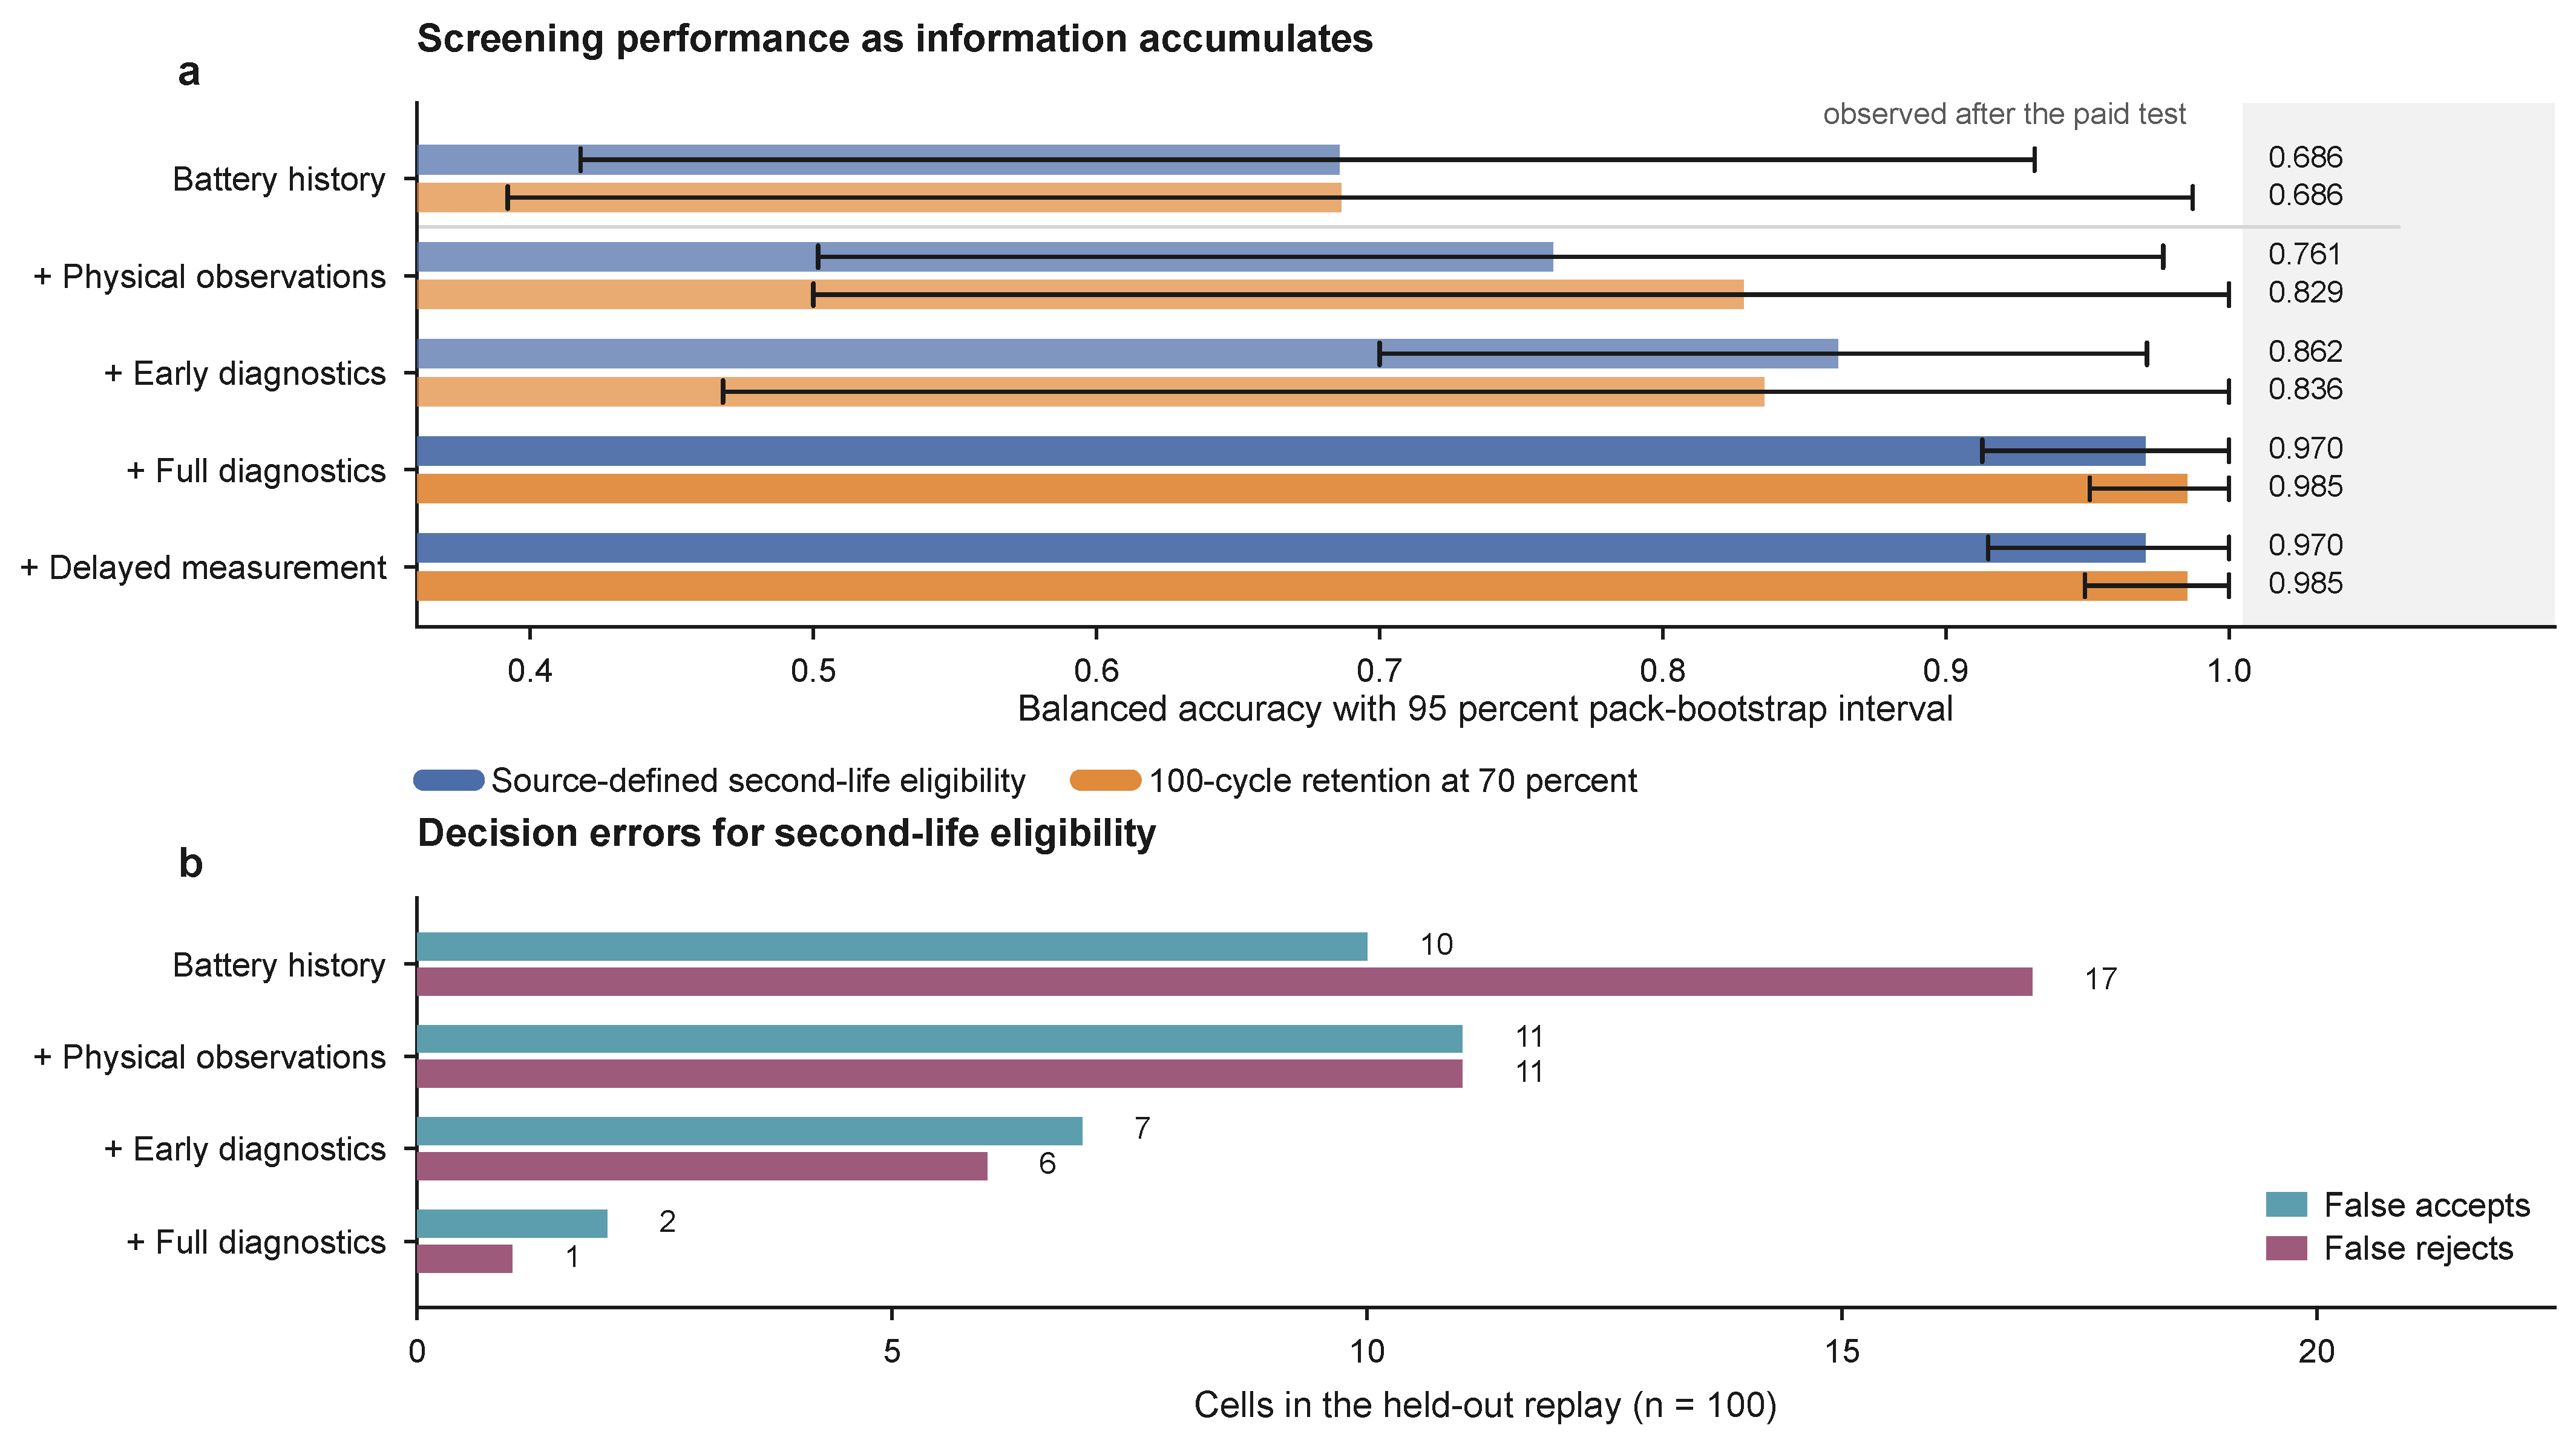
Table 3 and Figure 3 report the main pack-level results for both targets. Battery history and passport-compatible fields already carry usable screening information for source-defined eligibility, with a balanced accuracy of 0.686 and a specificity of 0.844, while recall of eligible cells is 0.528 and the pack bootstrap interval spans 0.418 to 0.931. Adding the two physical observations available after recovery raises balanced accuracy to 0.761 and recall to 0.694. Adding the early transient diagnostics raises balanced accuracy to 0.862, recall to 0.833 and specificity to 0.891, and the Brier score falls from 0.216 to 0.097. The step from history to early diagnostics therefore cuts the balanced error rate of the screening decision by 56 percent, from 0.314 to 0.138, and the Brier score by 55 percent, which is the largest improvement available from information that precedes the paid sequence. Full characterization reaches 0.970 through measurements recorded during or after the reference sequence, so it functions as the qualification benchmark at the end of the staged screen. Adding the delayed measurement leaves the balanced accuracy unchanged at 0.970 and improves no reported confusion count. The same ordering holds for the physical retention endpoint, where battery history, early diagnostics and full characterization attain 0.686, 0.836 and 0.985.
Figure 3.
Screening performance as information accumulates. Panel (a) shows pack-level balanced accuracy with 95 percent pack bootstrap intervals for the source-defined eligibility target and for the 100-cycle retention target; the shaded region marks the full characterization blocks, which are observed after the paid reference test. Panel (b) resolves the replay into false acceptances and false rejections for the four before completion and benchmark blocks.
The wide intervals are a property of the evidence rather than of the presentation: 16 source packs bound the precision of every estimate in Table 3, and the interval for battery history recall reaches zero at its lower end. The supported statement is that history available before the decision contains screening information in this source, not that a fixed field effect transfers unchanged to incoming populations.
Because the marginal intervals overlap, they cannot by themselves settle whether the progression is real. Table 4 therefore reports the paired interval for the difference between blocks, computed on the same resampled packs as described in Section 2.6. For second-life eligibility, the step from battery history to early diagnostics is 0.176 in balanced accuracy with a 95 percent paired interval of 0.005 to 0.384, and the difference is positive in 97.7 percent of the 10,000 resamples, so the improvement survives the overlap of the marginal intervals. The step from early diagnostics to full characterization is 0.109 (0.024 to 0.218), also excluding zero. The two smaller steps are not resolved by this design: physical observations alone add 0.076 (minus 0.038 to 0.267) and early diagnostics on top of physical observations add 0.101 (minus 0.007 to 0.248), each positive in about three quarters to 96 percent of resamples. For the 100-cycle retention target, none of the paired intervals excludes zero, so for that endpoint, the ordering in Table 3 is a point estimate ordering rather than a resolved difference. The claim carried by this evidence is accordingly narrow and explicit: the gain from battery history to early diagnostics is resolved for the eligibility target, the intermediate steps and the retention target are not, and the retention ordering should be read as consistent with the eligibility result rather than as independent confirmation of it.
Table 4.
Paired pack bootstrap analysis of the difference in balanced accuracy between information blocks. Both blocks are scored on the same resampled cells in each of 10,000 pack resamples, so the shared variation cancels. The interval is the 2.5th to 97.5th percentile interval of the difference, and the last column is the share of resamples in which the richer block scores higher. A difference whose interval excludes zero is resolved by this design; a difference whose interval spans zero is not.
The confusion counts make the mechanism concrete (Figure 3b). For second-life eligibility, battery history predictions produce 54 true negatives, 10 false acceptances, 17 false rejections and 19 true positives. Early diagnostics change these counts to 57, 7, 6 and 30, so the early block avoids 11 false rejections and 4 false acceptances relative to history alone in this linked replay, which is a reduction of 65 percent in the number of eligible cells that the screen would otherwise discard. Full characterization changes them to 62, 2, 1 and 35 and avoids 16 and 8, respectively. The block that changes the error structure most is therefore not the one that completes the paid sequence but the small transient measurement set that precedes it.
For the continuous cycle 100 endpoint, battery history yields a mean absolute error, with one pack left out, of 0.249 and of 0.071 (95 percent interval to 0.664). Early diagnostics reduce the mean absolute error to 0.236 and raise to 0.232, and full characterization reduces it to 0.131 with of 0.762. Adding the delayed measurement gives 0.132 and 0.759, so the delayed field carries no incremental regression value. The three-class source label is markedly less stable than the binary target, with macro-balanced accuracy of 0.509, 0.601 and 0.838 for history, early diagnostics and full characterization. The repurpose class contains 11 cells and is absent from the training side of some held-out pack folds, so predictions fall back to a constant there, and the binary endpoint remains the appropriate primary target for the available evidence.
3.3. Resource and Risk of a Screening Policy
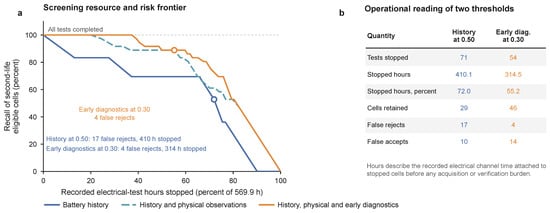
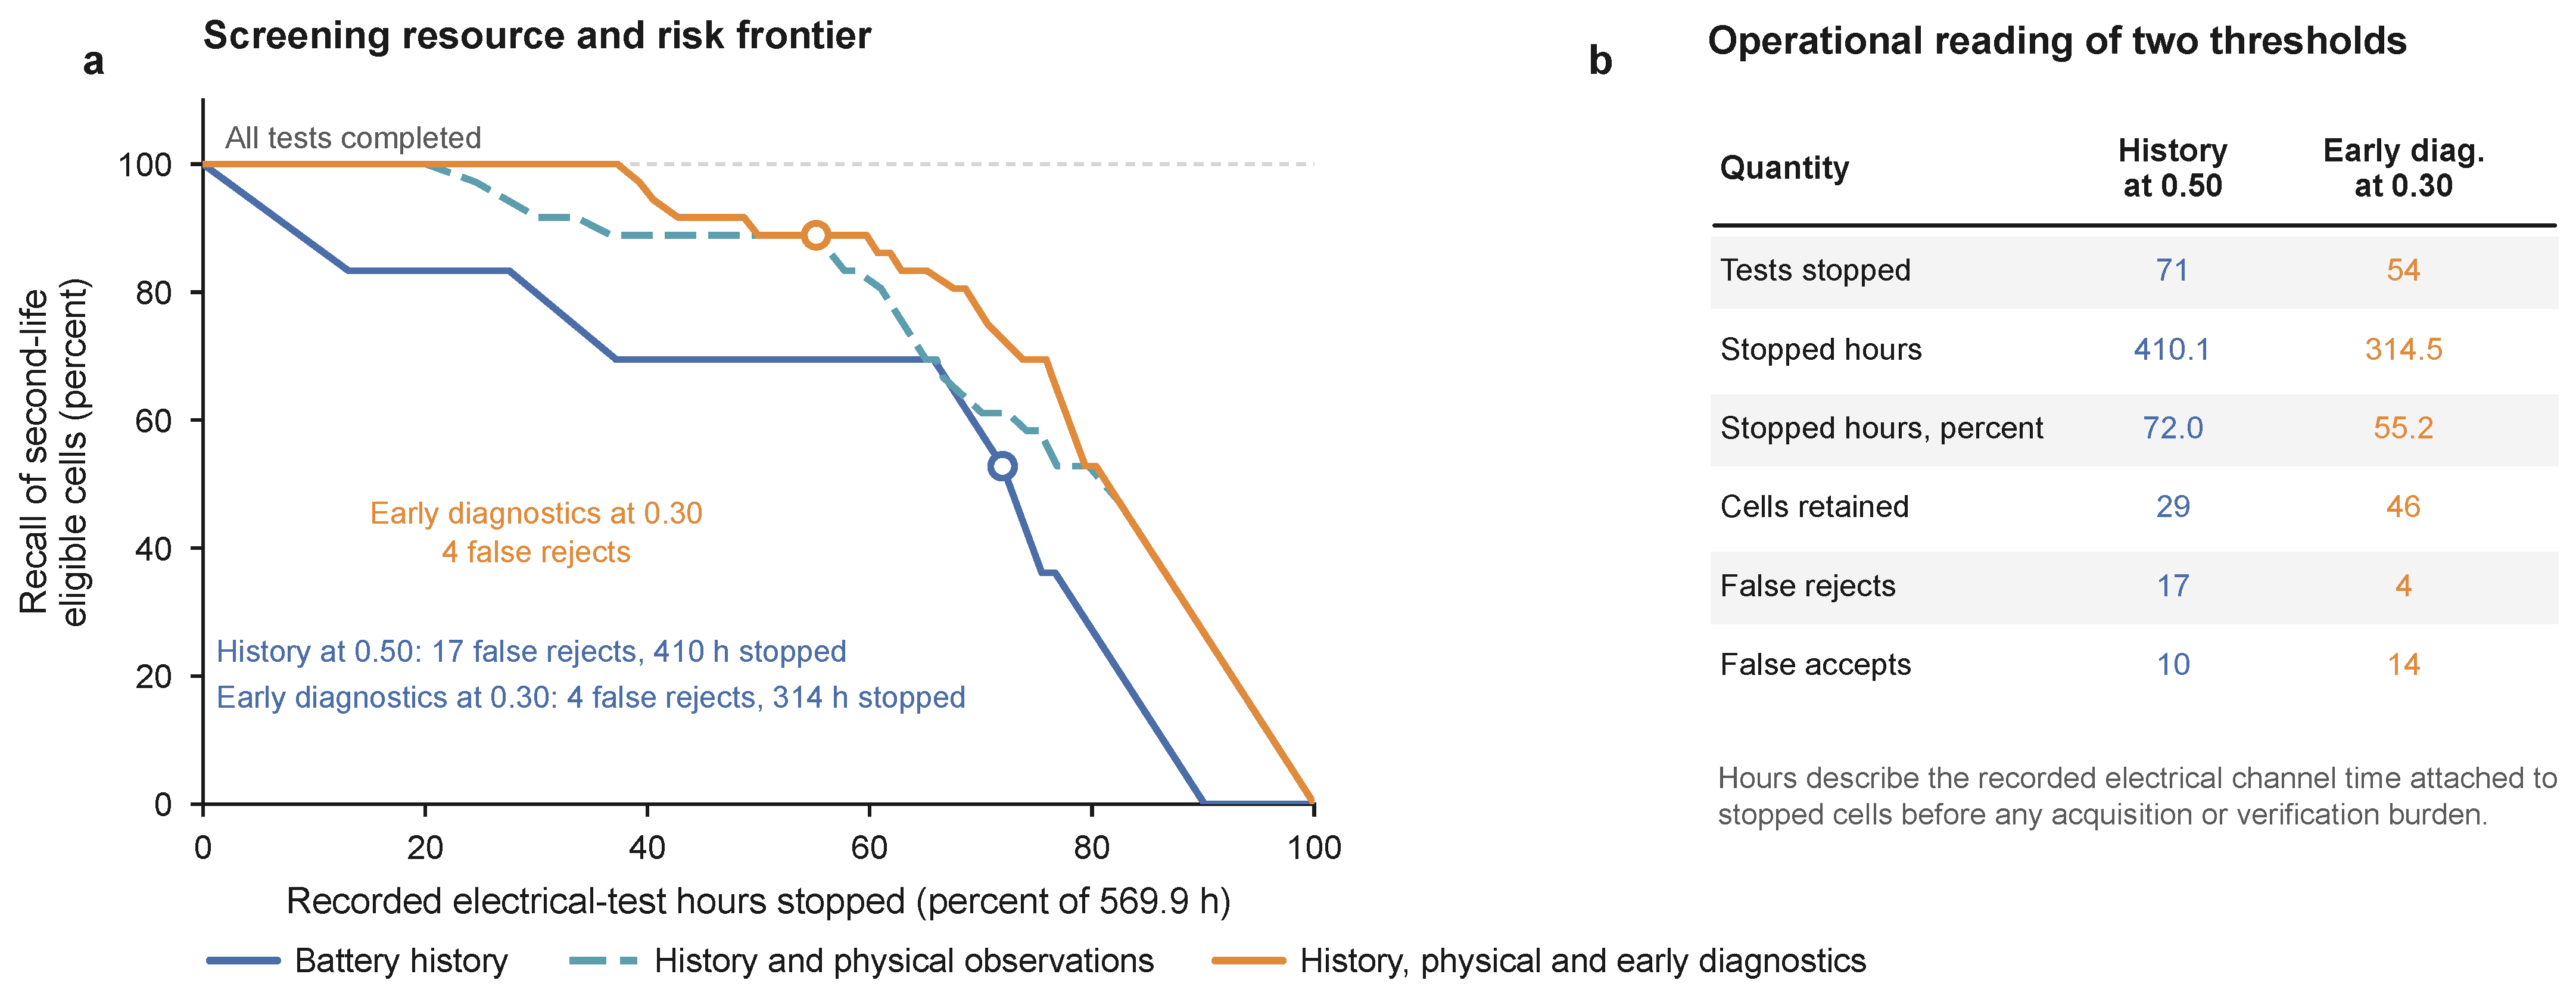
Figure 4 reports the stopping replay restricted to before completion information, and Table 5 reports it at a common set of thresholds. The two operating points that earlier illustrated the frontier, a history-only model at a threshold of 0.50 and an early diagnostic model at a threshold of 0.30, sit at different positions on the curve, so a direct comparison between them would confound the information content with the criterion. The comparison that isolates the information is the one taken at the same threshold, and Table 5 is arranged for it.
Figure 4.
Screening resource and risk frontier for source-defined second-life eligibility. Panel (a) traces recall of eligible cells against the percentage of the 569.9 recorded electrical channel hours attached to stopped tests, using only information available before completion of the reference test. Panel (b) reports the operational reading of two illustrative thresholds. The same ordering holds when both blocks are evaluated at a common threshold, as tabulated in Table 5. Stopped hours precede any acquisition or verification burden and are not realized savings.
Table 5.
Stopping replay for source-defined second-life eligibility at a common set of decision thresholds. Each block is evaluated at the same thresholds as every other block, so a row comparison within a threshold block isolates the contribution of the additional information. Recall is recall of eligible cells, specificity is specificity for the ineligible class, and false rejections are the eligible cells that the policy would discard. Stopped hours are the recorded electrical channel hours attached to stopped tests and precede any acquisition or verification burden.
At any matched threshold, the early diagnostic block dominates the history-only block on this sample. At a threshold of 0.30, battery history produces 11 false rejections and requires 325.99 stopped hours, whereas early diagnostics produce 4 false rejections and require 314.49 stopped hours, with recall of 0.889 against 0.694 and specificity of 0.781 against 0.703. At a threshold of 0.50 the same pattern holds, with 6 against 17 false rejections and 364.80 against 410.07 stopped hours. Across the full sweep of 101 thresholds from 0 to 1, the early block never produces more false rejections than the history block, and its recall of eligible cells is never lower. Its specificity is equal or higher at 99 of the 101 thresholds, and it stops no more recorded test hours at 73 of the 101 thresholds. The additional diagnostic information therefore improves the decision at a fixed criterion rather than merely relocating the operating point along a single curve, and the dominance statement does not depend on the two thresholds used for illustration.
A second view removes the threshold entirely by comparing the two blocks at a matched testing budget. When the replay is asked to stop 40 percent of the recorded channel hours, battery history retains 0.694 of the eligible cells whereas early diagnostics retain 0.956; at 55 percent, the two values are 0.694 and 0.889; at 70 percent, they are 0.580 and 0.767. Over the range from 40 to 70 percent of the recorded workload, the early block therefore retains between 0.19 and 0.26 more of the eligible cells for the same amount of stopped test time. The frontier is thus not a single optimum but a map of what each information level buys, and reading it at a fixed decision criterion or a fixed workload gives the same ordering.
For the pair of operating points that sit at different thresholds, the exchange can still be priced once the criterion difference is accepted. Relative to the history-only rule at 0.50, the early diagnostic rule at 0.30 avoids 13 false rejections and 95.58 h of stopped test time, and it creates four additional false acceptances, 14 rather than 10. If , and denote the receiver’s weights, which are zero or greater, for a false rejection, a false acceptance and one recorded reference test hour, that exchange is favorable exactly when
before adding the acquisition, verification and maintenance cost of the additional information. Equation (6) is stated for that pair only, because the matched threshold comparison in Table 5 already establishes the ordering without it. The data identify the quantities on each side but not the weights, so the expression marks the condition under which the observed exchange becomes favorable rather than a net value estimate. The threshold sweep behind all of these points is reported in full in Supplementary Table S2.
A model-free check supports the plausibility of history as a screening signal. Among packs where the field is present, the battery management system capacity field is positively associated with the measured fraction of cells at or above 70 percent capacity (Spearman , , ), whereas the cycle count field is negatively associated (, , ). The quartile pattern is monotone for the capacity field and incomplete for the cycle count field, and both are measured after testing at the pack level, so the association supports the signal without turning a pack average into a validated payoff.
3.4. Capacity Benchmarks and Label Related Sensitivities
A measured initial capacity rule is a strong paid diagnostic comparator. For second life eligibility, an 80 percent capacity rule attains balanced accuracy 0.977 with recall 1.000 and specificity 0.953, whereas a battery management system 70 percent rule attains 0.686 with recall 0.528 and specificity 0.844. For the complete 100-cycle target, a 90 percent initial capacity rule attains 0.978, while the battery management system rule attains 0.806. Direct capacity testing therefore attains the highest single measurement discrimination reported in this study at 0.977 and 0.978, and it is also the most resource intensive, which is the trade-off that motivates screening in the first place.
Removing all direct ampere hour and watt hour variables from the full characterization block leaves balanced accuracy at 0.957 (95 percent interval 0.875 to 1.000) for second life eligibility and at 0.985 (0.951 to 1.000) for 100-cycle retention. Transient, incremental and recovery measurements therefore carry information beyond the direct capacity fields in this source, while their acquisition still requires an electrical characterization protocol.
3.5. Independent Cohort Under Protocol Holdout Prediction
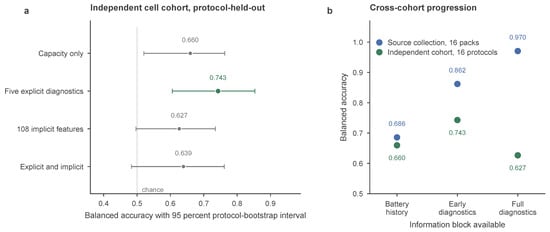
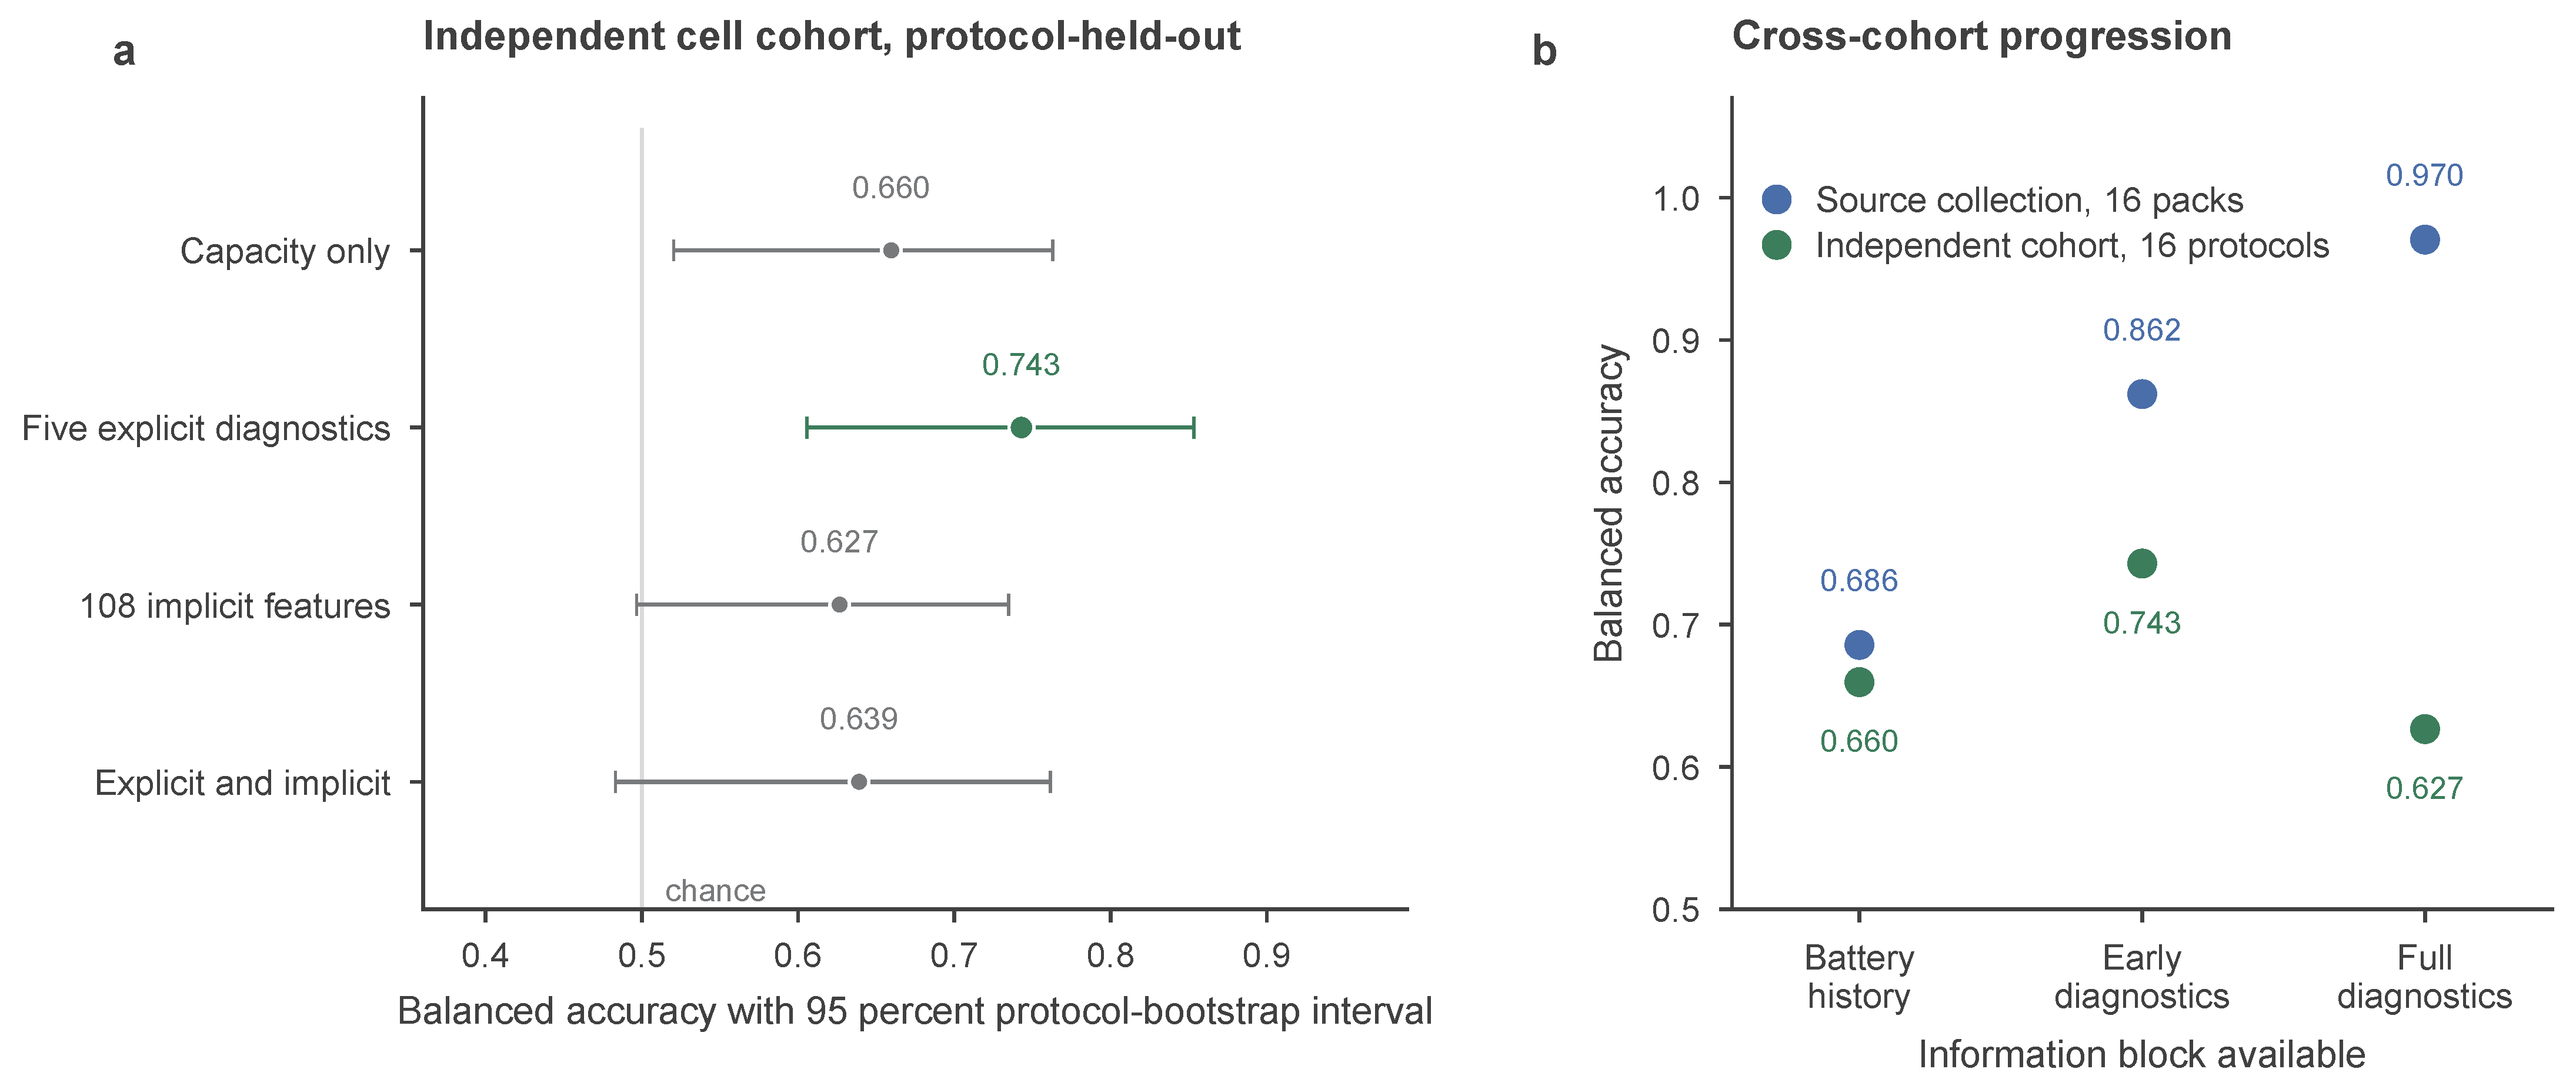
The independent cohort provides a separate test of the physical mechanism (Table 6 and Figure 5). Under protocol holdout prediction, capacity alone reaches a balanced accuracy of 0.660 (95 percent interval 0.520 to 0.763; AUROC 0.613). Adding voltage, internal resistance, coulombic efficiency and energy efficiency raises balanced accuracy to 0.743 (0.606 to 0.853; AUROC 0.810) and reduces false acceptances from 20 to 13 while leaving false rejections at nine. The 108 implicit single cycle features do not reproduce the gain, reaching 0.627 (0.497 to 0.735; AUROC 0.706), and the union of explicit and implicit blocks reaches 0.639 (0.483 to 0.761). A small set of physically interpretable diagnostic measurements therefore transfers better to this separate retention endpoint than a high-dimensional implicit feature expansion under the same grouped validation.
Table 6.
Independent cohort under protocol holdout prediction. The endpoint is spline-interpolated capacity at second life cycle 151 at or above 70 percent of nominal capacity. All cells sharing one first life protocol are held out together. False acceptances and false rejections are counted at a probability threshold of 0.50.
Figure 5.
Independent cohort validation. Panel (a) reports protocol holdout balanced accuracy with 95 percent protocol bootstrap intervals for four information blocks; the five explicit diagnostics are highlighted against the capacity benchmark. Panel (b) places the two cohorts side by side on the comparable information levels of battery history or capacity, early diagnostics, and full characterization or the implicit feature set.
The two diagnostic blocks are not the same variables, and what the independent cohort can support depends on that difference. The early block of the Salinas records contains a short circuit indicator and two transient voltage readings taken from the first discharge step. The explicit block of the independent cohort contains capacity, voltage, internal resistance, coulombic efficiency and energy efficiency, and no variable is shared between the two blocks. The comparison is therefore structural rather than variable for variable. In both cohorts, the design compares a baseline block with the same baseline extended by a small set of explicit, physically interpretable single-cycle electrical measurements that are available before the future trajectory, and in both cohorts, a high-dimensional implicit expansion is available as a contrast. What replicates is the proposition that a short explicit electrical diagnostic block carries retention information that survives grouped validation, not the transportability of a fitted model or of a specific feature list. Two limits follow directly. A Salinas fitted model cannot be applied to this cohort, because the inputs do not exist there. The magnitude 0.660 to 0.743 belongs to this cohort and its endpoint; the sign and the ordering are what carry across, and Section 4.5 states the same point for the general case.
4. Discussion
4.1. A Staged Screening Architecture for Retired Cells
The results describe a screening architecture rather than a single best model. Battery history and passport-compatible fields provide a first stage that requires no test channel and separates a substantial share of clearly ineligible units, with a specificity of 0.844 and a recall of 0.528 for second-life eligibility. Physical observations after recovery add a second inexpensive increment, and the early transient diagnostics add the largest single improvement available before the paid sequence completes, moving balanced accuracy from 0.686 to 0.862 and reducing false rejections from 17 to 6. Full characterization remains the qualification step, and its 0.970 balanced accuracy is best read as the ceiling that a complete measurement sequence achieves rather than as a screening result.
Framing the evidence this way clarifies where the value of battery history lies. A historical field can be useful without being sufficient: it supports a first pass that decides which units deserve a paid test, and it becomes more valuable as the cost of the avoided test rises relative to the cost of a misclassified unit. The frontier in Figure 4 makes that exchange explicit and leaves the weights to the operator, which is the point at which passport design, diagnostic design and process economics meet.
The staged reading also explains why a very accurate model can be operationally weak. A block that reaches 0.970 but is recorded during the sequence it would need to shorten cannot support a stopping rule, and a block that adds no measurable information, as the delayed storage measurement does not, should not occupy a position in the decision. Information value in screening is therefore a property of the block, its availability time and its acquisition cost together, and not of a discrimination score alone.
4.2. Why Early Electrical Observations Carry Screening Information
The empirical ordering in this study has a physical reading, and stating it separates the measurement result from the mechanism that is supposed to explain it. Capacity loss in a lithium ion cell is not a single process. Four contributions are usually distinguished: the evolution of the electrode microstructure, interfacial changes between electrode and electrolyte including the growth and reformation of the passivation layer, loss of accessible lithium, and growth of cell impedance. Their relative weight depends on chemistry, on the first life duty cycle, and on temperature. What connects them to a screening decision is that none of them is silent in the electrical response of a cell. Structural and interfacial degradation alter the way the terminal voltage moves when a current step is applied, because the observed voltage is the sum of an equilibrium potential and a set of overpotentials that are themselves functions of the evolving interfaces and of the transport paths in the electrode. Work on carbon-based anode materials makes the same coupling visible from the materials side. A recent study of a hard carbon anode establishes that the pore structure and the interfacial stability of the electrode are jointly critical to its behavior and that both are set by the chemistry of the carbon framework [28]. That system is sodium ion, so the point taken from it here is the coupling between electrode structure, interface and electrochemical response rather than a chemistry-specific result; the same coupling is what the terminal voltage of the cells studied here reports.
Two consequences follow for the present design. The first is that a very short electrical observation can be informative without resolving any single degradation mode. A transient voltage reading taken at the start of a discharge step and the short circuit indicator that accompanies it respond to the same combination of equilibrium state and overpotential structure that later determines how quickly the cell loses capacity, so a block of three such variables can carry a repeatable fraction of retention information, which is what the pack grouped result reports. The second is that impedance-related quantities should behave in the same direction, and they do in the independent cohort, where internal resistance joins capacity, voltage, coulombic efficiency and energy efficiency in the block that outperforms capacity alone. Aging studies that measure capacity fade and impedance fade on the same cells record the same coupling from the measurement side, in that the impedance trajectory accompanies the capacity trajectory rather than following it [29,30], and the future trajectory that a second life screen has to anticipate is the one described by these coupled quantities [2].
The mechanism also marks the boundary of the claim. This study measures what the diagnostic block carries, not which degradation mode produces it, and no post mortem or impedance spectroscopy data are available to attribute the observed discrimination to a specific interfacial or structural process. A study that paired the same screening protocol with post mortem characterization of a subset of cells would be the direct way to close that gap, and it is listed among the next steps in Section 4.5.
4.3. Transferability of Explicit Diagnostic Information
The independent cohort supports the physical part of the mechanism in a second material system. Five explicit single-cycle measurements improve a protocol holdout retention screen from 0.660 to 0.743, while 108 implicit features extracted from the same cycle do not reproduce that gain. The result is consistent with a mechanism tied to interpretable electrical state rather than to the dimension of the feature set, and it is the kind of evidence that a grouped external evaluation is designed to expose: the larger implicit block has more capacity to fit, and under held-out protocols that capacity does not convert into retention discrimination.
The transfer claim remains bounded, and the feature mismatch is the first of those bounds. Because the two diagnostic blocks share no variable, the independent cohort cannot confirm that the Salinas transient readings would work elsewhere, and the Salinas model cannot be applied to it. What the cohort tests is the narrower proposition that a short block of explicit, physically interpretable electrical measurements taken before the future trajectory improves grouped retention screening, which is the proposition the staged architecture depends on. The second bound is the setting: the cohort contains laboratory-controlled NCM(523)/graphite cells under standardized second-life cycling; its endpoint is a spline-interpolated future capacity value rather than an observed route outcome, and the protocol groups are not incoming batches. The appropriate conclusion is therefore that a small explicit diagnostic set reproduces its advantage in a separate cell design and a separate grouping structure, while the specific variables and the magnitude do not transfer.
4.4. What the Study Supports
Five findings are established by the reported evidence. Battery history alone contains measurable but limited screening information under pack-level evaluation, both for the source-defined target and for the after characterization capacity endpoint in 989 cells. A small early diagnostic block materially improves grouped screening performance and changes the error structure by removing false rejections rather than by raising overall accuracy. The improved errors are obtainable before the paid sequence completes, so they correspond to a feasible decision point. An explicit diagnostic variable set transfers to an independent cohort better than a larger implicit feature set. Chronology determines whether a block can support a stopping rule at all, which is why the strongest discrimination benchmark and the deployable frontier in this study are built from different information.
4.5. Limits and a Validation Protocol for the Next Study
The strongest limitation is the absence of independent incoming batches with observed route choices and process outputs. The 100 cell outcome subset is linked to the same collection as the 2019 workbook and represents 16 original packs, and the grouped estimates rest on those 16 units. Section 3.1 reports the composition that this implies: 15 of the 16 packs are single class, so the effective number of independent class homogeneous units is small, and a fold that leaves one pack out withdraws an entire class homogeneous group. Pack composition and cell class are therefore close to confounded in this subset, which is a more specific statement than a wide interval. It means three things. The pooled estimate can be sensitive to individual packs, since one pack that changes its majority class moves a sizeable share of the outcome. The paired difference in Table 4 is the more informative quantity than either marginal interval, because it conditions on the same packs. And a cell-level random split would not merely widen the interval; it would change the estimand, because such a split would let a model learn a pack’s class from part of that same pack. The point estimates may also change under chemistry, supplier, age or disassembly conditions that are not represented. The source label is a class assigned from delayed cycling under a defined protocol, and it is not an observed commercial route allocation. A 100-cycle endpoint is a useful physical check but not a complete remaining life distribution, and safety, insulation, imbalance and pack-level thermal constraints lie outside the target. Finally, the mechanism discussed in Section 4.2 is inferred from the electrical response and is not attributed to a specific degradation mode, since no post mortem or impedance spectroscopy measurements accompany these cells.
The cost ledger is also incomplete by construction. Recorded channel duration is not labor, elapsed facility time, electricity consumption or currency, and verification, passport maintenance, data access, calibration and handling costs are not observed. Unchosen routes have no observed output, so a counterfactual route margin would require a paired or randomized physical trial, a logged decision design with explicit identification assumptions, or an independently validated process model whose outcomes are labeled as modeled. Without that evidence, a ranking of information blocks can reverse under plausible payoff assumptions, and Equation (6) marks the point at which the present analysis stops.
These limits define the next study. Each incoming battery or batch should record chemistry, health, history, every test result with its availability time, the test fee and verification burden, the route actually chosen, all process resources, product quantity and product qualification, using one physical key from intake to route execution. The decision rule should be frozen after a calibration set of physical batches, and new batches should then evaluate false rejection, false acceptance, qualified output, processing cost and environmental inventory under that rule. If route alternatives are not both observed, the missing counterfactual should be stated and the process model validated before it is used for any net value statement. A subset of the screened cells should be taken to post mortem examination and to impedance spectroscopy, so that the discrimination carried by the transient readings can be attributed to a structural, interfacial or transport mechanism rather than inferred from the terminal voltage alone. Such a design would extend the present resource and risk frontier into a net decision frontier. The information fee would then be deducted alongside testing and maintenance cost; the maximum acceptable fee would be estimated once route costs and outputs have both been observed, and the mechanistic reading of Section 4.2 would become a measured one.
5. Conclusions
Screening of retired lithium ion cells improves in a clear and reproducible order as information becomes available. Battery history and passport-compatible fields carry usable pack-level screening information for second-life eligibility, with a balanced accuracy of 0.686, and physical observations after recovery take that to 0.761. A small early electrical diagnostic block, available before the paid characterization sequence completes, provides the largest improvement at that point, raising balanced accuracy from 0.761 to 0.862, reducing the false rejection count from 17 to 6 of 36 eligible cells, and cutting the balanced error rate of the screening decision by more than half. The paired pack bootstrap interval for the step from history to early diagnostics excludes zero for this target, at 0.005 to 0.384 with 97.7 percent of resamples positive, so the improvement is resolved despite the overlap of the marginal intervals; the intermediate steps and the retention target are not resolved by this design. Full characterization remains the qualification benchmark at 0.970, and the delayed storage measurement adds no measurable information. When both information levels are held to the same decision threshold, the early block never produces more false rejections than battery history across the full threshold range, and at a matched testing budget of 40 percent of recorded channel hours it retains 0.956 rather than 0.694 of the eligible cells, so the difference reflects the information rather than the position of the criterion. In an independent cohort with a different cathode chemistry and protocol structure, five explicit diagnostics improve protocol holdout retention screening while 108 implicit features do not, which supports interpretable electrical state over feature expansion under grouped validation.
These results support a staged screening architecture in which battery history is used for a low-cost first pass, targeted early diagnostics refine the decision before a full sequence is committed, and complete electrical characterization remains the qualification step. The frontier reported here quantifies the exchange between retained eligible cells and recorded test time at each stage, and the exchange rate itself depends on the relative cost of a false rejection, a false acceptance and an occupied test channel, which the receiving operation is best placed to set.
Supplementary Materials
The following supporting information can be downloaded at: https://www.mdpi.com/article/10.3390/batteries12110457/s1, Table S1: Variable identifiers (x1–x29 and the four pack-level fields cb, zb, db and sb) mapped to measurement family, information block and availability relative to the paid test; Table S2: Complete threshold sweep, from 0 to 1 in steps of 0.01, of the stopping replay for the three deployable information blocks and both targets, reporting tests stopped, stopped hours, stopped-hours fraction, recall, specificity and false rejections at each threshold; Table S3: Full metric set for every information block and target, including balanced accuracy, recall, specificity, AUROC, average precision, Brier score, log loss, macro F1, confusion counts and the regression metrics (MAE, RMSE, R2 and Spearman ρ) for the continuous capacity endpoint.
Author Contributions
Conceptualization, J.Z. and S.W.; methodology, J.Z. and S.W.; software, J.Z.; validation, J.Z.; formal analysis, J.Z.; investigation, J.Z.; resources, S.W.; data curation, J.Z.; writing of the original draft, J.Z.; review and editing, J.Z. and S.W.; visualization, J.Z.; supervision, S.W.; project administration, S.W.; funding acquisition, S.W. All authors have read and agreed to the published version of the manuscript.
Funding
This research was funded by the National Social Science Fund of China (General Program), grant number 25BGJ089.
Institutional Review Board Statement
Not applicable.
Informed Consent Statement
Not applicable.
Data Availability Statement
The 2019 cell and pack records are available from Mendeley Data, version 4, DOI 10.17632/kg75m9ydfz.4. The characterization and delayed performance files are available through TU Berlin DepositOnce, DOIs 10.14279/depositonce-11469 and 10.14279/depositonce-11887. The independent cell cohort is available from Zenodo, DOI 10.5281/zenodo.14859405. The analysis code, the derived input tables and the reference results that reproduce all reported tables and figures are archived at Zenodo, DOI 10.5281/zenodo.23572462 (version 1.0.0; source repository https://github.com/williamjay1/secondlife-screening, accessed on 25 September 2026). Raw source files are preserved separately from derived data.
Acknowledgments
The authors thank the groups that released the public battery collections used in this study for making their measured data available. OpenAI Codex was used only for limited Python 3.12 code assistance and English language polishing. All substantive research tasks, including study design, data collection and processing, analysis, interpretation, and manuscript preparation, were performed by the authors. AI did not generate or alter data or determine conclusions, and the authors take full responsibility for the manuscript.
Conflicts of Interest
The authors declare no conflicts of interest.
Abbreviations
The following abbreviations are used in this manuscript:
| BMS | battery management system |
| LIB | lithium ion battery |
| NCM | nickel cobalt manganese oxide |
| AUROC | area under the receiver operating characteristic curve |
| SoH | state of health |
References
- Wang, Q.; Zhang, T.; Guo, Y.; Huang, L.; Shi, T.; Cai, N.; Yue, Y.; Xie, Y.; Luddeke, C.T.; Luo, R. AI-driven echelon utilization of retired electric vehicle batteries and their life cycle carbon mitigation potential. Carbon Neutr. Syst. 2025, 1, 16. [Google Scholar] [CrossRef] [Scilit]
- Huang, X.; Tao, S.; Liang, C.; Tang, Y.; Chen, J.; Shi, J.; Li, Y.; Xia, B.; Zhou, G.; Zhang, X. iMOE: Prediction of second-life battery degradation trajectory using interpretable mixture of experts. Nat. Commun. 2026, 17, 2549. [Google Scholar] [CrossRef] [Scilit] [PubMed]
- Vignesh, S.; Che, H.S.; Selvaraj, J.; Tey, K.S.; Lee, J.W.; Shareef, H.; Errouissi, R. State of Health (SoH) estimation methods for second life lithium-ion battery: Review and challenges. Appl. Energy 2024, 369, 123542. [Google Scholar] [CrossRef] [Scilit]
- Tao, S.; Ma, R.; Zhao, Z.; Ma, G.; Su, L.; Chang, H.; Chen, Y.; Liu, H.; Liang, Z.; Cao, T.; et al. Generative learning assisted state-of-health estimation for sustainable battery recycling with random retirement conditions. Nat. Commun. 2024, 15, 10154. [Google Scholar] [CrossRef] [Scilit] [PubMed]
- Buidin, T.I.C.; Cristea, M.; Cristea, C. Prediction of Retired EV Batteries Usable Capacity for Repurposing in Second-Life Applications. Technologies 2026, 14, 124. [Google Scholar] [CrossRef] [Scilit]
- Cobb, A.; Ramirez-Meyers, K.; Michalek, J.; Swaminathan, S.; Gasper, P.; Polzin, B.; Smith, K. Electric-vehicle battery second-life and recycling pathways: How economics depend on chemistry, processing, and application. Appl. Energy 2026, 414, 127809. [Google Scholar] [CrossRef] [Scilit]
- Zhuang, J.; Bach, A.; van Vlijmen, B.H.; Reichelstein, S.J.; Chueh, W.; Onori, S.; Benson, S.M. Technoeconomic decision support for second-life batteries. Appl. Energy 2025, 390, 125800. [Google Scholar] [CrossRef] [Scilit]
- Ma, R.; Tao, S.; Sun, X.; Ren, Y.; Sun, C.; Ji, G.; Xu, J.; Wang, X.; Zhang, X.; Wu, Q.; et al. Pathway decisions for reuse and recycling of retired lithium-ion batteries considering economic and environmental functions. Nat. Commun. 2024, 15, 7641. [Google Scholar] [CrossRef] [Scilit] [PubMed]
- European Parliament; Council of the European Union. Regulation (EU) 2023/1542 Concerning Batteries and Waste Batteries; European Union: Brussels, Belgium, 2023. [Google Scholar]
- European Commission. Digital Product passport for Batteries and Data Points by Category; European Commission: Brussels, Belgium, 2026.
- BatteryPass Consortium. Battery Passport Value Assessment; BatteryPass Consortium: Berlin, Germany, 2024. [Google Scholar]
- Pohlmann, A.; Popowicz, M.; Schoggl, J.P.; Baumgartner, R.J. Digital product passports for electric vehicle batteries: Stakeholder requirements for sustainability and circularity. Clean. Prod. Lett. 2025, 8, 100090. [Google Scholar] [CrossRef] [Scilit]
- Losa, R.; Torjesen, S. The quest for more circular battery value chains: Implementing the EU digital battery passport and remaining challenges. Clean. Prod. Lett. 2025, 9, 100118. [Google Scholar] [CrossRef] [Scilit]
- Berger, K.; Baumgartner, R.J.; Weinzerl, M.; Bachler, J.; Preston, K.; Schoggl, J.P. Data requirements and availabilities for a digital battery passport A value chain actor perspective. Clean. Prod. Lett. 2023, 4, 100032. [Google Scholar] [CrossRef] [Scilit]
- Terkes, M.; Demirci, A.; Gokalp, E.; Cali, U. Battery Passport for Second-Life Batteries: Potential Applications and Challenges. IEEE Access 2024, 12, 128424–128467. [Google Scholar] [CrossRef] [Scilit]
- Hassini, M.; Redondo-Iglesias, E.; Venet, P. Battery Passports for Second-Life Batteries: An Experimental Assessment of Suitability for Mobile Applications. Batteries 2024, 10, 153. [Google Scholar] [CrossRef] [Scilit]
- Lennartz, J.; Jansen, K.; Rietveld, E. Digital product passport data to improve the material flow and stock monitoring and projections at EU-level: The case of EV-batteries. Procedia CIRP 2025, 135, 642–647. [Google Scholar] [CrossRef] [Scilit]
- Roberts, D.R.; Bahn, V.; Ciuti, S.; Boyce, M.S.; Elith, J.; Guillera-Arroita, G.; Hauenstein, S.; Lahoz-Monfort, J.J.; Schroeder, B.; Thuiller, W.; et al. Cross-validation strategies for data with temporal, spatial, hierarchical, or phylogenetic structure. Ecography 2017, 40, 913–929. [Google Scholar] [CrossRef] [Scilit]
- Varma, S.; Simon, R. Bias in error estimation when using cross-validation for model selection. BMC Bioinform. 2006, 7, 91. [Google Scholar] [CrossRef] [Scilit] [PubMed]
- Salinas, F. Data for: A Second Life for Li-Ion Cells Rescued from Notebook Batteries. 2019. Available online: https://data.mendeley.com/datasets/kg75m9ydfz/4 (accessed on 20 September 2026).
- Salinas, F.; Krüger, L.; Neupert, S.; Kowal, J. A second life for li-ion cells rescued from notebook batteries. J. Energy Storage 2019, 24, 100747. [Google Scholar] [CrossRef] [Scilit]
- Salinas, F. Second Life Assessment of Lithium-Ion Cells Obtained from Portable Electronics. Ph.D. Thesis, Technische Universität Berlin, Berlin, Germany, 2021. [Google Scholar] [CrossRef] [Scilit]
- Salinas, F. Dataset to the Thesis: Second Life Assessment of Lithium-Ion Cells Obtained from Portable Electronics. 2021. Available online: https://depositonce.tu-berlin.de/items/b0924281-b40f-4fe2-8277-27856496744f (accessed on 20 September 2026).
- Wang, S.; Gao, F.; Tian, H. Deep sorting of reused batteries for enabling long-term consistency grouping with unknown prior conditions. Cell Rep. Phys. Sci. 2025, 6, 102657. [Google Scholar] [CrossRef] [Scilit]
- Wang, S.; Gao, F.; Tian, H. Data for: Deep sorting of reused batteries for enabling long-term consistency grouping with unknown prior conditions. Zenodo 2025. [Google Scholar] [CrossRef]
- Saito, T.; Rehmsmeier, M. The precision-recall plot is more informative than the ROC plot when evaluating binary classifiers on imbalanced datasets. PLoS ONE 2015, 10, e0118432. [Google Scholar] [CrossRef] [Scilit] [PubMed]
- Collins, G.S.; Reitsma, J.B.; Altman, D.G.; Moons, K.G.M. Transparent reporting of a multivariable prediction model for individual prognosis or diagnosis (TRIPOD): The TRIPOD statement. Ann. Intern. Med. 2015, 162, 55–63. [Google Scholar] [CrossRef] [Scilit] [PubMed]
- Xu, Q.; Jia, S.; Li, Y.; Wang, H.; Guo, M.; Zhou, S.; Yang, X.; Li, C.; Tu, H.; Zhu, H.; et al. Revealing the Critical Role of Amide Bonds in Pore Structure and Interfacial Stability of Hard Carbon Anodes for Sodium-Ion Batteries. Adv. Funct. Mater. 2026, 36, e76601. [Google Scholar] [CrossRef] [Scilit]
- Luh, M.; Blank, T. Comprehensive battery aging dataset: Capacity and impedance fade measurements of a lithium-ion NMC/C-SiO cell. Sci. Data 2024, 11, 1004. [Google Scholar] [CrossRef] [Scilit] [PubMed]
- Stroebl, F.; Petersohn, R.; Schricker, B.; Schaeufl, F.; Bohlen, O.; Palm, H. A multi-stage lithium-ion battery aging dataset using various experimental design methodologies. Sci. Data 2024, 11, 1020. [Google Scholar] [CrossRef] [Scilit] [PubMed]

Disclaimer/Publisher’s Note: The statements, opinions and data contained in all publications are solely those of the individual author(s) and contributor(s) and not of MDPI and/or the editor(s). MDPI and/or the editor(s) disclaim responsibility for any injury to people or property resulting from any ideas, methods, instructions or products referred to in the content. |
© 2026 by the authors. Licensee MDPI, Basel, Switzerland. This article is an open access article distributed under the terms and conditions of the Creative Commons Attribution (CC BY) license.