


Abstract
Lithium-ion batteries in unmanned aerial vehicles (UAVs) experience highly dynamic electrical loads, but thermal warning criteria are rarely interpreted against non-abuse aviation-oriented operating states. This study integrated three independent datasets: 196 DJI Matrice 100 flights, 13,326 validated Sony-Murata VTC6 laboratory missions from 16 cells, and 67 high-temperature-rise abuse experiments from six cell/source families. Real UAV operation showed sustained electrical demand, with a median mission P95 power of 643.1 W; each additional 250 g payload was associated with a 51.1 W increase in P95 power. Among non-abuse missions, 942/13,326 (7.07%) reached at least 60 °C, and median mission maximum temperature increased by 14.28 °C from the first to final within-cell progression decile. However, the conservative maximum non-abuse heating rate at T ≥ 60 °C was 0.451 °C·s−1, below the minimum same-thermocouple value of 0.900 °C·s−1 in the abuse cohort. A literature-based criterion of T ≥ 60 °C and dT/dt ≥ 1 °C·s−1 produced no observed non-abuse activations and activated in 66/67 abuse experiments. Thus, temperature-domain overlap increased across recorded mission progression, whereas empirical thermal-rate separation persisted.
1. Introduction
Lithium-ion batteries (LIBs) are increasingly used in unmanned aerial vehicles (UAVs) and electric vertical take-off and landing (eVTOL) aircraft because of their favorable specific energy and power characteristics [1,2,3]. Unlike many ground-based applications, electrically powered aircraft operate under stringent mass constraints while experiencing strongly mission-dependent electrical loads. Real-flight measurements from multirotor UAVs have demonstrated substantial variation in electrical demand with speed, payload, altitude, wind, and flight trajectory [4], while representative eVTOL duty cycles require high discharge power during take-off and landing [5]. These operating characteristics make battery thermal behavior relevant not only to performance and degradation but also to flight safety.
Temperature is one of the most accessible battery-monitoring variables and strongly affects battery performance, degradation, and safety [6,7,8]. Repeated cycling and degradation can modify resistance and heat-generation characteristics [9,10,11]. Aviation-specific battery studies have therefore examined prognostics, degradation modes, and aging parameters under repeated high-power missions [12,13,14]. In particular, analyses of the public VTC6 eVTOL dataset have linked degradation behavior to cycling conditions including temperature and charging current [15], while subsequent work has examined the evolution of flight measurements and multiple aging parameters during eVTOL duty cycling [14].
At the safety extreme, thermal runaway is characterized by rapid self-heating that may culminate in venting, fire, or explosion [16,17,18]. Material-level safety strategies have also been investigated, including phosphazene-based flame-retardant additives, thermally stable dual-salt electrolytes, and multifunctional film-forming additives intended to reduce electrolyte flammability and improve electrode–electrolyte interfacial stability [19,20,21]. Thermal, electrical, gas, pressure, mechanical, and other precursor signals have consequently been investigated for warning [22,23,24]. Aviation-specific thermal-runaway warning is now an active research field rather than an unexplored problem. Recent studies have examined operando thermal and non-thermal indicators under aviation-relevant conditions [25] and developed multi-parameter warning strategies under low-pressure environments [26,27,28].
The interpretation of simple temperature-based criteria nevertheless remains challenging in high-power aviation applications. Elevated temperature represents accumulated thermal loading but does not necessarily imply progression to uncontrollable self-heating. Previous thermal-runaway warning work has combined an absolute-temperature condition of 60 °C with a temperature-rise-rate condition of 1 °C·s−1 [23], illustrating the practical distinction between absolute thermal state and rapid thermal evolution. More generally, published definitions of rapid heating and thermal-runaway onset vary with cell chemistry, test method, sensor location, state of charge, and thermal boundary conditions [29,30,31]. Consequently, a criterion that appears well separated from abuse behavior under one experimental condition cannot automatically be assumed to retain the same operational margin during legitimate high-power flight operation.
Previous studies have largely addressed different portions of this problem separately. Real UAV datasets have primarily been used to characterize flight performance and energy consumption [4]. Public eVTOL cycling data have supported prognostics and degradation analyses [5,12,13,14,15]. Aviation thermal-runaway studies, in contrast, have focused principally on dedicated abuse experiments, low-pressure environments, multi-parameter warning, and mitigation [32,33,34]. Earlier electrothermal modeling has explicitly connected lithium-ion battery behavior from normal operating conditions to abuse conditions [35], but empirical cross-dataset assessment combining real UAV electrical demand, long-term non-abuse aviation-oriented thermal behavior, and independent high-rise abuse temperature histories remains comparatively underexplored.
To examine this gap, we used three public datasets with distinct roles. Real DJI Matrice 100 flight records are used to characterize the electrical-demand envelope of a small multirotor UAV. Aviation-oriented Sony-Murata VTC6 cycling records are used to define the non-abuse aviation-oriented thermal domain and quantify its evolution across within-cell recorded mission progression. Finally, 67 high-resolution high-temperature-rise abuse experiments (hereafter, high-rise abuse experiments) from six cell/source families are used to characterize rapid-heating behavior at a matched 1 s timescale. The study addresses three questions: (1) what electrical loads characterize real multirotor UAV missions; (2) how strongly can the non-abuse aviation-oriented temperature domain shift during repeated mission cycling; and (3) whether temperature-rise rate retains empirical separation from the evaluated abuse domain when absolute temperature begins to overlap. The principal novelty therefore lies in cross-domain operational assessment of thermal warning descriptors rather than in proposing a new thermal-runaway indicator.
2. Materials and Methods
2.1. Public Data Sources, Original Experimental Protocols, and Analytical Cohorts
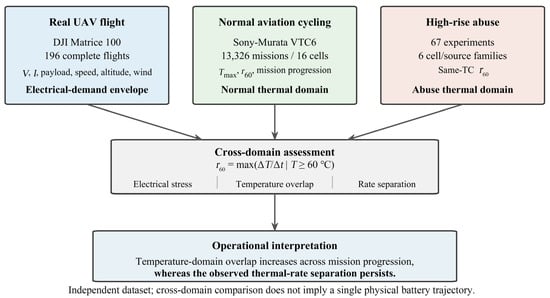
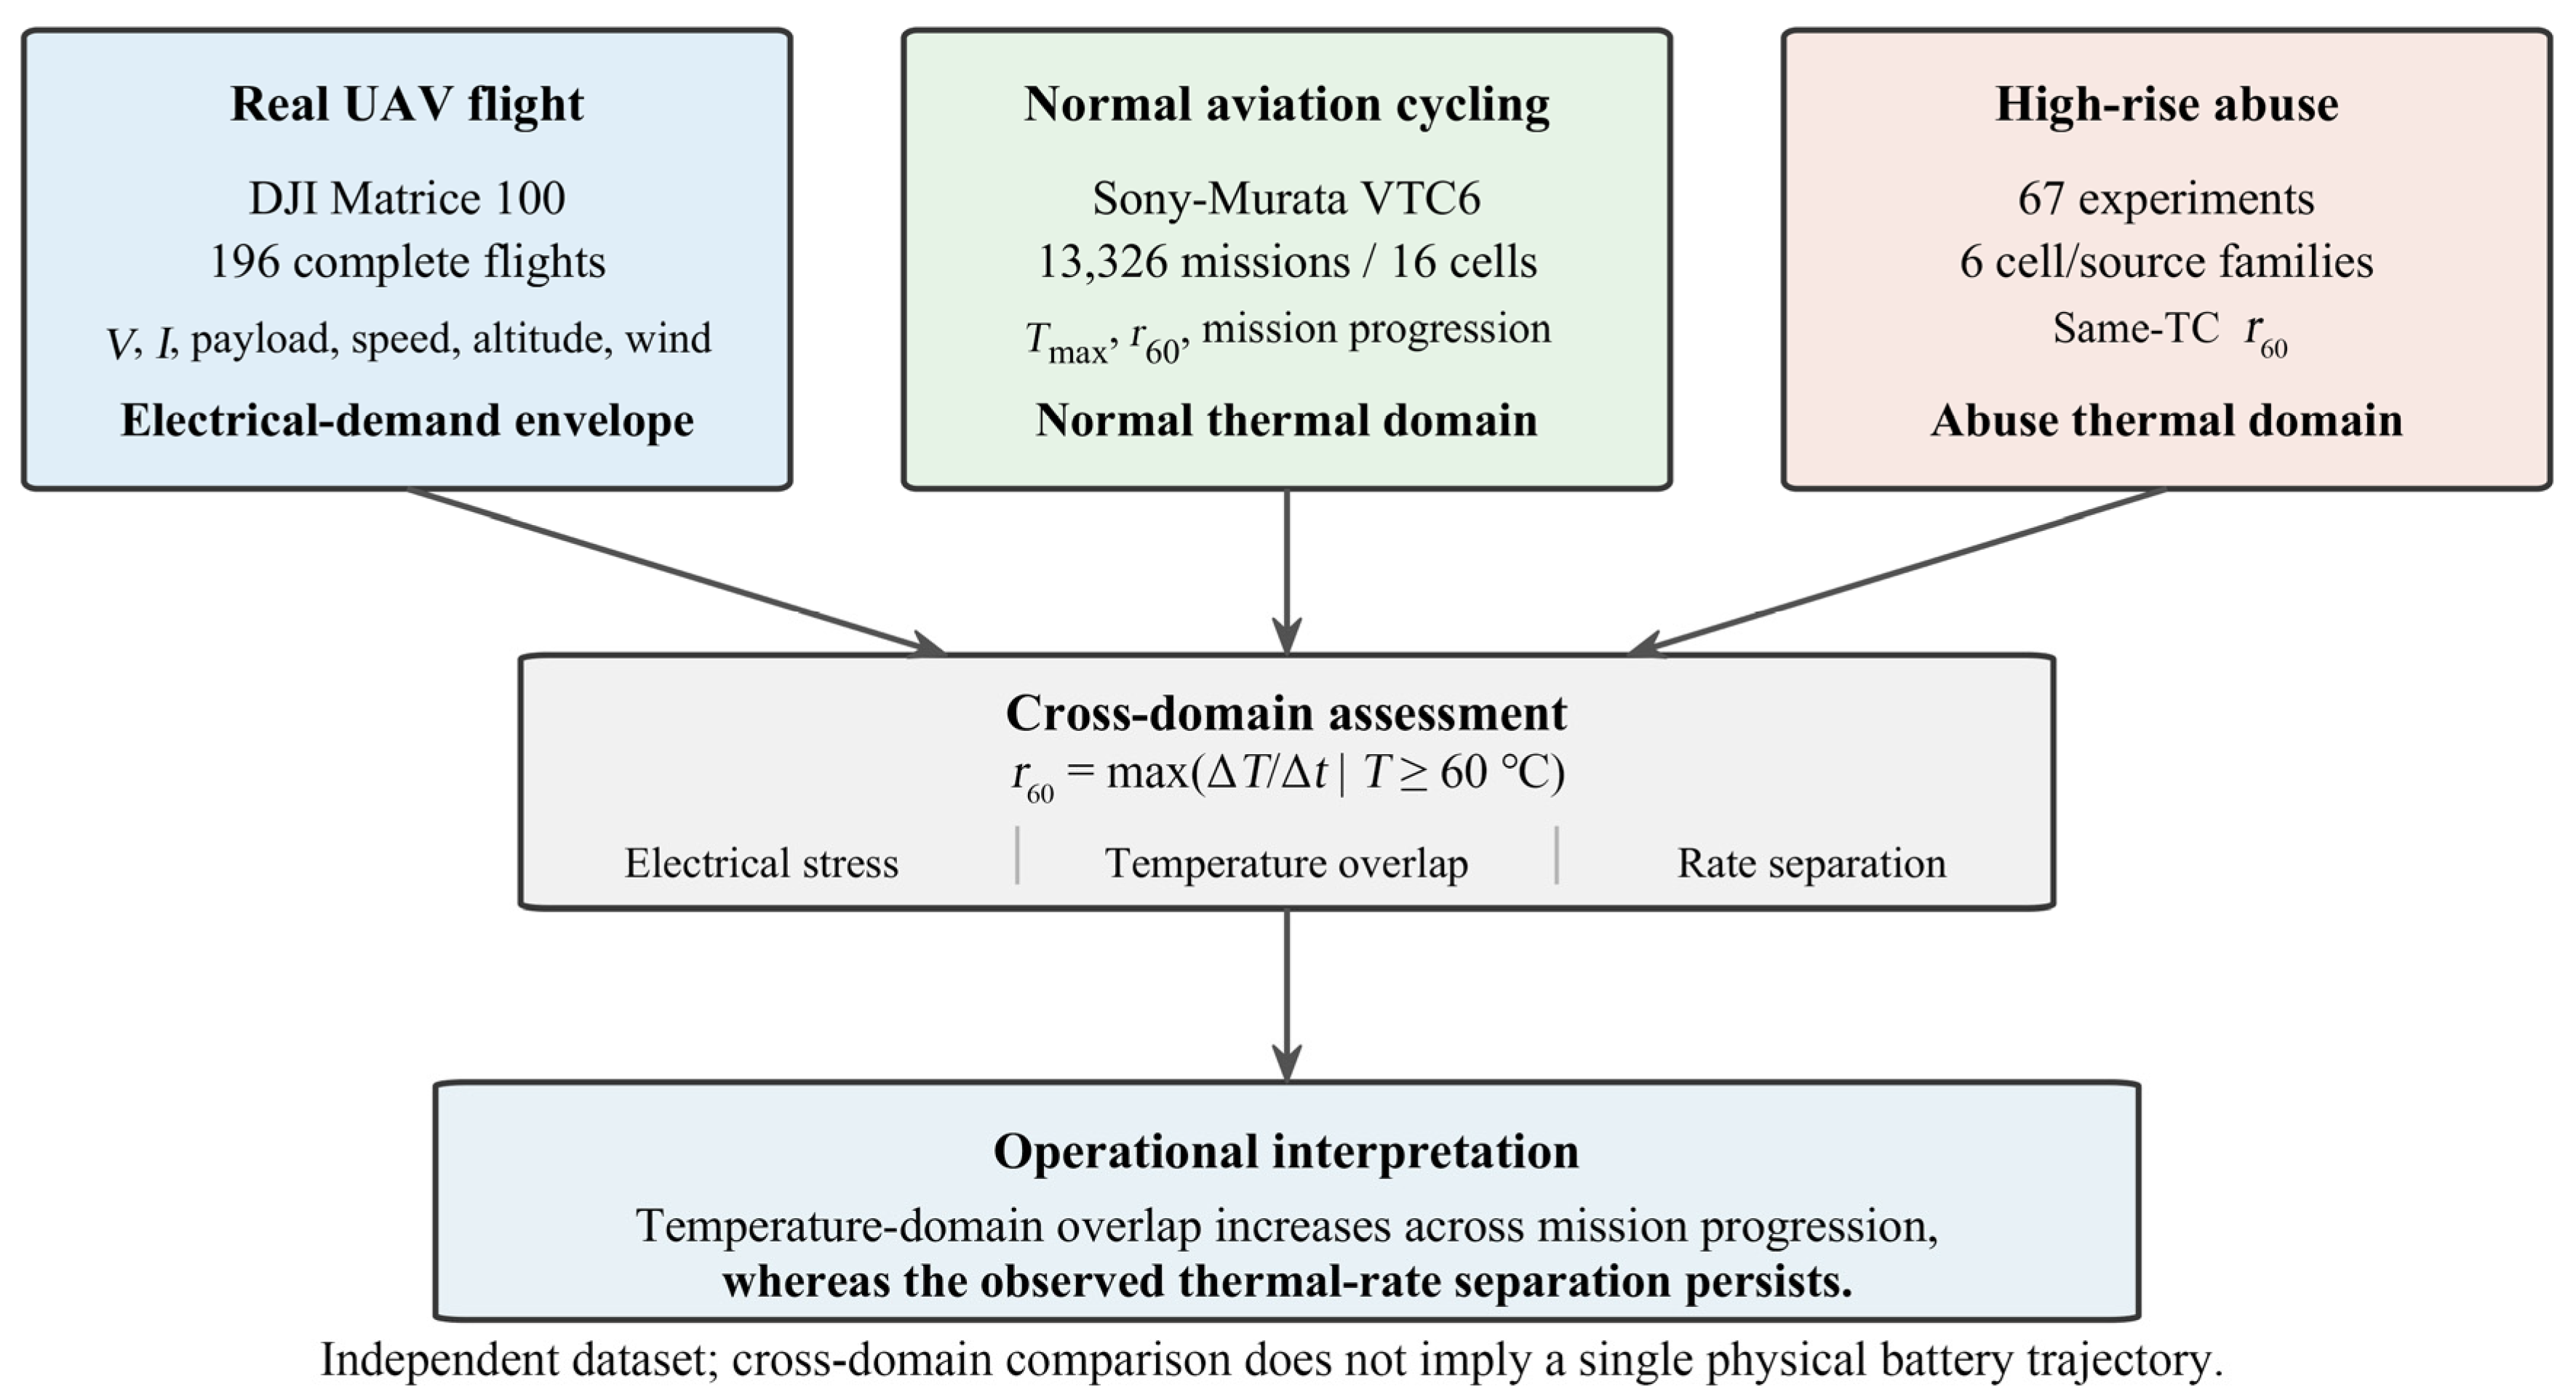
This study was a secondary analysis of three previously published, publicly accessible datasets; no UAV flight tests, battery cycling experiments, or battery abuse experiments were conducted by the present authors. The three datasets were assigned complementary rather than interchangeable analytical roles (Figure 1 and Table 1). The DJI Matrice 100 flight dataset was used to characterize the field-relevant electrical-demand envelope. The Sony-Murata VTC6 aviation-oriented cycling dataset was used to characterize non-abuse thermal behavior and its evolution across the recorded within-cell mission sequence. A separate mechanically induced abuse dataset provided 67 experiments from six cell/source families and was used to characterize rapid high-temperature heating. The resulting cross-dataset framework therefore evaluated the relationship between field-relevant electrical loading and thermal behavior, with particular emphasis on absolute-temperature overlap and high-temperature heating-rate separation. Data provenance, original experimental conditions, and the analytical cohorts are described below and summarized in Table 1, while the overall analytical framework is illustrated in Figure 1.
Figure 1.
Cross-dataset framework for evaluating UAV-relevant electrical loading and thermal-domain relationships.
Table 1.
Characteristics and analytical roles of the three datasets used in the cross-domain assessment.
The first dataset comprised previously published DJI Matrice 100 flight measurements reported by Rodrigues et al. [4]. The raw and processed flight records were obtained from the associated public Carnegie Mellon University/figshare repository (DOI: 10.1184/R1/12683453). These flight experiments were conducted by the original investigators and were not performed as part of the present study. In the source experiments, a DJI Matrice 100 quadrotor autonomously followed a predefined delivery-type flight path while programmed cruise speed, cruise altitude, and payload were varied. The experimental conditions covered cruise speeds of 4–12 m·s−1, cruise altitudes of 25–100 m, and payloads of 0, 250, and 500 g. Battery voltage and current, aircraft position and kinematics, and wind conditions were recorded using the onboard sensor system [4].
For the present secondary analysis, 196 complete flight records associated with the R1–R7 route categories and containing cruise operation were retained, whereas hover-only, ground, and ancillary records were excluded. The R1–R7 labels refer to route categories in the source records rather than flight routes newly defined or performed in the present study. The source study describes the Matrice 100 as using a LiPo flight battery and reports a standard nominal battery capacity of 4500 mAh; however, the available source documentation does not identify the cathode chemistry at a more specific material level. Electrical-demand analysis used the recorded battery voltage and current together with programmed speed, payload, altitude, wind speed, and flight kinematics.
To avoid assigning a preprocessing-dependent current polarity, electrical demand was therefore quantified using current magnitude and power magnitude as defined in Equations (1) and (2), respectively.
where V is battery voltage and I is measured battery current.
P = V|I|
The second dataset comprised the previously published Sony-Murata VTC6 eVTOL-oriented battery-cycling dataset reported by Bills et al. [5], obtained from its public Figshare repository (DOI: 10.1184/R1/14226830.v2). The underlying cycling experiments were conducted by the original dataset authors; the present study reconstructed and analyzed mission sequences from these published records. The duty cycle reproduced high-power take-off, lower-power cruise, and high-power landing segments representative of electric-aircraft operation [2,3,5]. Complete mission sequences were reconstructed from the corresponding discharge segments and subjected to consistency screening. A total of 20,850 validated missions were identified. Because the sampling interval differed among cells, thermal-rate analyses were restricted to 13,326 missions from 16 cells with approximately 1 s temporal resolution. These records formed the primary non-abuse aviation-oriented cohort.
The source VTC6 dataset included multiple operating protocols, including changes in discharge power, cruise duration, chamber temperature, charging current, and upper charge voltage [5,14,15]. Ambient temperature was controlled at the protocol level and differed among the predefined test conditions. Cells assigned a specified temperature condition were placed in a temperature chamber maintained at that setpoint, while cell-can surface temperature was recorded using a thermocouple attached to the cell body [5]. A separate time-resolved ambient-temperature signal was not included in the published mission files. Moreover, the original dataset documentation cautions that the recorded cycle number is not an exact common cycling coordinate after source files were combined. Accordingly, raw cycle number was not interpreted as state of health or equivalent battery age. Instead, within-cell mission order was used to describe progression through the recorded cycling sequence.
The third dataset was obtained from the publicly available Mechanically Induced Thermal Runaway for Li-ion Batteries dataset generated through collaborative testing at Oak Ridge National Laboratory and Sandia National Laboratories and distributed through Mendeley Data (DOI: 10.17632/sn2kv34r4h) [36]. In the original experiments, a standardized single-side indentation procedure was used to apply increasing mechanical load to individual lithium-ion cells and induce an internal short circuit. Cell voltage, compressive load, indenter displacement, and temperature were recorded as time-resolved signals. Depending on the original test configuration, temperature was measured using one or multiple thermocouples located on the cell surface. Thus, the experiments analyzed here represent a common mechanically induced internal short-circuit abuse protocol rather than a mixture of external heating, overcharge, and conventional nail-penetration tests. The downloaded archive contained 253 experimental workbooks. In the present re-extraction, 250 workbooks yielded usable temperature–time data and 245 independent analyzable temperature series remained after duplicate handling. The primary cohort was selected using only pre-specified data-quality and cohort-size criteria: native sampling frequency ≥ 9.5 Hz, recorded temperature rise ≥ 50 °C, and membership in a cell/source family contributing at least seven qualifying experiments. These criteria yielded 67 experiments from six cell/source families. Neither the subsequent high-temperature rate metric nor the 0.5 and 1.0 °C·s−1 evaluation thresholds were used for cohort selection.
The resulting framework therefore linked three distinct evidence domains: real UAV electrical demand, non-abuse aviation-oriented thermal behavior, and rapid heating during battery abuse.
2.2. Electrical-Demand, Thermal-Rate, and Mission-Progression Metrics
For each DJI flight, mean, root-mean-square (RMS), 95th-percentile (P95), and maximum electrical power were calculated. P95 was selected as the primary upper-tail demand descriptor because it captures sustained high-power operation while being less sensitive than the instantaneous maximum to isolated samples. Aggregate dwell fractions above increasing power thresholds were also calculated to characterize the duration of high-load operation.
The primary adjusted flight model was restricted to route R1 because R1 contained the vast majority of complete flights (182 of 196) and provided repeated observations across the programmed payload, speed, and altitude levels. The remaining R2–R7 routes contributed only 14 flights in total and differed from R1 in route geometry or cruise-altitude profile, making them too sparse for stable multivariable adjustment without introducing additional route-related heterogeneity. After excluding the single 750 g R1 flight because it lacked within-level replication, the primary adjusted cohort comprised 181 R1 missions with payloads of 0, 250, or 500 g.
For each validated, approximately 1 s VTC6 mission, the maximum recorded temperature was defined using Equation (3).
Tmax = max[T(t)]
For thermal-domain comparison, the primary dynamic descriptor, r60, was defined in Equation (4) as the maximum approximately 1 s temperature-rise rate evaluated while the corresponding cell temperature was at least 60 °C.
Thus, r60 represents the fastest approximately 1 s heating observed after the measured temperature entered the T ≥ 60 °C domain. For the non-abuse VTC6 cohort, approximately 1 s eligibility was defined at cell level by a median native sampling interval between 0.5 and 1.5 s. Temperature-rise rates were calculated directly from adjacent timestamped observations, and individual intervals were retained only when their duration was between 0.5 and 1.5 times the cell-specific median interval, thereby excluding isolated timing irregularities without resampling the original traces. For the mechanically induced abuse cohort, each physical thermocouple was linearly interpolated independently onto a common 1 s time grid, and the fixed-window rate was calculated within that same channel as [Tj(t) − Tj(t − 1 s)]/1 s. The experiment-level r60 was then defined as the maximum qualifying value obtained from any individual thermocouple. This procedure provided an approximately matched 1 s comparison between the two datasets while preventing artificial derivatives caused by switching between thermocouple channels.
Among the 942 non-abuse VTC6 missions reaching Tmax 60 °C, 682 contained at least one valid approximately 1 s temperature pair after entry into the T ≥ 60 °C domain and therefore permitted direct calculation of r60. For the remaining 260 missions, no complete valid approximately 1 s temperature pair was available in this high-temperature domain. The published records did not permit these cases to be reliably separated into brief threshold crossings, end-of-record truncation, possible logging or sensor interruptions, or timing intervals failing the predefined validity criterion. For these missions, the maximum approximately 1 s temperature-rise rate over the complete mission was therefore used as a conservative upper-bound surrogate. Directly observed and conservatively bounded cases were retained separately, and unavailable high-temperature rates were not treated as zero.
To examine the evolution of the non-abuse aviation-oriented thermal domain across recorded mission progression, missions were ordered independently within each approximately 1 s cell. A normalized within-cell progression coordinate was defined using Equation (5).
where j is the ordered validated mission index within cell i, and Ni is the total number of validated missions for that cell. Values of = 0 and = 1 therefore represent the earliest and latest validated missions available for that cell, respectively. The coordinate was divided into ten equal progression bins. Importantly, represents recorded within-cell mission progression rather than state of health, remaining capacity, or a universal fraction of battery life.
For the abuse cohort, temperature-rise rates were recalculated within each physical thermocouple before experiment-level aggregation. At a given rate threshold, an experiment was classified as activated only when at least one individual thermocouple independently satisfied both T ≥ 60 °C and the rate condition. This same-thermocouple procedure avoided artificial derivatives that could arise when the hottest temperature channel changed between adjacent time points. The experiment-level abuse descriptor was the maximum same-thermocouple 1 s rate observed at T ≥ 60 °C.
2.3. Statistical Analysis and Cross-Domain Warning Assessment
Medians and interquartile ranges (IQRs) were used descriptively to summarize central tendency and dispersion across missions or cells, as appropriate. IQRs represent the spread of the central 50% of observations and were not interpreted as confidence intervals or inferential uncertainty bounds.
For the primary R1 cohort, flight-level P95 electrical power was modeled as a linear function of payload, programmed cruise speed, programmed altitude, and mean wind speed using Equation (6).
where P95 is the 95th percentile of electrical power within an individual flight; is the model intercept; and are the mutually adjusted regression coefficients for payload, programmed cruise speed, programmed altitude, and mean wind speed, respectively. The predictors were scaled to practically interpretable increments of 250 g, 2 m·s−1, 25 m, and 1 m·s−1, so that each coefficient directly represents the adjusted change in flight-level P95 power, in watts, for the corresponding increment while the other predictors are held constant. The term denotes the residual error. All four predictors were entered as continuous terms in the primary model.
Because multiple missions were conducted on the same date, standard errors were clustered by flight date using a CR1 finite-cluster covariance correction. Confidence intervals and two-sided p values were based on the Student t distribution with G − 1 degrees of freedom, where G = 16 flight-date clusters. Given the modest number of date clusters, interpretation emphasized effect sizes and 95% confidence intervals rather than p values. Variance inflation factors were calculated to assess multicollinearity. A categorical sensitivity model was additionally fitted for payload, programmed speed, and altitude, and alternative outcomes included mean, RMS, and maximum power.
For mission-progression analysis, each cell’s median Tmax in the first progression decile served as its own reference. The first-to-final decile change was calculated at cell level, and an exact two-sided paired sign test was used to test whether the direction of change was systematically positive or negative across the 16 cells.
Cross-domain thermal comparison focused on the literature-based reference criterion in Equation (7) [23].
A rate threshold of 0.5 °C·s−1 was also evaluated as a post hoc sensitivity analysis after inspection of the empirical domain separation. It was selected as a simple lower-rate benchmark that remained just above the observed conservative non-abuse upper boundary (0.451 °C·s−1), thereby testing whether the cross-domain separation persisted under a less stringent rate criterion than the pre-specified 1 °C·s−1 reference threshold. It was not treated as an optimized or proposed alarm threshold. Because non-abuse missions were repeatedly sampled from the same cells and abuse experiments were clustered across cell/source families, activation counts were reported descriptively rather than interpreted as independent estimates of diagnostic sensitivity or specificity.
3. Results and Discussion
3.1. Real UAV Electrical Demand and Mission-Dependent Loading
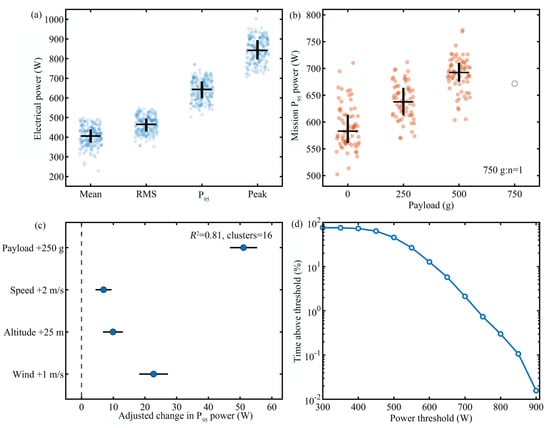
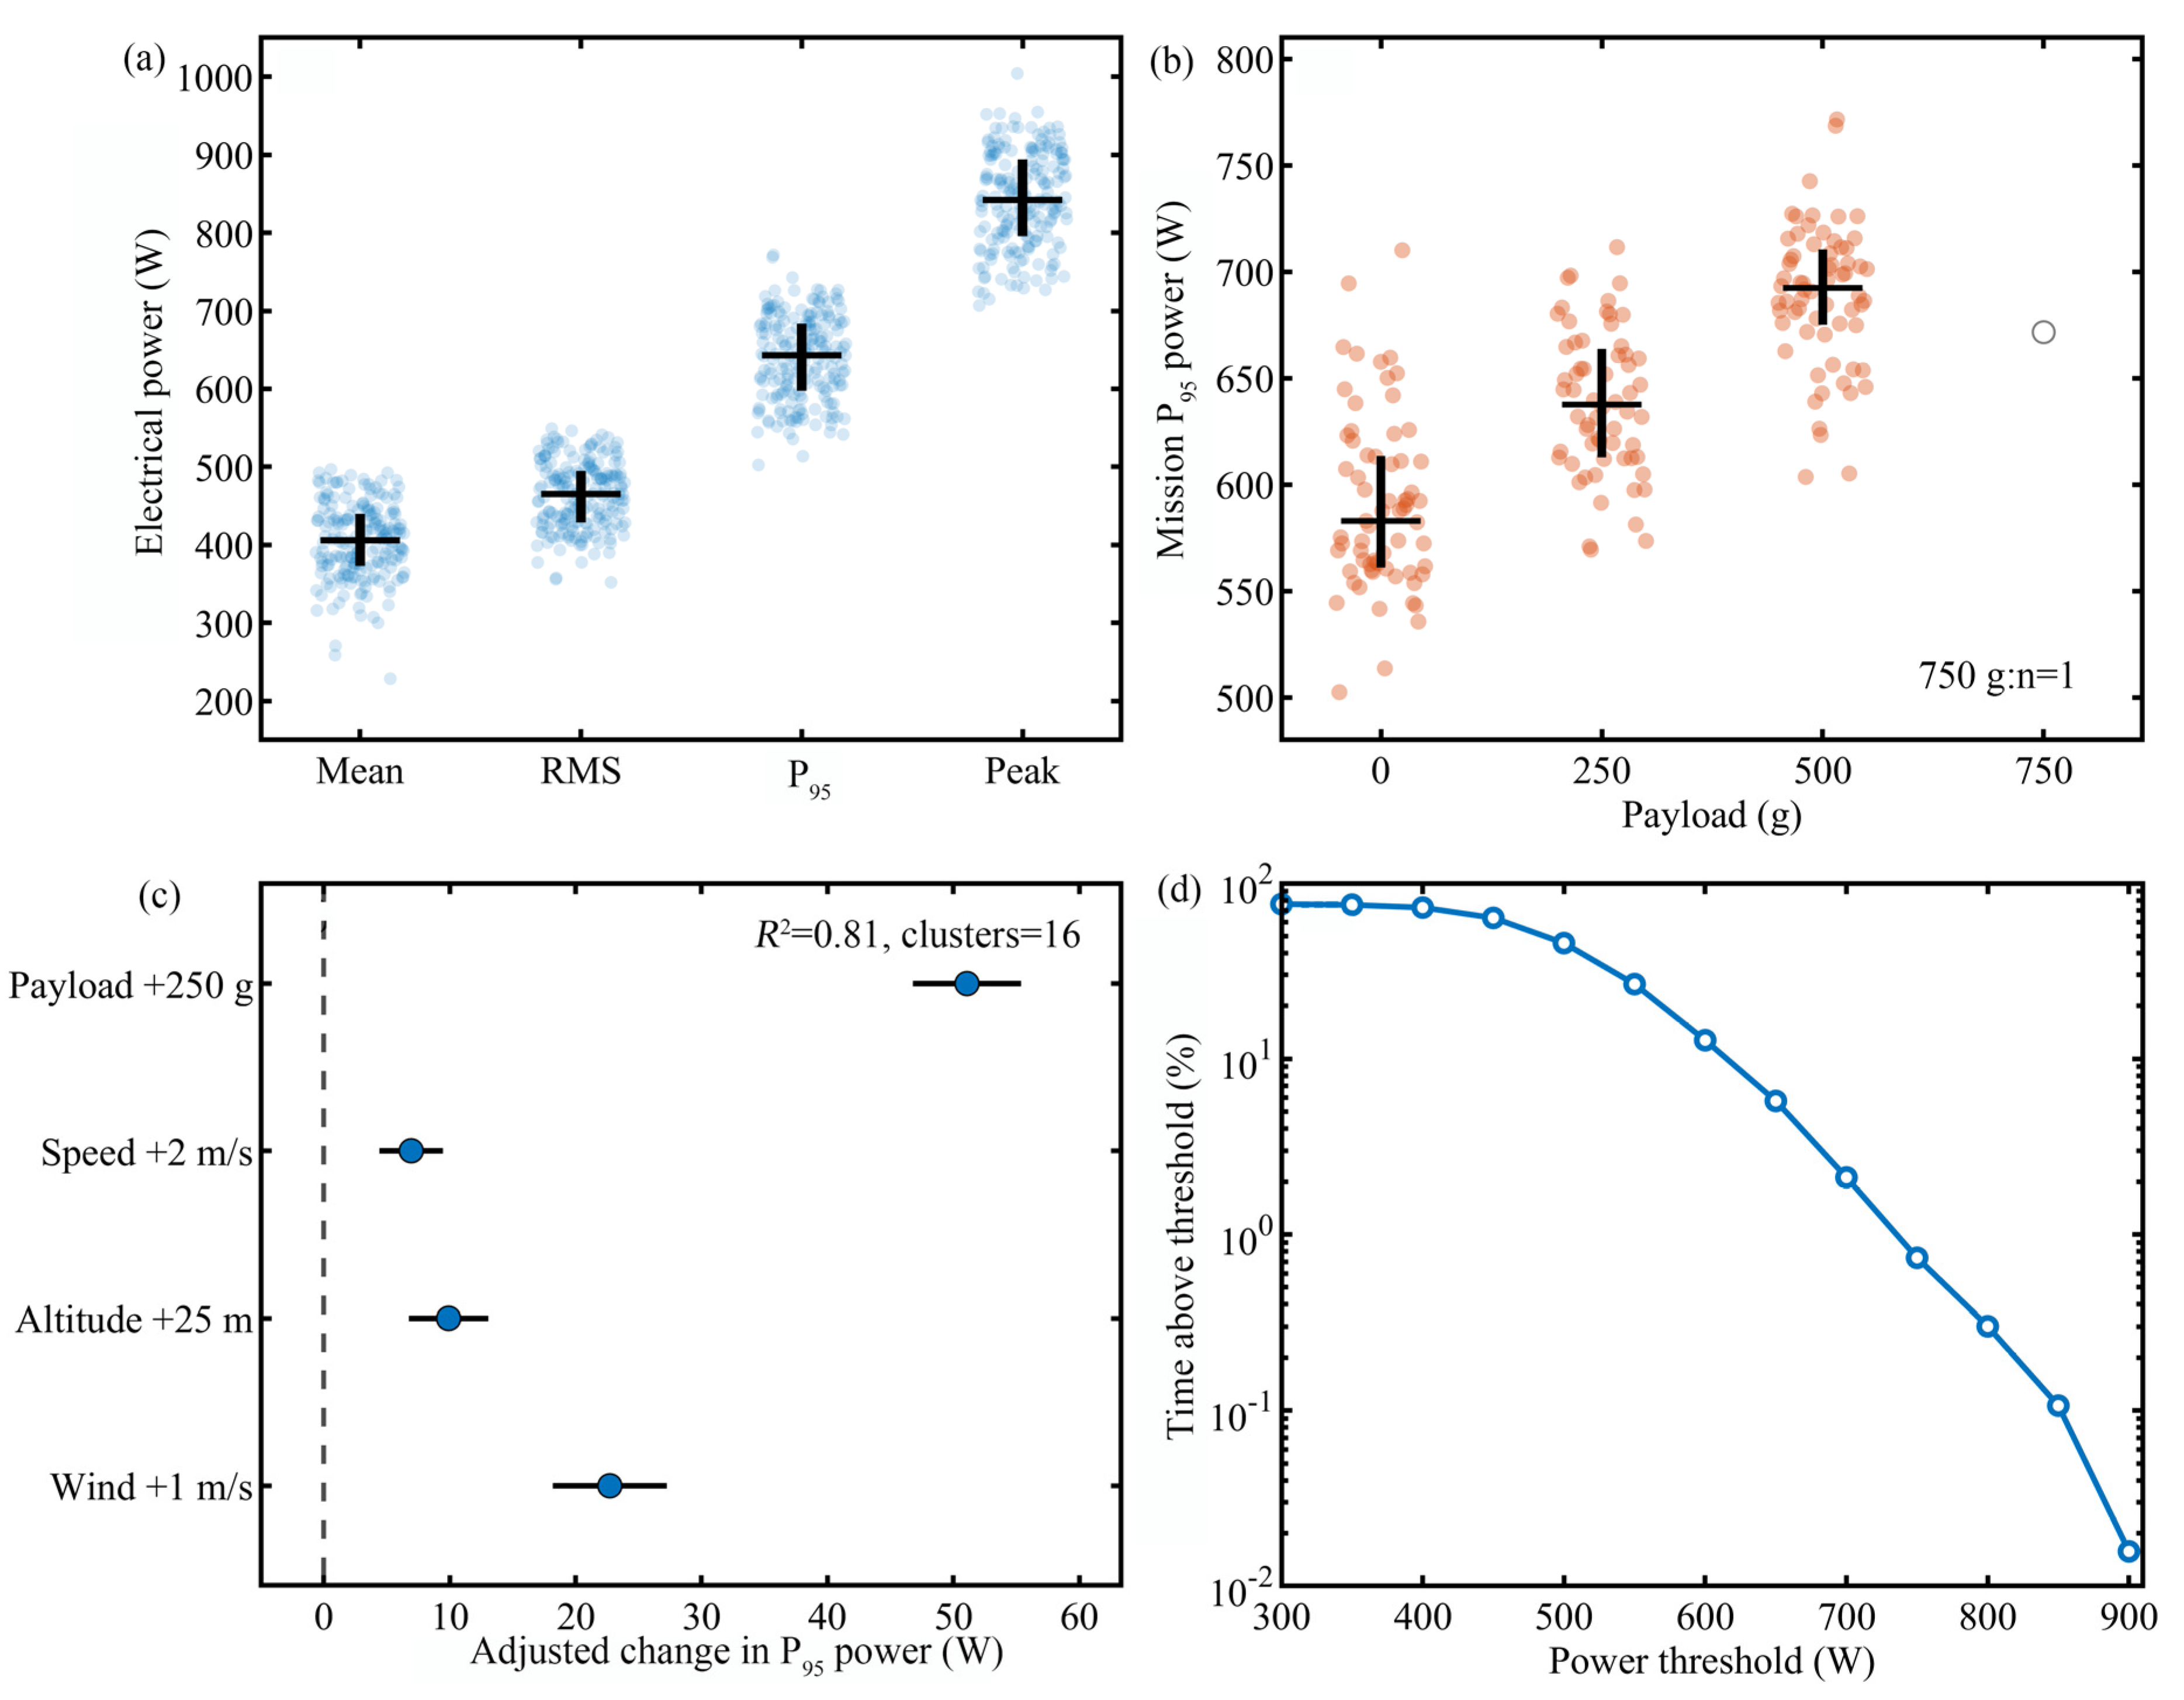
The 196 complete DJI R1-R7 flights showed that real multirotor operation imposed sustained high electrical demand rather than only brief isolated power peaks (Figure 2a). Flight-level mean, RMS, P95, and maximum electrical power were summarized for each mission, with median values of 405.9, 465.3, 643.1, and 842.1 W, respectively; the largest observed instantaneous power reached 1004.2 W. Figure 2a shows the distribution of these four flight-level metrics across individual missions, with medians and interquartile ranges indicating the central tendency and between-flight dispersion, respectively.
Figure 2.
Electrical-demand envelope of real multirotor UAV operation. (a) Flight-level power metrics across 196 complete missions. (b) Mission P95 power by payload. (c) Adjusted associations with P95 power in the primary R1 cohort. (d) Aggregate flight time above increasing power thresholds.
High electrical demand occupied a substantial fraction of total flight duration (Figure 2d). Across all 196 flights, 72.7% of aggregate flight time occurred above 400 W, 45.6% above 500 W, 12.8% above 600 W, and 2.11% above 700 W. Although operation above 800 W accounted for only 0.30% of aggregate duration, 144 of 196 missions contained at least one sample above this level, and 46 missions exceeded 900 W at least once. These results show that real UAV battery loading is better represented as a broad and highly dynamic demand distribution than by a single nominal discharge rate.
Payload showed the most consistent positive association with upper-tail power. Median P95 increased from 582.9 W at 0 g to 637.6 W at 250 g and 692.4 W at 500 g (Figure 2b). The single 750 g flight was retained for descriptive visualization but excluded from adjusted inference. In the route-controlled primary R1 cohort (n = 181), adjusted associations with P95 power were estimated for increments of 250 g payload, 2 m·s−1 programmed cruise speed, 25 m programmed altitude, and 1 m·s−1 mean wind speed (Figure 2c and Table 2). Each additional 250 g of payload was associated with a 51.1 W increase in P95 power (95% CI, 45.5–56.6 W). Corresponding adjusted increases were 6.9 W (4.6–9.3 W) per 2 m·s−1 programmed speed, 9.9 W (6.1–13.7 W) per 25 m programmed altitude, and 22.7 W (17.8–27.6 W) per 1 m·s−1 mean wind speed. Confidence intervals were based on date-clustered CR1 standard errors with Student-t inference using 16 date clusters (df = 15).
Table 2.
Adjusted associations between flight conditions and mission P95 electrical power in the primary DJI R1 cohort.
The model explained 80.9% of flight-to-flight variation in P95, and the maximum variance inflation factor was only 1.118, indicating negligible predictor collinearity. Treating payload categorically yielded adjusted increases of 53.7 W for 250 g and 102.4 W for 500 g relative to 0 g, closely reproducing the primary linear estimate.
The speed effect was more strongly concentrated at the upper end of the tested range. Relative to 4 ms−1, differences at 6 and 8 ms−1 were small, whereas 10 and 12 m·s−1 were associated with increases of approximately 12.9 and 27.7 W in P95, respectively. Moreover, speed was not consistently positively associated with mean, RMS, and peak power. The influence of speed therefore appears to involve the distribution and timing of upper-tail electrical demand rather than a uniform increase across all power descriptors.
Together, these field observations establish the electrical context in which UAV battery thermal-warning criteria must operate. They do not directly determine cell temperature or failure state, but they demonstrate that normal UAV operation can impose repeated and sustained high-load conditions whose thermal consequences must be distinguished from abnormal self-heating. These characteristics are consistent with the stringent power requirements previously identified for electric vertical-flight applications [2,3].
3.2. Progressive Temperature-Domain Overlap During Aviation-Oriented Non-Abuse Cycling
Absolute temperature showed substantial overlap with the non-abuse aviation-oriented laboratory domain. Among the 13,326 validated approximately 1 s missions from 16 VTC6 cells, 942 missions reached Tmax ≥ 60 °C, corresponding to 7.07% of the primary non-abuse cohort (Table 3). For the cross-domain comparison, r60 was defined as the maximum approximately 1 s temperature-rise rate evaluated while T ≥ 60 °C. For temperature-positive non-abuse missions in which a high-temperature rate could not be directly observed, the maximum whole-mission approximately 1 s temperature-rise rate was used as a conservative upper bound surrogate.
Table 3.
Cross-domain thermal characteristics and robustness of the evaluated thermal-warning descriptors.
Because multiple mission observations were obtained repeatedly from the same cells, the resulting activation proportions were treated as descriptive, cross-domain comparisons rather than as independent estimates of diagnostic sensitivity or specificity. The 0.5 °C·s−1 criterion was examined post hoc and is therefore reported only as a sensitivity analysis. The high-rate abuse cohort represents the evaluated abuse dataset and does not imply independently confirmed thermal runaway for every individual experiment.
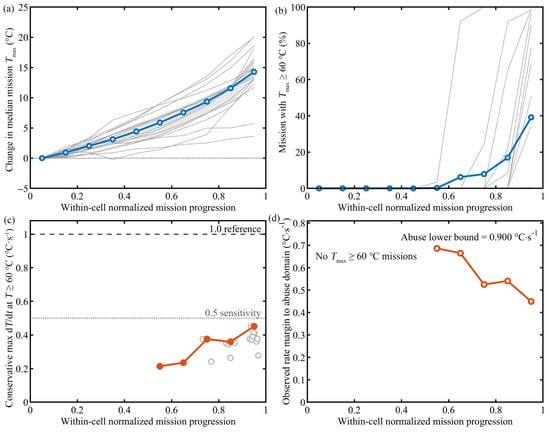
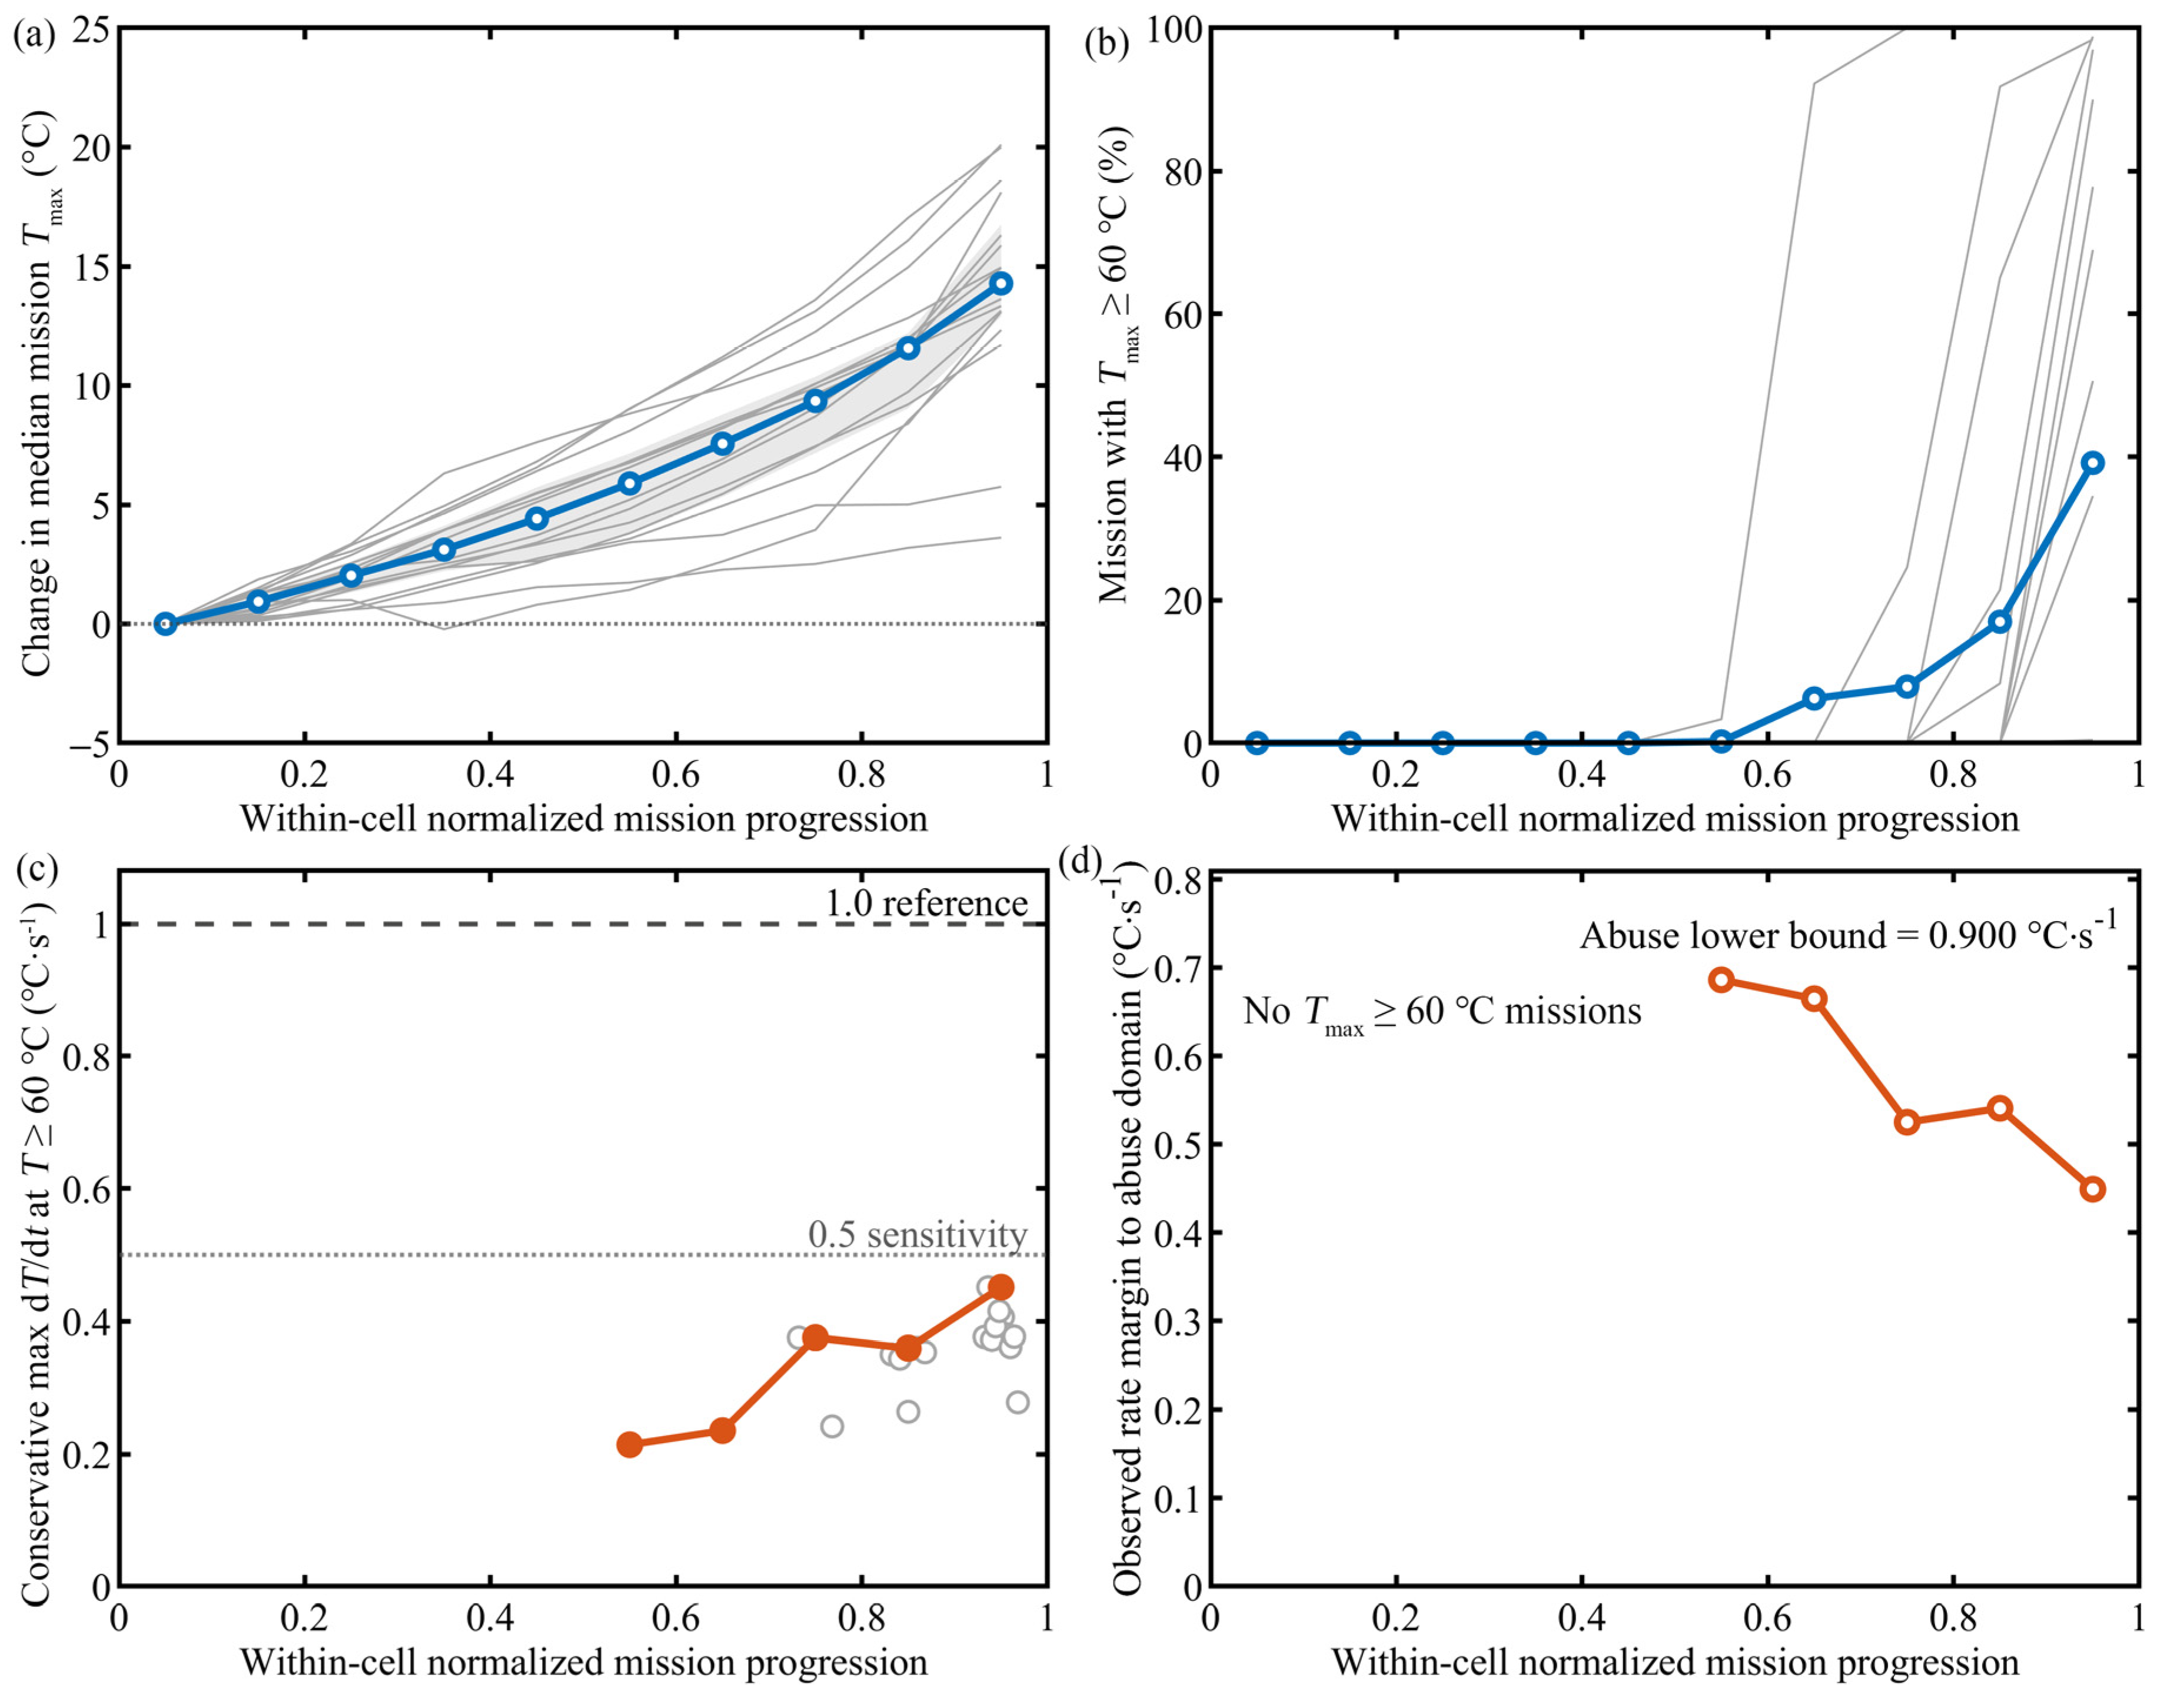
This overlap was strongly dependent on within-cell mission progression (Figure 3). Validated missions from each cell were ordered chronologically and mapped onto a normalized within-cell progression coordinate ranging from 0 to 1. This coordinate represents the recorded mission sequence and should not be interpreted as a direct measure of the state of health. Figure 3a shows the change in cell-specific median mission maximum temperature relative to the first progression decile, with the cross-cell median describing the typical trajectory and the interquartile range indicating between-cell dispersion at each progression decile. No mission in the first five progression deciles reached Tmax ≥ 60 °C. The pooled descriptive fraction first became nonzero in the sixth decile and increased progressively thereafter, reaching 39.18% in the final decile (Figure 3c). Because cells contributed different numbers of missions, this pooled percentage is presented descriptively; cell-level trajectories are shown in Figure 3b, and the early-to-late temperature comparison was performed at the cell level.
Figure 3.
Evolution of the non-abuse thermal domain across within-cell mission progression. (a) Cell-specific change in median mission maximum temperature. (b) Fraction of missions reaching Tmax ≥ 60 °C. (c) Conservative high-temperature maximum temperature-rise rate. (d) Separation between the non-abuse upper bound and the abuse-cohort lower bound.
The corresponding high-temperature heating-rate behavior remained substantially below that observed in the abuse cohort. Figure 3c shows the conservative maximum temperature-rise rate evaluated while T ≥ 60 °C; when a directly observable high-temperature rate was unavailable, the whole-mission maximum approximately 1 s rate was used as an upper-bound surrogate. The pre-specified 1 °C·s−1 reference criterion and the post hoc 0.5 °C·s−1 sensitivity threshold are shown for comparison. Figure 3d further quantifies the separation between the progression-bin non-abuse upper bound and the minimum same-thermocouple high-temperature rate observed across the 67 abuse experiments.
The increase in operating temperature was also evident at cell level. Relative to each cell’s first progression decile, the median first-to-final increase in mission Tmax was 14.28 °C, with an interquartile range of 12.90–16.76 °C, indicating that the central 50% of cell-specific increases were concentrated within this relatively narrow range. All 16 cells showed a positive first-to-final change, yielding an exact paired sign-test value of p = 3.05 × 10⁻⁵. Thus, the upward thermal shift was not driven solely by a small subset of cells. Operationally, the 14.28 °C median increase is important not because it represents a safety limit, but because it indicates a substantial reduction in the temperature margin to any fixed absolute-temperature warning threshold. Consistent with this shift, 39.18% of missions in the final progression decile reached Tmax ≥ 60 °C. This proportion should not be interpreted as indicating that 39.18% of missions were unsafe or approaching thermal runaway; rather, it shows that a 60 °C temperature condition alone became increasingly common within the evaluated non-abuse domain and therefore increasingly ambiguous as a stand-alone warning criterion.
The observed progression is qualitatively consistent with previous evidence that repeated cycling and battery degradation can alter internal resistance, heat generation, and electrothermal response [10,11,14,15]. However, the present normalized progression variable was based only on within-cell mission sequence and did not directly measure capacity retention, impedance growth, or state of health. The +14.28 °C change should therefore be interpreted as thermal-domain evolution across the recorded mission sequence, not as a calibrated aging–temperature relationship.
This distinction is important for thermal-warning design. An absolute threshold such as 60 °C retains physical meaning as an indicator of substantial thermal loading, but the present results show that its operational margin can shrink markedly across recorded aviation-oriented cycling. A fixed temperature condition may therefore become increasingly ambiguous even in the absence of transition into a failure state.
3.3. Persistence of Thermal-Rate Separation from the Abuse Domain
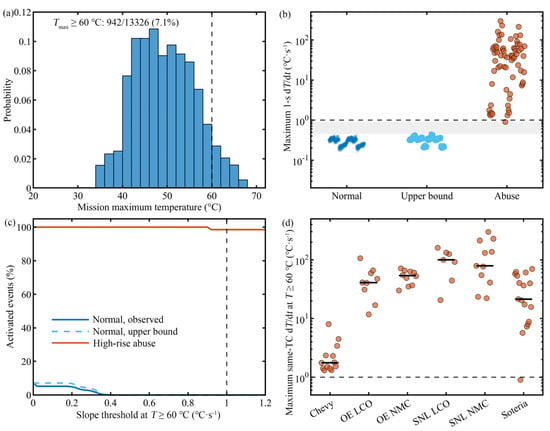
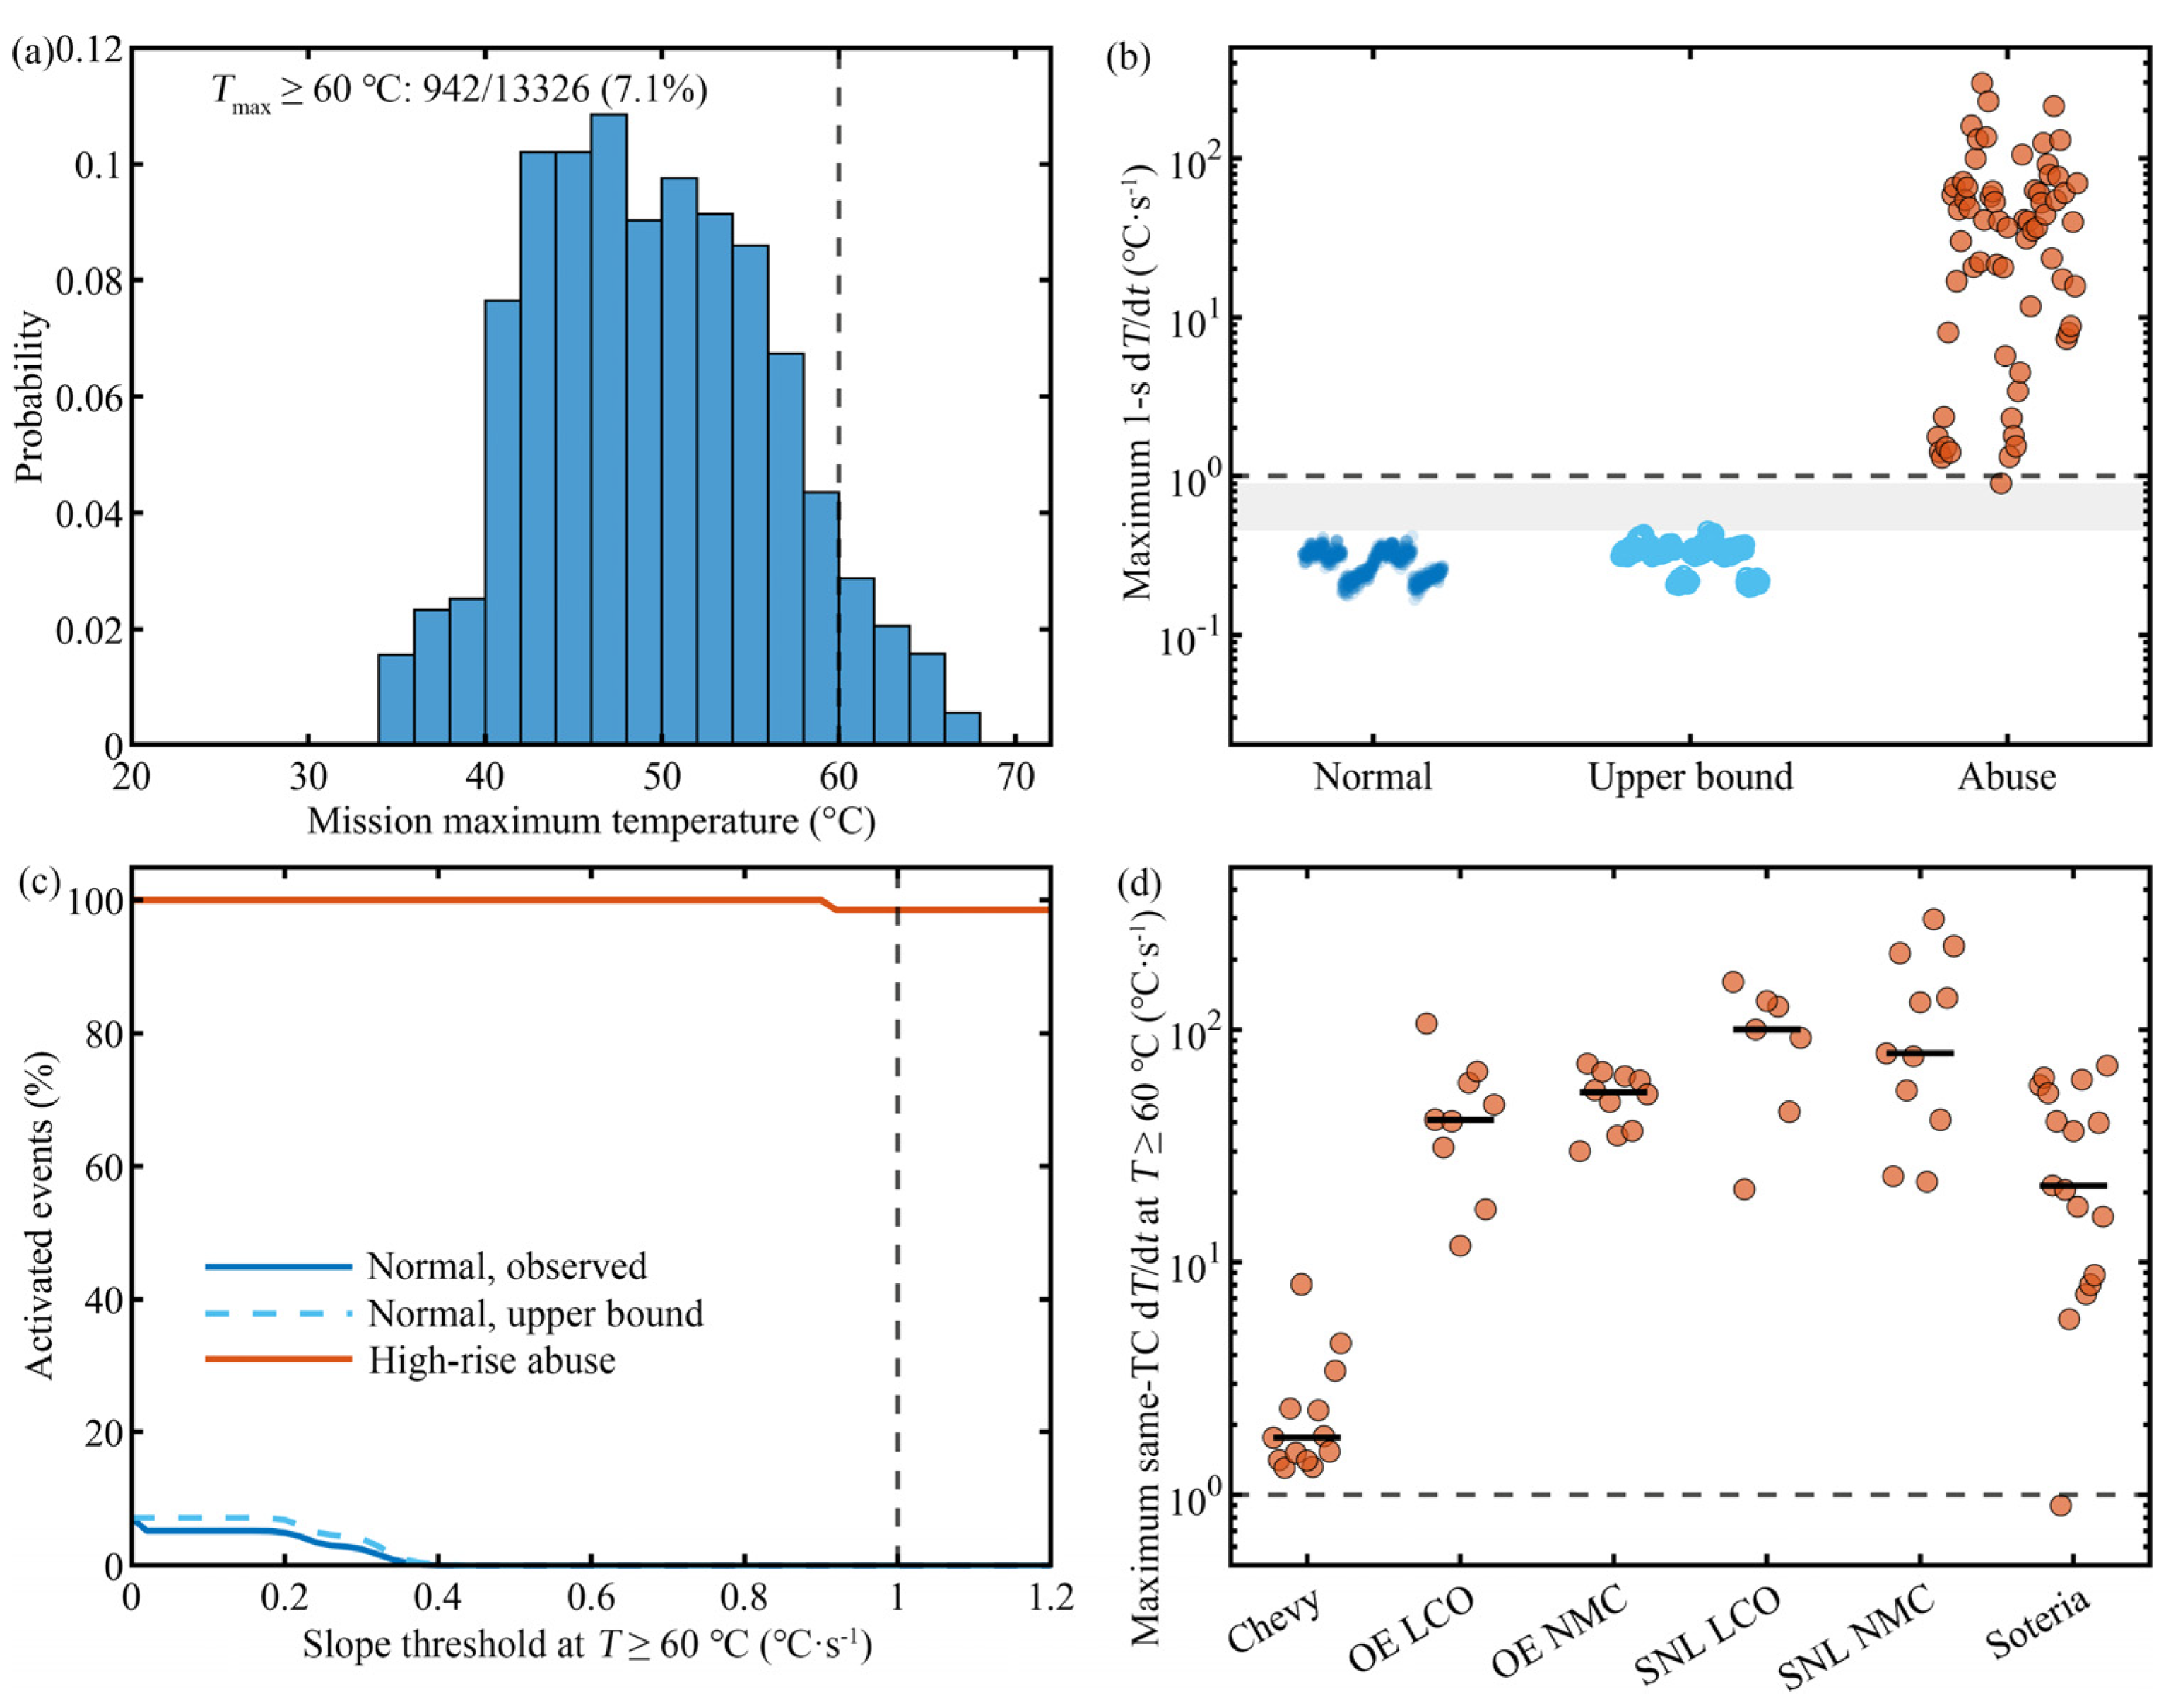
Temperature-rise rate provided substantially greater separation between the evaluated non-abuse aviation-oriented and abuse domains than absolute temperature alone (Figure 4 and Table 3). The comparison was performed at a matched approximately 1 s timescale. Figure 4a shows the distribution of mission maximum temperature in the non-abuse cohort, whereas Figure 4b compares directly observed and conservatively bounded high-temperature rise-rate distributions with those from the abuse experiments. Figure 4c summarizes activation counts across candidate high-temperature rise-rate thresholds, distinguishing directly observed non-abuse activations from the conservative whole-mission upper-bound scenario. Figure 4d shows experiment-level same-thermocouple high-temperature rise rates across the six abuse cell/source families. The 1 °C·s−1 threshold was the literature-based pre-specified reference criterion, whereas 0.5 °C·s−1 was examined post hoc as a sensitivity threshold.
Figure 4.
Cross-domain comparison of non-abuse aviation-oriented and abuse thermal behavior. (a) Mission maximum temperature. (b) High-temperature rise-rate distributions. (c) Threshold activation counts. (d) Abuse-family high-temperature rise rates.
Among non-abuse aviation-oriented missions with Tmax ≥ 60 °C, the largest directly observable high-temperature approximately 1 s rise rate was 0.415 °C·s−1. After conservatively assigning the whole-mission maximum approximately 1 s rate to temperature-positive missions lacking a directly calculable high-temperature slope pair, the maximum non-abuse domain boundary increased to only 0.451 °C·s−1.
In contrast, the lowest experiment-level same-thermocouple high-temperature maximum among the 67 abuse experiments was 0.900 °C·s−1. The resulting conservative empirical separation was therefore 0.449 °C·s−1. The 0.449 °C·s−1 separation is operationally meaningful as an empirical margin between the two evaluated domains at the matched approximately 1 s timescale: the lowest abuse-cohort boundary (0.900 °C·s−1) was approximately twice the conservative non-abuse upper boundary (0.449 °C·s−1). This margin indicates that, within the present datasets, the observed separation was not dependent on a narrowly placed threshold immediately adjacent to normal heating behavior. It should, however, be interpreted as an observed dataset-specific margin rather than as an engineering safety tolerance or a universally transferable threshold. This gap was not an artifact of switching between thermocouples. Recalculation using the same physical thermocouple for both temperature and derivative measurements produced identical event-level classification to the previous envelope-based implementation in all 67 abuse experiments.
The literature-based reference criterion combining T ≥ 60 °C and dT/dt ≥ 1 °Cs−1 produced no observed activation among the 13,326 non-abuse aviation-oriented missions and activated in 66 of 67 abuse experiments. The single non-activating experiment reached a same-thermocouple maximum high-temperature rate of approximately 0.900 °C·s−1. Lowering the rate component to 0.5 °C·s−1 yielded activation in all 67 abuse experiments while still producing zero non-abuse mission activations in the present datasets; however, because this threshold was examined after the empirical separation was known, it should be interpreted only as a sensitivity result.
The progression analysis provided an additional robustness check. Once missions exceeding 60 °C began to appear, the conservative progression-bin non-abuse boundaries remained approximately 0.214, 0.235, 0.375, 0.359, and 0.451 °Cs−1 from progression deciles 6–10, respectively (Figure 3c). Consequently, even in the final progression decile, the minimum observed non-abuse-to-abuse rate-domain gap remained approximately 0.449 °C·s−1 (Figure 3d).
The combined evidence therefore reveals an important contrast: temperature-domain overlap increased, whereas thermal-rate separation persisted across the recorded aviation-oriented cycling progression.
Recent aviation-oriented studies have demonstrated that gas, pressure, voltage, mechanical response, and thermal signals can provide advance warning of thermal runaway under dedicated abuse and low-pressure conditions [28,37,38]. The present analysis addresses a complementary question: whether simple thermal descriptors remain distinguishable from states encountered during a large number of non-abuse aviation-oriented laboratory duty cycles. In this respect, absolute temperature showed increasing ambiguity, whereas matched-timescale high-temperature rise rate retained empirical separation from the evaluated high-rise abuse domain.
The large variation in abusive thermal behavior across chemistry, state of charge, format, and testing conditions is consistent with previous experimental and mechanistic studies [39,40,41]. In the present study, the abuse cohort included multiple cell/source families spanning different chemistries, capacities, cell formats, and sensor configurations, which provides some evidence that the observed abuse-side lower boundary was not determined by a single cell family. However, this heterogeneity should not be interpreted as demonstrating chemistry-independent robustness of the cross-domain separation. The non-abuse aviation-oriented cohort consisted only of Sony-Murata VTC6 cells, and the mechanically induced experiments were conducted at the cell level under a common indentation-based abuse protocol. Pack-level thermal gradients, inter-cell heat transfer, cooling architecture, sensor placement, and pack control strategies were therefore not represented. Consequently, the observed 0.449 °C·s−1 separation cannot presently be assumed to persist across other chemistries or UAV pack configurations without application-specific validation. Furthermore, the DJI flight dataset and the VTC6 thermal dataset were obtained from independent battery systems. The value of the cross-dataset comparison is therefore not direct trajectory reconstruction, but assessment of whether simple warning descriptors occupy overlapping or distinct empirical domains across complementary operational and abuse datasets.
Application-specific validation remains necessary before any numerical criterion is used in a UAV battery-management or safety system. In particular, future work should combine synchronized electrical, thermal, gas, pressure, and mechanical measurements in UAV-specific cells and packs across environmental conditions, aging states, and realistic flight loads.
4. Conclusions
This study integrated real UAV flight records, aviation-oriented non-abuse laboratory cycling data, and independent abuse experiments to evaluate how operational and abuse thermal domains overlap and separate under UAV-relevant conditions.
Real multirotor missions imposed sustained high electrical demand, with a median mission P95 of 643.1 W and observed instantaneous power exceeding 1 kW. Payload was the most consistent mission-level determinant of upper-tail demand: each additional 250 g was associated with an approximately 51 W increase in P95 power after adjustment for programmed speed, altitude, and wind.
Absolute temperature alone showed substantial overlap with aviation-oriented non-abuse cycling. Overall, 7.07% of the 13,326 approximately 1 s missions reached at least 60 °C. Moreover, the non-abuse temperature domain shifted upward across recorded within-cell mission progression, with a median first-to-final progression-decile increase of 14.28 °C and positive changes in all 16 cells.
In contrast, the high-temperature heating-rate domain remained separated in the evaluated datasets. The conservative maximum non-abuse rate at T ≥ 60 °C was 0.451 °C·s−1, compared with a minimum of 0.900 °C·s−1 among the 67 abuse experiments. The literature-based reference criterion combining T ≥ 60 °C with dT/dt ≥ 1 °C·s−1 produced no observed activation among the 13,326 non-abuse aviation-oriented missions and activated in 66 of 67 abuse experiments.
The principal implication is therefore not that a universal UAV thermal-runaway threshold has been established. Rather, the results demonstrate that absolute-temperature overlap can increase markedly across repeated aviation-oriented duty cycling while an empirical thermal-rate separation remains observable. Thermal warning for UAV batteries should consequently consider both thermal state and thermal dynamics. The observed rate-domain margin should be regarded as empirical and dataset-specific rather than chemistry- or pack-independent, and any numerical criterion should be validated on application-specific cells and packs across realistic mission, environmental, and degradation conditions.
Author Contributions
Conceptualization, Y.L. and N.W.; methodology, Y.L. and N.W.; software, Y.L.; validation, Y.L.; formal analysis, Y.L.; investigation, Y.L. and N.W.; data curation, Y.L.; writing—original draft preparation, Y.L.; writing—review and editing, N.W., M.L. and L.H.; visualization, Y.L.; supervision, N.W., M.L. and L.H.; project administration, N.W. All authors have read and agreed to the published version of the manuscript.
Funding
This research received no external funding.
Data Availability Statement
The DJI Matrice 100 flight data and the Sony-Murata VTC6 aviation-oriented cycling data are publicly available through the source datasets cited in Refs. [4,5], respectively. The mechanically induced battery-abuse data were obtained from the publicly available Mechanically Induced Thermal Runaway for Li-ion Batteries dataset hosted on Mendeley Data (Version 2; DOI: 10.17632/sn2kv34r4h.2) and described in Ref. [36]. The 67-experiment primary abuse cohort was derived from these source workbooks using the pre-specified sampling-resolution, temperature-rise, and minimum family-size criteria described in Section 2.1, with source-level provenance retained in the analysis catalogue. Derived analysis tables and MATLAB (version R2024b; The MathWorks, Inc., Natick, MA, USA) scripts used to generate the reported results are available from the corresponding author upon reasonable request.
Acknowledgments
During the preparation of this manuscript, the authors used ChatGPT (GPT-5.6 Sol, OpenAI, San Francisco, CA, USA) to assist with English-language editing, including improvements in grammar, clarity, concision, and readability. The authors subsequently reviewed and manually edited all AI-assisted outputs and take full responsibility for the content and scientific accuracy of the final publication.
Conflicts of Interest
The authors declare no conflicts of interest.
References
- Sripad, S.; Bills, A.; Viswanathan, V. A Review of Safety Considerations for Batteries in Aircraft with Electric Propulsion. MRS Bull. 2021, 46, 435–442. [Google Scholar] [CrossRef] [Scilit]
- Yang, X.-G.; Liu, T.; Ge, S.; Rountree, E.; Wang, C.-Y. Challenges and Key Requirements of Batteries for Electric Vertical Takeoff and Landing Aircraft. Joule 2021, 5, 1644–1659. [Google Scholar] [CrossRef] [Scilit]
- Fredericks, W.L.; Sripad, S.; Bower, G.C.; Viswanathan, V. Performance Metrics Required of Next-Generation Batteries to Electrify Vertical Takeoff and Landing (VTOL) Aircraft. ACS Energy Lett. 2018, 3, 2989–2994. [Google Scholar] [CrossRef] [Scilit]
- Rodrigues, T.A.; Patrikar, J.; Choudhry, A.; Feldgoise, J.; Arcot, V.; Gahlaut, A.; Lau, S.; Moon, B.; Wagner, B.; Matthews, H.S.; et al. In-Flight Positional and Energy Use Data Set of a DJI Matrice 100 Quadcopter for Small Package Delivery. Sci. Data 2021, 8, 155. [Google Scholar] [CrossRef] [Scilit] [PubMed]
- Bills, A.; Sripad, S.; Fredericks, L.; Guttenberg, M.; Charles, D.; Frank, E.; Viswanathan, V. A Battery Dataset for Electric Vertical Takeoff and Landing Aircraft. Sci. Data 2023, 10, 344. [Google Scholar] [CrossRef] [Scilit] [PubMed]
- Yu, R.; Wang, M.; Niu, M.; Fan, M.; Guan, Y.; Su, Y. Temperature Monitoring of Lithium-Ion Batteries: Sensor Technologies, Deployment Strategies, and Smart Batteries. J. Energy Chem. 2026, 119, 245–262. [Google Scholar] [CrossRef] [Scilit]
- Bandhauer, T.M.; Garimella, S.; Fuller, T.F. A Critical Review of Thermal Issues in Lithium-Ion Batteries. J. Electrochem. Soc. 2011, 158, R1. [Google Scholar] [CrossRef] [Scilit]
- Ma, S.; Jiang, M.; Tao, P.; Song, C.; Wu, J.; Wang, J.; Deng, T.; Shang, W. Temperature Effect and Thermal Impact in Lithium-Ion Batteries: A Review. Prog. Nat. Sci. Mater. Int. 2018, 28, 653–666. [Google Scholar] [CrossRef] [Scilit]
- Liu, J.; Zhou, L.; Zhang, H.; Zhao, K.; Wang, Z. Aging and Thermal Behavior of Lithium-Ion Battery under High Charging Current Cycling. Therm. Sci. Eng. Prog. 2026, 69, 104466. [Google Scholar] [CrossRef] [Scilit]
- Shen, W.; Wang, N.; Zhang, J.; Wang, F.; Zhang, G. Heat Generation and Degradation Mechanism of Lithium-Ion Batteries during High-Temperature Aging. ACS Omega 2022, 7, 44733–44742. [Google Scholar] [CrossRef] [Scilit] [PubMed]
- Vetter, J.; Novák, P.; Wagner, M.R.; Veit, C.; Möller, K.-C.; Besenhard, J.O.; Winter, M.; Wohlfahrt-Mehrens, M.; Vogler, C.; Hammouche, A. Ageing Mechanisms in Lithium-Ion Batteries. J. Power Sources 2005, 147, 269–281. [Google Scholar] [CrossRef] [Scilit]
- Liu, T.; Yang, X.-G.; Ge, S.; Leng, Y.; Wang, C.-Y. Ultrafast Charging of Energy-Dense Lithium-Ion Batteries for Urban Air Mobility. eTransportation 2021, 7, 100103. [Google Scholar] [CrossRef] [Scilit]
- Mitici, M.; Hennink, B.; Pavel, M.; Dong, J. Prognostics for Lithium-Ion Batteries for Electric Vertical Take-off and Landing Aircraft Using Data-Driven Machine Learning. Energy AI 2023, 12, 100233. [Google Scholar] [CrossRef] [Scilit]
- Yang, J.; Chen, S.; Pang, T.; Sun, J.; Zhu, X.; Huang, W.; Fan, G.; Zhang, X. A Concurrent Estimation Framework for Multiple Aging Parameters of Lithium-Ion Batteries for eVTOL Applications. Appl. Energy 2025, 399, 126500. [Google Scholar] [CrossRef] [Scilit]
- Bills, A.; Fredericks, L.; Sulzer, V.; Viswanathan, V. Massively Distributed Bayesian Analysis of Electric Aircraft Battery Degradation. ACS Energy Lett. 2023, 8, 3578–3585. [Google Scholar] [CrossRef] [Scilit]
- Wei, N.; Li, M. Experimental Study of Thermal Runaway Process of 50 Ah Prismatic Nickel-Rich Battery. Energies 2023, 16, 5967. [Google Scholar] [CrossRef] [Scilit]
- Wei, N.; Li, M. Experimental Investigation of Thermal Runaway in 40Ah Prismatic Lithium Batteries at Different SOC. An. Acad. Bras. Ciênc. 2024, 96, e20230648. [Google Scholar] [CrossRef] [Scilit] [PubMed]
- Feng, X.; Ouyang, M.; Liu, X.; Lu, L.; Xia, Y.; He, X. Thermal Runaway Mechanism of Lithium Ion Battery for Electric Vehicles: A Review. Energy Storage Mater. 2018, 10, 246–267. [Google Scholar] [CrossRef] [Scilit]
- Li, X.; Li, W.; Chen, L.; Lu, Y.; Su, Y.; Bao, L.; Wang, J.; Chen, R.; Chen, S.; Wu, F. Ethoxy (Pentafluoro) Cyclotriphosphazene (PFPN) as a Multi-Functional Flame Retardant Electrolyte Additive for Lithium-Ion Batteries. J. Power Sources 2018, 378, 707–716. [Google Scholar] [CrossRef] [Scilit]
- Yang, Y.-P.; Jiang, J.-C.; Huang, A.-C.; Tang, Y.; Liu, Y.-C.; Xie, L.-J.; Zhang, C.-Z.; Wu, Z.; Xing, Z.-X.; Yu, F. 3-(Trifluoromethyl)Benzoylacetonitrile: A Multi-Functional Safe Electrolyte Additive for LiNi0.8Co0.1Mn0.1O2 Cathode of High Voltage Lithium-Ion Battery. Process Saf. Environ. Prot. 2022, 160, 80–90. [Google Scholar] [CrossRef] [Scilit]
- Yang, Y.-P.; Huang, A.-C.; Tang, Y.; Liu, Y.-C.; Wu, Z.-H.; Zhou, H.-L.; Li, Z.-P.; Shu, C.-M.; Jiang, J.-C.; Xing, Z.-X. Thermal Stability Analysis of Lithium-Ion Battery Electrolytes Based on Lithium Bis(Trifluoromethanesulfonyl)Imide-Lithium Difluoro(Oxalato)Borate Dual-Salt. Polymers 2021, 13, 707. [Google Scholar] [CrossRef] [Scilit] [PubMed]
- Maddipatla, S.; Kwon, B.; Jeevarajan, J.; Pecht, M. Prognostic Approaches for Early Detection of Thermal Runaway in Lithium-Ion Batteries. Battery Energy 2026, 5, e70149. [Google Scholar] [CrossRef] [Scilit]
- Chen, Q.; He, Y.; Fang, N.; Yu, G. A Combined Data-Driven and Model-Based Algorithm for Accurate Battery Thermal Runaway Warning. Sensors 2024, 24, 4964. [Google Scholar] [CrossRef] [Scilit] [PubMed]
- Song, Y.; Jiang, X.; Lyu, N.; Lu, H.; Zhang, D.; Li, H.; Jin, Y. Early Warning of Lithium-Ion Battery Thermal Runaway Based on Gas Sensors. eTransportation 2025, 26, 100502. [Google Scholar] [CrossRef] [Scilit]
- Yang, J.; Yang, Y.; Deng, W.; Liu, T.; Chen, D.; Wang, M.; Xie, J.; Zhang, Q. Early Warning Strategy of Thermal Runaway for Aviation Lithium-Ion Batteries from Operando Parameters Evaluation. Chem. Eng. J. 2026, 529, 172781. [Google Scholar] [CrossRef] [Scilit]
- Yang, L.; Liu, F.; Li, F.; Chen, Z.; Wang, J.; Gao, L.; Xiao, F.; Sun, J.; Romagnoli, A. Thermal Runaway Prevention and Mitigation for Lithium-Ion Battery-Powered Electric Aircraft: Challenges and Perspectives. Aerosp. Traffic Saf. 2024, 1, 103–118. [Google Scholar] [CrossRef] [Scilit]
- Liu, S.; Lu, S.; Huang, J.; Zhao, J.; Zhang, H. A Review on Thermal Runaway Warning Technologies for Aviation Lithium-Ion Batteries: Progress, Challenges, and Prospects. Renew. Sustain. Energy Rev. 2026, 239, 117149. [Google Scholar] [CrossRef] [Scilit]
- Liu, S.; Lu, S.; Huang, J.; Zhao, J.; Zhang, H. Adaptive Multi-Parameter Early Warning of Lithium-Ion Battery Thermal Runaway for Electric Aircraft under Low-Pressure Conditions. Aerosp. Sci. Technol. 2026, 172, 111752. [Google Scholar] [CrossRef] [Scilit]
- Huang, J.; Xia, Y.; Xu, S.; Li, L.; Ji, H.; Chen, X.; Xu, J. Predictive Thermal Safety of Lithium-Ion Batteries through a Unified Kinetic-Thermal Framework. J. Mater. Chem. A 2026, 14, 6651–6662. [Google Scholar] [CrossRef] [Scilit]
- Elsner, F.; Pischinger, S. Thermal Runaway in Batteries: A Database-Driven Literature Review and Exploratory Statistical Analysis. Batteries 2026, 12, 240. [Google Scholar] [CrossRef] [Scilit]
- Su, J.; DiFelice, A.; Mawela, J.; Gan, J.; Che, S.; Cho, W.; Yan, H.; Xiao, Y.; Yao, X.; Guo, X.; et al. Engineering Strategies to Suppress Thermal Runaway Propagation in Lithium-Ion Battery: Mechanisms, Metrics, Materials, and Evaluation Methods. Adv. Sci. 2026, 13, e76502. [Google Scholar] [CrossRef] [Scilit] [PubMed]
- Jia, Z.; Liu, Y.; Duan, Q.; Wang, Q. Thermodynamic Understanding Thermal Runaway Characteristics and Propagation Mechanisms of Aircraft Power Battery Modules under Low-Pressure Conditions. eTransportation 2026, 29, 100629. [Google Scholar] [CrossRef] [Scilit]
- Cheng, Q.; Wan, X.; Liu, X.; Shi, D.; Ouyang, D.; Yao, J.; Wang, J.; Miao, C. Thermal Runaway Behavior of Lithium-Ion Batteries under Aircraft Cargo Cabin Conditions: Effects of Triggering Protocol, Heating Power, and Preload Force. J. Energy Storage 2026, 171, 122900. [Google Scholar] [CrossRef] [Scilit]
- Yang, J.; Xiao, Y.; Yan, M.; Huang, X.; Li, L.; Zhang, Z.; Cheng, X.; Zhang, H.; Pan, Y. Dual-Network Aerogel-Based Thermal-Safety Management System Design for Electric-Aircraft Battery Packs: Efficient Heat Management and Runaway Protection. Nano-Micro Lett. 2026, 18, 447. [Google Scholar] [CrossRef] [Scilit] [PubMed]
- Ping, P.; Wang, Q.; Chung, Y.; Wen, J. Modelling Electro-Thermal Response of Lithium-Ion Batteries from Normal to Abuse Conditions. Appl. Energy 2017, 205, 1327–1344. [Google Scholar] [CrossRef] [Scilit]
- Lin, L.; Li, J.; Fishman, I.M.; Torres-Castro, L.; Preger, Y.; De Angelis, V.; Derin, I.; Zhu, X.; Wang, H. Dataset of Mechanically Induced Thermal Runaway Measurement and Severity Level on Li-Ion Batteries. Data Brief 2024, 55, 110609. [Google Scholar] [CrossRef] [Scilit] [PubMed]
- Liu, S.; Guo, Q.; Zhang, J.; Huang, Z.; Han, D. Investigation on Thermal Runaway Behaviors and Gas Generation Dynamics of Lithium-Ion Batteries Induced by Electrical Abuse at Low-Pressure Conditions. J. Energy Storage 2025, 125, 116855. [Google Scholar] [CrossRef] [Scilit]
- Liu, S.; Kong, X.; Wang, J.; Li, S.; Ma, C.; Xu, C.; Zhang, W.; Zhang, J.; Huang, Z.; Han, D. Effect of Low Pressure on Thermal Runaway Behavior of Lithium-Ion Batteries Induced by Internal Short Circuit with Optical Diagnostics. Energy 2026, 344, 139869. [Google Scholar] [CrossRef] [Scilit]
- Bugryniec, P.J.; Resendiz, E.G.; Nwophoke, S.M.; Khanna, S.; James, C.; Brown, S.F. Review of Gas Emissions from Lithium-Ion Battery Thermal Runaway Failure—Considering Toxic and Flammable Compounds. J. Energy Storage 2024, 87, 111288. [Google Scholar] [CrossRef] [Scilit]
- Finegan, D.P.; Billman, J.; Darst, J.; Hughes, P.; Trillo, J.; Sharp, M.; Benson, A.; Pham, M.; Kesuma, I.; Buckwell, M.; et al. The Battery Failure Databank: Insights from an Open-Access Database of Thermal Runaway Behaviors of Li-Ion Cells and a Resource for Benchmarking Risks. J. Power Sources 2024, 597, 234106. [Google Scholar] [CrossRef] [Scilit]
- Chi, A.; Gao, Y.; Jiang, Q.; Chu, D.; Deng, Z.; Wang, J. Overheat-to-Thermal-Runaway Characteristics and Fuzzy Risk Assessment of Automotive Lithium-Ion Cells with Different Cathode Materials, Capacities, Packaging, and States of Charge. J. Power Sources 2025, 659, 238470. [Google Scholar] [CrossRef] [Scilit]

Disclaimer/Publisher’s Note: The statements, opinions and data contained in all publications are solely those of the individual author(s) and contributor(s) and not of MDPI and/or the editor(s). MDPI and/or the editor(s) disclaim responsibility for any injury to people or property resulting from any ideas, methods, instructions or products referred to in the content. |
© 2026 by the authors. Licensee MDPI, Basel, Switzerland. This article is an open access article distributed under the terms and conditions of the Creative Commons Attribution (CC BY) license.