


Abstract
As a core component of the new power system, energy-storage batteries undergo capacity degradation, increasing internal resistance and declining state of health (SOH) as a result of calendar aging. These changes compromise the operational safety and life-cycle economic performance of energy-storage stations. To address the need for calendar-aging risk management in stationary batteries and accurate SOH estimation from cycling data, this study develops two complementary components: a field priority-charging strategy for stationary cells and a data-driven SOH prediction model evaluated on public cycling datasets. The strategy defines criteria for low-energy stationary batteries and establishes weighted priority-charging rules for risk-cell locking and power replenishment. We construct an SOH prediction model that integrates interactive convolution and adaptive spectral modules, and we use the Dream Optimization Algorithm to optimize its hyperparameters and address multi-scale feature entanglement and limited prediction accuracy. The results show that the strategy replenishes SOC and increases cell voltage in stationary batteries, and that the risk score is significantly correlated with SOH. On the CALCE and Oxford cycling datasets, the model yields lower errors than the evaluated baselines, although the reduction depends on the battery and comparator. Ablation tests confirm the superiority of each module. This study provides a field risk-management scheme for stationary batteries and a high-precision SOH prediction method validated on public cycling datasets.
1. Introduction
As the global energy transition accelerates, the new-energy industry is expanding rapidly, together with its upstream and downstream supply chains. Energy storage is a representative part of this development [1]. As an indispensable component of the new power system, energy-storage stations are being deployed at increasing scale and sophistication. Nevertheless, several practical challenges have emerged during this development. Because energy-storage stations are important for photovoltaic-power integration, cost remains a central challenge [2]. Batteries account for approximately 40% of total station investment and nearly 60% of Battery Energy-Storage System (BESS) costs [3]. Their aging and health status, therefore, require close attention.
Large-scale energy-storage stations and consumer electronics impose different performance requirements on batteries [4]. Aging rules established for consumer-electronics batteries, therefore, cannot be transferred directly to energy-storage applications. Battery aging is generally reflected by declining electrochemical performance, particularly capacity loss and increased internal resistance [5]. For example, a battery is widely considered to reach the end of its service life when its residual capacity falls to 80% of its initial capacity [6]. For high-power batteries, a doubling of impedance may also be used to define the end of life [7]. In practical applications, the causes of energy-storage battery aging can be classified as operational aging and static aging. Operational aging is unavoidable because irreversible degradation occurs in all batteries during service [8]. For example, unstable operating conditions can produce unbalanced discharge, accelerate the loss of lithium ions and loss of active material (LAM), and promote irreversible processes such as solid-electrolyte-interphase (SEI) film growth [9]. Even protective operating practices cannot eliminate electrochemical aging mechanisms such as lithium-ion loss and LAM; they can only influence the service life. Because energy-storage stations are connected to the power system, their batteries cannot operate under ideal charge–discharge conditions during daily grid dispatch. Consequently, some batteries are used frequently, whereas others operate infrequently or remain in static standby [10]. After production, battery performance also declines over time under low-frequency use or idle standby until it reaches a specified aging threshold, such as 80% of initial capacity. The duration of this process is referred to as calendar life or calendar aging [11]. Calendar aging is, therefore, unavoidable in practical energy-storage systems. It originates from continuous, irreversible side reactions within the battery that cannot be completely eliminated, even under optimal storage conditions [12]. Reasonable monitoring and mitigation strategies are, therefore, essential for protecting battery health, planning battery service and reducing operating costs in energy-storage applications.
Accurate SOH estimation can help resolve several operational challenges in energy-storage stations. First, as a core BESS safety indicator, SOH can effectively identify abnormal batteries, prevent thermal runaway at its source and reduce the risk of fire [13]. Second, SOH provides an important basis for assessing aging. It supports strategies such as balancing control and single-cell replacement, thereby limiting cluster degradation caused by deteriorated cells and reducing operation and maintenance costs. It also supports echelon utilization and retirement recycling, improving whole-life-cycle economic benefits [14]. Finally, energy-storage systems are important for peak regulation, frequency control and emergency standby. Battery degradation can slow the power response and reduce available capacity, potentially preventing the station from meeting grid-dispatch instructions [15].
Extensive research has established a relatively mature theoretical framework for SOH estimation. Following conventional classifications, we divide existing methods into four categories.
The first category comprises experiment-based detection methods. These methods estimate SOH by measuring aging-related parameters, such as capacity and internal resistance, during battery operation [16]. However, these methods require highly accurate sensors and are suitable only for offline laboratory applications, limiting their practical value for engineering deployment.
The second category comprises model-based methods. These methods simulate SOH evolution through battery models and can provide estimates over the full life cycle [17]. Typical representatives include empirical degradation models, equivalent-circuit models, and electrochemical models. Empirical degradation models fit functions to SOH degradation curves. For example, a modified linear model with an exponential-decay slope achieved favorable long-term prediction accuracy and generalization [18]. However, these models have limited interpretability and cannot explain phenomena such as battery capacity increases. Equivalent-circuit models simulate battery behavior with circuit elements such as resistors to estimate SOH. Liu et al. [19] used a second-order RC equivalent-circuit model with a constant-current bias compensation term in a Kalman-filtering framework, substantially improving prediction accuracy. This approach has a simple structure and low computational cost and can be combined with filtering algorithms for online SOH estimation. Nevertheless, accurate simulation under complex operating conditions remains difficult. Electrochemical models describe battery-aging mechanisms using partial differential equations. Electrochemical impedance spectroscopy has also been used to obtain internal degradation information for SOH estimation [20]. Because batteries involve complex internal chemical mechanisms, these models require substantial computation and intricate structures, creating practical challenges for researchers.
The third category comprises data-driven black-box methods. Given the complex internal reactions described above, data-driven methods provide a viable alternative. By treating the battery interior as a black box, these methods bypass detailed mechanism analysis, extract external health features (HFs) associated with aging, and learn a mapping between HFs and SOH [21]. Representative data-driven algorithms including support vector machines (SVMs) [22], the random forest regression [23], and data-driven cycle-life prediction [24] have been widely adopted. However, their accuracy depends strongly on health-feature selection and operating conditions. With advances in artificial intelligence, deep learning algorithms have increasingly replaced traditional machine learning methods. Their adaptability and representation capacity help address nonlinear, weakly correlated health features and complex temporal dependencies. For example, Du et al. [25] combined convolutional neural networks with wavelet transforms and attention, improving SOH prediction accuracy. Wang et al. [26] proposed an exponential-smoothing Transformer with temporal and channel attention, thereby improving prediction accuracy through self-attention.
The fourth category comprises hybrid methods. Because the preceding categories have complementary strengths and limitations, hybrid methods integrate their advantages within a single framework. They can achieve high-quality predictions without increasing computational cost and are, therefore, considered promising research strategies. Hybrid methods combine complementary physical, statistical and data-driven information. Waag et al. [27] reviewed diagnostic and prognostic approaches for lithium-ion batteries, including model-based and data-driven health assessment. Linghu et al. [28] proposed an SOH estimation method integrating data augmentation with an LSTM-iTransformer model, which addresses data scarcity and improves prediction accuracy. Zhang and Lee [29] summarized prognostic and health-monitoring methods for lithium-ion batteries and emphasized the need to combine measured signals with degradation-aware models.
Several challenges remain in SOH estimation for energy-storage batteries. First, batteries operate under non-ideal conditions. A degraded single cell can create voltage differences that affect the entire cluster and distort associated SOH information. Second, SOH prediction cannot rely solely on historical cycling SOH. It is essential to consider the effects of exogenous variables such as operating temperature, charge–discharge rate and cycle number. Finally, energy-storage stations require systematic monitoring and diagnosis frameworks that account for calendar aging.
Mainstream public lithium-battery datasets, including CALCE and Oxford, are mainly recorded under cyclic charge–discharge aging conditions. Full-life time-series data for long-term static calendar aging are difficult to obtain because energy-storage station assets are commercially confidential. To address this limitation, we separate the evaluation of the calendar-aging risk-management strategy from the quantitative assessment of the SOH prediction model. The former is examined using on-site monitoring data from static batteries, whereas the latter is evaluated using public cycling datasets. Accordingly, the present results demonstrate prediction performance on cycling data and observations from field risk management. They do not independently validate pure calendar-aging prediction or separate calendar aging from cycle aging.
Existing hybrid SOH prediction schemes often stack independent network modules without targeted structural redesign or interactive feature transmission for composite battery aging. This can result in superficial integration and insufficient separation of multi-scale aging features. In contrast to this component-stacking paradigm, we do not directly adopt the original, unmodified adaptive spectral block (ASB), interactive convolution block (ICB) and CrossLinear structures. Instead, we customize and reconstruct each module for battery-aging tasks and build bidirectional, normalized feature interaction channels between the spectral decomposition and interactive convolution units. The resulting three-part architecture forms an integrated time–frequency feature interaction mechanism for representing low- and high-frequency patterns in the measured sequences. In this manuscript, these frequency components are treated as temporal-scale features rather than independently verified physical signatures of calendar and cycle aging. The architecture is designed to reduce feature coupling in SOH prediction, whereas validation under pure calendar-aging and controlled composite-aging conditions remains outside the available dataset. Building on our previous studies [30,31,32], this study further proposes a comprehensive calendar-aging-oriented SOH prediction and active-protection strategy for energy-storage batteries. We establish a weighted risk score based on SOC, intra-cluster voltage difference and other parameters to classify batteries as Category A high-risk static cells or Category B normal cells. Category A batteries are locked from discharge and receive priority charging to mitigate operational exposure to calendar aging. Meanwhile, the reconstructed ICB and ASB modules [33] are embedded into the optimized CrossLinear architecture [34] to build the ICB-ASB-CrossLinear SOH prediction model, where the Dream Optimization Algorithm (DOA) [35] is utilized for hyperparameter tuning. Ablation experiments are used to compare the contribution of the modules. The main contributions of this study are summarized as follows:
(1) To address calendar aging, we design a targeted management strategy and formulate a priority score. The strategy is intuitive and efficient for identifying charging priorities during daily operation. The risk score is also significantly correlated with SOH and may support subsequent SOH research.
(2) We propose an integrated multi-scale feature-decoupling mechanism by reconstructing ICB, ASB and CrossLinear with bidirectional cross-feature interactions. The resulting model eliminates interference among multidimensional battery-health features during SOH prediction. Ablation experiments assess the necessity of each module and the performance of the proposed model.
(3) We use the Dream Optimization Algorithm to address hyperparameter selection in the deep learning model and improve prediction accuracy.
This paper is organized as follows. Section 2 introduces SOH and the preliminary data processing. Section 3 presents the calendar-aging countermeasure strategy and the prediction model implementation. Section 4 reports experiments on the aging-control strategy and prediction model, together with the ablation analysis. Section 5 summarizes the findings and discusses future research directions.
2. Preliminary Information
2.1. SOH Estimation
SOH is used to quantify the aging and degradation of a battery by comparing its current performance with its original state. It is generally expressed as a percentage. The standard SOH value of a new battery is 100%. When available capacity falls below 80% of the initial rated capacity or internal impedance rises substantially above 120% of the initial internal resistance, the battery faces potential failure or retirement and requires timely replacement. Most academic studies use the capacity ratio as the battery-health criterion. We follow this definition, as shown in Equation (1).
Here, Cn denotes the battery capacity at the current cycle, and Ci denotes the initial battery capacity.
2.2. Dataset Selection
We use a dataset comprising four prismatic batteries, CS2-35 to CS2-38, from the University of Maryland [36]. Each battery has a rated capacity of 1100 mAh and a weight of approximately 21.1 g. All batteries follow the same charging profile under a standard constant-current and constant-voltage protocol. Specifically, the batteries are charged at 0.5 C until the voltage reaches 4.2 V, followed by constant-voltage charging at 4.2 V until the current falls below 0.05 A. Unless otherwise specified, the discharge cut-off voltage is 2.7 V, and cycling is performed at a constant current of 1 C.
In addition, two batteries (Nos. 1 and 2) from the University of Oxford are used for robustness validation [37]. Each battery has a nominal capacity of 740 mAh, and its charge–discharge data were recorded at 40 °C. The Oxford cells have the same nominal capacity; the capacity difference discussed here is between the Oxford cells and the 1100 mAh CALCE cells. The two datasets also differ in electrochemical composition, cell format, ambient temperature and load profile, allowing us to assess model generalization and robustness.
We use two publicly available lithium-ion battery datasets, CALCE CS2 and the Oxford dataset, to evaluate the generalization of the proposed health-status prediction model. The two datasets differ substantially in battery specifications, testing environments and aging conditions. The CALCE CS2 dataset uses prismatic lithium cobalt oxide (LCO) batteries with a nominal capacity of 1100 mAh. The aging experiments were conducted at a constant room temperature of 25 °C. The batteries followed standard constant-current/constant-voltage (CC-CV) charging and fixed-rate constant-current discharge protocols. Capacity degradation was mainly caused by repeated cycling under standardized laboratory conditions. By contrast, the Oxford dataset contains pouch-type NMC batteries with a capacity of 0.74 Ah. All aging tests were conducted at an elevated temperature of 40 °C. Unlike fixed-rate constant-current discharge, this dataset uses a dynamic load profile derived from urban driving to simulate vehicle operation. The resulting degradation record reflects a combined high-temperature and dynamic-cycling condition; the available data do not independently identify the contribution of calendar aging versus cycling aging. Differences in chemistry, cell format, rated capacity, operating temperature and discharge load provide a basis for assessing model robustness across battery types and operating scenarios.
2.3. Feature Extraction and Correlation Analysis
To extract aging-related health features from the original charge–discharge time series, we selected six representative indicators: two time-domain voltage-plateau features, two constant-current charging-duration features and two incremental-capacity (IC) curve features. Using Battery No. 35 as an example, we extracted these features as shown in Figure A1. The definitions and calculation procedures for health features (HF1–HF6) are as follows:
HF1: Charging-time characteristic (isobaric rise duration). This is the cumulative time required for the battery voltage to reach the cut-off voltage during constant-current charging:
Here, tstart is the start time of constant-current charging, and tCV is the time at which the battery enters the constant-voltage stage.
HF2: Constant-current charging duration. This is the duration of the constant-current segment before the transition to constant-voltage charging.
HF3: Constant-voltage charging duration. This is the duration of constant-voltage charging until the current falls below the cut-off threshold.
HF4: Discharging-time characteristic (isobaric drop duration). This is the total discharge time from full SOC to the discharge cut-off voltage at the rated current:
HF5: IC peak value. This is the maximum of the incremental-capacity curve, calculated as IC = dC/dV, and reflects lithium-intercalation activity within the cell:
HF6: IC peak voltage. This is the terminal voltage corresponding to the maximum of the incremental-capacity curve, that is, the voltage coordinate of HF5.
We then performed Pearson correlation analysis on the six HFs. The results are shown as a heat map in Figure A2.
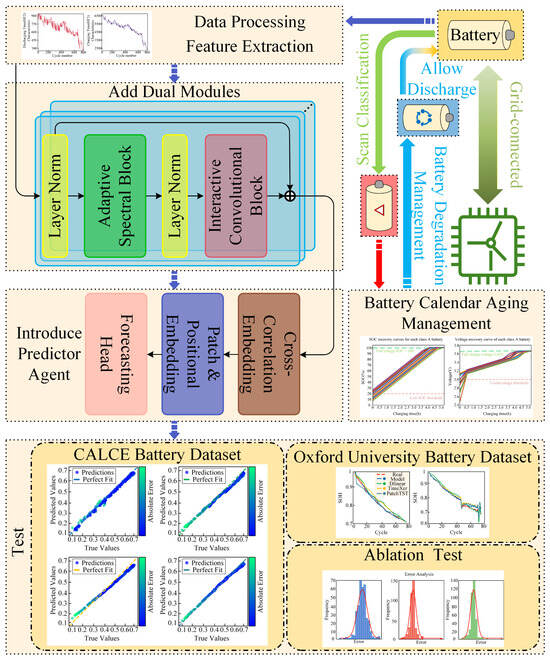
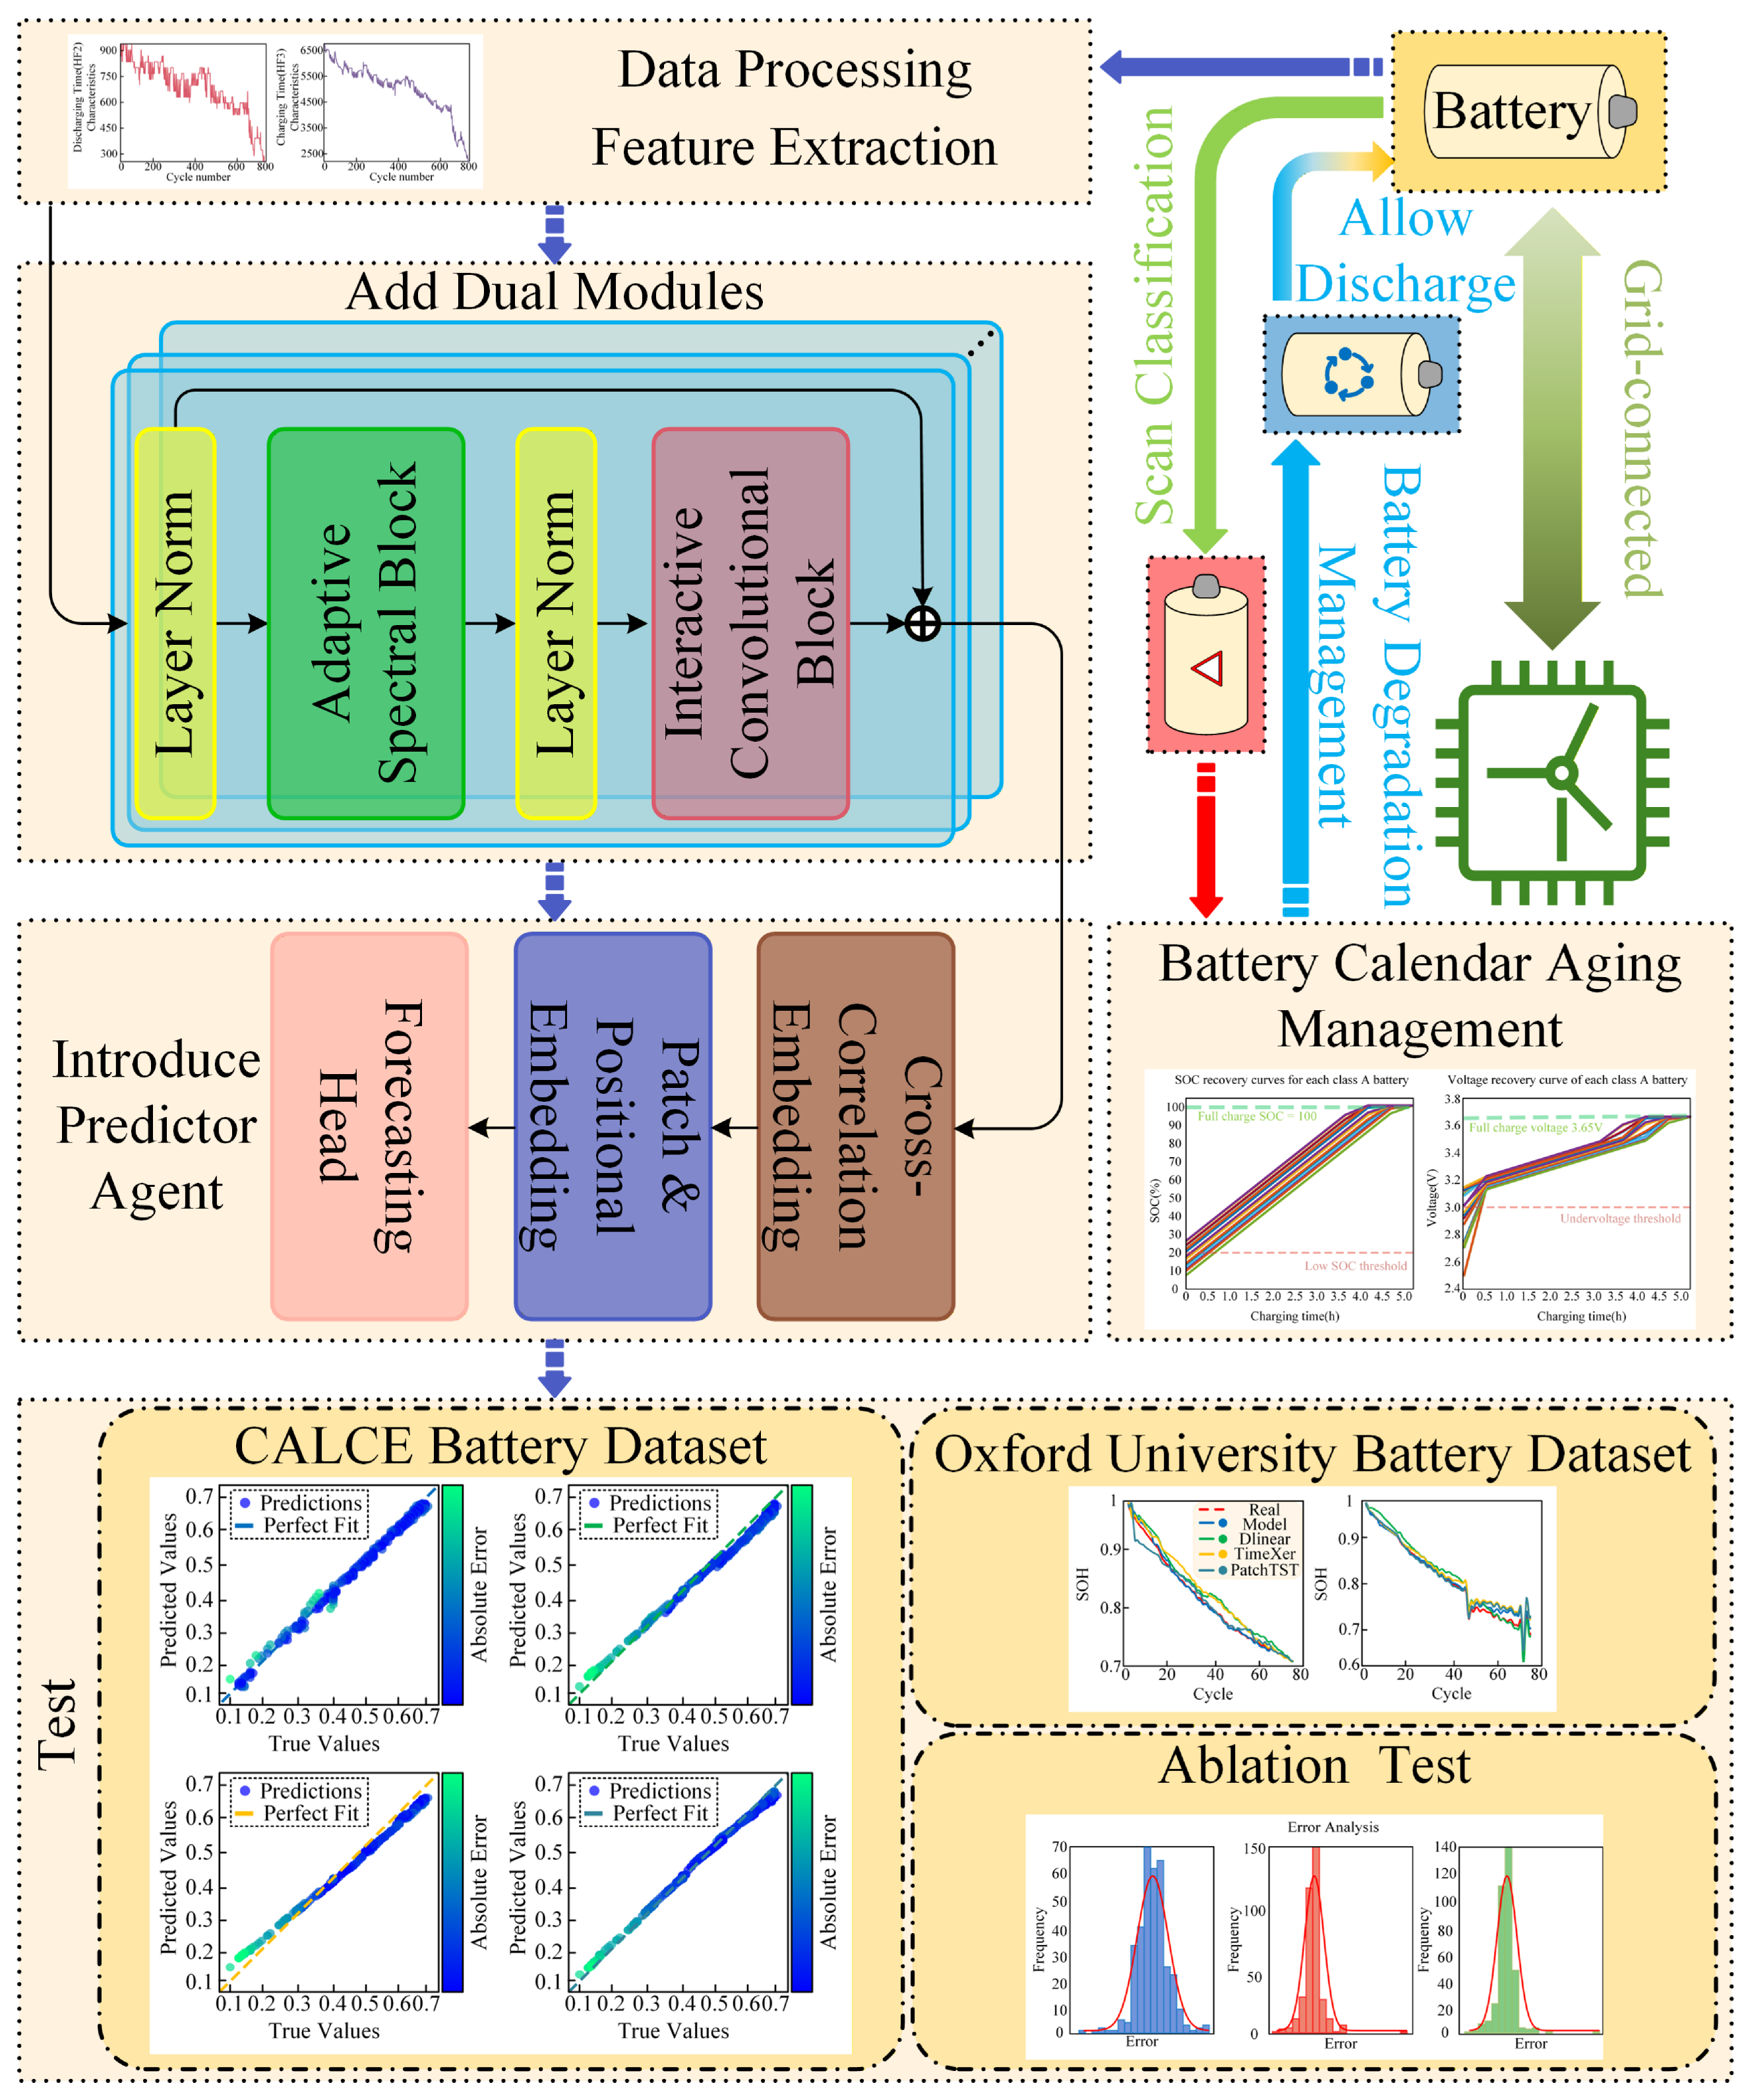
Figure A2 shows strong positive correlations among HF1, HF2 and HF3. HF1–HF3 are strongly negatively correlated with HF4 and HF6, whereas HF4 and HF6 are strongly positively correlated with each other. HF5 is positively correlated with HF1–HF3 and negatively correlated with HF4 and HF6. SOH is positively correlated with HF1, HF2, HF3 and HF5 but negatively correlated with HF4 and HF6. The strong linear correlations between all six health features and SOH demonstrate that these features effectively characterize battery degradation and are suitable candidate inputs for the prediction model. The overall workflow is shown in Figure 1.
Figure 1.
Workflow.
3. Calendar-Aging Countermeasure Strategy
3.1. Definition of Long-Term Quiescent, Low-Energy Batteries
Given the operating and standby patterns of batteries in energy-storage stations and the characteristics of calendar aging, long-term quiescent, low-energy batteries must be identified for subsequent management.
Considering the application characteristics of energy-storage batteries, we define five evaluation criteria. A battery that meets at least two criteria during subsequent monitoring is classified as a target long-term quiescent, low-energy battery. The first and primary criterion is no charging for at least seven consecutive days. The second is an SOC below 20%. The third is a terminal voltage below 3.0 V, or persistence in the undervoltage range for the relevant chemistry, using lithium iron phosphate batteries as an example. The fourth is a voltage difference exceeding 50 mV relative to the cluster average, or an internal resistance 15% above its initial value. The fifth is fewer than two charge–discharge cycles during the preceding 30 days.
The five criteria were not selected solely from experience. They were derived by integrating the time-dependent electrochemical aging mechanisms of lithium batteries, national energy-storage standards and power-station operation and maintenance requirements. Examples include the “Operation and Maintenance Regulations for Energy Storage Stations” (GB/T 40090-2021), “Battery Management System for Electric Energy Storage” (GB/T 34131-2023) and “Lithium-Ion Batteries for Electric Energy Storage” (GB/T 36276-2023).
3.2. Coping Strategies
3.2.1. General Principle
Considering that the purpose of detection is to mitigate the impact of calendar aging on battery state of health, priority charging should be arranged exclusively for low-energy batteries that have been idle without charging for a long time after the assessment. Such batteries are temporarily prohibited from discharging and connecting to the grid until the activation charge is completed. This short-term high-SOC step is an operational reserve measure for routine dispatch and emergency response, where sufficient stored energy and voltage headroom are required for rapid power delivery; it is not a recommendation to hold cells indefinitely at high SOC. Both batteries pending charging and fully charged batteries are marked accordingly; each batch is unlocked only after being fully charged, and unified scheduling is conducted only after all batteries reach the qualified standard. A mild low charging rate is adopted throughout the charging process to avoid impacting the internal electrochemical system of the battery and reduce the risk of health degradation such as SEI film damage.
3.2.2. Priority-Scoring Rule
Based on these criteria and principles, we propose a priority rule. A weighted priority score is assigned to each battery, and batteries with higher scores receive higher charging priority, as shown in Equation (5):
Here, t denotes the standing time of the target battery, TSOC denotes its SOC level, and ΔV denotes the voltage difference between the target battery and the other cells in the same cluster. The present score uses voltage difference as the consistency term, although an equivalent formulation based on the internal-resistance change rate is also feasible. The equation, therefore, incorporates the core evaluation criteria. To protect intra-cluster consistency, the priority strategy is applied to the worst-performing cell in each cluster. The score is, therefore, a dimensionless, monotone engineering risk index: each term is oriented so that a larger value represents greater operational risk, and the weights preserve the relative contribution of standing time, low SOC and cluster inconsistency. Temperature was not added as a fourth term because the available station record and the public CALCE/Oxford benchmark files do not provide synchronized cell-temperature histories with the same sampling and aging labels; a temperature-weight calibration would require a dedicated laboratory dataset or a comparable field campaign.
3.2.3. Calibration Analysis of Weight Correlations
To assess the rationale for the weight coefficients, we first performed a mechanism-informed correlation calibration using the 64 selected aging-sample batteries, described at the beginning of Section 4.1. This calibration provides an interpretable initialization for the engineering risk score rather than a uniquely optimal statistical estimate.
We first extracted t, TSOC and ΔV for the 64 sample batteries and calculated the SOH of each battery. Because the predictors have different units and ranges, we converted them to dimensionless, risk-oriented quantities before combination, with larger values indicating greater priority risk. The absolute Pearson coefficients with SOH were |r|t = 0.78, |r|TSOC = 0.76, and |r|ΔV = 0.39. Their relative magnitudes provide a transparent, data-informed initialization, yielding approximately 0.4:0.4:0.2 after normalization. This procedure prevents a variable from dominating the score solely because it is expressed in days, percentage points or millivolts.
To assess local sensitivity around the correlation-informed initialization, we evaluated four candidate coefficient combinations subject to weights summing to one. These combinations perturb the relative contributions of standing time, SOC and voltage difference while preserving the same dimensionless risk-score structure. We compared the goodness of fit between the risk score and SOH for each combination, as shown in Table 1. The small spread in R2 across the tested combinations indicates that the association is not driven by a single sharply tuned point and that the weighting rule is locally stable. A formal cross-validation estimate would require independent battery-cluster splits. Randomly splitting the 64 cells could leak cluster-level operating conditions. Only four field clusters are available for cluster-level validation, making such an estimate unstable without additional independent data. We, therefore, treat cross-validation as an important future validation step rather than claiming that it was completed for the present dataset.
Table 1.
Weight-sensitivity comparison.
The 0.4/0.4/0.2 combination gives the highest R2 among the tested candidates, whereas nearby combinations produce similar values. This result supports the current setting as a transparent and locally robust engineering choice for the available field sample, rather than as a uniquely optimized or universally transferable weight vector. Independent cluster-level cross-validation and external sensitivity testing remain appropriate goals for future data collection.
3.2.4. Control Process
The control process comprises five stages. In Stage 1, the BMS scans all clusters and individual cells hourly. It labels and classifies them according to the established rules as Category A target batteries or Category B normal batteries. In Stage 2, the discharge loops of Category A batteries are locked for protection. Charging remains enabled and discharging is disabled, preventing further depletion and the associated risk of over-discharge, accelerated calendar aging and irreversible lithium loss. In Stage 3, Category A batteries receive priority supplementary charging. Considering dispatch requirements, constant-current charging is performed at 0.2 C or below, or at an efficiency-oriented rate of 0.3 C-0.5 C. When the battery reaches 100% SOC or the full-charge cut-off voltage, short-term constant-voltage saturation is maintained, and cluster voltage consistency is checked during this period. In Stage 4, each target cell is marked as activated after full charging. Discharge authority is restored, and grid participation is allowed only after all cells in the cluster are activated. In Stage 5, automatic low-volume supplementary charging to 50% SOC is triggered when standing time exceeds 5 days or SOC falls below 30%. This measure is intended to limit prolonged low-energy standing and self-discharge. The process is shown in Figure A3.
The calendar-aging management strategy and the SOH prediction model are separate research components, each with its own validation system. They, therefore, cannot be compared across groups using the same battery sample.
3.3. Implementation of the Prediction Algorithm
3.3.1. Dream Optimization Algorithm (DOA)
DOA is a metaheuristic optimization algorithm inspired by features of human dreaming, including memory retention, partial forgetting, self-organization and information sharing. It balances global exploration and local exploitation through two search phases and three core strategies, ultimately producing an optimized solution.
The algorithm rests on the following assumptions: dream quality is evaluated by fitness, and new dreams originate from existing memories. Memories undergo partial forgetting and self-organized supplementation, and individuals differ randomly in memory capability. These assumptions support the stochastic search and path expansion of the algorithm.
The algorithm comprises five stages: initialization, exploration, exploitation, boundary handling and termination. It uses three core strategies. The memory strategy resets individuals toward high-quality solutions and retains their information. The forgetting-and-supplementation strategy randomly replaces partial dimensions and adaptively changes the search domain. The dream-sharing strategy transfers position information among individuals to help escape local optima. The overall results are shown in Figure A4.
The exploration phase accounts for 90% of the iterations, during which the population is divided into five groups to emphasize global search. The exploitation phase accounts for the remaining 10% without population grouping and focuses on local refinement around promising solutions.
DOA formulates a single-objective optimization model that provides a unified representation of the optimization problem, as shown in Equation (6).
The algorithm first generates initial candidate solutions randomly within the search space to ensure a uniform initial distribution, as shown in Equation (7).
Xi = Xl + rand ⋅ (Xu − Xl)
The population is then divided into five groups for global search. Individuals in each group record the best group solution and retain high-quality search information, as shown in Equation (8).
Each individual then forgets partial dimensional information and replenishes it randomly to promote global exploration, as shown in Equation (9).
Individuals subsequently share position information to improve their ability to escape local optima, as shown in Equation (10).
A fine search is then performed around the global optimum to accelerate convergence, as shown in Equation (11).
Finally, the constrained problem is transformed into an unconstrained form for practical engineering applications, as shown in Equation (12).
Quantitative experiments in the original publication [35] demonstrate the superiority of DOA over classical heuristic algorithms, including the Genetic Algorithm (GA) and Particle Swarm Optimization (PSO). Detailed performance data are available in that reference.
3.3.2. Dual Convolution Mechanism
ICB is a CNN architectural module. It enhances feature representation and adaptivity by introducing data-dependent interactions among multi-scale and multi-branch convolutional features. By contrast, ASB is an adaptive spatial convolutional block that dynamically adjusts convolutional-kernel weights according to the spatial distribution of the input sequence, thereby improving the model’s ability to fit non-stationary and nonlinear time series.
SOH monitoring sequences from energy-storage batteries exhibit pronounced multi-scale entanglement. At fine scales, this appears as hourly charge–discharge fluctuations and high-frequency internal-resistance changes. At coarse scales, it appears as weekly capacity-fading trends and long-term cycling-aging patterns. These scales are coupled and jointly influence future SOH degradation. SOH sequences exhibit continuous, smooth attenuation and periodic charge–discharge patterns, and their capacity variations satisfy the Lipschitz-smoothness assumption. On this basis, combining multi-scale decomposition with recursive hybridization can ensure bounded SOH-prediction errors, providing theoretical support for applying the ICB and ASB modules together.
We, therefore, decompose the time-series lightweight adaptive network (TSLANet) framework to extract and integrate the two modules. The overall architecture is shown in Figure A5. ASB separates multi-scale information and further adapts the nonlinear sequence representation. Using the representations enhanced by ASB, ICB models temporal SOH dependencies and couples multivariate channels to provide interactive features for prediction.
First, the Discrete Fourier Transform converts the time-series signal from the time domain to the frequency domain, separating long-range low-frequency trends from short-range high-frequency fluctuations and forming the basis of ASB, as shown in Equation (13).
Here, x[n] is the time series and X[k] is its frequency spectrum. Adaptive suppression of high-frequency noise is then applied while preserving valid frequency-domain signals, as shown in Equation (14).
Ffiltered = F⊙(P > θ), P = |F|2
Here, F denotes the FFT frequency-domain feature, P denotes the power spectrum, θ is a learnable threshold, and ⊙ denotes element-wise multiplication. Frequency-domain multiplication is then used to implement temporal circular convolution, which models global trends and local details simultaneously and serves as an alternative to self-attention, as shown in Equation (15).
Here, WG denotes the global filter for capturing long-range dependencies, whereas WL denotes the local filter for capturing short-range fluctuations. The fused frequency-domain features are then transformed back into the time domain to complete adaptive spectral enhancement, as shown in Equation (16).
S = Γ−1 [FG + FL]
Here, Γ−1 denotes the inverse fast Fourier transform (IFFT), and S represents the processed time-domain features. Large and small convolution kernels then mutually modulate one another to capture fine- and coarse-grained features simultaneously, as shown in Equation (17).
Here, Conv1 and Conv2 are one-dimensional convolutions with different kernel sizes, and ϕ denotes the GELU activation function. Finally, the two interactive feature paths are fused to produce the enhanced temporal representation for prediction, as shown in Equation (18).
OICB = Conv3(A1 + A2)
The core advantage of the ICB-ASB dual module is its joint time–frequency decomposition mechanism. Through FFT adaptive frequency filtering, ASB separates low- and high-frequency components of the measured sequences. These components are used as temporal-scale representations and are not treated as independently identified calendar- and cycle-aging mechanisms without dedicated validation. The subsequent dual-branch interactive convolution in ICB further captures correlations between the two types of decomposed aging features, enabling the combined architecture to effectively suppress prediction errors caused by entangled aging information.
3.3.3. CrossLinear Algorithm
Traditional time-series prediction is commonly divided into univariate and multivariate prediction. Univariate prediction uses only the historical target variable, whereas multivariate prediction models relationships among multiple variables. Many real-world prediction tasks do not fit either paradigm completely. Prediction with exogenous variables has, therefore, become an active research direction. However, this setting also creates new challenges. Existing models may fail to distinguish endogenous from exogenous variables or may model their dependencies too elaborately, resulting in overfitting.
CrossLinear, therefore, embeds endogenous and exogenous variables through lightweight cross-correlation. Using one-dimensional convolutions, the module captures direct, long-term dependencies between endogenous and exogenous variables while filtering time-varying and indirect dependencies that may cause overfitting. The overall framework is shown in Figure A6.
The first component is the normalization module. CrossLinear performs instance normalization on the endogenous variables and outputs Xen∗, where μ is the mean and σ is the variance, as shown in Equation (19).
Xen*, μ, σ = InstanceNorm(Xen)
Parameter-free instance normalization is applied to the exogenous variables to obtain Xex∗, as shown in Equation (20).
Xex*, μ, σ = InstanceNorm(Xex)
The normalized data are then passed to the backbone network to produce predictions in normalized space. The original mean μ and variance σ are used to denormalize the predictions and recover the original scale, as shown in Equations (21) and (22).
The core cross-correlation embedding module is then applied. The endogenous and exogenous variables are stacked along the time dimension, and one-dimensional convolution extracts the cross-correlation feature Xcross, as shown in Equation (23).
Xcross = Conv1D(Stack(Xen*, Xex*))
The original endogenous variables and cross-correlation features are then weighted and fused using the learnable parameter α to obtain the final embedding Xem, as shown in Equation (24).
Xem = α ⋅ Xen* + (1 − α) ⋅ Xcross
CrossLinear next divides the embedded sequence into patches of length p, yielding k = ⌈T/p⌉ patches, as shown in Equation (25).
The patch-projection features and positional embedding PE are then weighted and fused using the learnable parameter β, as shown in Equation (26).
Finally, all patch features are concatenated and passed to a linear projection layer to generate predictions for the next S steps, as shown in Equation (27).
4. Experimental Validation and Analysis
The model was implemented in PyTorch(2.8.0) and run in a CPython 3.10 environment. Visual Studio Code (1.138) was used for development and debugging. The experiments were performed on an ASUS Tianxuan 6 Pro computer equipped with an Intel(R) Core(TM) i7-14650HX processor, 32 GB of memory and an NVIDIA GeForce GTX 5060 graphics card with 8 GB of video memory. All equations, derived indicators and plotted curves were generated by the same documented implementation from the processed data used for the reported tables and figures; no values were reconstructed manually from the plots.
The core fixed configuration parameters of the ICB-ASB-CrossLinear prediction model were defined as follows. The sliding input-window length seq_len was set to 10, so the model used 10 consecutive time-series health indicators as input. The prediction horizon pred_len was set to 1 for single-step SOH prediction. The input feature dimensions enc_in and dec_in matched the dimensions of the raw multidimensional battery-health data, and the training batch size was fixed at 64. The DOA algorithm optimized three key hyperparameters by minimizing training MSE loss. The search spaces were a learning rate of [0.0001, 0.01], a hidden dimension d_model of [32, 128] and a feed-forward dimension d_ff of [32, 128].
4.1. Calendar-Aging Strategy Experiment
To evaluate the proposed calendar-aging control strategy, we selected a photovoltaic energy-storage station in Linying County, Luohe City, Henan Province.
Because of the internal data-confidentiality regulations of the commercial energy-storage station, we could not obtain long-term, continuous capacity time series under pure static calendar-aging conditions. We, therefore, evaluated the calendar-aging control strategy separately from the SOH prediction model. This section uses real-time monitoring data from on-site energy-storage cells to evaluate calendar-aging risk classification and the associated management strategy. Section 4.2 evaluates SOH-prediction performance using public cycling-aging datasets. The observed association between the on-site risk score and SOH may support future evaluation of the risk score as an auxiliary exogenous feature. However, because independent full-life calendar-aging data are unavailable, this study does not claim that the present experiments validate joint SOH estimation under calendar-cycle composite aging. Because the station dataset is confidential, independent capacity-test records, measurement accuracy, and a controlled measurement interval cannot be reported here. The field comparison is, therefore, interpreted as descriptive evidence of operational changes rather than causal proof of calendar-aging suppression. The figures are intended to document the screening, ranking and operational response that can be obtained from the permitted measurements, not to present a certified full-life SOH trajectory. Station SOH measurements are commercially confidential; the authors were authorized only to perform an initial measurement to characterize the approximate condition of the sampled cells. Accordingly, the displayed figures report the measurable SOC, voltage, risk-score and charging-time information and do not claim a controlled capacity-recovery experiment.
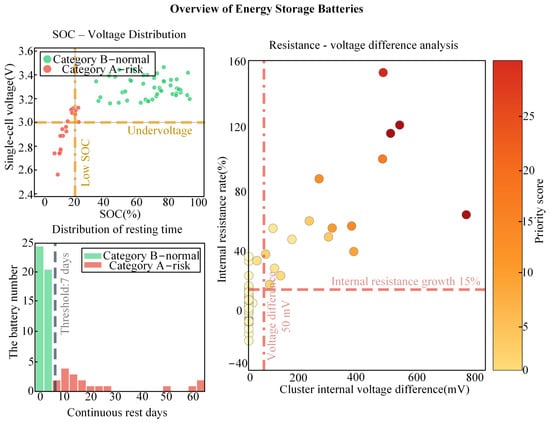
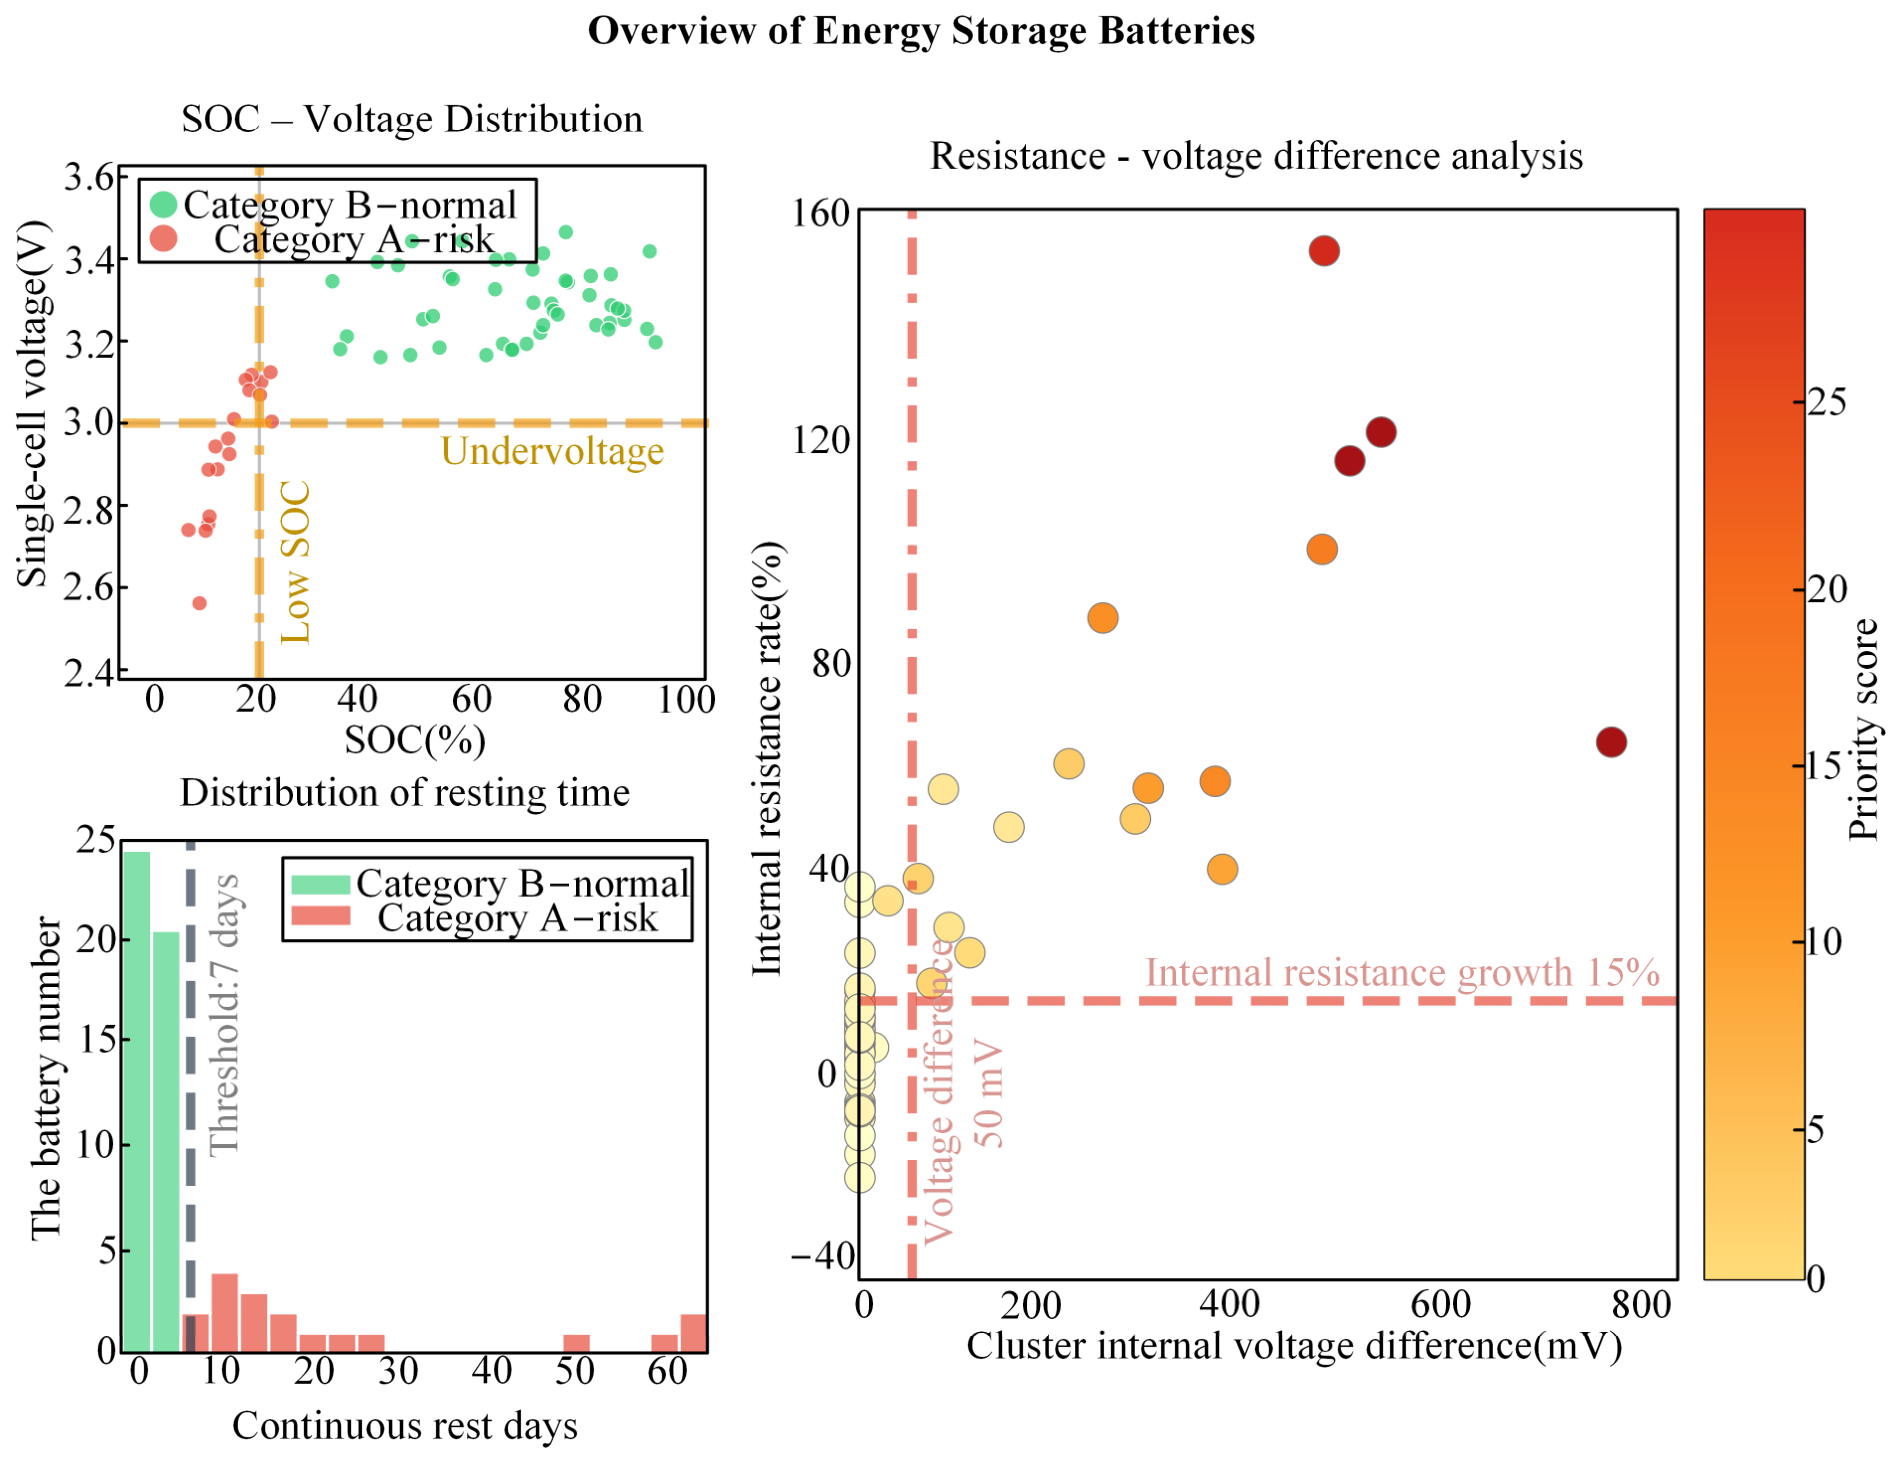
Four battery clusters were used as samples, with 16 single cells in each cluster. The batteries were first classified as Category A or Category B, and the results are shown in Figure 2.
Figure 2.
Battery overview.
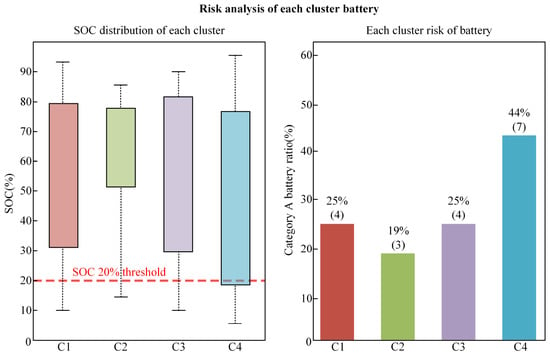
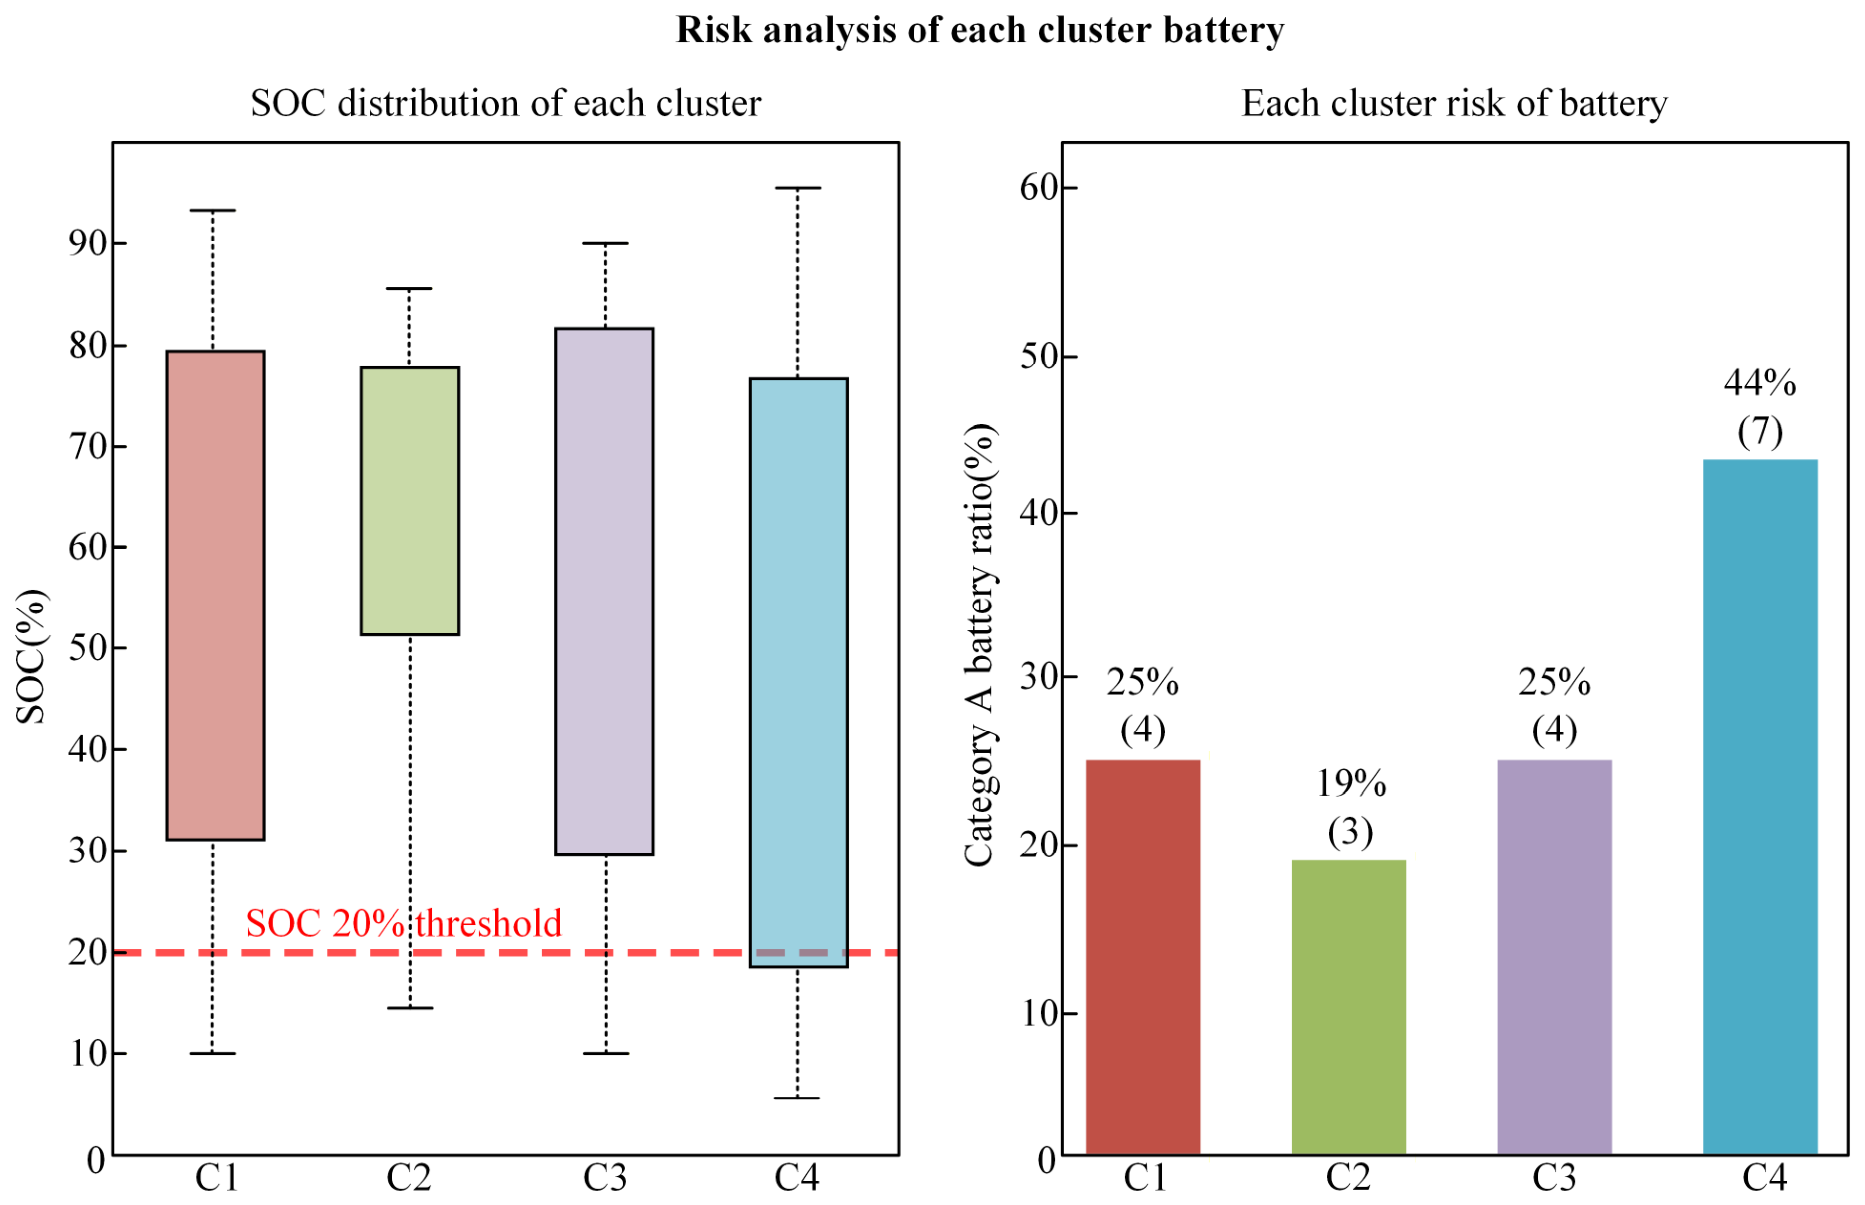
Among the 64 sampled cells, the proportion of high-risk cells marked in red is relatively low. The SOC and capacity of many Category A cells show clear concentration patterns, indicating that a single cell rarely affects the entire cluster. This pattern is mainly caused by the long-term static operation of entire clusters under conventional operating conditions. To examine this pattern and analyze the factors associated with Category A cells, we conducted cluster-level risk analysis and judgment-hit analysis, as shown in Figure 3.
Figure 3.
Battery risk analysis.
The cluster-level risk analyses and detailed calculations yielded the following results. Among the 64 sampled batteries, 18 were classified as Category A and 46 as Category B, so Category A accounted for 28.1%. The mean SOC across all batteries was 56.1%.
In Figure A7, red denotes judgment hits and green denotes cases that did not satisfy the judgment rules. Among the 22 displayed batteries, 4 had six judgment hits, accounting for 18.2%. One battery had five hits, and one had three hits. Two batteries had four hits and two had two hits, while two additional batteries had only one hit and were not classified as risky. Standing duration, cluster voltage difference and internal-resistance growth contributed relatively large proportions among the evaluation indicators. These results highlight the need to protect battery consistency during daily energy-storage-station operation.
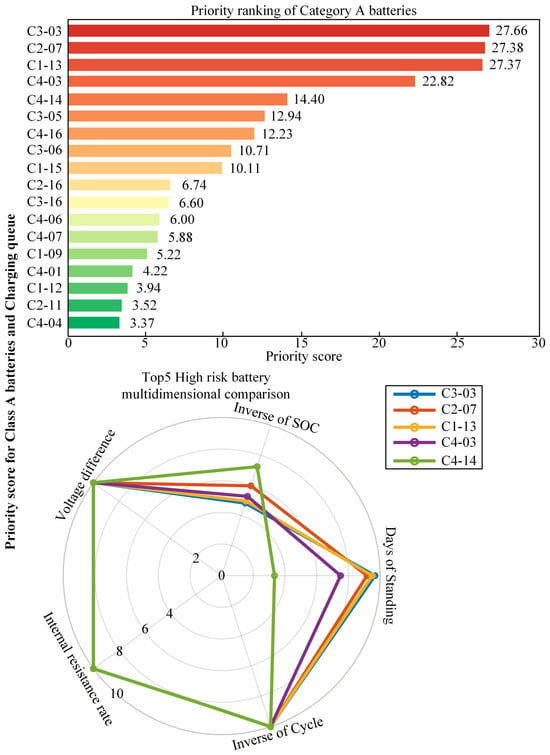
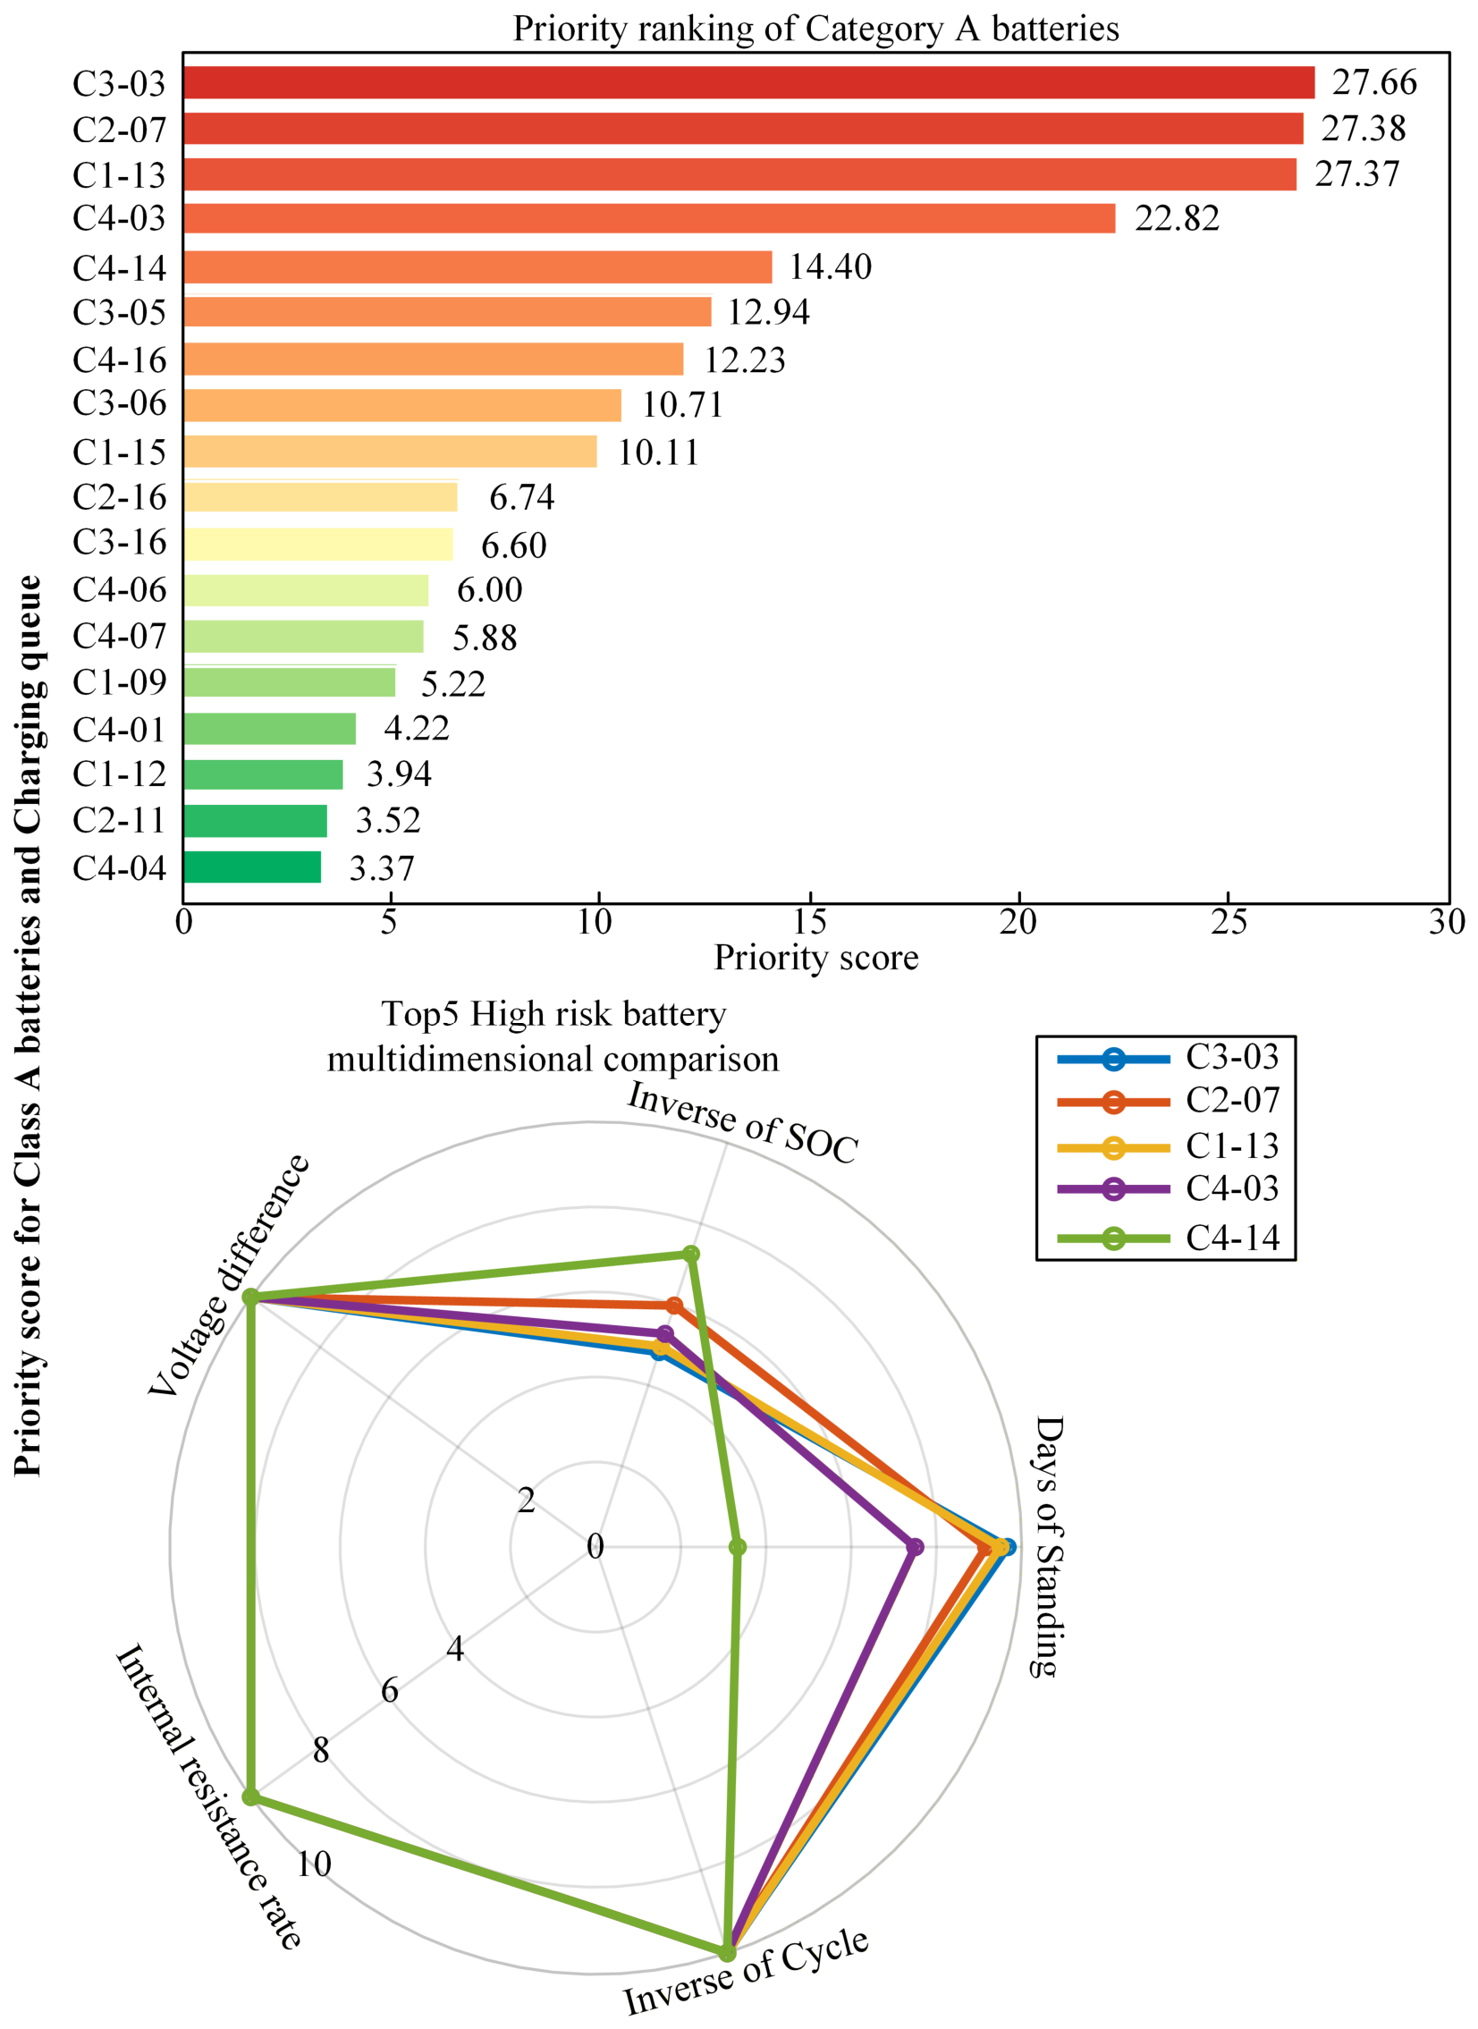
After all judgments were completed and Category A batteries identified, we calculated their priority scores using Equation (5) and ranked their charging priorities. The results are summarized in Figure 4.
Figure 4.
Priority queue for Category A batteries.
After ranking the 18 Category A batteries, we performed a further risk analysis of the five highest-priority batteries. This analysis clarifies the relative contribution of each risk factor and the urgency of supplementary charging. It also supports daily operation and maintenance and battery-health protection.
Charge-locking control was then implemented for the risky batteries, as shown in Figure A8.
Under the proposed control strategy, a battery enters the activated state after full charging, its discharge authority is restored, and it is permitted to participate in grid dispatch. Figure A9 shows the full-charging and activation times for each Category A battery.
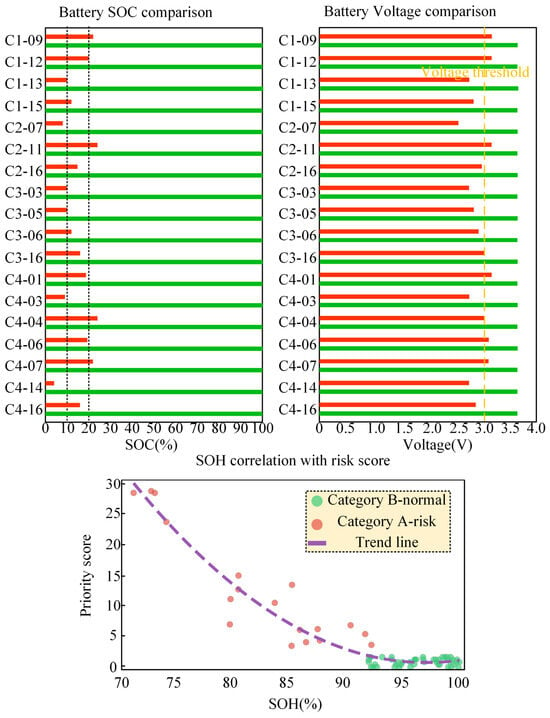
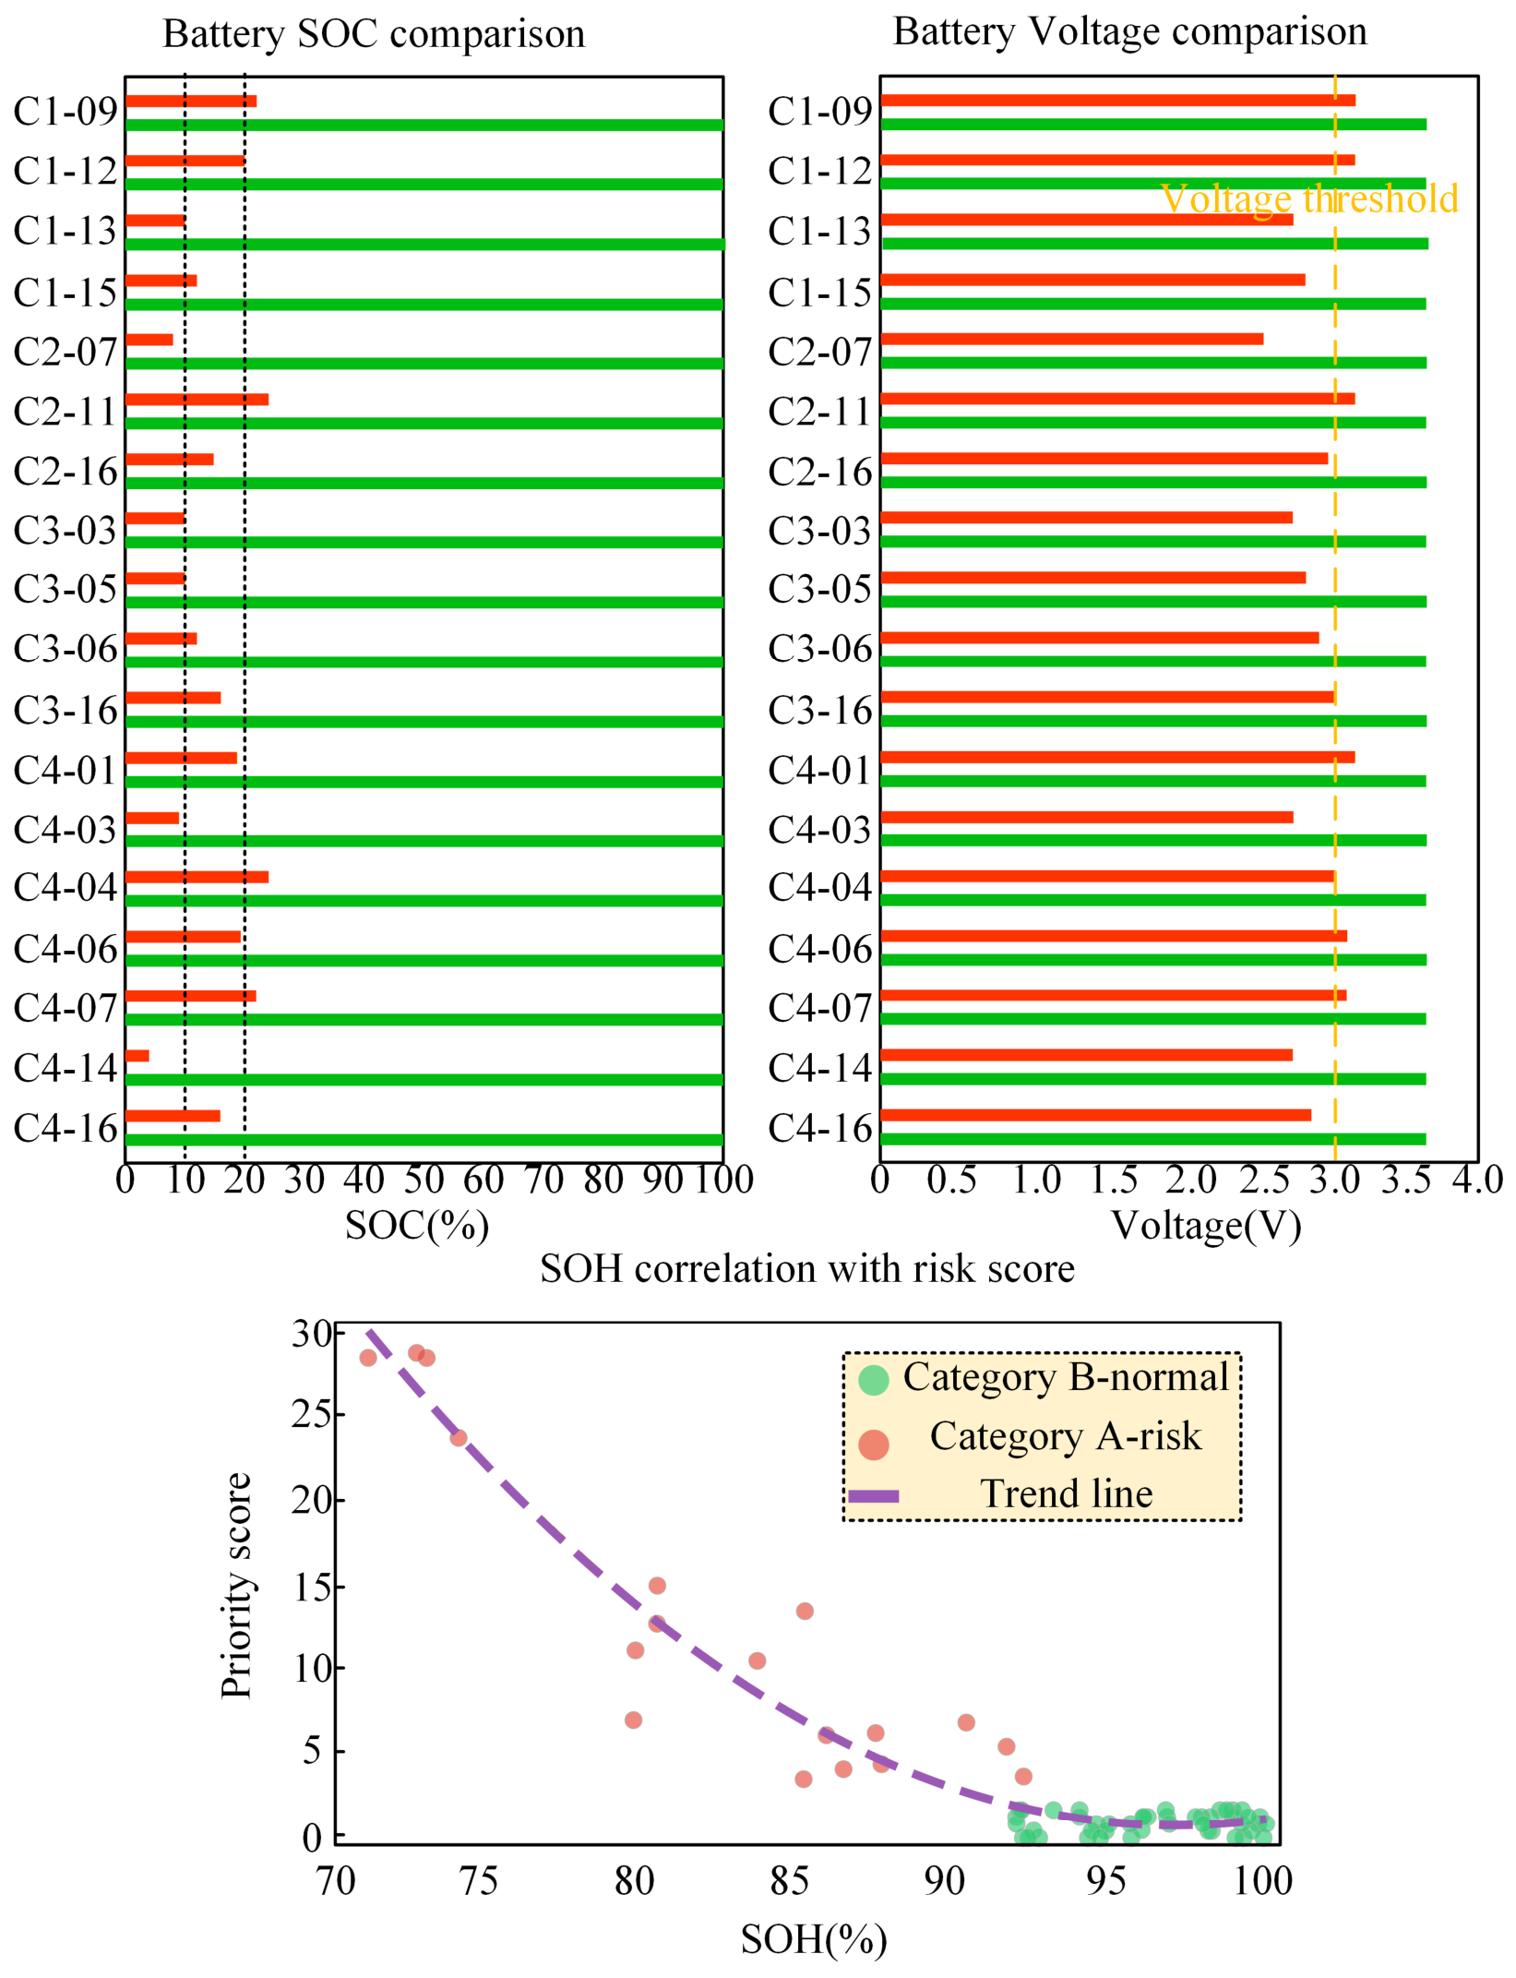
In Figure A9, red and green represent the initial SOC levels, with darker red indicating a lower initial level. After all batteries were fully charged, we compared SOC and cell voltage before and after charging. The relationship between risk score and SOH was assessed separately. The results are shown in Figure 5.
Figure 5.
Before-and-after comparison and risk score.
The results show a strong correlation between the risk score and the SOH trend line. Batteries with higher risk scores have lower SOH values, whereas batteries with lower risk scores have SOH values close to or above the sample average. For the same batch of high-risk batteries, SOC and cell voltage increased after the priority-charging strategy was implemented. This result further demonstrates the feasibility of the proposed calendar-aging weight formula and indicates that its risk score largely reflects SOH degradation characteristics. These observations suggest that the risk score derived from on-site calendar-aging detection may serve as an auxiliary health feature for the proposed SOH prediction model, although composite-aging estimation was not independently validated here.
4.2. SOH Prediction Experiment
Before the prediction experiments, the required deep learning and data-processing libraries, including PyTorch and Pandas, were installed in the Visual Studio Code environment together with their dependencies.
The proposed ICB-ASB-CrossLinear model is designed to extract multi-scale temporal features relevant to SOH estimation under cycling and potentially coupled-aging conditions. However, because of energy-storage-station data confidentiality, we could not obtain full-life calendar-aging time series for independent testing. We, therefore, used the widely recognized CALCE and Oxford cycling-aging benchmark datasets to quantitatively evaluate model accuracy, ablation performance and robustness. Because full-life calendar-aging time-series data are unavailable, the present study does not independently validate pure calendar-aging prediction or physically separate calendar- and cycle-aging contributions.
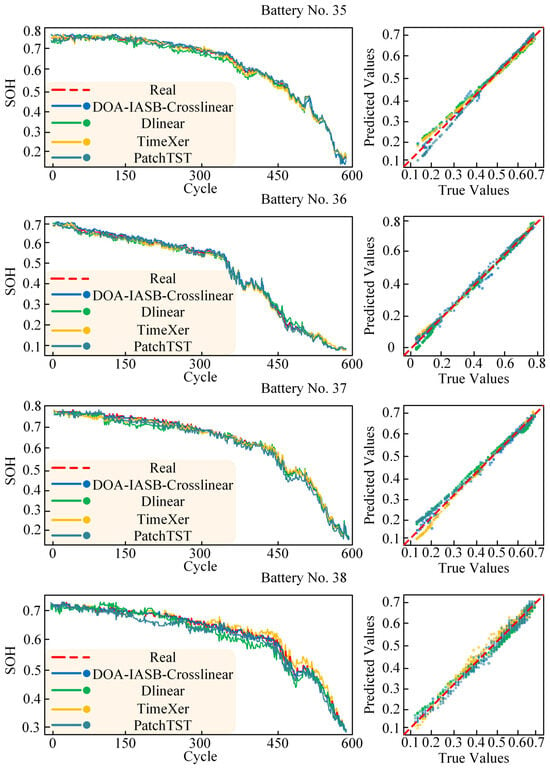
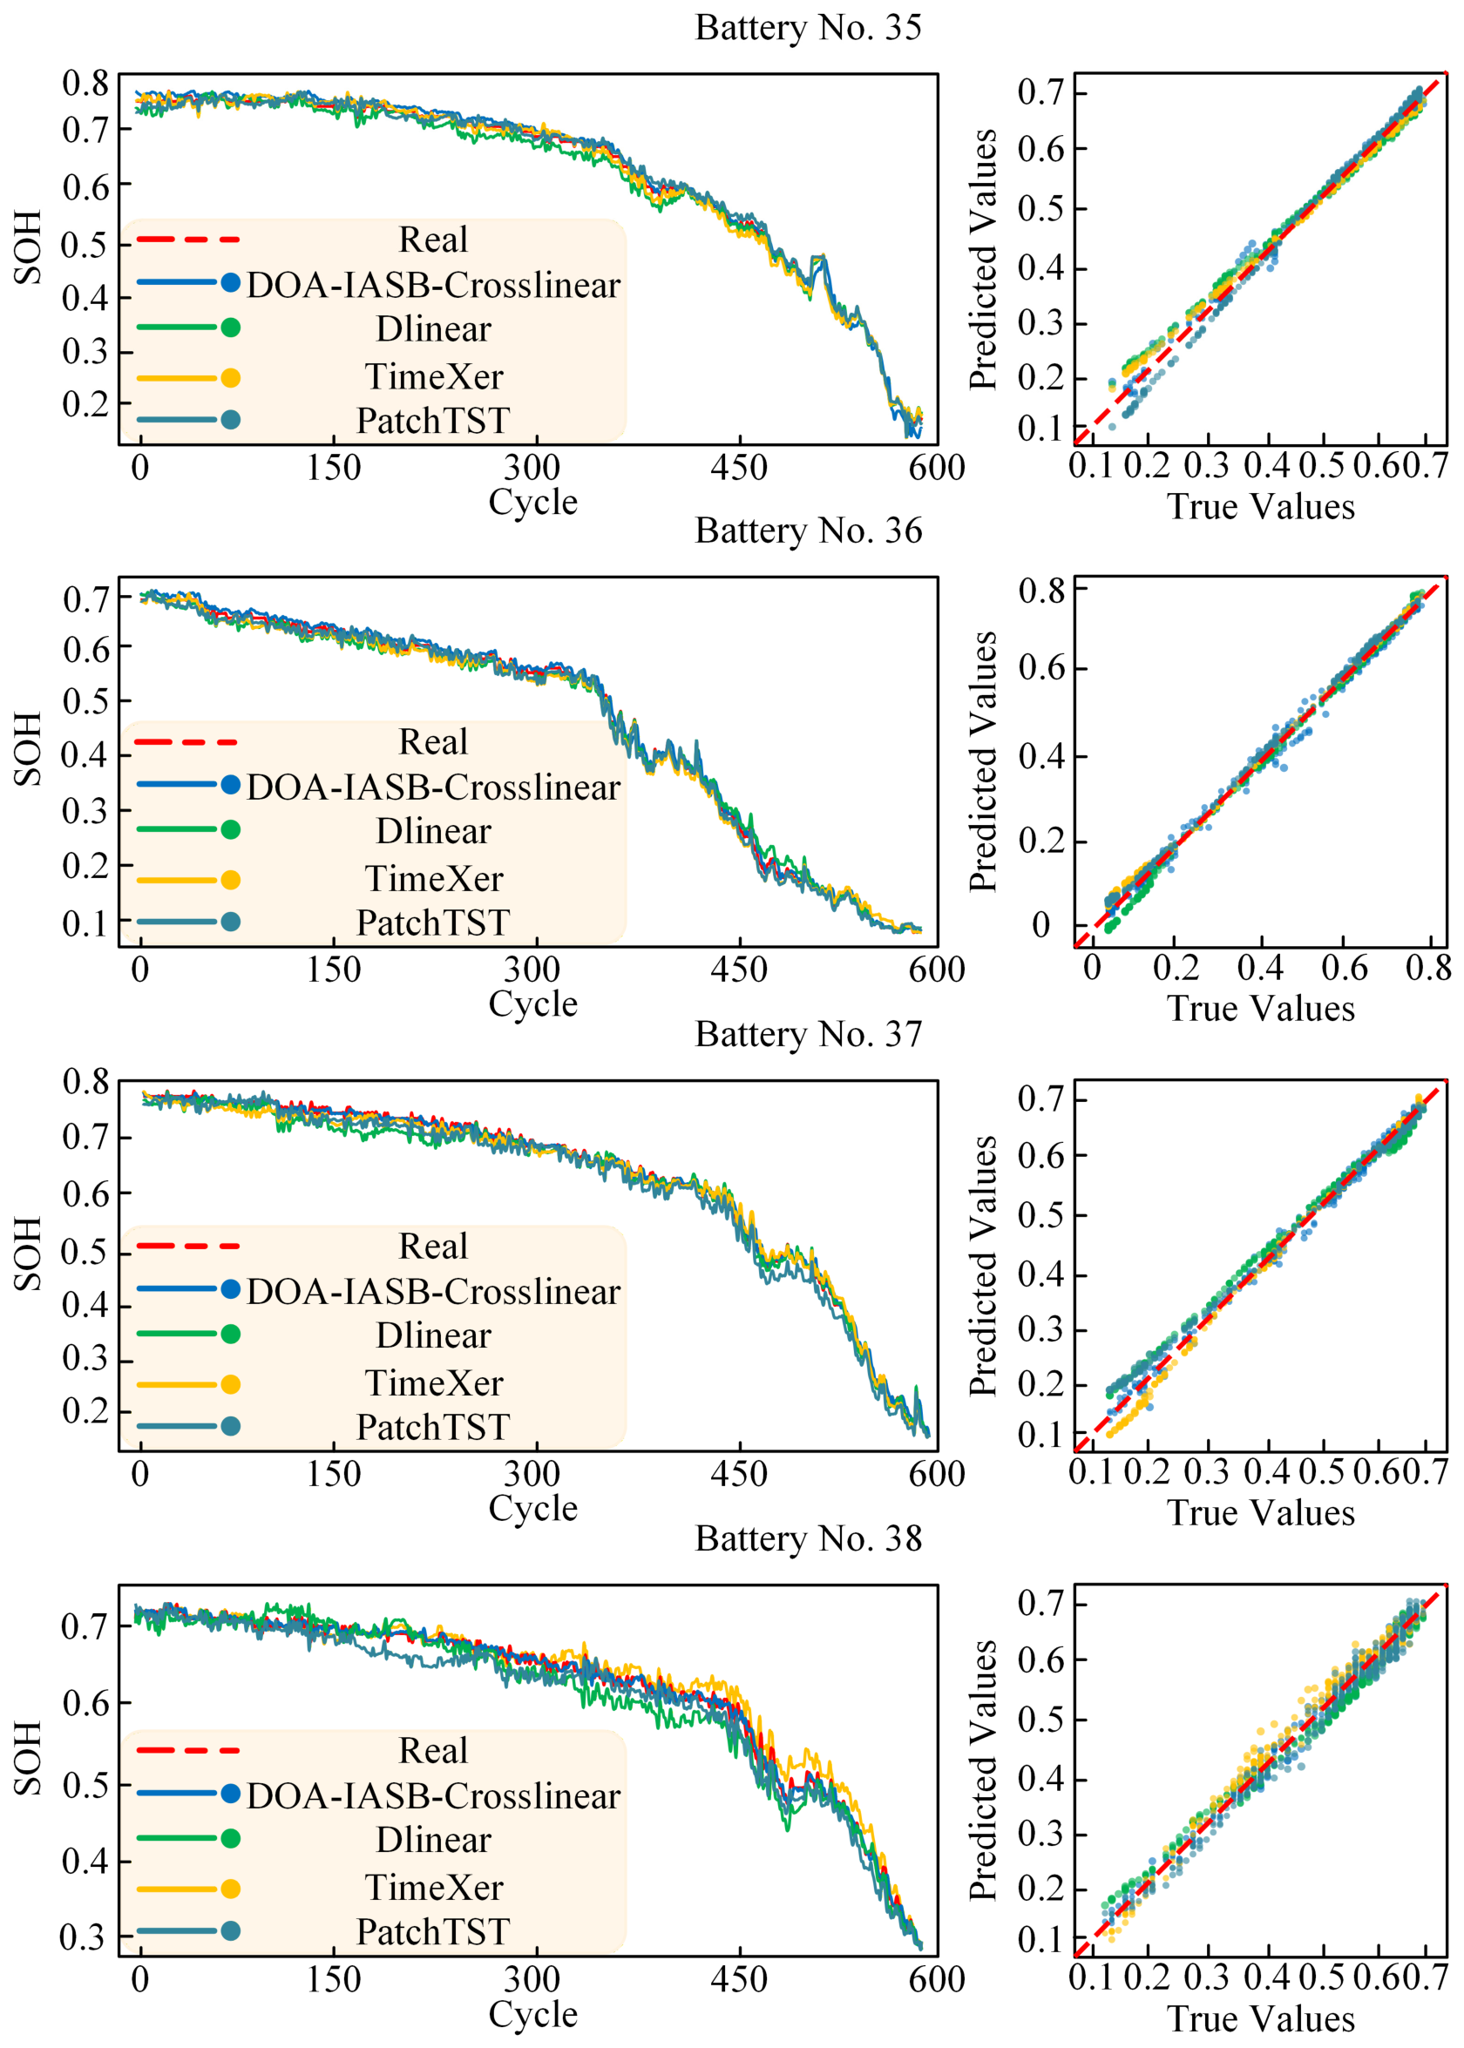
For validation, the first 30% of each cycle record was used for training. For the displayed test comparisons, approximately 80% of each battery’s measured cycle record was retained. Because the complete records contain approximately 600–800 cycles, the retained portions have battery-specific lengths, and their SOH ordinate ranges are not expected to be identical. The plotted portions were selected to preserve representative degradation trajectories for comparing model tracking. Because SOH records below 20% have limited practical significance, we adopted this data-processing procedure. Several evaluation metrics, including goodness of fit, were calculated. The battery test results are shown in Figure 6.
Figure 6.
CALCE battery test.
The right-hand subplots show the corresponding model errors. Because of space limitations, Table 2 reports detailed data only for Battery No. 38.
Table 2.
CALCE comparison metrics.
To evaluate the model against recent methods, we selected TimeXer and PatchTST proposed in 2022–2024 as primary baselines and Dlinear as a lightweight benchmark. These recent high-accuracy architectures outperform traditional recurrent models such as BiLSTM by a large margin, making them suitable advanced comparison baselines. The prediction curve of the proposed model almost completely overlaps with the actual SOH curve. It accurately tracks the gradual SOH decline in the early and middle stages and the rapid decline in the later stage, avoiding the prediction lag, deviation and over-smoothing observed in the baselines. The proposed model also has the lowest RMSE, MAE and MAPE among the evaluated models. For the detailed CS2-38 comparison in Table 2, RMSE is 50% lower and MAPE approximately 56% lower than for Dlinear. The reductions relative to TimeXer and PatchTST are smaller and battery-dependent, while the average prediction error remains below 1% for this comparison.
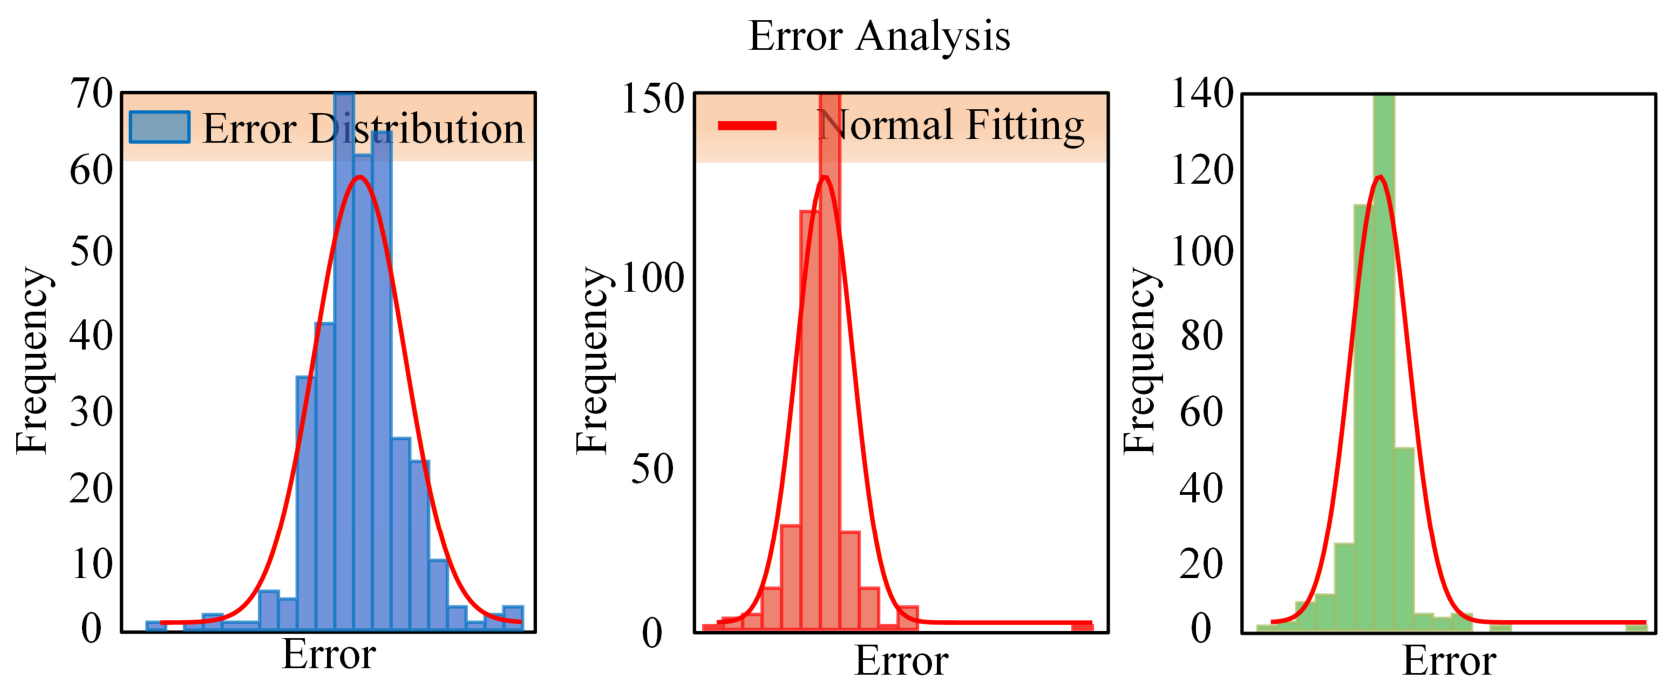
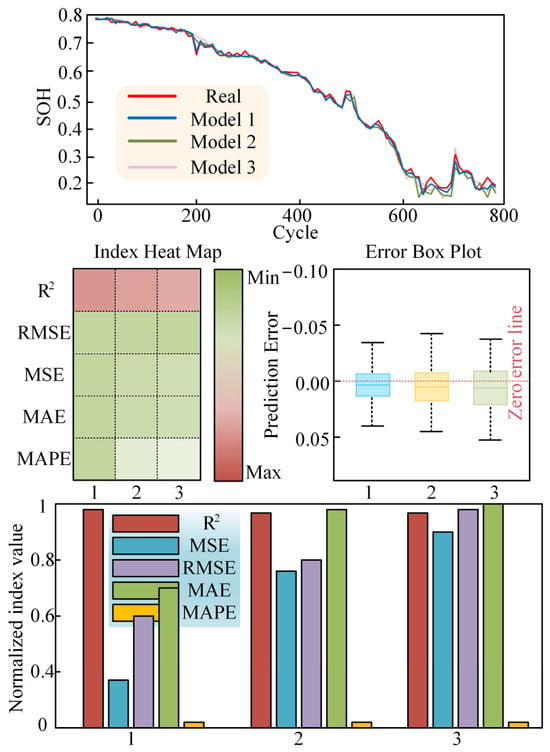
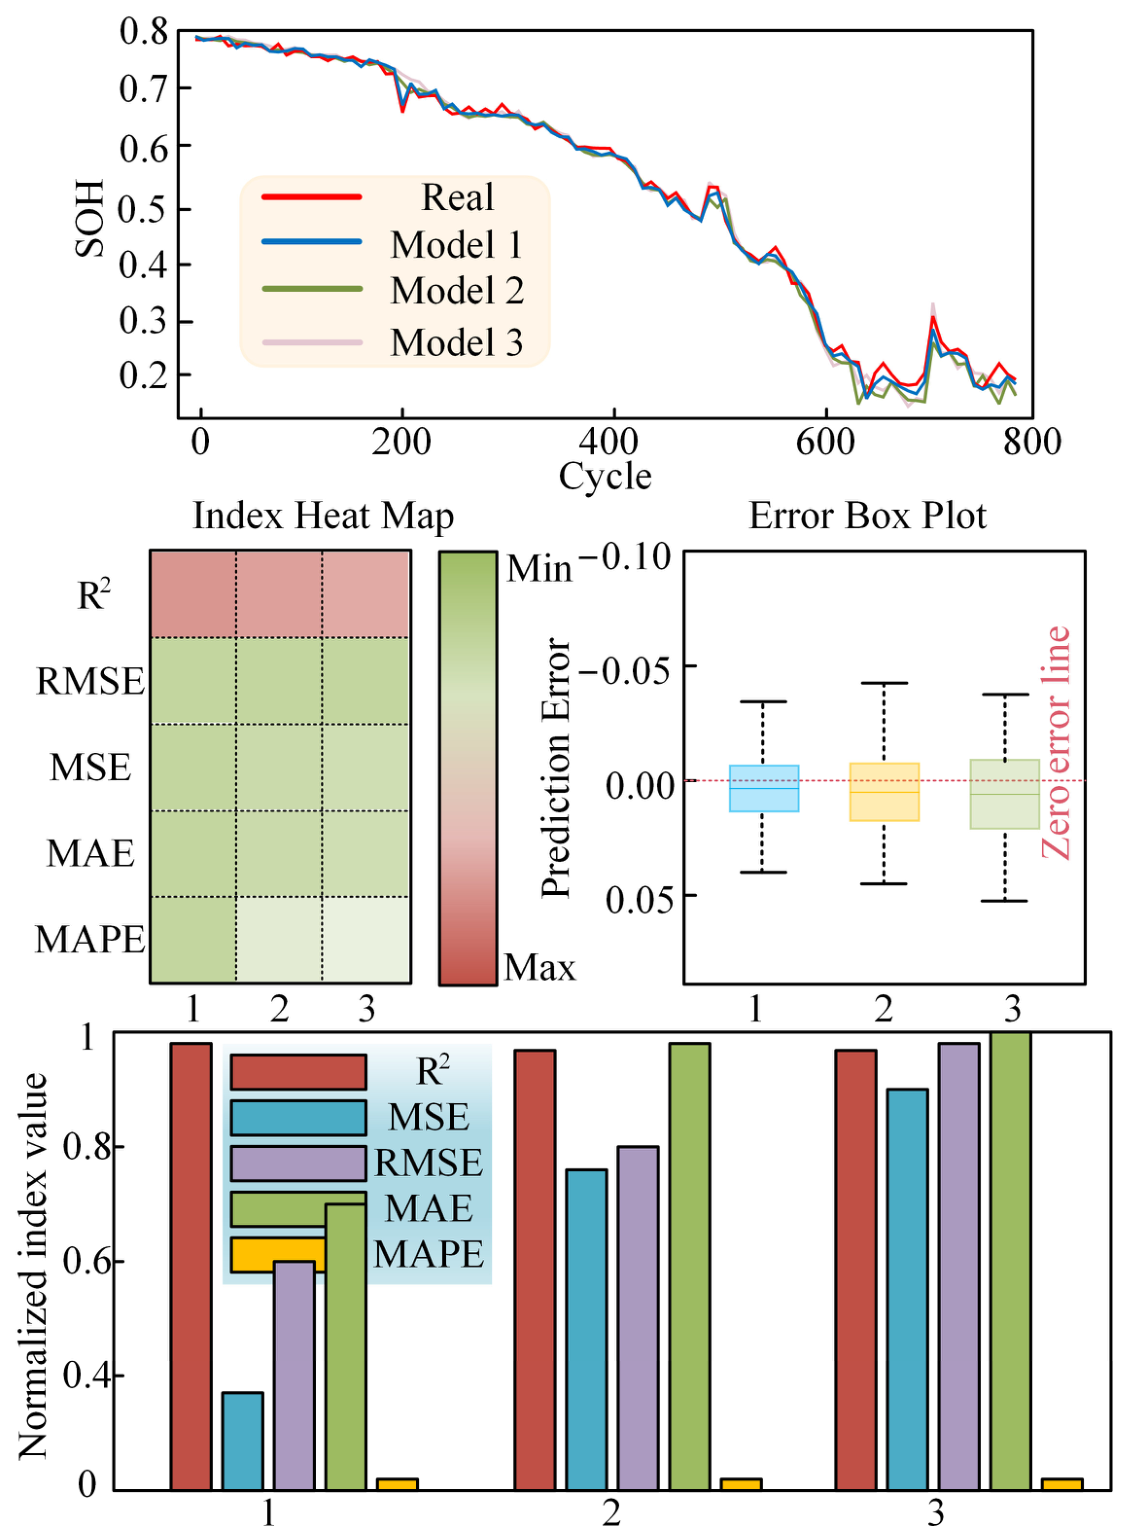
To evaluate the contribution of each component, we performed ablation experiments using different model combinations. Model 1 represents DOA-ICB-ASB-CrossLinear, Model 2 represents ICB-ASB-CrossLinear and Model 3 represents CrossLinear. The relevant data are shown in Figure 7.
Figure 7.
Ablation experiment.
Because the errors differ in magnitude, some values in the figures cannot be compared clearly on a 0–1 scale. For example, MSE is much smaller than the other metrics. The plotted positions, therefore, should not be interpreted as the absolute metric values. Detailed values for each indicator are listed in Table 3.
Table 3.
Detailed metrics.
The ablation results show the contribution of each retained module under the same training and evaluation setup. They support the combined model as the best-performing configuration in this comparison, while the magnitude of improvement should be interpreted together with the metric values in Table 3.
The error range on the horizontal axis in Figure A10 is small, and the scale division introduces visual interference. Consequently, the left graph appears asymmetric only as a result of the visual scale. Overall, the error distribution is consistent with the normal-distribution curve, suggesting no substantial deviation in the system and supporting the reliability of the experimental results.
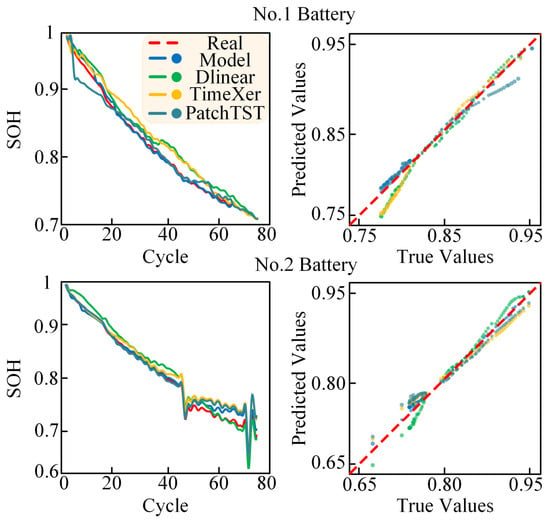
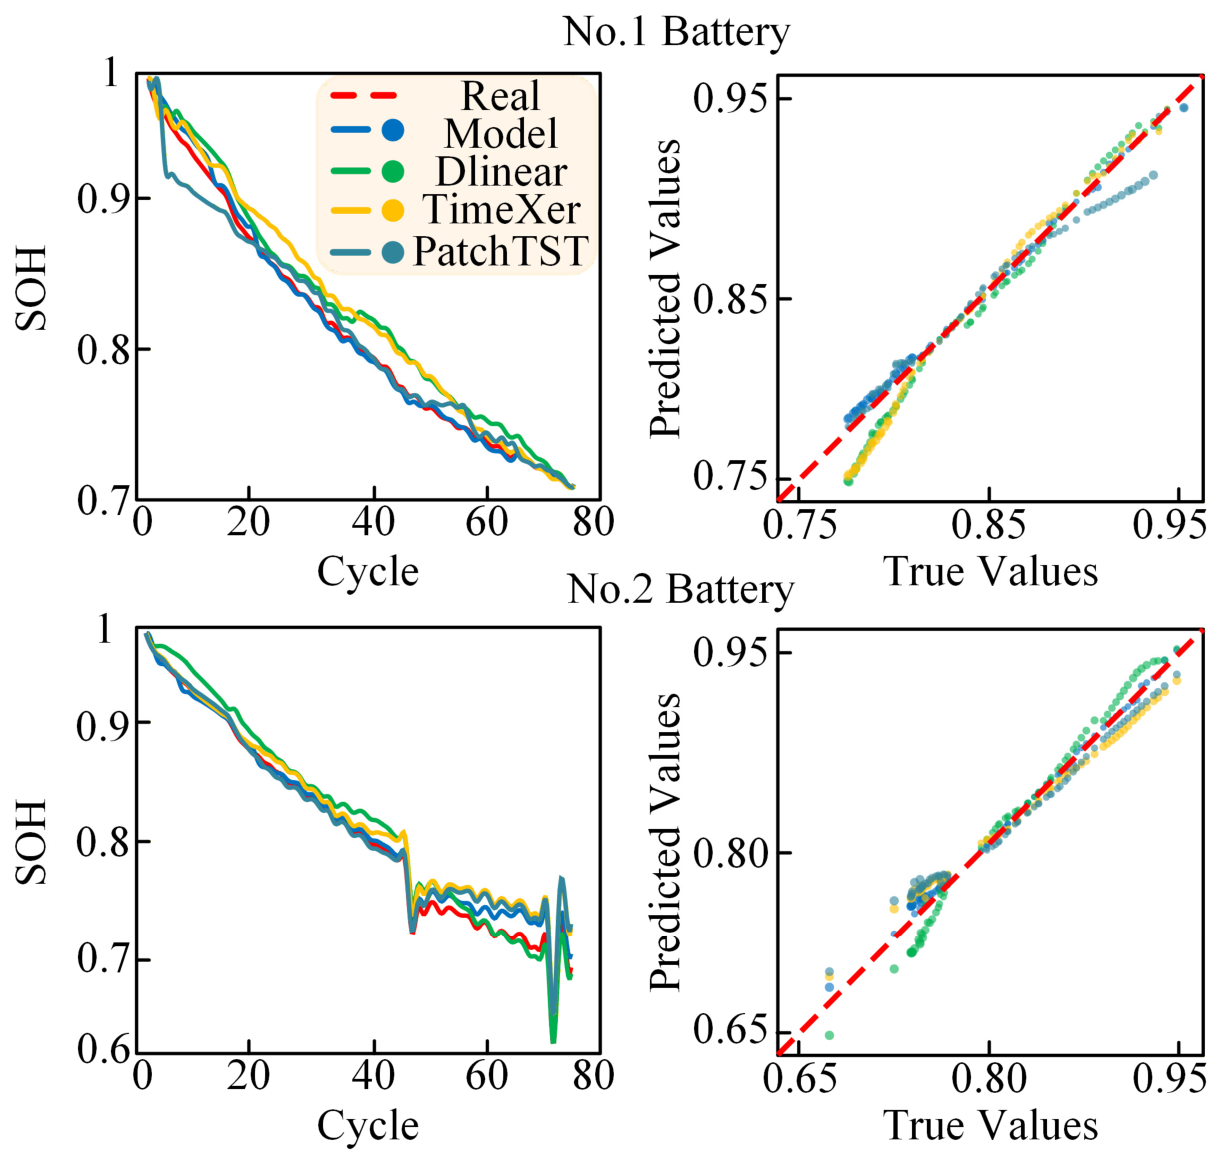
Finally, we used two public battery datasets from the University of Oxford to evaluate model robustness and provide a further comparison. The results are presented in Figure 8.
Figure 8.
Oxford battery test.
Detailed comparison data for Battery No. 2 are listed in Table 4.
Table 4.
Comparison data for Battery No. 2.
For the steady attenuation of Battery No. 1, the proposed prediction curve closely follows the measured curve and tracks the gradual SOH decline without obvious lag or deviation. For Battery No. 2, which exhibits a sudden capacity drop and local fluctuations, the proposed model captures the overall SOH decline and reproduces later-cycle capacity fluctuations. By contrast, the baseline models deviate during the late attenuation stage of Battery No. 1 and fail near the sudden-drop inflection point of Battery No. 2, indicating limited adaptation to this non-stationary attenuation pattern.
Overall, the proposed model maintains an extremely low error level on the Oxford dataset. These results demonstrate that its performance is not dependent on a specific dataset and fully verify its robustness under the tested conditions.
5. Conclusions
This study addresses two related issues: calendar-aging management and high-precision SOH prediction for energy-storage batteries. We designed a management strategy, constructed a prediction model and conducted multi-scenario validation, thereby establishing a complete technical system for aging identification, active management and health assessment. The main conclusions are as follows:
(1) We identified key factors associated with calendar aging in energy-storage batteries. Standing duration, SOC level, intra-cluster voltage difference and internal-resistance consistency were identified as the key factors triggering calendar aging. The proposed risk score was strongly correlated with SOH and may serve as an auxiliary indicator for SOH evaluation.
(2) The proposed calendar-aging countermeasure strategy can accurately identify batteries that remain in a low-energy state during long-term standby. Through classified management, priority supplementary charging and regular pre-charging, the strategy is intended to reduce over-discharge risk and limit exposure to prolonged low-energy standby. A before-and-after comparison of the on-site batteries showed SOC replenishment and increased cell voltage but did not establish causal suppression of calendar aging.
(3) The ICB-ASB-CrossLinear prediction model separated multi-scale temporal features in the SOH data. With hyperparameters optimized by DOA, its prediction accuracy exceeded that of the evaluated baselines, including Dlinear, on the tested cycling datasets. The model captured SOH variation under steady attenuation and sudden capacity-drop scenarios. Its extension to independently validated calendar-cycle composite aging remains to be established.
(4) Ablation experiments demonstrated that the ICB module, ASB module and DOA optimization algorithm each improved model performance and were indispensable to the overall framework, supporting the rationale and superiority of the proposed architecture.
Author Contributions
Conceptualization, methodology and resources: T.Y. and J.F.; software and data curation: B.H. and G.P.; writing—original draft: B.H.; supervision: T.Y. All authors have read and agreed to the published version of the manuscript.
Funding
This research received no external funding.
Data Availability Statement
Data will be made available on request.
Acknowledgments
We thank the anonymous reviewers for their valuable comments.
Conflicts of Interest
Author Guangtao Peng was employed by State Grid Henan Electric Power Co., Ltd., Linying Power Supply Company. The remaining authors declare that the research was conducted without commercial or financial relationships that could be construed as a potential conflict of interest.
Appendix A
Figure A1.
Health-feature extraction.
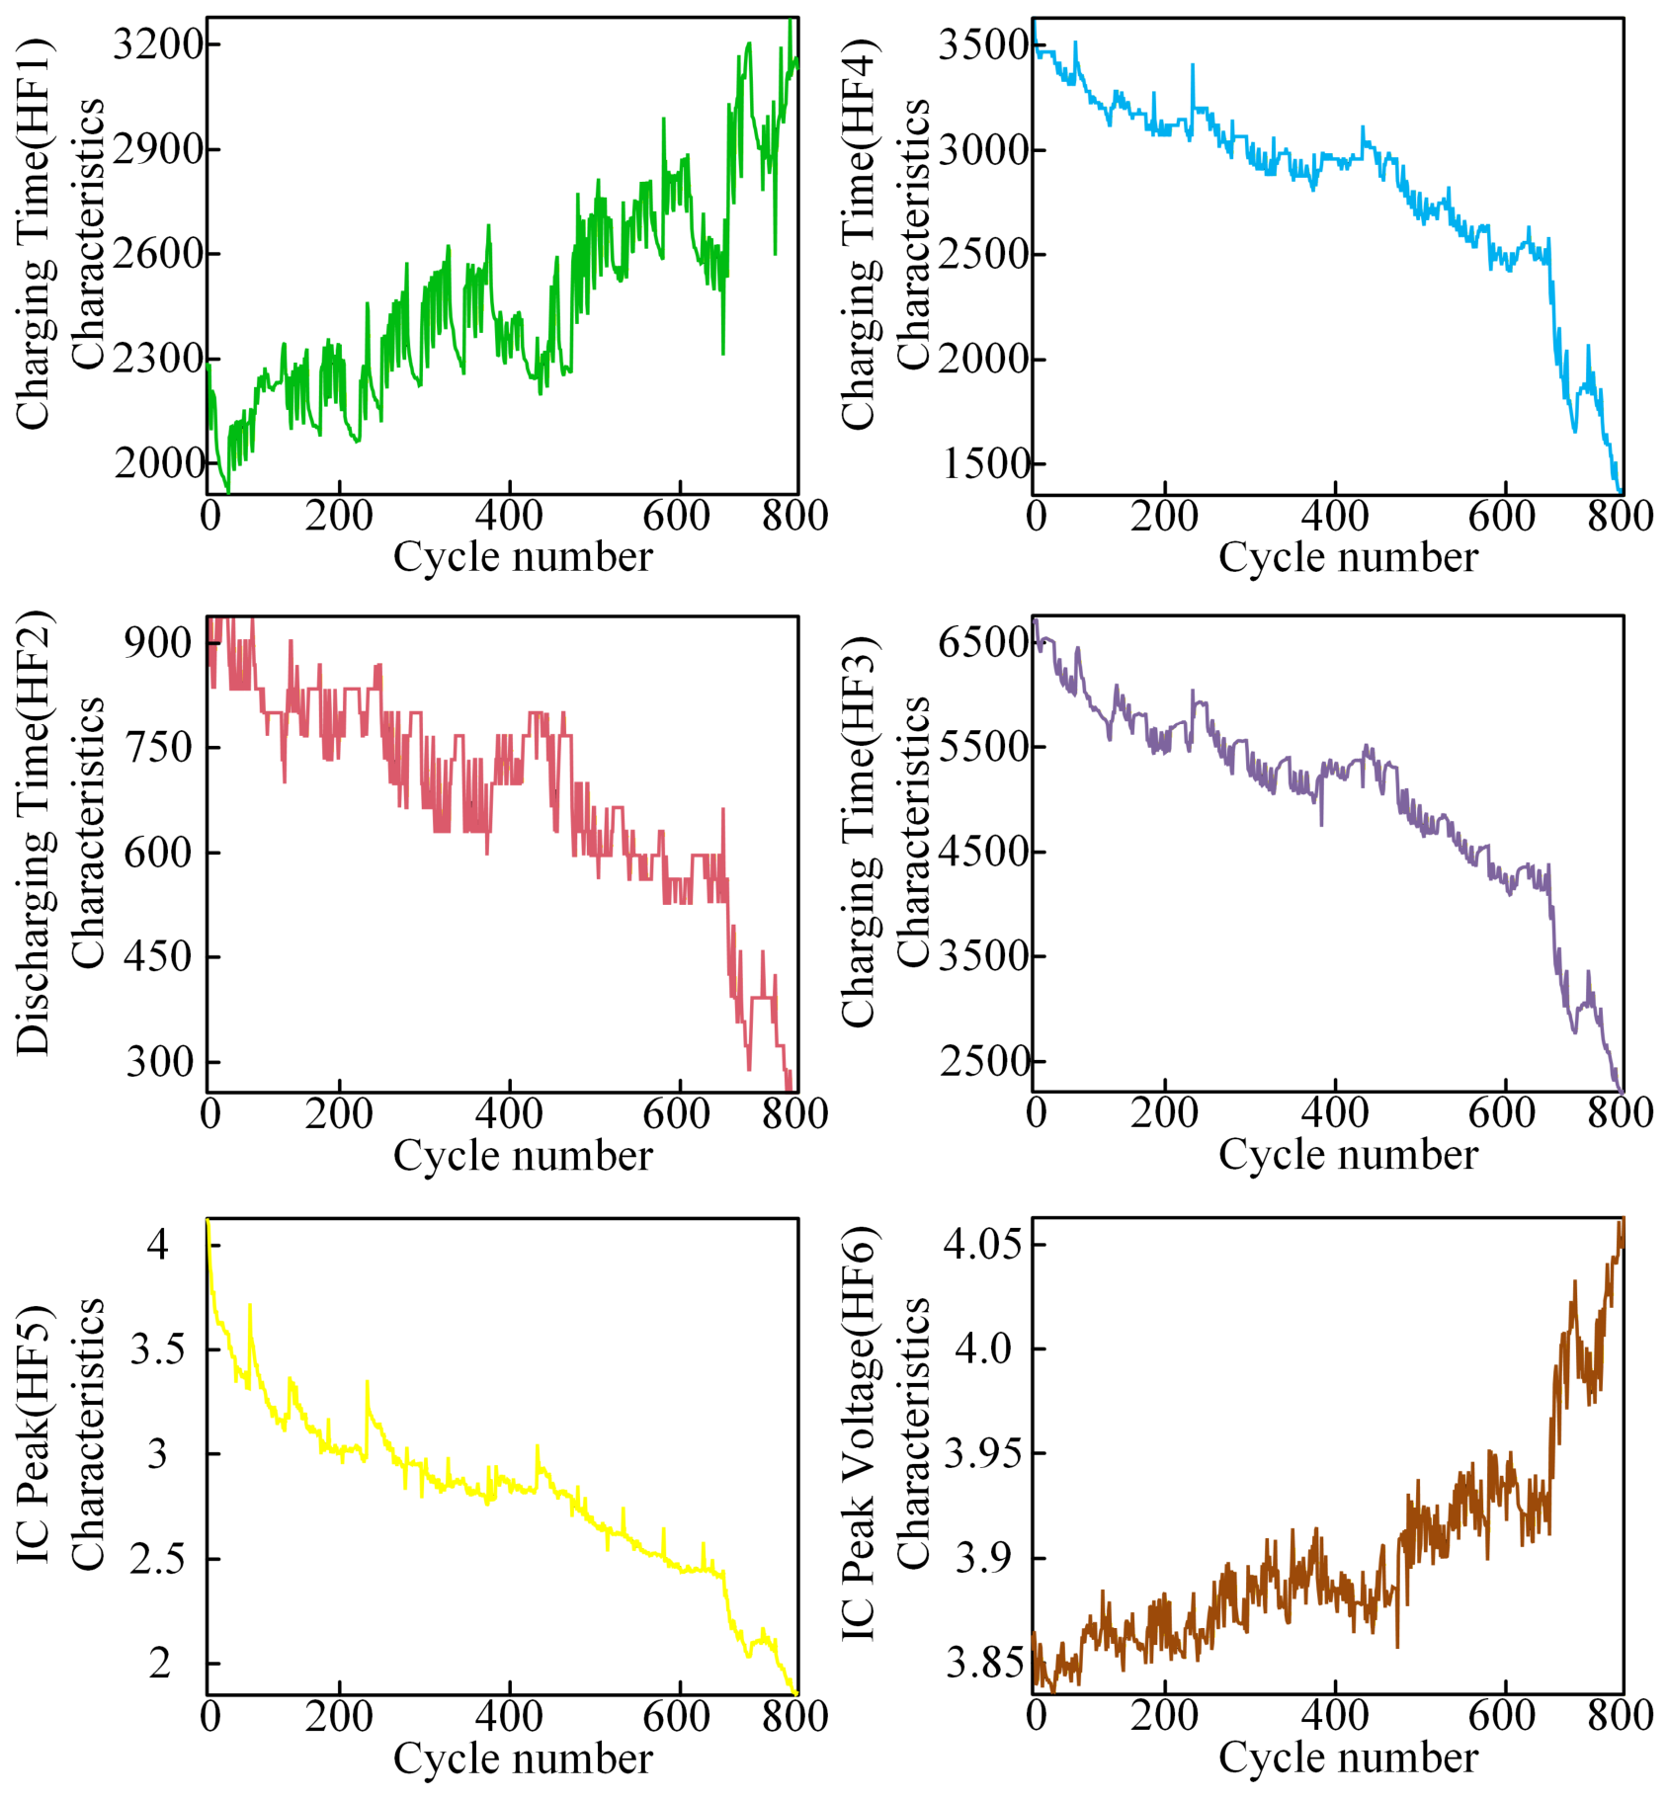
Figure A2.
Health-feature correlation heat map.
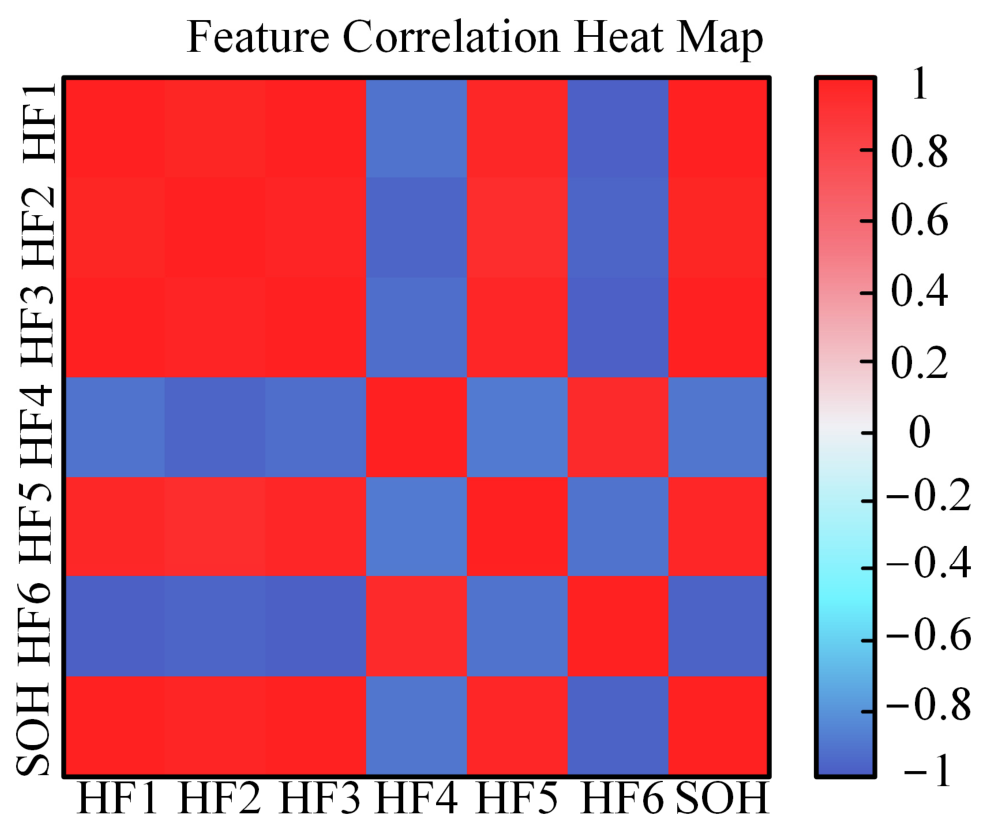
Figure A3.
Control process.
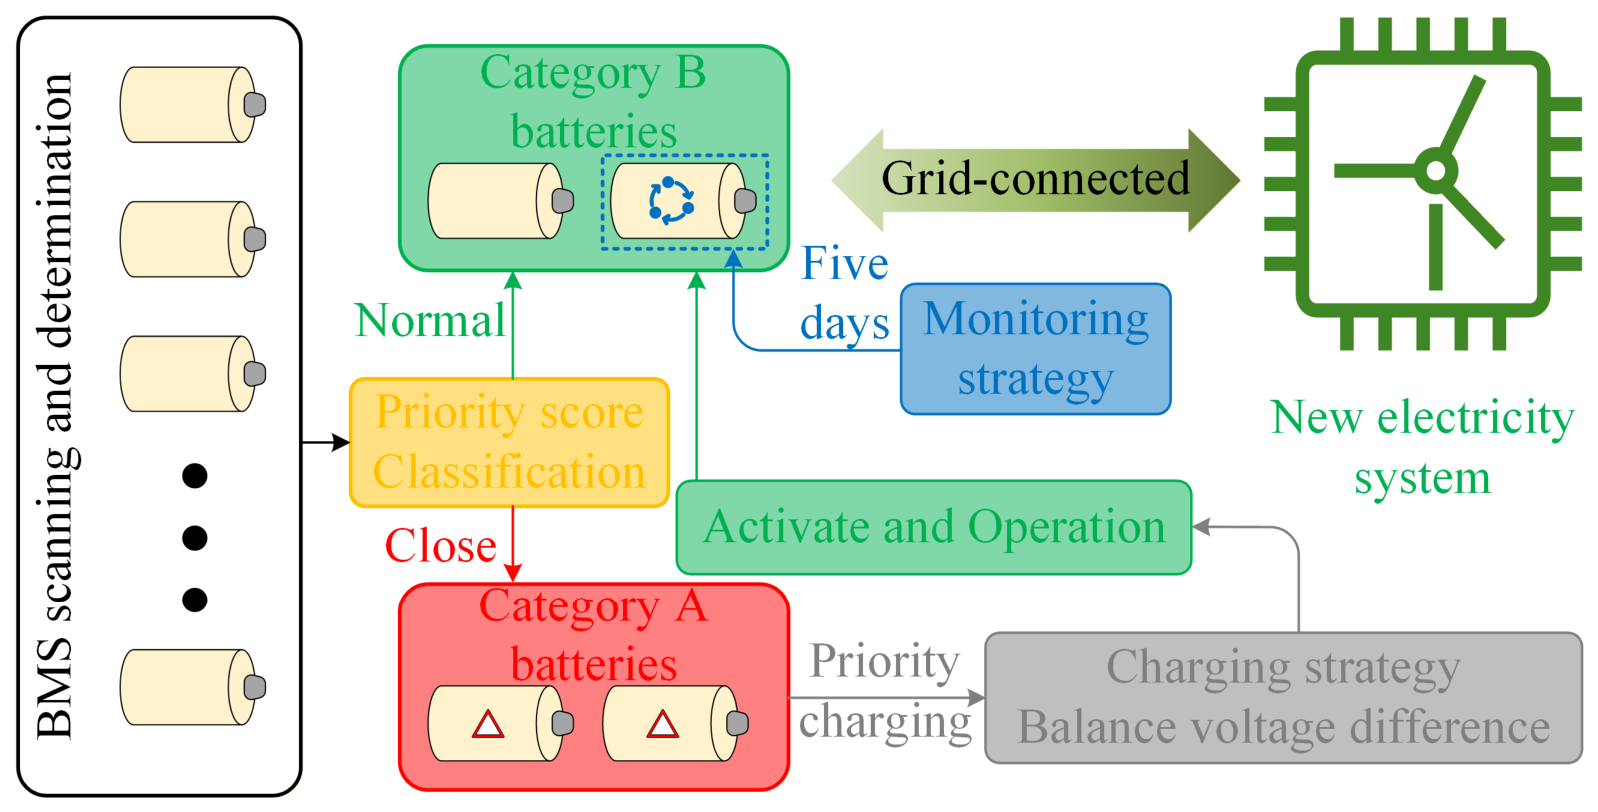
Figure A4.
Algorithm logic.
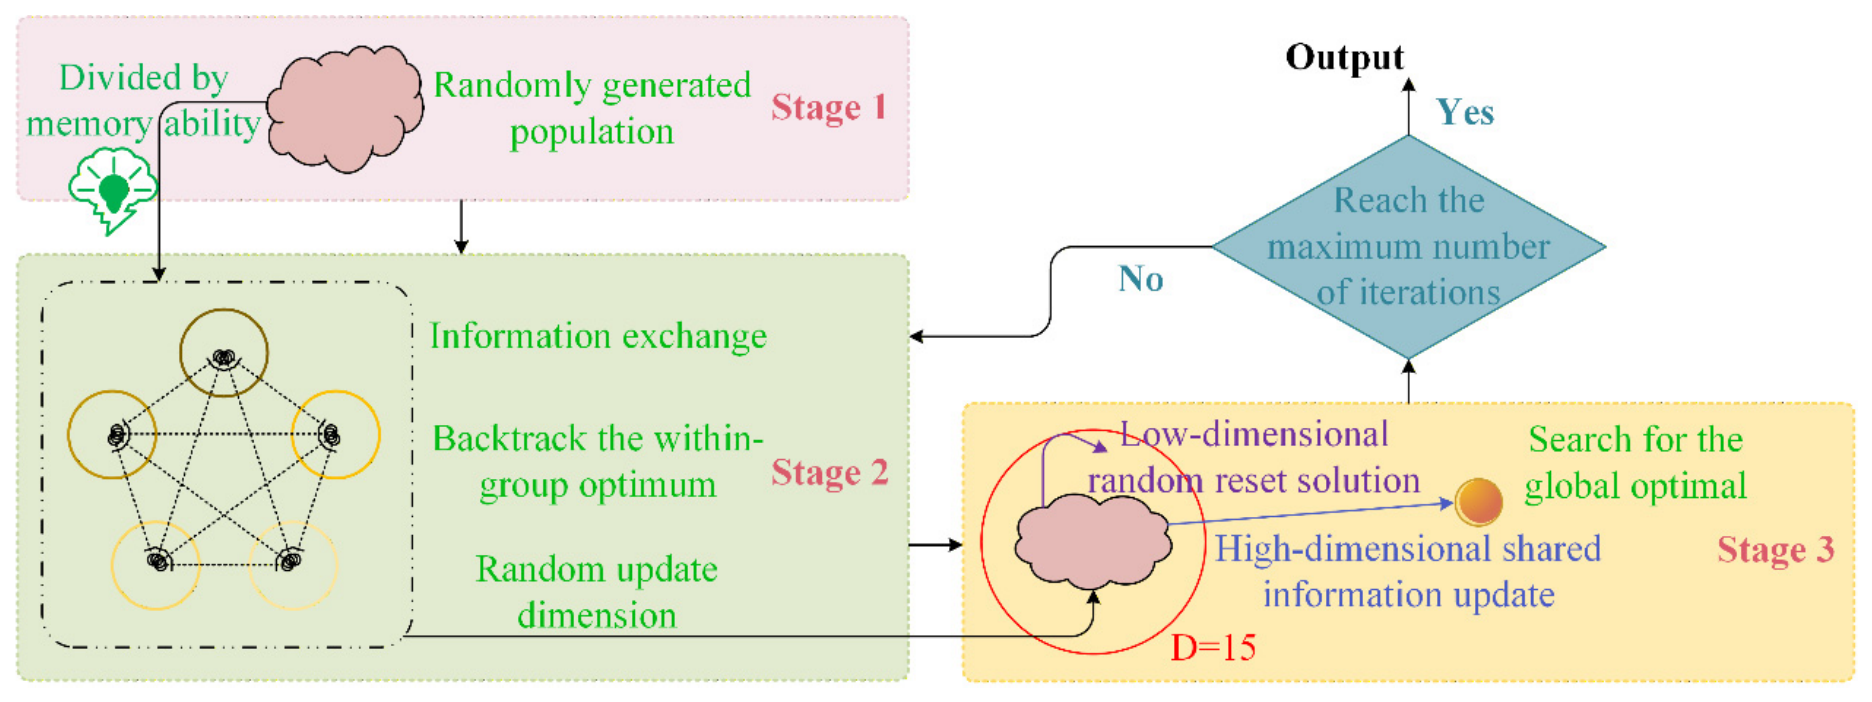
Figure A5.
TSLANet framework.
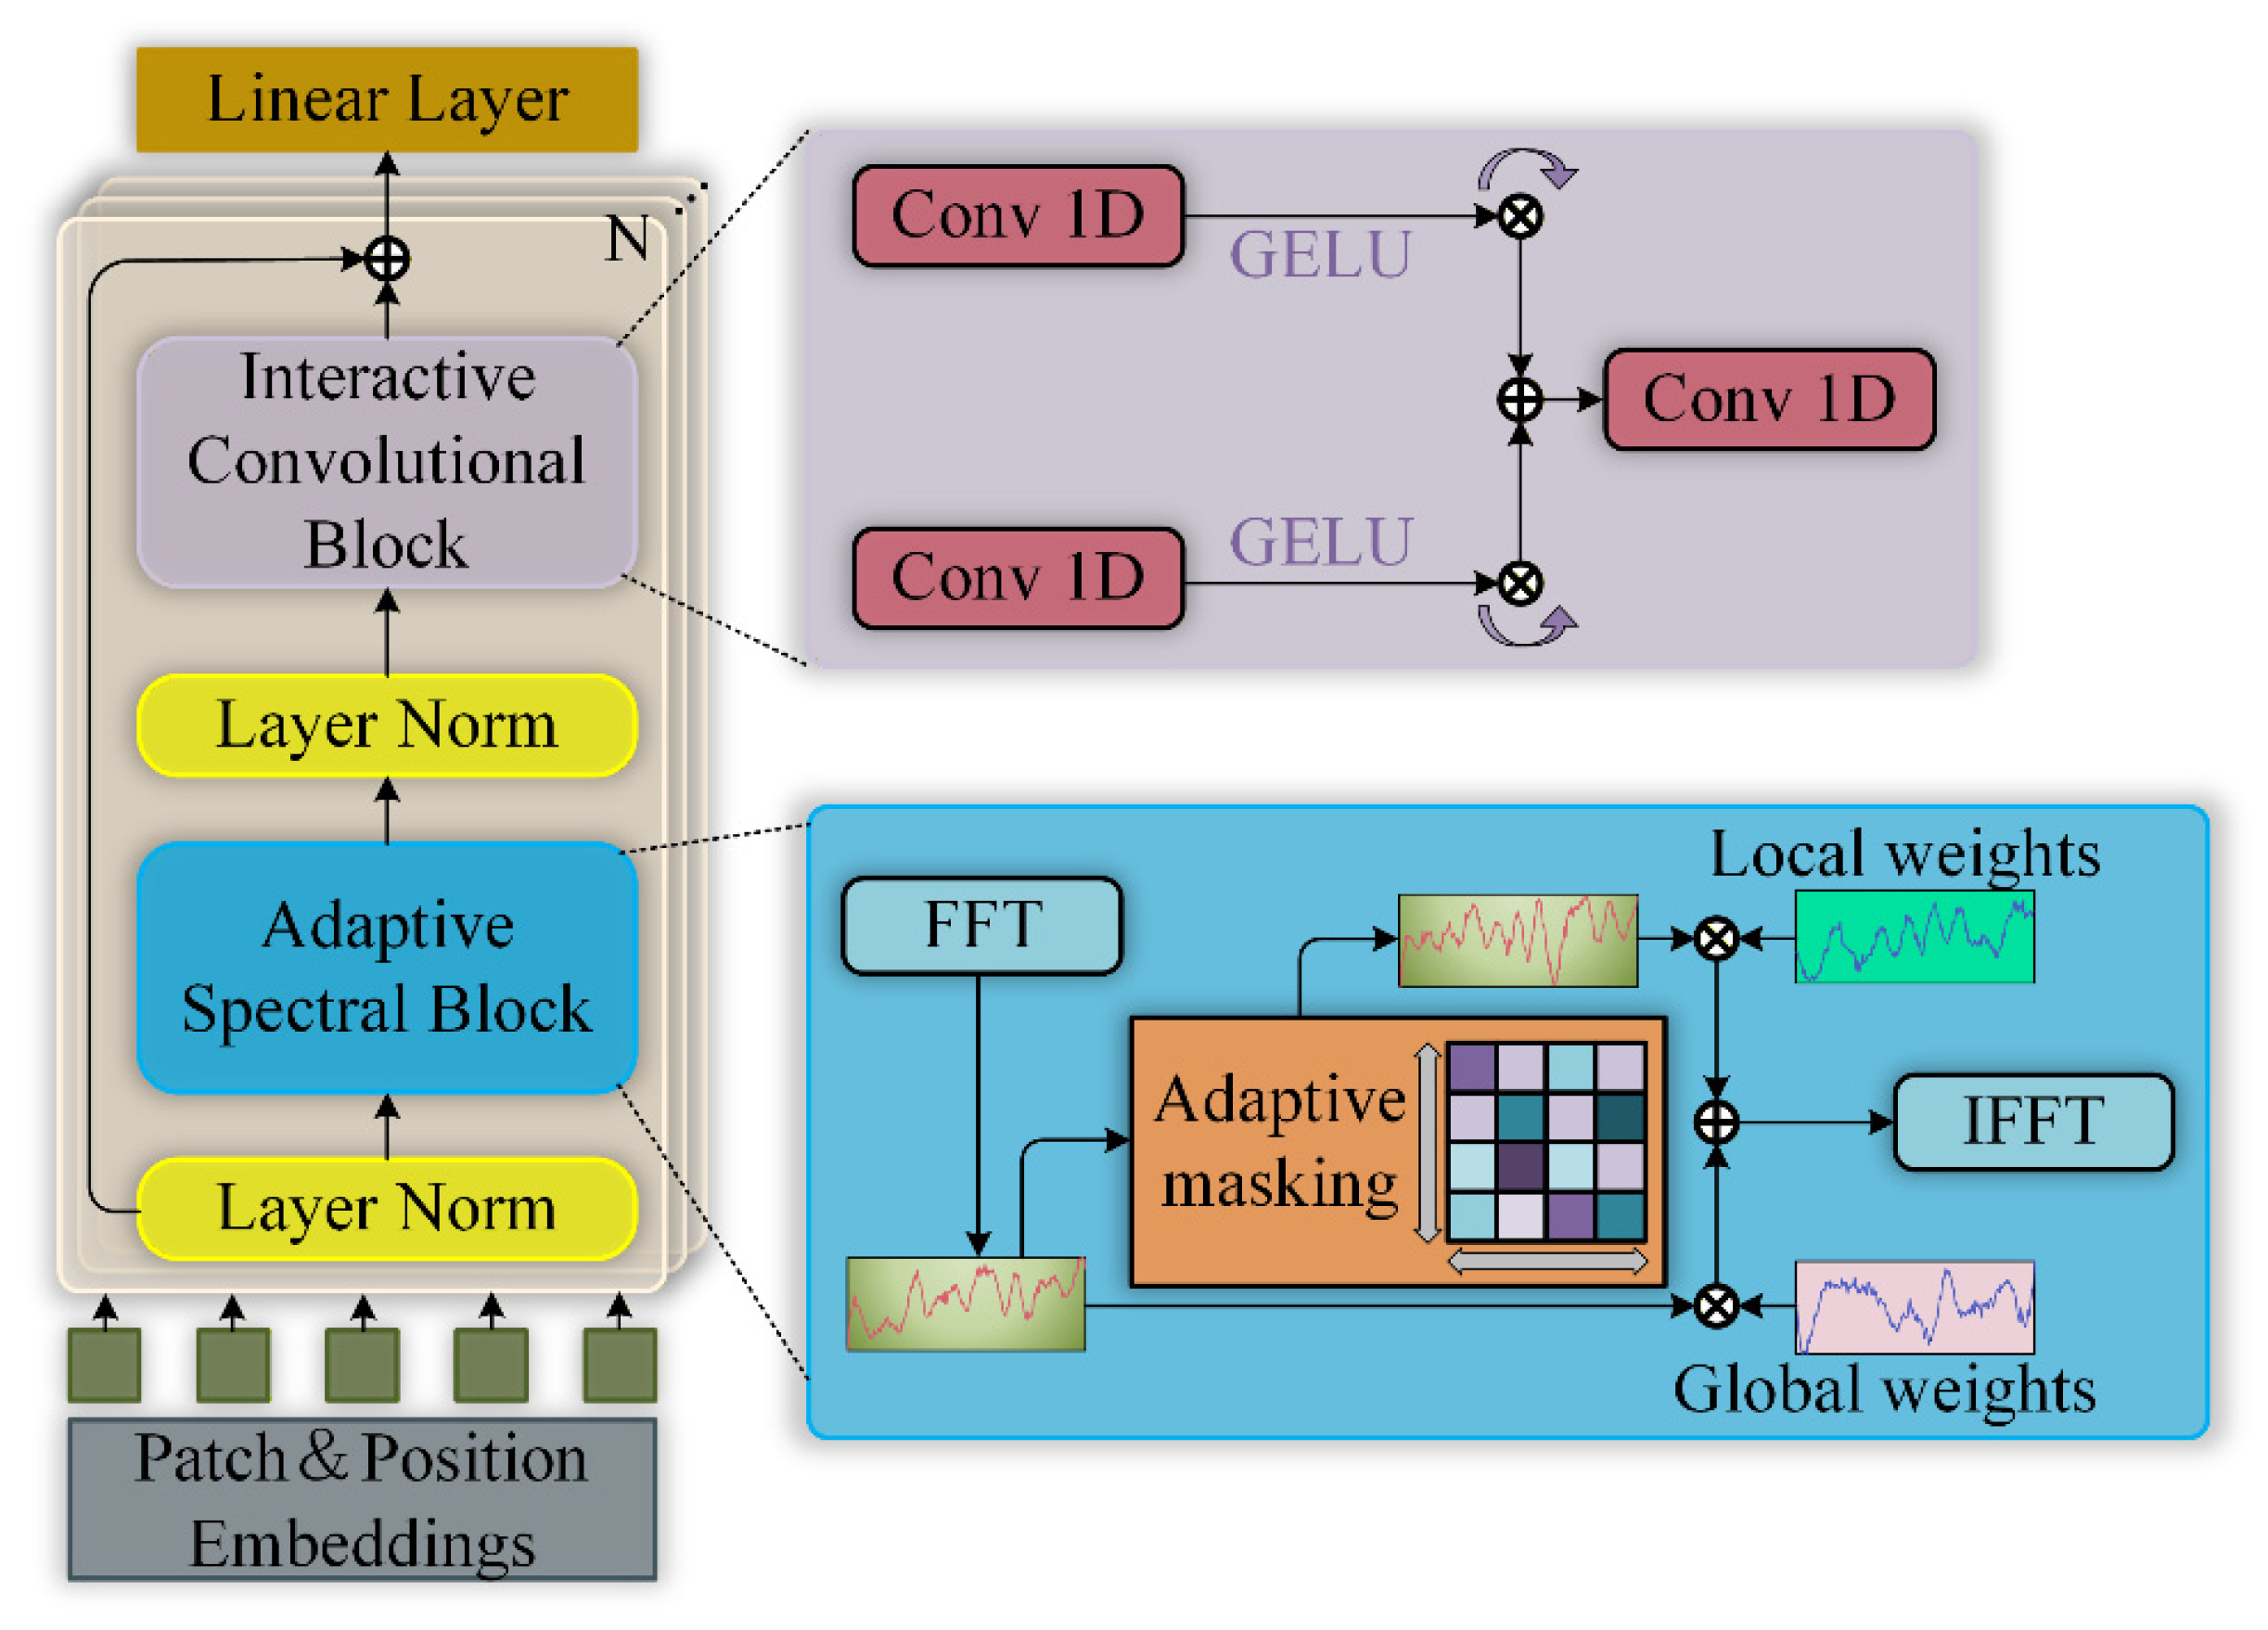
Figure A6.
CrossLinear framework.
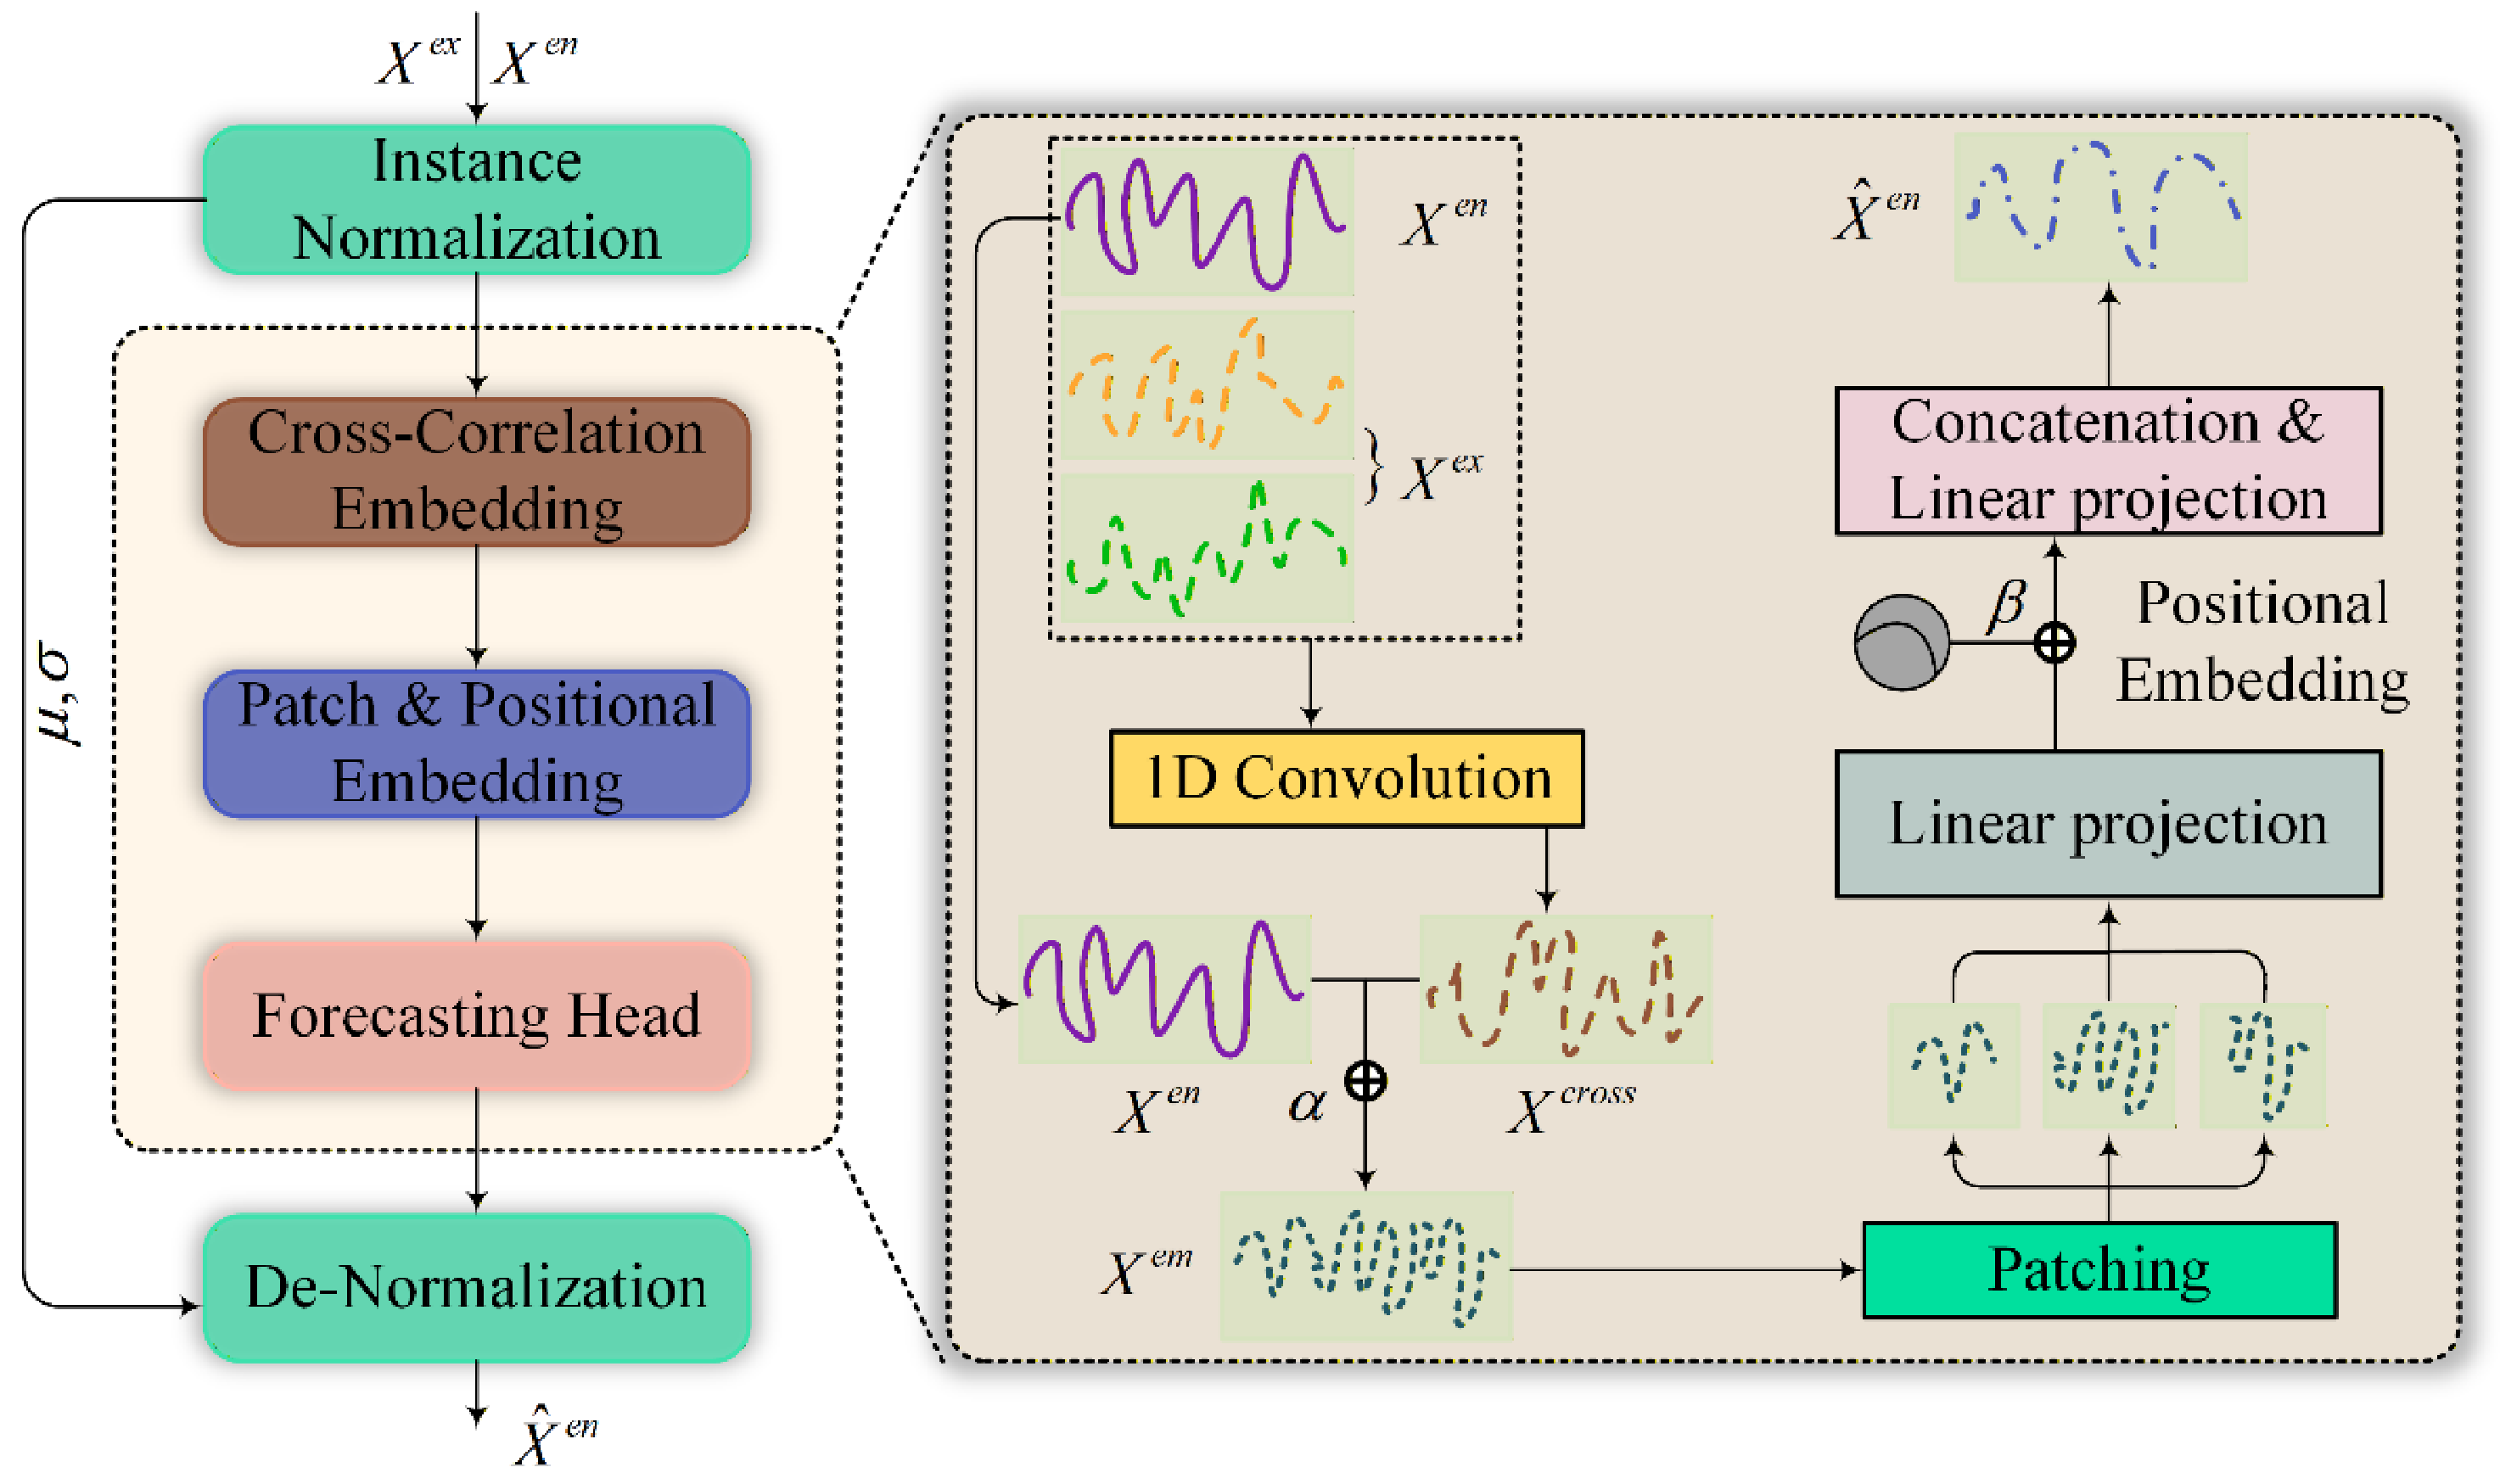
Figure A7.
Rule-hit heat map.
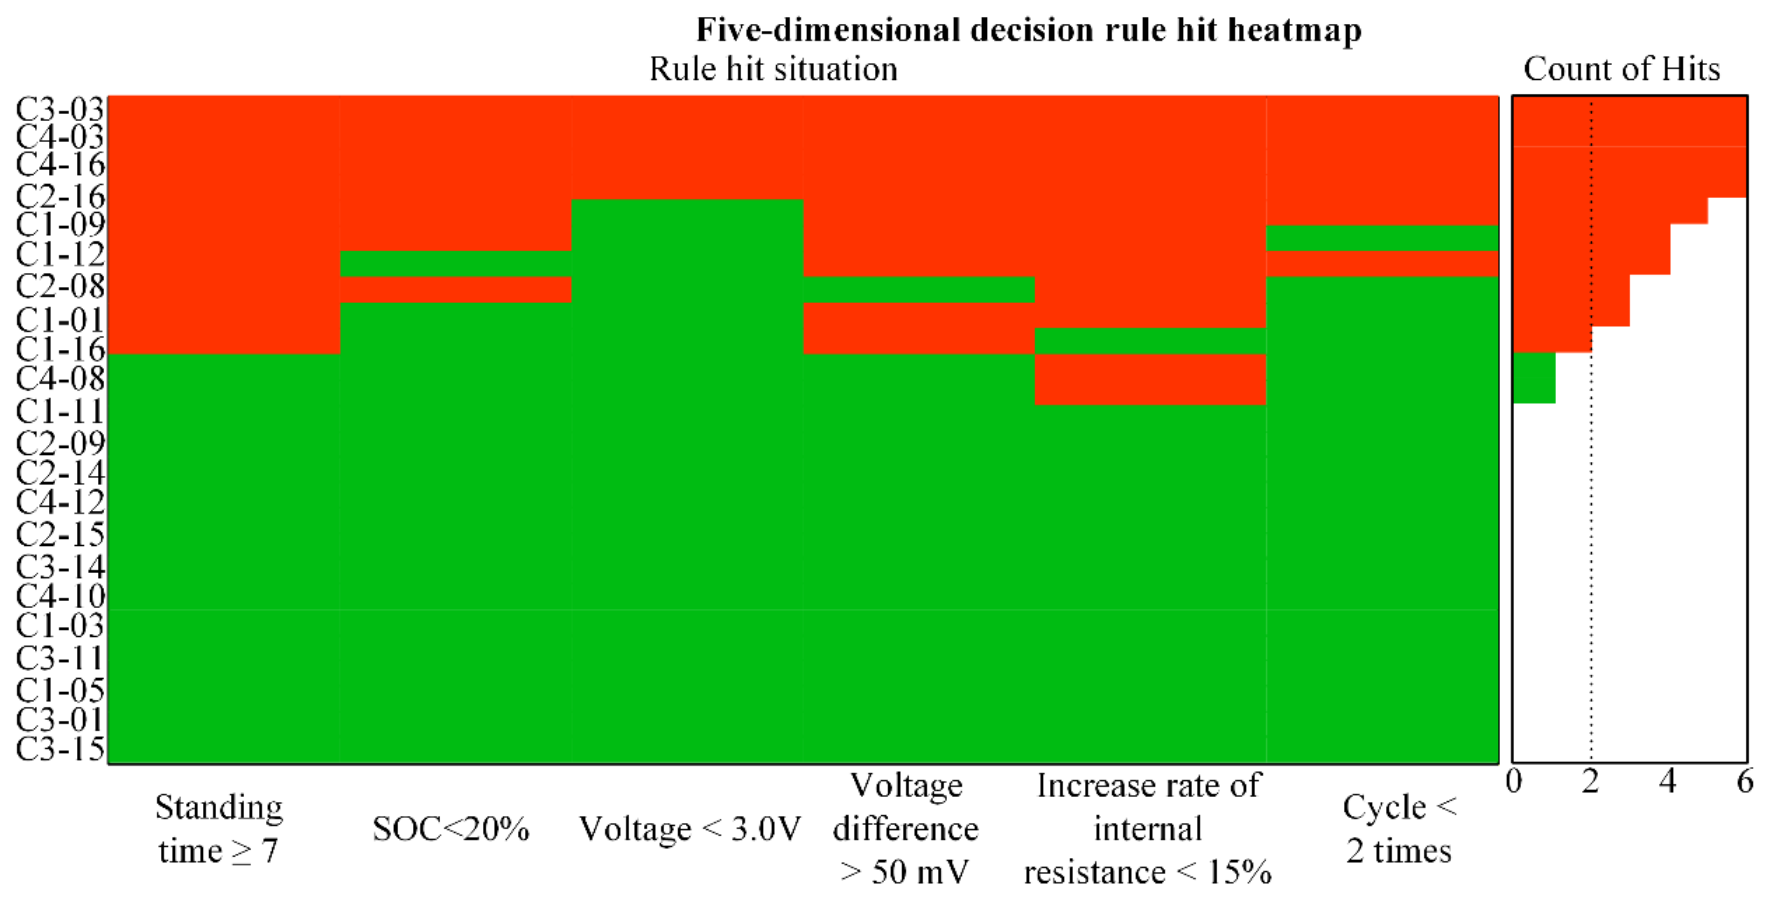
Figure A8.
Charging recovery.
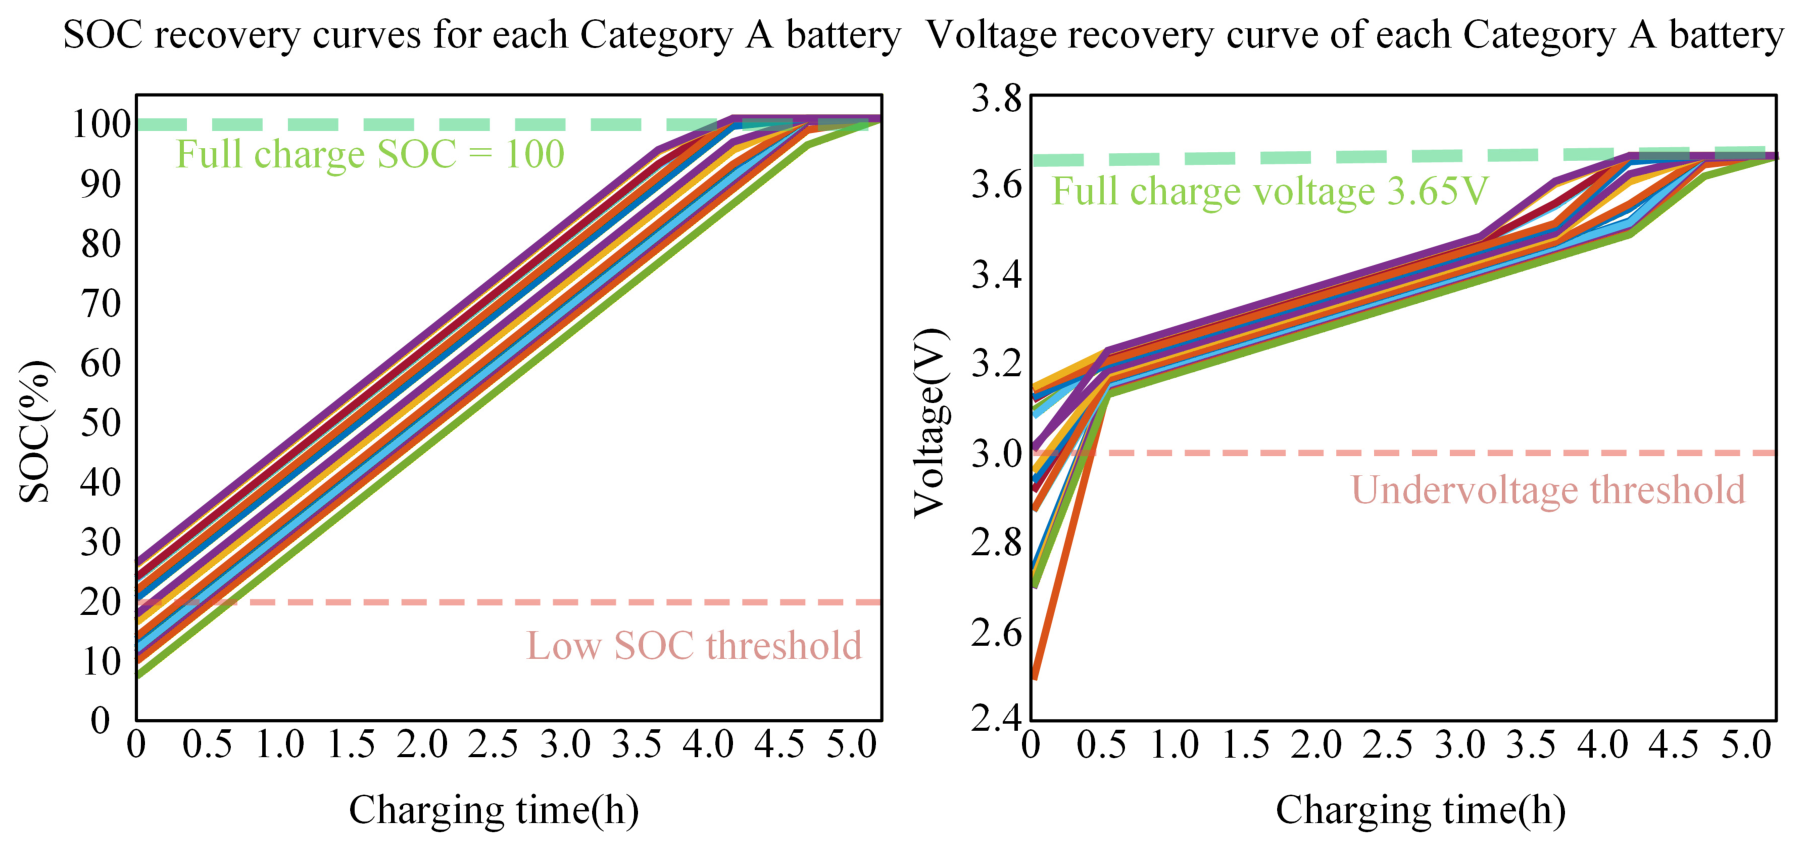
Figure A9.
Charging time.
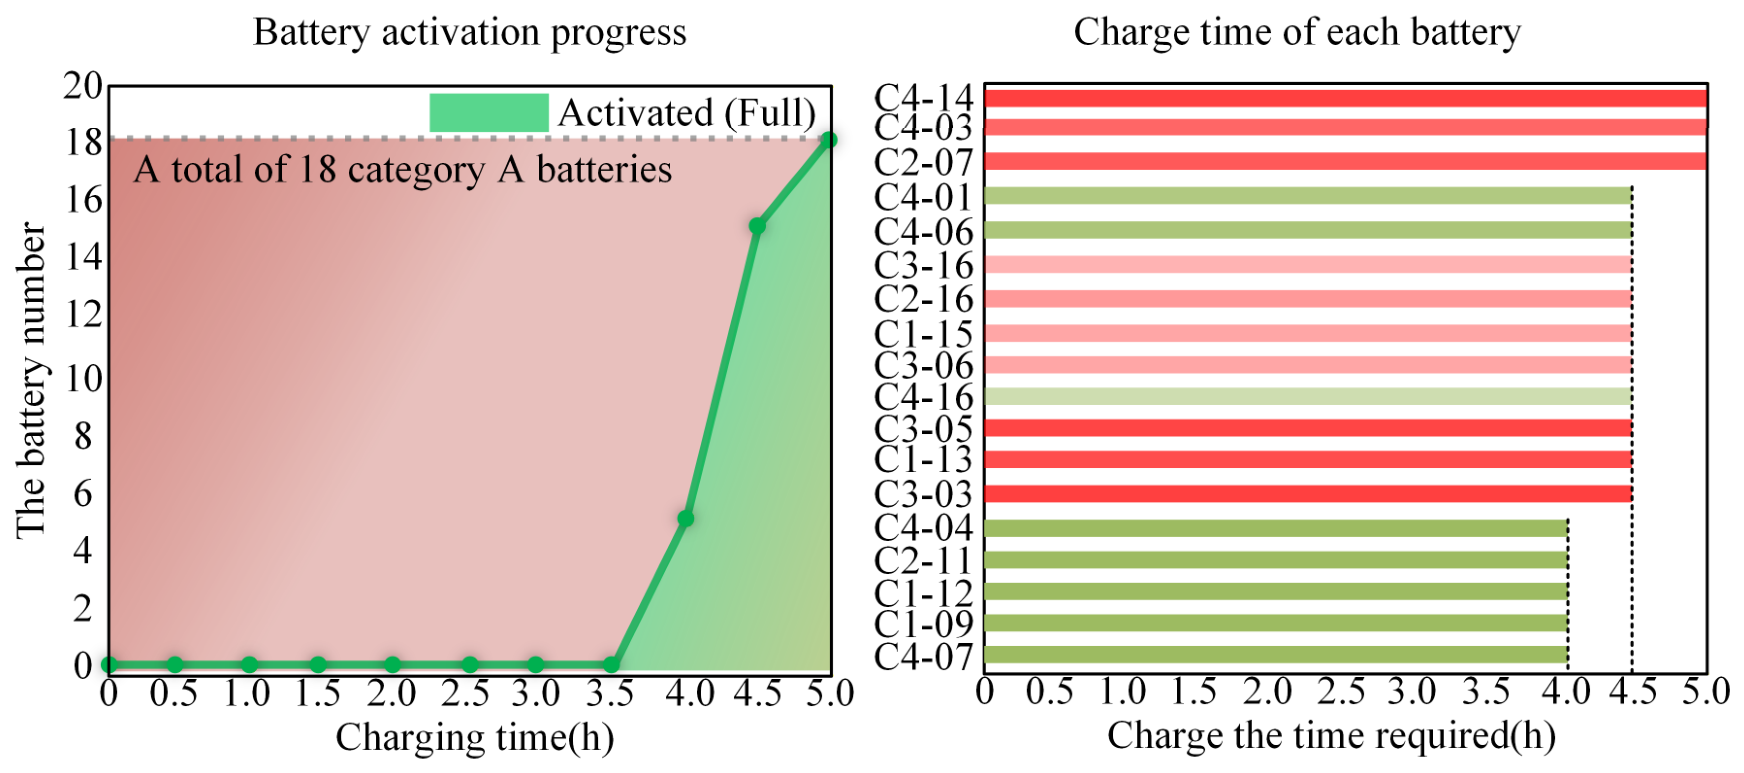
Figure A10.
Error analysis.
References
- D’Apolito, L.; Huang, J.; Hong, H.; Luo, J.; Shen, S. Model predictive control for energy management of lithium nickel cobalt manganese oxide and lithium iron phosphate batteries hybrid energy storage system. J. Energy Storage 2026, 164, 122262. [Google Scholar] [CrossRef] [Scilit]
- Tian, C.; Zhang, Q.; Mei, D.; Chen, E.; Li, Z.; Zhang, X. Day-Ahead Economic Dispatch Optimization for Industrial Consumers Utilizing Shared Energy Storage Stations. Processes 2025, 13, 3964. [Google Scholar] [CrossRef] [Scilit]
- IEA. Batteries and Secure Energy Transitions; IEA: Paris, France, 2024. [Google Scholar]
- Sheppard, A.J.; Nygård, M.M.; Fagerström, J. Impact of settlement time resolution on battery lifetime in self-regulating, hybridised solar photovoltaic and battery energy storage power plants. Energy Rep. 2026, 15, 109177. [Google Scholar] [CrossRef] [Scilit]
- Lyu, Z.; Tian, H.; Wu, L.; Wang, J. Empowering lithium-ion battery state of health solution: Incorporating electrochemical aging characterization and unscented particle filter. J. Power Sources 2026, 671, 239606. [Google Scholar] [CrossRef] [Scilit]
- Arif, N.A.; Mekhilef, S.; Seyedmahmoudian, M.; Stojcevski, A. Degradation in Li-ion batteries and capacity decline under different cycling conditions: A comprehensive review. J. Energy Storage 2026, 154, 121270. [Google Scholar] [CrossRef] [Scilit]
- Li, C.; Zhao, G.; Li, K.; Zhang, X.; Wang, J. Modelling of cells’ capacity distribution and fading for lithium-ion battery pack during the charge and discharge cycles. Energy 2025, 337, 138427. [Google Scholar] [CrossRef] [Scilit]
- Jia, Y.; Lu, N.; Sun, N.; Li, H.; Azaza, M.; Xiong, R. A physics-informed ensemble learning method for battery aging prediction across diverse charging conditions. Appl. Energy 2026, 414, 127785. [Google Scholar] [CrossRef] [Scilit]
- Yang, Y.; Raymand, D.; Guo, W.; Brandell, D. Modeling the interplay between aging and thermal runaway propagation in large-format lithium-ion batteries. J. Power Sources Adv. 2026, 38, 100203. [Google Scholar] [CrossRef] [Scilit]
- Chen, Z.; Jia, L.; Yin, L.; Dang, C.; Ren, H.; Zhang, Z. A Review on Thermal Management of Li-ion Battery: From Small-Scale Battery Module to Large-Scale Electrochemical Energy Storage Power Station. J. Therm. Sci. 2024, 34, 1–23. [Google Scholar] [CrossRef] [Scilit]
- Lin, J.; Hu, W.; Yang, J.; Hu, Y.; Ma, S.; Pan, L.; Wen, F.; Ding, M.; Tang, S.; Wei, Y.; et al. Quantifying aging kinetics in LiFePO4/graphite pouch cells: Cycle aging vs calendar aging via a novel impedance descriptor. Energy Storage Mater. 2026, 86, 104926. [Google Scholar] [CrossRef] [Scilit]
- Yang, Z.; Li, X.; Li, J.; Li, H.; Shi, J.; Fan, X.; Cong, Z.; Feng, X.; Yang, X.-G. Study on Influencing Factors of Calendar Aging and Cycle Aging of LFP Batteries. Appl. Sci. 2025, 15, 12749. [Google Scholar] [CrossRef] [Scilit]
- Wang, T.; Shen, X.; Shi, Y.; Han, C.; Wang, J.; Huang, Y.; Wang, Z. A hybrid deep learning model for thermal runaway prediction in large lithium-ion batteries. J. Energy Storage 2026, 163, 122078. [Google Scholar] [CrossRef] [Scilit]
- Wang, J.V.; Liu, Y.; Wang, Q.; Kang, J.; Meng, P.; Zhu, G. Battery SOH estimation based on thermodynamic parameters from an electrochemical fractional-order model and LSTM. iScience 2026, 29, 114234. [Google Scholar] [CrossRef] [Scilit] [PubMed]
- Dawahdeh, A.; Sharadga, H.; Zakeri, G.; Hayajneh, A.; Pritchard, G. Real-time building energy storage scheduling under electrical load uncertainty: A Markov decision process approach with comprehensive analysis of different pricing policies. Energy Rep. 2026, 15, 109194. [Google Scholar] [CrossRef] [Scilit]
- Ma, C.; Wang, L.; Wu, J.; Liu, C.; Wang, L.; Liao, C. From Laboratory to Real-World Application: A Comprehensive Study on Battery State of Health Assessment Methods. Energies 2026, 19, 1506. [Google Scholar] [CrossRef] [Scilit]
- Shaosen, S.; Di, G.; Vandana; Gao, L.; Li, W.; Garg, A. Enhancing battery health estimation using model selection criteria-based genetic programming. J. Energy Storage 2024, 102, 114077. [Google Scholar] [CrossRef] [Scilit]
- Sivalertporn, K.; Poopanya, P.; Phophongviwat, T. Capacity Forecasting of Lithium-Ion Batteries Using Empirical Models: Toward Efficient SOH Estimation with Limited Cycle Data. Energies 2025, 18, 3828. [Google Scholar] [CrossRef] [Scilit]
- Liu, S.; Cui, Y.; Yuan, L.; Xu, Z.; Jin, L. Joint State-of-Charge and State-of-Health Estimation Method Based on Equivalent Circuit Model and Data-Driven Model Fusion. Energies 2026, 19, 1567. [Google Scholar] [CrossRef] [Scilit]
- Berecibar, M.; Gandiaga, I.; Villarreal, I.; Omar, N.; Van Mierlo, J.; Van den Bossche, P. Critical review of state of health estimation methods of Li-ion batteries for real applications. Renew. Sustain. Energy Rev. 2016, 56, 572–587. [Google Scholar] [CrossRef] [Scilit]
- Liu, S.; Sun, C.; Sun, B.; Fang, L.; Li, D. A two-layer full data-driven model for state of health estimation of lithium-ion batteries based on MKRVM-ELM hybrid algorithm with ant-lion optimization. J. Energy Storage 2025, 114, 115716. [Google Scholar] [CrossRef] [Scilit]
- Sharma, P.; Mishra, A. Improved pufferfish-optimized KNN-SVM technique for state-of-health estimation of electric vehicles lithium-ion battery. Eng. Res. Express 2025, 7, 045326. [Google Scholar] [CrossRef] [Scilit]
- Xiao, W.; Jia, J.; Gao, W.; Li, H.; Xu, H.; Zhong, W.; He, K. Stage-Wise SOH Prediction Using an Improved Random Forest Regression Algorithm. Electronics 2026, 15, 287. [Google Scholar] [CrossRef] [Scilit]
- Severson, K.A.; Attia, P.M.; Jin, N.; Perkins, N.; Jiang, B.; Yang, Z.; Chen, M.H.; Aykol, M.; Herring, P.K.; Fraggedakis, D.; et al. Data-driven prediction of battery cycle life before capacity degradation. Nat. Energy 2019, 4, 383–391. [Google Scholar] [CrossRef] [Scilit]
- Du, C.; Sang, Z.; Zhou, R.; Zhang, X.; Li, P.; Jiang, Y. A deep learning method combining wavelet transform and transfer learning for lithium-ion battery state of health estimation. J. Process Control 2026, 161, 103706. [Google Scholar] [CrossRef] [Scilit]
- Wang, S.; Chen, K.; Jin, Z.; Qin, A.; Zeng, L. A method for estimating the SOH of lithium-ion batteries based on exponential smoothing transformer with temporal-channel coordinate attention and reversible instance normalization. Ionics 2026, 32, 5407–5424. [Google Scholar] [CrossRef] [Scilit]
- Waag, C.; Fleischer, S.; Sauer, D.U. Critical review of the methods for monitoring of lithium-ion batteries in electric and hybrid vehicles. J. Power Sources 2014, 258, 321–339. [Google Scholar] [CrossRef] [Scilit]
- Linghu, J.; Tan, Y.; Chen, C.; Ren, R.; Wang, X.; Wei, X. A Hybrid LSTM-iTransformer Model with Data Augmentation for Battery State-of-Health Estimation. Electronics 2026, 15, 1166. [Google Scholar] [CrossRef] [Scilit]
- Zhang, J.; Lee, J. A review on prognostics and health monitoring of Li-ion battery. J. Power Sources 2011, 196, 6007–6014. [Google Scholar] [CrossRef] [Scilit]
- Yuan, T.; Han, B.; Song, X.; Shuang, Y.; Wang, R. A SOH estimation method utilizing crossformer-transfer learning architecture for new energy storage stations considering erratic power injection. J. Energy Storage 2025, 139, 118542. [Google Scholar] [CrossRef] [Scilit]
- Yuan, T.; Gao, F.; Bai, J.; Sun, H. A lithium-ion battery state of health estimation method utilizing convolutional neural networks and bidirectional long short-term memory with attention mechanisms for collaborative defense against false data injection cyber-attacks. J. Power Sources 2025, 631, 236193. [Google Scholar] [CrossRef] [Scilit]
- Yuan, T.; Zhu, M.; Bai, J.; Sun, H. A GPR-EDM-UPF framework with false data detection and correction for generalized estimation of SOH in batteries under cyber attacks. J. Power Sources 2024, 623, 235449. [Google Scholar] [CrossRef] [Scilit]
- Emadeldeen, E.; Eldele, E.; Chen, Z.; Wu, M.; Li, X.; Ragab, M. Tslanet: Rethinking transformers for time series representation learning. arXiv 2024, arXiv:2404.08472. [Google Scholar]
- Zhou, P.; Liu, Y.; Liang, J.; Song, Q.; Li, X. CrossLinear: Plug-and-Play Cross-Correlation Embedding for Time Series Forecasting with Exogenous Variables. arXiv 2025, arXiv:2505.23116. [Google Scholar]
- Lang, Y.; Gao, Y. Dream Optimization Algorithm (DOA): A novel metaheuristic optimization algorithm inspired by human dreams and its applications to real-world engineering problems. Comput. Methods Appl. Mech. Eng. 2025, 436, 117718. [Google Scholar] [CrossRef] [Scilit]
- He, W.; Williard, N.; Osterman, M.; Pecht, M. Prognostics of lithium-ion batteries based on Dempster–Shafer theory and the Bayesian Monte Carlo method. J. Power Sources 2011, 196, 10314–10321. [Google Scholar] [CrossRef] [Scilit]
- Birkl, C. Diagnosis and Prognosis of Degradation in Lithium-ion Batteries. Doctoral Dissertation, University of Oxford, Oxford, UK, 2017. [Google Scholar]

Disclaimer/Publisher’s Note: The statements, opinions and data contained in all publications are solely those of the individual author(s) and contributor(s) and not of MDPI and/or the editor(s). MDPI and/or the editor(s) disclaim responsibility for any injury to people or property resulting from any ideas, methods, instructions or products referred to in the content. |
© 2026 by the authors. Licensee MDPI, Basel, Switzerland. This article is an open access article distributed under the terms and conditions of the Creative Commons Attribution (CC BY) license.