


Abstract
Lithium-ion batteries (LIBs) in electric vehicle battery packs are assembled under mechanical constraints that exert compression force during operation. During operation, battery cells undergo volumetric changes that cause thickness variations, known as battery swelling. The resulting swelling behavior under mechanical constraints generates force fluctuation. The prediction for force magnitude is critical, as insufficient force compromises electrical contact and structural stability, while excessive force accelerates structural degradation and increases safety risks. However, force sensors have not been widely implemented due to high costs, integration complexity, and reliability concerns, which limits the practical application of force prediction. In this study, we present a coupled electrochemical–mechanical model for predicting compression forces aligning with battery swelling behavior without requiring real-time force sensors during operation. The model predicts the evolution of compression force at an initial external pressure of 0.201 MPa, achieving a mean absolute percentage error (MAPE) of 4.48% during 1C discharge and 7.02% under multi-phase driving cycle conditions, compared with experimental results. The developed framework addresses the existing gap in predicting compression force for mechanically constrained LIBs. The proposed modeling approach enables real-time force monitoring in battery modules, thereby enhancing safety assessment capabilities through force predictions and optimizations.
1. Introduction
The transition toward decarbonized transportation and renewable-integrated smart mobility systems has positioned lithium-ion batteries (LIBs) as a core enabling technology for electric vehicles (EVs), stationary energy storage, and vehicle-to-grid applications [1,2,3]. As EV adoption accelerates to meet global emission-reduction targets, battery packs are required to deliver higher energy density, longer service life, and improved safety within increasingly compact module designs. Realizing these requirements depends on the reliable structural integration of individual cells within modules, where mechanical constraint plays a central role in maintaining electrical contact, dimensional stability, and long-term performance throughout the vehicle’s operational life. In practical battery packs, cells are integrated into modules under mechanical constraints that apply compressive force to maintain contact and structural integrity [4,5]. During operation, electrochemical processes cause volumetric expansion, producing reversible and irreversible dimensional changes known as battery swelling [6,7,8,9]. In mechanically constrained systems, the resulting volumetric change generates altered compressive forces on module structures [10,11,12]. The magnitude of this force is critical for battery performance and safety [13,14]. Insufficient force weakens electrical contact and mechanical stability [15,16,17,18], while excessive force accelerates degradation mechanisms including electrode cracking, separator deformation, and side reactions that elevate safety risks such as internal short circuits and thermal runaway [19,20,21]. Accurate force prediction is therefore essential for module design optimization and safety assessment, yet force sensors have not been widely implemented due to high costs, integration complexity, and reliability concerns [22]. One promising approach to address these practical limitations is the use of physics-based battery models, which can potentially reconstruct internal mechanical states from measurable electrical signals without relying on dedicated sensors [23,24].
Physics-based simulation has become a core tool for LIB design and for probing internal states that are otherwise inaccessible to direct measurement [25,26,27,28,29,30]. This field of research traces back to the porous electrode and concentrated solution theories introduced by Newman and co-workers for simulating Li+ transport under galvanostatic operation [31,32], which have been extended to capture mechanical degradation phenomena at multiple length scales [33,34]. Rieger et al. developed a framework for reversible swelling prediction by connecting particle-level strain to cell expansion [27,35]. In our previous work, we developed a P2D-based model capable of predicting cell thickness changes under mechanical constraints [23]. Many efforts have been made to understand the influence of mechanical forces in lithium-ion batteries, offering valuable insights through empirical, lumped-parameter, and increasingly data-driven approaches [11,26,36,37,38,39,40]. However, few works explicitly correlate swelling behavior with evolving mechanical force to enable force prediction. Among the existing approaches, some studies have employed machine learning methods [22,36]. Cai et al. [22] combined an electromechanical coupled model with machine learning to estimate battery expansion without direct displacement sensing, while Kwak et al. [36] applied machine learning regression to predict compression force evolution over degradation. Both approaches achieve good predictive accuracy but typically rely on large amounts of training data and offer limited physical interpretability of the underlying electrochemical–mechanical mechanisms. A notable gap in the existing literature is the lack of a direct, mechanistic link between cell swelling dynamics and compression force evolution within a constrained module. In this context, our work proposes a physics-based electrochemical–mechanical framework that directly links swelling behavior to compression force evolution, enabling an interpretable and data-efficient model for compression force prediction.
This study presents a framework of a coupled electrochemical–mechanical model for predicting compression forces in battery cells which directly align battery swelling behavior with force evolution. The framework integrates three coupled components: (i) preload force estimation derived from internal resistance measurements, (ii) P2D-based thickness prediction under mechanical constraints, and (iii) dynamic force calculation through nonlinear stiffness modeling. The resulting model predicts compression force throughout various load profiles using electrical cycling data, thereby enabling real-time force monitoring without reliance on displacement and force sensors during operation. This approach addresses the current gap for force estimation required for practical battery management and provides the potential to enhance safety assessment through force predictions and optimizations.
2. Model Development
The modeling framework adopts a multiscale approach to predict the force evolution of LIBs under mechanical constraints during electrical cycling. The model integrates three key components: (i) preload force prediction based on Hybrid Pulse Power Characterization (HPPC) tests (Section 2.1), (ii) cell thickness change prediction derived from pressure-dependent parameters (Section 2.2), and (iii) spring stiffness characterization obtained from compression tests (Section 2.3). The force evolution during cycling is then determined by coupling these three components through the fundamental relationship as detailed in Equation (1):
where Fcycling represents the total force during electrical cycling, Fpreload represents the preload force applied to the cell upon module assembly prior to any electrical cycling, dt(P) is the cell thickness change under the applied mechanical pressure during cycling, and k represents the spring stiffness. This framework enables prediction of both thickness and force variations throughout the cycling process without requiring real-time force sensors.
Fcycling = Fpreload + dt(P) × k
2.1. Preload Force Prediction
The preload force applied to battery cells in mechanically constrained configurations directly influences the internal electrochemical–mechanical state through modifications to electrode porosity, interfacial contact resistance, and ionic transport pathways [17,41]. These compression-induced structural changes manifest as measurable variations in internal resistance, providing a foundation for preload force estimation without real-time sensors [22]. To establish the quantitative relationship between applied force and electrical impedance, Hybrid Pulse Power Characterization (HPPC) tests are performed on fresh cells under systematically varied preload conditions. The internal resistance R at each pulse is calculated from the instantaneous voltage response using Ohm’s law as in Equation (2): [42]
where Upre_pulse is the equilibrium voltage measured during the rest period immediately before the pulse (typically averaged over the final 60 measurement points to minimize noise), Upost_pulse is the voltage measured at the end of the discharge pulse after ohmic drop and initial polarization have occurred, and Ipulse is the applied pulse current magnitude. Upre_pulse represents the open-circuit voltage at the given SOC under the applied compression, while Upost_pulse captures the combined effects of ohmic resistance, charge transfer polarization, and concentration polarization on short timescales. Multiple discharge and charge pulses at each SOC level yield statistical data for averaging, enhancing measurement robustness against noise and transient effects.
R = |Upre_pulse − Upost_pulse|/Ipulse
The internal resistance measurements obtained under different preload forces reveal a functional relationship between preload force and resistance. This relationship is empirically determined through calibration experiments where cells are tested under controlled preload forces while monitoring the HPPC response. Through regression analysis of the characterization data, the functional form Fpreload = f(R) is directly derived, enabling preload force estimation from measured resistance values. Given a resistance R obtained from HPPC testing, the corresponding preload force can be calculated directly using this established functional relationship [22,43] and is expressed as Equation (3):
where F(R) is the estimated preload force, R is the internal resistance obtained from HPPC testing, and a, b, and c are SOC-dependent empirical fitting parameters. The SOC-dependent values of a, b, and c, together with the corresponding fitting error, are reported in Section 4.1.
2.2. Cell Thickness Prediction
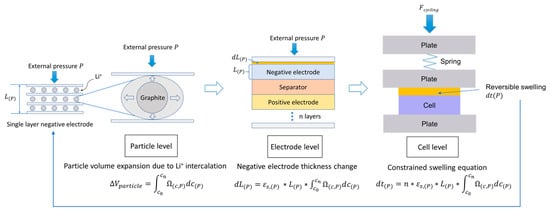
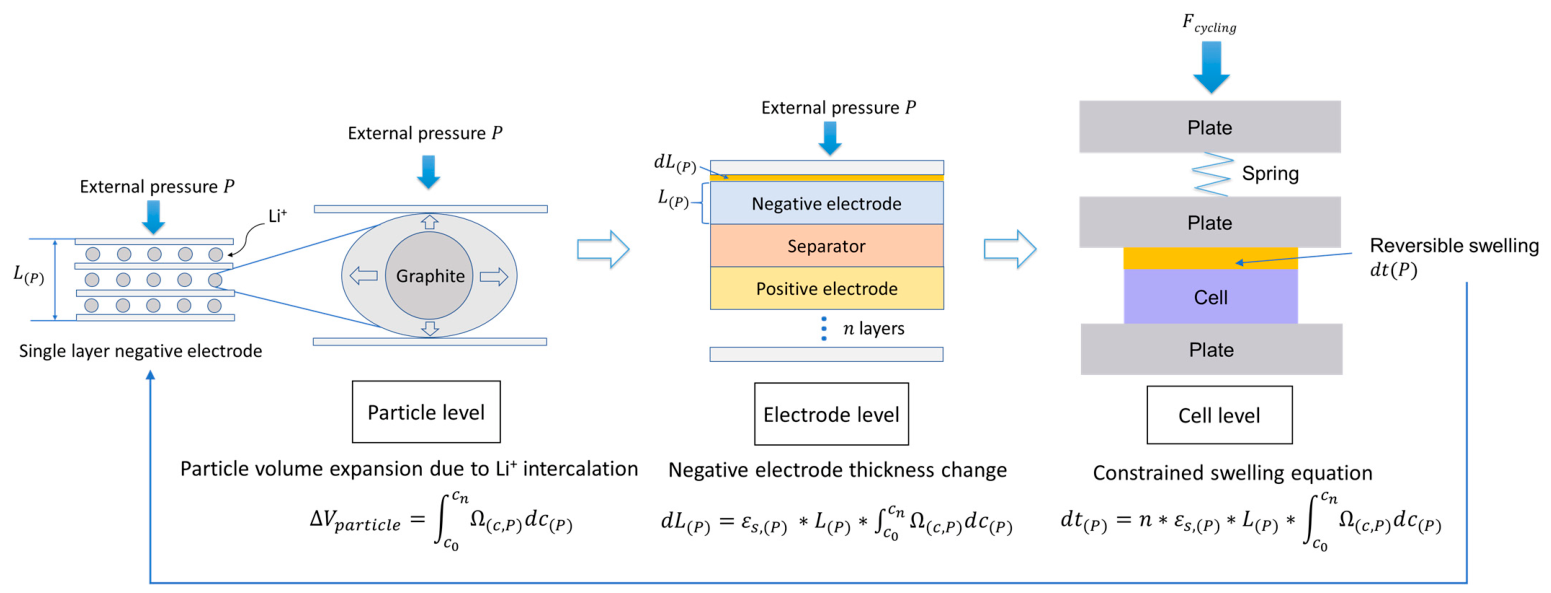
Cell thickness evolution during electrochemical cycling results from lithium intercalation-induced volumetric expansion at the particle level, which propagates through the electrode microstructure to produce macroscopic dimensional changes [44]. The detailed method can be found in our previous study [23]. Under mechanical constraint, the relationship between local concentration changes and observable thickness variation is modified by external pressure effects on both material properties and swelling behavior. The thickness prediction employs a multiscale electrochemical–mechanical framework which connects particle-level expansion to cell-level swelling, as shown in Figure 1.
Figure 1.
Principle of the cell thickness prediction model framework. This figure is reproduced from our previous study [23].
The framework comprises three levels, namely the particle, electrode and cell scales. For the particle scale, Li+ concentration gradients during cycling are resolved using a pseudo-two-dimensional (P2D) electrochemical model. The volumetric expansion of each particle can be calculated by multiplying its concentration distribution by the partial molar volume Ω(c,P), which depends on both pressure and concentration [45]. The partial molar volume Ω(c,P) captures both the concentration dependence arising from lattice staging during intercalation and the pressure dependence arising from the additional mechanical work required to expand the electrode lattice against an external constraint. It is assumed that increasing applied pressure suppresses the effective volume change at a given lithium concentration. The full derivation and parameterization of Ω(c,P) are provided in our previous work [23]. Overall electrode swelling is obtained by aggregating the particle-level expansions. By summing the contributions of all electrode layers, we can then determine the total change in the cell thickness.
2.3. Spring Stiffness Characterization
Spring stiffness is characterized through controlled displacement testing of a constrained fixture assembly that replicates the bracing conditions within the battery module. The fixture incorporates disk springs sandwiched between rigid plates, and force–displacement data are acquired across a range of preload forces to establish the complete stiffness–force relationship. Local stiffness k(F) at each force level is computed as the derivative dF/dx of the measured force–displacement curve. Data from multiple test configurations are aggregated with statistical filtering applied to remove outliers.
A piecewise model is employed to capture the nonlinear stiffness behavior across the full compression range. The formulation incorporates constant stiffness in the low-force regime, polynomial stiffness in the intermediate range, and a modified contact function at high compression to represent geometric nonlinearity. The instantaneous spring force is determined iteratively from the change in cell thickness [46]. This iterative approach allows accurate calculation of mechanical loads while capturing the nonlinear stiffness behavior across the full range of operating conditions.
3. Experimental Setup
3.1. Specimen
Experiments are carried out on the same commercial prismatic cell format used in our earlier work [23]. The cell has a nominal capacity of 75 Ah and dimensions of 220.6 × 105.4 × 22.8 mm. It uses NMC 631 as the cathode material and graphite as the anode material, with a maximum voltage of 4.35 V and a minimum voltage of 2.80 V. The cell contains two jelly stacks, with anodes coated on copper current collectors and cathodes coated on aluminum current collectors, separated by a polyolefin separator. The stacks are enclosed in a protective polymer film and housed within an aluminum casing. The internal structure and dimensions of anodes, cathodes, current collectors, and separators are characterized using light microscopy, with the corresponding results presented in Appendix A.
3.2. Test Setup
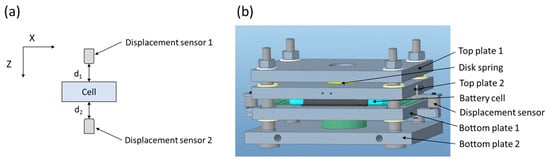
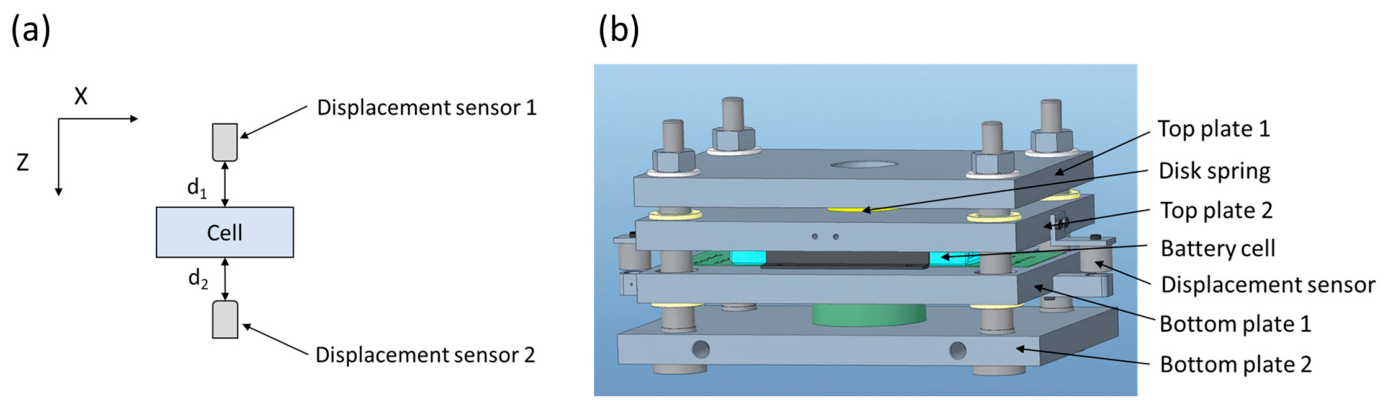
Two test setups are constructed, as shown in Figure 2. A detailed description of both setups can be found in our previous work [23]. The unconstrained setup, shown in Figure 2a, is designed to track cell thickness during cycling using two capacitive sensors (Micro-Epsilon Messtechnik GmbH & Co. KG, Ortenburg, Germany). The constrained setup, illustrated in Figure 2b, consists of an assemble of four steel plates secured by four corner bolts, incorporating a disk spring between the top plates to replicate the bracing stiffness of battery modules.
Figure 2.
Schematic drawings of test setup: (a) unconstrained setup, (b) constrained setup.
3.3. Test Procedure
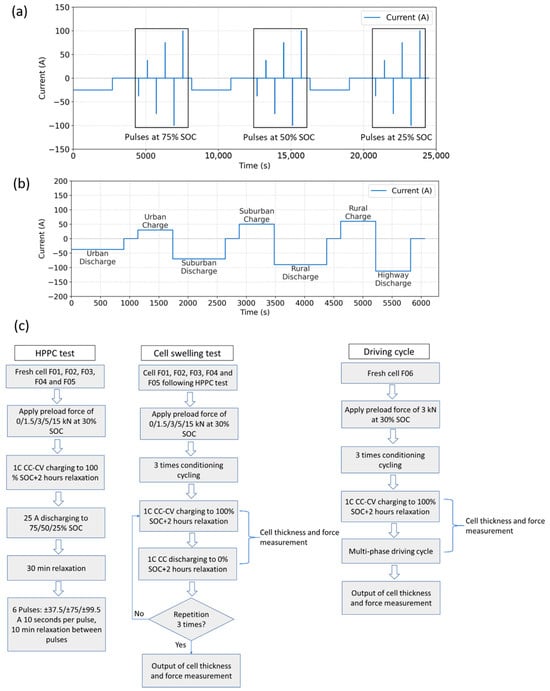
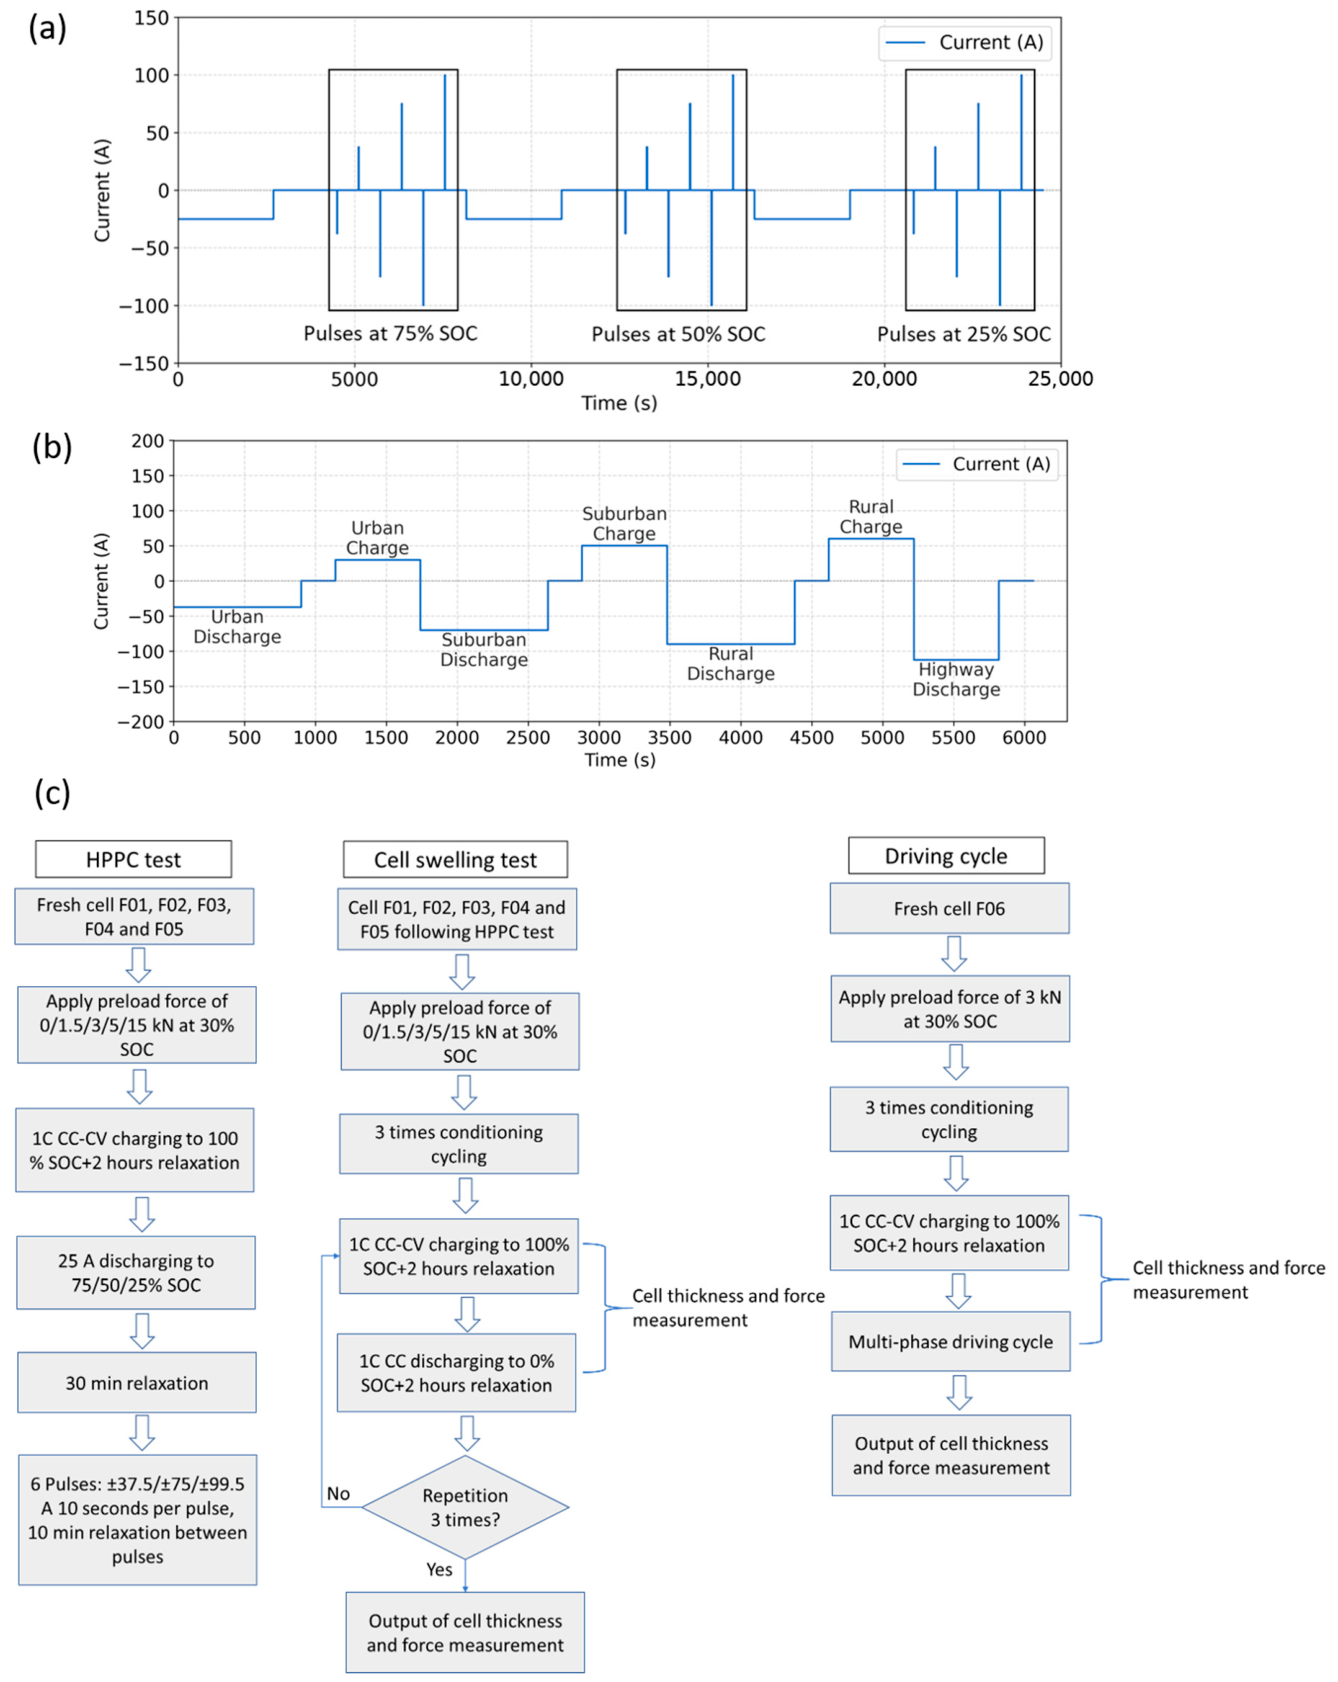
The experimental characterization consists of three complementary test series designed to establish and validate the integrated electromechanical model under various operating conditions. First, HPPC testing is conducted on five cells (F01–F05) under five different preload forces ranging from 0 kN to 15 kN to establish the force–resistance calibration relationship across multiple state-of-charge levels and current rates. The current profile of the HPPC tests is shown in Figure 3a. Second, cell swelling tests are performed on the same cells during extended cycling to capture the cell thickness and force change under unconstrained and constrained conditions during electrical cycling. Third, driving cycle testing is conducted on cell F06 to validate the model’s predictive capability under realistic transient current profiles representative of electric vehicle operation. The driving cycle current profile is shown in Figure 3b. The complete test procedure is depicted schematically in Figure 3c, illustrating the sequential testing protocols and their respective objectives within the overall characterization framework.
Figure 3.
(a) HPPC test current profile, (b) driving cycle current profile, (c) schematic drawings of the test procedure.
3.4. HPPC Tests
To establish the force–resistance calibration relationship, five fresh cells named F01, F02, F03, F04, and F05 from the same production batch are subjected to systematic HPPC testing under controlled preload forces of 0 kN, 1.5 kN, 3 kN, 5 kN, and 15 kN. The preload force is applied to each cell at 30% SOC to represent realistic mechanical constraints at a mid-range charge state, avoiding the extreme volumetric conditions of fully charged or discharged states. These force levels range from unconstrained conditions to high compression representative of tightly constrained battery modules, enabling comprehensive characterization of compression effects on internal resistance [17,47]. Among these force levels, the results at 0 kN, 1.5 kN, 5 kN, and 15 kN are used for model characterization, while the 3 kN condition serves as validation since it represents the practical applied force specified by the manufacturer. The HPPC test applies a standardized sequence of current pulses to characterize the cell’s dynamic voltage response and extract internal resistance at different state-of-charge levels. The protocol consists of discharge and charge pulse pairs with 10 s durations, separated by rest periods to allow the cell to approach electrochemical and thermal equilibrium.
The HPPC protocol is initiated at 100% SOC following a full charge and equilibration period. Each cell is discharged at a constant current of 25 A, corresponding to a rate of approximately 0.33C, to the first target SOC of 75%, followed by a 30 min rest period to allow voltage stabilization and concentration gradient relaxation. At each target SOC level of 75%, 50%, and 25%, a sequence of discharge and charge pulse pairs is applied with progressively increasing magnitudes of ±37.5 A, ±75 A, and ±99.75 A, corresponding to rates of approximately ±0.5C, ±1C, and ±1.33C, respectively. Each pulse is maintained for 10 s to capture ohmic resistance and short-term polarization effects while avoiding excessive concentration polarization [48]. Relaxation periods of 10 min are inserted between consecutive pulses to allow partial recovery of voltage and concentration gradients. After completing the pulse sequence at 75% SOC, the cell is discharged at 25 A to 50% SOC where the pulse sequence is repeated, then discharged to 25% SOC for the final pulse sequence. In total, each cell experiences 18 pulses consisting of three discharge and three charge pulses at each of three SOC levels under each preload condition. All tests are conducted at ambient temperature under controlled laboratory conditions with temperature maintained within ±1 °C.
3.5. Cell Swelling Tests
To validate the integrated modeling framework under mechanically constrained conditions, the same cells from the HPPC testing are subjected to electrical cycling while continuously monitoring both thickness changes and compression forces. Following preload application, each cell undergoes three conditioning cycles to eliminate mechanical settling effects, initial creep, and transient relaxation behavior [4]. The conditioning protocol consists of 1C constant current–constant voltage (CC-CV) charging to 100% SOC with a cutoff current of 3.75 A, followed by 1C constant current (CC) discharge to 0% SOC, with 10 min relaxation periods after each charge and discharge phase. The preload force decreases during cycling and becomes stable after these initial three cycles, establishing a baseline for subsequent measurements.
Following the conditioning phase, each cell is cycled three additional times using the same CC-CV charging and CC discharging protocol, but with extended 2 h relaxation periods after each charge and discharge phase to ensure complete electrochemical and mechanical equilibration. Cell thickness and force are measured continuously throughout these three measurement cycles to characterize the dynamic electro-chemo-mechanical response under constrained conditions. The experimental dataset builds upon our previous work [23], which covered three levels of preload forces. In the present study, an additional preload condition of 3 kN (the manufacturer-recommended force for optimal cell operation) is included to enhance the resolution of the force-dependent characterization and further validate the framework across a broader operating range.
3.6. Driving Cycle
To demonstrate the model’s predictive capability under realistic transient operating conditions, a fresh cell F06 is subjected to a representative driving cycle that simulates the complex current dynamics encountered during electric vehicle operation. The cell is preloaded with 3 kN force at 30% SOC following the same preload application procedure described previously. After preload application, the cell is charged to 100% SOC using 1C constant current–constant voltage protocol with a cutoff current of 3.75 A, then subjected to the multi-phase driving cycle while thickness and force are continuously monitored.
The driving cycle comprises four sequential phases designed to replicate urban, suburban, rural, and highway driving conditions, each characterized by distinct power demands and regenerative braking patterns [49]. The urban phase consists of discharge at −37.5 A for 900 s, followed by 240 s relaxation and charge at 30 A for 600 s. The suburban phase applies discharge at −70 A for 900 s, followed by 240 s relaxation and charge at 50 A for 600 s. The rural phase involves discharge at −90 A for 900 s, followed by 240 s relaxation and charge at 60 A for 600 s. Finally, the highway phase applies discharge at −112.5 A for 600 s, followed by 240 s relaxation. The final cell SOC is expected to be approximately 40%. This profile captures the dynamic current variations, rest periods, and regenerative braking events characteristic of real vehicle operation, providing a rigorous test of the model’s ability to predict force evolution under continuously varying electrochemical and mechanical states. The total cycle duration is approximately 1.7 h, with cell SOC decreasing progressively through the phases. Cell thickness and force measurements acquired throughout the driving cycle enable validation of model predictions under transient conditions.
4. Results and Discussion
4.1. Results of Preload Force Prediction
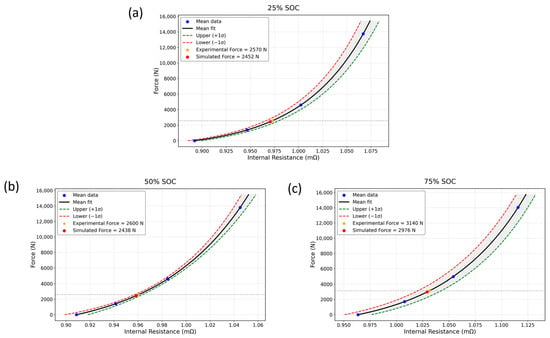
The relationship between preload force and internal resistance is established through systematic HPPC of four fresh cells tested under controlled preload forces of 0 kN, 1.5 kN, 5 kN, and 15 kN, using the empirical relationship introduced in Equation (3).
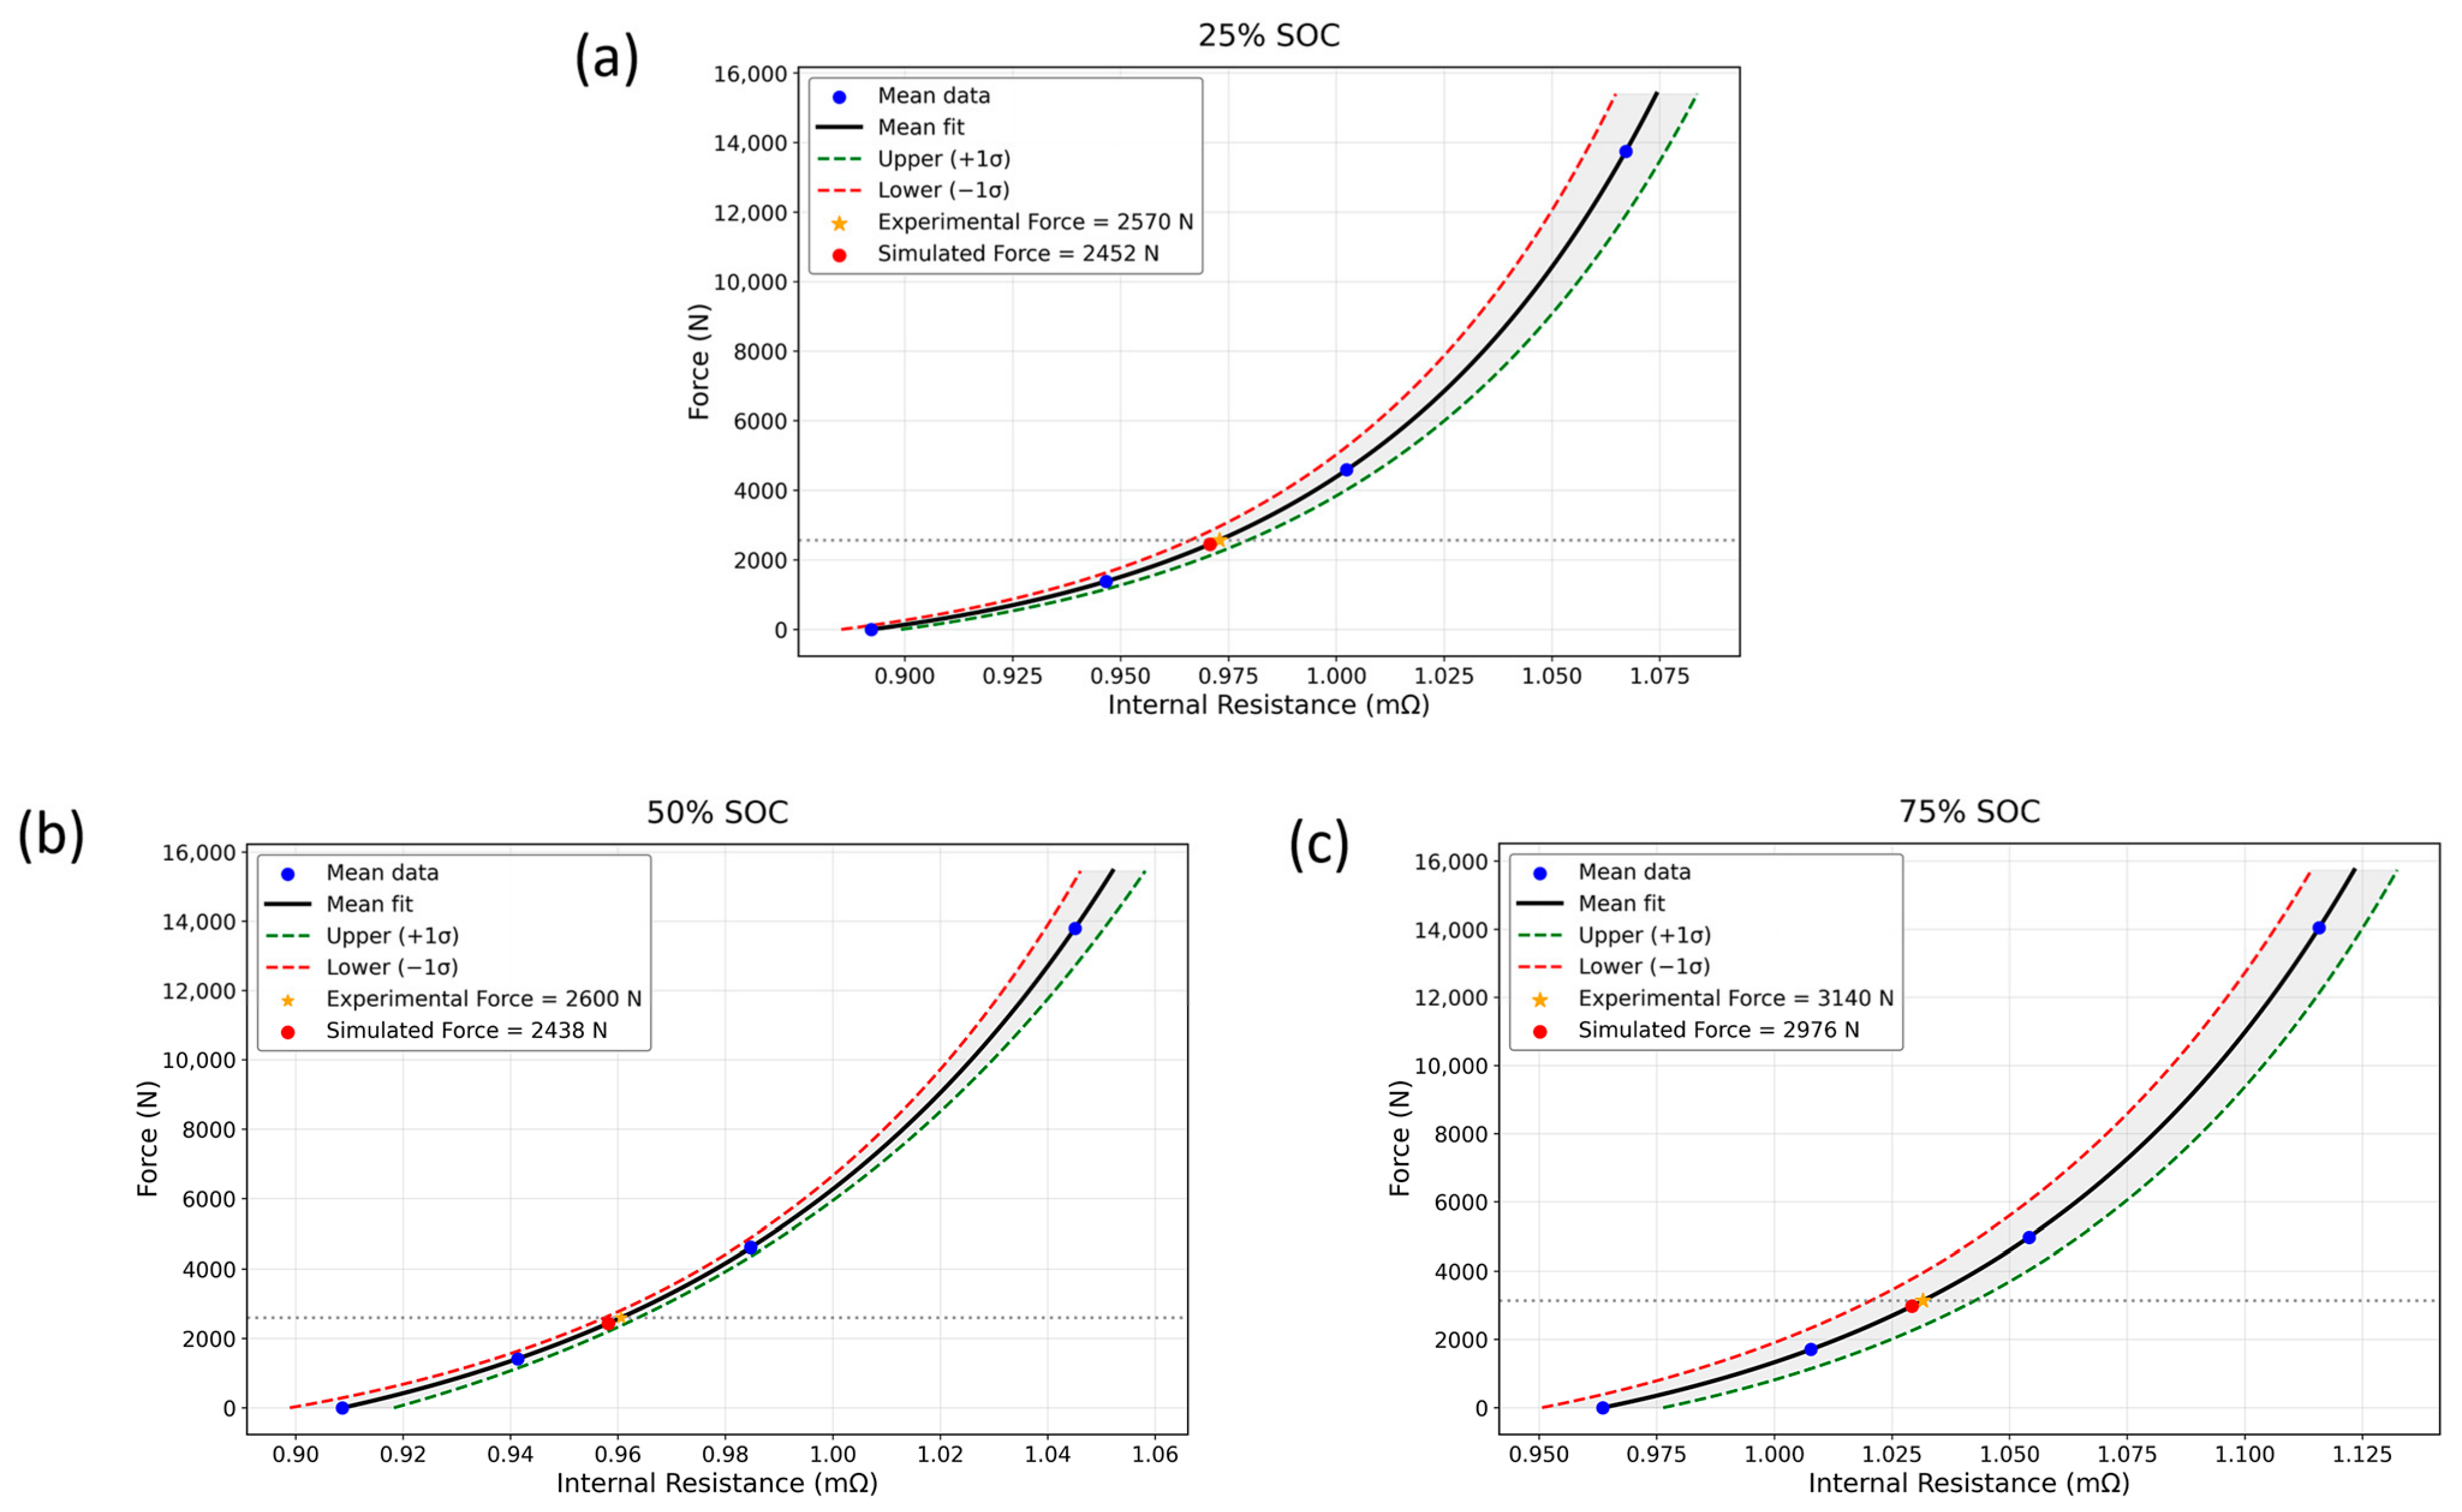
Figure 4 presents the calibrated force–resistance curves at three representative SOC levels, 75%, 50%, and 25%, where each data point represents the mean value calculated from six pulses at the corresponding SOC level. The SOC-dependent fitting parameters a, b, and c are summarized in Table 1, enabling preload force estimation from HPPC resistance measurements at these characterized SOC levels. The root-mean-square errors (RMSE) for the fitted curves are 0.000041 mΩ at 75% SOC, 0.000075 mΩ at 50% SOC, and 0.000045 mΩ at 25% SOC. To validate the estimation approach, the calibrated relationship is applied to predict the initial preload force for cell F03, which was tested under 3 kN preload. HPPC measurements are performed at 75%, 50%, and 25% SOC, and the resulting internal resistance values are substituted into Equation (3) with parameters from Table 1. Table 2 compares the estimated and experimental forces. The preload estimation achieves relative errors of 4.59%, 6.23%, and 5.22% at 25%, 50%, and 75% SOC respectively, demonstrating practical viability for initial force determination. The variation in estimated force across SOC levels reflects both SOC-dependent electrochemical impedance characteristics and slight mechanical relaxation during the HPPC test sequence. The observed errors are primarily attributed to measurement uncertainty in HPPC voltage response, temperature variations during testing, and the empirical nature of the calibration relationship [48,50]. It is noted that internal resistance is temperature-dependent [50], and the force–resistance calibration in Equation (3) is therefore strictly valid within this narrow, near-isothermal range. Additional HPPC calibration across a range of temperatures is needed to extend the model, as discussed in Section 4.5.
Figure 4.
Force–resistance relationships at different SOCs: (a) 25% SOC, (b) 50% SOC, (c) 75% SOC.
Table 1.
SOC-dependent fitting parameters for preload force estimation.
Table 2.
Validation of preload force estimation in the case of 3 kN preload force.
The preload force applied to battery cells in mechanically constrained configurations directly influences the internal electrochemical–mechanical state by altering electrode porosity, interfacial contact resistance, and ionic transport pathways [15,17]. In principle, increasing preload can reduce interfacial contact resistance by closing microscopic gaps at the electrode/current collector and electrode/separator interfaces. In our cells, however, internal resistance is observed to increase with increasing preload force across the tested range, suggesting that the reduction in pore connectivity and the resulting increase in ionic transport resistance may outweigh the benefits of reduced contact resistance. Confirming this hypothesis and separating the contact and transport resistance contributions would require electrochemical impedance spectroscopy (EIS) measurements under varying preload, which we identify as a direction for future work.
4.2. Results of Cell Thickness Prediction
Compared to our previous study [23], we introduce an additional pressure level of 0.201 MPa, corresponding to a 3 kN preload force, applied at the beginning of discharge to validate the cell thickness prediction model and improve its accuracy. This level was chosen because 3 kN is the operational preload force recommended by the manufacturer. In total, four pressure levels are used to construct the partial molar volume surface, while this additional level is reserved specifically for validation. Experimental thickness change for partial molar volume Ω(c,P) calibration is measured at applied pressures of 0 MPa, 0.164 MPa, 0.256 MPa, and 0.612 MPa.
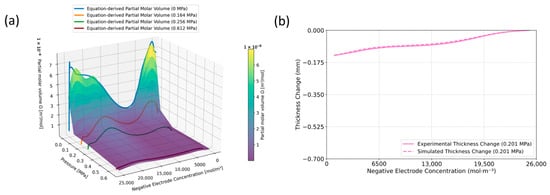
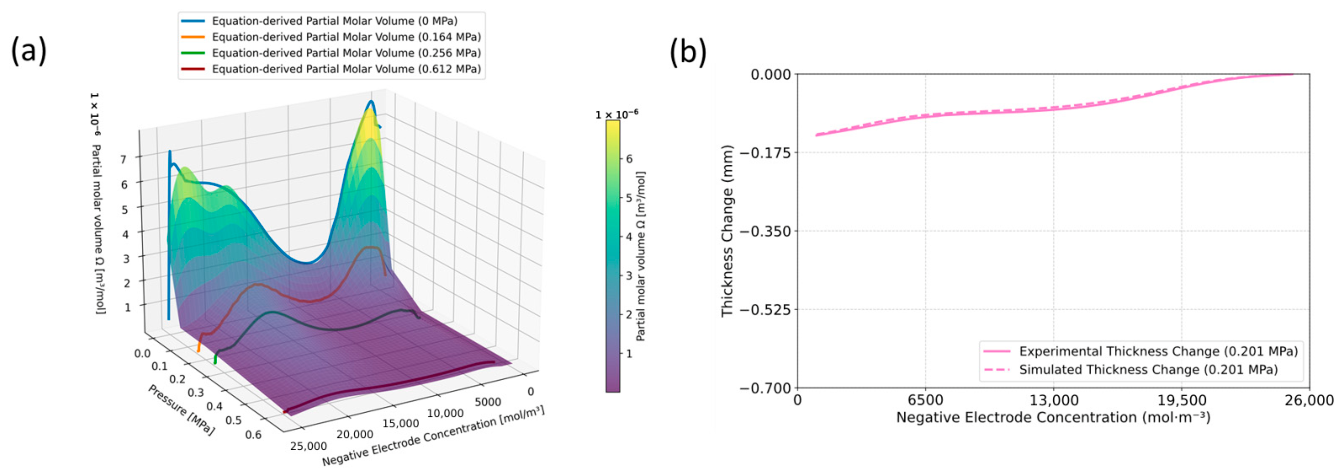
Figure 5a shows an interpolated [T](c,P) surface, which characterizes the variation in partial molar volumes Ω(c,P) with both concentration and pressure [45,51,52,53]. A detailed description of the physical motivation and formulation of Ω(c,P) is provided in our previous work [23]. Table 3 shows the mean absolute percentage error (MAPE) analysis of the surface-fitted and equation-derived partial molar volumes Ω(c,P) at applied pressures. The simulated cell thickness change at 0.201 MPa during 1C discharge is obtained by substituting the corresponding parameters into the previously derived constrained swelling equation [23]. Figure 5b compares this result against experimental data at 0.201 MPa, showing a MAPE of 5.63%.
Figure 5.
(a) Interpolated partial molar volume surface of [T](c,P), (b) comparison between simulated and experimental cell thickness changes at an applied pressure of 0.201 MPa during 1C discharge.
Table 3.
MAPE analysis of surface-fitted and equation-derived partial molar volume Ω(c,P).
4.3. Results of Spring Stiffness Characterization
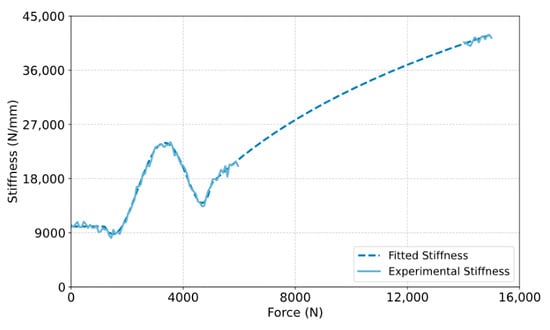
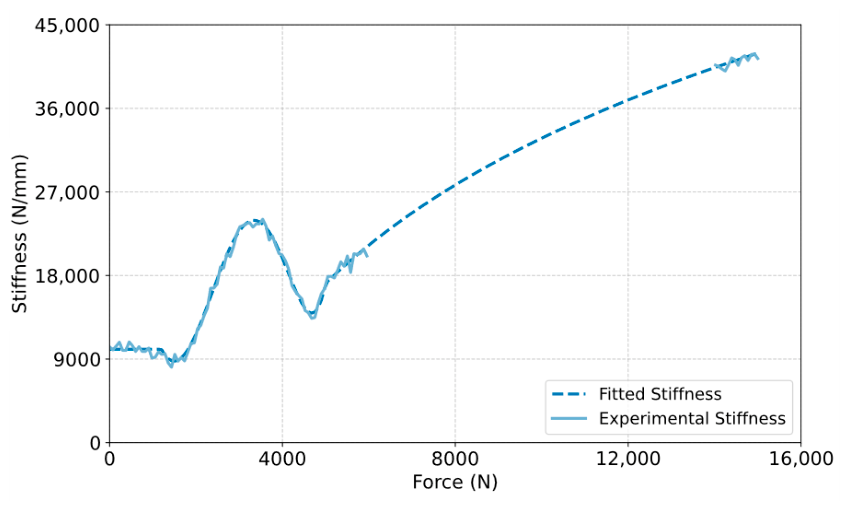
Figure 6 presents the stiffness–force relationship derived from experimental compression data, showing strong agreement between simulated and experimental results. The fitted model achieves a MAPE of 2.43% across the characterized force range, confirming that the segmented modeling approach adequately captures the essential nonlinear characteristics. This characteristic nonlinearity is typical of disk spring assemblies and must be captured for force prediction under varying compression states [54,55].
Figure 6.
Comparison of simulated and experimental spring stiffness.
The stiffness exhibits nonlinear behavior with three distinct regimes in the force range from 0 to 15 kN. The first regime, ranging from 0 to 2 kN, shows relatively constant stiffness at approximately 10 kN/mm, corresponding to elastic compression of the disk spring. The second regime, ranging from 2 to 5 kN, is a transition zone featuring a peak stiffness of approximately 24 kN/mm followed by a temporary reduction. The third regime, occurring at forces above 6 kN, shows progressive stiffening with stiffness values reaching 26 to 42 kN/mm due to increasing coil contact and geometric effects. Due to experimental limitations, experimental data in the force range between 6 and 14 kN are not available. To conclude, we assume that the constant-stiffness function represents near-linear elastic compression at low force, the polynomial function captures the transitional nonlinear seating behavior between disk-spring elements at intermediate force, and the contact-based function represents progressive geometric stiffening as inter-disk clearances close at high force. The segmented model provides continuous predictions across the entire range based on the characterized boundary behavior.
4.4. Model Validation
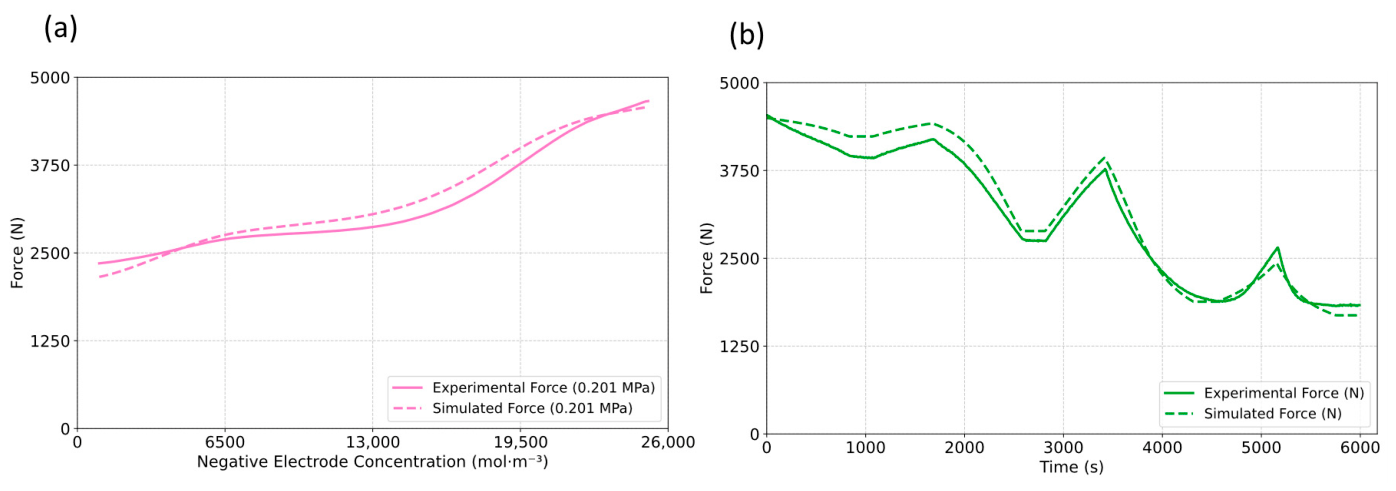
Figure 7a presents the comparison between simulated and experimental force evolution during 1C discharge at 0.201 MPa. The initial preload force is estimated from HPPC internal resistance measurements using the calibrated relationship from Section 3.1 at 75% SOC. To derive the preload force at 100% SOC, the swelling function calculates the thickness change from 75% to 100% SOC at 1C charging current, which is then multiplied by the spring stiffness to determine the corresponding force change. Adding this force change to the initial value yields the preload force at 100% SOC, which serves as the baseline preload force. The simulation captures the force evolution throughout the discharge process, achieving a MAPE of 4.48% compared with experimental measurements. The force decreases progressively during discharge as lithium de-intercalation causes electrode contraction. The observed error may be attributed to the assumption of uniform pressure distribution across the cell surface, whereas actual cells exhibit pressure gradients due to electrode edge effects and local inhomogeneities in electrode thickness and porosity [37].
Figure 7.
Comparison of simulated and experimental force evolution at initial pressure of 0.201 MPa: (a) 1C discharge phase, (b) multi-phase driving cycle conditions.
Figure 7b compares the simulated and experimental force evolution throughout the multi-phase driving cycle conditions. The model achieves a MAPE of 7.02% across the complete profile, demonstrating robust prediction capability under dynamic operating conditions. The prediction accuracy is further evaluated for the urban, suburban, rural, and highway phases, as summarized in Table 4. The corresponding MAPEs are 7.66%, 8.60%, 5.06%, and 6.44%, respectively. The results demonstrate that the proposed model maintains a relatively consistent prediction accuracy across the different driving conditions, with the lowest prediction error observed during the rural phase. During the discharge phase, the force exhibits characteristic decreases due to de-intercalation induced contraction. During rest periods, partial force relaxation occurs as concentration gradients equilibrate within the electrode structure. Upon charging, the force progressively increases as lithium intercalates into the graphite anode. The magnitude of force changes scales appropriately with discharge current magnitude, with larger force increases observed during the high-rate highway discharge phase compared with the lower-rate urban phase, confirming that the model captures the rate-dependent mechanical response [11,56].
Table 4.
MAPE analysis of multi-phase driving cycle conditions.
4.5. Model Limitation
While the proposed framework demonstrates good predictive accuracy under the tested conditions, several limitations should be acknowledged when considering its practical viability. First, the model assumes a spatially uniform pressure distribution across the cell surface. However, practical modules may experience non-uniform compression due to plate bending, manufacturing tolerances, and cell or fixture misalignment, which can produce localized pressure concentrations not captured by the uniform pressure assumption. This is identified as a limitation of the present framework and a direction for future refinement. Second, the current framework is calibrated and validated under near-isothermal conditions (ambient temperature within ±1 °C) and at fixed current rates. The temperature and C-rate dependence of internal resistance and swelling behavior are not explicitly quantified, which may limit accuracy under conditions with significant thermal variation. Third, the model captures only reversible swelling in fresh cells and does not account for irreversible mechanisms such as SEI layer growth, gas generation, lithium plating, or cumulative plastic deformation of the constraint system. As a result, its applicability to aged cells or long-term lifetime prediction is not yet established.
5. Conclusions
This study develops a comprehensive electrochemical-mechanical modeling framework for predicting compression force in mechanically constrained LIB systems without requiring real-time sensors during operation. The framework achieves force prediction through the integration of three coupled components: preload estimation from internal resistance measurements, P2D-based thickness prediction under mechanical constraints, and dynamic force calculation using calibrated nonlinear constraint stiffness characteristics. This approach requires electrical cycling data routinely available in battery management systems, providing a cost-effective solution for real-time force monitoring in electric vehicle battery modules.
Experimental validation on commercial 75 Ah NMC-631/graphite prismatic cells at an average pressure of 0.201 MPa demonstrates robust performance across all framework components. Preload force estimation from internal resistance measurements achieves relative errors below 6.5% at three representative SOC levels. The P2D model predicts cell thickness changes with 5.63% MAPE during 1C discharge. Spring stiffness characterization captures the nonlinear force–displacement relationship with a MAPE of 2.43%. Integrating these components yields total force prediction accuracy of 4.48% MAPE under 1C discharge at 0.201 MPa and 7.02% MAPE during multi-phase driving cycle conditions, demonstrating the framework’s capability to capture force dynamics under both laboratory and real-world cycling conditions. It is worth noting that this work serves as a foundational step toward validating the principle of compression force prediction, with current limitations including the absence of temperature, C-rate, and aging effects such as SEI layer growth and irreversible volume changes. Near-term extensions will focus on temperature and C-rate dependencies, while aging integration and broader chemistry validation remain longer-term research directions.
This study bridges the gap for compression force estimation without real-time sensors in practical battery applications. By extending the previously developed P2D-based swelling prediction model with preload force estimation and stiffness characterization, the framework provides a comprehensive coupled electrochemical–mechanical model for force monitoring in mechanically constrained battery systems. This approach is essential for real-time force monitoring in battery modules and for paving the way for future research into safety assessment capabilities through force predictions and optimizations.
Author Contributions
J.Y.: Conceptualization; Data Curation; Formal Analysis; Investigation; Methodology; Validation; Visualization; Writing—Original Draft. C.D.: Investigation; Project Administration; Writing—Review and Editing. M.S.: Investigation; Writing—Review and Editing. M.F.: Investigation; Writing—Review and Editing. P.H.: Conceptualization; Funding Acquisition; Supervision; Writing—Review and Editing. C.E.: Funding Acquisition; Supervision; Writing—Review and Editing. All authors have read and agreed to the published version of the manuscript.
Funding
This research is conducted under the NEMO project, funded by the European Union’s Horizon Europe programme (Grant Agreement No. 101102944).
Data Availability Statement
The datasets presented during this study are available on Zenodo [https://doi.org/10.5281/zenodo.22079386] (created 24 August 2026). Due to a non-disclosure agreement within the project, the files will be made publicly available on 31 October 2026.
Acknowledgments
The authors thank their NEMO project consortium partners for their input, with particular thanks to IAV for technical support. The authors used Claude Sonnet 5 and GPT-5.6 Luna for grammar and spelling checks during preparation of this manuscript, and reviewed and edited all resulting content. They take full responsibility for the published text.
Conflicts of Interest
Authors Patrick Höschele and Christian Ellersdorfer were employed by the company Battery4Life GmbH. The remaining authors declare that the research was conducted in the absence of any commercial or financial relationships that could be construed as potential conflicts of interest.
Appendix A. Geometric and Gravimetric Analysis
In this study, light microscopy measurements are used to determine the dimensions of the individual cell components. Each layer, including the anode, cathode, current collector, and separator, is individually embedded, ground, and polished prior to imaging. Layer thickness is determined by averaging measurements taken at 12 to 16 points per sample. Figure A1 shows representative light microscopy images illustrating the measured dimensions of the anode, cathode and separator layers.
Figure A1.
Light microscopy characterization results: (a) anode, (b) cathode, (c) separator.
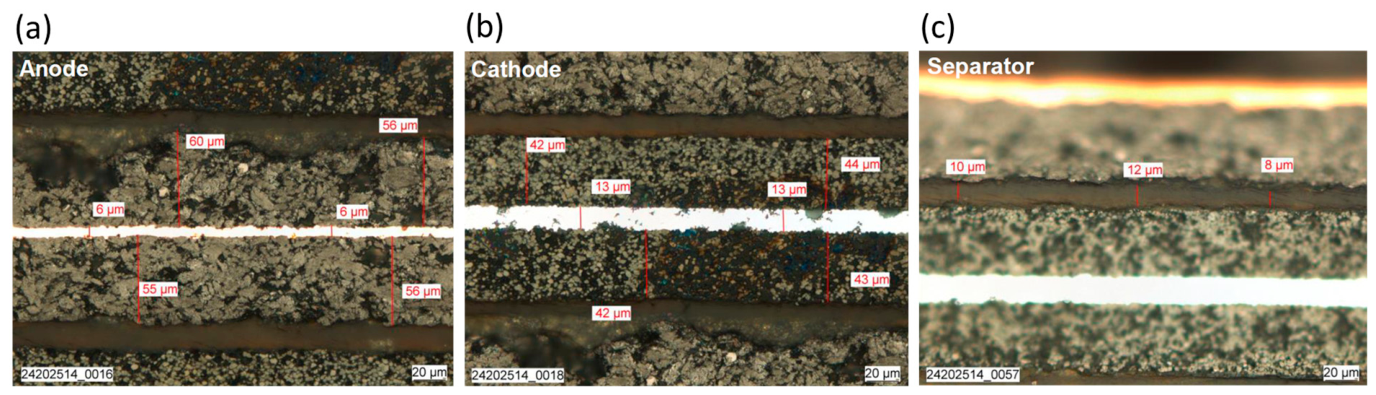
The thicknesses of the cell components determined by light microscopy characterization are summarized in Table A1.
Table A1.
Thickness of cell components determined by light microscopy.
Table A2 summarizes the gravimetrically determined mass of each cell component. Copper and aluminum current collector masses are calculated using densities of 8960 kg/m3 and 2700 kg/m3 respectively.
Table A2.
Mass of cell components determined by gravimetric measurement.
References
- Koech, A.K.; Mwandila, G.; Mulolani, F. A review of improvements on electric vehicle battery. Heliyon 2024, 10, e34806. [Google Scholar] [CrossRef] [Scilit] [PubMed]
- Kwak, E.; Du Son, S.; Jeong, S.; Oh, K.-Y. Characterization of the mechanical responses of a LiFePO4 battery under different operating conditions. J. Energy Storage 2020, 28, 101269. [Google Scholar] [CrossRef] [Scilit]
- Nasajpour-Esfahani, N.; Garmestani, H.; Bagheritabar, M.; Jasim, D.J.; Toghraie, D.; Dadkhah, S.; Firoozeh, H. Comprehensive review of lithium-ion battery materials and development challenges. Renew. Sustain. Energy Rev. 2024, 203, 114783. [Google Scholar] [CrossRef] [Scilit]
- Höschele, P.; Heindl, S.F.; Erker, S.; Ellersdorfer, C. Influence of reversible swelling and preload force on the failure behavior of a lithium-ion pouch cell tested under realistic boundary conditions. J. Energy Storage 2023, 65, 107228. [Google Scholar] [CrossRef] [Scilit]
- Cannarella, J.; Arnold, C.B. Stress evolution and capacity fade in constrained lithium-ion pouch cells. J. Power Sources 2014, 245, 745–751. [Google Scholar] [CrossRef] [Scilit]
- Höschele, P.; Ellersdorfer, C. Implementing Reversible Swelling into the Numerical Model of a Lithium-Ion Pouch Cell for Short Circuit Prediction. Batteries 2023, 9, 417. [Google Scholar] [CrossRef] [Scilit]
- Cao, Y.; Wang, H.; Liu, B. Multi-scale swelling behaviors and mechanisms of graphite electrode-based lithium-ion battery at various charging rates. J. Power Sources 2024, 606, 234504. [Google Scholar] [CrossRef] [Scilit]
- Garrick, T.R.; Miao, Y.; Macciomei, E.; Fernandez, M.; Weidner, J.W. Quantifying Aging-Induced Irreversible Volume Change of Porous Electrodes. J. Electrochem. Soc. 2023, 170, 100513. [Google Scholar] [CrossRef] [Scilit]
- Niu, Z.; Sun, Z.; Zhang, S.; Xia, Y. Model development for predicting irreversible swelling of aged lithium iron phosphate/graphite pouch cells under different pressures and temperatures. J. Power Sources 2025, 641, 236884. [Google Scholar] [CrossRef] [Scilit]
- Hahn, S.; Theil, S.; Kroggel, J.; Birke, K.P. Pressure Prediction Modeling and Validation for Lithium-Ion Pouch Cells in Buffered Module Assemblies. J. Energy Storage 2021, 40, 102517. [Google Scholar] [CrossRef] [Scilit]
- Sauerteig, D.; Hanselmann, N.; Arzberger, A.; Reinshagen, H.; Ivanov, S.; Bund, A. Electrochemical-mechanical coupled modeling and parameterization of swelling and ionic transport in lithium-ion batteries. J. Power Sources 2018, 378, 235–247. [Google Scholar] [CrossRef] [Scilit]
- Deich, T.; Storch, M.; Steiner, K.; Bund, A. Effects of module stiffness and initial compression on lithium-ion cell aging. J. Power Sources 2021, 506, 230163. [Google Scholar] [CrossRef] [Scilit]
- Wang, M.J.; Choudhury, R.; Sakamoto, J. Characterizing the Li-Solid-Electrolyte Interface Dynamics as a Function of Stack Pressure and Current Density. Joule 2019, 3, 2165–2178. [Google Scholar] [CrossRef] [Scilit]
- Fasching, M.; Grollitsch, S.; Höschele, P.; Schmid, A.; Ellersdorfer, C. Investigating the mechanical in-plane characteristics of lithium-ion pouch cells under crush loads. J. Energy Storage 2024, 89, 111581. [Google Scholar] [CrossRef] [Scilit]
- Müller, V.; Scurtu, R.-G.; Memm, M.; Danzer, M.A.; Wohlfahrt-Mehrens, M. Study of the influence of mechanical pressure on the performance and aging of Lithium-ion battery cells. J. Power Sources 2019, 440, 227148. [Google Scholar] [CrossRef] [Scilit]
- Mussa, A.S.; Klett, M.; Lindbergh, G.; Lindström, R.W. Effects of external pressure on the performance and ageing of single-layer lithium-ion pouch cells. J. Power Sources 2018, 385, 18–26. [Google Scholar] [CrossRef] [Scilit]
- Müller, V.; Scurtu, R.-G.; Richter, K.; Waldmann, T.; Memm, M.; Danzer, M.A.; Wohlfahrt-Mehrens, M. Effects of Mechanical Compression on the Aging and the Expansion Behavior of Si/C-Composite|NMC811 in Different Lithium-Ion Battery Cell Formats. J. Electrochem. Soc. 2019, 166, A3796–A3805. [Google Scholar] [CrossRef] [Scilit]
- Xie, S.; Ren, L.; Yang, X.; Wang, H.; Sun, Q.; Chen, X.; He, Y. Influence of cycling aging and ambient pressure on the thermal safety features of lithium-ion battery. J. Power Sources 2020, 448, 227425. [Google Scholar] [CrossRef] [Scilit]
- Chen, H.; Zhang, P.; Wu, Y.; Huang, Y. A comprehensive analysis of preload force effects on the opening of safety valves and thermal runaway behavior in prismatic batteries. J. Energy Storage 2025, 105, 114693. [Google Scholar] [CrossRef] [Scilit]
- Yin, J.; Drießen, C.; Klink, R.; Kizio, S.; Moser, J.; Ellersdorfer, C.; Höschele, P. Implementation of gas formation into a finite-element model for the mechanical swelling simulation of lithium-ion batteries. J. Energy Storage 2026, 150, 120376. [Google Scholar] [CrossRef] [Scilit]
- Barai, A.; Tangirala, R.; Uddin, K.; Chevalier, J.; Guo, Y.; McGordon, A.; Jennings, P. The effect of external compressive loads on the cycle lifetime of lithium-ion pouch cells. J. Energy Storage 2017, 13, 211–219. [Google Scholar] [CrossRef] [Scilit]
- Cai, X.; Zhang, C.; Chen, J.; Chen, Z.; Zhang, L.; Sauer, D.U.; Li, W. Sensorless battery expansion estimation using electromechanical coupled models and machine learning. J. Energy Chem. 2025, 105, 142–157. [Google Scholar] [CrossRef] [Scilit]
- Yin, J.; Drießen, C.; Schinagl, M.; Gebregeorgis, T.H.; Meeusen, M.; Mamme, M.H.; Höschele, P.; Ellersdorfer, C. Development of a P2D-based model for battery swelling prediction under mechanical constraints. J. Power Sources 2026, 677, 240029. [Google Scholar] [CrossRef] [Scilit]
- Wu, J.; Ai, W. Simplified Pseudo Two-Dimensional Model for Stress Evolution of Lithium-Ion Battery Electrodes Under Practical Loadings. J. Electrochem. Soc. 2026, 173, 30504. [Google Scholar] [CrossRef] [Scilit]
- Zhao, Y.; Stein, P.; Bai, Y.; Al-Siraj, M.; Yang, Y.; Xu, B.-X. A review on modeling of electro-chemo-mechanics in lithium-ion batteries. J. Power Sources 2019, 413, 259–283. [Google Scholar] [CrossRef] [Scilit]
- von Kessel, O.; Hoehl, T.; Heugel, P.; Brauchle, F.; Vrankovic, D.; Birke, K.P. Electrochemical-Mechanical Parameterization and Modeling of Expansion, Pressure, and Porosity Evolution in NMC811∣SiOx-Graphite Lithium-Ion Cells. J. Electrochem. Soc. 2023, 170, 90534. [Google Scholar] [CrossRef] [Scilit]
- Rieger, B.; Schlueter, S.; Erhard, S.V.; Schmalz, J.; Reinhart, G.; Jossen, A. Multi-scale investigation of thickness changes in a commercial pouch type lithium-ion battery. J. Energy Storage 2016, 6, 213–221. [Google Scholar] [CrossRef] [Scilit]
- Chai, Z.; Liu, Z.; Xue, Q.; Xiao, Y.; Tan, P.; Qiu, M.; Li, J. Efficient coupled mechanical-electrical-thermal modeling and safety assessment of lithium-ion battery under mechanical abuse. J. Energy Storage 2025, 114, 115917. [Google Scholar] [CrossRef] [Scilit]
- Xu, H.; Zhu, J.; Finegan, D.P.; Zhao, H.; Lu, X.; Li, W.; Hoffman, N.; Bertei, A.; Shearing, P.; Bazant, M.Z. Guiding the Design of Heterogeneous Electrode Microstructures for Li-Ion Batteries: Microscopic Imaging, Predictive Modeling, and Machine Learning. Adv. Energy Mater. 2021, 11, 2003908. [Google Scholar] [CrossRef] [Scilit]
- Pistorio, F.; Clerici, D.; Somà, A. POLIDEMO: An electrochemical-mechanical framework for modeling lithium-ion batteries degradation. Appl. Energy 2026, 404, 126744. [Google Scholar] [CrossRef] [Scilit]
- Doyle, M.; Fuller, T.F.; Newman, J. Modeling of Galvanostatic Charge and Discharge of the Lithium/Polymer/Insertion Cell. J. Electrochem. Soc. 1993, 140, 1526–1533, Erratum in J. Electrochem. Soc. 2018, 165, X13. https://doi.org/10.1149/2.1181811jes. [Google Scholar] [CrossRef] [Scilit]
- Fuller, T.F.; Doyle, M.; Newman, J. Simulation and Optimization of the Dual Lithium Ion Insertion Cell. J. Electrochem. Soc. 1994, 141, 1–10. [Google Scholar] [CrossRef] [Scilit]
- Christensen, J.; Newman, J. Stress generation and fracture in lithium insertion materials. J. Solid State Electrochem. 2006, 10, 293–319. [Google Scholar] [CrossRef] [Scilit]
- Zhang, X.; Shyy, W.; Sastry, A.M. Numerical Simulation of Intercalation-Induced Stress in Li-Ion Battery Electrode Particles. J. Electrochem. Soc. 2007, 154, A910. [Google Scholar] [CrossRef] [Scilit]
- Rieger, B.; Erhard, S.V.; Rumpf, K.; Jossen, A. A New Method to Model the Thickness Change of a Commercial Pouch Cell during Discharge. J. Electrochem. Soc. 2016, 163, A1566–A1575. [Google Scholar] [CrossRef] [Scilit]
- Kwak, E.; Jeong, S.; Kim, J.-H.; Oh, K.-Y. Prediction of compression force evolution over degradation for a lithium-ion battery. J. Power Sources 2021, 483, 229079. [Google Scholar] [CrossRef] [Scilit]
- Michelini, E.; Höschele, P.; Heindl, S.F.; Erker, S.; Ellersdorfer, C. Experimental Investigation on Reversible Swelling Mechanisms of Lithium-Ion Batteries under a Varying Preload Force. Batteries 2023, 9, 218. [Google Scholar] [CrossRef] [Scilit]
- Bonkile, M.P.; Jiang, Y.; Kirkaldy, N.; Sulzer, V.; Timms, R.; Wang, H.; Offer, G.; Wu, B. Coupled electrochemical-thermal-mechanical stress modelling in composite silicon/graphite lithium-ion battery electrodes. J. Energy Storage 2023, 73, 108609. [Google Scholar] [CrossRef] [Scilit]
- Zhang, J.; Kang, B.; Luo, Q.; Zou, S. Effects of Pressure Evolution on the Decrease in the Capacity of Lithium-Ion Batteries. Int. J. Electrochem. Sci. 2020, 15, 8422–8436. [Google Scholar] [CrossRef] [Scilit]
- Liu, S.; Li, X.; Li, J.; Shi, J.; Fan, X.; Cong, Z.; Feng, X.; Li, H.; Wang, W.; Jiang, J.; et al. Expansion Pressure as a Probe for Mechanical Degradation in LiFePO4 Prismatic Batteries. Batteries 2025, 11, 391. [Google Scholar] [CrossRef] [Scilit]
- Leonard, A.; Planden, B.; Lukow, K.; Morrey, D. Investigation of constant stack pressure on lithium-ion battery performance. J. Energy Storage 2023, 72, 108422. [Google Scholar] [CrossRef] [Scilit]
- Pan, B.; Sun, J.; Zhao, X.; Liu, L.; Wang, L.; Pan, C.; Wang, Y. Identification of ohmic internal resistance of batteries based on cloud data. J. Energy Storage 2025, 120, 116364. [Google Scholar] [CrossRef] [Scilit]
- Permatasari, A.; So, M.; van Nguyen, L.; Yano, T.; Inoue, G. Porosity and tortuosity dynamics and their impact on lithium-ion battery performance with different separator structures. J. Power Sources 2025, 647, 237278. [Google Scholar] [CrossRef] [Scilit]
- Gupta, P.; Gudmundson, P. A multi-scale model for simulation of electrochemically induced stresses on scales of active particles, electrode layers, and battery level in lithium-ion batteries. J. Power Sources 2021, 511, 230465. [Google Scholar] [CrossRef] [Scilit]
- Clerici, D. Diffusion-induced stress amplification in phase-transition materials for electrodes of lithium-ion batteries. Int. J. Mech. Sci. 2024, 281, 109541. [Google Scholar] [CrossRef] [Scilit]
- Chen, R.; Li, X.; Yang, Z.; Xu, J.; Yang, H. Nonlinear behavior of disk spring with complex contact state. Sci. Prog. 2021, 104, 368504211052360. [Google Scholar] [CrossRef] [Scilit] [PubMed]
- Roering, P.; Overhoff, G.M.; Liu, K.L.; Winter, M.; Brunklaus, G. External Pressure in Polymer-Based Lithium Metal Batteries: An Often-Neglected Criterion When Evaluating Cycling Performance? ACS Appl. Mater. Interfaces 2024, 16, 21932–21942. [Google Scholar] [CrossRef] [Scilit] [PubMed]
- Sun, J.; Kainz, J. Optimization of hybrid pulse power characterization profile for equivalent circuit model parameter identification of Li-ion battery based on Taguchi method. J. Energy Storage 2023, 70, 108034. [Google Scholar] [CrossRef] [Scilit]
- Lee, G.; Yeon, J.; Kim, N.; Park, S. A comprehensive methodology for developing and evaluating driving cycles for electric vehicles using real-world data. eTransportation 2025, 24, 100409. [Google Scholar] [CrossRef] [Scilit]
- Schinagl, M.; Fasching, M.; Höschele, P.; Ellersdorfer, C. Impact of temperature on Li-ion battery impedance and compensation strategies. J. Power Sources 2025, 649, 237478. [Google Scholar] [CrossRef] [Scilit]
- Clerici, D.; Martelli, S.; Mocera, F.; Somà, A. Mechanical characterization of lithium-ion batteries with different chemistries and formats. J. Energy Storage 2024, 84, 110899. [Google Scholar] [CrossRef] [Scilit]
- Tu, Y.; Wu, B.; Ai, W.; Martínez-Pañeda, E. Influence of concentration-dependent material properties on the fracture and debonding of electrode particles with core–shell structure. J. Power Sources 2024, 603, 234395. [Google Scholar] [CrossRef] [Scilit]
- Iqbal, N.; Choi, J.; Lee, C.; Ayub, H.M.U.; Kim, J.; Kim, M.; Kim, Y.; Moon, D.; Lee, S. Effects of Diffusion-Induced Nonlinear Local Volume Change on the Structural Stability of NMC Cathode Materials of Lithium-Ion Batteries. Mathematics 2022, 10, 4697. [Google Scholar] [CrossRef] [Scilit]
- Ma, K.; Zhou, Y.; Lu, D. Theoretical and experimental investigation on disc spring isolation system with loading rings. Soil Dyn. Earthq. Eng. 2023, 165, 107655. [Google Scholar] [CrossRef] [Scilit]
- Gilmore, P.; Gandhi, U.; Singh, R. Effect of disk-to-disk variations on the nonlinear static characteristics and stability regimes of coned disk spring stacks: Experimental and computational studies of quasi-zero-stiffness isolators. Mech. Syst. Signal Process. 2024, 219, 111609. [Google Scholar] [CrossRef] [Scilit]
- Yuan, C.; Hahn, Y.; Lu, W.; Oancea, V.; Xu, J. Quantification of electrochemical-mechanical coupling in lithium-ion batteries. Cell Rep. Phys. Sci. 2022, 3, 101158. [Google Scholar] [CrossRef] [Scilit]

Disclaimer/Publisher’s Note: The statements, opinions and data contained in all publications are solely those of the individual author(s) and contributor(s) and not of MDPI and/or the editor(s). MDPI and/or the editor(s) disclaim responsibility for any injury to people or property resulting from any ideas, methods, instructions or products referred to in the content. |
© 2026 by the authors. Licensee MDPI, Basel, Switzerland. This article is an open access article distributed under the terms and conditions of the Creative Commons Attribution (CC BY) license.