


Abstract
Batteries are regarded as a uniform heat source in traditional thermal management system design. Inconsistencies in electrochemical reactions across time and space are often ignored, which leads to an unreasonable battery thermal management system. This paper establishes a 2D electro-thermal fully coupled model based on the Kim model and NTGK model for a high-capacity blade battery. Based on the experimental results, the accuracy of the model was verified by examining terminal voltage, average battery temperature, and temperature distribution. The distribution characteristics of physical fields within the battery were analyzed using the electro-thermal model. The results indicated that the distribution of electrochemical reaction rates inside the battery shows a clear boundary between the near-tab area and the middle positions. In the initial stage of discharge, the electrochemical reaction rates were higher around the tabs. However, the electrochemical reaction rates were higher around the middle positions at the end stage of discharge. Thus, we proposed two schemes, a three-zone model and a five-zone model for 3D thermal analysis, according to the distribution characteristics of the physical fields. We found that the difference in the prediction accuracy of temperature distribution between the two schemes was small. Therefore, we recommended the three-zone scheme for 3D thermal analysis, considering the complexity of the operation. These conclusions could provide a reference for a refined thermal management system design of large-sized blade batteries.
1. Introduction
The construction of a new power system dominated by new energy sources is a crucial pathway to achieving the goals of carbon peaking and carbon neutrality. However, green renewable energy sources, represented by wind and solar power, are inherently intermittent and volatile, posing significant challenges to the stable operation of power systems [1,2]. Novel energy storage technologies, which can enhance both the efficiency and reliability of power output from new energy sources, serve as critical pillars supporting new power systems [3,4,5]. In recent years, novel energy storage technologies, particularly those based on batteries, have experienced rapid development. Projections indicate that the installed capacity of battery energy storage systems (BESSs) reached 265 GWh in 2025 in China [6].
As the core component of BESSs, battery performance directly affects the safety, efficiency and reliability of the entire system. An efficient and reliable thermal management system is essential to ensure the continuous and safe operation of BESSs. However, conventional thermal management designs typically treat batteries as uniform heat-generating bodies with constant heat sources. This approach fails to account for the inconsistency of electrochemical reaction distributions across different time and spatial locations, leading to unreasonable system design. Consequently, such mismatches can degrade battery cycle life over extended operation periods [7]. BYD Energy Storage employs its unique large-sized, high-capacity blade battery as an energy storage unit, achieving a good balance between cost and energy density. Nevertheless, large-format energy storage batteries exhibit more pronounced inconsistencies in their electrochemical distributions compared with small-sized batteries. Liu et al. [8] investigated the non-uniform distribution of a pouch battery. They found that the maximum non-uniformity of temperature distribution during 1C discharge could reach 0.8. Lin et al. [9] created a 3D electrochemical–thermal model to understand the non-uniform thermal characteristics of pouch cells. The temperature gradient distribution showed a deviation of 64.0/62.1% at 5 °C discharge. Such heterogeneity inevitably leads to inconsistencies in both thermal and aging patterns, ultimately compromising the operational lifespan of the BESS [10].
Traditional design methods are insufficient to meet the refined thermal design requirements of large-sized blade batteries, and the temperature consistency of blade batteries needs to be further improved.
Zhang et al. [11] established a 1D-3D electro-thermal coupling model for a 280 Ah energy storage battery to analyze the temperature distribution of a single battery under natural heat dissipation conditions. However, in this approach, the coupling between the 1D electrochemical model and the 3D thermal model relies solely on the average temperature and average heat generation rate, which fails to capture the spatial heterogeneity of electrochemical reactions. In order to obtain the physical field distribution information inside the battery, Mei et al. [12] employed a fully coupled 3D electrochemical–thermal model to simulate the spatial evolution process of the electrochemical reaction inside a 18.5 Ah prismatic battery. Their results revealed that the potential gradient and temperature gradient near the tab area were large, and the electrochemical reaction had obvious uneven distribution on the current collector surface. Similarly, Lin et al. [13] established a 3D-3D electrochemical–thermal coupling model for a 280 Ah large-sized energy storage battery and analyzed the variations in potential, heat generation rate and current density on the current collector under different depths of discharge. The results showed significant temporal and spatial inconsistency in the electrochemical reaction. Nevertheless, the fully 3D coupling model is not suitable for engineering due to its large number of parameters, the difficulty in obtaining them, and the high computational cost associated with solving numerous partial differential equations. To address these limitations, Ding et al. [14] established a 2D-2D electrical–thermal coupling model for a prismatic battery, where the electrical model was described by the NTGK model. By calculating the Poisson distribution of the potential of the collector, the distribution of the transfer current was obtained, followed by the distribution trend of the heat generation rate and temperature on the cell surface. However, this model does not account for the inconsistency in depth of discharge caused by non-uniform current distribution; therefore, the model cannot characterize the effects of collector conductance on the physical field distribution and is not suitable for large blade batteries. The 2D coupling model requires fewer parameters and involves less computation, making it more suitable for engineering applications. Moreover, the geometry of the blade battery is characterized by an extremely small thickness (27 mm) compared to its length (960 mm) and height (122 mm). The nominal current of a BYD blade battery is only 0.5C, which means the heat generation rate is relatively small. Therefore, the temperature gradient in the thickness direction is insignificant. The research emphasis of this work is specifically placed on resolving the in-plane spatial non-uniformity of the physical fields. Therefore, the model can be reasonably reduced to a 2D representation in this paper.
In summary, the traditional design methods of a thermal management system of BESSs consider the single battery a heating body with a uniform distribution of reaction rate in time and space and thus cannot meet the fine thermal management requirements of large-sized and high-capacity blade batteries. Furthermore, we also note that although the full 3D electrochemical–thermal coupled model can analyze the inconsistent distribution of chemical reaction rates in the battery, it requires numerous parameters and significant computing resources, which is not suitable for engineering calculations. To address this, this paper establishes a two-dimensional fully coupled electrochemical–thermal model for large-sized blade batteries. The accuracy of the model is verified by experimental results, and it offers significant advantages, including fewer model parameters and lower computational resource consumption. Using this model, the temporal and spatial non-uniformity of the electrochemical reaction rate in high-capacity blade batteries is analyzed. Based on the analysis of battery heat generation characteristics, the battery is segmented to facilitate a three-dimensional thermal analysis at the battery module level.
2. Electro-Thermal Coupling Model for Blade Battery
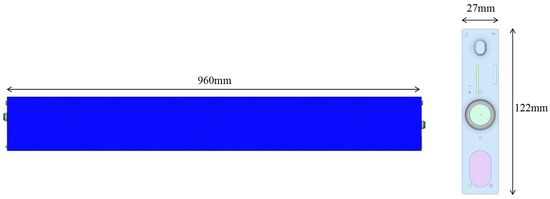
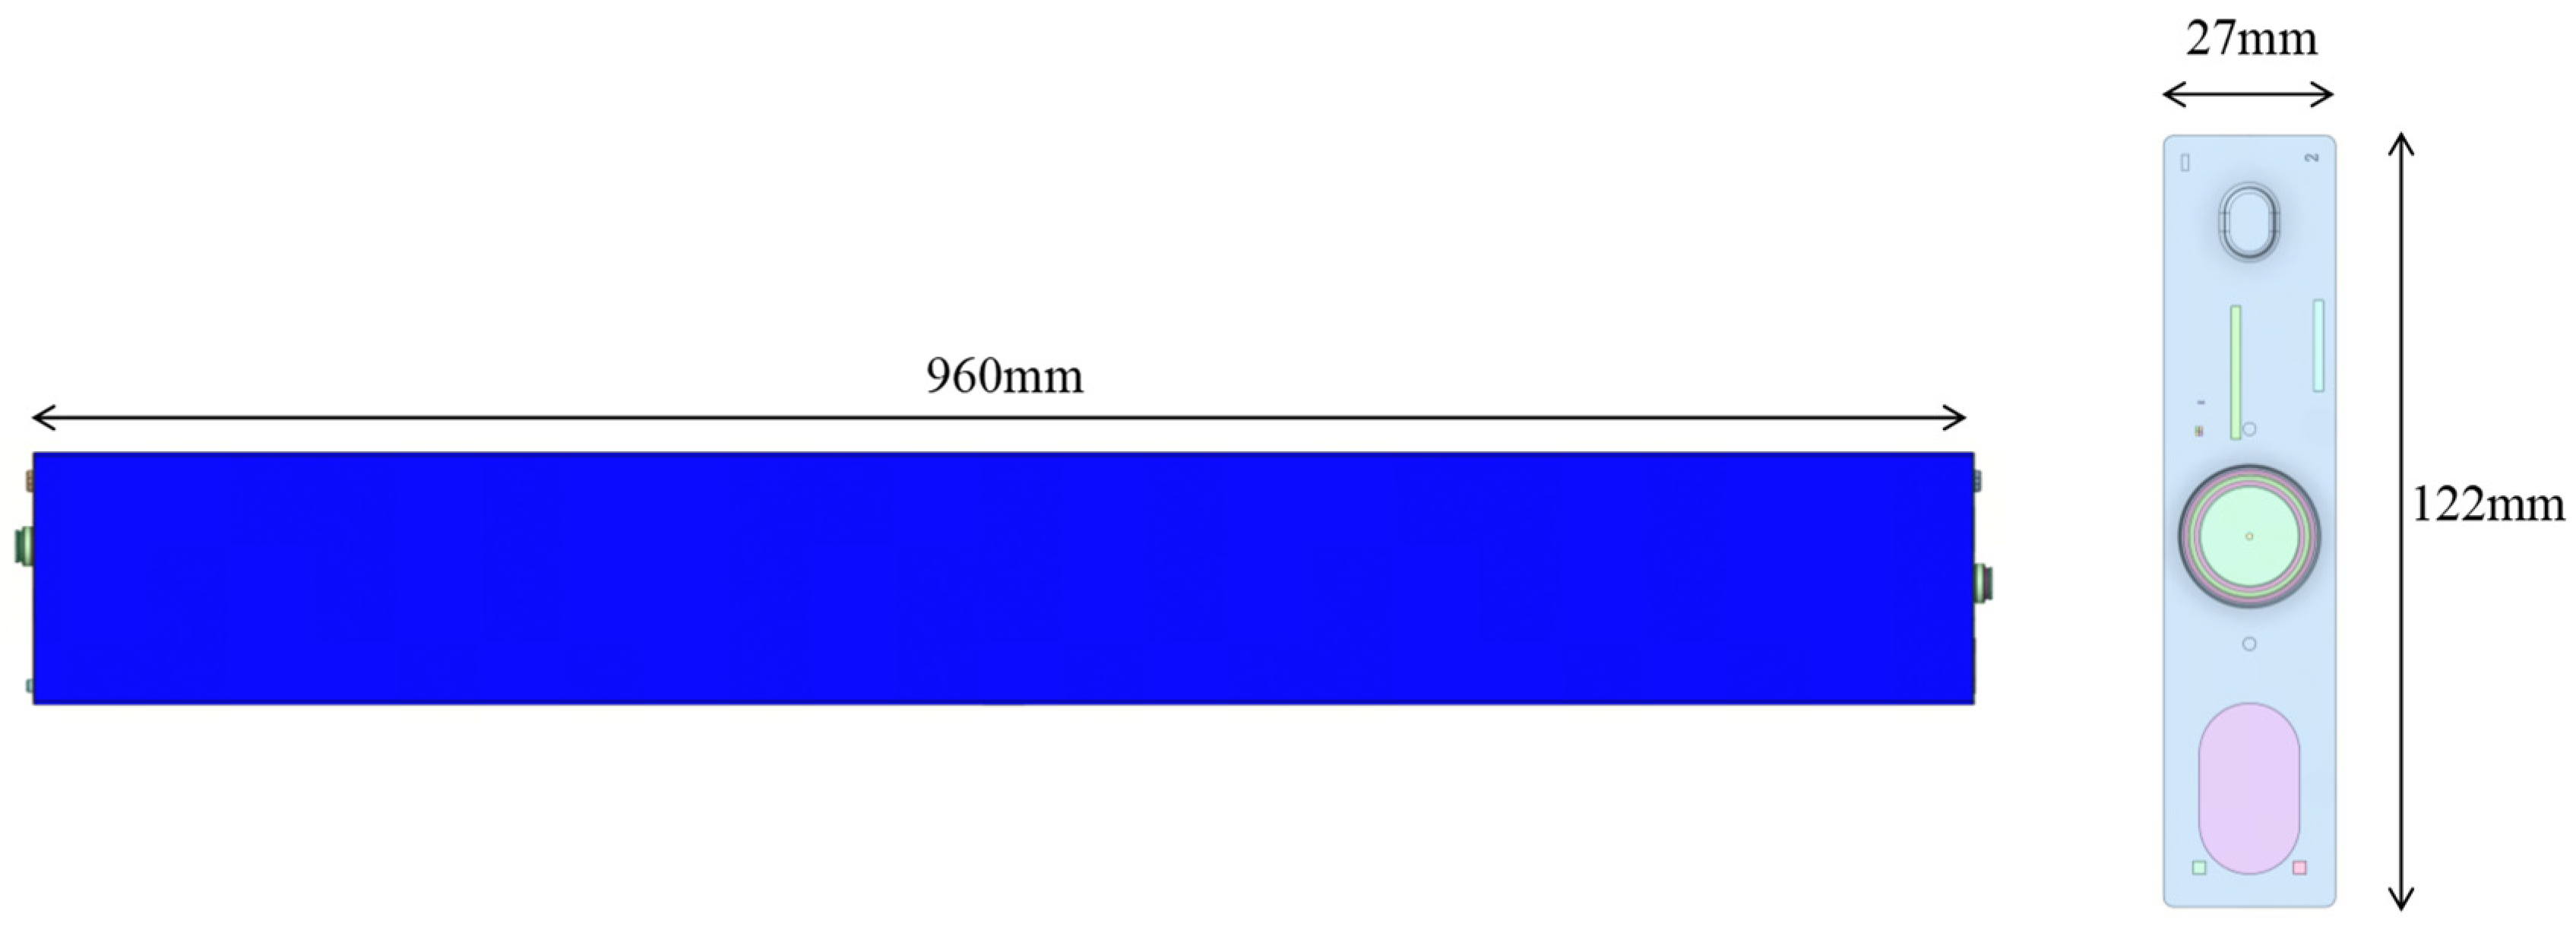
The battery studied in this paper is a blade battery produced by BYD Automotive Industry Co., Ltd. (Shenzhen, China), with a nominal capacity of 400 Ah, as shown in Figure 1. The length, height, and thickness of the blade battery are 960 mm, 122 mm, and 27 mm, respectively. Since the thickness direction of the battery (27 mm) is significantly smaller than its length (960 mm) and height (122 mm), the temperature and potential gradients along the thickness direction can be neglected. Therefore, the battery can be simplified to a two-dimensional model that only considers the heat transfer and electrochemical behavior in the plane defined by the length and height. This simplification substantially reduces computational cost without appreciably sacrificing accuracy.
Figure 1.
A scheme of the blade battery.
2.1. Electrical Model
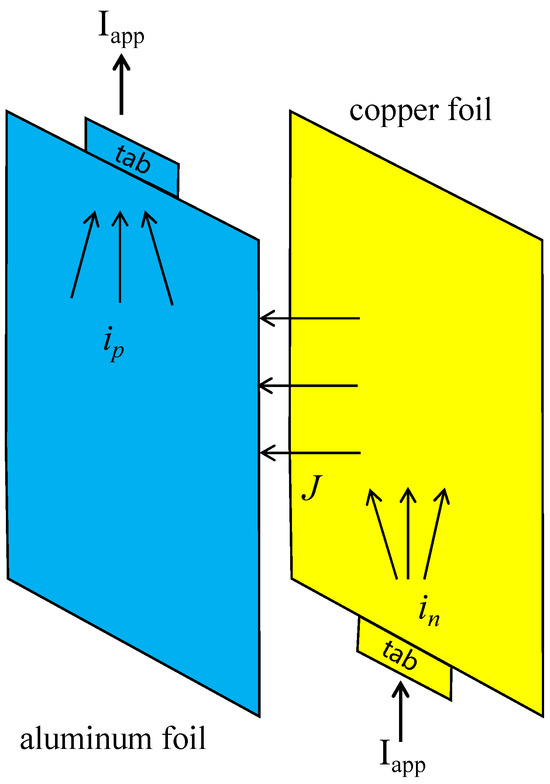
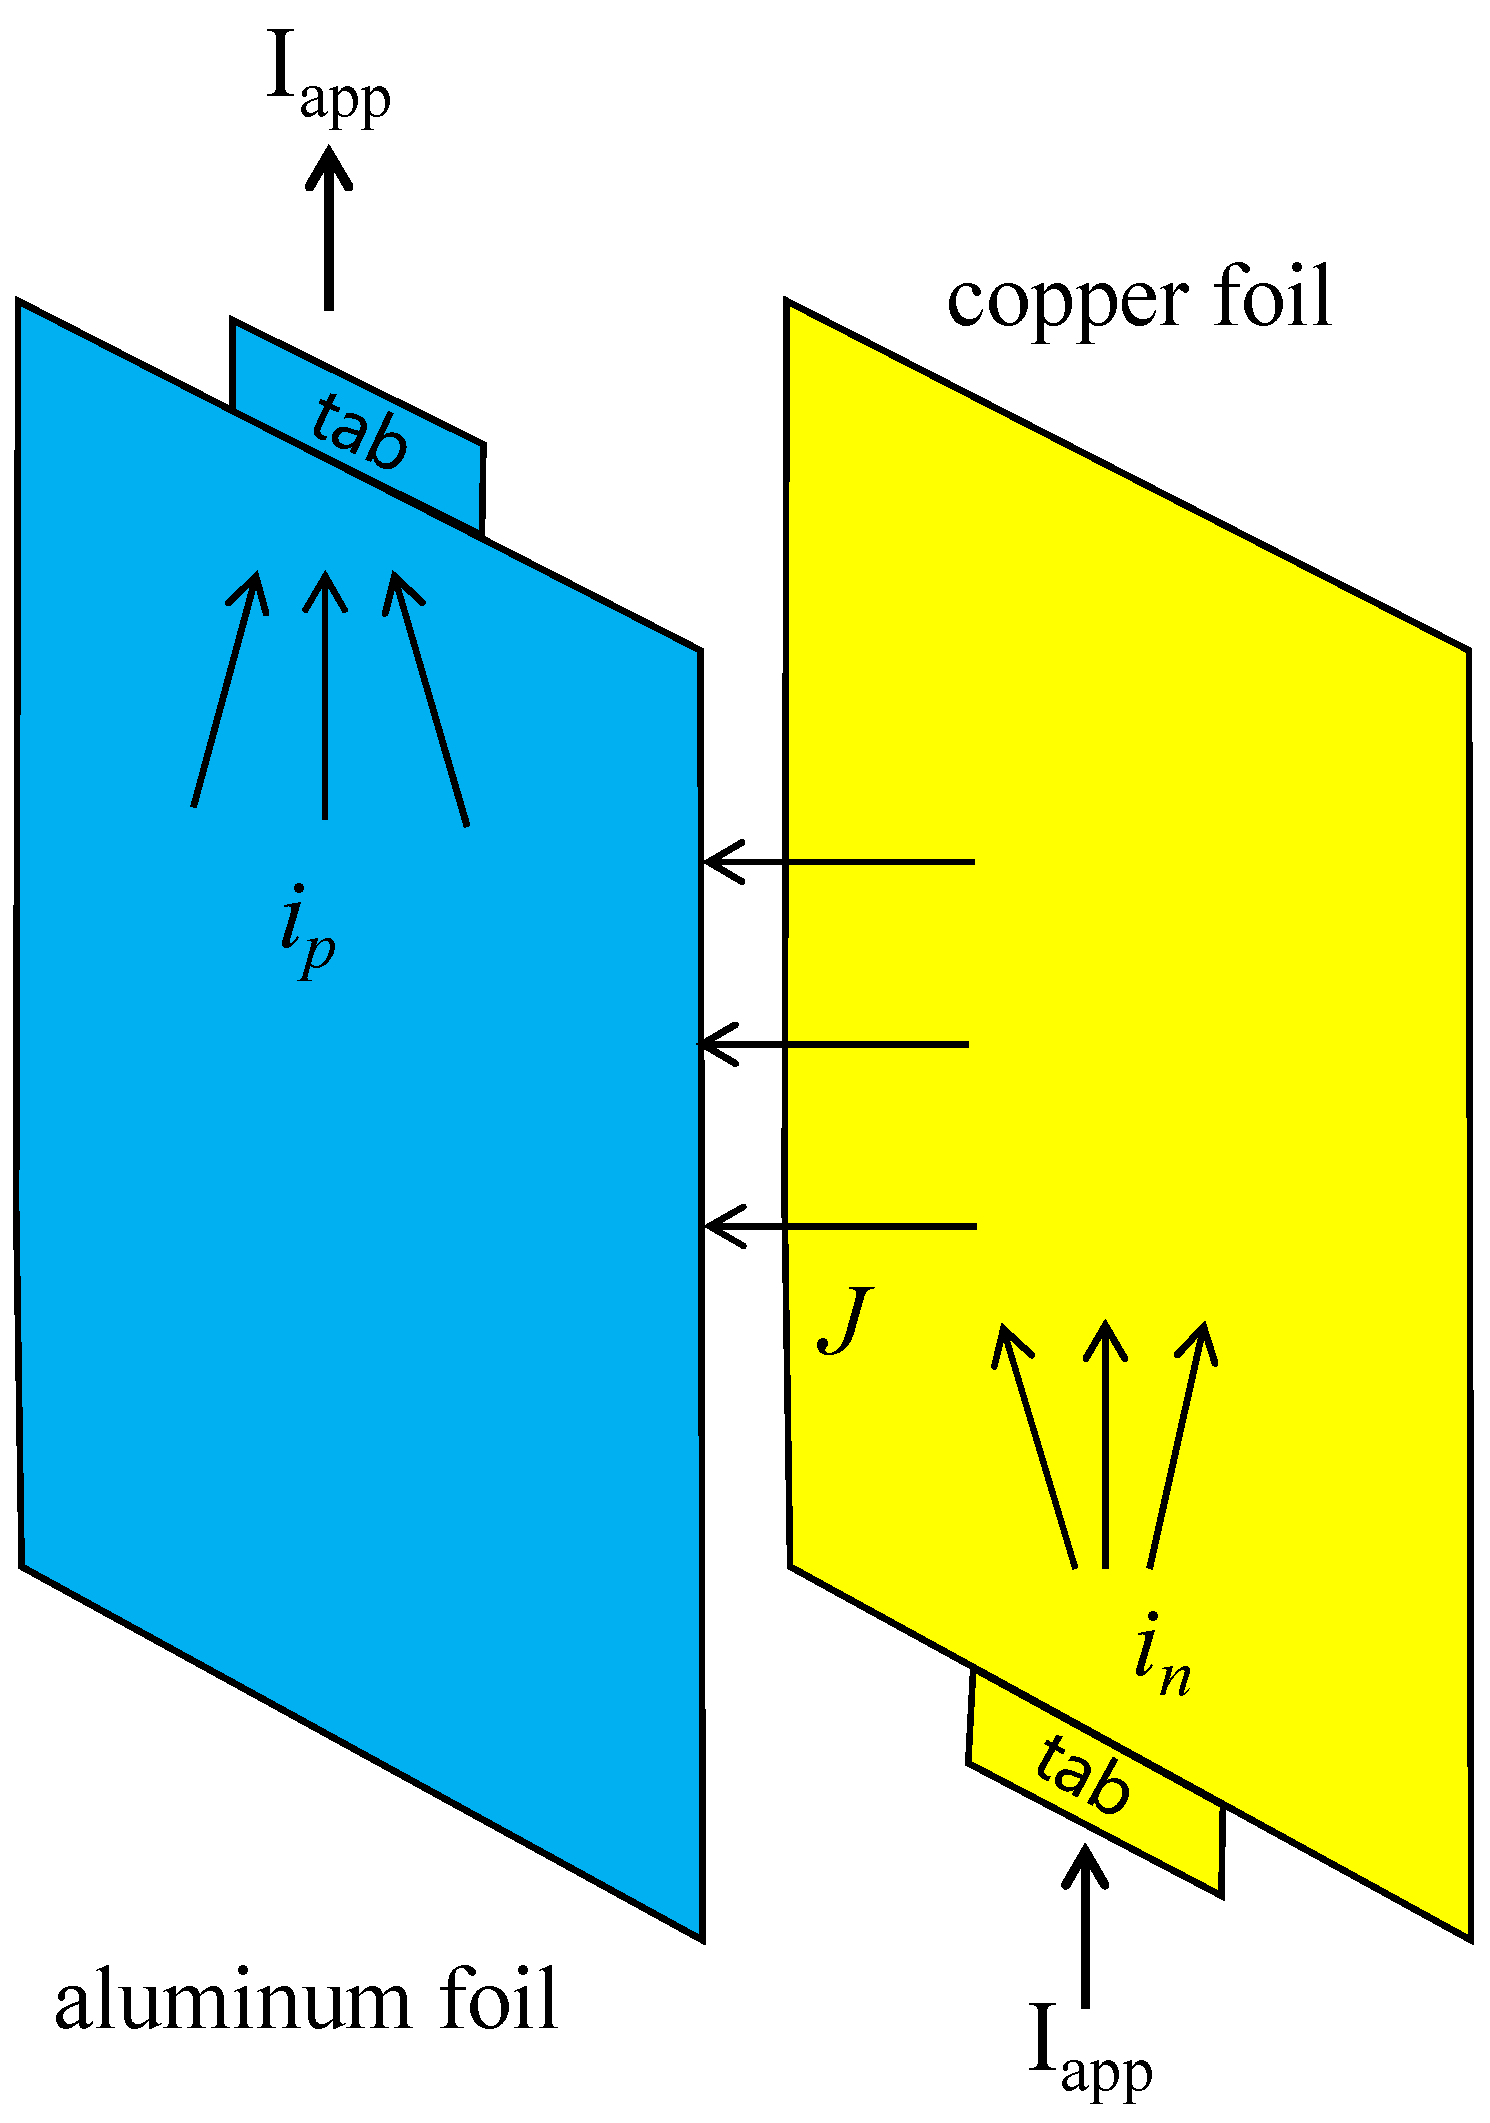
The interior of the blade battery is formed by stacking multiple cells, and each cell consists of a negative current collector, a negative active material, a separator, a positive active material and a positive current collector, as shown in Figure 2. The positive and negative current collectors are parallel to each other. During battery operation, there are two kinds of currents: (1) the transfer current J formed by the migration of lithium ions driven by the potential difference at the corresponding position between the electrodes; (2) the surface current i driven by the potential difference of the electrodes themselves.
Figure 2.
Schematic diagram of current between electrodes during discharge.
The degree of ion migration in the cell and the degree of electron migration in the electrode are conserved, described by the following formula:
where ip and in are the surface current density of the positive and negative electrodes, respectively, described by Ohm’s law as follows:
where Up and Un are the positive and negative potentials, respectively; and are the equivalent conductance of collector, respectively. Substituting Equations (3) and (4) into Equations (1) and (2), we obtain the following:
In the above Poisson equation, the boundary condition for the positive pole is as follows:
Equation (7) is used for other boundaries except the tab, and Equation (8) is used for the boundary condition where the tab is connected to the external circuit. The voltage boundary condition at the tab is set to the Dirichlet boundary, Vp = VL. The boundary conditions for the negative electrode are as follows:
Equation (9) is used for other boundaries except the tab, and Equation (10) is used for the boundary condition where the tab is connected to the external circuit.
The transfer current density J in Equations (5) and (6) can be described by the NTGK model as a function of the potential difference between the positive and negative electrodes according to the following equation:
In the above formula, Yec is the conductance density, and Uocv is the open-circuit voltage of the cell. Yec can be described as a function of depth of discharge (DOD) and temperature, while Uocv is not significantly affected by temperature and can be described as a function of depth of discharge as follows:
By solving the above equation, the temporal and spatial variation in the transfer current density J on the electrode can be obtained. The inconsistency of current density will affect the distribution of the DOD of the battery, followed by the distribution of the conductivity density and open-circuit voltage of the battery. Therefore, the electrical model needs to calculate the distribution of the DOD in the cell, which can be described by the transfer current density J as follows:
2.2. Thermal Model
The relationship between the temperature distribution and the electrochemical reaction in the battery is bidirectional coupling. The influence of temperature on the internal electrochemical reaction can be reflected accurately by establishing an accurate thermal model of the battery. The size of the blade battery in the thickness direction is much smaller than that in the length and width directions, and the internal cells are stacked in the thickness direction. Therefore, the temperature gradient in the thickness direction can be ignored, and the blade battery can be simplified into a two-dimensional model, as shown in Figure 3. Based on the energy conservation equation, the temperature distribution of the blade battery can be described as follows:
where ρ is the battery density; Cp is the specific heat capacity of the battery; T is the battery temperature; kx and ky are the equivalent thermal conductivities in the x and y directions; q is the volumetric heat generation of the battery; and hconv is the convective heat transfer coefficient, which is determined as 13 W/(m2·K) through experimental calibration. The battery was arranged in a temperature chamber, and the environment temperature was set as 27 °C. The heat generation of the battery is calculated by the following formula:
where dUocv/dT is the battery temperature entropy coefficient.
Figure 3.
Two-dimensional model of battery.
The battery cover’s structural component is treated as a fixed-resistance heating element, and the heat generation rate is given by the following:
where Iapp is the current applied in battery; the Rcover is the resistance of the battery cover.
2.3. Model Parameters
The interior of the battery is formed by stacking multiple layers of cell units, and the specific parameters are detailed in Table 1.
Table 1.
Internal cell unit parameters.
The equivalent conductivity in Equations (3) and (4) is determined by both the thickness and conductivity of the electrode material, and can be calculated from the following equation:
where δp and δn are the thicknesses of the positive and negative electrodes, respectively, given by the following:
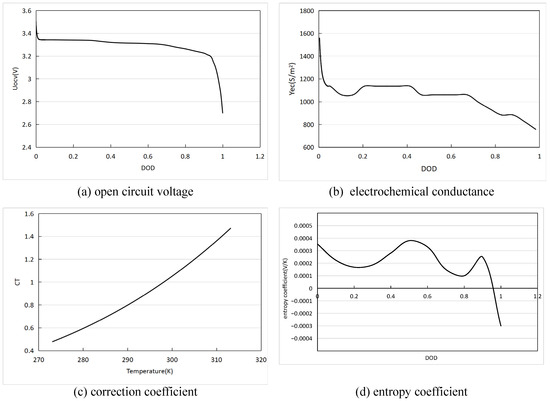
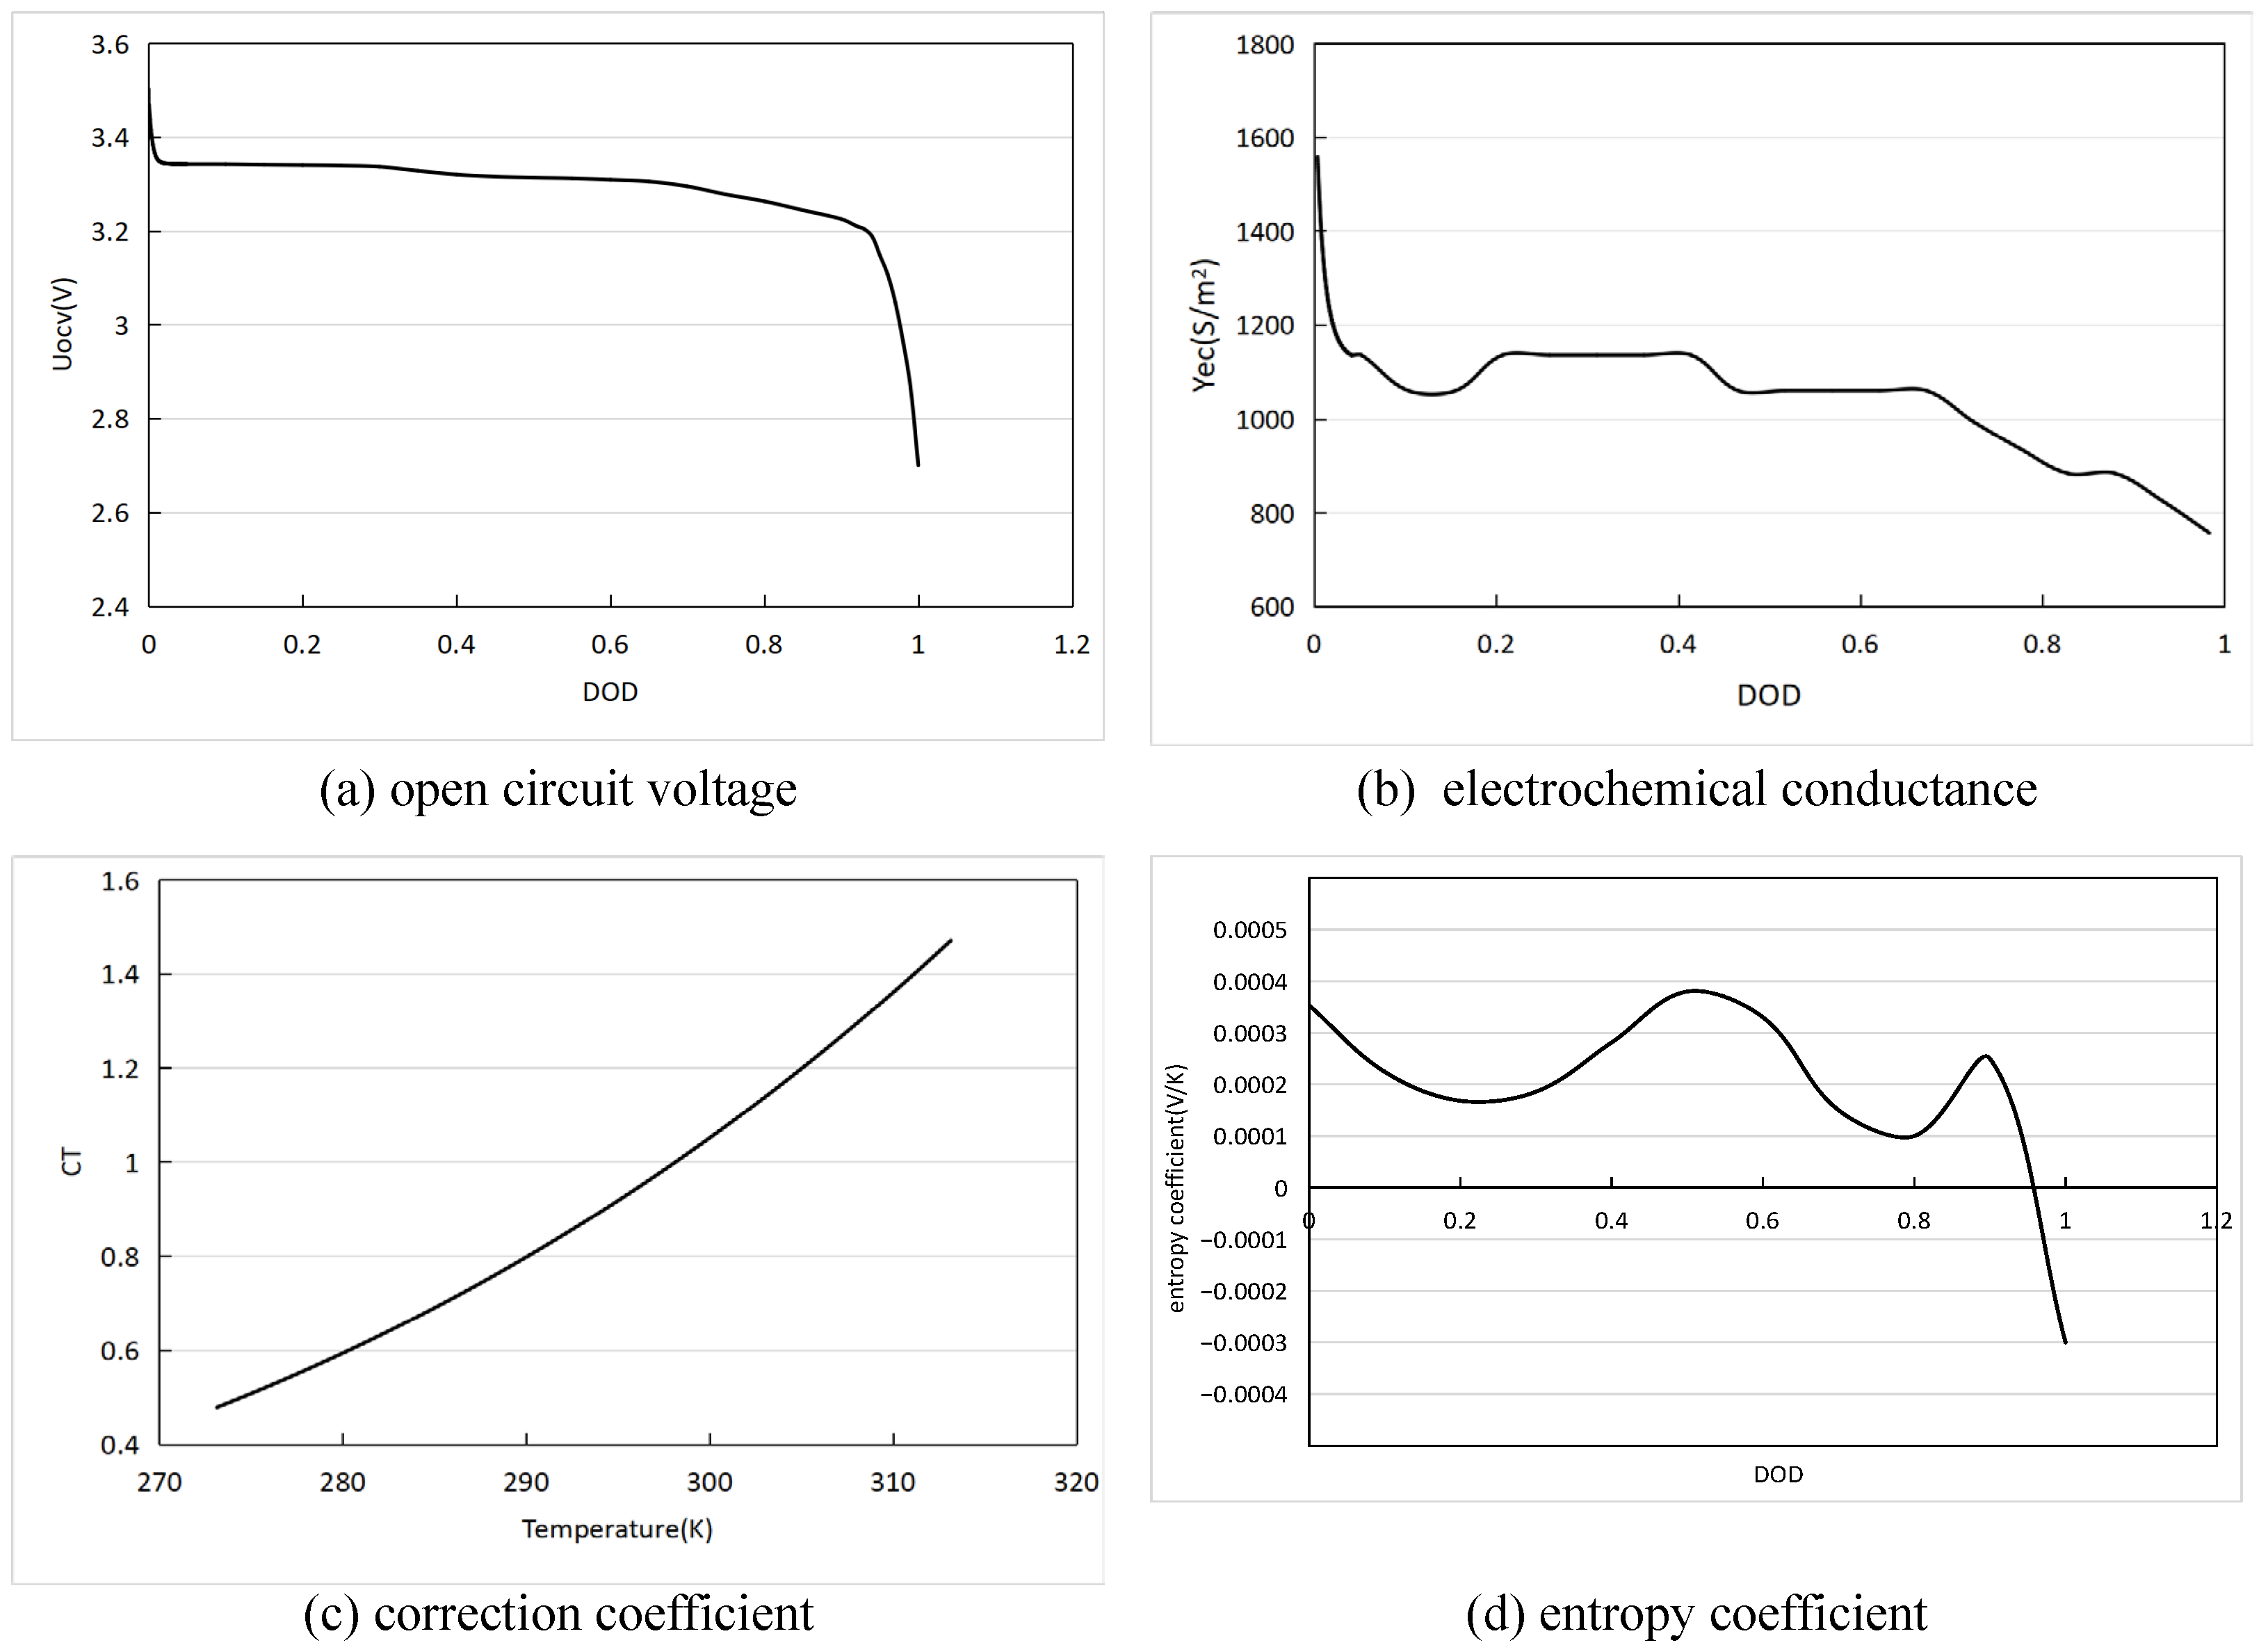
Uocv and Yec in Equation (11) are extracted from experimental data and can be embedded into COMSOL Multiphysics 6.2 in the form of an interpolation function, as shown in Figure 4a,b. Yec is affected by temperature and can be corrected by the temperature coefficient CT, as shown in Figure 4c. The entropy coefficient for calculating the reversible heat of the battery in Formula (17) is extracted from the experimental data, and the interpolation function is implanted into COMSOL Multiphysics, as shown in Figure 4d.
Figure 4.
The core parameters of the battery model.
3. Model Validation
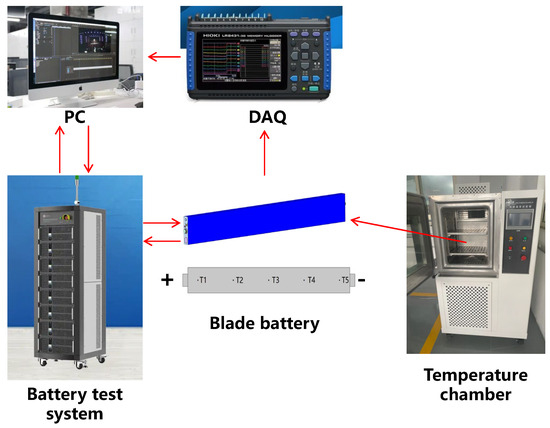
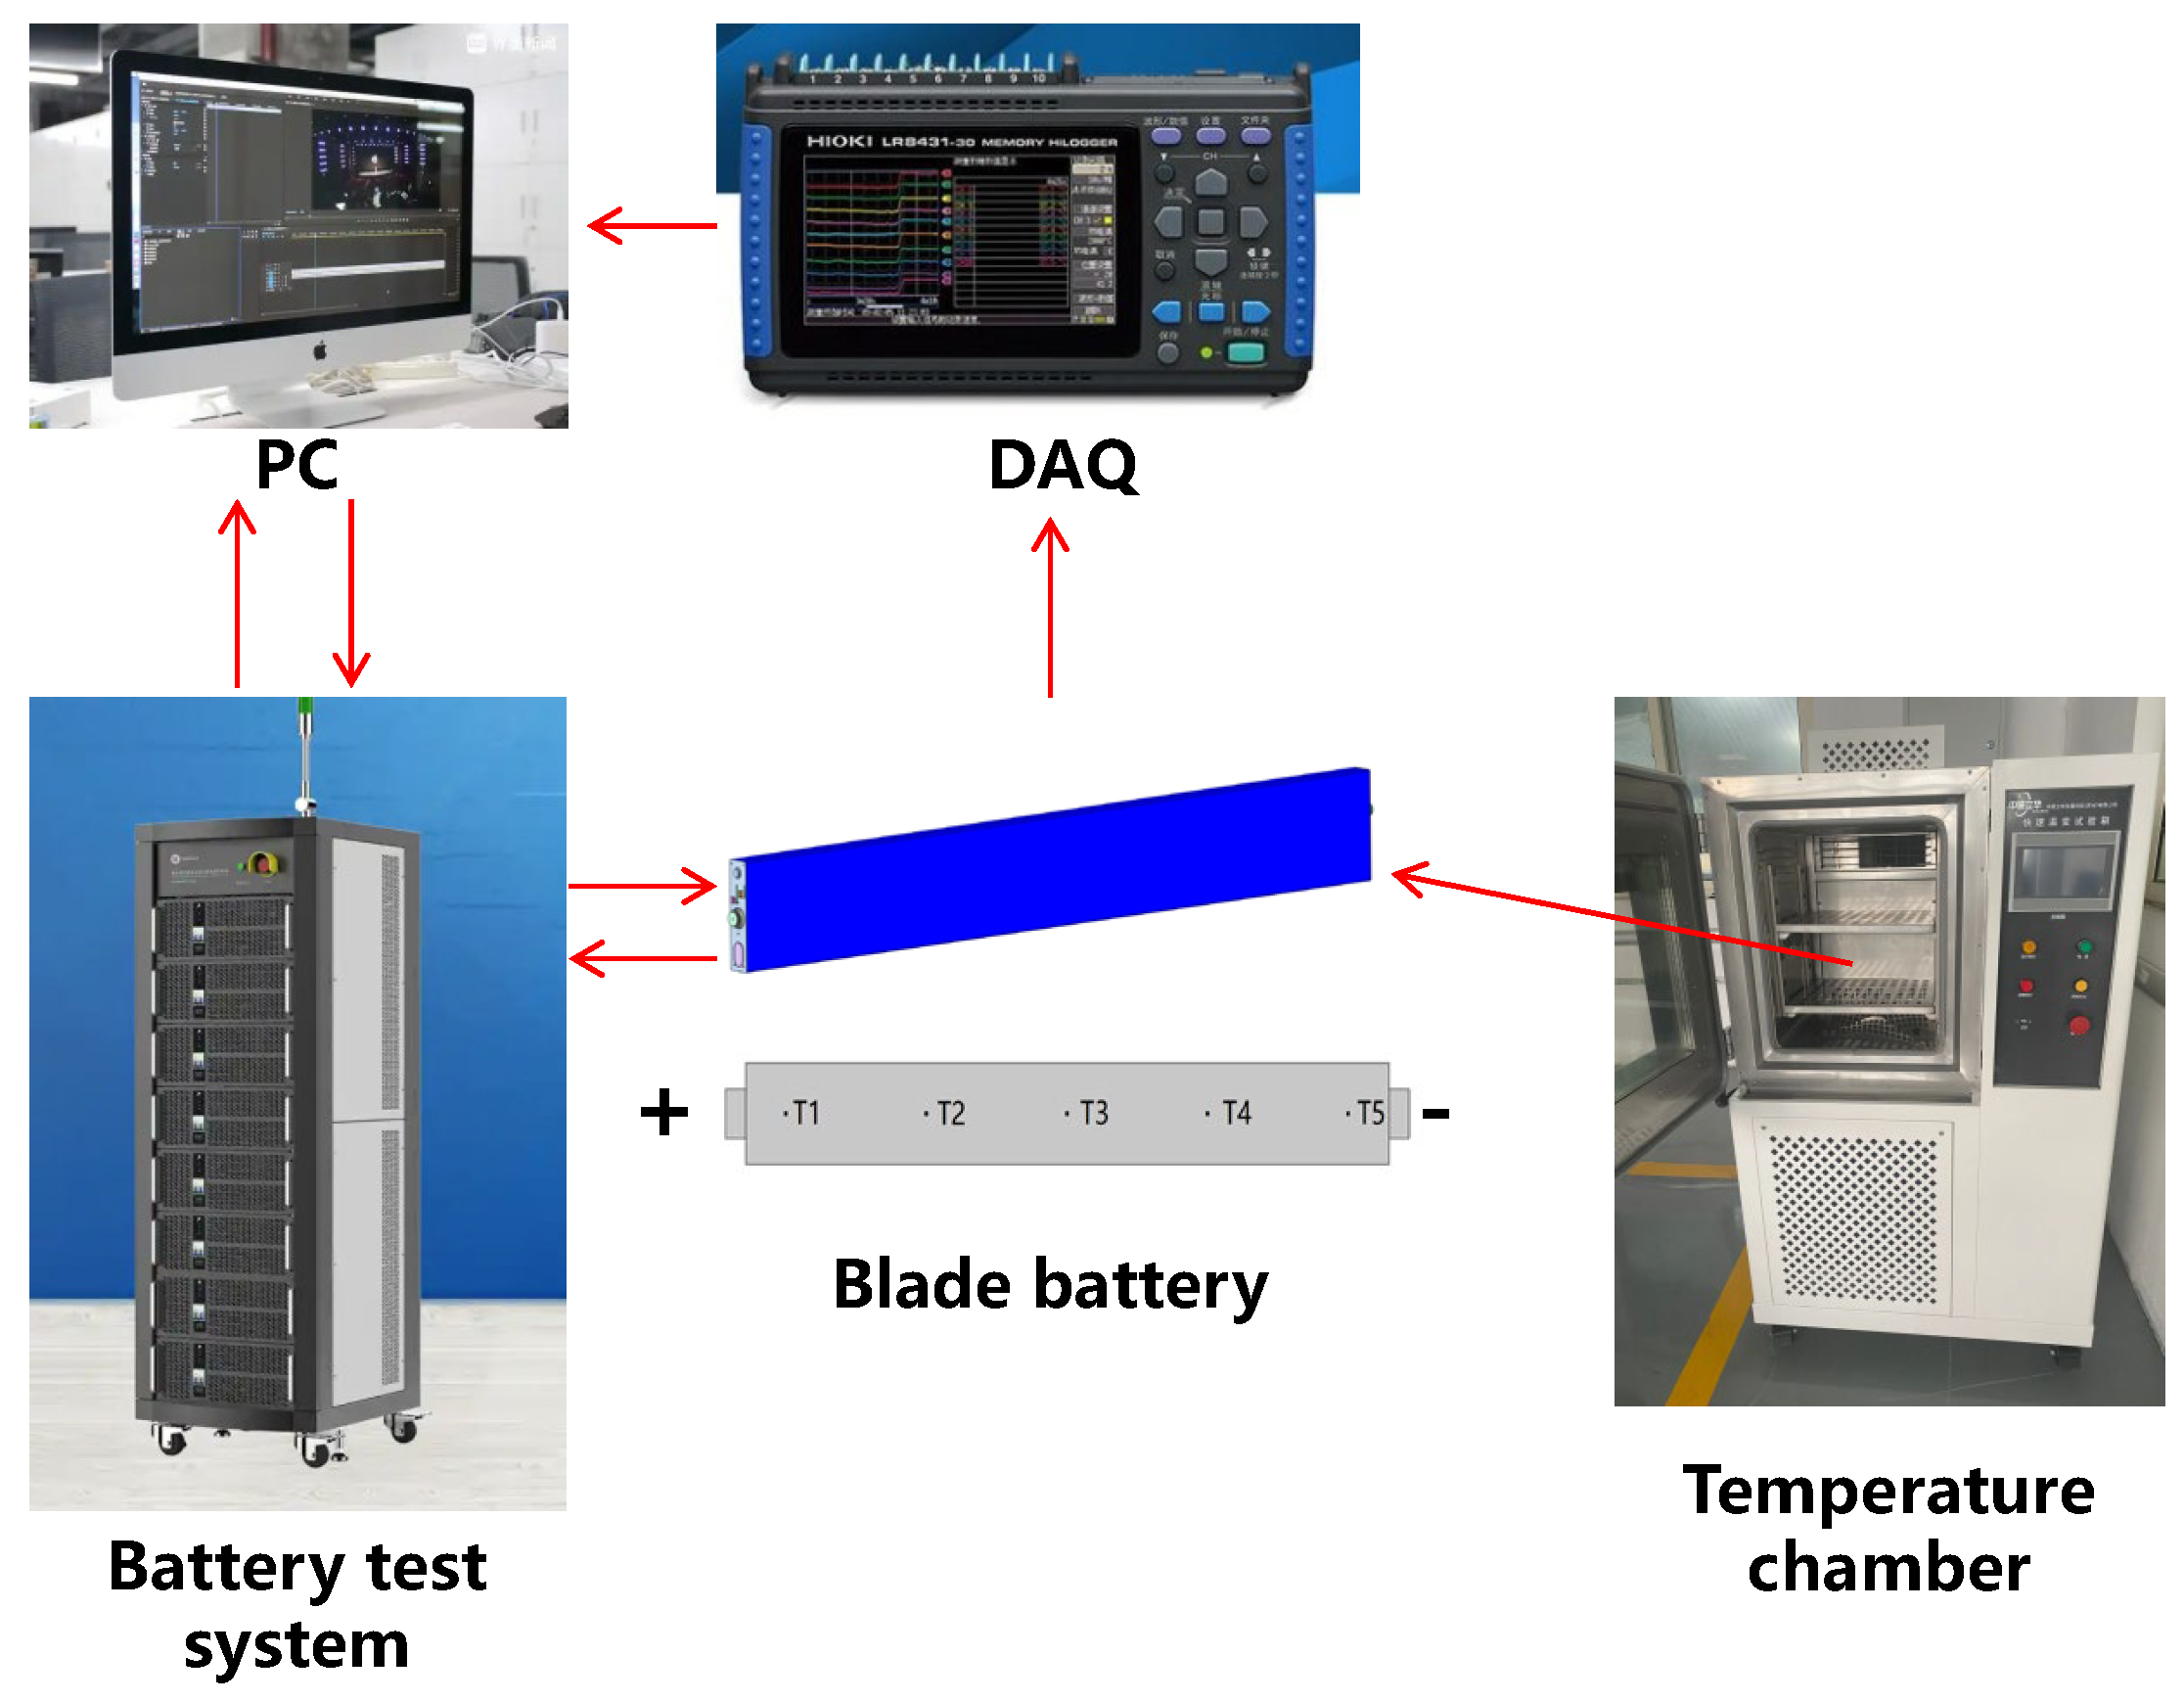
To verify the accuracy of the model, we built a test platform for the electrical–thermal characteristics of the blade battery, as shown in Figure 5. The battery was placed in a thermal chamber (Suzhou Unique Environmental Test Equipment Co., Ltd., Suzhou, China) with a temperature control accuracy of ±0.5 °C. The chamber temperature was set to 27 °C. Five thermocouples connected to a data logger (HIOKI E.E. CORPORATION, Ueda, Japan) were attached to the battery surface to monitor real-time temperature changes, with their placement identical to that shown in Figure 3. Therefore, the experimental battery surface temperature could be compared with that of simulation data. In the temperature chamber, the battery was discharged at a constant current of 200 A. The Nebula battery cycle test system (Fujian Nebula Electronics Co., Ltd., Fuzhou, China) was used to collect the voltage data of the battery.
Figure 5.
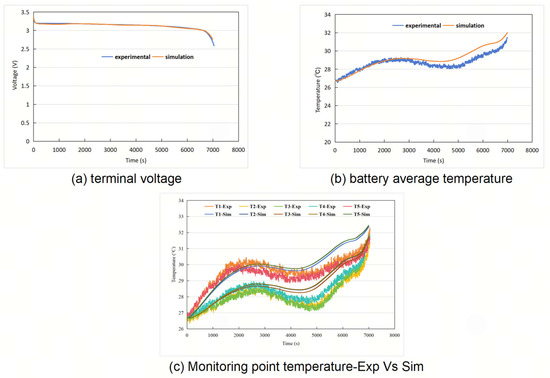
The battery test platform.
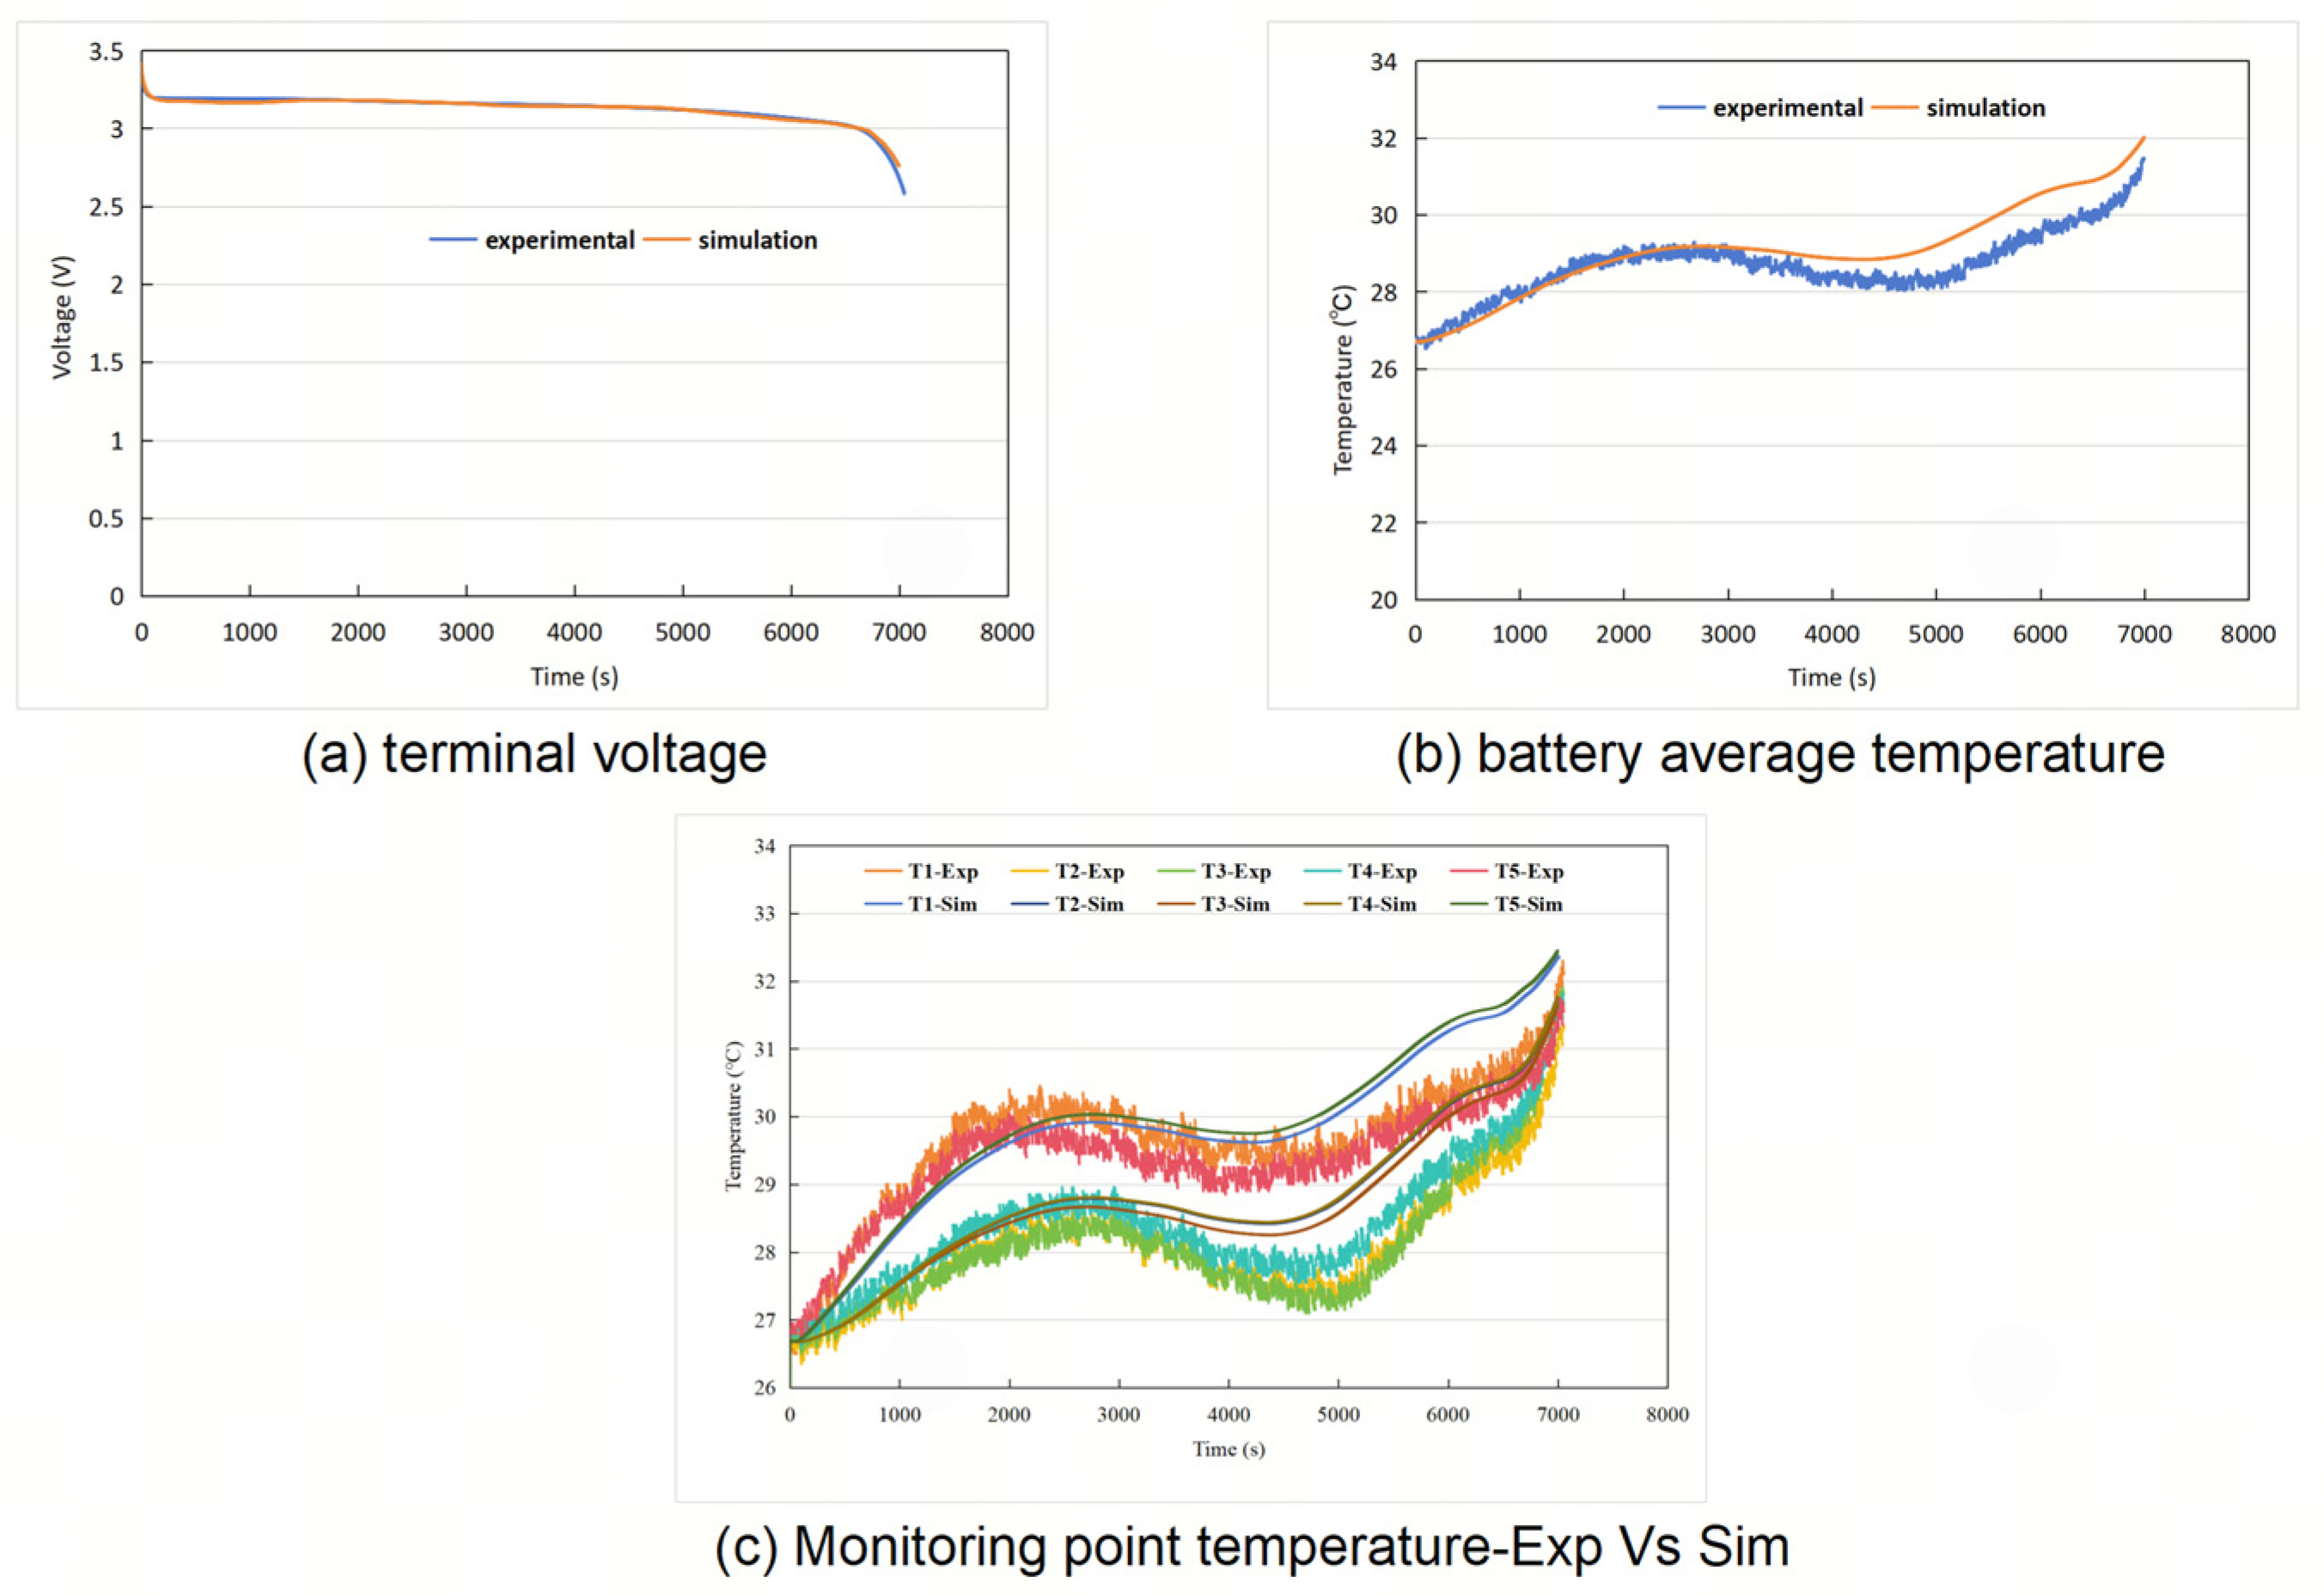
The accuracy of the model was evaluated by the relative error, which can be expressed as (Xexp−Xsim)/Xexp × 100%. As shown in Figure 6a, the change trend of the simulation value of the battery terminal voltage is basically consistent with the experimental value, and the maximum relative error between them is 2.81%. As shown in Figure 6b, the average temperature of monitoring points on the battery surface during the experiment was calculated and compared with the model simulation values. The results show that the maximum relative error between the experimental value and the simulation value of the battery average temperature is 4%. To further verify the accuracy of the model for the calculation of battery temperature distribution, we compared the temperature changes of five temperature monitoring points. As shown in Figure 6c, the change trend of the experimental values of the temperature at the monitoring points is the same as that of the simulation value. The maximum temperature difference among the battery monitoring points exhibited a pattern of first increasing and then decreasing. The results show that the maximum relative errors for monitoring points 1# to 5# are 4%, 5.9%, 5.6%, 4.1%, and 5.4%, respectively. The comparative results indicate that the established two-dimensional electro-thermal coupling model of the blade battery accurately captures terminal voltage variations and temperature distribution trends, confirming its applicability for high-fidelity thermal management simulation design.
Figure 6.
Battery electro-thermal model validation.
4. Results and Discussion
For large-sized blade batteries with high capacity, the distribution of physical fields in the battery is not uniform. A thermal management system that fails to account for these distribution characteristics may exacerbate inconsistencies within the battery, consequently reducing battery efficiency and operational lifespan. Therefore, drawing upon the two-dimensional electro-thermal coupling model previously proposed for the blade battery, this section focuses on analyzing the distribution characteristics of various internal physical fields. The findings are intended to serve as a reference for the design of a more refined and effective thermal management system.
4.1. Electrochemical and Thermal Inconsistency of Blade Battery
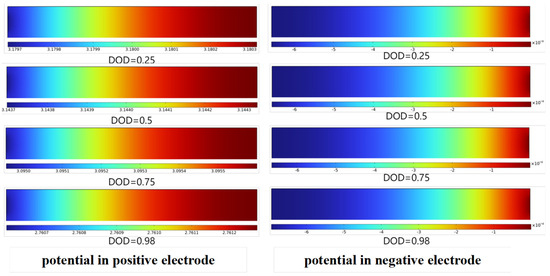
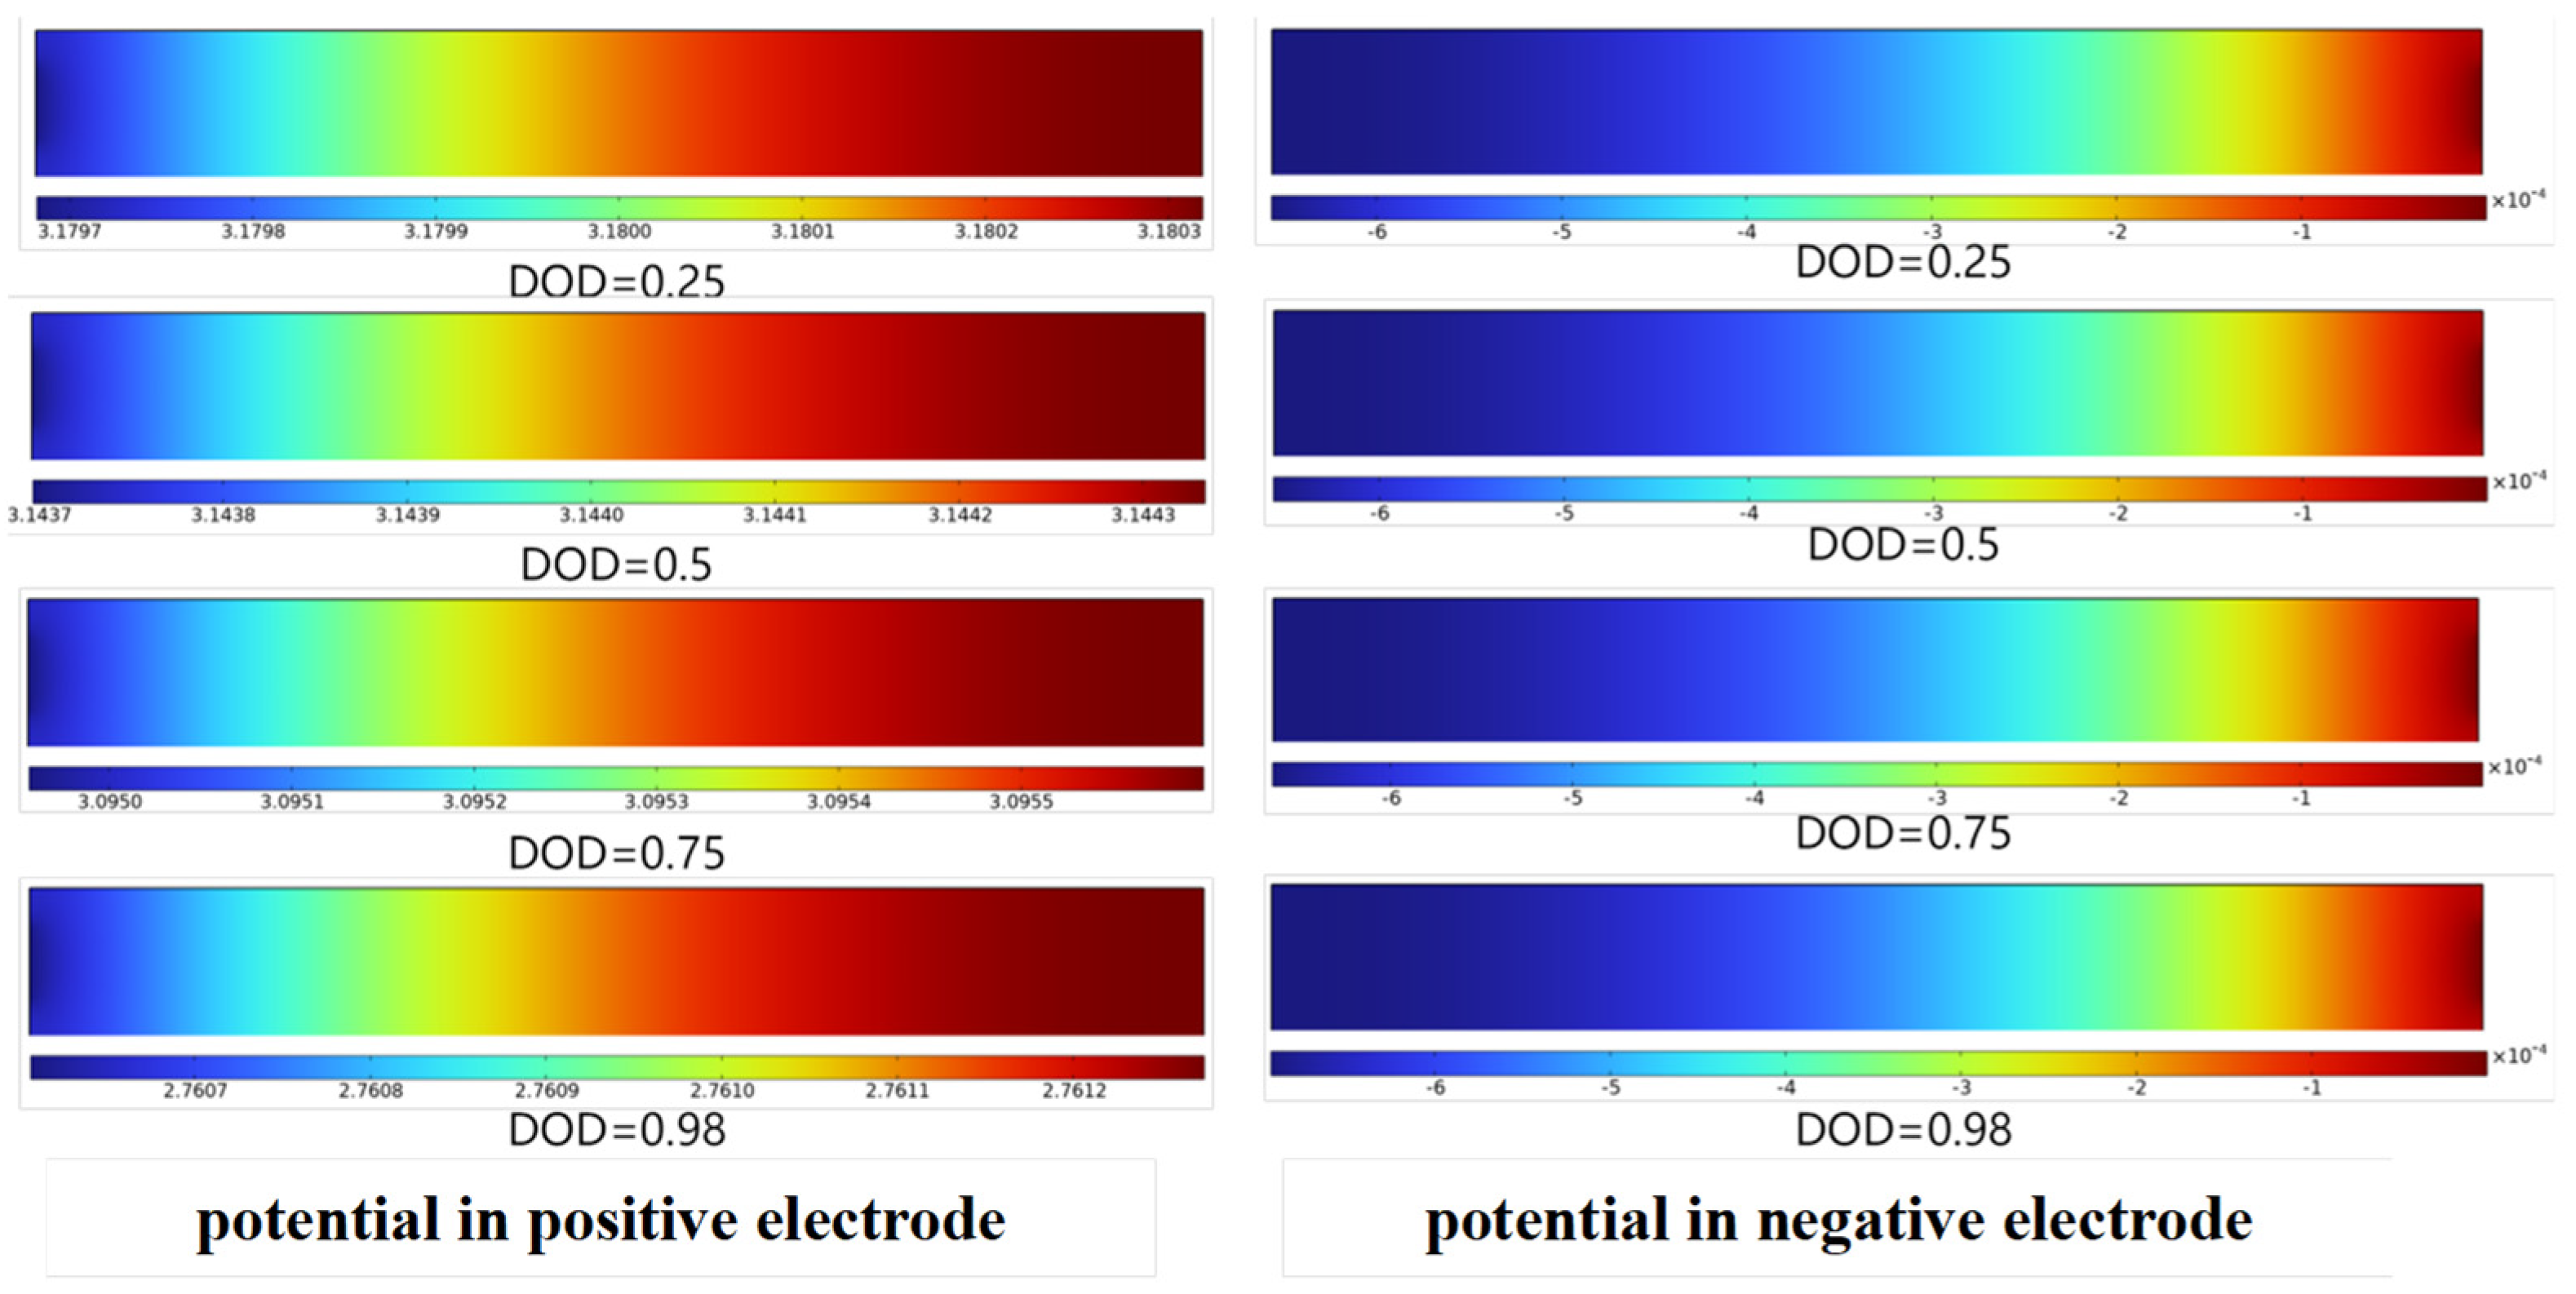
As shown in Figure 7, the potential distribution of the positive and negative electrodes under constant current discharge conditions at various depths of discharge is presented. Since the tabs of the blade battery are arranged at both ends, it can be observed that the potential gradient is larger near the tabs. For the positive electrode, the current flows out of the positive tab during discharge, resulting in a higher potential at locations farther from the tab and a lower potential near the tab. For the negative electrode, the current flows into the negative tab during discharge, leading to a higher potential near the tab and a lower potential at locations farther from the tab. Additionally, it can be found that the potential distribution trends of the positive and negative electrodes at corresponding positions are identical. This results in a more uniform potential difference distribution between the positive and negative electrodes at the same location across the entire battery, indicating that arranging the tabs on both sides offers advantages compared to arranging them on the same side for large-sized blade batteries.
Figure 7.
Potential distribution of electrodes.
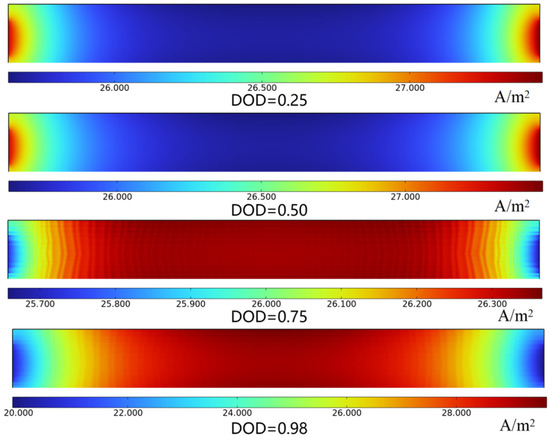
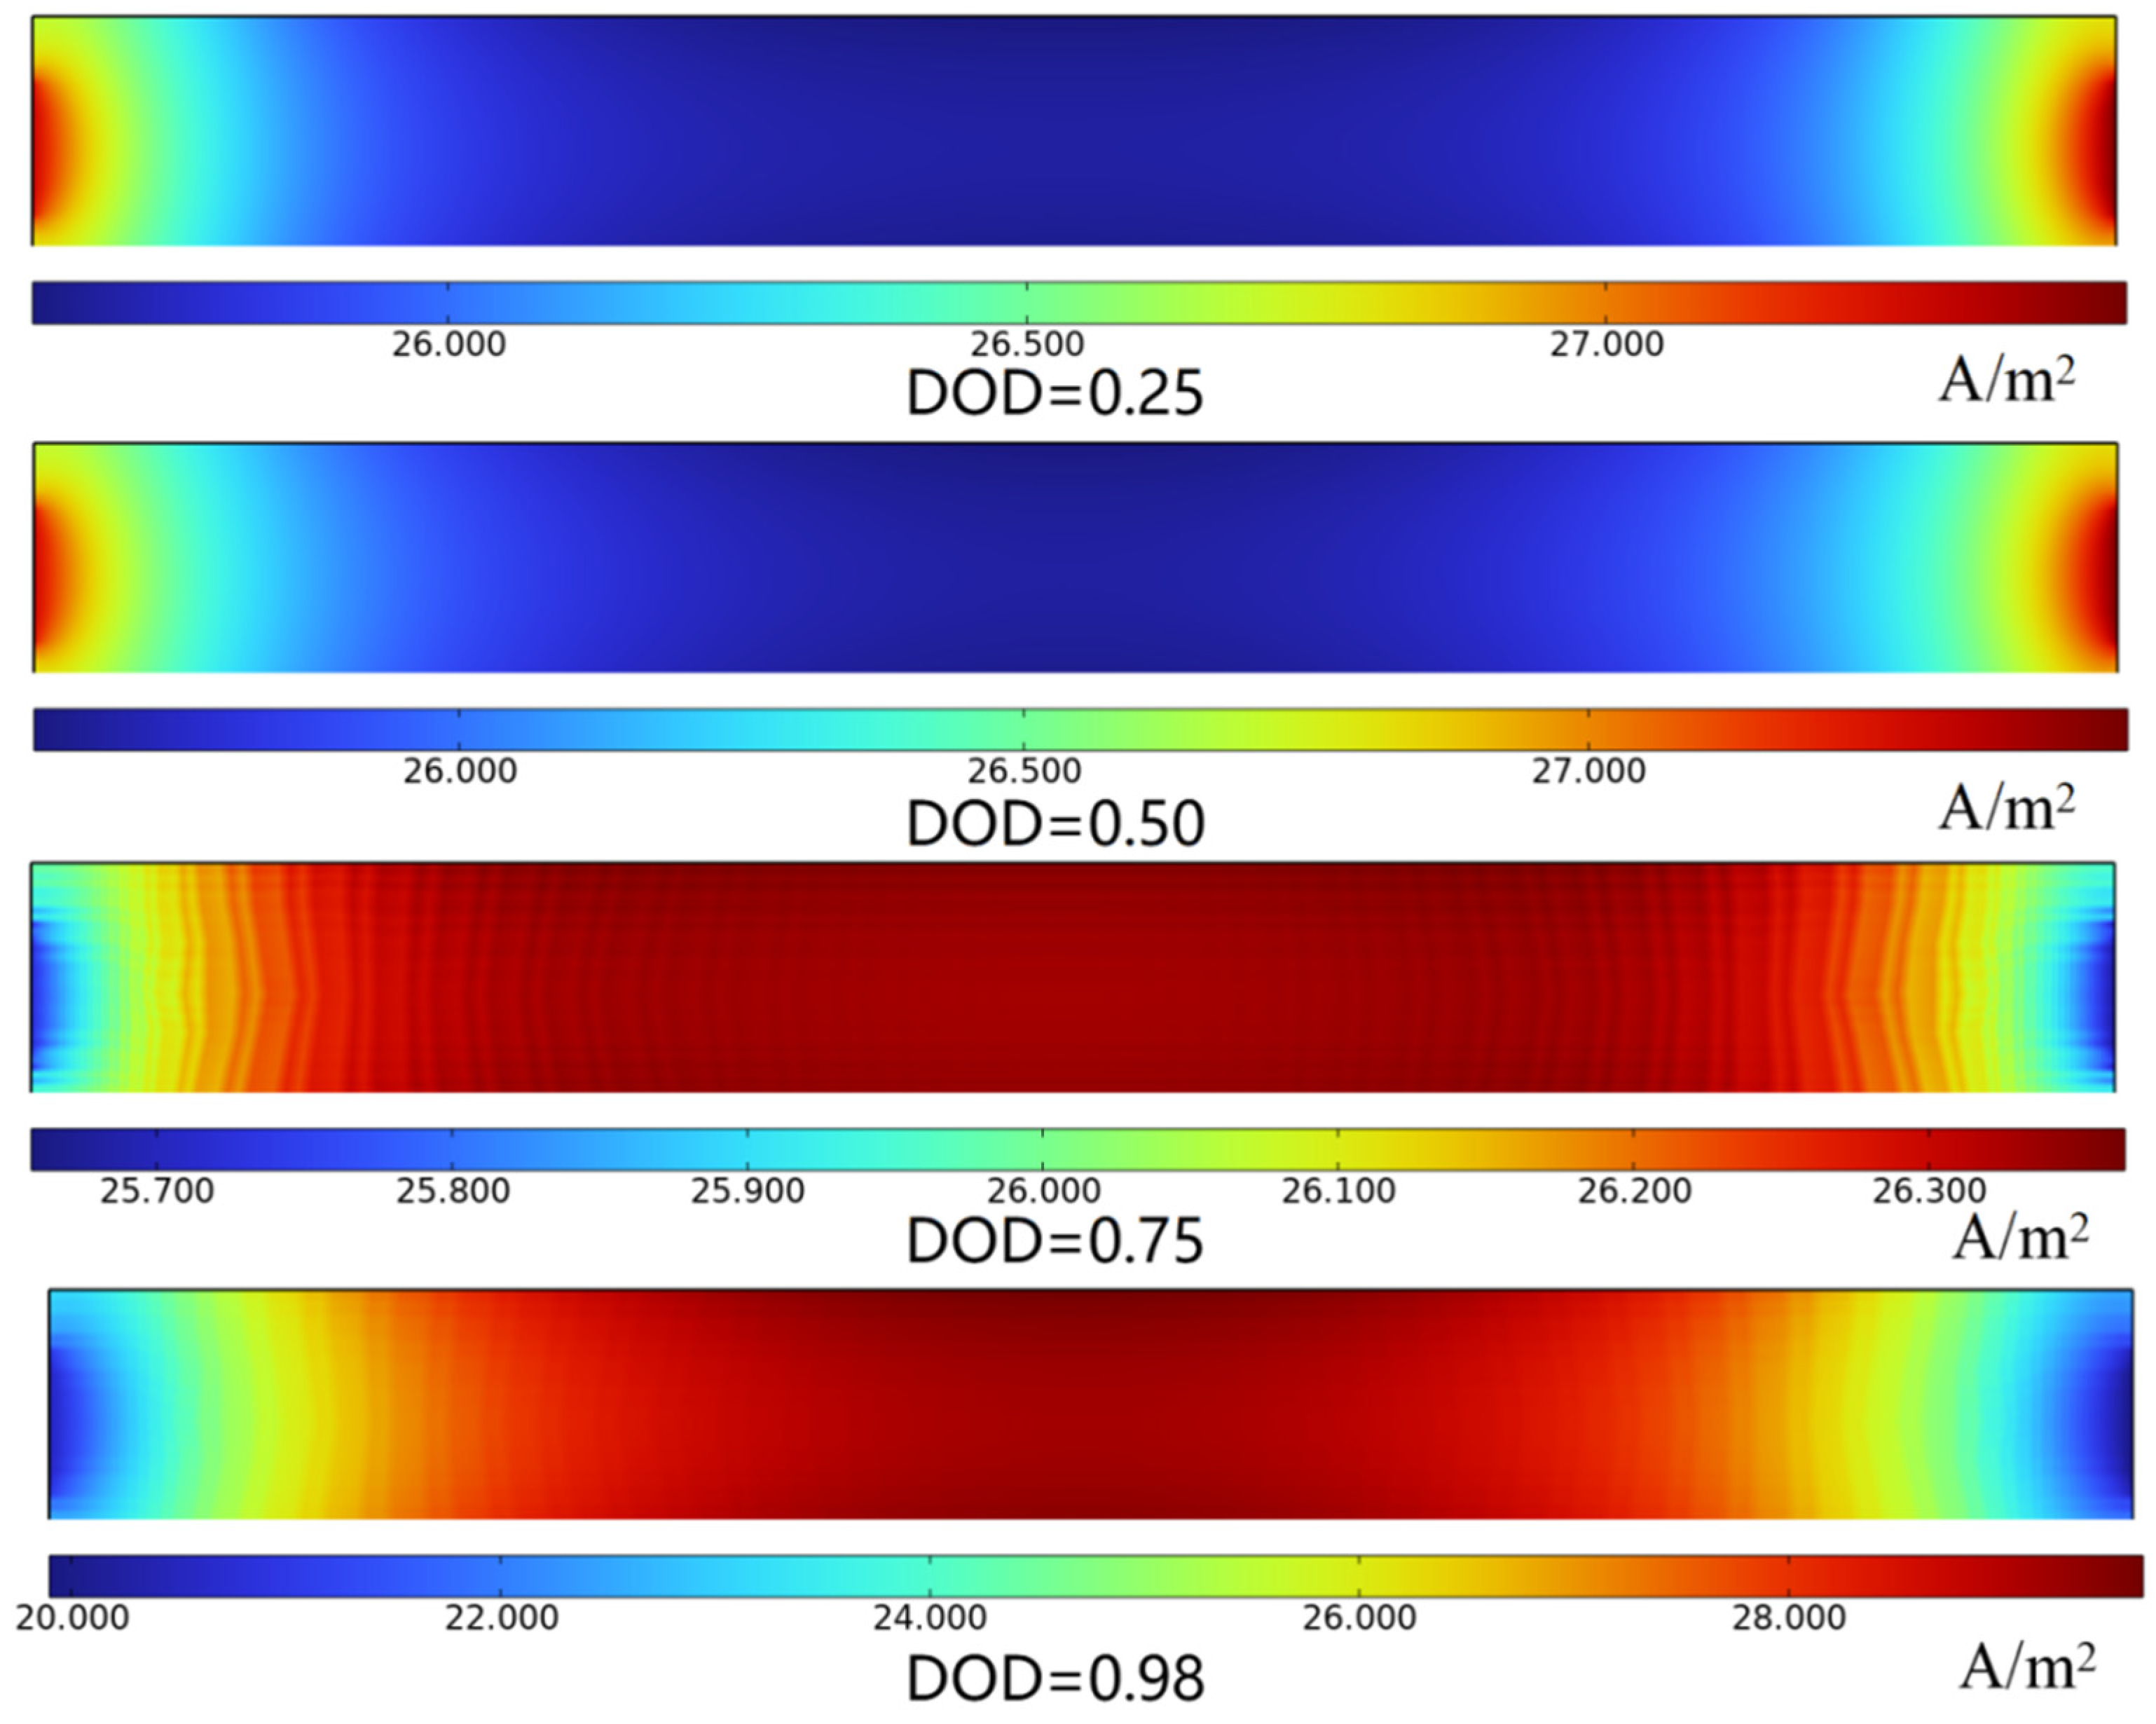
Based on Equation (11), the magnitude of the transfer current density is primarily influenced by the potential difference between the corresponding positions of the positive and negative electrodes. An uneven potential distribution leads to a non-uniform distribution of the transfer current density, resulting in an uneven electrochemical reaction rate. Figure 8 illustrates the distribution of the transfer current density under constant current discharge conditions at various DOD values. As shown in the figure, at the initial stage of discharge, the transfer current density near the tabs is significantly higher than that in other regions. However, at the end of discharge, the transfer current density near the tabs becomes notably lower than that in other regions. During the initial discharge stage, the overpotential near the tabs is higher, while the overpotential in the central region of the battery is lower, resulting in a higher electrochemical reaction rate near the tabs. At the end of discharge, the DOD near the tabs is higher. As shown in Figure 4b, the electrical conductivity decreases with increasing DOD, which leads to higher resistance to lithium-ion transport. In contrast, the central region exhibits a lower DOD and higher electrical conductivity, resulting in a higher transfer current density in the middle and lower current density at both ends. The non-uniformity of the transfer current density leads to adverse consequences such as an inconsistent DOD, non-uniform heat generation rates, and uneven aging, which together cause a non-uniform temperature distribution across the battery. Furthermore, due to the temperature dependence of the electrochemical reaction rate, an uneven temperature distribution further exacerbates the inconsistency in electrochemical characteristics. Over prolonged operation, this will ultimately reduce the battery life.
Figure 8.
Distribution of transfer current density.
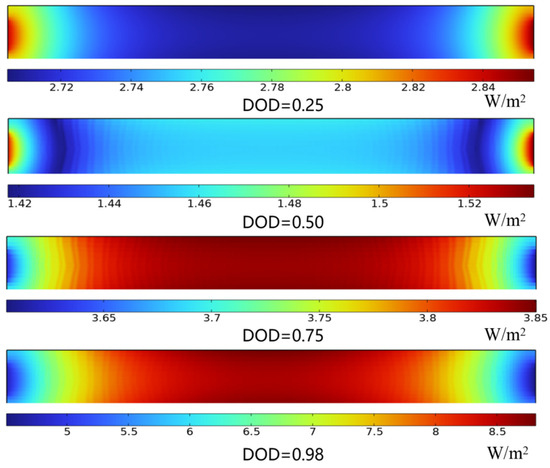
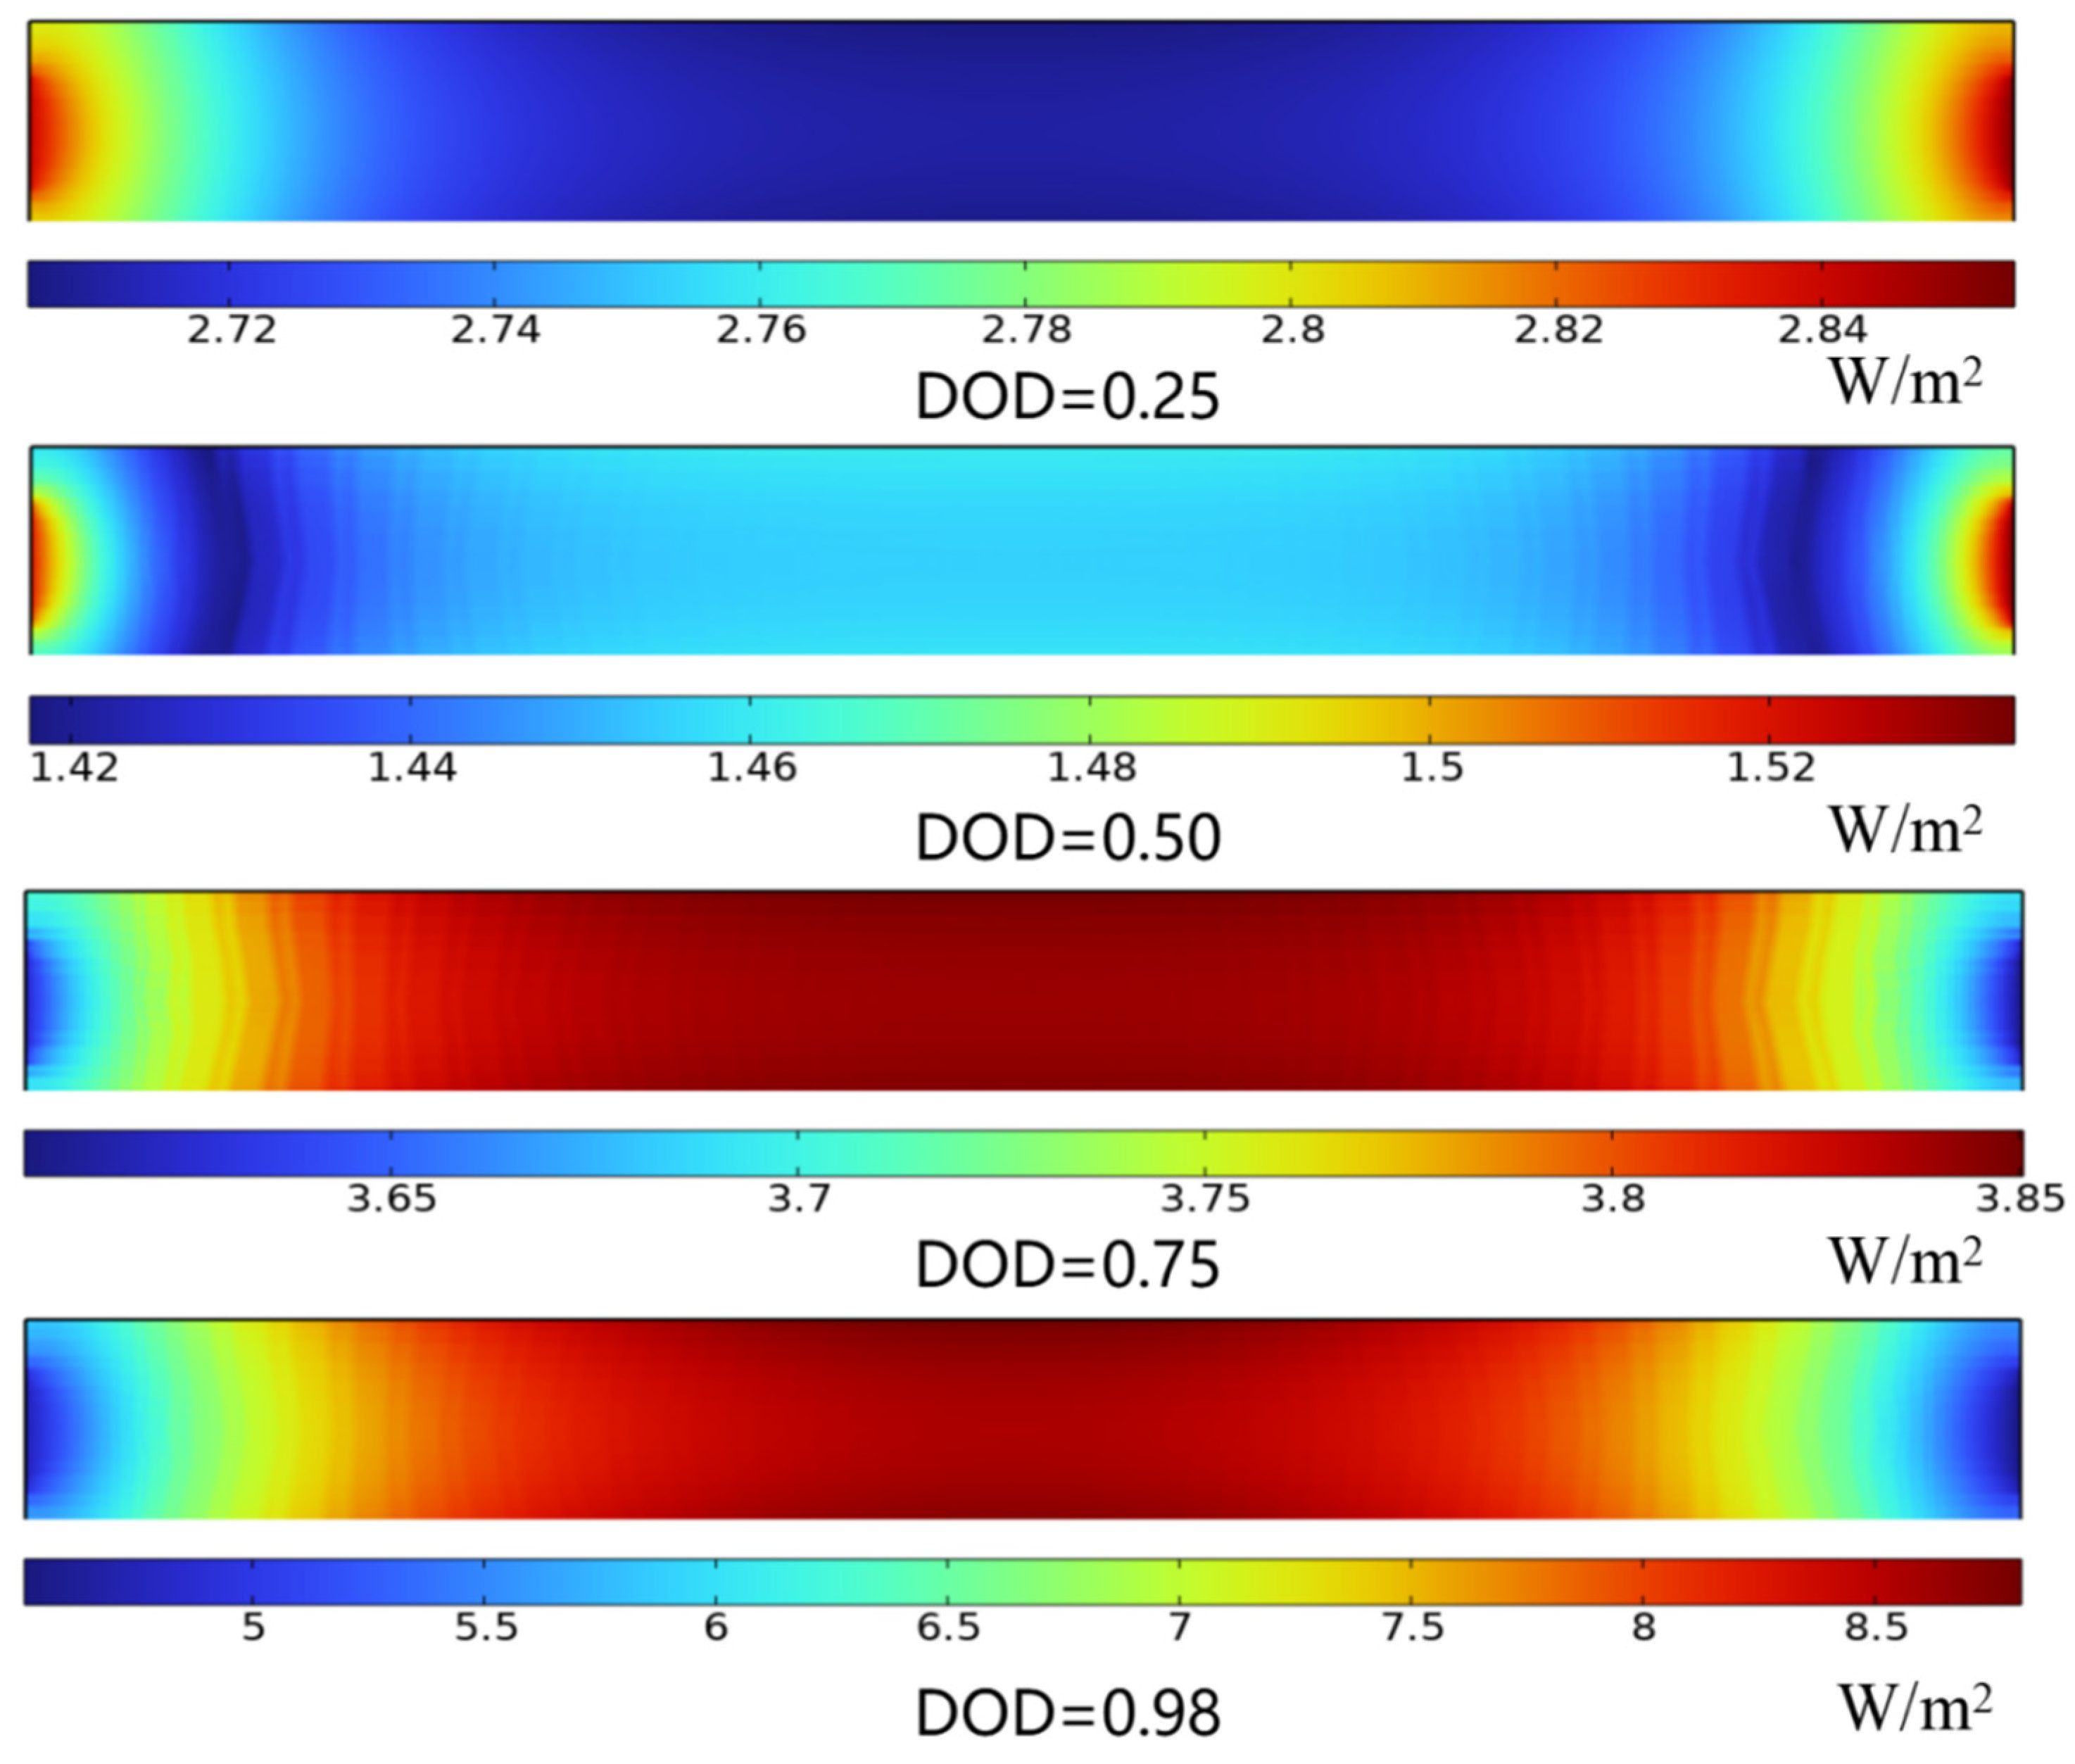
As indicated by Equation (17), the distribution characteristics of the battery′s transfer current density influence the distribution characteristics of its heat generation density. Figure 9 illustrates the distribution of heat generation density under constant current discharge conditions at various DOD values. The results show that at the initial stage of discharge, the heat generation density is higher near the tab positions, while it is lower in the central region of the battery. Conversely, at the end of discharge, the heat generation density near the tabs is significantly lower than that in the central region of the battery. Combined with Figure 8, it can be observed that at the initial stage of discharge, the higher transfer current density near the tabs leads to a higher heat generation density. In the later stage of discharge, the transfer current density in the central region of the battery is higher, resulting in a higher heat generation density in the middle compared to both ends.
Figure 9.
Distribution of heat generation density.
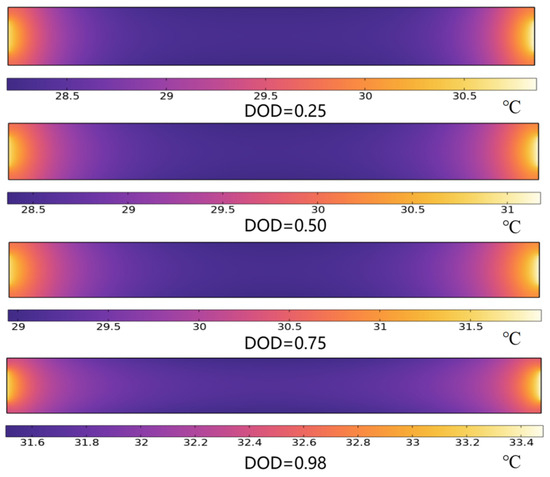
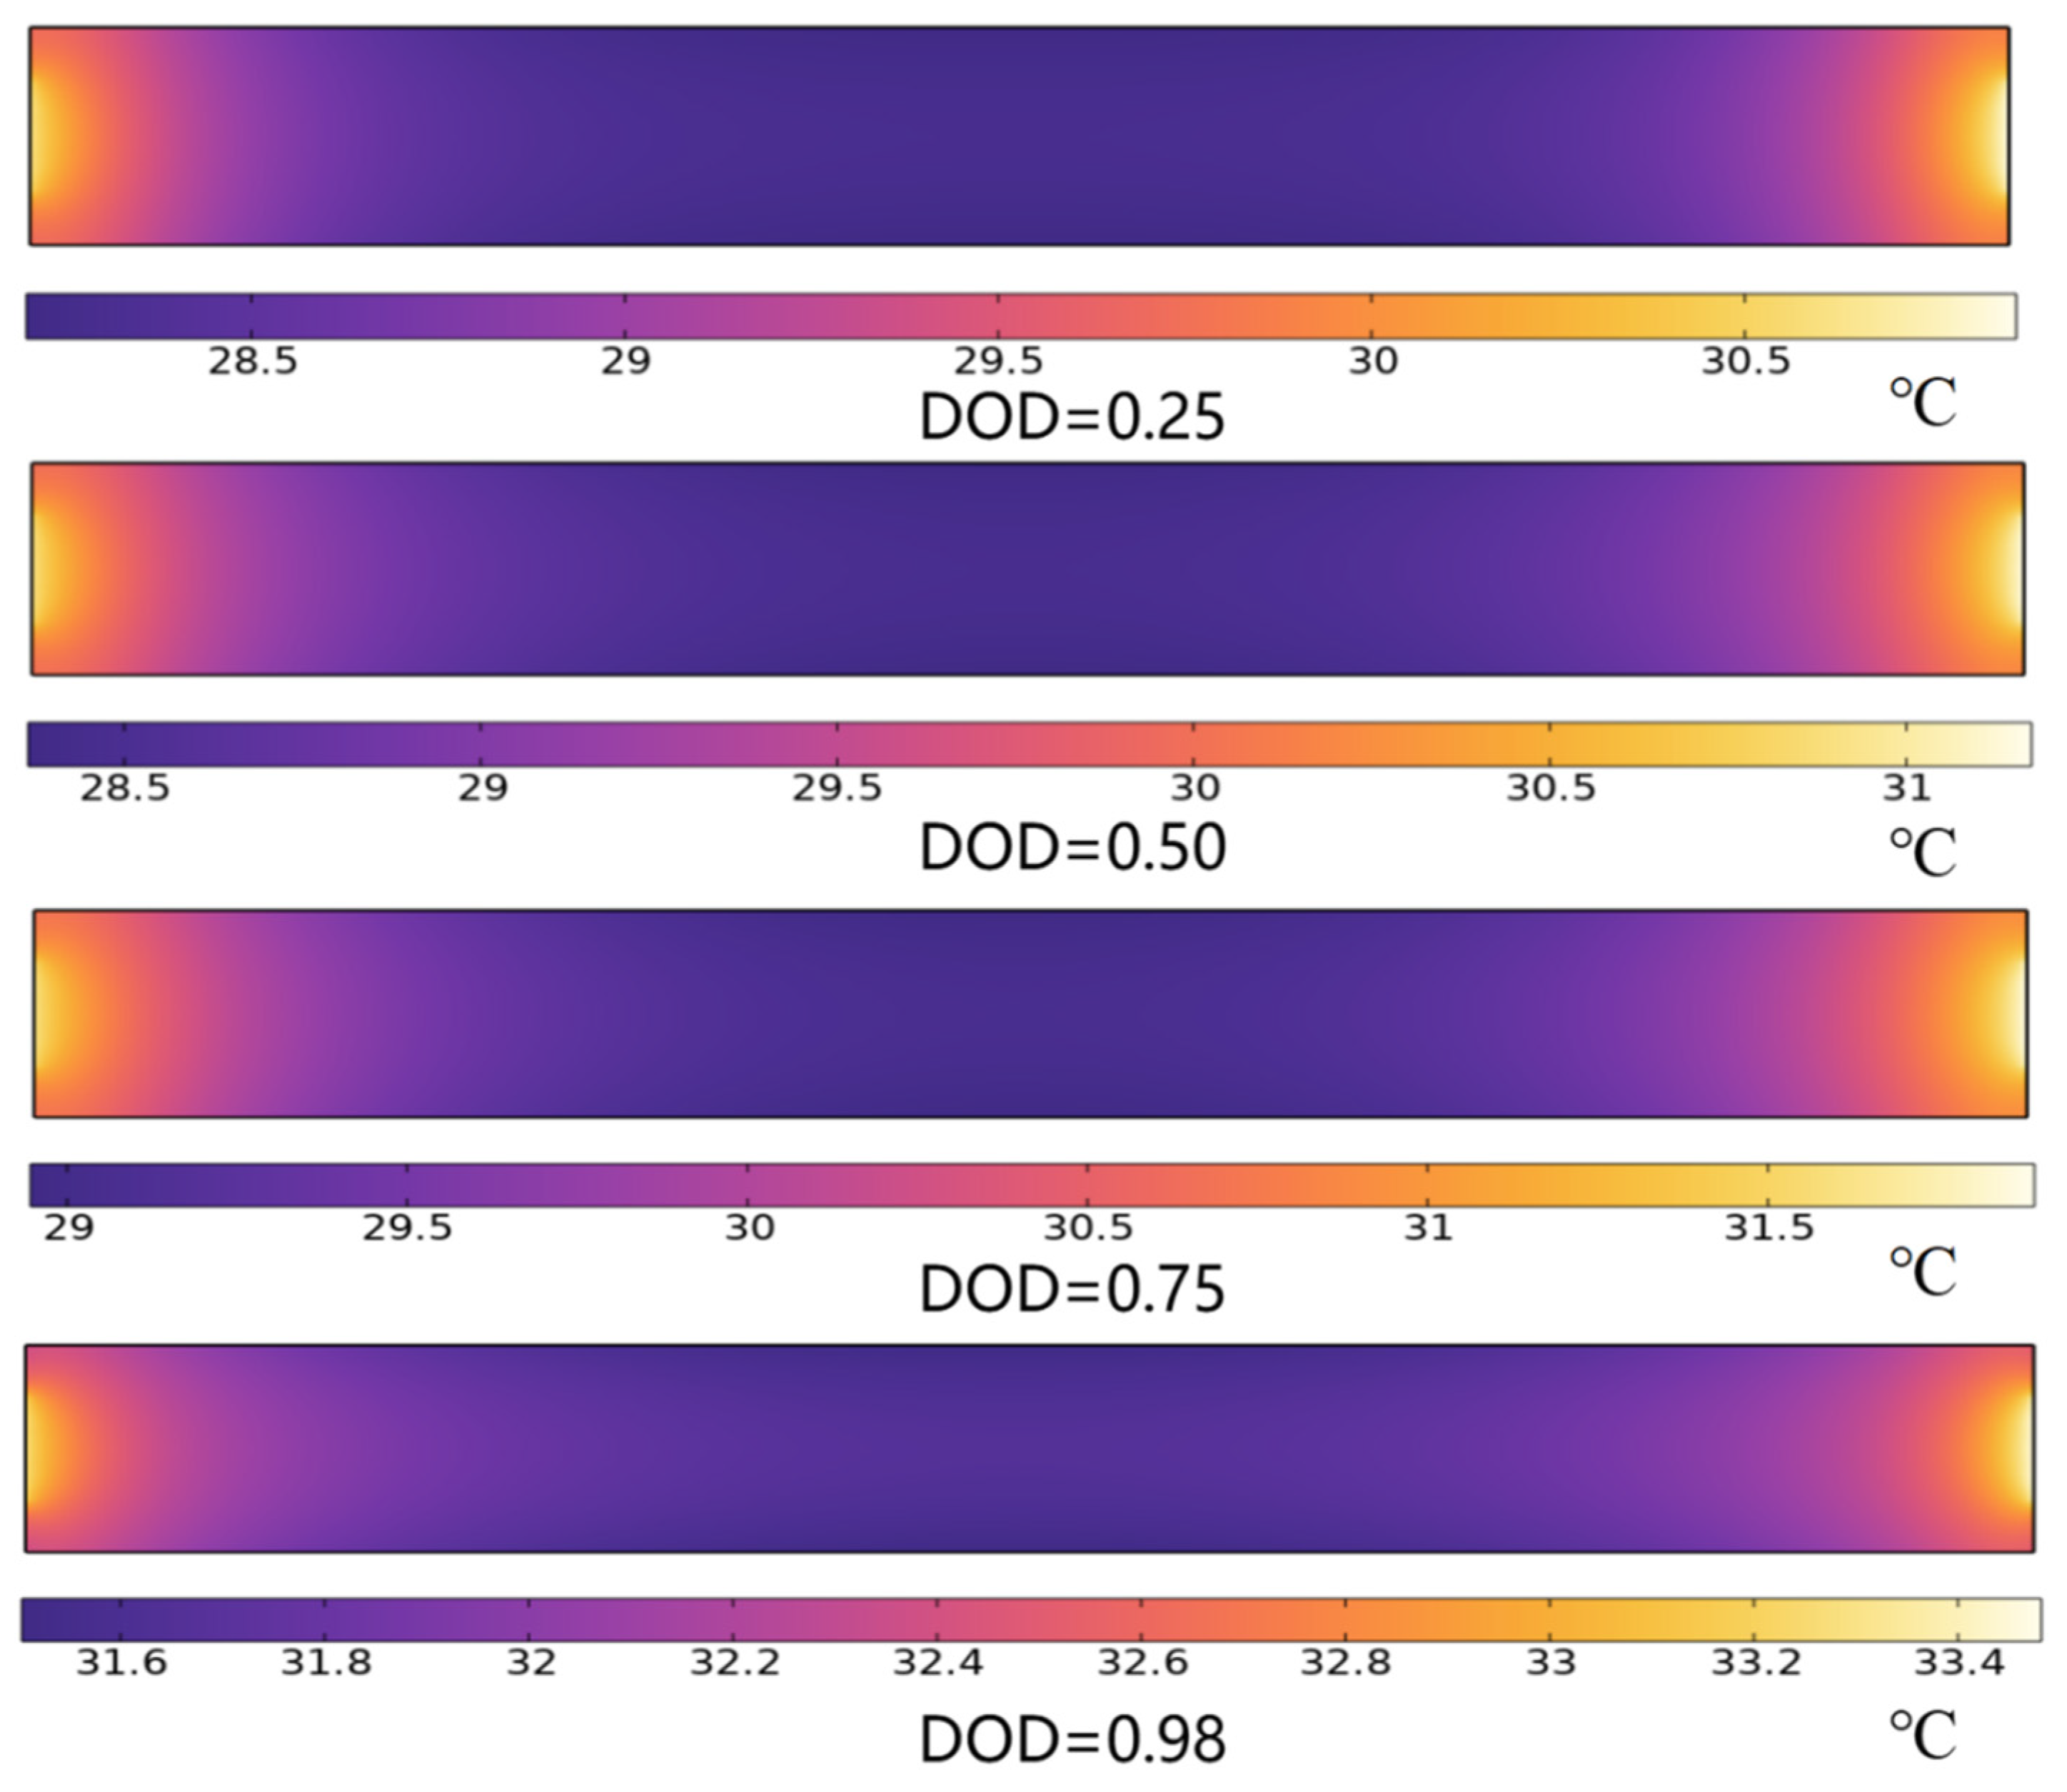
From Equation (16), it can be observed that the distribution characteristics of the heat generation density in the blade battery influence the temperature distribution characteristics of the battery. Figure 10 presents the temperature distribution of the battery under constant current discharge at various DOD values. The results indicate that, at different DOD values, the temperature near the tab side is significantly higher than that in the middle region of the battery. Although the heat generation density in the middle is notably higher than that at both ends at the end of discharge, the temperature near the tab position remains consistently higher. This is attributed to the significantly greater influence of heat generation from the structural components of the battery cover at the ends of the blade battery compared to the middle. However, a comparison of the temperature distribution trends at different DOD values reveals that as the DOD increases, the maximum temperature difference of the battery exhibits a trend of first increasing and then decreasing. This phenomenon is primarily due to the increase in heat generation density in the middle of the battery during the later stage of discharge, which leads to a higher rate of temperature rise in the middle relative to both ends, thereby mitigating the degree of temperature inconsistency within the battery.
Figure 10.
Distribution of battery temperature.
4.2. Simplified Analysis of Heat Source Distribution
The aforementioned 2D electro-thermal fully coupled model can accurately reproduce the real distribution of the internal physical fields within the battery. Nevertheless, the difference in model dimensionality prevents the 2D model from being applied to three-dimensional thermal simulation. This limits its applicability in the thermal design of battery modules. To address this limitation, this section proposes a partitioned heat source scheme. This scheme is based on the aforementioned physical field distribution characteristics and is used to analyze the temperature distribution of the battery. Accordingly, it enables three-dimensional thermal simulation of the battery.
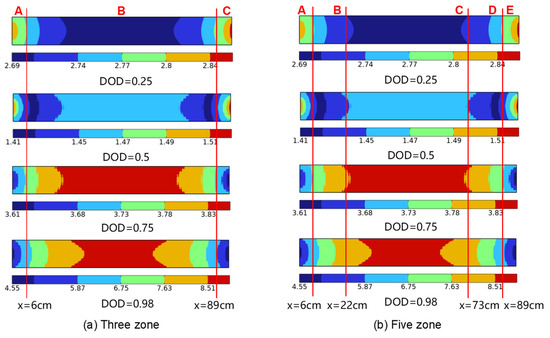
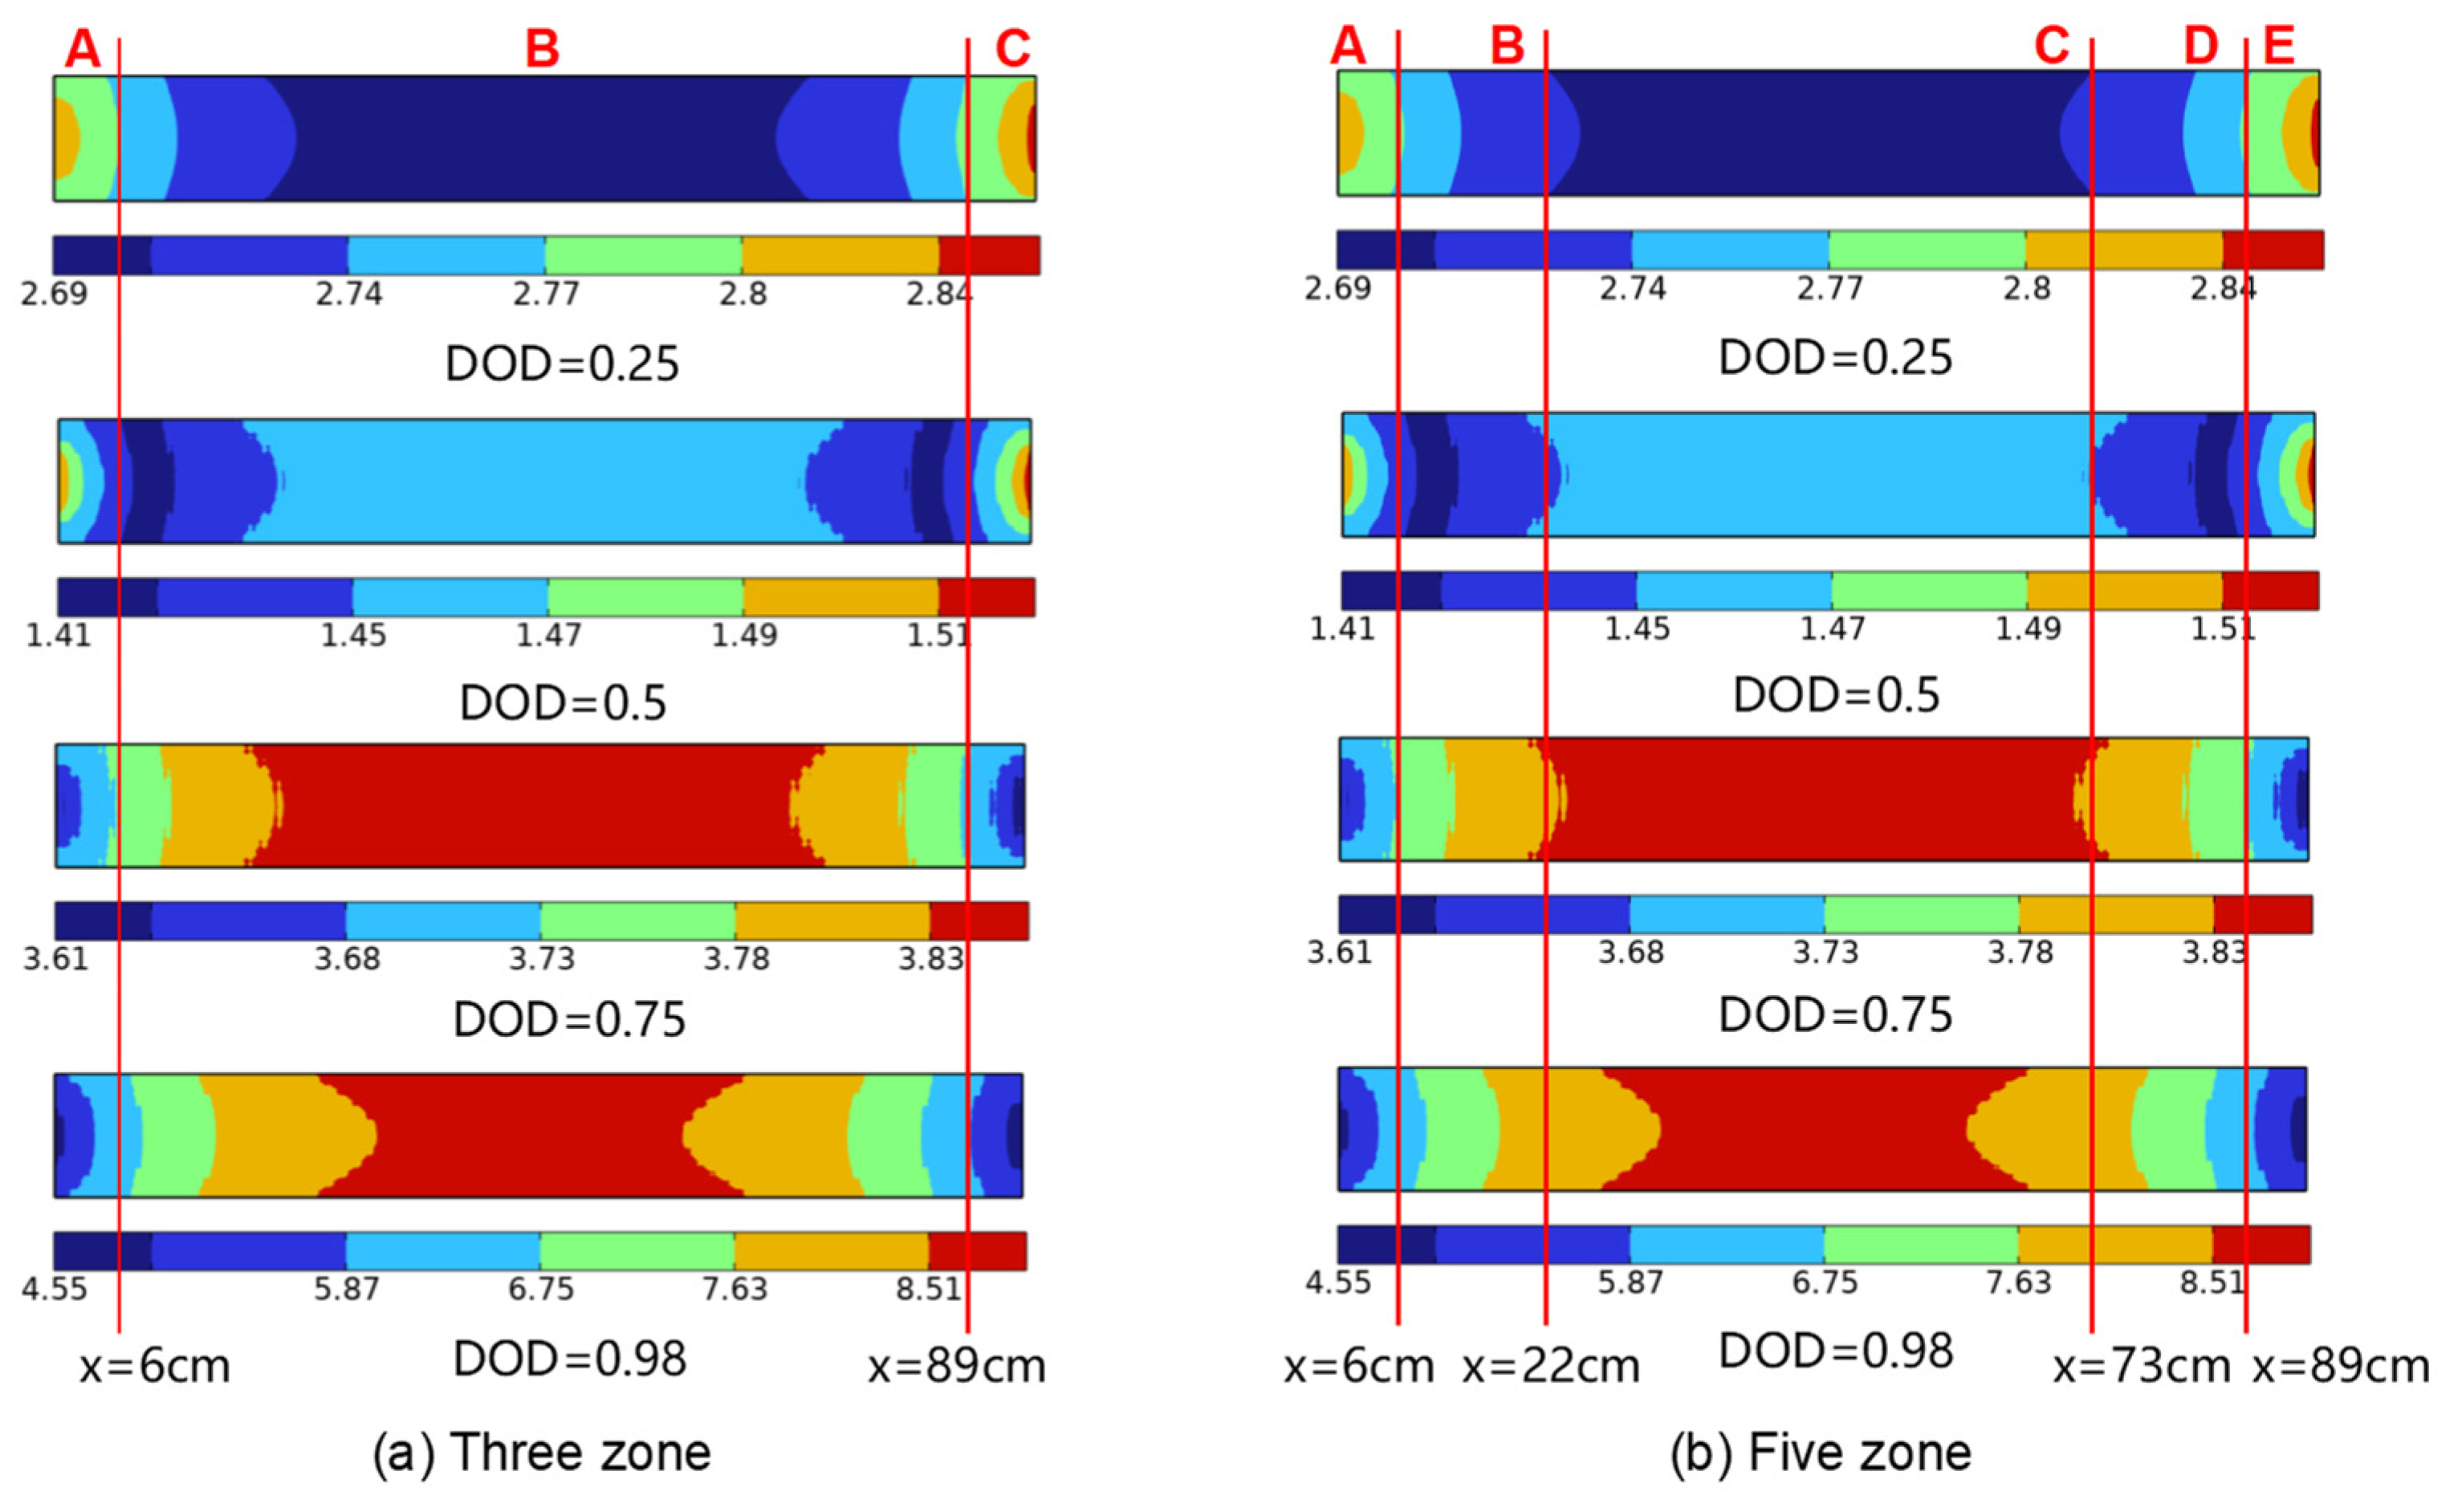
We re-plotted the heat generation density distribution of the blade battery, obtained from the 2D electro-thermal coupled model, using an isosurface mapping method, as shown in Figure 11. It can be observed that heat generation density exhibits a distinct regional pattern. Based on the characteristics of this distribution, two zoning schemes are proposed in this section. As illustrated in Figure 11a, the battery is divided into three regions, while in Figure 11b, it is partitioned into five regions.
Figure 11.
A schematic of the regional heat generation density distribution of the battery.
To analyze the accuracy of the two zoning schemes in simulating battery temperature distribution, the heat source within each zone was averaged at each time step and applied as the local heat source in the corresponding zone of a three-dimensional battery thermal model. The temperature distribution of the battery was then computed using this 3D thermal model. Table 2 compares the results obtained from the three-zone 3D thermal model with those from the experimental data. The results show that the maximum temperature error between the simulated and experimental values was 1.4 °C, occurring at monitoring point T5 at a DOD of 0.98.
Table 2.
A comparison of temperature monitoring points in the three-zone scheme.
The five-zone scheme divides the battery heat source more finely, providing a closer representation of the actual heat generation conditions. Table 3 compares the calculation results of the 3D thermal model under the five-zone scheme with those of the experimental data. The results indicate that the battery temperature distribution calculated by the five-zone three-dimensional thermal model is in better agreement with that of the experiment, with a maximum temperature error of 1.3 °C. These findings demonstrate that the prediction accuracy of the five-zone scheme for temperature distribution differs only slightly from that of the three-zone scheme. However, the five-zone scheme requires dividing the three-dimensional battery model into five segments and assigning independent heat sources to each segment, which inevitably increases the workload of 3D thermal simulation at the battery module level. Therefore, the three-zone scheme is recommended to strike a balance between setup complexity and computational accuracy.
Table 3.
A comparison of temperature monitoring points in the five-zone scheme.
5. Conclusions
In this paper, a two-dimensional electro-thermal fully coupled model is established for large-format blade batteries. Experimental validation demonstrates that the proposed model can accurately predict both the variation trend of the battery terminal voltage and the temperature distribution. The internal electrochemical reaction rate distribution and thermal behavior are thoroughly analyzed. Furthermore, based on the heat generation distribution characteristics, two three-dimensional partitioned modeling schemes for 3D thermal simulation are proposed. The thermal simulation results of these two partitioning schemes are compared and analyzed against experimental data to evaluate their consistency. The main conclusions of this paper are as follows:
- (1)
- The established 2D electro-thermal fully coupled model for blade batteries can accurately predict the inconsistency of the internal physical fields. The maximum relative error between the simulated and experimental values of the battery terminal voltage and average temperature is less than 5%. The maximum error between the simulated and experimental values of the temperature at monitoring points is less than 6%.
- (2)
- The distribution of the electrochemical reaction rate inside the battery exhibits a clear demarcation between the areas near the tabs and the central region. At the initial stage of discharge, the reaction rate is higher near the tabs. At the end of discharge, the reaction rate in the central region of the battery becomes higher.
- (3)
- Based on the distribution characteristics of the internal physical fields, two schemes (three-zone and five-zone partitioning) were adopted for 3D thermal simulation. The prediction accuracy of the five-zone scheme for temperature distribution shows a slight improvement compared to the three-zone scheme. However, considering the complexity of the simulation operation, we recommend the three-zone scheme.
Author Contributions
Conceptualization, J.W. and S.D.; writing—original draft preparation, J.W.; data curation, J.W.; funding acquisition, H.C. and X.Y.; investigation, S.D.; formal analysis, X.Z. All authors have read and agreed to the published version of the manuscript.
Funding
This research was funded by the National Key R&D Program of China, grant number 2022YFB2404400.
Data Availability Statement
The original contributions presented in this study are included in the article. Further inquiries can be directed to the corresponding author.
Conflicts of Interest
Authors Jun Wang, Xueqin Yin, Hu Cao, Shusheng Deng and Xinyan Zhou are employed by the company Electric Power Research Institute, BYD Auto Industry Co., Ltd. The authors declare that the research was conducted in the absence of any commercial or financial relationships that could be construed as a potential conflict of interest.
References
- Zhuo, Z.Y.; Zhang, N.; Xie, X.R.; Kang, C.Q. Key Technologies and Developing Challenges of Power System with High Proportion of Renewable Energy. Autom. Electr. Power Syst. 2021, 45, 171–191. [Google Scholar]
- Zhuang, K.; Fan, P.C.; Jiang, C.Y.; Yin, W.Q.; Ye, J.L.; Wang, H.; Wang, C.L. Optimization of the electricity consumption strategy for agricultural irrigation districts with distributed photovoltaic and energy storage systems. Energy Storage Sci. Technol. 2025, 14, 2782–2790. [Google Scholar]
- Zhang, X.D.; Li, H.; Guo, G.D.; Wang, Z. Succession and Breakthrough in Constructing a New-Type Power System: Challenges, Responses, and New Concepts for Grid Planning in the 15th Five-Year Plan Period. Proc. CSEE 2026, 1–19. [Google Scholar] [CrossRef]
- Liu, J. Key issues and policy mechanisms for developing new energy storage in China. Energy Storage Sci. Technol. 2025, 14, 2625–2634. [Google Scholar]
- Wen, J.Y.; Zhou, B.; Zhou, J.Y.; Lin, Y.J.; Chen, X. Exploring the Role and Value of Energy Storage in Constructing New-type Power Systems. Proc. CSEE 2026, 46, 3917–3937. [Google Scholar] [CrossRef]
- Chen, H.S.; Li, H.; Xu, Y.J.; Xu, D.; Wang, L.; Zhou, X.; Chen, M.; Hu, D.; Lin, H.; Li, X. Research progress in China’s energy storage technology in 2025. Energy Storage Sci. Technol. 2024, 14, 2149–2192. [Google Scholar] [CrossRef]
- Li, Y.; Zhou, Z.; Wu, W.-T. Three-dimensional thermal modeling of Li-ion battery cell and 50 V Li-ion battery pack cooled by mini-channel cold plate. Appl. Therm. Eng. 2019, 147, 829–840. [Google Scholar] [CrossRef] [Scilit]
- Liu, S.Z.; Zhang, T.; Zhang, C.; Yuan, L.; Xu, Z.; Jin, L. Non-uniform heat generation model of pouch lithium-ion battery based on regional heat generation rate. J. Energy Storage 2023, 63, 107074. [Google Scholar] [CrossRef] [Scilit]
- Lin, X.-W.; Zhou, Z.-F.; Zhu, X.-G.; Chen, B.; Zhu, H.; Ben, N.-Y.; Wang, X.-D.; Xu, W.-W. Non-uniform thermal characteristics investigation of three-dimensional electrochemical-thermal coupled model for pouch lithium-ion battery. J. Clean. Prod. 2023, 417, 137912. [Google Scholar] [CrossRef] [Scilit]
- Seongkim, U.; Yi, J.; Burmshin, C.; Han, T.; Park, S. Modelling the thermal behaviour of a lithium-ion battery during charge. J. Power Sources 2011, 196, 5115–5121. [Google Scholar] [CrossRef] [Scilit]
- Zhang, Y.; Zhang, W.; Kong, W. Numerical and experimental study on thermal behavior of prismatic lithium-ion battery for large-capacity energy storage. J. Energy Storage 2024, 83, 110620. [Google Scholar] [CrossRef] [Scilit]
- Mei, W.; Liang, C.; Sun, J.; Wang, Q. Three-dimensional layered electrochemical-thermal model for a lithium-ion pouch cell. Int. J. Energy Res. 2020, 44, 8919–8935. [Google Scholar] [CrossRef] [Scilit]
- Lin, X.W.; Jiang, Y.; Yu, H.T.; Shi, M.Y.; Liu, B.; Wen, X.L.; Zhou, Z.F. A comprehensive investigation on the electrochemical and thermal inconsistencies for 280 Ah energy storage lithium-ion battery. Energy Convers. Manag. 2024, 315, 118750. [Google Scholar] [CrossRef] [Scilit]
- Ding, Y.; Lu, L.; Zhang, H.W. BatteryFOAM: A comprehensive electrochemical-electrical-thermal solver with OpenFOAM for computational battery dynamics. Appl. Energy 2024, 376, 124145. [Google Scholar] [CrossRef] [Scilit]



Disclaimer/Publisher’s Note: The statements, opinions and data contained in all publications are solely those of the individual author(s) and contributor(s) and not of MDPI and/or the editor(s). MDPI and/or the editor(s) disclaim responsibility for any injury to people or property resulting from any ideas, methods, instructions or products referred to in the content. |
© 2026 by the authors. Licensee MDPI, Basel, Switzerland. This article is an open access article distributed under the terms and conditions of the Creative Commons Attribution (CC BY) license.