


Abstract
Magnetic drug targeting (MDT) is commonly evaluated by peak accumulation at the target site. Under pulsatile flow, however, initial deposition does not predict sustained localisation. We introduce the Magnetic Targeting Optimisation Concept (M-TOC), a safety-constrained framework that restructures MDT evaluation by separating geometric deposition from retention stability and embedding both within a defined hemodynamic safety window. Deposition (D) was quantified by using obstruction degree at the injection end, OD(T0), and restricted by a structural admissibility limit (OD_max = 40%). Retention stability (R) was quantified using early washout at T0 + 30 s and an apparent half-life (τ1/2) derived from coverage decay under controlled pulsatile washout. These descriptors were integrated into a Unified Targeting Score (UTS), applied only within the admissible domain, thereby enforcing feasibility before optimisation. Three PEG-functionalised magnetoresponsive nanocluster formulations were evaluated under identical magnetic and flow conditions. D–R mapping identified distinct operating regimes and showed that no tested configuration simultaneously achieved admissible deposition and robust pulsatile stability. By formalising MDT as a constrained multi-objective problem, M-TOC provides an objective method for regime discrimination and a transferable design principle for stability-guided targeting under physiological flow.
1. Introduction
Magnetic Drug Targeting (MDT) aims to increase local drug concentration by using externally generated magnetic-field gradients to exert magnetophoretic forces proportional to ∇|B|2 [1,2,3]. In many experimental studies, the amount of material accumulated at the target site is taken as a direct indicator of therapeutic success. This assumption, however, becomes fragile once physiological flow is considered. In vivo, magnetic deposition occurs under pulsatile blood flow, where velocity and wall shear stress vary continuously throughout the cardiac cycle and interact dynamically with deposited structures [4,5,6].
Under pulsatile conditions, magnetic attraction and hydrodynamic drag act simultaneously on deposited clusters. Magnetic force depends on the local field gradient, whereas drag depends on velocity, viscosity, and particle size. During systole, transient shear-stress peaks can approach—and, in some conditions, exceed—the magnetic forces responsible for retention. When this happens, deposits do not remain static. They rearrange, partially detach, and may progressively destabilise [4,5]. Deposition in a pulsatile environment is therefore better understood as a dynamic transport–stability problem rather than as a one-time capture event.
Increasing magnetic gradients to enhance capture introduces an additional layer of complexity. Stronger gradients increase particle accumulation near the vessel wall and promote cluster growth. That accumulation, in turn, alters local velocity profiles and effectively narrows the lumen in confined geometries [6,7]. Even moderate geometric narrowing can produce nonlinear changes in shear distribution under pulsatile flow. The system is thus governed by three interacting mechanisms: magnetic attraction, pulsatile drag, and progressive structural accumulation. Improving one inevitably perturbs the others.
These interactions challenge a central assumption in much of the MDT literature: that more accumulation necessarily implies better targeting. Peak deposition at the end of injection describes only a temporary geometric condition. It does not reveal how the deposit will behave once physiological flow resumes.
For controlled drug delivery, the critical variable is not how much material is initially captured, but how much remains localised over time without compromising vessel patency [2,3].
For this reason, we argue that deposition amount and retention stability do not scale proportionally under pulsatile flow and should be assessed together. Optimal targeting is expected to exist within a bounded operational region where magnetic forces are sufficient to counter pulsatile drag, yet deposition remains below obstruction levels that disturb lumen integrity. We refer to this region as the hemodynamic safety window (HSW).
In the present study, we experimentally map this safety window using PEG-functionalised magnetoresponsive nanoclusters under controlled pulsatile in vitro conditions. We quantify deposition through obstruction degree and spatial coverage, and we evaluate retention by measuring washout dynamics and time-dependent decay. These descriptors are then combined into a unified optimisation metric that treats magnetic targeting as a stability-constrained design problem rather than an accumulation-maximisation exercise.
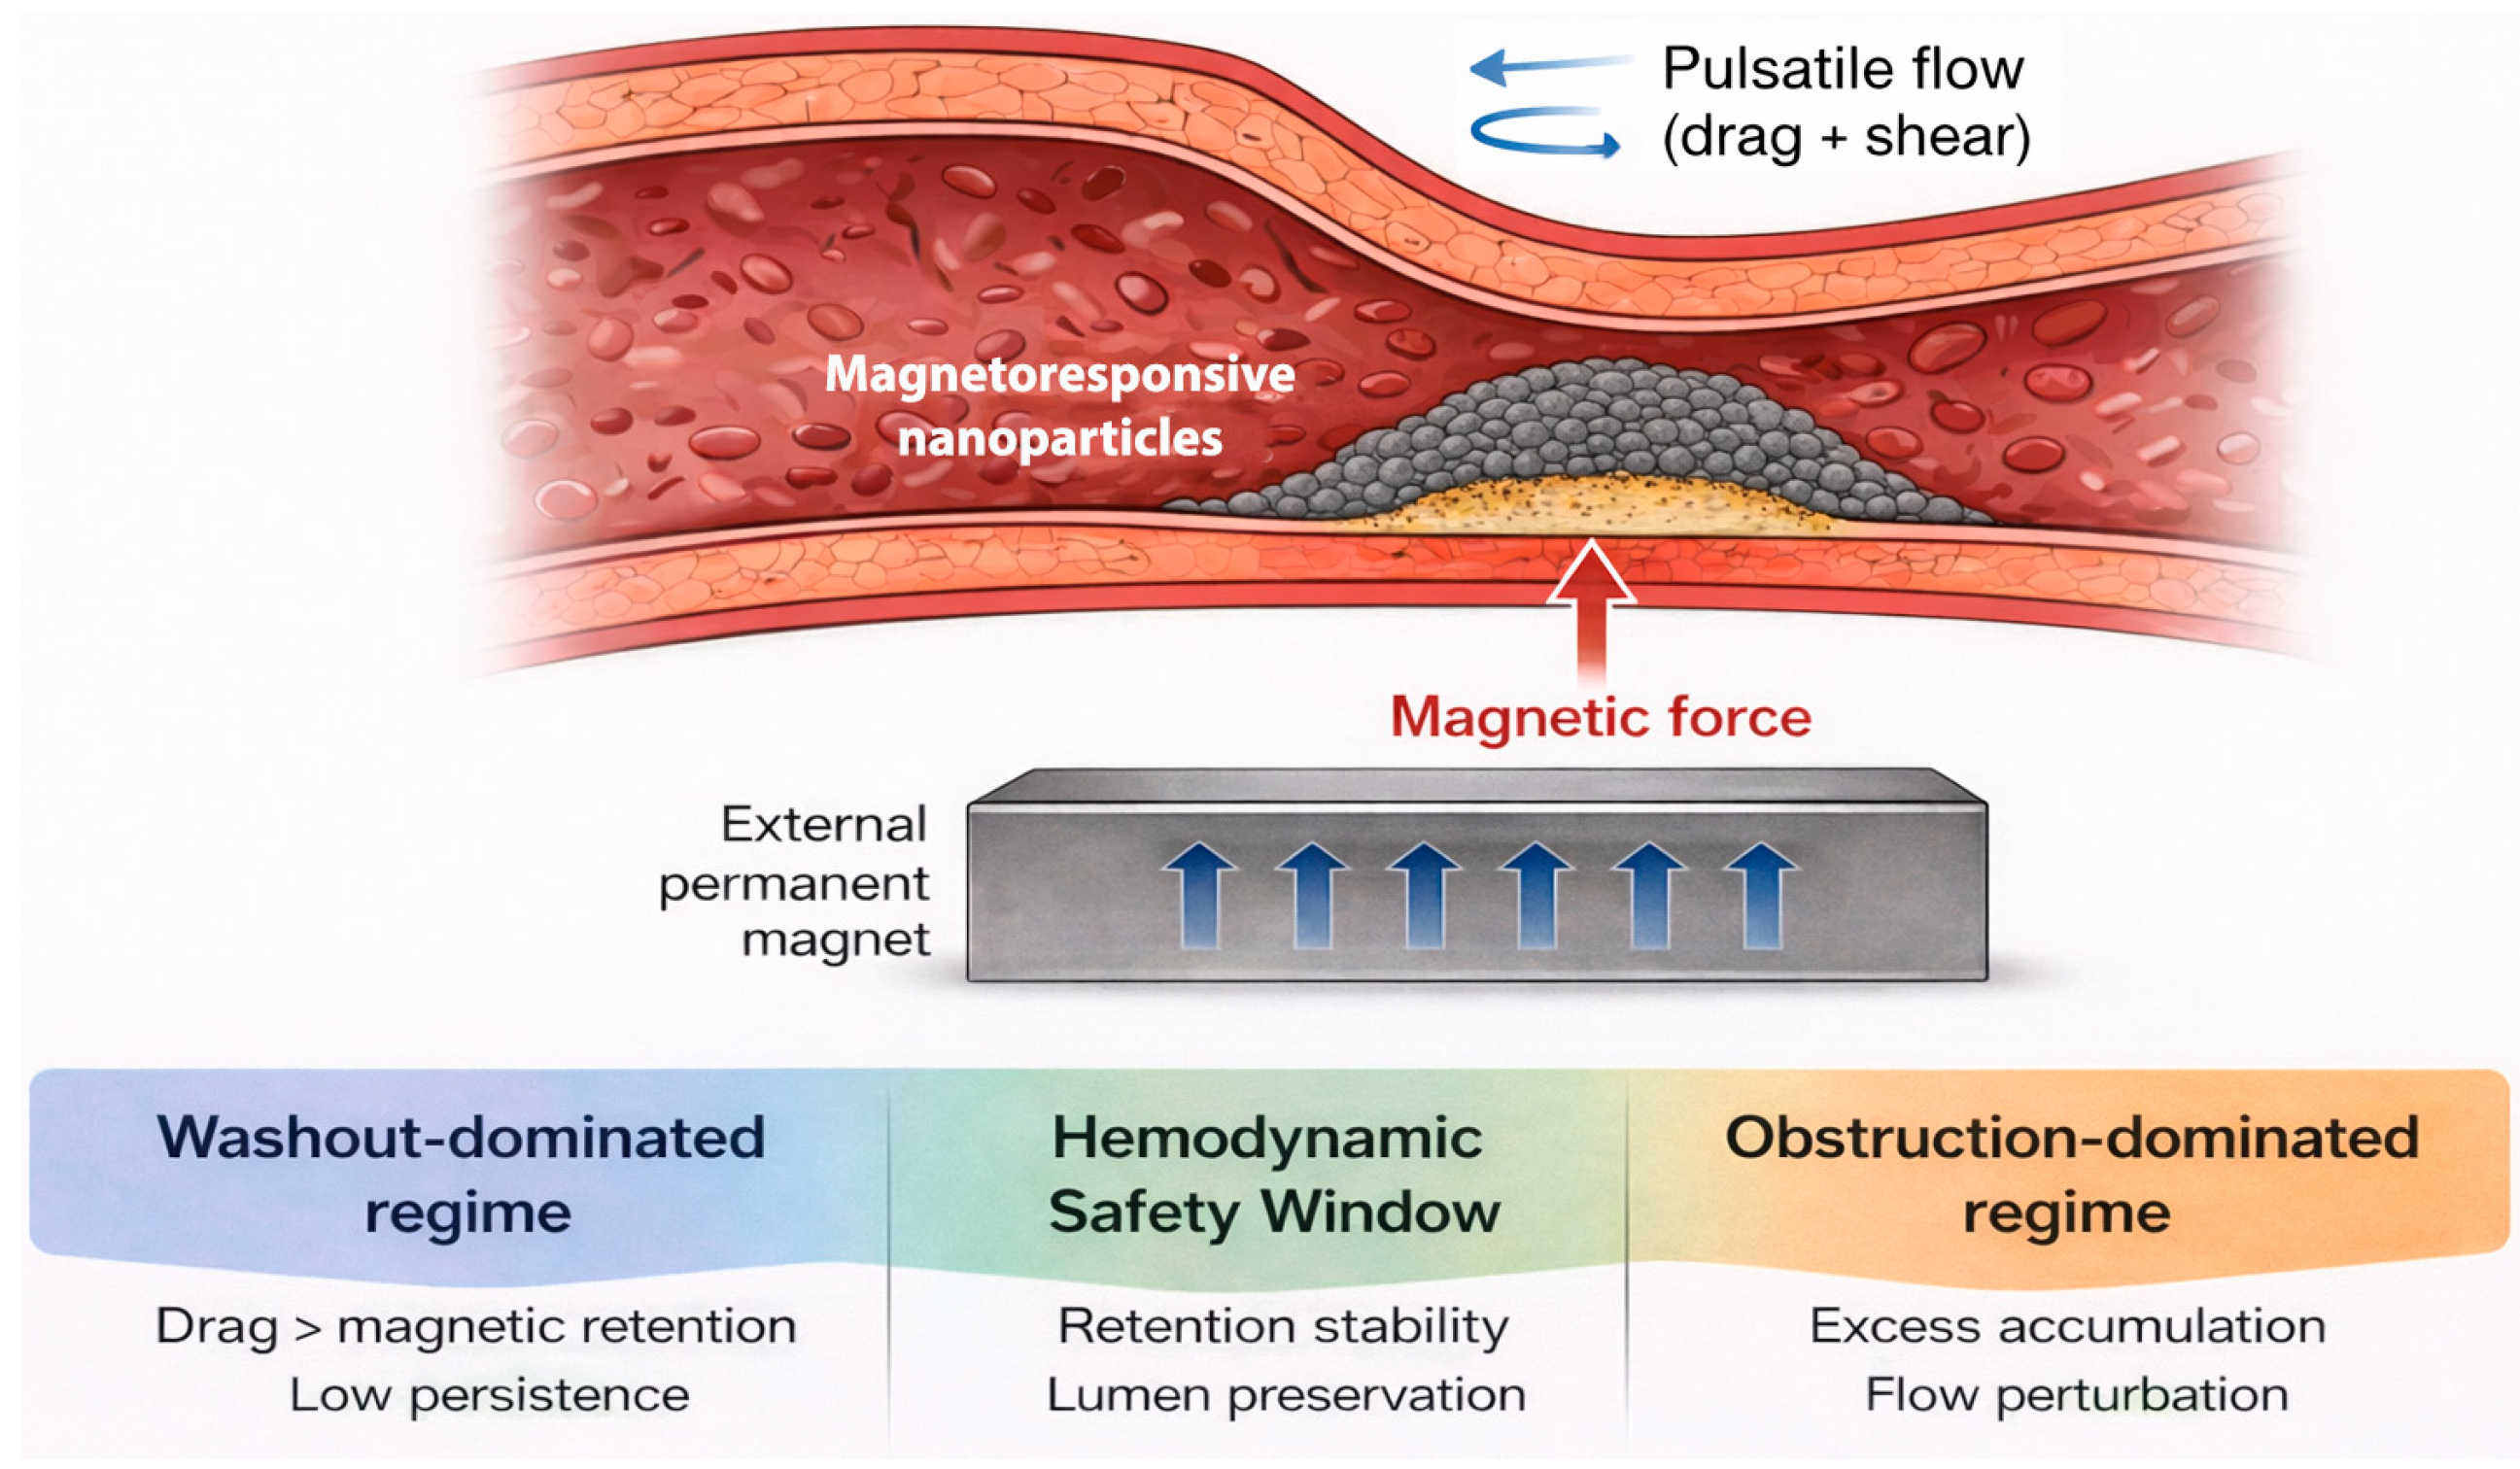
The interplay among magnetic attractions, pulsatile drag, and structural accumulation defines the limits of magnetic targeting under flow. As illustrated in Figure 1, these mechanisms delimit a bounded domain separating washout-dominated states from obstruction-dominated configurations. The hemodynamic safety window lies between these extremes. In the following section, we translate this conceptual boundary into a quantitative optimisation framework.
Figure 1.
Mechanistic framework of the Hemodynamic Safety Window (HSW) in magnetic drug targeting under pulsatile flow. Magnetic deposition results from the competition between magnetophoretic attraction (proportional to ∇|B|2) and pulsatile hemodynamic drag. Concurrently, structural accumulation modifies effective lumen diameter and local shear distribution. These coupled mechanisms define a bounded operational domain. Below the HSW, pulsatile drag dominates, and retention becomes insufficient. Above the HSW, excessive structural accumulation disrupts flow and increases the risk of obstruction. The HSW therefore represents the stability-constrained, physiologically admissible regime for persistent magnetic localisation. The blue arrows schematically indicate the direction of the external magnetic field, while the red arrow marks the region where the magnetic field gradient acts on the magnetoresponsive nanoclusters, promoting their accumulation near the vessel wall.
Rationale and Conceptual Motivation
Although magnetic drug targeting has advanced considerably, performance is still frequently judged by the amount of material accumulated at the end of injection, often under steady or simplified flow conditions [8,9,10]. Retention under physiologically relevant pulsatile shear remains comparatively underrepresented in evaluation criteria, despite evidence that both capture efficiency and stability decrease as flow intensity and shear exposure increase, and that retention strongly depends on magnet configuration and near-wall hydrodynamics [11,12].
What remains uncommon is a structured framework that explicitly separates initial geometric deposition from post-injection stability while simultaneously imposing a structural admissibility constraint on accumulation. Most optimisation strategies aim to maximise capture, yet few systematically examine whether that capture remains compatible with lumen patency once pulsatile flow resumes.
Increasing magnetic gradients to enhance capture may simultaneously promote near-wall aggregate growth, thereby modifying local flow structure and effectively narrowing the lumen. Despite this geometric consequence, the magnitude of accumulation is rarely treated as an explicit design constraint in optimisation strategies [13,14]. Vascular biomechanics research has long demonstrated that even moderate reductions in diameter can induce nonlinear changes in wall shear stress and flow topology [15,16,17]. Computational fluid dynamics studies further confirm that as the severity of narrowing increases, wall shear stress distributions shift and disturbed-flow features intensify [18,19]. Although magnetically induced deposition is not equivalent to pathological stenosis, the governing hemodynamic principles remain applicable.
For this reason, we adopt OD < 40% as a conservative geometric boundary for magnetic accumulation within the present framework. This value is not intended as a universal clinical threshold, but as a controllable structural constraint within a bounded optimisation problem.
To address these methodological gaps, we developed the Magnetic Targeting Optimisation Concept (M-TOC). Rather than treating structural admissibility as a secondary outcome, M-TOC incorporates it as a governing constraint. Lumen patency is quantified using the obstruction degree (OD), defined as the relative reduction in the effective lumen diameter caused by the deposited magnetic layer. This parameter provides a geometric measure of the degree to which magnetic accumulation narrows the vessel lumen and therefore defines the admissible structural domain within which magnetic targeting may operate.
Within this constrained region, performance must reflect both the magnitude of deposition and its stability under pulsatile washout. We therefore introduce a Unified Targeting Score (UTS) that integrates deposition quality (restricted by OD) and retention stability into a single bounded metric. In the balanced configuration (α = β = 0.5), structural containment and dynamic persistence are weighted equally, preventing implicit prioritisation of excessive accumulation or transient stability.
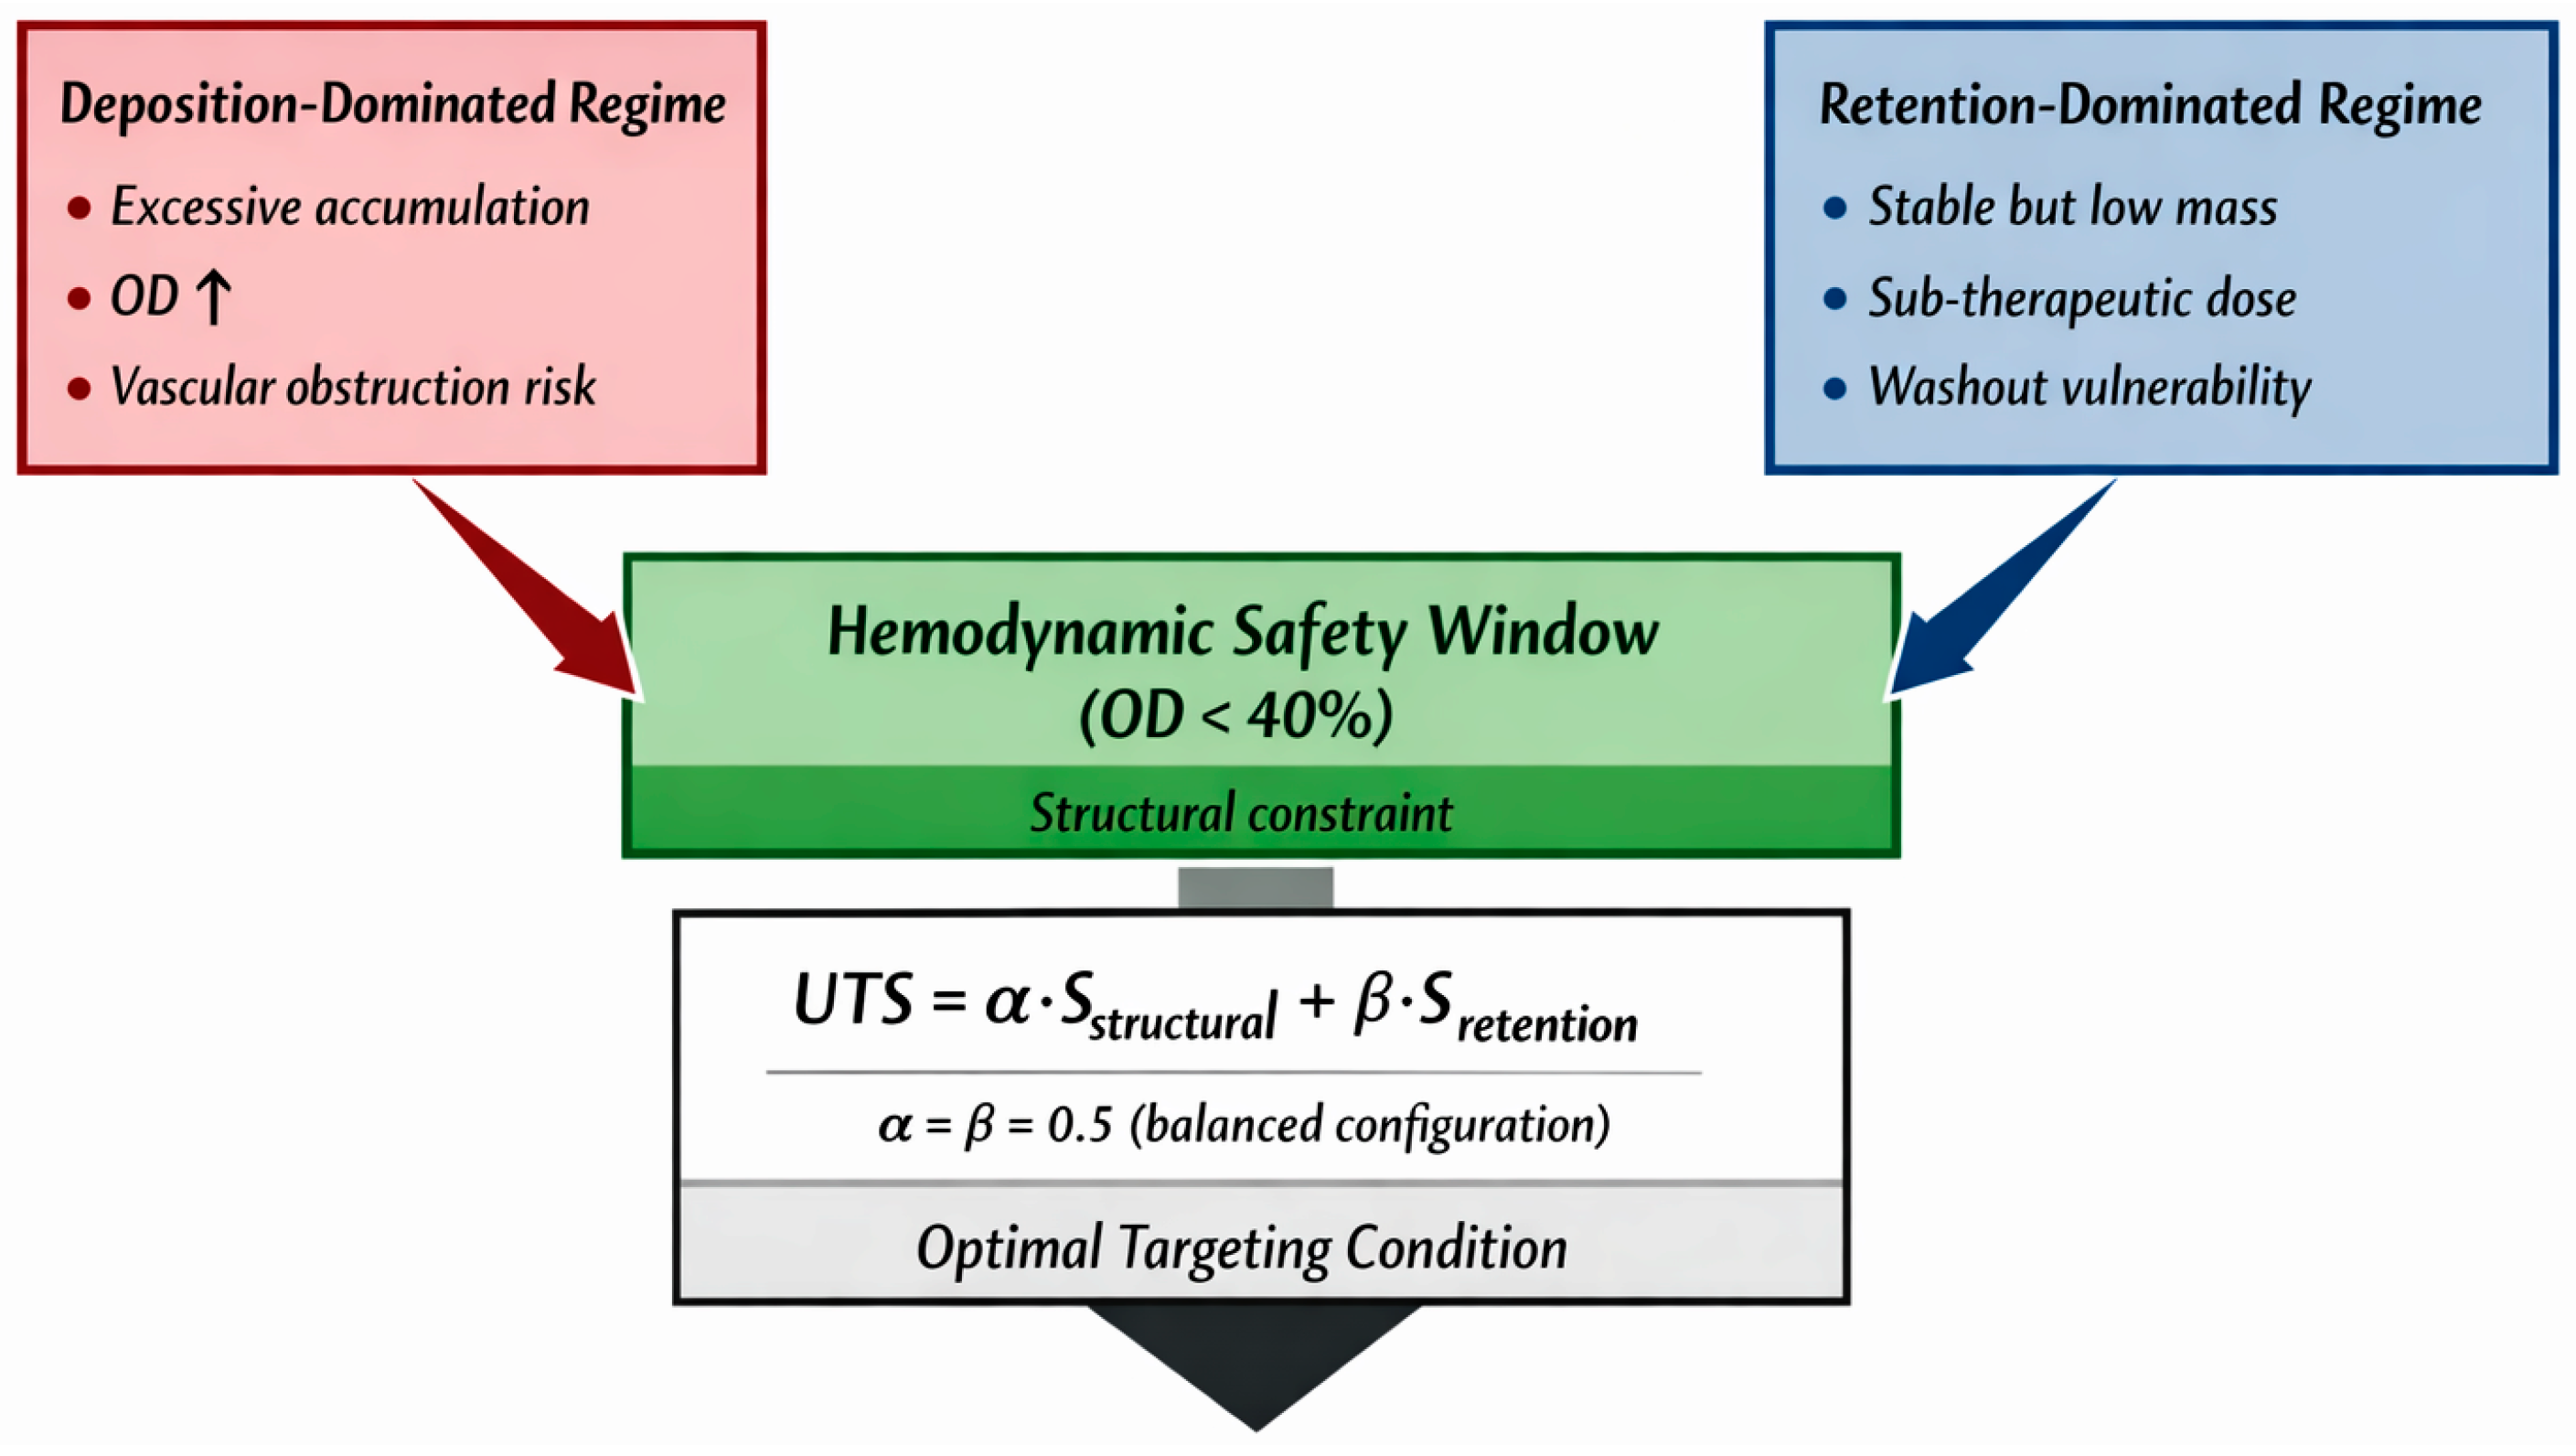
By embedding geometric limits and pulsatile retention within a single evaluative framework, M-TOC enables us to distinguish washout-dominated states from obstruction-constrained ones and to compare nanoparticle formulations, magnet geometries, and flow conditions on common ground. Figure 2 summarises the conceptual architecture of this approach. The formal mathematical definitions follow in Section 2.
Figure 2.
Conceptual representation of the Magnetic Targeting Optimisation Concept (M-TOC). Magnetic drug targeting is reframed as a dual-objective optimisation problem bounded by a structurally defined hemodynamic safety window (Obstruction Degree, OD < 40%). Deposition-dominated regimes, characterised by excessive magnetic accumulation, increase the risk of obstruction, whereas retention-dominated regimes may provide stability without achieving a therapeutically sufficient local dose. M-TOC integrates structural safety and pulsatile retention stability into a Unified Targeting Score (UTS), defined as UTS = α·S_structural + β·S_retention. In the balanced configuration (α = β = 0.5), equal weight is assigned to obstruction-defined safety and dynamic persistence, enabling identification of optimal targeting conditions within physiologically safe limits.
2. Magnetic Targeting Optimisation Concept (M-TOC)
2.1. Formal Definition of the Hemodynamic Safety Window
The obstruction degree (OD) was previously introduced as a geometric descriptor of magnetic deposition under pulsatile conditions [20,21]. In earlier work, OD quantified the extent of lumen narrowing associated with magnetic accumulation.
Within the present framework, OD is elevated from a descriptive parameter to a structural admissibility constraint. It defines the geometric boundary within which magnetic targeting is considered acceptable.
OD is calculated as:
where h denotes the maximal radial thickness of the deposited layer and D the native internal vessel diameter, because local protrusion determines effective lumen narrowing, maximal thickness is used as a conservative structural reference.
Each targeting configuration must satisfy a predefined obstruction limit: .
In the present implementation, we set .
This value requires contextual clarification. Clinical stenosis grading often uses thresholds around 50% diameter reduction [22]. However, our framework does not model pathological stenosis. Magnetic deposition is externally controlled and, in principle, adjustable. For this reason, we introduce a 40% geometric boundary as a conservative estimate intended to preserve lumen patency under pulsatile conditions.
The threshold should therefore be interpreted as a design constraint rather than a clinical cutoff. It defines the structural safety margin within which optimisation may proceed. Configurations exceeding this limit are classified as structurally inadmissible, regardless of retention performance.
Under this definition, the Hemodynamic Safety Window corresponds to the subset of configurations that satisfy the OD constraint while maintaining measurable stability during pulsatile exposure. Structural admissibility is thus enforced before any optimisation metric is applied.
2.2. Retention Descriptors
In previous work, retention under pulsatile flow was characterised using two complementary parameters: washout degree (WD) and retention half-life (τ1/2) [21]. These descriptors capture different temporal aspects of deposit behaviour once injection ends and physiological flow resumes.
We define the washout degree (WD) as the relative reduction in projected surface coverage between the end of injection (T0) and the end of a predefined washout interval (T7):
where denotes the coverage at injection termination and the coverage after the pulsatile washout period.
WD therefore measures the amount of the initially deposited material lost under controlled pulsatile exposure. A higher WD indicates weaker early retention.
To describe how the remaining deposit evolves, we approximate the temporal coverage decay using a first-order exponential model over the fixed washout interval:
Here, kout represents an apparent detachment constant derived from the experimental decay curve. The corresponding retention half-life is obtained from:
We emphasise that this exponential representation serves as an operational descriptor of apparent decay behaviour within a limited observation window. It is not intended to resolve the intrinsic kinetics of nanoparticle detachment. Instead, it provides a stable and reproducible parameter for comparing formulations under identical pulsatile conditions.
WD and τ1/2 therefore describe complementary aspects of retention. WD captures the magnitude of early material loss immediately after flow restoration, whereas τ1/2 reflects the rate at which the remaining deposit declines over time. A formulation may exhibit limited initial washout yet decay rapidly thereafter, or, conversely, sustain greater early loss but stabilise during prolonged exposure. Considering only one parameter would provide an incomplete picture of deposit persistence.
Within M-TOC, WD and τ1/2 are retained as directly measurable descriptors of pulsatile stability. In the next section, these quantities are normalised and combined into a single retention component (R), enabling joint evaluation with the deposition component (D) under the structural admissibility constraint.
2.3. Unified Targeting Score (UTS)
Magnetic targeting under pulsatile flow requires two conditions to be satisfied simultaneously. First, deposition must remain within the admissible obstruction limit defined in Section 2.1. Second, the deposited material must be stable under pulsatile shear. These requirements are conceptually distinct and should not be conflated.
To jointly evaluate them, we introduce a Unified Targeting Score (UTS) that combines deposition and retention into a single scalar quantity, while enforcing structural admissibility as a prior condition.
- Deposition Component (D)
Within the admissible domain OD ≤ OD_max, we express deposition as a normalised quantity:
This formulation ensures that deposition increases monotonically with obstruction while remaining bounded between 0 and 1. Configurations exceeding OD_max are excluded from optimisation. Structural admissibility is therefore treated as a hard constraint rather than a weighted objective.
- Retention Component (R)
Retention stability is derived from the experimentally measurable descriptors introduced in Section 2.2: washout degree (WD) and retention half-life (τ1/2).
We first transform washout into a retention-quality term:
Lower washout corresponds to higher retention quality, and the resulting score is bounded between 0 and 1.
The half-life is normalised relative to the maximal observed value within the experimental dataset:
This scaling preserves the internal ranking among tested configurations and ensures comparability within the validated parameter space. It does not imply cross-system kinetic equivalence.
We then combine both contributions:
where defines the relative emphasis placed on early washout resistance versus longer-term persistence. In the balanced configuration used throughout this study, . This linear combination keeps the retention metric transparent and directly interpretable.
- Unified Targeting Score
Deposition and retention are finally integrated as:
with the constraint:
In the balanced reference configuration:
This choice reflects a neutral assumption: structural containment and retention stability are equally necessary for effective targeting. Alternative weightings can be explored for application-specific priorities, but admissibility remains mandatory.
By construction, UTS is bounded between 0 and 1. Maximising UTS identifies the configuration that best balances deposition and retention within the imposed structural constraint.
We deliberately adopt a linear weighted combination to preserve interpretability. The objective is not to conceal the trade-off between accumulation and stability, but to express it explicitly in a reproducible form.
- Scope and Experimental Validation
The mathematical structure of UTS does not depend on nanoparticle composition, magnet geometry, or vessel diameter. Its components are expressed in normalised form so that the same logic can, in principle, be applied across different targeting scenarios.
In the present study, however, we validate the framework within a defined experimental configuration: PEG-functionalised magnetoresponsive nanoclusters evaluated under controlled pulsatile flow and fixed magnet–vessel geometry. The normalisation of retention half-life relative to the maximal observed value reflects this bounded parameter space.
Accordingly, the current implementation should be viewed as a proof-of-concept validation rather than an exhaustive exploration of all possible configurations. The generality of the framework arises from its mathematical formulation, whereas quantitative outcomes remain configuration dependent.
2.4. Operational Regime Identification
Magnetic targeting under pulsatile flow can be formalised as a constrained bi-objective problem involving deposition (D) and retention stability (R), restricted to the admissible domain defined by OD ≤ OD_max.
Within this domain, each configuration is represented as a point in the D–R plane. Because increasing magnetic attraction may enhance deposition without proportionally improving retention, D and R are coupled but not strictly aligned.
In multi-objective optimisation theory, configurations that cannot be improved in one objective without compromising the other form the Pareto frontier [23]. In the present context, a configuration is non-dominated if no other admissible configuration simultaneously increases both deposition and retention stability. The set of such configurations represents the best achievable compromises between accumulation and stability within the OD-constrained domain.
To interpret this interaction, we represent each configuration in the D–R space, restricted to the admissible domain OD ≤ OD_max. Within this space, some configurations offer a better balance between deposition and retention than others.
A configuration is considered non-dominated if no other admissible configuration simultaneously improves both D and R. The set of such configurations defines the practical trade-off boundary between accumulation and stability. Rather than treating this boundary as an abstract optimisation concept, we use it as a geometric tool for interpreting experimental data.
The Unified Targeting Score (UTS) introduced above provides a convenient way to summarise this trade-off numerically. For fixed weighting parameters, maximising UTS selects a specific point along the admissible trade-off boundary, depending on the relative emphasis assigned to deposition and retention.
From this perspective, three operational regimes naturally emerge:
- −
- Washout-dominated regime. Deposition occurs, but retention remains weak. Alternative admissible configurations achieve higher stability without increasing obstruction.
- −
- Stability-favoured regime. Deposition and retention reach a balanced state within the obstruction constraint. Configurations in this region lie close to the admissible trade-off boundary and represent the most effective targeting conditions under the imposed limits.
- −
- Obstruction-constrained regime. Deposition approaches the structural threshold without proportional improvement in retention. Further accumulation yields diminishing practical benefit and may compromise lumen patency.
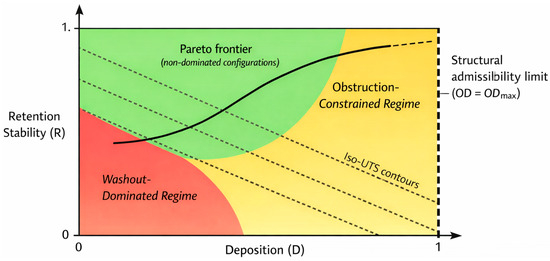
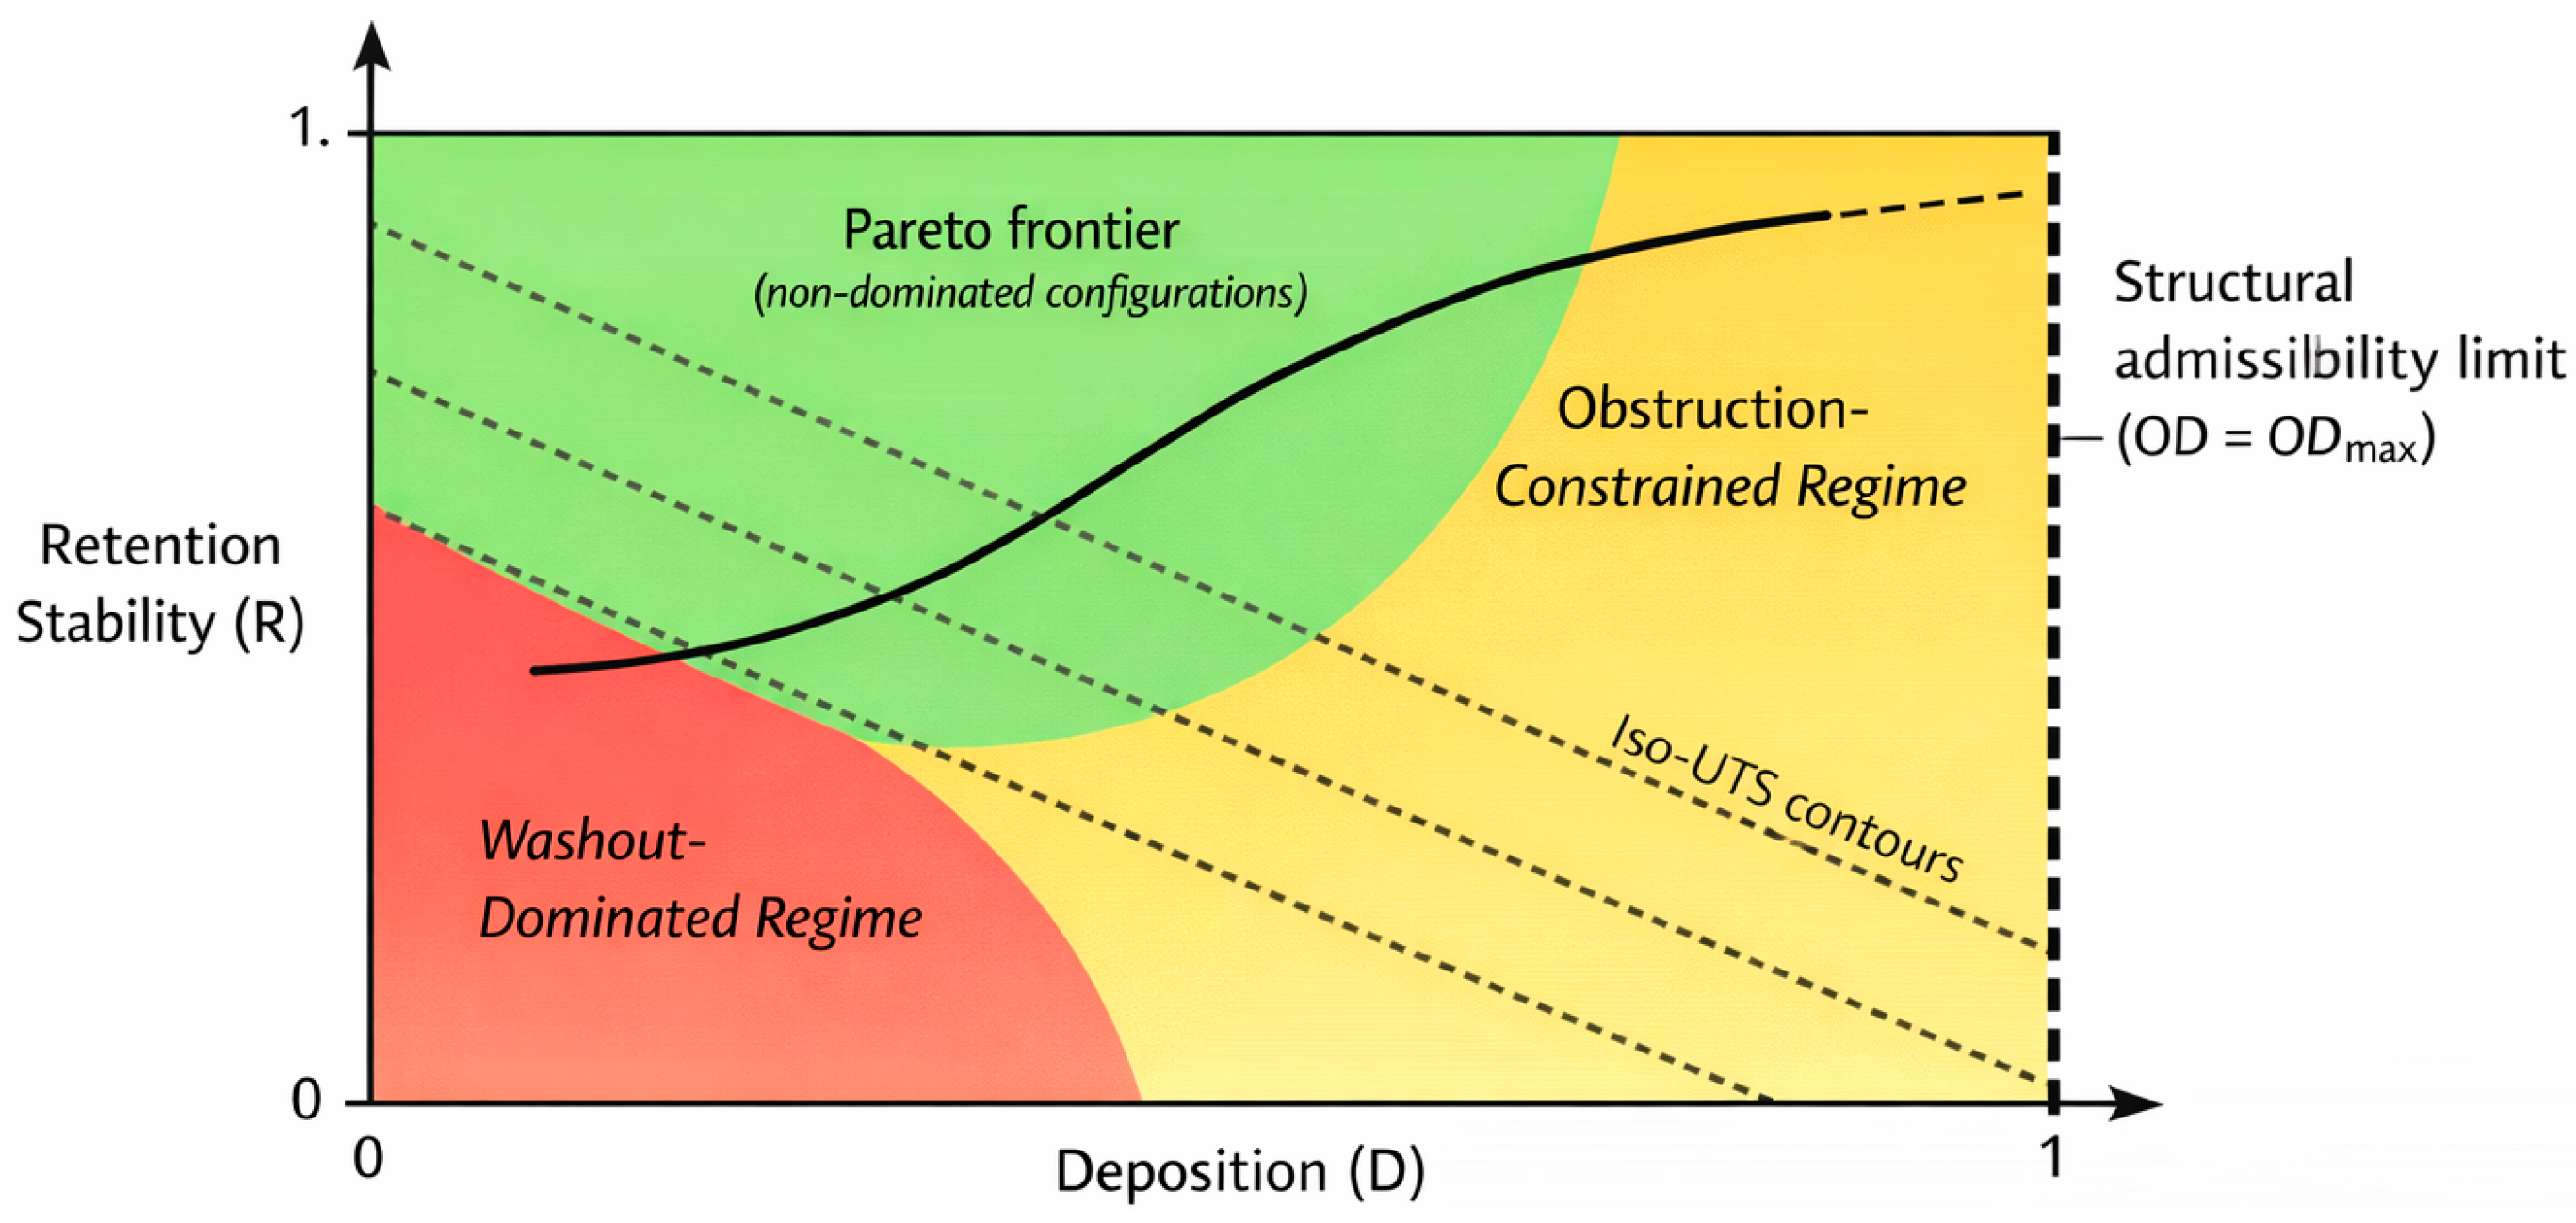
Importantly, these regimes are not defined by arbitrary cut-offs. They arise from the geometry of the D–R interaction under structural constraint. Figure 3 illustrates this conceptual landscape and provides the reference framework for positioning the experimental results presented later.
Figure 3.
Conceptual D–R trade-off landscape under structural constraint. Magnetic targeting configurations are represented in the normalised deposition–retention space. The admissible domain is bounded by the structural obstruction limit (D = 1). Non-dominated configurations form the Pareto frontier, representing optimal trade-offs between deposition and retention stability. Iso-UTS contours illustrate scalarization of the bi-objective problem. Three operational regimes emerge naturally from this geometry: washout-dominated, stability-favoured, and obstruction-constrained. The continuous–discontinuous line schematically represents the conceptual trade-off boundary between deposition and retention within the admissible domain. Along this boundary, improvements in one component occur at the expense of the other, illustrating the constrained optimisation landscape underlying the D–R framework.
2.5. Implications for Constrained Targeting Optimisation
The M-TOC framework reframes magnetic drug targeting as a constrained performance problem rather than a simple accumulation-maximisation exercise. Increasing deposition alone does not guarantee improved targeting if structural limits are exceeded or if retention under pulsatile flow remains weak.
In practical terms, admissible targeting must satisfy two conditions simultaneously: obstruction must remain below the predefined threshold, and the deposited material must persist under shear. These criteria are not independent. Adjusting magnet strength, nanoparticle formulation, or dosing may improve one aspect while compromising the other.
This perspective has methodological consequences. Experimental comparisons should not rely solely on peak deposition values measured at injection termination. Instead, configurations should be evaluated within the D–R space, where deposition and retention are considered together under the obstruction constraint. A configuration that approaches the structural limit without achieving proportional gains in stability does not necessarily represent better targeting performance.
By making this trade-off explicit, M-TOC provides a structured framework for comparing nanoparticle formulations and magnet configurations under pulsatile conditions. It also clarifies why certain parameter combinations appear promising when judged by accumulation alone but fail to remain stable once flow resumes.
The framework does not prescribe a single optimal configuration. Rather, it defines the admissible region within which optimisation can occur and makes transparent the balance required between geometric containment and dynamic persistence. In this sense, it functions less as a ranking tool and more as a decision framework for constrained targeting design.
3. Materials and Methods
3.1. Experimental Platform and Operational Implementation
To implement the M-TOC framework under controlled conditions, we used the in vitro arterial phantom platform described in our previous work [21]. We deliberately preserved the same phantom geometry, pump waveform, and magnet positioning to maintain hemodynamic continuity with the earlier dataset. This continuity allows the present study to focus on structured D–R mapping rather than on geometric reconfiguration.
A rectangular NdFeB35 permanent magnet (30 × 20 × 20 mm; nominal surface field 0.45 T; 35 MGOe) served as the external magnetic source. The NdFeB magnet used in the experiments had a maximum energy product (BHmax) of 35 MGOe (Mega-Gauss Oersted), a standard unit used to express the magnetic energy density of permanent magnets. We fixed the magnet at a constant stand-off distance of 11 mm from the outer wall of the flow tube using a rigid mechanical holder. This setup eliminated placement variability and ensured that any differences observed between formulations could not be attributed to changes in magnet position.
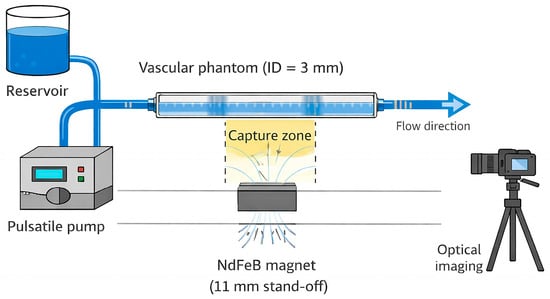
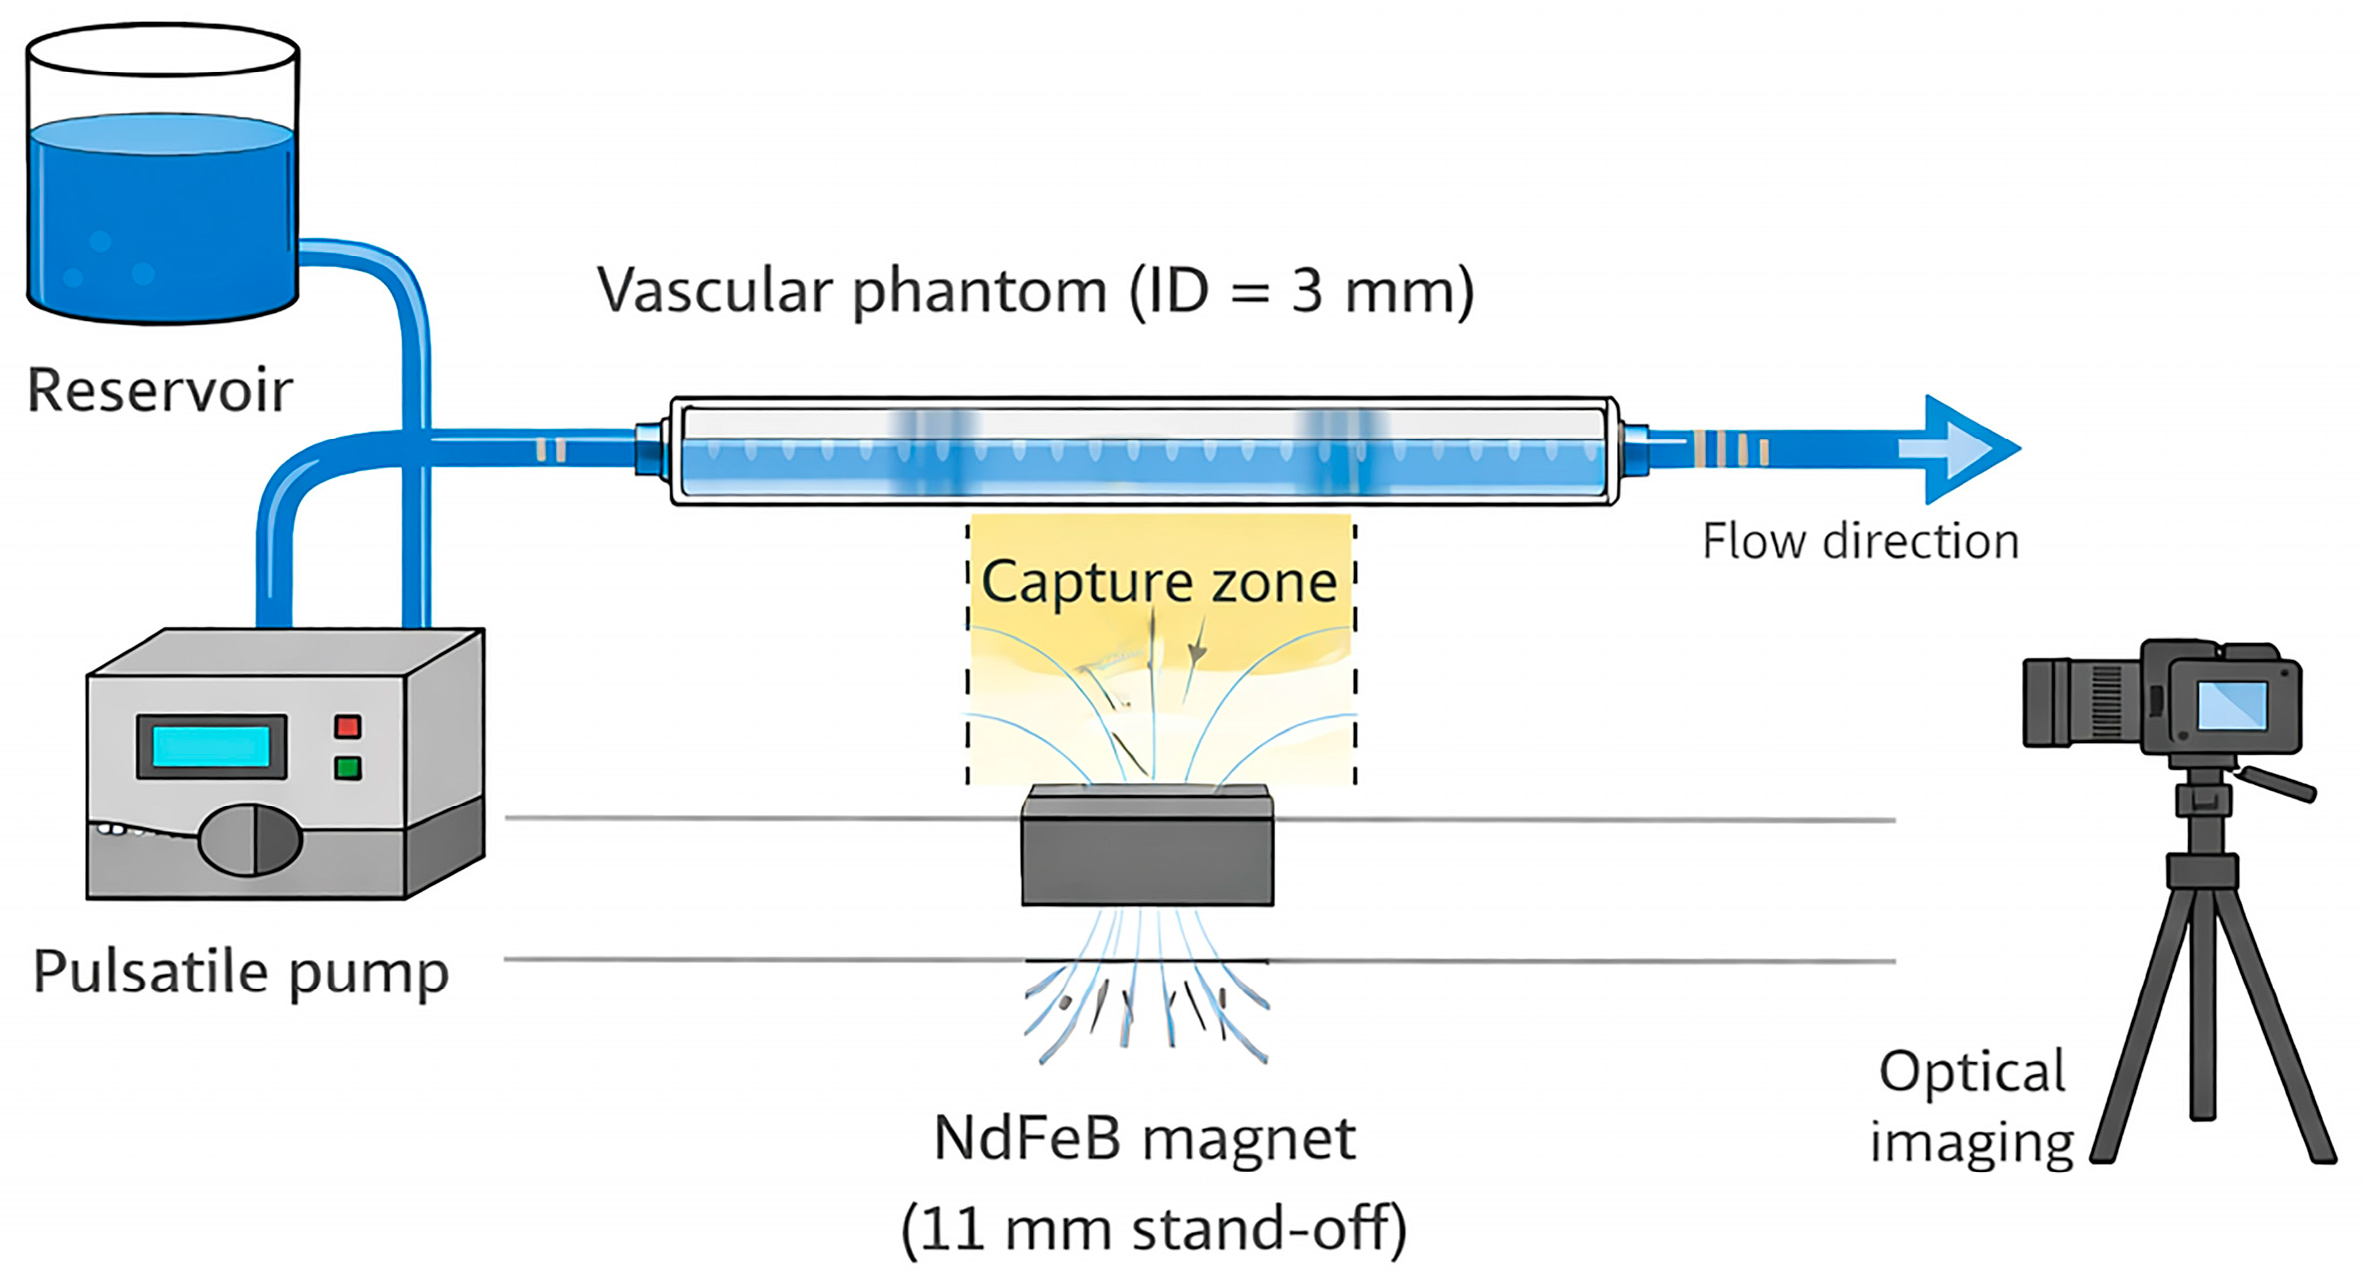
A schematic overview of the experimental platform is presented in Figure 4. The diagram illustrates the main elements of the pulsatile targeting system, including the programmable pulsatile pump, the vascular phantom segment positioned within the magnetic capture region, the external permanent magnet placed at a fixed stand-off distance, and the optical imaging system used to monitor deposition morphology during the experiment.
Figure 4.
Schematic representation of the experimental setup used for magnetic drug targeting under pulsatile flow. A programmable pulsatile pump drives the working fluid through a transparent vascular phantom. A rectangular NdFeB permanent magnet is positioned below the vessel at a fixed stand-off distance (11 mm), generating the magnetic field gradient responsible for nanoparticle capture. The capture zone corresponds to the region above the magnet where magnetic deposition occurs. Optical imaging is used to monitor deposition morphology and washout dynamics.
We verified local magnetic exposure at the vessel wall using a calibrated Hall probe (teslameter, resolution 0.01 T) (Model 5080, F.W. Bell Gaussmeter, Milwaukie, OR, USA). Measurements in the capture region yielded wall-field values ≥ 0.18 T. Radial field measurements in the near-wall zone showed gradients exceeding 10 T/m within the first 2–3 mm from the vessel wall. Together, these values confirm that all experiments were conducted in a stable, reproducible magnetic environment.
Each experiment followed the same three-stage protocol. First, we stabilised the baseline pulsatile flow. Second, we injected the nanocluster suspension and allowed magnetic deposition under the prescribed waveform. Third, we applied a 5 min pulsatile washout phase (T_washout = 5 min) without altering the magnetic configuration. This final stage enabled quantification of both early detachment and time-dependent decay.
From this protocol, we derived deposition descriptors based on post-injection morphology (coverage, spatial distribution, and OD) and retention descriptors based on washout behaviour (WD and τ1/2).
These experimentally measured quantities were subsequently transformed into D, R, and UTS according to the definitions provided in Section 2.
3.2. Magnetoresponsive Nanoclusters and PEG Functionalization
We evaluated three PEG-functionalised magnetoresponsive nanocluster (MNC) formulations previously synthesised and characterised in [21]: PEG-2000, PEG-6000, and PEG-10,000, hereafter referred to as MNC-2000, MNC-6000, and MNC-10,000. The present study does not modify their composition or surface chemistry. Instead, it examines how PEG molecular weight influences deposition morphology and pulsatile stability under identical magnetic and hemodynamic boundary conditions.
The PEG-functionalised magnetoresponsive nanocluster formulations used in this study (MNC-2000, MNC-6000 and MNC-10,000) were synthesised and extensively characterised in our previous work (Bernad et al. [20]). That study reports the full physicochemical characterisation of the nanoclusters, including TEM micrographs confirming the multicore spherical architecture, hydrodynamic size distributions and zeta potential measurements obtained by dynamic light scattering (DLS), as well as magnetisation curves measured by vibrating sample magnetometry (VSM).
The main physicochemical parameters relevant to the present magnetic targeting experiments are summarised in Table 1, while the detailed characterisation dataset is reported in the original study. In particular, the different PEG molecular weights influence the hydrodynamic size, surface charge and interparticle interactions in suspension, which are expected to affect cluster–flow interactions and therefore the balance between magnetic retention and hydrodynamic washout under pulsatile flow conditions.
Table 1.
Physicochemical properties of the PEG-coated magnetoresponsive nanoclusters used in this study (MNC-2000, MNC-6000 and MNC-10,000). The values summarise the main parameters relevant for the magnetic targeting experiments and are derived from the detailed nanoparticle characterisation previously reported in Bernad et al. [20].
The detailed physicochemical characteristics of the tested formulations are summarised in Table 1.
3.3. Pulsatile Flow Conditions and Phantom Geometry
Pulsatile targeting experiments were conducted in a transparent glass vascular phantom with an internal diameter of 3 mm and a length of 200 mm. This geometry approximates a medium-calibre arterial segment while allowing direct optical assessment of deposit morphology.
Flow was generated using a programmable pulsatile pump configured to reproduce an arterial-like waveform with a 1 s cardiac period (1 Hz), a peak velocity of 0.45 m/s, and a mean velocity of 0.25 m/s.
In the present study, the pulsation frequency was kept constant to ensure identical hydrodynamic boundary conditions across all experiments. Within the M-TOC framework, pulsatile frequency is therefore treated as a controlled experimental parameter rather than as an optimisation variable. The framework evaluates deposition and retention under a defined pulsatile regime, while different pulsation frequencies could be investigated in future studies to examine their influence on washout dynamics and stability.
The working fluid consisted of a glycerol–water mixture adjusted to mimic blood density (ρ = 1055 kg/m3) and physiological viscosity (μ ≈ 3.5 mPa·s). Under these conditions, the Reynolds number was estimated as:
For the applied parameters, Re ≈ 220, consistent with laminar arterial flow. The wall shear stress was estimated using the laminar pipe approximation:
This yielded a mean wall shear stress of approximately 1.2 Pa (≈12 dyn/cm2), within the physiological range reported for medium-diameter arteries [24,25]. Peak systolic shear remained below 2 Pa.
All formulations were evaluated under identical boundary conditions: magnet stand-off distance (11 mm), waveform parameters, injected dose (0.5 wt%; 50 mg MNCs in 10 mL), injection duration (60 s), and washout duration (T_washout = 5 min). Keeping these parameters constant was essential to attribute differences in deposition and retention exclusively to formulation-dependent properties.
3.4. Image Acquisition and OD Measurement Procedure
Deposit morphology at injection termination (T0) was quantified using calibrated side-view optical imaging under controlled magnification and illumination conditions. A 1 mm reference grid was imaged within the same field of view to enable pixel-to-length calibration.
Image analysis was performed in ImageJ (NIH) (https://imagej.nih.gov/ij/, version 4.2, accessed on 5 December 2025). Identical thresholding and region-selection criteria were applied across formulations and replicates to ensure consistency.
For obstruction degree calculation, deposit thickness (h) was defined as the maximal radial height of the deposited layer measured from the inner vessel wall toward the lumen centre at the location of greatest accumulation. We selected maximal thickness as a conservative structural metric, since local protrusion determines effective lumen narrowing.
Using the known phantom diameter (D = 3 mm), OD was calculated according to the definition provided in Section 2.1. In the present framework, OD serves as a structural admissibility criterion. Configurations exceeding the predefined threshold are classified as inadmissible, irrespective of their retention behaviour.
3.5. Retention Stability Measurement Under Pulsatile Washout
Retention stability was assessed by monitoring the time evolution of deposited coverage immediately after injection termination (T0). Pulsatile washout was applied for 5 min under unchanged waveform conditions.
The selected interval was sufficient to capture early destabilisation and subsequent decay without reaching complete depletion. Optical images were acquired every 30 s (Δt = 30 s), and projected coverage was quantified using calibrated image analysis.
Early washout was expressed as the relative reduction in coverage between T0 and the first post-injection measurement (T0 + 30 s). This parameter captures the immediate response of the deposit to the restoration of pulsatile shear.
Subsequent temporal evolution of projected coverage was approximated using the first-order exponential decay model defined in Section 2.2, from which the apparent washout rate constant (kout) and the corresponding half-life (τ1/2) were derived. This exponential representation is used as a comparative descriptor over the fixed 5 min window rather than as an intrinsic detachment kinetics model. Its purpose is to provide a reproducible measure of time-dependent retention stability under identical pulsatile conditions.
Washout degree (WD) and τ1/2 were subsequently used to compute the normalised retention component (R) as described in Section 2.
3.6. UTS Computation
For each formulation, the experimentally measured descriptors were transformed into normalised deposition (D) and retention (R) components, as defined in Section 2.
Deposition was calculated directly from the measured obstruction degree (OD) relative to the admissible threshold (OD_max = 40%). Retention was derived from washout degree (WD) and retention half-life (τ1/2), which were first normalised and then combined as described previously.
Throughout this study, we adopted the balanced weighting configuration (α = β = 0.5; γ = 0.5). This choice assigns equal importance to structurally admissible deposition and retention stability and avoids favouring either component a priori.
Mean values obtained from independent experimental replicates were used to compute D, R, and the resulting Unified Targeting Score (UTS) for each formulation. No additional post hoc weighting or optimisation was applied beyond the predefined balanced configuration.
3.7. Statistical Analysis
All experiments were performed in independent triplicate (n = 3). Each replicate comprised the full experimental sequence, including baseline stabilisation, magnetic deposition, and pulsatile washout under identical boundary conditions.
Results are reported as mean ± standard deviation (SD). Variability across replicates remained below 10% for primary descriptors. Uncertainties are reported with two significant figures, while the corresponding mean values are rounded consistently to the same decimal precision to preserve comparability between experimental conditions.
Comparisons between formulations were conducted using one-way analysis of variance (ANOVA), followed by Tukey’s post hoc test to correct for multiple comparisons. A two-sided significance threshold of p < 0.05 was applied.
For composite quantities (D, R, and UTS), uncertainty was estimated using first-order error propagation (the delta method), assuming independent variances for the underlying measured descriptors. This approach provides an approximate estimate of propagated variability without introducing additional model assumptions.
4. Results
4.1. Deposition Morphology and OD-Based Structural Envelope
Obstruction degree (OD) was used as the geometric descriptor defining structural admissibility, as introduced in Section 2.1. OD was evaluated at the end of injection (T0) and after the 5 min pulsatile washout interval (T7), allowing comparison between initial accumulation and post-flow structural evolution.
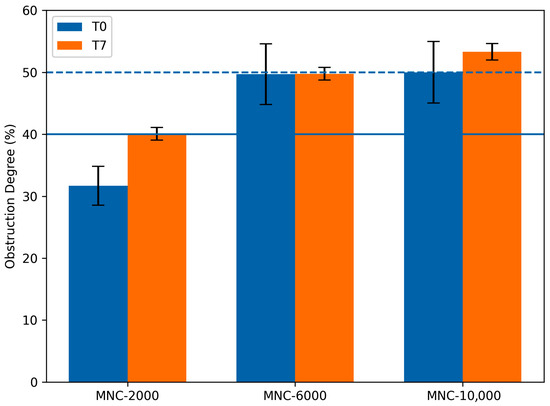
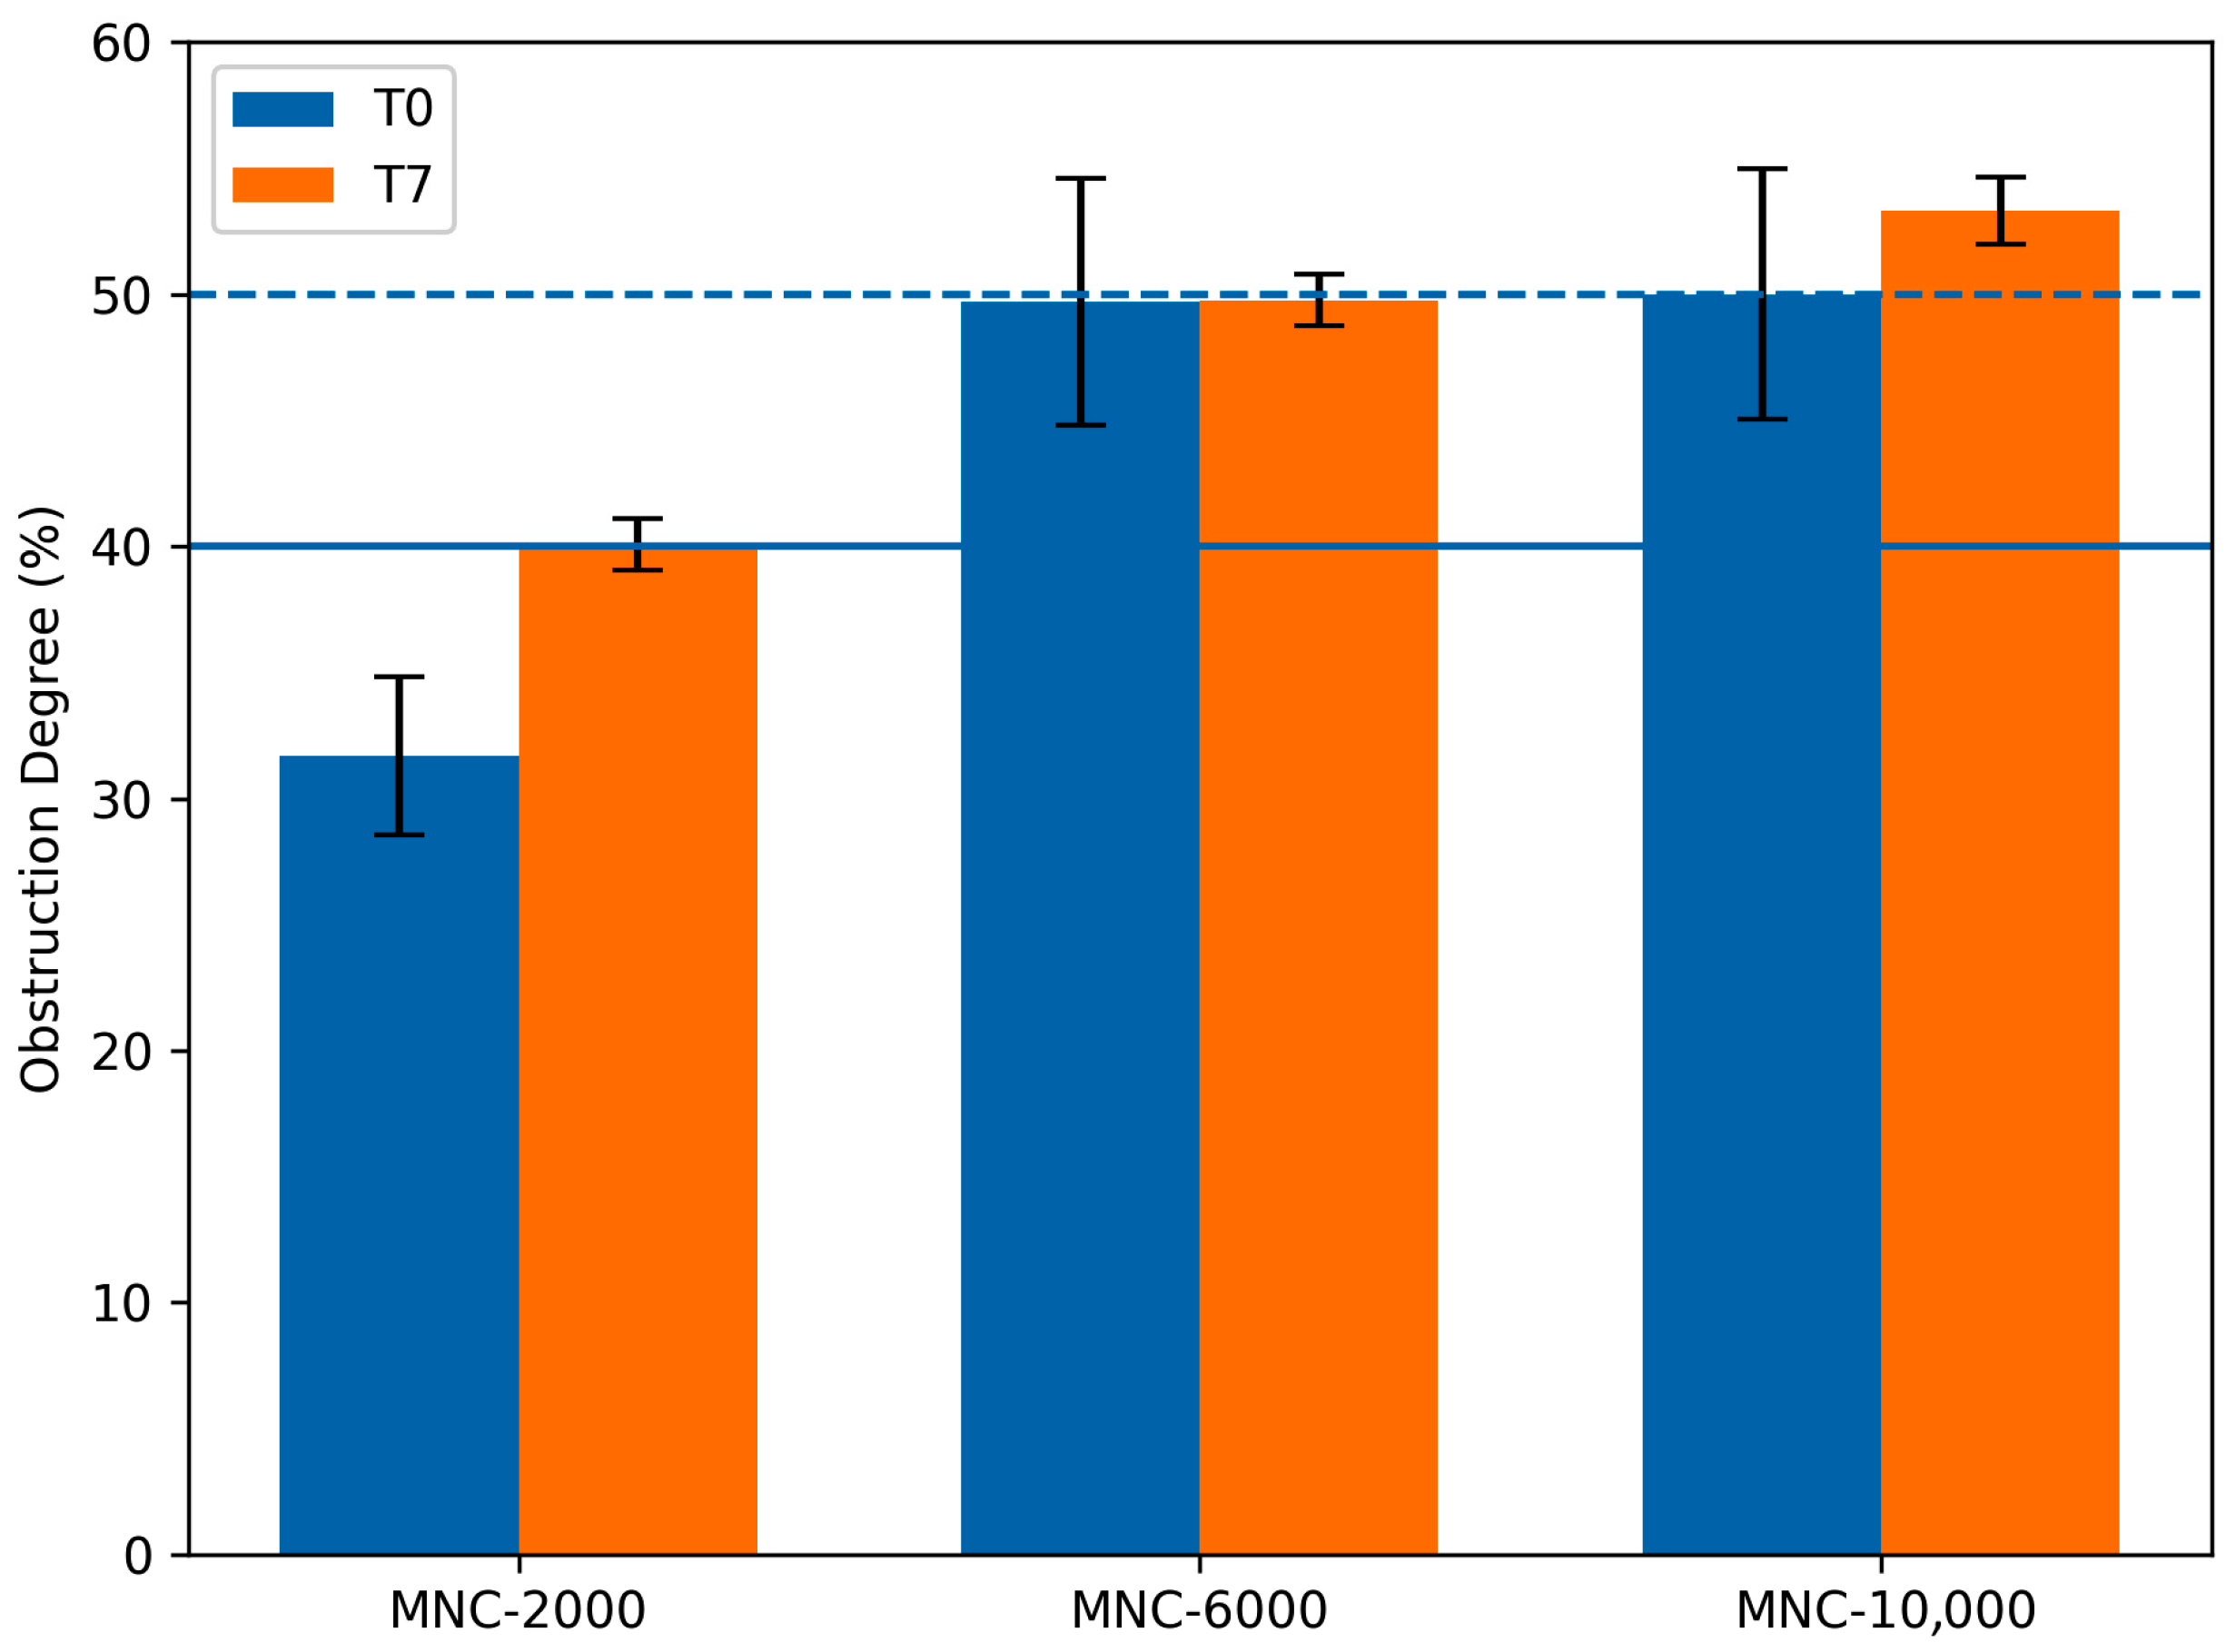
At T0, clear differences were observed between formulations. MNC-2000 produced an obstruction of 31.7 ± 3.12%, remaining below the conservative admissibility threshold (OD < 40%). In contrast, MNC-6000 (49.7 ± 4.89%) and MNC-10,000 (50.0 ± 4.97%) exceeded this limit at injection completion. Thus, although all variants achieved visible deposition, only MNC-2000 satisfied the predefined structural constraint immediately after deposition.
Following pulsatile washout (T7), OD values evolved differently. MNC-2000 increased to 40.1 ± 1.01%, approaching the admissibility boundary. MNC-6000 remained within the intermediate sub-occlusive range (49.8 ± 1.02%), whereas MNC-10,000 increased further to 53.3 ± 1.32%, surpassing the 50% reference line. These changes indicate that structural configuration under flow does not simply mirror the initial injection state but may reorganise under pulsatile exposure.
Between-formulation differences in OD were statistically significant at both points (T0 and T7) (one-way ANOVA followed by Tukey’s post hoc test, p < 0.0001), indicating that obstruction degree differed significantly among the three formulations under identical experimental conditions. Specifically, MNC-2000 remained below the predefined admissibility threshold at injection termination (31.7 ± 3.12%), whereas both MNC-6000 and MNC-10,000 exceeded this limit with obstruction values approaching 50% (Table 2). This statistically significant stratification persisted after the washout interval (T7), confirming that the structural differences observed immediately after deposition were not transient but remained distinguishable under continued pulsatile flow. Post hoc comparisons confirmed that the structural stratification observed at T0 persisted after washout rather than converging toward a common geometry.
Table 2.
Obstruction degree (OD) at the injection end (T0) and after pulsatile washout (T7).
The quantitative OD values relative to the 40% admissibility limit and the 50% reference line are summarised in Table 2 and illustrated in Figure 5. Together, these data define the structural envelope within which subsequent retention analysis must be interpreted.
Figure 5.
Obstruction degree (OD) at the injection end (T0) and after 5 min pulsatile washout (T7). Bars represent mean ± SD (n = 3 independent experiments). The solid horizontal line indicates the conservative admissibility threshold (40%), while the dashed line marks the 50% reference line. Between-formulation differences were significant at both T0 and T7 (one-way ANOVA followed by Tukey’s post hoc test, p < 0.0001). Statistical comparisons refer to differences between the three formulations at each time point.
Statistical comparison between formulations was performed using one-way ANOVA followed by Tukey post hoc testing (see main text for p-values).
4.2. Retention Stability Under Pulsatile Flow
Retention under pulsatile conditions was analysed in two complementary stages: early washout immediately after injection termination and subsequent time-dependent decay over the 5 min washout interval.
- Early Washout (WD at 30 s)
Early washout was quantified at T0 + 30 s relative to T0, as defined in Section 2.2. As shown in Table 3, early washout revealed clear differences between the three MNC variants. At 30 s after injection termination, corresponding to the onset of the standardised washout phase, MNC-2000 exhibited a WD of 38.33 ± 0.38%, whereas MNC-6000 and MNC-10,000 showed substantially lower values (17.87 ± 0.35% and 10.77 ± 0.42%, respectively). These differences were highly significant (one-way ANOVA, F = 4190, p = 3.7 × 10⁻¹⁰), and Tukey post hoc testing confirmed significant pairwise differences between all formulations (p < 0.001). These data indicate that the configuration generating the highest initial obstruction (MNC-2000) was also more susceptible to early shear-induced detachment.
Table 3.
Early washout (WD) at 30 s after injection termination.
These differences suggest that geometric protrusion at T0 does not necessarily confer immediate resistance to pulsatile forces.
- Time-Dependent Washout Dynamics
To characterise the subsequent evolution of deposited material, projected coverage was monitored over the full 5 min washout interval and fitted using a first-order exponential model. After 5 min of continued pulsatile exposure, total washout reached 49.77 ± 0.49% for MNC-2000, compared with 21.20 ± 0.26% for MNC-6000 and 18.23 ± 0.23% for MNC-10,000. Thus, although deposition magnitude differed across MNC-variants, the relative stability ranking remained consistent: MNC-10,000 exhibited the greatest resistance to washout, followed by MNC-6000, while MNC-2000 showed the largest cumulative material loss.
Time-dependent decay analysis further differentiated the variants. The retention half-life (τ1/2), obtained from exponential fitting over the 5 min interval, was 18.7 min for MNC-2000, 77.9 min for MNC-6000, and 34.7 min for MNC-10,000. These values reflect differences not only in early detachment but also in longer-term structural persistence under identical pulsatile flow. In such near-stationary regimes, the dynamic amplitude of decay becomes small relative to measurement variability, inherently limiting the coefficient of determination (R2) despite the presence of a measurable slope.
The complete washout descriptors and fitted parameters are summarised in Table 4.
Table 4.
Exponential washout parameters (kout, τ1/2, and R2) derived from exponential fits to the mean projected coverage curves obtained from n = 3 independent experiments. Because the parameters were extracted from the fitted mean curves, they are reported as descriptive fit values and not as mean ± SD estimates.
The values listed in Table 4 correspond to parameters extracted from exponential fits to the mean coverage curves and are therefore reported as descriptive fit values rather than replicate-wise mean ± SD estimates.
For MNC-6000, the low coefficient of determination (R2 ≈ 0.08) does not reflect model inadequacy but rather the minimal dynamic variation observed within the 5 min washout interval. Because the projected coverage changed only marginally over time, the exponential decay model captures a nearly flat response curve. In this context, the magnitude of the fitted half-life parameter remains informative for comparative purposes, whereas goodness-of-fit metrics become less discriminating due to the dataset’s restricted variance. The extracted parameter kout therefore represents an apparent decay descriptor within the imposed observation window, enabling internal comparative ordering across formulations. The corresponding τ1/2 should be interpreted as an operational half-life derived from this apparent slope rather than as a fully resolved intrinsic kinetic constant.
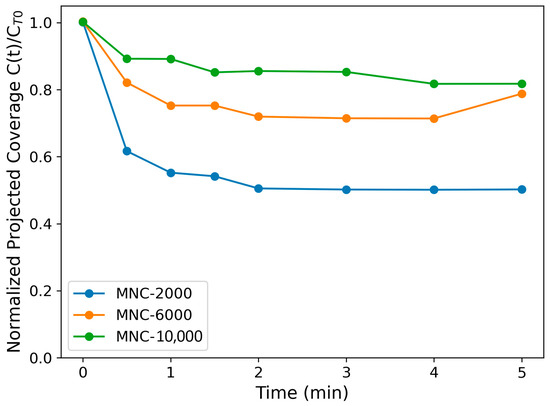
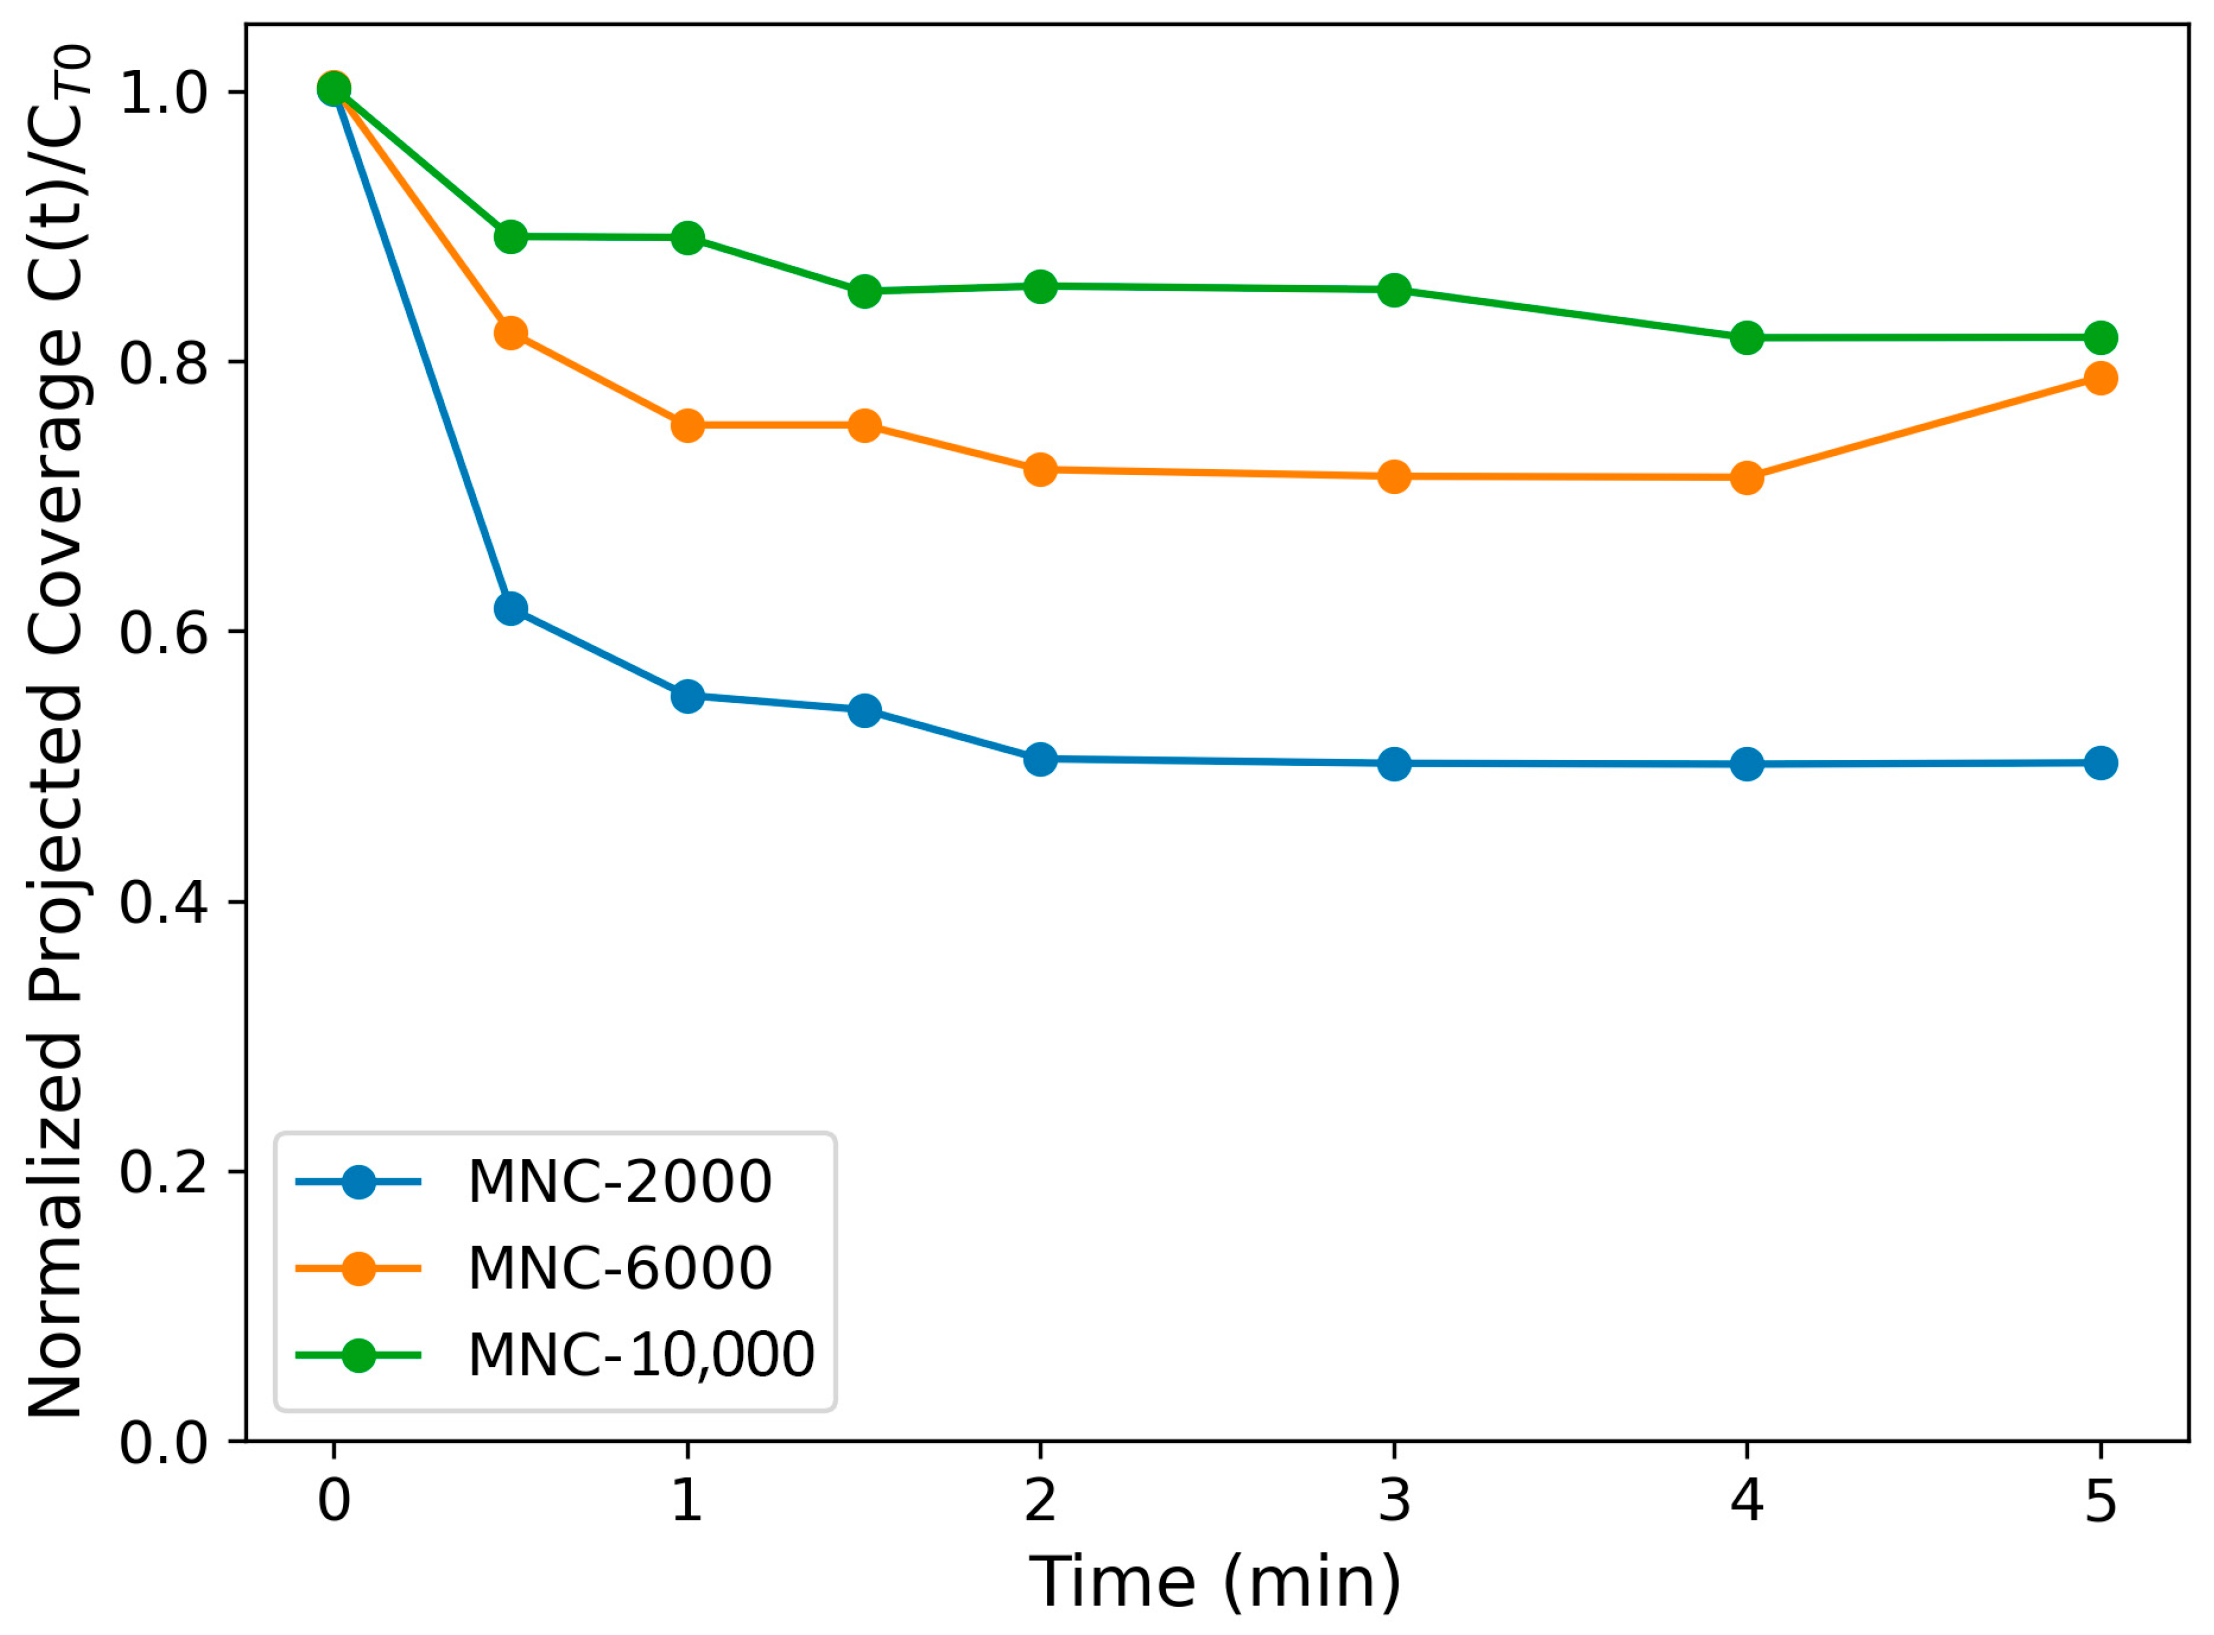
The temporal evolution of deposited coverage during the washout phase is illustrated in Figure 6. The three formulations exhibit clearly different decay profiles. MNC-2000 shows the sharpest initial drop immediately after injection termination, consistent with its markedly higher early washout value (WD = 38.33 ± 0.38%; Table 3), indicating rapid destabilisation of the deposited layer once pulsatile shear is restored. In contrast, MNC-6000 and MNC-10,000 display substantially flatter early decay segments, in agreement with their lower WD values (17.87 ± 0.35% and 10.77 ± 0.42%, respectively), indicating greater immediate resistance to washout. Over the remainder of the 5 min interval, the curves remain separated, with MNC-6000 exhibiting the shallowest overall decay slope and the longest apparent retention half-life, whereas MNC-2000 maintains the fastest cumulative loss profile. The graphical representation, therefore, mirrors the quantitative hierarchy observed in Table 4 and visually confirms that retention dynamics differ substantially despite comparable magnetic boundary conditions.
Figure 6.
Time-dependent evolution of normalised deposited fraction under pulsatile washout. Mean normalised projected coverage for MNC-2000, MNC-6000, and MNC-10,000 during the standardised 5 min pulsatile washout interval. Points represent mean values (n = 3 independent experiments); solid lines indicate first-order exponential fits used to estimate formulation-specific washout rate constants (kout).
Although the three nanocluster formulations exhibit comparable magnetic responsiveness, as indicated by similar saturation magnetisation values (Table 1), they differ in hydrodynamic diameter and surface charge. These physicochemical differences may influence the organisation and cohesion of the magnetically deposited layer and therefore contribute to the formulation-dependent retention behaviour observed in Table 3 and Table 4. In particular, the formulations exhibiting lower early washout (MNC-6000 and MNC-10,000) also correspond to nanoclusters with distinct colloidal characteristics, suggesting that physicochemical properties beyond magnetic response may influence the mechanical stability of the deposited aggregates under pulsatile shear.
Importantly, the configuration that satisfied the structural admissibility criterion at T0 (MNC-2000) did not demonstrate superior retention stability over time. Conversely, MNC-variants exceeding the conservative obstruction limit showed greater persistence during washout.
This divergence between geometric admissibility and dynamic stability provides the experimental basis for the joint D–R evaluation developed in Section 2.
4.3. Operational Regime Discrimination in the Constrained D–R Space
Figure 3 introduced the conceptual D–R landscape under a structural constraint, illustrating that optimal magnetic targeting under pulsatile flow must lie within an admissible domain defined by a maximal obstruction threshold (OD_max). That representation was generic and theoretical. The present section applies that framework to the experimental data.
In this study, the admissible obstruction limit was set to OD_max = 40%, thereby defining the hemodynamic safety window. The deposition component D was computed according to Equation (5).
Configurations exceeding this threshold were classified as structurally inadmissible and excluded from optimisation analysis. This classification was applied prior to the evaluation of retention performance. This ensures that retention gains cannot compensate for excessive initial lumen narrowing.
The present rigid phantom does not aim to replicate full vascular compliance or endothelial response; rather, it isolates the geometric–hemodynamic interaction under controlled pulsatile flow. Within this controlled setting, OD_max serves as a conservative structural constraint ensuring that accumulation does not approach ranges associated with marked shear amplification.
To visualise the distribution of the tested formulations within the constrained performance space, their normalised deposition and retention components were projected onto the D–R plane.
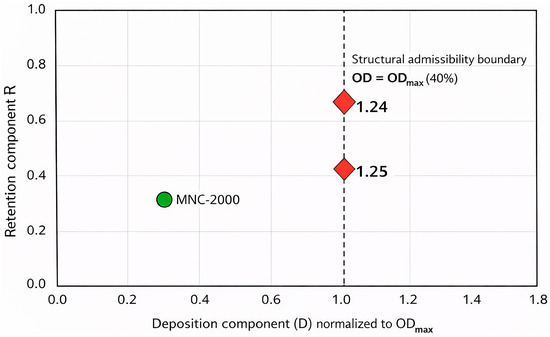
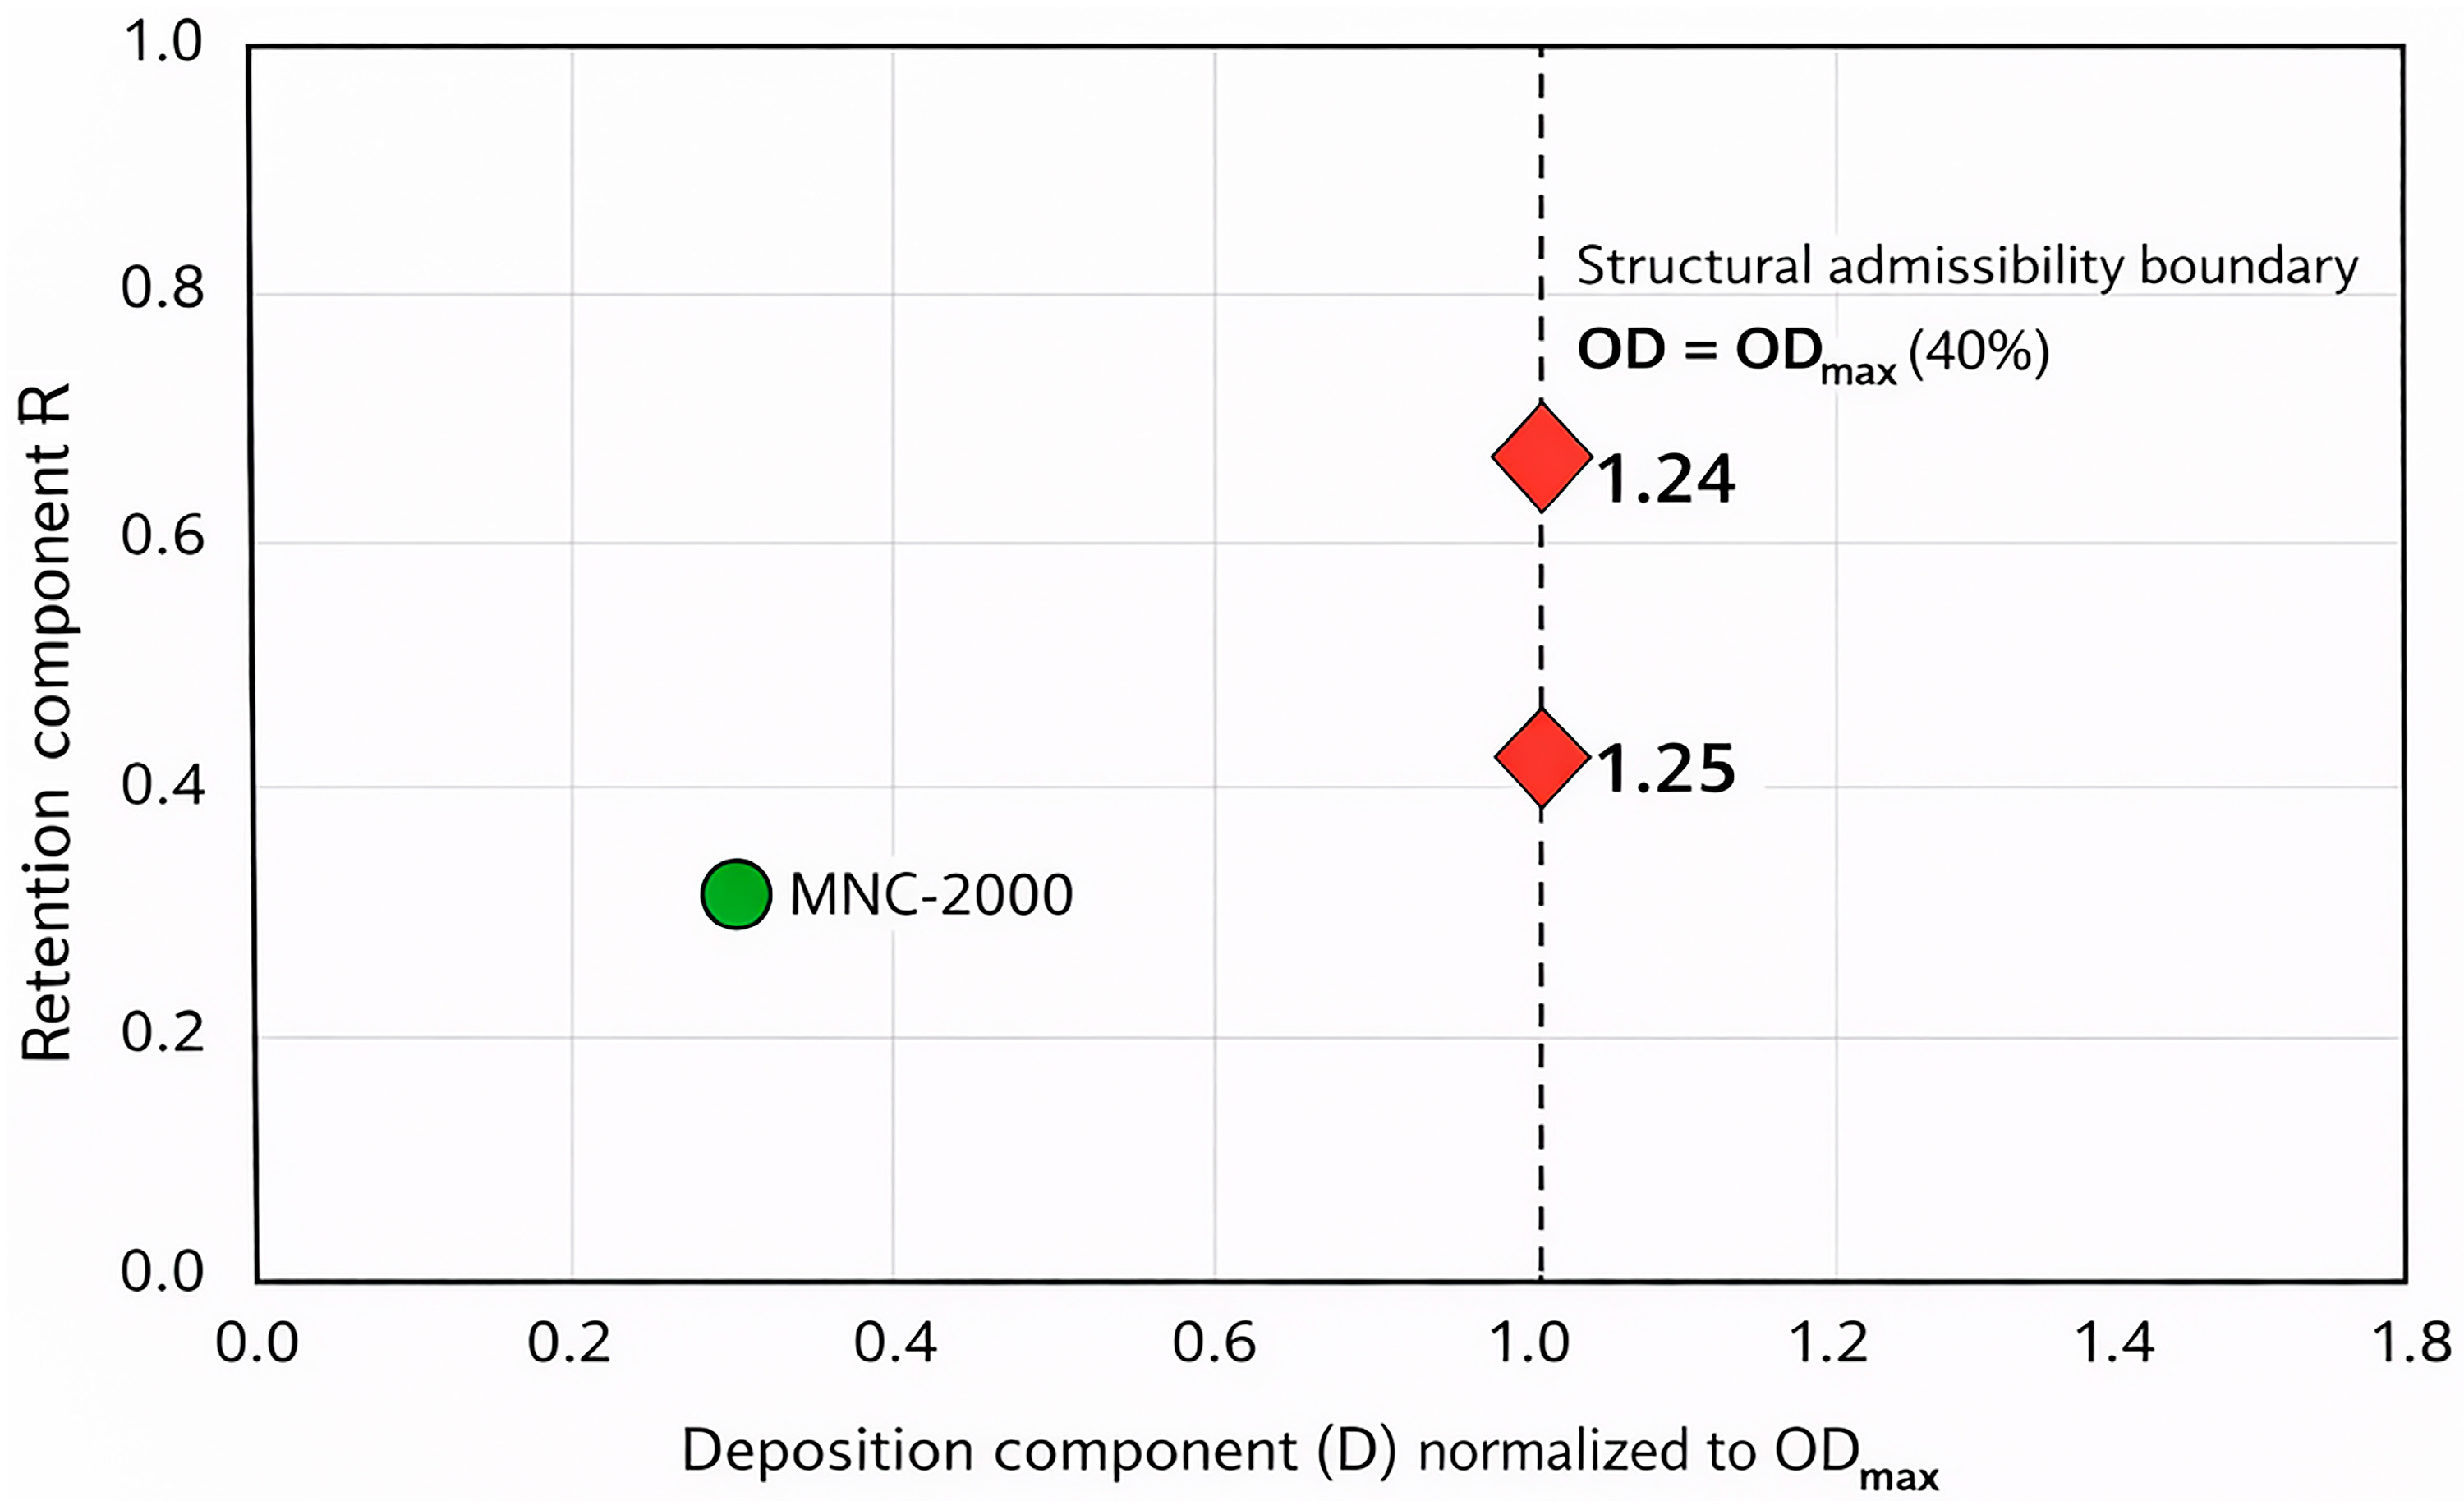
Figure 7 displays discrete experimentally measured coordinates, in contrast to the continuous conceptual representation shown in Figure 3. The vertical boundary at D = 1 marks the admissibility cutoff corresponding to OD_max = 40%. We display configurations exceeding this limit at the boundary and label them with their OD/OD_max ratio to indicate exclusion.
Figure 7.
Experimental positioning of the tested formulations in the constrained D–R space (OD_max = 40%). The vertical dashed line at D = 1 marks the structural admissibility boundary corresponding to the obstruction threshold OD_max = 40%. Configurations located to the right of this boundary exceed the structural safety window and are therefore excluded from optimisation irrespective of retention performance. MNC-2000 lies within the admissible region (D ≈ 0.79; R ≈ 0.43) but exhibits limited retention stability. In contrast, MNC-6000 and MNC-10,000 exceed the obstruction threshold at injection (OD ≈ 49.7% and 50.0%, respectively) and therefore fall outside the admissible domain. Because the deposition component D is defined only for OD ≤ OD_max, configurations exceeding the structural threshold are projected onto the admissibility boundary (D = 1). The labels 1.24 and 1.25 correspond to the ratios OD/OD_max for MNC-6000 and MNC-10,000, respectively, indicating the degree to which the obstruction limit is exceeded.
With 11 mm magnet separation, only MNC-2000 remains within the permissible region (D ≈ 0.79; R ≈ 0.43). MNC-6000 and MNC-10,000 exhibit stronger retention but exceed the obstruction limit at injection (OD ≈ 50%) and therefore lie outside the safety window.
The comparison between Figure 3 and Figure 7 is central to validating the framework. While the conceptual landscape predicts the existence of a region combining admissible deposition with high retention, the current dataset does not populate that region. The D–R map, therefore, shows that none of the tested configurations simultaneously achieves structural admissibility and strong pulsatile stability under the investigated conditions.
Thus, the regime discrimination illustrated in Figure 7 reflects the combined geometric constraint imposed by the obstruction threshold and the retention behaviour observed under pulsatile flow.
4.4. UTS-Based Optimisation Within the Admissible Domain
The D–R analysis in Section 4.3 established a clear structural boundary: deposition is considered valid only within the admissible domain defined by OD_max = 40%. Configurations exceeding this limit are excluded from optimisation. Consequently, UTS-based evaluation is performed strictly within the structurally admissible domain.
Under the balanced weighting configuration (α = β = 0.5), the Unified Targeting Score integrates deposition and retention into a single scalar metric. However, because admissibility is imposed first, UTS serves as a decision tool only among configurations satisfying OD(T0) ≤ 40%.
At the tested magnet distance (11 mm), only MNC-2000 fulfils this condition. Its normalised components (D ≈ 0.79; R ≈ 0.43) yield a UTS ≈ 0.61. In contrast, MNC-6000 and MNC-10,000 exhibit greater retention stability but exceed the obstruction threshold at injection (OD(T0) > OD_max). For this reason, they cannot be included in the UTS comparison, which is defined only within the admissible domain (OD ≤ OD_max). This does not imply reduced effectiveness of these formulations but rather reflects the safety-constrained nature of the optimisation framework. The resulting evaluation within the admissible domain is summarised in Table 5.
Table 5.
UTS evaluation within the structural admissibility domain (OD_max = 40%).
This outcome reflects the safety-constrained structure of the optimisation framework, in which only configurations satisfying the admissibility condition OD(T0) ≤ OD_max can be evaluated using the UTS. Under the present experimental geometry, this leads to a single admissible configuration, while the absence of an admissible high-retention alternative indicates that the tested parameter space does not yet populate the stability-favoured region predicted by the conceptual D–R landscape.
5. Discussion
5.1. Validation of a Safety-Constrained Targeting Framework
This study experimentally validates the M-TOC framework. It defines how to interpret magnetic targeting performance under pulsatile flow by applying two explicit criteria: structural admissibility (OD_max = 40%) and quantified retention stability.
The framework does not tune nanoparticle parameters. It establishes evaluation rules. Targeting performance is considered acceptable only when deposition remains within the obstruction limit and retention stability is maintained under pulsatile shear.
The present validation demonstrates that safety screening precedes optimisation. Retention scoring applies only within the admissible domain. Even when the explored configuration space does not contain a jointly optimal state, the framework still distinguishes between feasible and infeasible regimes.
The observed trade-off arises directly from the measured deposition and retention data. MNC-6000 showed the highest retention stability, characterised by reduced early washout and a prolonged apparent half-life under pulsatile flow. However, it exceeded the admissible obstruction limit (OD_max = 40%), reaching an initial narrowing of approximately 50%.
In contrast, MNC-2000 remained within the structural threshold but exhibited substantially shorter persistence during washout. The pronounced difference in apparent half-life indicates that magnetically confined aggregates respond sensitively to shear forces once pulsatile flow is restored.
Shear-initiated disruption of intravascular structures is well established in vascular biomechanics [24,25]. In magnetic targeting, the interaction between magnetic confinement and hemodynamic stress has been analysed analytically and numerically [12,26], but it has rarely been incorporated into a constrained performance framework.
The present results show that deposition geometry and retention stability do not align automatically within the admissible domain. This supports the dual-objective structure of M-TOC.
The absence of a configuration that combines strong retention with admissible deposition does not weaken the framework. It confirms its ability to discriminate between feasible and infeasible operating regimes.
5.2. Beyond Accumulation: Context Within Magnetic Targeting Research
Magnetic drug targeting research has traditionally focused on particle capture and magnetic accumulation. Analytical and computational studies have modelled particle transport and capture in vascular flow, highlighting the roles of magnetic field gradients, flow velocity, and vessel geometry [13,26]. These models clarify particle trajectories and capture efficiency.
Experimental and translational studies have also shown the difficulty of maintaining magnetic localisation in vivo, where vascular geometry, pulsatility, and systemic factors add complexity [10,26].
Sufficient magnetic force for capture does not ensure stable retention under physiological flow.
The formulation-dependent differences observed in the present study can be further interpreted in relation to the physicochemical characteristics of the tested nanoclusters (Table 1). Although the three variants exhibit comparable magnetic responsiveness (saturation magnetisation ranging from 72 to 82 emu/g), they differ in hydrodynamic diameter and surface charge, both of which influence colloidal interactions and aggregate formation during magnetic capture.
In particular, the MNC-6000 and MNC-10,000 formulations, which exhibit the lowest early washout values (WD = 17.87 ± 0.35% and 10.77 ± 0.42%, respectively; Table 3), also display the longest apparent retention half-lives under pulsatile flow (τ1/2 = 77.9 min and 34.7 min; Table 4). These observations suggest that formulation-dependent colloidal properties may contribute to stronger interparticle cohesion within the deposited layer, thereby increasing resistance to pulsatile shear once injection terminates.
At the same time, these formulations produced thicker deposits during magnetic capture, resulting in obstruction degrees of approximately 50% at T0 (Table 2), exceeding the predefined admissibility threshold (OD_max = 40%). This outcome illustrates the central trade-off addressed by the M-TOC framework: physicochemical characteristics that favour structural persistence under pulsatile washout may simultaneously promote more extensive deposition during magnetic capture. The resulting coupling between deposition morphology and retention stability reinforces the need to evaluate magnetic targeting performance within a structurally constrained optimisation framework rather than relying solely on accumulation metrics.
Recent computational analyses that include pulsatile flow and vascular narrowing show that increasing stenosis severity alters local velocity gradients and shear exposure, which affects particle transport and deposition stability [14,19]. These results demonstrate that hemodynamic changes cannot be separated from targeting performance.
In this study, we formalise this interaction as a constrained optimisation problem. We separate the obstruction degree at T0, a geometric descriptor, from kinetic persistence under pulsatile flow. We then embed both within an explicit safety boundary. In doing so, the M-TOC framework shifts magnetic targeting from accumulation maximisation to stability-guided optimisation under flow constraints.
5.3. Implications for Future Targeting Design
The hemodynamic safety window is a practical design principle for magnetic targeting systems. It defines the operating range in which deposition ensures sustained retention while preserving vessel patency.
Hemodynamic effects of increasing obstruction are well documented in imaging and biomechanical studies of vascular stenosis [16]. Even in rigid models, geometric narrowing alters velocity gradients and the shear distribution, thereby modifying the mechanical environment of deposited magnetic clusters.
With OD_max = 40% used here as a conservative safety limit, only one admissible configuration remains in the present dataset. If a less conservative threshold were adopted (e.g., OD_max ≈ 50%, often cited as a hemodynamic transition threshold in stenosis grading), additional configurations would become feasible and UTS ranking could be applied.
Weighting parameters (α, β) allow application-specific balancing of deposition and retention, but this weighting operates only within the admissible domain defined by the obstruction constraint.
These results show that improving target performance cannot rely only on increasing the magnetic force or particle concentration. Hemodynamics imposes structural limits. Magnet configuration, exposure duration, and nanoparticle design must operate within those limits.
Stable therapeutic localisation requires balancing magnetic confinement against flow-induced destabilisation.
Even within a limited experimental space, M-TOC separates configurations into distinct regimes, explicitly defines admissibility, and prevents interpretation based solely on peak deposition.
The framework is transferable beyond the formulations tested here and can guide future experimental, computational, and translational studies.
Magnetic drug targeting should prioritise predictable retention within hemodynamic constraints rather than maximising capture alone.
5.4. Limitations
Several limitations should be acknowledged.
- −
- First, all experiments were performed in a rigid vascular phantom under a defined pulsatile waveform. Although this configuration reproduces essential features of arterial flow, it does not account for vessel compliance, endothelial interaction, blood cellular components, or biological feedback. These factors may alter particle–flow coupling and retention behaviour in vivo.
- −
- Second, experimental space was intentionally restricted to isolate the interaction between geometric obstruction and pulsatile retention. We used a predefined set of nanoparticle formulations and a fixed magnet stand-off distance to preserve internal consistency in the D–R mapping. As a result, the explored parameter space does not fully capture the range of possible magnetic targeting configurations.
- −
- The analysis focuses on structural retention metrics under controlled washout conditions. It does not address drug release kinetics, systemic biodistribution, or pharmacodynamic response.
- −
- Retention half-lives were obtained from first-order exponential fits over a short, fixed washout interval. These values serve as comparative stability indicators within the present setup and should not be interpreted as intrinsic kinetic constants.
- −
- Because magnet distance and exposure conditions were fixed by design, the explored configuration space is sparse. Under the tested geometry, the OD-admissible set contains only one feasible configuration. This reflects the limited sampling of the parameter space rather than a restriction of the optimisation framework itself.
Future studies should systematically vary parameters—particularly magnet position, field strength, waveform characteristics, and dosing—to determine whether additional configurations can occupy the stability-favoured region of the D–R domain.
We selected OD_max = 40% as a conservative structural boundary. Alternative admissibility thresholds may be evaluated in future work using compliant vessel models, subject-specific geometries, and computational fluid dynamics simulations to refine the quantitative limits of the safety window.
These limitations relate to the experimental configuration, not to the conceptual structure of the framework.
The distinction between geometric admissibility and time-dependent retention stability arises from fundamental flow–structure interactions and is independent of a specific nanoparticle formulation or magnet configuration.
6. Conclusions
This study presents and tests a systematic method for evaluating magnetic drug targeting under pulsatile flow. By separating geometric deposition from retention stability and embedding both within an explicit hemodynamic safety boundary, magnetic drug targeting is reframed from a peak-accumulation metric to a safety-constrained stability paradigm.
The results show that strong retention and acceptable lumen narrowing do not necessarily occur together.
Configurations that perform well under pulsatile flow may exceed the maximum allowable deposition limit. Conversely, geometrically admissible deposits may show limited stability over time. This difference results from the interaction between magnetic confinement and flow-induced shear.
Magnetic drug targeting should therefore not be treated as an accumulation-maximisation problem. It should be viewed as a stability-guided process operating within defined geometric constraints.
The D–R mapping makes this constraint explicit and converts performance evaluation into a conditional optimisation problem.
Even under controlled experimental conditions, the framework clearly distinguishes between admissible and non-admissible regimes and shows that no optimal configuration was achieved within the tested parameter space. In this way, it functions both as a comparison tool and as a design guide.
In pulsatile vascular environments, progress in magnetic targeting depends less on maximising capture and more on achieving predictable retention within structural limits.
Author Contributions
Conceptualization, S.I.B. and E.S.B.; methodology, S.I.B. and E.S.B.; validation, S.I.B. and E.S.B.; formal analysis, E.S.B.; investigation, S.I.B. and E.S.B.; writing—original draft preparation, S.I.B. and E.S.B.; writing—review and editing, S.I.B. and E.S.B.; visualisation, S.I.B. All authors have read and agreed to the published version of the manuscript.
Funding
This research received no external funding.
Institutional Review Board Statement
Not applicable.
Informed Consent Statement
Not applicable.
Data Availability Statement
The data presented in this study are available within the article.
Acknowledgments
For S.I. Bernad, this work was supported by the RA-TB/CFATR/LHC multiannual research program 2026–2030.
Conflicts of Interest
The authors declare no conflicts of interest.
References
- Anderson, S.D.; Gwenin, V.V.; Gwenin, C.D. Magnetic Functionalized Nanoparticles for Biomedical, Drug Delivery and Imaging Applications. Nanoscale Res. Lett. 2019, 14, 188. [Google Scholar] [CrossRef] [Scilit]
- Karvelas, E.G.; Lampropoulos, N.K.; Karakasidis, T.E.; Sarris, I.E. Blood Flow and Diameter Effect in the Navigation Process of Magnetic Nanocarriers inside the Carotid Artery. Comput. Methods Programs Biomed. 2022, 221, 106916. [Google Scholar] [CrossRef] [Scilit]
- Cheng, X.; Xie, Q.; Sun, Y. Advances in Nanomaterial-Based Targeted Drug Delivery Systems. Front. Bioeng. Biotechnol. 2023, 11, 1177151. [Google Scholar] [CrossRef] [Scilit] [PubMed]
- Bianco, V.; Trubatch, A.D.; Wei, H.; Yecko, P. Quantifying Volume Loss of a Magnetically Localized Ferrofluid Bolus in Pulsatile Pipe Flow. J. Magn. Magn. Mater. 2021, 524, 167595. [Google Scholar] [CrossRef] [Scilit]
- Kosari, E.; Vafai, K. Transport and Dynamic Analysis of Magnetic Nanoparticles in Brain Microvascular Vessels. Phys. Fluids 2021, 33, 081907. [Google Scholar] [CrossRef] [Scilit]
- Lim, J.; Lanni, C.; Evarts, E.R.; Lanni, F.; Tilton, R.D.; Majetich, S.A. Magnetophoresis of Nanoparticles. ACS Nano 2011, 5, 217–226. [Google Scholar] [CrossRef] [Scilit] [PubMed]
- Ben Salah, A.; Ukai, T.; Mingyuan, L.; Morimoto, H.; Maekawa, T. Growth Process of Clusters Formed by Paramagnetic Microparticles in an Ac/Dc Combined Magnetic Field. AIP Adv. 2023, 13, 055010. [Google Scholar] [CrossRef] [Scilit]
- McBain, S.C.; Yiu, H.H.; Dobson, J. Magnetic Nanoparticles for Gene and Drug Delivery. Int. J. Nanomed. 2008, 3, 169–180. [Google Scholar] [CrossRef] [Scilit]
- Liu, Y.-L.; Chen, D.; Shang, P.; Yin, D.-C. A Review of Magnet Systems for Targeted Drug Delivery. J. Control. Release 2019, 302, 90–104. [Google Scholar] [CrossRef] [Scilit]
- Al-Jamal, K.T.; Bai, J.; Wang, J.T.-W.; Protti, A.; Southern, P.; Bogart, L.; Heidari, H.; Li, X.; Cakebread, A.; Asker, D.; et al. Magnetic Drug Targeting: Preclinical In Vivo Studies, Mathematical Modeling, and Extrapolation to Humans. Nano Lett. 2016, 16, 5652–5660. [Google Scholar] [CrossRef] [Scilit]
- David, A.E.; Cole, A.J.; Chertok, B.; Park, Y.S.; Yang, V.C. A Combined Theoretical and In Vitro Modeling Approach for Predicting t He Magnetic Capture and Retention of Magnetic Nanoparticles In Vivo. J. Control. Release 2011, 152, 67–75. [Google Scholar] [CrossRef] [Scilit]
- Kayal, S.; Bandyopadhyay, D.; Mandal, T.K.; Ramanujan, R.V. The Flow of Magnetic Nanoparticles in Magnetic Drug Targeting. RSC Adv. 2011, 1, 238–246. [Google Scholar] [CrossRef] [Scilit]
- Calandrini, S.; Capodaglio, G.; Aulisa, E. Magnetic Drug Targeting Simulations in Blood Flows with Fluid-Structure Interaction. Int. J. Numer. Methods Biomed. Eng. 2018, 34, e2954. [Google Scholar] [CrossRef] [Scilit]
- Jalali, S.; Jalali, S.; Barati, E. Pulsatile Blood Flow Simulations of Magnetic Drug Targeting (MDT) for Drug Particles Dispersion Through Stenosis Asymmetric and Symmetric Vessels. J. Magn. Magn. Mater. 2024, 590, 171649. [Google Scholar] [CrossRef] [Scilit]
- Bartlett, E.S.; Walters, T.D.; Symons, S.P.; Fox, A.J. Quantification of Carotid Stenosis on CT Angiography. Am. J. Neuroradiol. 2006, 27, 13–19. [Google Scholar]
- Saba, L.; Scicolone, R.; Johansson, E.; Nardi, V.; Lanzino, G.; Kakkos, S.K.; Pontone, G.; Annoni, A.D.; Paraskevas, K.I.; Fox, A.J. Quantifying Carotid Stenosis: History, Current Applications, Limitations, and Potential: How Imaging Is Changing the Scenario. Life 2024, 14, 73. [Google Scholar] [CrossRef] [Scilit]
- Salgado, R. Carotid Imaging in 2023: Stenosis and Beyond. J. Belg. Soc. Radiol. 2023, 107, 96. [Google Scholar] [CrossRef] [Scilit]
- Yang, J.; Zhang, Y.; Xue, J.; Guo, Y.; Liu, S.; Yao, Y.; Zhong, H.; Quan, A.; Yang, J. Hemodynamic Effects of Stenosis with Varying Severity in Different Segments of the Carotid Artery Using Computational Fluid Dynamics. Sci. Rep. 2025, 15, 4896. [Google Scholar] [CrossRef] [Scilit]
- Wang, K.; Armour, C.H.; Gibbs, R.G.J.; Xu, X.Y. A Numerical Study of the Effect of Thrombus Breakdown on Predicted Thrombus Formation and Growth. Biomech. Model. Mechanobiol. 2024, 23, 61–71. [Google Scholar] [CrossRef] [Scilit]
- Bernad, S.I.; Bunge, A.; Ioncica, M.C.; Turcu, R.; Dan, M.; Socoliuc, V.; Susan-Resiga, D.; Bernad, E.S. Impact of the Different Molecular Weights of Polyethylene Glycol (PEG) Coating Agents on the Magnetic Targeting Characteristics of Functionalized Magnetoresponsive Nanoclusters. Magnetochemistry 2024, 10, 51. [Google Scholar] [CrossRef] [Scilit]
- Bernad, S.I.; Bernad, E.S. Influence of PEG Molecular Weight on Washout Resistance and Deposition Efficiency of Magnetoresponsive Nanoclusters Under Pulsatile Flow for Magnetic Drug Targeting. Pharmaceuticals 2025, 18, 1394. [Google Scholar] [CrossRef] [Scilit]
- North American Symptomatic Carotid Endarterectomy Trial Collaborators. Beneficial Effect of Carotid Endarterectomy in Symptomatic Patients with High-Grade Carotid Stenosis. N. Engl. J. Med. 1991, 325, 445–453. [Google Scholar] [CrossRef] [Scilit]
- Daskilewicz, M.J.; German, B.J. Representing Sampled Pareto Frontiers as Parameterized Continuous Manifolds Using Self-Organizing Maps. AIAA J. 2014, 52, 2480–2490. [Google Scholar] [CrossRef] [Scilit]
- Malek, A.M.; Alper, S.L.; Izumo, S. Hemodynamic Shear Stress and Its Role in Atherosclerosis. JAMA 1999, 282, 2035–2042. [Google Scholar] [CrossRef] [Scilit] [PubMed]
- Chiu, J.-J.; Chien, S. Effects of Disturbed Flow on Vascular Endothelium: Pathophysiological Basis and Clinical Perspectives. Physiol. Rev. 2011, 91, 327–387. [Google Scholar] [CrossRef] [Scilit] [PubMed]
- Furlani, E.P.; Ng, K.C. Analytical Model of Magnetic Nanoparticle Transport and Capture in the Microvasculature. Phys. Rev. E 2006, 73, 061919. [Google Scholar] [CrossRef] [Scilit]


Disclaimer/Publisher’s Note: The statements, opinions and data contained in all publications are solely those of the individual author(s) and contributor(s) and not of MDPI and/or the editor(s). MDPI and/or the editor(s) disclaim responsibility for any injury to people or property resulting from any ideas, methods, instructions or products referred to in the content. |
© 2026 by the authors. Licensee MDPI, Basel, Switzerland. This article is an open access article distributed under the terms and conditions of the Creative Commons Attribution (CC BY) license.