


Abstract
Citrus medica ‘Guangdong Xiangshui’ is a commercially valuable specialty citrus cultivar whose leaf volatile organic compounds (VOCs) hold promise for applications in food flavor development. Although rootstock genotype is known to influence secondary metabolism in scions, its specific regulatory effects on leaf VOCs in this cultivar remain poorly understood. In this study, headspace gas chromatography–ion mobility spectrometry (HS-GC-IMS) combined with multivariate statistical analysis was employed to profile leaf VOCs from plants grafted onto four different rootstocks, alongside own-rooted controls. For comparative purposes, leaf and pericarp VOC profiles were also analyzed under identical conditions. A total of 43 valid ion signals were detected, of which 27 neutral parent volatile compounds—predominantly aldehydes, alcohols, ketones, esters, and sulfur-containing compounds—were tentatively identified via database matching (match score > 80%). Distinct volatile fingerprints were observed among rootstock genotypes and propagation modes, and nine candidate differential compounds with variable importance in projection (VIP) > 1 were screened, demonstrating that HS-GC-IMS coupled with exploratory chemometric analysis enables preliminary discrimination of leaf samples across rootstock treatments. Comparative tissue analysis revealed pronounced metabolic divergence: leaves accumulated abundant C6 aldehydes and alcohols, indicative of lipoxygenase (LOX) pathway activity, whereas pericarp exhibited a higher proportion of terpenoids, consistent with terpene synthase (TPS) pathway dominance. However, these metabolic profiling results alone do not conclusively establish pathway-mediated regulatory mechanisms, necessitating further molecular and biochemical investigations. Collectively, this study provides foundational data for rootstock selection and the utilization of leaf aroma resources in C. medica ‘Guangdong Xiangshui’.
1. Introduction
In recent years, lemon tea has established itself as a prominent category within the beverage industry. The primary raw materials used in its production include Citrus medica ‘Guangdong Xiangshui’ (Guangdong Xiangshui lemon), C. limonia ‘Osbeck’ (Taiwan Xiangshui lemon), and C. limon ‘Eureka’ (Eureka lemon). Among these, C. medica ‘Guangdong Xiangshui’ is regarded as a premium raw material for lemon tea, owing to its desirable agronomic and quality attributes, including a rich aromatic profile, seedlessness, the capacity to flower and fruit four to six times per year, and a consistent year-round supply [1,2]. Although morphologically similar to common lemons, this cultivar is taxonomically classified as a citron (C. medica) rather than a true lemon (C. limon) [1,2]. While the volatile profile of its fruit has been previously characterized [3], the volatile composition of its leaves differs markedly, with the leaves being particularly rich in C6 and C9 aldehydes and alcohols that impart characteristic fresh, green, vegetative notes [4].
In addition, the regulatory influence of rootstocks on leaf volatiles differs from that on fruit volatiles. As a continuously harvestable raw material available year-round, the leaves of C. medica ‘Guangdong Xiangshui’ hold unique application potential in the food industry, with patented technologies already established for their use in hotpot seasoning formulations and related products [5,6]. Nevertheless, the specific biochemical components that underpin the leaf aroma profile, as well as the factors modulating them, remain insufficiently characterized, representing a notable knowledge gap for targeted quality improvement.
Aroma-active compounds—volatile constituents that directly contribute to the overall odor of a sample [7]—form the material basis of aroma quality. Their identification is a prerequisite for elucidating the mechanisms of aroma formation. Gas chromatography–mass spectrometry (GC–MS) coupled with gas chromatography–olfactometry (GC–O) is a well-established technique for this purpose and has been successfully applied to characterize key aroma compounds in various citrus species [8,9]. However, research specifically addressing the leaf aroma profile of C. medica ‘Guangdong Xiangshui’ remains scarce. Despite the traditional culinary use of its leaves, a systematic and in-depth analysis of their volatile composition is still lacking. Existing studies have predominantly focused on fruit quality and utilization [10,11], leaving the chemical basis of the leaf aroma largely unexplored.
In citrus production, Citrus junos is characterized by vigorous growth and a well-developed root system, making it a commonly used rootstock in Guangdong citrus orchards [12]. C. grandis serves as a traditional rootstock for pomelo and certain other citrus cultivars, valued for its strong root system, good graft compatibility, and vigorous growth [13]. Poncirus trifoliata is among the most frequently employed rootstocks in citrus cultivation, conferring cold hardiness, drought tolerance, and often inducing early fruiting and dwarfing effects [13]. Citrange (P. trifoliata × C. sinensis), a hybrid rootstock, is noted for its vigorous root system, strong growth, and tolerance to poor and acidic soils [14]. These rootstocks differ markedly in their physiological characteristics, which may in turn exert differential effects on scion metabolism and volatile profiles.
Rootstock genotype is a well-documented factor influencing scion physiology, including the composition and concentration of volatile compounds such as aldehydes, alcohols, and terpenes in leaves [15]. For volatile profiling of C. medica ‘Guangdong Xiangshui’, GC–MS has been the conventional method [16]. In contrast, GC–IMS offers advantages in rapid analysis, operational simplicity, and instrument portability [17], rendering it highly suitable for high-throughput screening applications. To our knowledge, no study has yet employed GC–IMS to investigate rootstock-induced variations in the leaf volatile profile of this cultivar. While the volatile profile of the pericarp has been reported previously [3], the leaf dataset generated in the present study is entirely new and independent. Although derived from the same field trial, it focuses on a distinct organ (leaves), confirming that the foliar findings presented here are novel contributions rather than re-analyses of previously published pericarp data.
GC–IMS-based volatile fingerprinting is often integrated with multivariate statistical analysis. Partial least squares–discriminant analysis (PLS–DA), a supervised classification method, is particularly effective for extracting latent information from complex datasets and identifying key discriminatory variables [18,19]. To facilitate the selection of specialized rootstocks and explore the application potential of leaf aroma resources, the present study employs HS–GC–IMS for the first time to tentatively characterize the volatile organic compounds (VOCs) in leaves of C. medica ‘Guangdong Xiangshui’ grafted onto different rootstocks, establishing flavor fingerprint profiles for each treatment. Subsequently, VIP (variable importance in projection) analysis derived from the PLS–DA model is applied to screen for volatile markers that discriminate among rootstock treatments. This exploratory approach aims to preliminarily delineate the impact of rootstock genotype on the leaf aroma signature, and the tentatively identified candidate markers are anticipated to provide preliminary insights into the metabolic mechanisms through which rootstocks modulate aroma formation in citrus leaves.
2. Materials and Methods
2.1. Plant Materials and Sample Collection
2.1.1. Plant Materials and Growth Conditions
In April 2020, scions of Citrus medica ‘Guangdong Xiangshui’ were grafted onto four one-year-old rootstocks, namely Citrus junos (abbreviated as XCL), C. grandis (SYL), Poncirus trifoliata (ZKL), and citrange (P. trifoliata × C. sinensis, ZCL). Own-rooted plants of the same cultivar, propagated by cuttings and exhibiting uniform growth performance, served as the control (abbreviated as QCL). When the new shoots reached approximately 50 cm in length, all grafted and own-rooted plants were transplanted to the demonstration and promotion base of Guangdong Tianhe High-Quality Seedling Breeding Co., Ltd., located in Xinxing County, Guangdong Province.
The field experiment was not arranged as a randomized complete block design. For each rootstock–scion combination (including the control), 20 plants were cultivated within a single independent plot (with one row representing one plot), at a plant spacing of 3 m and a row spacing of 4 m between different treatment plots. All treatment plots were randomly allocated across the experimental site. An inter-plot row spacing of 4 m was adopted to minimize interference among treatments, such as root competition and canopy shading, and border rows were established around the entire experimental field to reduce edge effects. Prior to transplanting, all plots were thoroughly ploughed and amended with well-decomposed farmyard manure to ensure uniform soil conditions. Throughout the trial, all plots received consistent agronomic management, including irrigation, fertilization, and pest and disease control. The experimental site featured flat terrain and homogeneous soil conditions to mitigate environmental heterogeneity.
Leaf sampling was conducted on 12 July 2023, at approximately 10:00 a.m. during the spring flush, three years after transplanting. A two-step selection procedure was applied to obtain representative sample trees for each treatment. First, all 20 trees per plot were surveyed for plant height, stem diameter (measured 10 cm above the graft union), and canopy width. Individuals were excluded if their plant height or stem diameter deviated by more than ±1.5 standard deviations from the treatment-specific mean, or if they exhibited obvious pest or disease damage, mechanical injury, or a canopy width less than 60% of the treatment average. Second, five trees were randomly selected from the remaining healthy individuals using a random number table method; the selected trees covered diverse positions within each row to minimize potential positional micro-environmental effects. The overall workflow of the field trial, sampling, and analytical procedures is illustrated in Supplementary Figure S1.
2.1.2. Sample Collection and Preservation
Spring-flush leaves were collected from bearing shoots located in the middle–outer canopy of each tree. For each of the five selected trees per treatment, one bearing shoot was sampled from each of the four cardinal directions (east, south, west, and north). Three fully expanded mature leaves were harvested per shoot, yielding a total of 12 leaves per individual tree. Immediately after harvest, the leaf tissues were snap-frozen in liquid nitrogen, transported to the laboratory, and stored at −80 °C until further pretreatment.
For each treatment, a total of 60 leaves were collected from five trees (12 leaves per tree). All leaves from the five trees within the same treatment were thoroughly pooled and mixed to generate a single composite biological sample, which was then randomly divided into three equal subsamples of 20 leaves each. Each subsample was independently homogenized and analyzed (n = 3). Since all three subsamples were derived from the same pooled biological material, they do not constitute independent biological replicates. Instead, they represent subsampling replicates of the composite sample, reflecting variability introduced during sample preparation and instrumental analysis.
2.2. Instruments and Reagents
2.2.1. Main Instruments and Equipment
Volatile components were analyzed using an integrated gas chromatography–ion mobility spectrometry (GC–IMS) system. The core detection instrument was a FlavourSpec® gas chromatography–ion mobility spectrometer (G.A.S. GmbH, Dortmund, Germany), and sample injection was performed using a CTC PAL 3 static headspace autosampler (CTC Analytics AG, Zwingen, Switzerland). Volatile compounds were separated on an MXT-WAX capillary column (15 m × 0.53 mm i.d., film thickness 1.0 μm; Restek Corporation, Bellefonte, PA, USA). Samples were incubated in 20 mL headspace vials (Haineng Advanced Technology Group, Jinan, China). VOCal software (version 0.4.03; G.A.S. GmbH, Dortmund, Germany) was used for data acquisition, processing, spectral analysis, and comparative visualization. The detailed GC–IMS analytical parameters are listed in Supplementary Table S1.
2.2.2. Main Reagents and Materials
All chemical reagents used in this study were of analytical grade. A series of n-ketone standards, namely 2-butanone, 2-pentanone, 2-hexanone, 2-heptanone, 2-octanone, and 2-nonanone (analytical grade; Aladdin Biochemical Technology Co., Ltd., Shanghai, China), were applied for system calibration and retention index calculation. High-purity nitrogen (≥99.999%) was used as the carrier gas and drift gas to ensure the stability of chromatographic separation and ion migration.
2.3. Experimental Methods
2.3.1. Pretreatment of Leaf Samples
Leaf tissue (1.5 g) was accurately weighed and placed into a 20 mL headspace vial. The vial was immediately sealed and loaded into the CTC-PAL 3 static headspace autosampler for automated headspace injection. Each subsample was injected instrumentally in triplicate, and the average value was adopted for subsequent quantitative calculations to minimize random instrumental errors. These three consecutive injections served as instrumental technical replicates and were averaged; they were not treated as independent biological replicates.
2.3.2. Headspace Sampling Conditions
The headspace injection parameters were set as follows: incubation temperature, 40 °C; incubation time, 10 min; incubation agitation speed, 500 rpm. A sample volume of 200 μL was injected in splitless mode. The syringe temperature was maintained at 85 °C to prevent condensation of volatile compounds and ensure injection accuracy.
2.3.3. Gas Chromatography Conditions
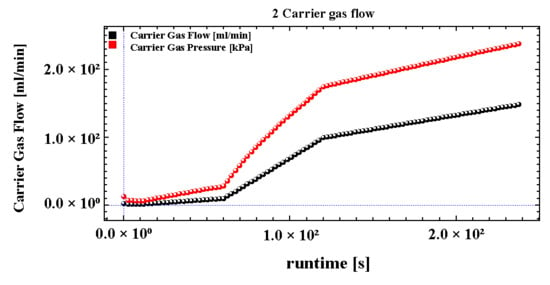
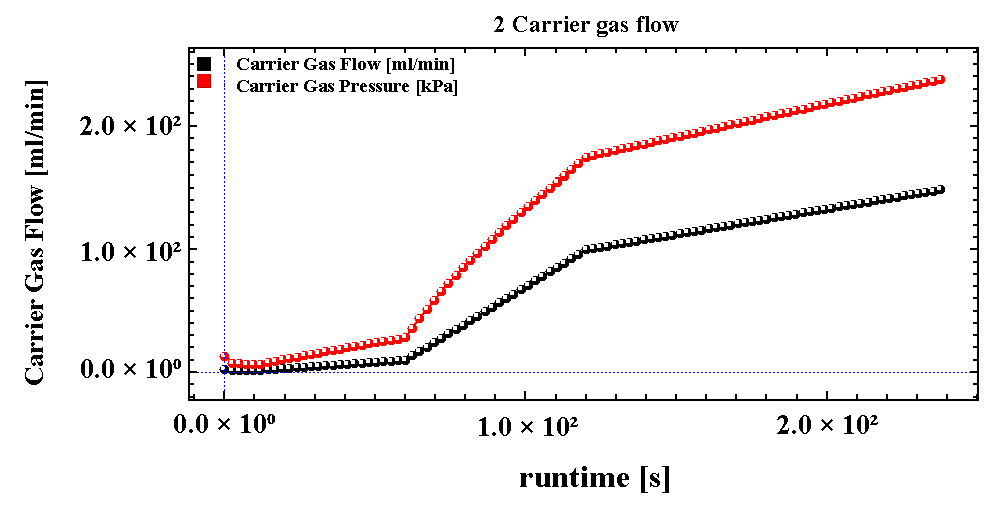
Chromatographic separation was performed on an MXT-WAX capillary column (15 m × 0.53 mm i.d., film thickness 1.0 μm; Restek Corporation, Bellefonte, PA, USA), with the column temperature maintained constant at 60 °C. High-purity nitrogen (≥99.999%) was used as the carrier gas. The carrier gas flow rate was controlled via a pressure-programmed mode (Table 1, Figure 1): the initial flow rate was 2.00 mL/min and held for 2 min, then linearly increased to 10.00 mL/min within 8 min, and further linearly increased to 100.00 mL/min within 10 min, followed by a hold at this flow rate for 25 min, resulting in a total chromatographic runtime of 45 min. The injector temperature was set at 80 °C. Throughout the analytical procedure, the drift gas flow rate was maintained constant at 150 mL/min to ensure stable ion separation in conjunction with the carrier gas flow.
Table 1.
Gas chromatography program parameters.
Figure 1.
Programmed carrier gas flow and pressure gradient over the GC runtime.
The linear retention indices (RI) of volatile compounds were calculated based on the retention times of n-ketone homologs (C4–C9) analyzed on the same MXT-WAX capillary column under identical chromatographic conditions. The calculated RI values were matched against the built-in NIST 2020 database and the IMS drift-time database of the GC-IMS system for preliminary compound identification using VOCal software (version 0.4.03). The RI matching tolerance was set to ±10 according to the instrument default parameters. Drift times were normalized to the reactant ion peak (RIP) prior to database matching. Only identification results with a composite match score > 80% were retained.
2.3.4. Ion Mobility Spectrometry Conditions
A tritium source (3H) was used as the ionization source. The drift tube had a length of 53 mm and was maintained at 45 °C to prevent condensation. The electric field strength was set at 500 V/cm. High-purity nitrogen (≥99.999%) served as the drift gas at a flow rate of 150 mL/min. Measurements were performed in positive-ion mode, and the separated ions were collected by a Faraday plate for signal acquisition.
Under positive-ion conditions, high-concentration analytes generate protonated monomers (M + H)+, protonated dimers (M2 + H)+, and even protonated trimers (M3 + H)+ within the ionization region. These represent different ionic forms of the same chemical compound, sharing identical CAS number, molecular formula, and chemical structure. Nevertheless, they exhibit distinct drift times in the IMS drift tube owing to differences in molecular weight, collision cross-section, ionic spatial configuration, charge state, and interactions with the drift gas.
2.4. Data Processing Methods
2.4.1. Qualitative and Quantitative Analysis
Raw spectral data were processed using the Laboratory Analytical Viewer (LAV; G.A.S. GmbH, Dortmund, Germany). The Reporter and Gallery Plot plug-ins were used as plug-ins to extract the peak volume of each volatile compound.
Qualitative analysis: Volatile compounds were tentatively identified by matching their retention indices (RI) and drift times (Dt) against the built-in NIST and IMS databases of the GC-IMS system. Only compounds with a match score > 80% were retained for subsequent analysis.
Quantitative analysis: For compounds that formed protonated monomer (M), dimer (D), and/or trimer (T) ions, the total peak volume of the target compound was calculated as the sum of peak volumes from all ionic forms. Because the proportion of each ionic form varies dynamically with analyte concentration, summing the peak volumes of all ionic forms is a standard practice in GC-IMS quantitative workflows to avoid bias caused by interconversion among different ion species. All peak volume data were normalized to sample weight prior to subsequent statistical analysis.
The proportion of each chemical class (PA, %) was calculated as follows:
where VA is the sum of normalized peak volumes of compounds belonging to chemical class A, and VT is the total normalized peak volume of all 27 parent compounds in the sample.
For compounds that generated multiple ion species—namely monomer (M), dimer (D), and/or trimer (T) ions—during GC-IMS ionization, the peak volumes of all ionic forms were summed to generate a representative variable for the parent compound. This integrated value was used in subsequent chemical class statistics, Venn diagram analysis, and calibration model construction. This treatment was designed to eliminate potential collinearity among homologous ions, which could otherwise distort the contribution of individual variables to multivariate statistical models.
2.4.2. Method Validation and Quality Control
To ensure the reliability of quantitative results, the precision, stability, and repeatability of the method were evaluated. The precision (six consecutive injections) yielded RSD < 10% for all compounds, with over 90% showing RSD < 5%; stability (0, 2, 4, 8, 12, 24 h post-preparation) gave RSD < 12%; and repeatability (six parallel subsamples) gave RSD < 15%. These results confirm good reproducibility and suitability for comparative analysis among treatment groups.
Prior to formal sequence analysis, blank vials were run to assess carryover and background noise, and the sequence was initiated only after system status was confirmed normal. Additional blanks were inserted after samples with intense odors or high analyte concentrations to prevent carryover or tailing. The C4–C9 n-ketone series was analyzed periodically to monitor stability and correct retention index shifts, ensuring reliable chromatographic alignment. Samples were injected sequentially by treatment group (XCL, SYL, ZCL, ZKL, QCL), with three subsamples from a pooled composite sample per group injected consecutively, rather than in a fully randomized run order. This non-randomized injection sequence carries a potential risk of confounding treatment effects with time-dependent instrumental drift or analyte carryover. Therefore, the assumption that minor instrumental fluctuations would affect all groups equally cannot be fully validated. Nevertheless, several measures were implemented to mitigate systematic bias, including blank injections, periodic monitoring via n-ketone standards, and RIP-based drift correction. Non-randomized run order remains a methodological limitation of this study, and inter-group comparisons should be interpreted accordingly. Prior to preprocessing, retention and drift times were calibrated using the reactant ion peak (RIP) to correct instrument drift. Ion peaks with signal-to-noise ratio below 3 were excluded from further analysis.
2.5. Statistical Analysis
All analyses were performed using three subsamples derived from a single pooled composite sample per treatment (n = 3). One-way analysis of variance (ANOVA) coupled with Duncan’s multiple range test was applied to evaluate significant differences among different rootstock treatments (p < 0.05). Given that the subsamples were not independent biological replicates, the statistical results are representative of the experimental batch and should be interpreted with caution when generalized to broader populations. All error bars in the figures represent standard deviation (SD). Prior to ANOVA, the assumptions of normality and homogeneity of variance were assessed using the Shapiro–Wilk test and Levene’s test, respectively. The data were examined for outliers prior to analysis, and no extreme values were detected. Additionally, Q–Q plots of representative compounds from different chemical classes (Supplementary Figure S2) were used for visual verification of the prerequisites for ANOVA.
Differential compounds were preliminarily screened using unadjusted one-way ANOVA p-values (p < 0.05) combined with a variable importance in projection (VIP) threshold > 1. This approach does not apply false discovery rate (FDR) correction for multiple testing, which may carry an elevated risk of false-positive findings. The tentatively identified compounds should be regarded as candidate differential markers from an exploratory analysis rather than statistically confirmed differences. For future validation studies with larger sample sizes, the Benjamini–Hochberg procedure is recommended to formally control for multiple comparisons.
Hierarchical cluster analysis (HCA) and heatmap visualization were implemented in R software (version 4.3.0) using the ggplot2 (version 3.4.4) and pheatmap packages (version 1.0.12). HCA was performed using Ward’s linkage method with Euclidean distance for both sample and compound clustering. Compound values in heatmaps were normalized by Z-score standardization (computed across samples for each compound).
For multivariate statistical analysis, normalized peak volumes were unit-variance scaled prior to principal component analysis (PCA) and partial least squares–discriminant analysis (PLS-DA). PCA was used for unsupervised dimensionality reduction. PLS-DA was conducted using SIMCA-P software (version 13.5, Umetrics, Umeå, Sweden). The optimal number of latent variables was determined by 7-fold cross-validation, and a 200-permutation test was performed to assess the risk of model overfitting. Detailed model parameters, including cumulative R2X, R2Y, Q2, optimal latent variables, permutation test p-values, and cross-validation ANOVA (CV-ANOVA) outputs, are summarized in Supplementary Table S1. Variables with VIP > 1 were regarded as candidate differential characteristic compounds.
The relative contribution of each aroma attribute in the radar charts was calculated by summing the normalized peak volumes (across three subsamples from a pooled composite sample) of all unique neutral parent compounds assigned to the same aroma descriptor. Venn diagrams were generated using the ggvenn package (version 0.1.9) to visualize shared and tissue-specific compounds between leaves and pericarp, based on counts of unique neutral parent compounds. All statistical analyses and visualizations were performed in R (version 4.3.0) and SIMCA-P (version 13.5). The full signal intensity matrix of all originally detected ion peaks is provided in Supplementary Table S2.
3. Results
3.1. Comparison of HS-GC-IMS Topographical Plots
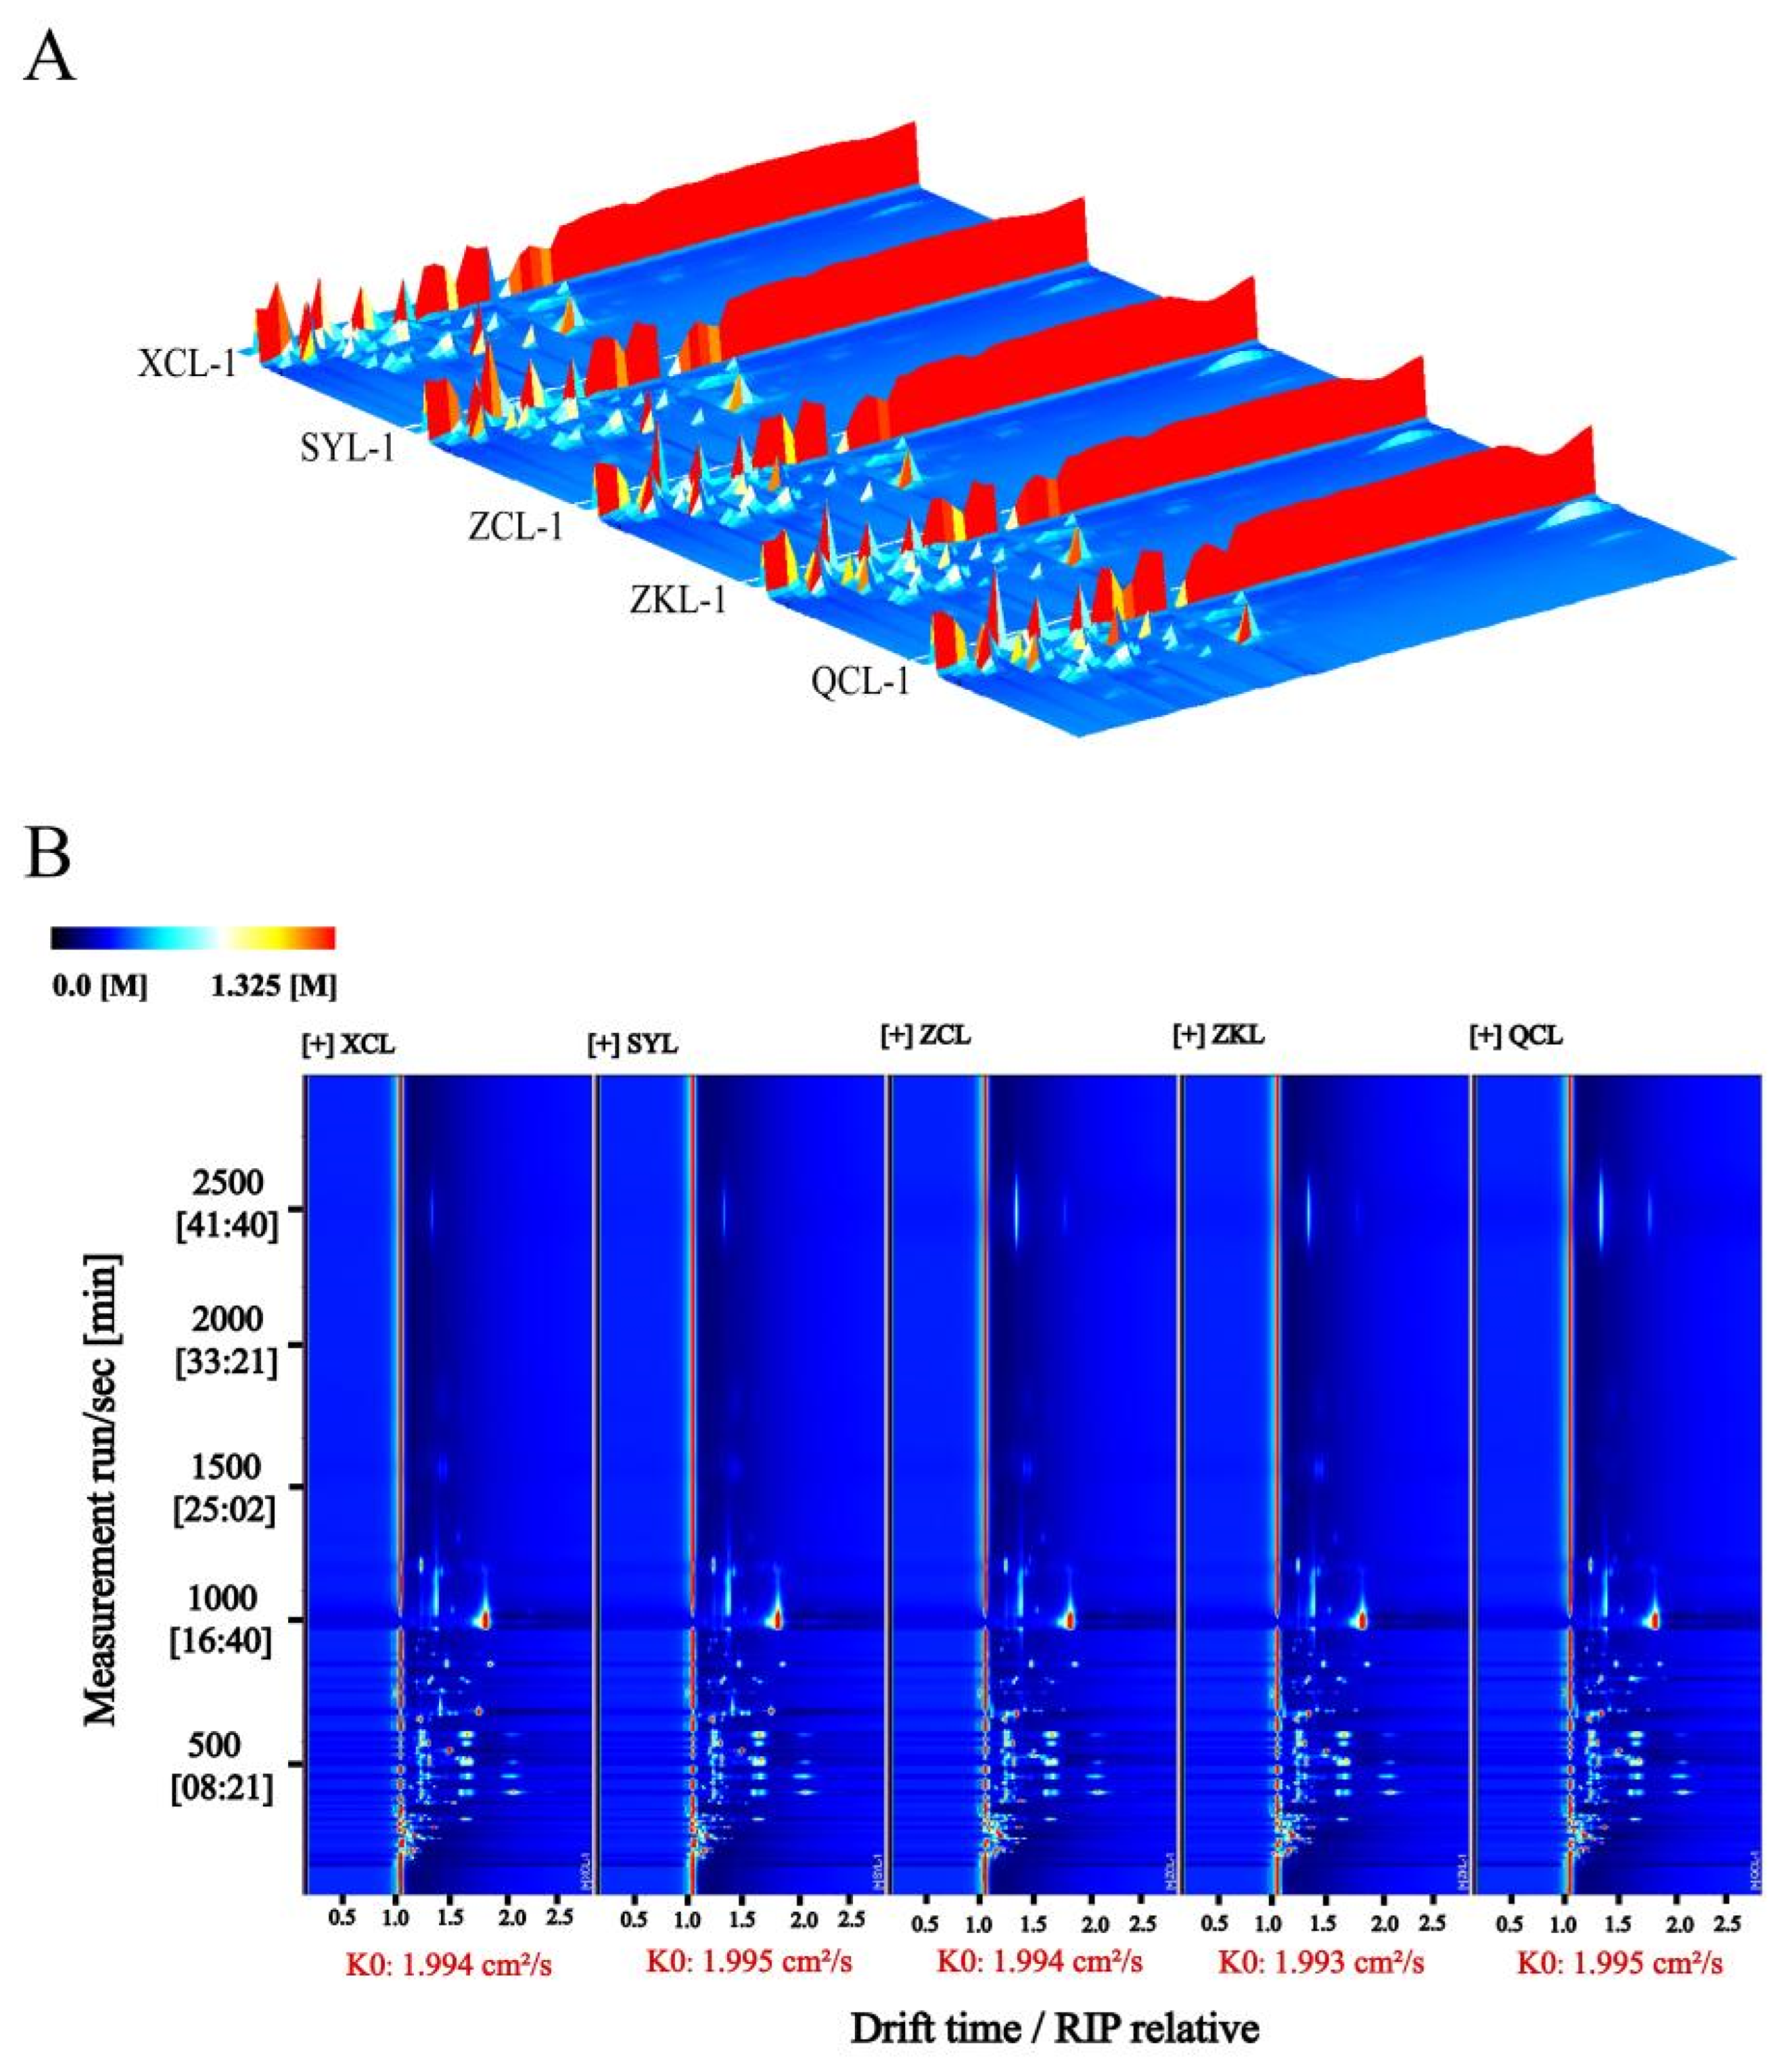
Figure 2A presents the three-dimensional topographic profiles generated by GC-IMS, providing a spatial visualization of VOC variations across samples. The three axes represent ion drift time (x-axis), GC retention time (y-axis), and signal intensity (z-axis), respectively [20]. Although the overall spatial distribution of VOC signals was largely consistent among leaf samples from plants grafted onto P. trifoliata, citrange, C. junos, C. grandis, and the own-rooted controls, marked differences in peak intensities were evident. These quantitative disparities, attributable to rootstock genotype or propagation method, are reflected in the distinct heights and morphologies of the high-intensity (red) regions within the topographic profiles. The corresponding two-dimensional topographic plot is shown in Figure 2B for enhanced clarity.
Figure 2.
GC-IMS analysis of volatile compounds in leaves from grafted and own-rooted plants. (A) Three-dimensional topographic plot; (B) two-dimensional topographic plot. Note: XCL, SYL, ZCL, ZKL, and QCL represent five different citrus rootstock treatment groups, respectively.
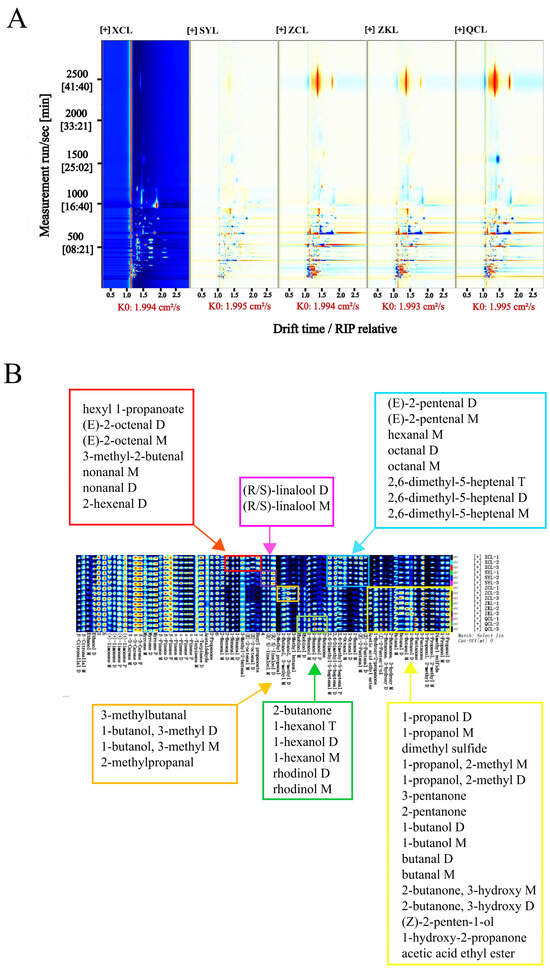
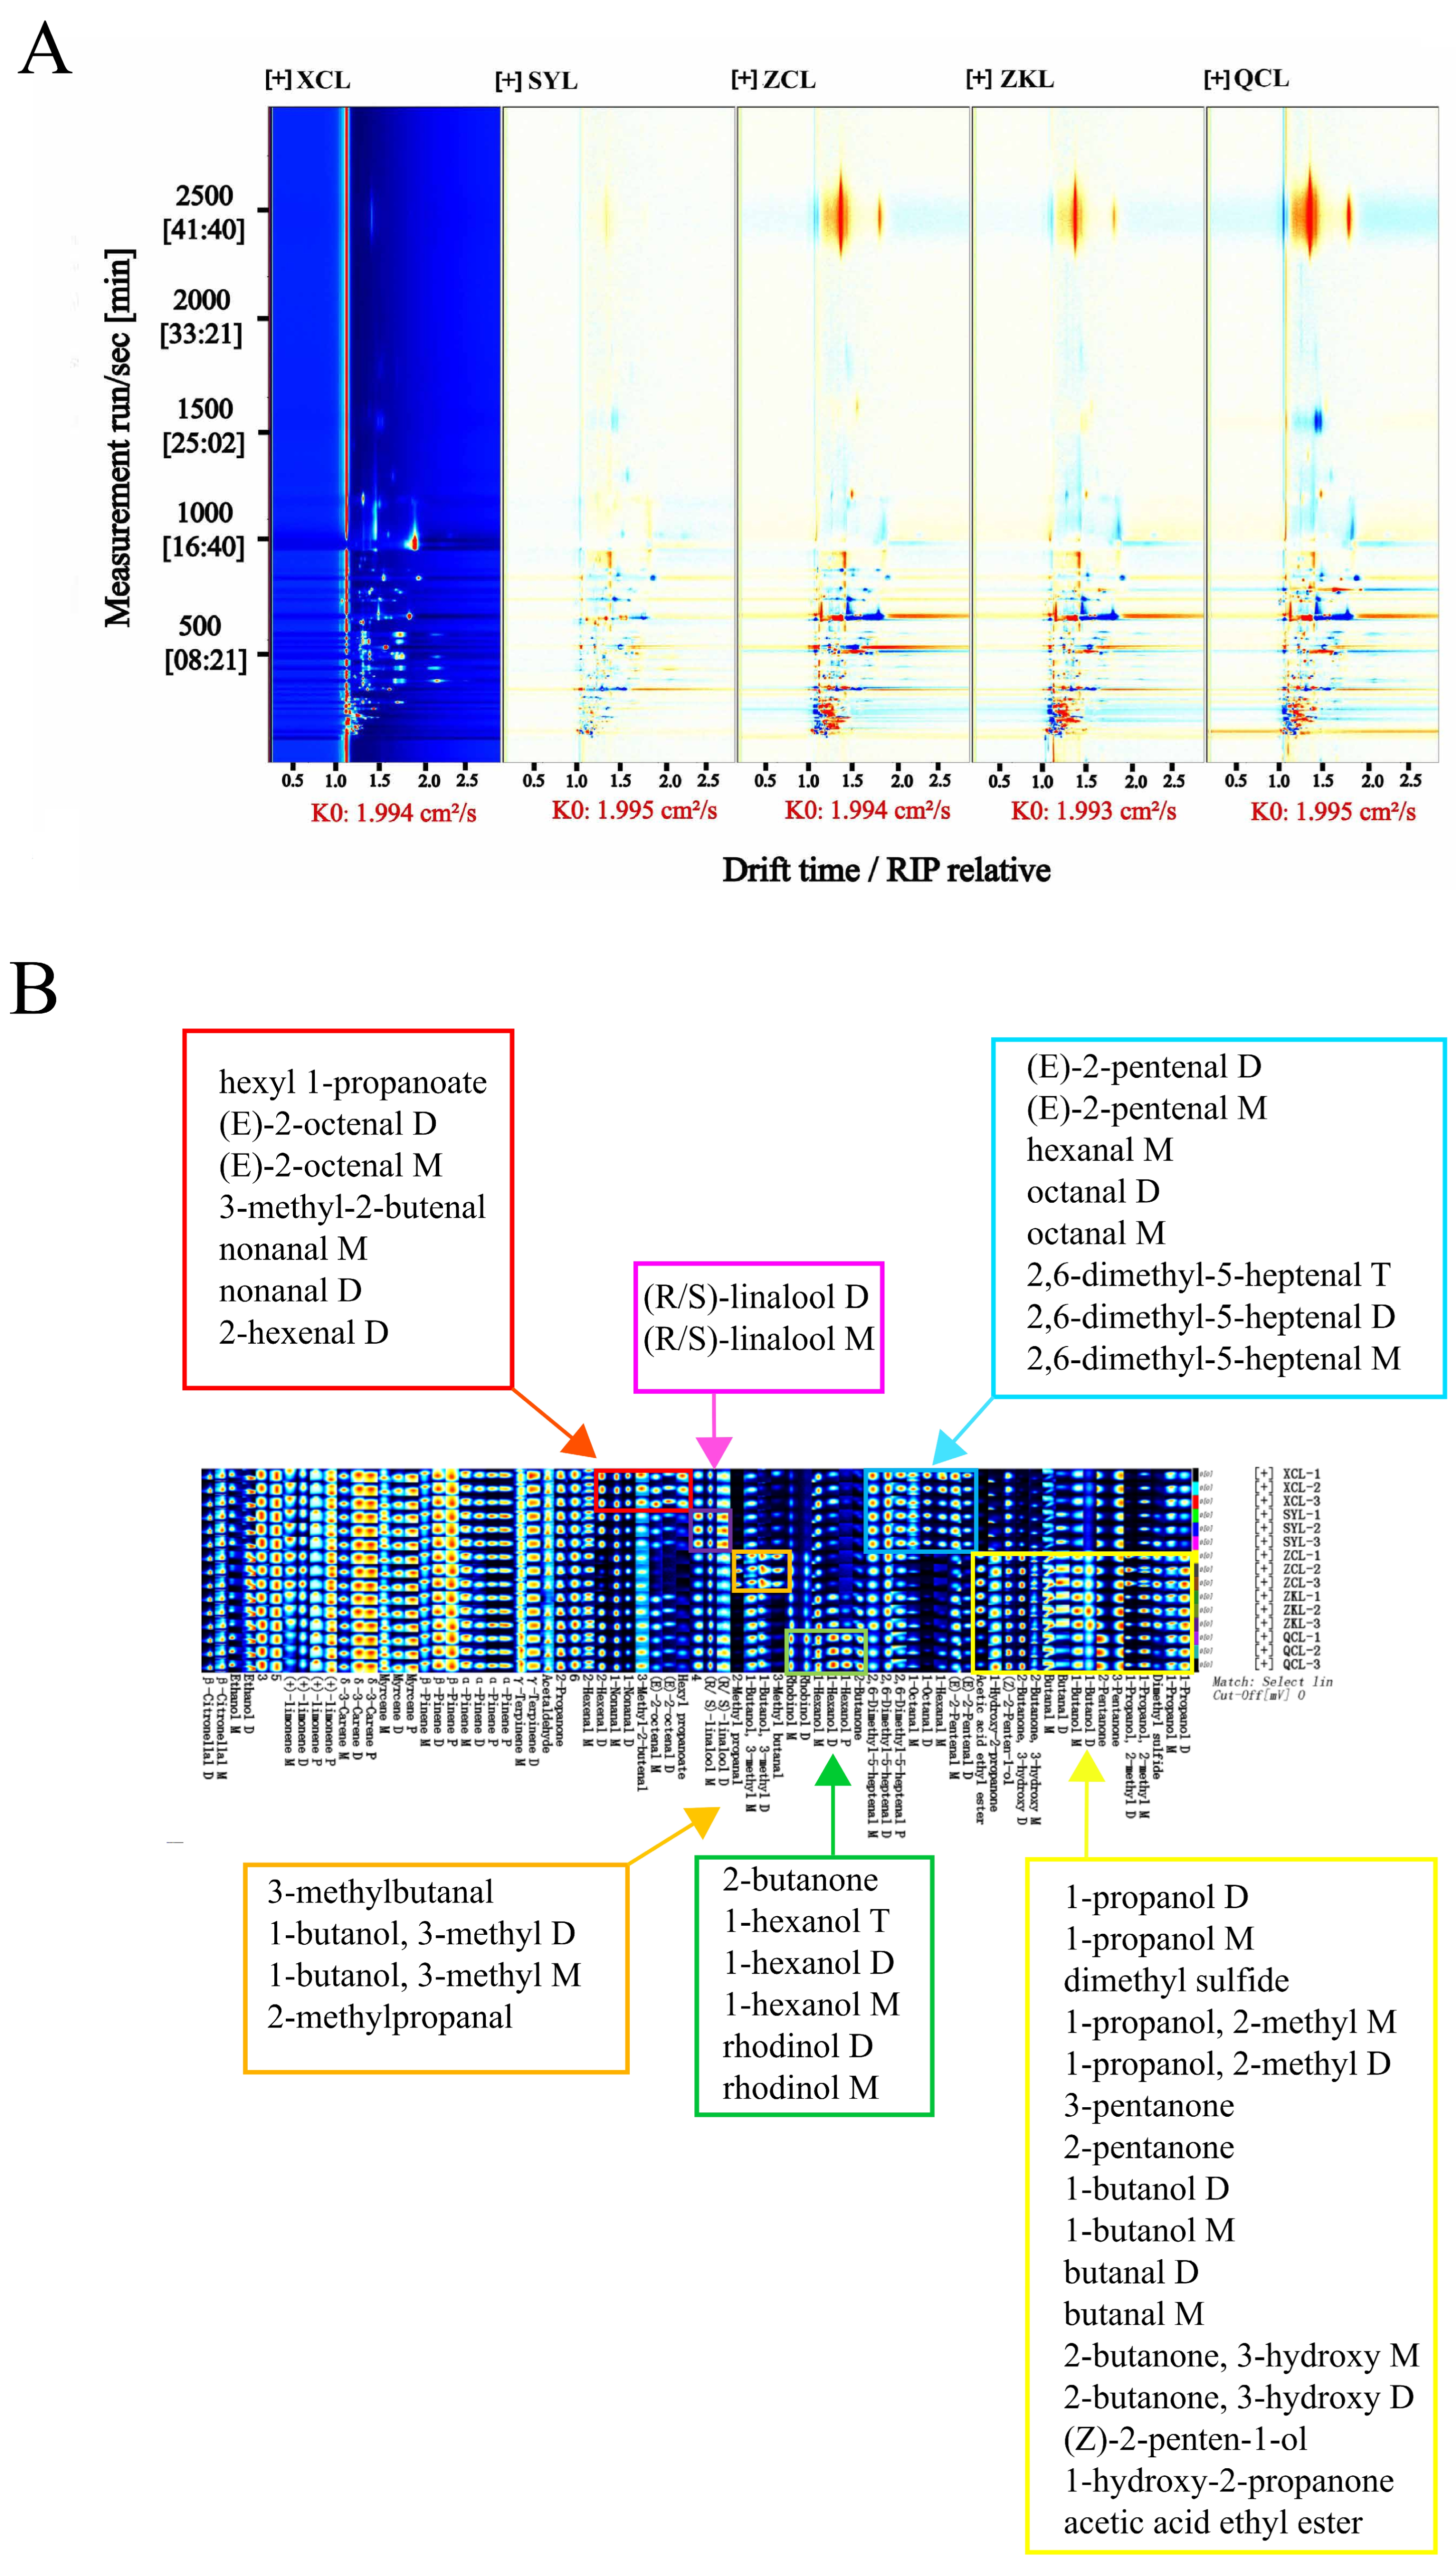
To further delineate these differences, differential analysis was performed. Using the spectrum of sample XCL-1 as a reference, difference spectra were generated by subtracting it from all other samples, yielding the comparative topographic map shown in Figure 3A. In this map, the vertical and horizontal axes correspond to GC retention time and ion drift time, respectively. The normalized reactant ion peak (RIP) is indicated by a red vertical line at a drift time of 1.0 ms [20], with each signal spot representing a detected VOC.
Figure 3.
(A) Differential topographic map of volatile compounds in leaves from different rootstocks and own-rooted plants. (B) GC-IMS fingerprint spectra of volatile components. The horizontal axis shows 43 tentatively identified ion signals (including monomers M, dimers D, and trimers T), which correspond to 27 unique parent compounds after consolidation. Note: XCL, SYL, ZCL, ZKL, and QCL represent five different citrus rootstock treatment groups, respectively.
Analysis of the difference map revealed distinct VOC fingerprints among treatments. The majority of signals were concentrated within retention times of 0–2500 s and drift times of 0.5–2.5 ms, with a prominent signal cluster observed in the drift time range of 1.0–2.0 ms. Signal intensity is represented by a color gradient ranging from white (low intensity) to red (high intensity), where redder hues indicate stronger ion signals, thereby providing a direct visual representation of compound abundance differences.
3.2. Feature Profiling and Differential Analysis of Tentatively Identified VOCs
Although the comparative topographic plot (Figure 3A) reveals distinct variation trends among volatile constituents, drawing definitive conclusions regarding individual compounds solely based on these visual representations remains challenging. In contrast, the fingerprint spectrum (Figure 3B) enables a more intuitive assessment of relative compound abundance through color intensity, facilitating both qualitative and quantitative comparisons across different samples [21].
As illustrated in Figure 3B, the vertical axis of the fingerprint plot corresponds to the subsamples from a pooled composite sample of the various rootstock treatments and the own-rooted control, while the horizontal axis represents the 43 characteristic ion signals detected, including monomer (M), dimer (D), and trimer (T) forms, as detailed in Supplementary Table S3. The color intensity of each cell directly reflects the relative signal intensity of a given compound within the corresponding sample, with darker hues indicating higher abundance. Notably, the compounds were detected as M, D, or T ion species [22]. After consolidating the signals of the different ion forms corresponding to the same parent compound, the fingerprint analysis tentatively identified 27 unique volatile compounds, as summarized in Table 2.
Table 2.
Twenty-seven unique parent volatile compounds tentatively identified in leaves of Citrus medica ‘Guangdong Xiangshui’ after the consolidation of monomer (M), dimer (D), and trimer (T) ion signals.
The fingerprint plot revealed distinct rootstock-specific accumulation patterns. Candidate differential compounds associated with the C. junos rootstock (as indicated in red) were predominantly esters and aldehydes. Characteristic compounds specific to C. grandis (in green) were mainly centered around linalool. For the citrange rootstock (in orange), the candidate differential metabolites predominantly included alcohols and aldehydes, whereas the own-rooted plants (in pink) specifically enriched a group of ketones and alcohols. Furthermore, a cluster of aldehydes (in maroon) exhibited an independent accumulation pattern, and another broad category of compounds (in blue)—encompassing alcohols, sulfides, ketones, aldehydes, and esters—was co-enriched in citrange, P. trifoliata, and own-rooted plants. Collectively, these results underscore that rootstock genotype or propagation method exerts a significant regulatory effect on the differential accumulation of volatile compound classes in scion leaves.
3.3. Analysis of Volatile Compound Differences Based on Principal Components and Relative Signal Intensities
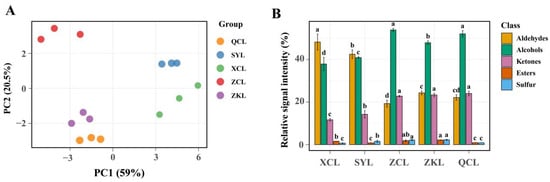
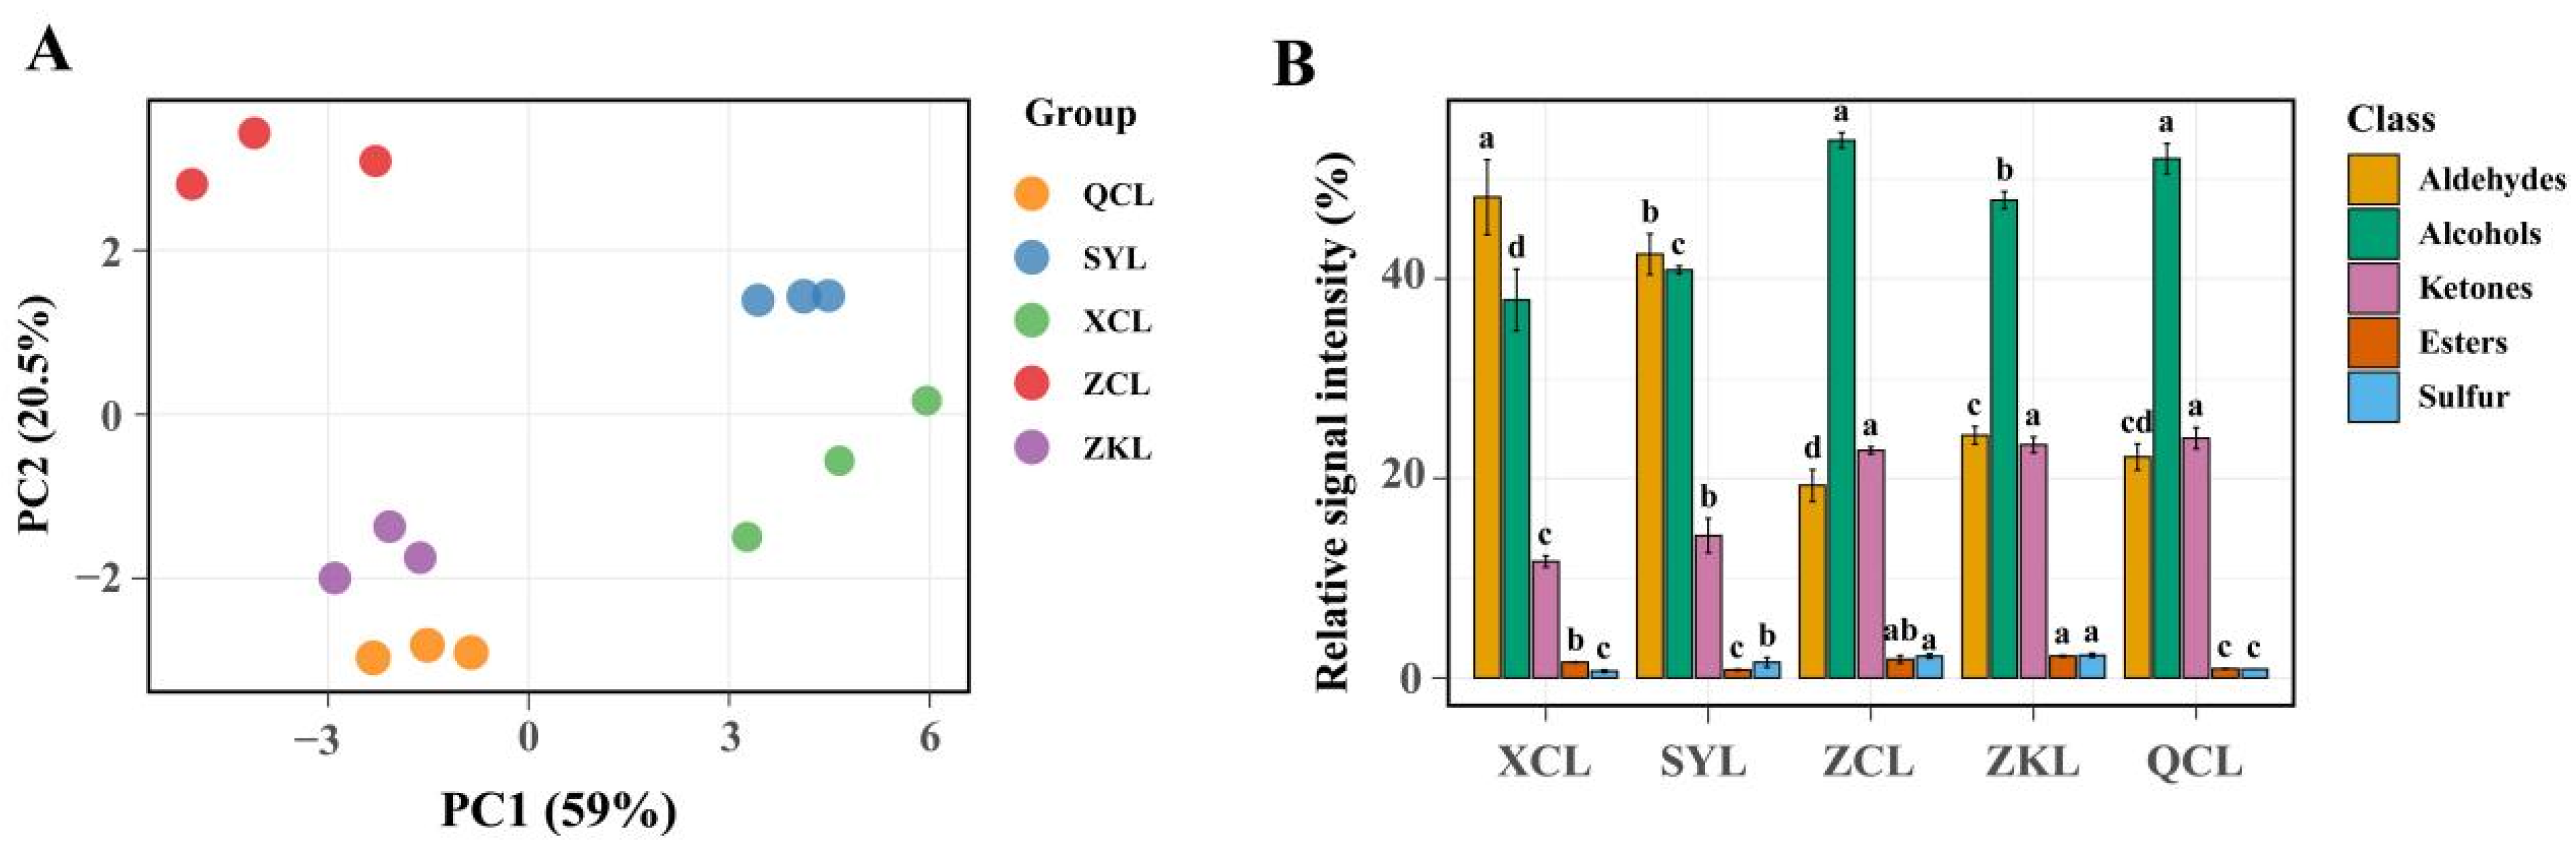
Principal component analysis (PCA) is a multivariate statistical method that reveals intrinsic relationships among variables through dimensionality reduction and has been widely applied to investigate differences in the volatile profiles of fruits and vegetables [23]. In this study, PCA was first employed to analyze the VOC profiles of leaves from plants grafted onto four different rootstocks, alongside own-rooted controls. As shown in Figure 4A, the first two principal components (PC1 and PC2) accounted for 59.0% and 20.5% of the total variance, respectively, yielding a cumulative contribution of 79.5%. This indicates that these two dimensions adequately represent the overall characteristics of the volatile composition across samples. The close clustering of replicate samples within each treatment demonstrates high experimental reproducibility. Regarding sample distribution, score plots for the C. junos and C. grandis groups clustered on the left side of the plot, suggesting a high degree of similarity in their volatile profiles. Samples from the own-rooted plants were positioned in the upper right quadrant, those from the P. trifoliata rootstock were located slightly to the right of center, and the citrange group formed a distinct cluster in the lower right quadrant, clearly separated from all other groups. Collectively, these results confirm that GC-IMS coupled with PCA can effectively discriminate leaf samples originating from different rootstocks and propagation methods.
Figure 4.
(A) PCA score plot of volatile compounds in leaves of Citrus medica ‘Guangdong Xiangshui’ grafted onto different rootstocks based on 27 parent compounds. (B) Relative signal intensities of major volatile chemical classes in leaves. Data are presented as means ± SD (n = 3 subsamples from a pooled composite sample). Different lowercase letters above the bars within the same chemical class indicate significant differences among treatments at p < 0.05 (Duncan’s multiple range test).
To elucidate the chemical basis of these separations, we analyzed the relative signal intensities of the major volatile chemical classes (Figure 4B). Significant variations were observed across different rootstock treatments. Aldehydes reached their highest relative signal intensity in C. junos rootstock leaves and their lowest in citrange. Conversely, alcohols showed the highest relative signal intensity in the own-rooted (QCL) plants and the lowest in the C. junos group. Notably, sulfur-containing compounds were significantly more abundant in leaves from citrange and P. trifoliata rootstocks than in the other treatments. Esters generally maintained low levels with relatively similar distributions across all groups, whereas ketones exhibited marked differentiation in their signal intensities among the different rootstocks.
3.4. Hierarchical Clustering Analysis of Volatile Compounds
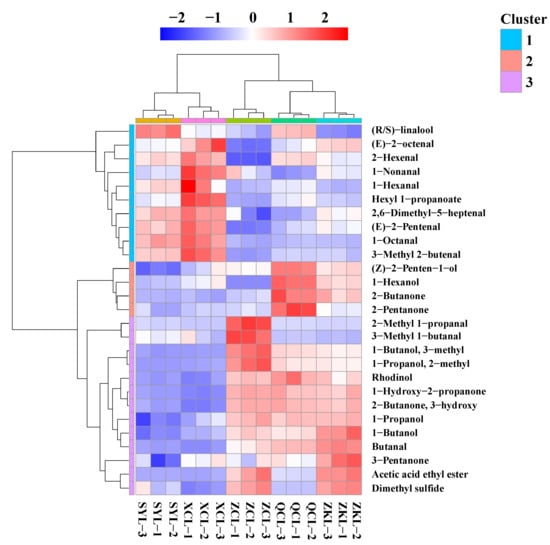
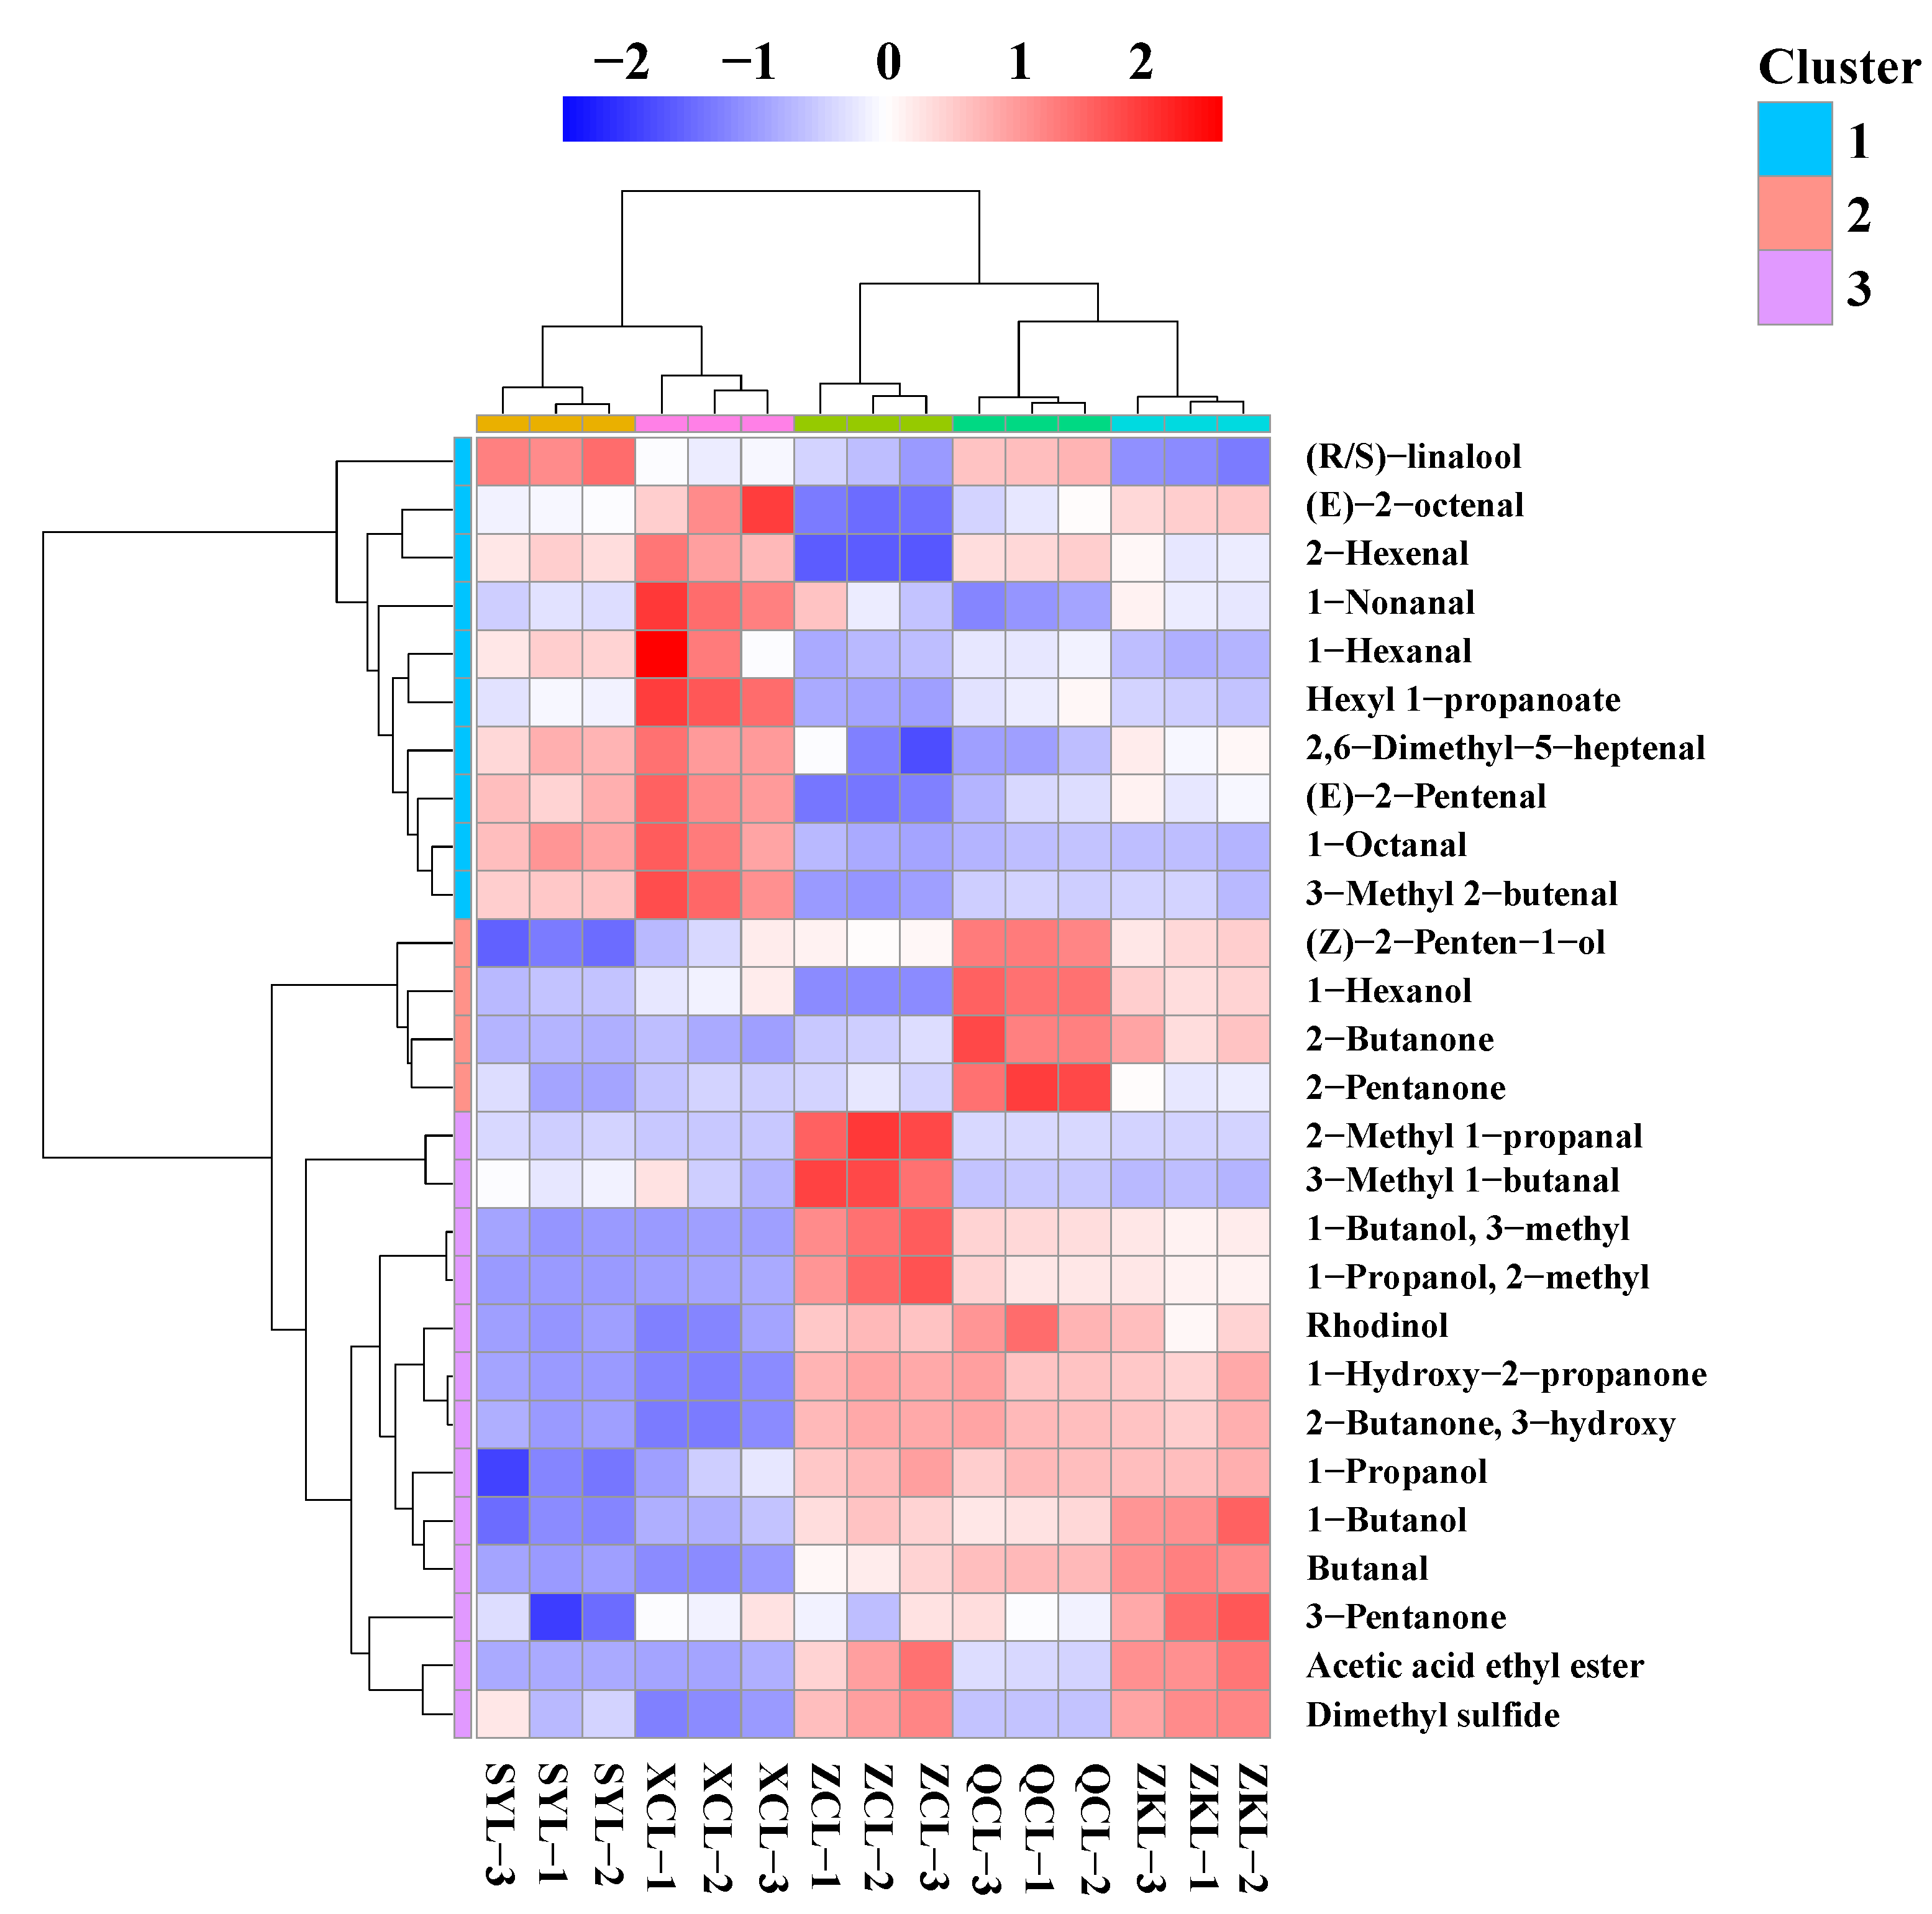
To systematically assess the similarities and differences in volatile fingerprints among different rootstock treatments, two-way hierarchical cluster analysis (HCA) was performed and visualized as a heatmap (Figure 5). The samples were divided into two major branches, with subsamples from a pooled composite sample from each rootstock or propagation method clustering together, further confirming that rootstock genotype or propagation method significantly influences the overall volatile composition of the leaves [24]. All parent volatile compounds were divided into three independent clusters (Clusters I–III) based on their co-accumulation patterns.
Figure 5.
Heatmap and hierarchical clustering analysis of 27 unique parent volatile compounds tentatively identified by GC-IMS in leaf samples from different rootstocks and own-rooted plants. In the heatmap, the peak volume of each volatile compound is represented by a color gradient, with redder hues indicating higher normalized signal intensities and bluer hues corresponding to lower values. Z-score standardization was applied to the data across samples for each compound. Note: XCL, SYL, ZCL, ZKL, and QCL represent five different citrus rootstock treatment groups, respectively.
Cluster I comprised 10 compounds: (R/S)-linalool, (E)-2-octenal, 2-hexenal, nonanal, hexanal, hexyl propanoate, 2,6-dimethyl-5-heptenal, (E)-2-pentenal, octanal, and 3-methyl-2-butenal. This cluster consisted of terpenoids (e.g., linalool) and a variety of straight- and branched-chain aldehydes (including green-leaf volatiles), with only a minor proportion of esters. These compounds exhibited significantly higher accumulation in leaves of the C. grandis (SYL) and C. junos (XCL) rootstocks, but were generally present at lower levels in the other rootstock treatments.
Cluster II comprised four compounds: (Z)-2-penten-1-ol, 1-hexanol, 2-butanone, and 2-pentanone. This cluster was mainly composed of alcohols and ketones. These compounds showed prominent accumulation in the citrange (ZCL) rootstock, but remained at low levels in the C. grandis and C. junos rootstocks, displaying an accumulation pattern distinctly different from that of Cluster I.
Cluster III comprised 13 compounds: 2-methylpropanal, 3-methylbutanal, 3-methyl-1-butanol, 2-methyl-1-propanol, rhodinol, hydroxyacetone, acetoin, 1-propanol, 1-butanol, butanal, 3-pentanone, acetic acid ethyl ester, and dimethyl sulfide. This cluster encompassed alcohols, hydroxy ketones, esters, and sulfides. It was predominantly enriched in leaves of the own-rooted plants (QCL) and P. trifoliata (ZKL) rootstocks, with moderate levels of a few compounds also observed in the citrange rootstock.
3.5. PLS-DA
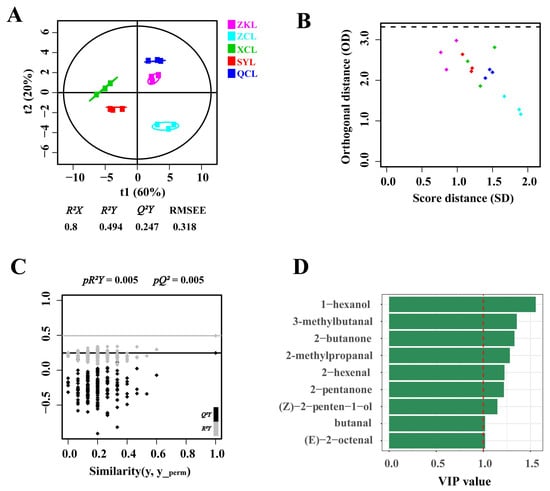
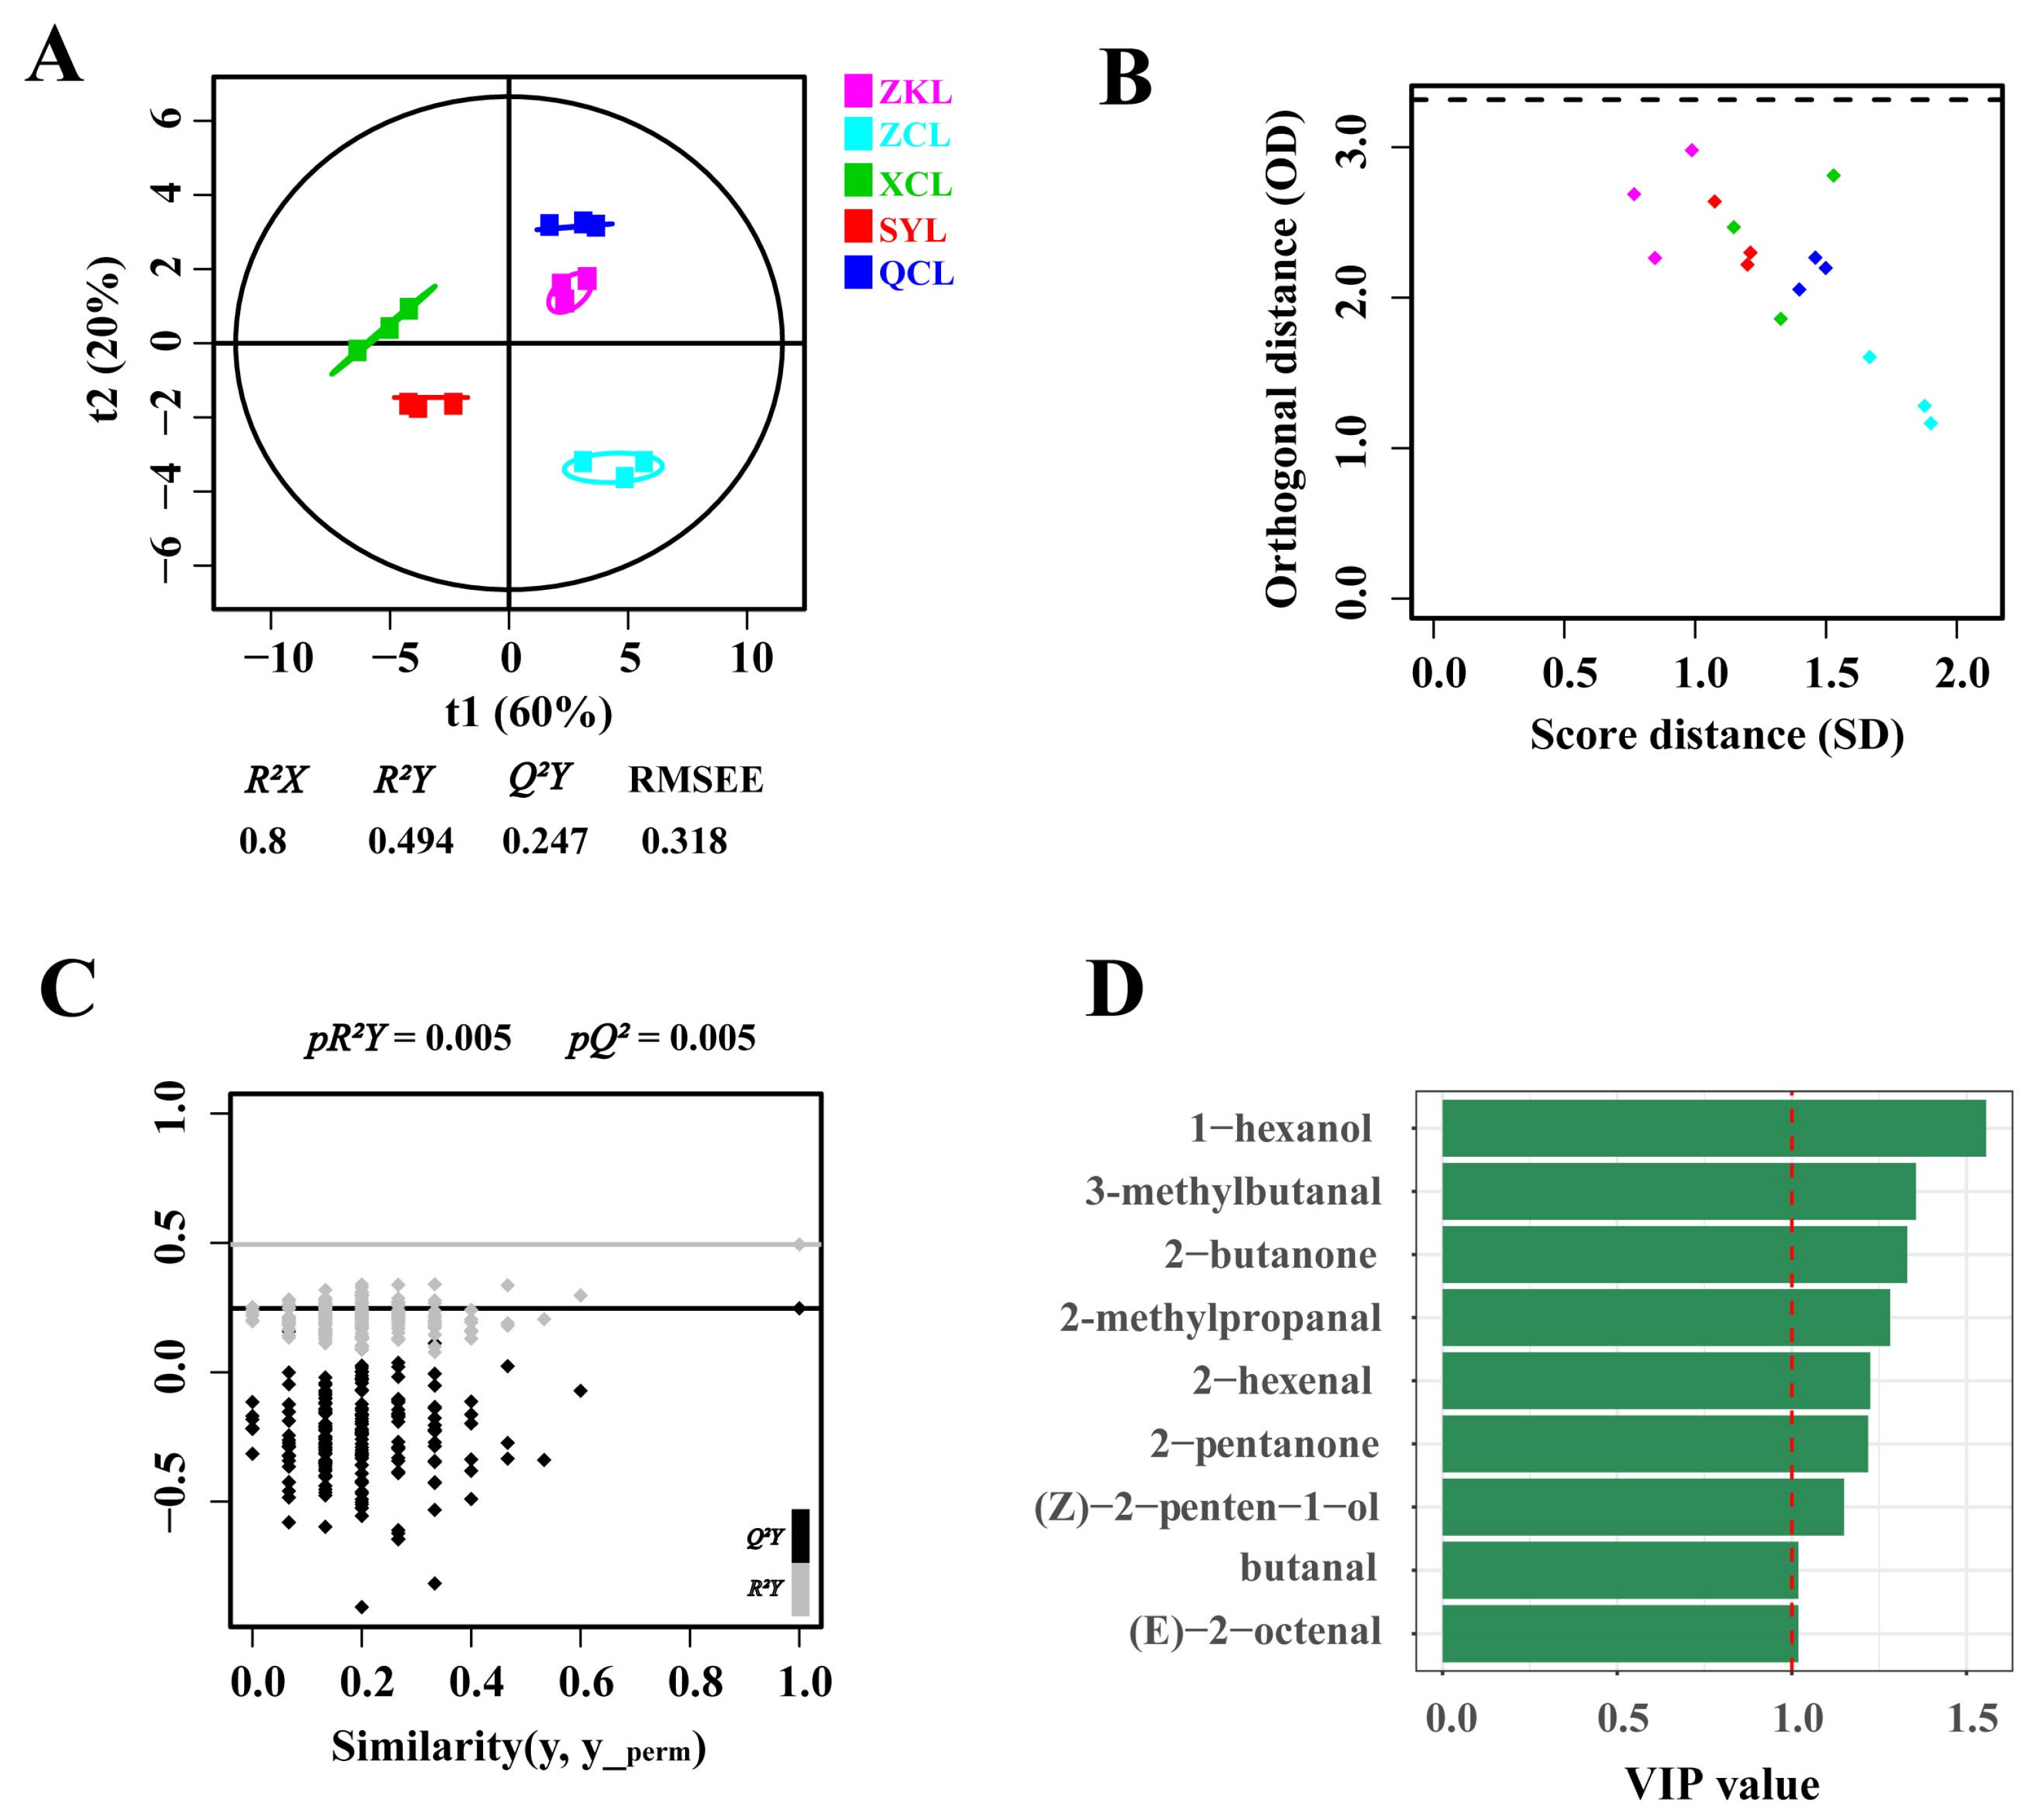
To more precisely identify characteristic discriminatory compounds among different rootstock treatments, a calibrated partial least squares–discriminant analysis (PLS-DA) model was constructed based on the 27 unique neutral parent compounds, in addition to the model built with the original 43 ion signals. As shown in Figure 6A, the first two latent variables (t1 and t2) of the calibrated model explained 60.0% and 20.0% of the total variance, respectively, with a cumulative explanatory power of 80.0%. The model fitting parameters were as follows: R2X = 0.800, R2Y = 0.494, and cross-validated predictive ability Q2 = 0.247, with two optimal latent variables extracted (Figure 6A). The Q2 value of 0.247 indicates limited predictive performance of the model. Together with the relatively small sample size, this model supports exploratory discrimination among rootstock groups but is not sufficiently robust for definitive rootstock identification.
Figure 6.
PLS-DA based on 27 unique parent volatile compounds. (A) PLS-DA score plot; (B) observation diagnostics plot; (C) permutation test plot (n = 200); (D) VIP score plot for the 27 parent compounds (the red dashed line indicates VIP = 1). Note: XCL, SYL, ZCL, ZKL, and QCL represent five different citrus rootstock treatment groups, respectively.
In the score plot (Figure 6A), samples were clearly separated by treatment, with no overlapping clusters. Samples from the own-rooted control (QCL) and P. trifoliata rootstock (ZKL) clustered closely in the upper-right quadrant, indicating a high degree of similarity in their volatile profiles. In contrast, the citrange rootstock (ZCL) formed a distinct and tight cluster in the lower-right quadrant. On the left side of the plot, C. junos (XCL) and C. grandis (SYL) occupied separate regions in the upper-left and lower-left quadrants, respectively, each exhibiting a unique volatile signature. These spatial distributions are consistent with the results of the fingerprint spectrum analysis.
The 200-permutation test showed that both pR2Y and pQ2 were 0.005, indicating no overfitting of the model (Figure 6C). The observation diagnostic plot showed that all samples were located below the threshold line, with no outliers detected (Figure 6B).
Variable importance in projection (VIP) was further applied to screen the 27 parent compounds (Figure 6D). A total of nine candidate differential compounds with VIP > 1 were identified from this exploratory analysis, namely 1-hexanol, 3-methylbutanal, 2-butanone, 2-methylpropanal, 2-hexenal, 2-pentanone, (Z)-2-penten-1-ol, butanal, and (E)-2-octenal. These candidate compounds may serve as potential characteristic markers for distinguishing leaves grafted onto different rootstocks. The comparative PLS-DA model based on the original 43 ion features, along with detailed parameters, is provided in Supplementary Figure S3 and Supplementary Table S1.
3.6. Comparative Analysis of Volatile Compounds Between Leaves and Pericarp
Leaf and pericarp samples were collected under identical field conditions on the same sampling date, following the procedures described in Section 2.1.1 (leaves) and our previous study [3] (pericarp). Both tissue types were analyzed using the same HS-GC-IMS headspace procedure (Section 2.3), ensuring that the observed volatile differences between the two tissues reflect genuine tissue-specific variation under comparable analytical conditions. To compare the volatile compositional differences between leaves and pericarp of Citrus medica ‘Guangdong Xiangshui’ grafted onto the same rootstocks, we qualitatively analyzed the leaf VOCs and compared them with the 22 parent volatile compounds (31 characteristic ion peak signals) previously tentatively identified in the pericarp by our group [3] (Supplementary Table S4). Aroma categories of the compounds were assigned based on the 16-note flavor wheel system described in Food Flavoring Technology [25], in conjunction with standard odor descriptors from the Flavornet (https://www.flavornet.org/) and The Good Scents Company (https://www.thegoodscentscompany.com) databases. Detailed aroma type classifications for each compound in leaves and pericarp are provided in Supplementary Tables S5 and S6, respectively.
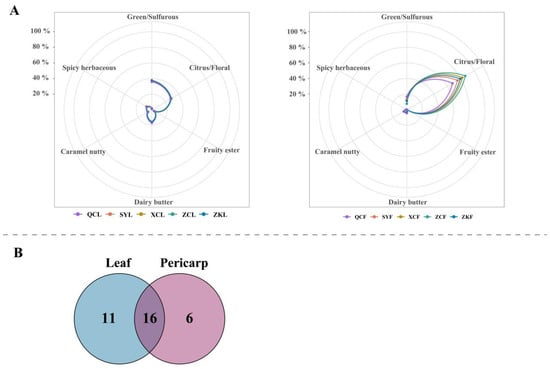
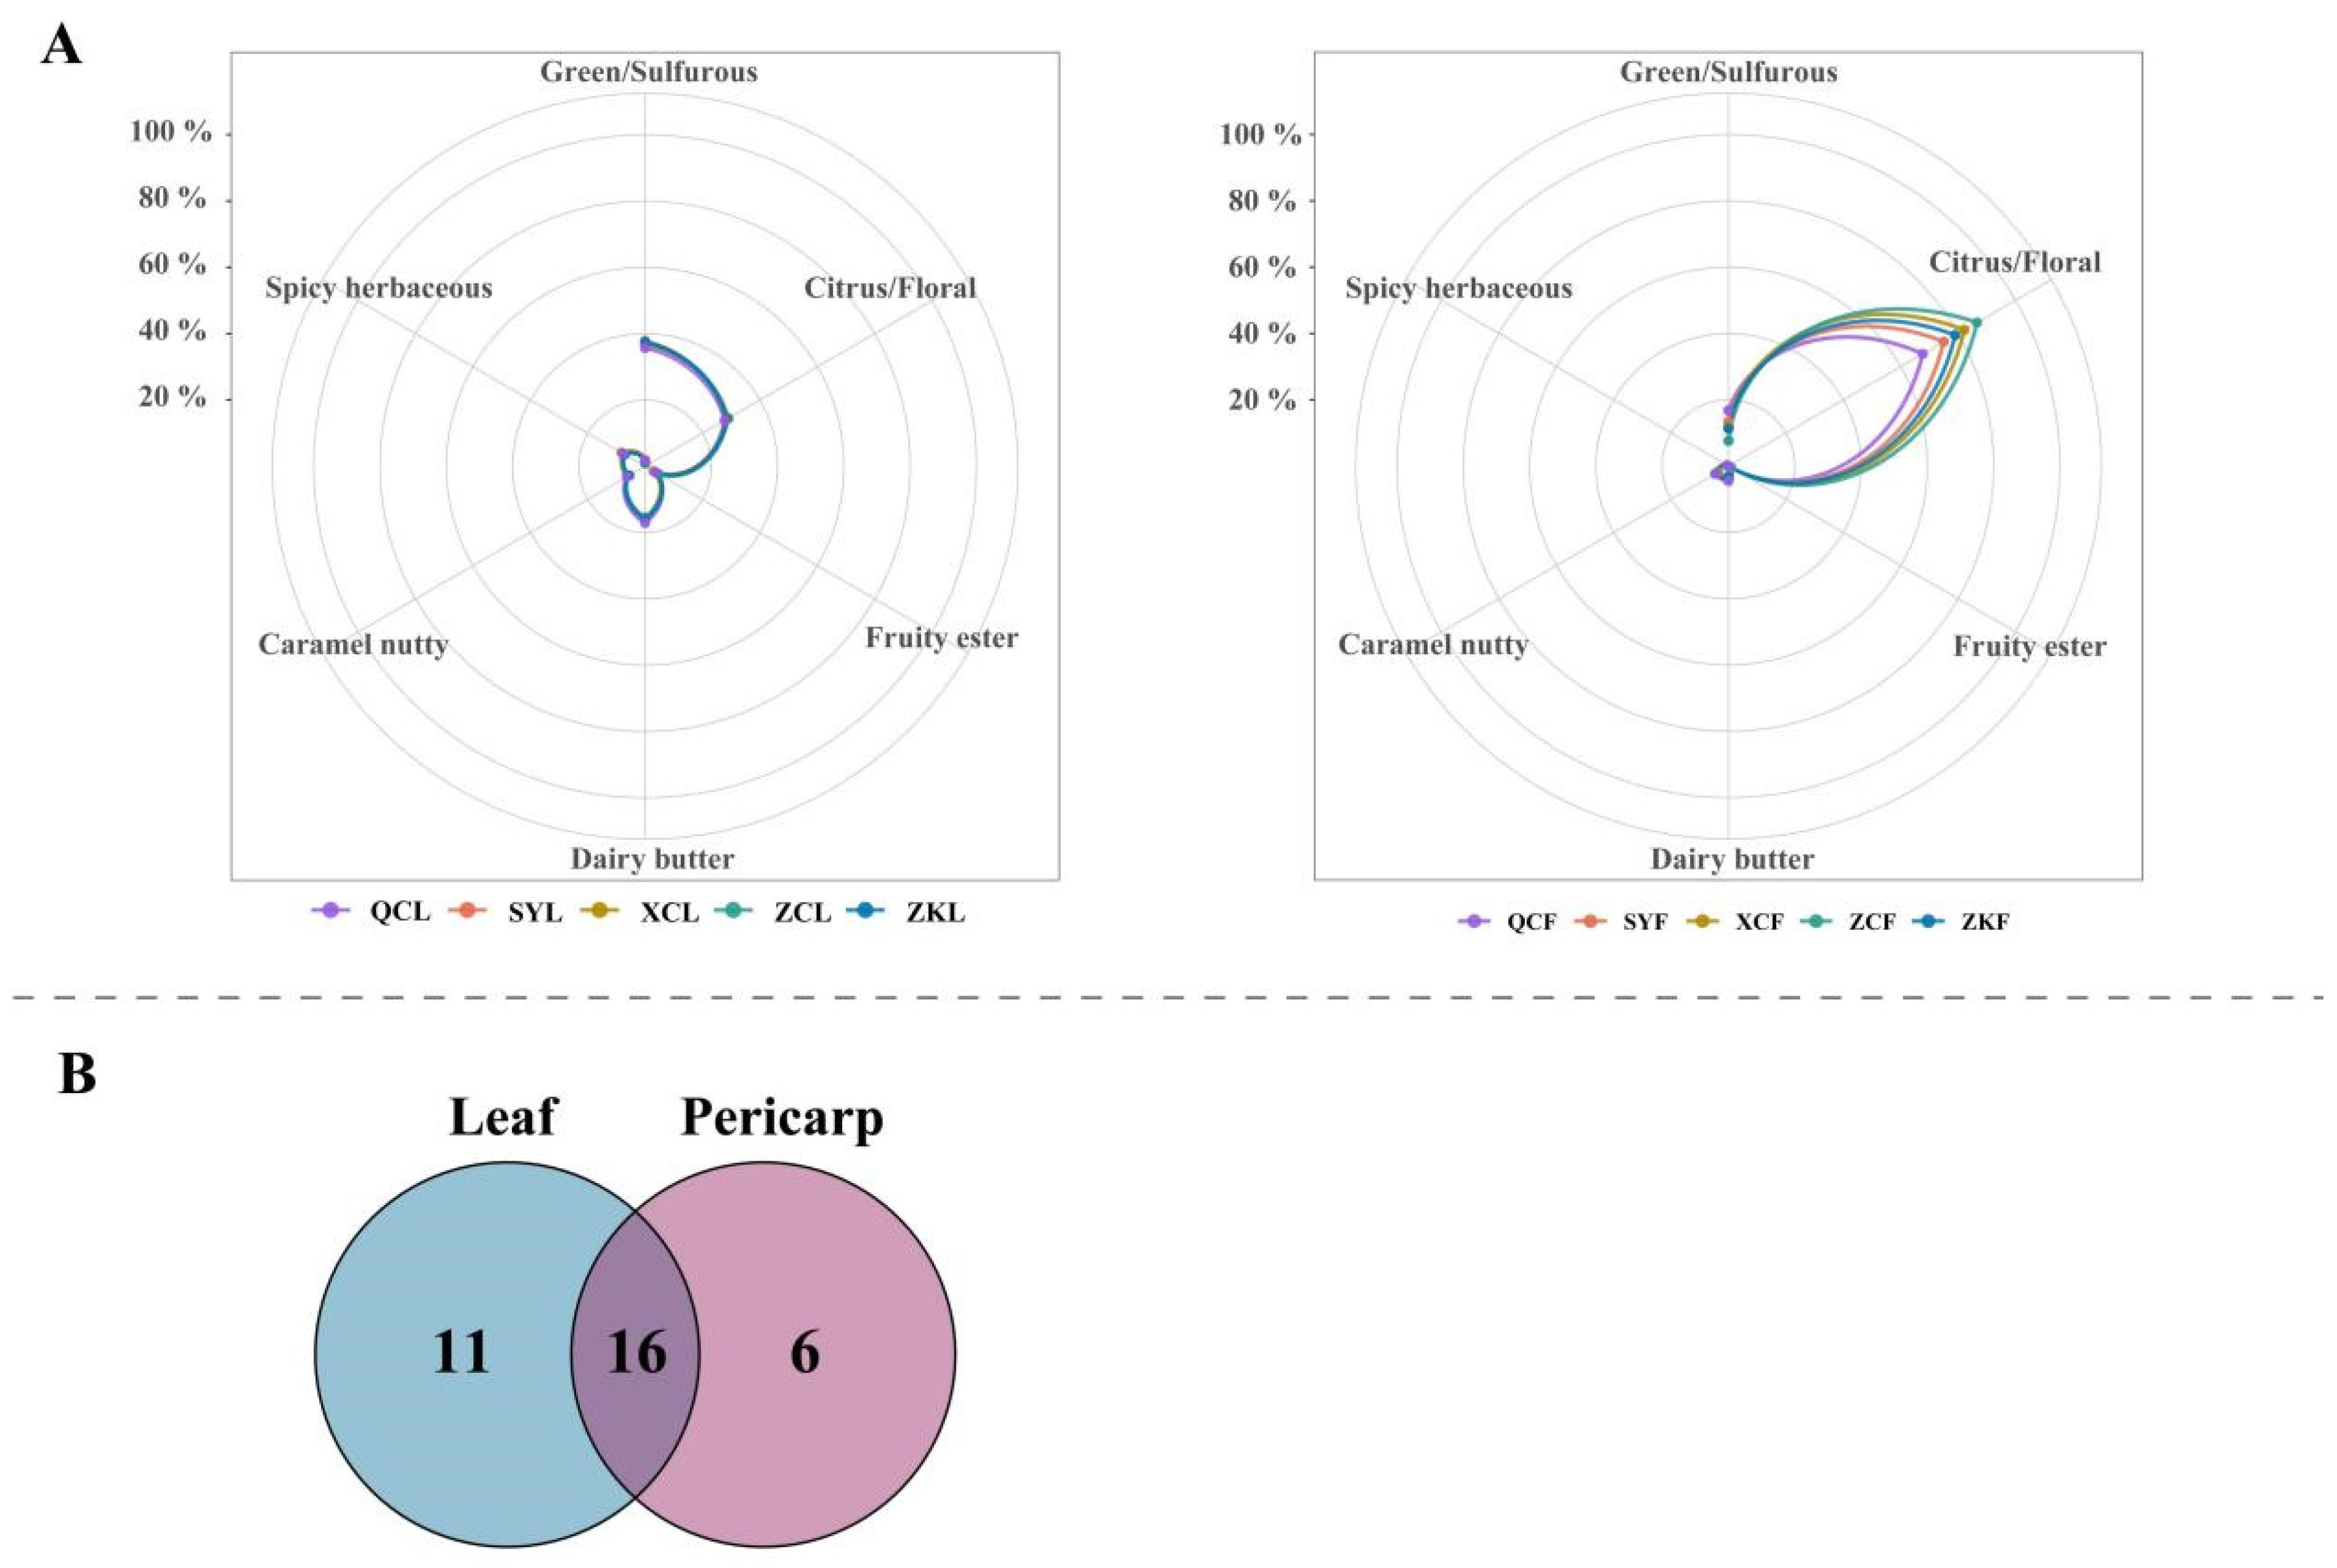
Figure 7A illustrates the relative proportions of compounds assigned to different aroma descriptor categories (hereinafter referred to as aroma-related chemical classes) in leaves and pericarp across different rootstock treatments. It should be noted that this radar plot represents a chemical classification based on aroma descriptors, rather than a direct representation of sensory aroma profiles. Distinct variations in volatile chemical profiles were observed between the two tissues. Leaves exhibited the highest relative abundance of compounds associated with green/grassy aroma descriptors (35.70–37.80%), followed by citrus/floral and dairy/butter-related substances. Compounds corresponding to the seven aroma descriptor categories were detected to varying degrees, and the overall volatile profiles of leaves were relatively consistent across rootstocks. In contrast, pericarp volatiles were characterized by the highest relative abundance of compounds classified under citrus/floral aroma descriptors (67.70–86.60%), with a substantial decrease in compounds associated with green-note descriptors. Fruity esters, spicy/herbaceous compounds, and sulfur-containing volatiles were rarely detected, resulting in a relatively concentrated chemical composition. Furthermore, rootstock effects on the relative abundance of these aroma-descriptor-associated chemical classes were more pronounced in pericarp than in leaves.
Figure 7.
Comparison of volatile compounds between leaves and pericarp of Citrus medica ‘Guangdong Xiangshui’ grafted onto different rootstocks. (A) Radar plots of aroma-related chemical classes in leaves and pericarp. (B) Venn diagram showing the numbers of shared and tissue-dataset-specific parent volatile compounds between leaves and pericarp (after consolidation of M, D, and T ion signals). Note: XCL, SYL, ZCL, ZKL, and QCL represent five different citrus rootstock treatment groups, respectively. This radar plot is a chemical classification map based on aroma descriptors derived from the Flavornet and The Good Scents Company databases. It does not represent the actual sensory aroma profile of the samples. The contribution of specific compounds to human sensory perception requires further validation through GC-O, odor activity value (OAV) analysis, or sensory evaluation.
Further comparative analysis, after consolidating M, D, and T ion signals into their corresponding parent compounds, revealed that 16 VOCs were shared between leaves and pericarp. Among them, 11 compounds were detected exclusively in leaves, and 6 were detected exclusively in pericarp (Figure 7B). The shared compounds, detailed in Supplementary Table S7, mainly included 2-hexenal, nonanal, 1-butanol, ethyl acetate, and (R/S)-linalool. These compounds were stably detected in both tissues and can be considered characteristic volatile components shared between the two organs of C. medica ‘Guangdong Xiangshui’.
The 11 compounds detected exclusively in leaves are summarized in Supplementary Table S8, including octanal, 1-hexanol, (E)-2-octenal, 3-methyl-2-butenal, 2,6-dimethyl-5-heptenal, dimethyl sulfide, hydroxyacetone, hexyl propanoate, among others. The six volatile compounds detected exclusively in pericarp are listed in Supplementary Table S9, namely heptanal, citral, methyl isovalerate, butyl acetate, pentanal, and acetone.
4. Discussion
4.1. Regulatory Effects of Rootstock or Propagation Method on Leaf Volatile Compounds
Grafting is a core agronomic practice in citrus production for regulating tree growth, stress tolerance, and secondary metabolite accumulation. The influence of rootstock genotype and propagation method on the accumulation of secondary metabolites in scion leaves represents an important research topic in fruit tree physiology and quality metabolism. Numerous studies have confirmed that rootstock genotype can shape the volatile composition of citrus scion leaves [15,26]. In the present study, using HS-GC-IMS combined with multivariate chemometrics, 27 unique neutral parent volatile compounds (corresponding to 43 effective ion signals) were tentatively identified, predominantly comprising esters, aldehydes, alcohols, ketones, and sulfur-containing compounds, which are also commonly reported volatile components in citrus leaves [4,27]. Notably, the subsamples from a pooled composite sample within each treatment group exhibited good stability and prominent inter-group specificity, consistent with previous findings in citrus and other fruit tree species [12,15,28].
To further screen for candidate characteristic compounds that distinguish different rootstocks, a PLS-DA discriminant model was constructed based on the 27 parent compounds. Using a VIP threshold greater than 1, a total of nine candidate differential characteristic compounds were identified: 1-hexanol, 3-methylbutanal, 2-butanone, 2-methylpropanal, 2-hexenal, 2-pentanone, (Z)-2-penten-1-ol, butanal, and (E)-2-octenal. It should be noted that the present study included only three subsamples derived from a single pooled composite sample per treatment group, resulting in a limited sample size. Although the model passed permutation testing and CV-ANOVA statistical validation, the generalizability of these candidate characteristic compounds requires further verification with larger independent sample sets in future studies, and they should not be regarded as definitive biomarkers at this stage [18,19].
These representative differential compounds mainly belong to aldehydes and alcohols. From a biosynthetic perspective, their formation is closely linked to the degradation of unsaturated fatty acids and the catabolism of amino acids in leaves. In the fatty acid degradation pathway, polyunsaturated fatty acids are first oxidized by lipoxygenase (LOX) and subsequently cleaved by hydroperoxide lyase (HPL) to yield C6 or C9 straight-chain aldehydes. These aldehydes can either serve directly as volatile components, be further reduced to the corresponding alcohols by alcohol dehydrogenase (ADH), or undergo esterification to form esters [29]. In addition to fatty acids, amino acids and carotenoids also serve as important precursors for volatile compounds. Amino acids can directly generate aroma-active compounds or participate in their synthesis via the Maillard reaction, while carotenoids, along with unsaturated fatty acids, can produce volatiles through enzymatic oxidation [30,31]. Therefore, we speculate that rootstocks may influence the relative balance of the LOX/HPL/ADH enzyme systems, thereby altering the production ratio of aldehydes and alcohols and ultimately generating rootstock-specific volatile profiles. However, as this inference is based solely on metabolite profiling, and enzyme activities, gene expression levels, or precursor contents were not measured in the present study, this hypothesis requires verification through further biochemical and molecular experiments [32,33].
It is also noteworthy that the physiological state of the plants themselves is a key variable determining metabolic flux. The differences between own-rooted and grafted plants cannot be attributed solely to rootstock genotype. Own-rooted plants, propagated by cuttings, lack a graft union, and their phenotypic variations result from the interaction of multiple factors, including genotypic background, propagation mode, and rootstock–scion interactions. Previous studies have demonstrated that propagation type can significantly alter plant water uptake, stomatal characteristics, photosynthetic performance, and the accumulation of osmolytes and antioxidant enzymes under abiotic stress [34,35]. Differences in root morphology and nutrient transport can further modify leaf physiological status, indirectly influencing secondary metabolic flux and thereby contributing to the divergence of volatile profiles among different rootstocks or propagation methods.
Previous literature has reported that 1-propanol, 1-butanol, 1-hexanol, and (Z)-2-penten-1-ol are often associated with vinous, fruity, and herbaceous aroma notes [36,37]; 3-hydroxy-2-butanone (acetoin) can exhibit creamy aroma characteristics [38,39]. C6–C9 straight-chain aldehydes possess fresh green and citrusy notes, along with certain antimicrobial and off-odor masking potentials [40,41,42,43]. Linalool is associated with floral characteristics; however, this compound is prone to autoxidation upon exposure to air, potentially generating allergenic derivatives [44,45,46,47,48]. Compounds such as 3-methylbutanal, 2-methylpropanal, ethyl acetate, and acetoin are generally associated with malty, fermented, fruity, and creamy aromas [49,50,51,52,53]; 2-methyl-1-propanol is often linked to grassy and vinous aroma notes [38,54,55,56]. It must be emphasized that the aroma attributes and potential biological activities of the above-mentioned compounds are derived from existing literature. The present study only detected and compared their normalized peak volumes, which cannot be directly equated with the actual sensory performance or in vivo functional activity of the samples. Furthermore, the reported antimicrobial and off-odor masking potentials are based on studies of pure compounds in the literature. This study only detected chemical signals and did not conduct relevant bioactivity validation.
4.2. Differences in Volatile Compounds Between Leaves and Pericarp
Both leaves and pericarp of the fragrant lemon (Citrus medica ‘Guangdong Xiangshui’) are important organs rich in secondary metabolites, significantly influencing the flavor quality of their processed products. Leaves are not only the primary site of photosynthesis and secondary metabolism but also contribute volatile compounds essential to the flavor of numerous processed products [57], whereas the pericarp serves as a key raw material for the natural flavor industry [3]. From a metabolic perspective, leaf volatiles are predominantly dominated by green-leaf aldehydes and alcohols generated via the LOX pathway, which aligns with the active fatty acid metabolism and defense-related physiological functions of leaves. In contrast, due to the highly developed oil gland structures in the pericarp, the terpenoid biosynthesis pathway mediated by terpene synthase (TPS) is dominant. This tissue-specific divergence is consistent with previous findings [4,57,58]. It should be noted that a compound detected exclusively in one tissue dataset only reflects the results under the current instrumental conditions, detection limits, and matrix effects, and does not prove that the compound is biosynthesized exclusively in that particular tissue. Furthermore, the relative signal intensities derived from normalized peak volumes in this study reflect differences in chemical abundance and cannot be directly equated with their actual contributions to sensory aroma. Aroma perception is ultimately determined by the odor thresholds of individual compounds and their synergistic and antagonistic effects. Future studies combining odor activity value (OAV) and sensory evaluation are required to precisely identify the key aroma-active compounds in the two tissues.
The regulatory effects of rootstocks on volatile compounds also differ significantly between the two organs. In leaves grafted onto C. junos (XCL) rootstock, the relative signal intensities of esters and enals such as hexyl propanoate, (E)-2-octenal, and 3-methyl-2-butenal were higher. Previous literature has reported that feeding stress from Diaphorina citri can induce increased levels of aldehydes, terpenes, and alcohols in citrus leaves, demonstrating the involvement of leaf volatiles in plant defense against biotic stress [59]. However, since the present study did not conduct insect or pathogen inoculation bioassays, the association between the accumulation of these compounds and stress resistance remains purely speculative. Rhodinol was detected in own-rooted leaves, and C6 aldehydes showed higher relative abundance in pericarp, indicating metabolic divergence between different organs under the same genotype. Rhodinol was detected exclusively in the pericarp of C. grandis (SYL) rootstock, making it a candidate compound for pericarp-based flavor development. Higher accumulation levels of citral and heptanal were observed in the pericarp of P. trifoliata (ZKL) rootstock, with citral being an important raw material for the flavor industry [60]. No dataset-specific parent compounds were tentatively identified in citrange (ZCL) leaves or C. junos (XCL) pericarp, suggesting that the metabolic regulation in these two materials may be relatively conserved, potentially related to their hybrid genetic backgrounds or tissue developmental stages. Overall, plant volatile compounds can be classified into four major categories—terpenoids, phenylpropanoids/benzenoids, fatty acid derivatives, and amino acid derivatives—and can be synthesized in multiple organs, including leaves and pericarp [61]. The compositional differences observed in this study essentially reflect the tissue-specific activation of secondary metabolic pathways in different organs.
4.3. Limitations and Future Prospects
This study established an exploratory chemometric discrimination approach based on HS-GC-IMS volatile fingerprints, combined with PCA, hierarchical cluster analysis, and PLS-DA discriminant models, providing a foundational data reference for rootstock screening and leaf aroma resource exploitation in Citrus medica ‘Guangdong Xiangshui’.
The characteristic chemical profiles associated with different rootstocks provide preliminary clues for germplasm utilization. Based on the aroma descriptors of individual compounds reported in the literature and flavor databases, the chemical profiles of C. junos (XCL) and C. grandis (SYL) rootstocks could be preliminarily associated with fresh green and floral notes; the citrange (ZCL) rootstock profile aligns with compounds typically described as having malty, fermented, and savory-related odor attributes; while P. trifoliata (ZKL) rootstock and own-rooted plants are enriched in compounds associated with grassy and vinous aroma notes. However, these are only chemical-level associations inferred from reported odor properties of pure compounds, not validated by direct sensory evaluation. The present study did not conduct GC-O analysis, odor activity value calculation, sensory evaluation, absolute quantification, extraction process optimization, or bioactivity assays; therefore, no conclusion can be drawn regarding the actual sensory performance or industrial application value of any specific material. Practical application potential must be validated through systematic follow-up experiments including sensory evaluation.
Several limitations of this study should be clearly acknowledged. First, regarding sensory interpretation, the radar plots based on database-derived aroma descriptors serve only as chemical classification tools and cannot be equated with the actual sensory aroma profiles of the samples. True sensory perception is determined by odor thresholds, as well as synergistic and antagonistic effects among compounds, and requires further validation through gas chromatography–olfactometry (GC–O), OAV, or sensory evaluation [7,9]. Second, only three subsamples from a pooled composite sample were included per treatment in this study, resulting in a relatively small sample size. Although the PLS-DA model passed permutation testing and CV-ANOVA validation with statistically significant results, its generalizability still needs to be verified with a larger independent sample set. The screened candidate compounds can therefore only be referred to as candidate differential characteristic compounds and should not be directly considered biomarkers [18,19].
Third, samples were injected sequentially by treatment group instead of full randomization. This non-randomized analytical run order creates a potential risk of confounding treatment-related differences with time-dependent instrumental drift or carry-over effects. This represents a methodological limitation, and inter-group comparison results should be interpreted with this caveat in mind.
Fourth, the proposed regulatory mechanisms involving the LOX/HPL/ADH pathways are hypotheses inferred from metabolic phenotypes, lacking direct evidence at the transcriptional or enzymatic level [32,33]. Future studies should expand the sample size and integrate absolute quantification using authentic standards, GC–O, sensory evaluation, as well as transcriptomics and biochemical assays, to provide more comprehensive scientific evidence for the regulatory mechanisms by which rootstocks influence the flavor quality of the scion.
5. Conclusions
In this study, we characterized the volatile profiles of Citrus medica ‘Guangdong Xiangshui’ leaves from plants grafted onto different rootstocks and from own-rooted controls using headspace gas chromatography–ion mobility spectrometry (HS-GC-IMS). A total of 43 ion signals were detected, corresponding to 27 parent compounds, predominantly comprising aldehydes, alcohols, ketones, esters, and sulfur-containing compounds. Rootstock genotype or propagation method significantly shaped the leaf volatile fingerprints, and nine candidate differential compounds (VIP > 1) were identified. Nevertheless, further validation with larger sample sets is required before these compounds can be considered reliable biomarkers.
Under a unified analytical workflow, leaf and pericarp tissues exhibited pronounced organ-specific divergence: leaves accumulated green-leaf aldehydes and alcohols, consistent with lipoxygenase (LOX) pathway activity, whereas pericarp was enriched in terpenoids, consistent with terpene synthase (TPS) pathway dominance. Compounds detected exclusively in one tissue do not necessarily indicate tissue-specific biosynthesis, as this may reflect limitations in detection sensitivity or matrix effects under the current analytical conditions. The proposed pathway-mediated regulatory mechanisms remain hypothetical and require further verification through biochemical and molecular approaches.
Overall, this workflow provides a methodological reference for exploratory chemometric discrimination of citrus rootstocks based on leaf volatile fingerprints and offers foundational data for the utilization of leaf aroma resources. Future studies should integrate absolute quantification, gas chromatography–olfactometry (GC–O), odor activity value (OAV) analysis, sensory evaluation, and multi-omics approaches to validate the underlying molecular mechanisms and to assess the practical application potential of these findings.
Supplementary Materials
The following supporting information can be downloaded at: https://www.mdpi.com/article/10.3390/horticulturae12091165/s1, Supplementary Figure S1: Experimental flowchart showing field sampling, sample preparation, HS-GC-IMS analysis, and data pretreatment. Supplementary Figure S2: Normal Q-Q plots of four representative volatile compounds for verification of ANOVA normality assumption. Supplementary Figure S3: PLS-DA based on the original 43 ion peak signals (including M, D, and T forms) without consolidation of homologous ions. (A) Score plot; (B) Observation diagnostics plot; (C) Permutation test plot (n = 200); (D) VIP score plot. Supplementary Table S1: Comparison of PLS-DA parameters between the original 43-ion feature model and the calibrated 27-parent compound model. Supplementary Table S2: Full signal intensity matrix of all 44 detected ion peaks (including 43 tentatively identified and 1 unidentified signal) across 15 subsamples (5 treatments × 3 subsamples per treatment, derived from pooled composite samples). Supplementary Table S3: Volatile ion peak signals detected by GC-IMS in leaves (43 tentatively identified ion signals and 1 unidentified signal), with retention indices, retention times, and drift times. Supplementary Table S4: Volatile ion peak signals detected by GC-IMS in pericarp (31 tentatively identified ion signals corresponding to 22 unique parent compounds), with retention indices, retention times, and drift times. Supplementary Table S5: Aroma type classification of the 27 parent volatile compounds tentatively identified in leaves of Citrus medica ‘Guangdong Xiangshui’ grafted onto different rootstocks. Supplementary Table S6: Aroma type classification of the 22 parent volatile compounds tentatively identified in pericarp of Citrus medica ‘Guangdong Xiangshui’ grafted onto different rootstocks. Supplementary Table S7: Distribution of the 16 parent compounds shared between leaves and pericarp across different rootstock categories. Supplementary Table S8: The 11 parent compounds detected exclusively in leaves (not detected in pericarp) across different rootstock categories. Supplementary Table S9: The 6 parent compounds detected exclusively in pericarp (not detected in leaves) across different rootstock categories.
Author Contributions
G.M.: Data curation, Formal analysis, Investigation, Writing—original draft, Writing—review & editing, Visualization. D.Q.: Formal analysis, Writing—review & editing. W.C.: Formal analysis, Writing—review & editing. J.Z.: Project administration, Supervision, Writing—review & editing, Funding acquisition (Corresponding Author). All authors have read and agreed to the published version of the manuscript.
Funding
This research was supported by the Guangdong Provincial Key Research and Development Program (No. 2022B0202070002); the Guangdong Provincial Special Fund for Modern Agriculture Industry Technology Innovation Teams (No. 2024CXTD10); the Seed Industry Revitalization Program of Guangdong Province (2024-NYP-00-029); and the National Modern Agricultural (Citrus) Technology Systems of China (No. CARS-26).
Data Availability Statement
The raw data supporting the conclusions of this article will be made available by the authors on request.
Conflicts of Interest
The authors declare no conflicts of interest.
References
- Li, X.; Cai, Z.; Gao, J.; Chen, J.; Liu, Y.; Xu, J. Analysis of volatile compound differences in Guangdong Xiangshui lemon (Citrus medica) from different harvest seasons in Weishan, Yunnan. Acta Hortic. Sin. 2025, 52, 2439–2452. [Google Scholar]
- Zhang, S.; Zhang, X.; Wu, D.; Kang, J.; Chen, X.; Geng, L.; Yin, G.; Chen, J.; Gao, J.; Cai, Z.; et al. Analysis of aroma quality in ‘Guangdong Xiangshui’ lemon based on molecular sensory technology. Sci. Agric. Sin. 2025, 58, 141–158. [Google Scholar]
- Mao, G.; Qiu, D.; Chen, W.; Wu, P.; Zeng, J. Rootstock selection regulates flavor quality in the scion of Citrus medica ‘Guangdong Xiangshui’: Insights from LC-MS and GC-IMS metabolomic analyses. Sci. Hortic. 2026, 357, 114656. [Google Scholar] [CrossRef] [Scilit]
- Lota, M.L.; de Rocca Serra, D.; Tomi, F.; Jacquemond, C.; Casanova, J. Volatile components of peel and leaf oils of lemon and lime species. J. Agric. Food Chem. 2002, 50, 796–805. [Google Scholar] [CrossRef] [Scilit] [PubMed]
- Petretto, G.L.; Vacca, G.; Addis, R.; Pietro, M.A.D.; Pintore, G.; Tilocca, M.G.; Chessa, M. Waste Citrus limon leaves as source of essential oil rich in limonene and citral: Chemical characterization, antimicrobial and antioxidant properties, and effects on cancer cell viability. Antioxidants 2023, 12, 1238. [Google Scholar] [CrossRef] [Scilit] [PubMed]
- Yunnan Academy of Agricultural Sciences; Institute of Tropical and Subtropical Economic Crops. A Pure Natural Perfume Lemon Hotpot Spice and Its Preparation Method. CN Patent No. CN117426494A, 23 January 2024. [Google Scholar]
- Van Ruth, S.M. Methods for gas chromatography-olfactometry: A review. Biomol. Eng. 2001, 17, 121–128. [Google Scholar] [CrossRef] [Scilit] [PubMed]
- Zhang, H.; Xie, Y.; Liu, C.; Chen, S.; Hu, S.; Xie, Z.; Deng, X.; Xu, J. Comprehensive comparative analysis of volatile compounds in citrus fruits of different species. Food Chem. 2017, 230, 316–326. [Google Scholar] [CrossRef] [Scilit] [PubMed]
- Lan-Phi, N.T.; Shimamura, T.; Ukeda, H.; Sawamura, M. Chemical and aroma profiles of yuzu (Citrus junos) peel oils of different cultivars. Food Chem. 2009, 115, 1042–1047. [Google Scholar] [CrossRef] [Scilit]
- Yang, J.; Xiong, W.; Zhang, Y.; Wu, J.; Li, M.; Yang, X.; Yi, S.; Zhou, L. Effects of different fertilization formulas on yield and quality of young Weishan perfume lemon trees. Zhejiang Citrus 2025, 42, 14–19. [Google Scholar]
- Yang, H.; Peng, Z.; Peng, L.; Yuan, M.; Chun, C.; Yuan, G. Effects of different rootstocks on growth and physiological indicators of Newhall navel orange grafted seedlings. J. Jiangxi Agric. Univ. 2023, 45, 575–583. [Google Scholar]
- Zhou, T.; Xiang, X.; Chen, P.; Han, J.; Su, F.; Liao, W.; Guo, L.; Xu, Y.; Wu, J.; Li, F. Effects of trifoliate orange and sour pummelo rootstocks on tree growth, development, and fruit quality formation of ‘Chunxiang’ citrus. J. Huazhong Agric. Univ. 2026, 45, 1–10. [Google Scholar]
- Oustric, J.; Morillon, R.; Luro, F.; Herbette, S.; Lourkisti, R.; Giannettini, J.; Santini, J. Tetraploid Carrizo citrange rootstock (Citrus sinensis Osb. × Poncirus trifoliata L. Raf.) enhances natural chilling stress tolerance of common clementine (Citrus clementina Hort. ex Tan). J. Plant Physiol. 2017, 214, 108–115. [Google Scholar] [CrossRef] [Scilit] [PubMed]
- Liu, Z. Exploration and thinking on the development of perfume lemon industry in dry-hot valley areas of Yunnan Province. China Fruit News 2025, 42, 21–23. [Google Scholar]
- Babazadeh-Darjazi, B. The effects of rootstock on the volatile flavour components of page mandarin flower and leaf. Afr. J. Agric. Res. 2011, 6, 1884–1896. [Google Scholar]
- Cao, L.; Gao, C.; Dai, F.; Luo, Z.; Wang, H.; Li, J.; Chen, J.; Luo, H. Analysis of aroma differences between peel and pulp of Guangdong perfume lemon based on electronic nose and HS-SPME-GC-MS. Food Ferment. Ind. 2026, 52, 367–376. [Google Scholar]
- Wang, S.; Chen, H.; Sun, B. Recent progress in food flavor analysis using gas chromatography-ion mobility spectrometry (GC-IMS). Food Chem. 2020, 315, 126158. [Google Scholar] [CrossRef] [Scilit] [PubMed]
- Li, J.; Xu, Y.; Du, W.; Jin, L.; Ren, P.; Ren, F.; Xie, J. Comparative analysis of aroma compounds in Chinese traditional dry-rendered fat by HS/GC-IMS, SPME/GC-MS, and SPME/GC-O. J. Food Compos. Anal. 2022, 107, 104378. [Google Scholar] [CrossRef] [Scilit]
- Yao, W.; Cai, Y.; Liu, D.; Chen, Y.; Li, J.; Zhang, M.; Zhang, H. Analysis of flavor formation during production of Dezhou braised chicken using headspace-gas chromatography-ion mobility spectrometry (HS-GC-IMS). Food Chem. 2022, 370, 130989. [Google Scholar] [CrossRef] [Scilit] [PubMed]
- Yang, Y.; Wang, B.; Fu, Y.; Shi, Y.; Chen, F.; Guan, H.; Zhang, N. HS-GC-IMS with PCA to analyze volatile flavor compounds across different production stages of fermented soybean whey tofu. Food Chem. 2021, 346, 128880. [Google Scholar] [CrossRef] [Scilit] [PubMed]
- Gu, S.; Zhang, J.; Wang, J.; Wang, X.; Du, D. Recent development of HS-GC-IMS technology in rapid and non-destructive detection of quality and contamination in agri-food products. TrAC Trends Anal. Chem. 2021, 144, 116435. [Google Scholar] [CrossRef] [Scilit]
- Meng, X.; Huang, Z.; Fan, C.; Xiang, X. Quality analysis and characterization of volatile flavor compounds in golden passion fruit during postharvest storage. Storage Process 2020, 20, 175–183. [Google Scholar]
- Huang, B.; Wang, G.; Chu, Z.; Qin, L. Effect of oven drying, microwave drying, and silica gel drying methods on the volatile components of ginger (Zingiber officinale Roscoe) by HS-SPME-GC-MS. Dry. Technol. 2012, 30, 248–255. [Google Scholar] [CrossRef] [Scilit]
- Lehner, T.; Siegmund, B. The impact of ventilation during postharvest ripening on the development of flavour compounds and sensory quality of mangoes (Mangifera indica L.) cv. Kent. Food Chem. 2020, 320, 126608. [Google Scholar] [CrossRef] [Scilit] [PubMed]
- Sun, B.; Chen, H. Food Flavoring Technology; Chemical Industry Press: Beijing, China, 2017. [Google Scholar]
- Ziogas, V.; Panou, E.; Graikou, K.; Ganos, C.; Ntamposi, E.; Chinou, I. Revealing the influence of rootstock choice on clementine mandarin leaves and peel volatile profile. Horticulturae 2025, 11, 523. [Google Scholar] [CrossRef] [Scilit]
- He, C.; Ran, Y.; Zeng, L.; Zhang, X.; Zhang, Y.; Wang, C. Analysis of aroma components from peels of different lemon varieties by GC-MS. Food Sci. 2013, 34, 175–179. [Google Scholar]
- Aguilar-Hernández, M.; Sánchez-Bravo, P.; Hernández, F.; Carbonell-Barrachina, Á.; Pastor-Pérez, J.; Legua, P. Determination of the volatile profile of lemon peel oils as affected by rootstock. Foods 2020, 9, 241. [Google Scholar] [CrossRef] [Scilit] [PubMed]
- Vincenti, S.; Mariani, M.; Alberti, J.; Jacopini, S.; Brunini-Bronzini de Caraffa, V.; Berti, L.; Maury, J. Biocatalytic synthesis of natural green leaf volatiles using the lipoxygenase metabolic pathway. Catalysts 2019, 9, 873. [Google Scholar] [CrossRef] [Scilit]
- Duan, L.; Guo, L.; Dou, L.; Zhou, C.; Xu, F.; Zheng, G.; Liu, E. Discrimination of Citrus reticulata Blanco and Citrus reticulata ‘Chachi’ by gas chromatograph-mass spectrometry-based metabolomics approach. Food Chem. 2016, 212, 123–127. [Google Scholar] [CrossRef] [Scilit] [PubMed]
- Liu, H.; An, K.; Su, S.; Yu, Y.; Wu, J.; Xiao, G.; Xu, Y. Aromatic characterization of mangoes (Mangifera indica L.) using solid phase extraction coupled with gas chromatography-mass spectrometry and olfactometry and sensory analyses. Foods 2020, 9, 75. [Google Scholar] [CrossRef] [Scilit] [PubMed]
- Ayseli, M.; Ayseli, Y. Flavors of the future: Health benefits of flavor precursors and volatile compounds in plant foods. Trends Food Sci. Technol. 2016, 48, 69–77. [Google Scholar] [CrossRef] [Scilit]
- Schwab, W.; Davidovich-Rikanati, R.; Lewinsohn, E. Biosynthesis of plant-derived flavor compounds. Plant J. 2008, 54, 712–732. [Google Scholar] [CrossRef] [Scilit] [PubMed]
- Ait Hammou, R.; Harrouni, C.; Ben El Caid, M.; Hallouti, A.; Baroud, S.; Daoud, S. Establishment of argan tree plantlets (Argania spinosa (L.) Skeels) grown from generative and vegetative propagation under different watering regimes at the nursery stage. Biocatal. Agric. Biotechnol. 2022, 44, 102457. [Google Scholar] [CrossRef] [Scilit]
- Ait Hammou, R.; Ben El Caid, M.; Harrouni, C.; Daoud, S. Germination enhancement, antioxidant enzyme activity, and metabolite changes in late Argania spinosa kernels under salinity. J. Arid. Environ. 2023, 219, 105095. [Google Scholar] [CrossRef] [Scilit]
- Burdock, G. Fenaroli’s Handbook of Flavor Ingredients; CRC Press: Boca Raton, FL, USA, 2016. [Google Scholar]
- Rowshan, V.; Najafian, S. Headspace analyses of leaf and flower of Citrus limetta (Lemon), Citrus maxima (Pomelo), Citrus sinensis (Orange), and Citrus medica (Cedrum) for volatile compounds by CombiPAL system technique. J. Herbs Spices Med. Plants 2013, 19, 418–425. [Google Scholar] [CrossRef] [Scilit]
- Berger, R.G. (Ed.) Flavours and Fragrances: Chemistry, Bioprocessing and Sustainability; Springer Science & Business Media: Berlin, Germany, 2007. [Google Scholar]
- Wang, H.; Su, Z.; Deng, P.; Chen, L.; Yang, M.; Xu, X. Characterization of volatile organic compounds and aroma of eight bamboo species leaves. Horticulturae 2024, 10, 394. [Google Scholar] [CrossRef] [Scilit]
- Li, L.; Jiang, J.; Hu, J.; Shi, Y.; Huang, P.; Ding, D. Screening of key aroma compounds in peel essential oils from different citrus varieties. Sci. Technol. Food Ind. 2023, 44, 259–269. [Google Scholar]
- Li, K.; Wang, J.; Li, Y.; Li, Q. Analysis of characteristic aroma of red pitaya wine. Food Ferment. Ind. 2019, 45, 217–223. [Google Scholar]
- Beristain-Bauza, S.; Hernández-Carranza, P.; Cid-Pérez, T.; Ávila-Sosa, R.; Ruiz-López, I. Antimicrobial activity of ginger (Zingiber officinale) and its application in food products. Food Rev. Int. 2019, 35, 407–426. [Google Scholar] [CrossRef] [Scilit]
- Wu, T.; Wang, M.; Wang, P.; Tian, H.; Zhan, P. Advances in the formation and control methods of undesirable flavors in fish. Foods 2022, 11, 2504. [Google Scholar] [CrossRef] [Scilit] [PubMed]
- Choi, H.; Sawamura, M.; Kondo, Y. Characterization of the key aroma compounds of Citrus flaviculpus Hort. ex Tanaka by aroma extraction dilution analysis. J. Food Sci. 2002, 67, 1713–1718. [Google Scholar] [CrossRef] [Scilit]
- Ren, F.; Li, Y.; Chen, W.; Chen, W.; Chen, H.; Zhang, M. Antimicrobial mechanism of linalool against Vibrio parahaemolyticus and its application in black tiger shrimp (Penaeus monodon). Food Biosci. 2024, 60, 104283. [Google Scholar] [CrossRef] [Scilit]
- Ren, F.; Zhu, M.; Zhao, Z.; Chen, W.; He, R.; Chen, H.; Chen, W. Combined bactericidal effect of linalool and pulsed light on Vibrio parahaemolyticus and its application to black tiger prawns. Food Res. Int. 2025, 213, 116556. [Google Scholar] [CrossRef] [Scilit] [PubMed]
- Kamatou, G.; Viljoen, A. Linalool—A review of a biologically active compound of commercial importance. Nat. Prod. Commun. 2008, 3, 1183–1192. [Google Scholar] [CrossRef] [Scilit]
- Sköld, M.; Börje, A.; Matura, M.; Karlberg, A. Studies on the autoxidation and sensitizing capacity of the fragrance chemical linalool, identifying a linalool hydroperoxide. Contact Dermat. 2002, 46, 267–272. [Google Scholar] [CrossRef] [Scilit] [PubMed]
- Yu, Y.; Bai, J.; Chen, C.; Plotto, A.; Yu, Q.; Baldwin, E.; Gmitter, F. Identification of QTLs controlling aroma volatiles using a ‘Fortune’ x ‘Murcott’ (Citrus reticulata) population. BMC Genom. 2017, 18, 646. [Google Scholar] [CrossRef] [Scilit] [PubMed]
- Cano-Lamadrid, M.; Lipan, L.; Hernández, F.; Martínez, J.; Legua, P.; Carbonell-Barrachina, Á. Quality parameters, volatile composition, and sensory profiles of highly endangered Spanish citrus fruits. J. Food Qual. 2018, 2018, 3475461. [Google Scholar] [CrossRef] [Scilit]
- Gonda, I.; Bar, E.; Portnoy, V.; Lev, S.; Burger, J.; Schaffer, A.; Tadmor, Y.; Gepstein, S. Branched-chain and aromatic amino acid catabolism into aroma volatiles in Cucumis melo L. fruit. J. Exp. Bot. 2010, 61, 1111–1123. [Google Scholar] [CrossRef] [Scilit] [PubMed]
- Liu, X.; Liu, J.; Yang, Z.; Song, H.; Liu, Y.; Zou, T. Aroma-active compounds in jinhua ham produced with different fermentation periods. Molecules 2014, 19, 19097–19113. [Google Scholar] [CrossRef] [Scilit] [PubMed]
- Ott, A.; Germond, J.; Baumgartner, M.; Chaintreau, A. Aroma comparisons of traditional and mild yogurts: Headspace gas chromatography quantification of volatiles and origin of α-diketones. J. Agric. Food Chem. 1999, 47, 2379–2385. [Google Scholar] [CrossRef] [Scilit] [PubMed]
- Hatanaka, A. The fresh green odor emitted by plants. Food Rev. Int. 1996, 12, 303–350. [Google Scholar] [CrossRef] [Scilit]
- Ceballos-Magaña, S.; de Pablos, F.; Jurado, J.; Martín, M.; Alcázar, Á.; Muñiz-Valencia, R. Characterisation of tequila according to their major volatile composition using multilayer perceptron neural networks. Food Chem. 2013, 136, 1309–1315. [Google Scholar] [CrossRef] [Scilit] [PubMed]
- Zhu, J.; Chen, F.; Wang, L.; Niu, Y.; Yu, D.; Shu, C.; Chen, H.; Wang, H.; Xiao, Z. Comparison of aroma-active volatiles in oolong tea infusions using GC-olfactometry, GC-FPD, and GC-MS. J. Agric. Food Chem. 2015, 63, 7499–7510. [Google Scholar] [CrossRef] [Scilit] [PubMed]
- Liu, Z.R.; Xu, S.Z.; Cen, J.Z.; Su, J.Y. Identification and analysis of volatile components in different tissue parts of perfume lemon. Mod. Food Sci. Technol. 2026, 42, 1–11. [Google Scholar] [CrossRef]
- Alquézar, B.; Rodríguez, A.; de la Peña, M.; Peña, L. Genomic analysis of terpene synthase family and functional characterization of seven sesquiterpene synthases from Citrus sinensis. Front. Plant Sci. 2017, 8, 1481. [Google Scholar] [CrossRef] [Scilit] [PubMed]
- Liu, Y.Q.; Xue, A.H.; Ding, P.; Lu, Z.J.; Hao, Y.B.; Luo, L.P. Effects of Diaphorina citri stress on volatile components of lemon leaf metabolome. J. Environ. Entomol. 2019, 41, 1089–1098. [Google Scholar] [CrossRef]
- Qin, T.; Lü, Q.; Li, X.; Zhang, X.; Li, Y.; Yang, S. Research advance of synthesis of perfume using citral as starting material. Guangzhou Chem. Ind. 2014, 42, 19–20+33. [Google Scholar]
- Mostafa, S.; Wang, Y.; Zeng, W.; Jin, B. Floral scents and fruit aromas: Functions, compositions, biosynthesis, and regulation. Front. Plant Sci. 2022, 13, 860157. [Google Scholar] [CrossRef] [Scilit] [PubMed]

Disclaimer/Publisher’s Note: The statements, opinions and data contained in all publications are solely those of the individual author(s) and contributor(s) and not of MDPI and/or the editor(s). MDPI and/or the editor(s) disclaim responsibility for any injury to people or property resulting from any ideas, methods, instructions or products referred to in the content. |
© 2026 by the authors. Licensee MDPI, Basel, Switzerland. This article is an open access article distributed under the terms and conditions of the Creative Commons Attribution (CC BY) license.